
Geothermal Potential of the Brenner Base Tunnel—Initial Evaluations

 , , ,
, , ,
Abstract
:1. Introduction
2. Materials and Methods
2.1. The BBT Drainage System
2.2. Data
2.3. Drainage System during Construction and Operational Phase
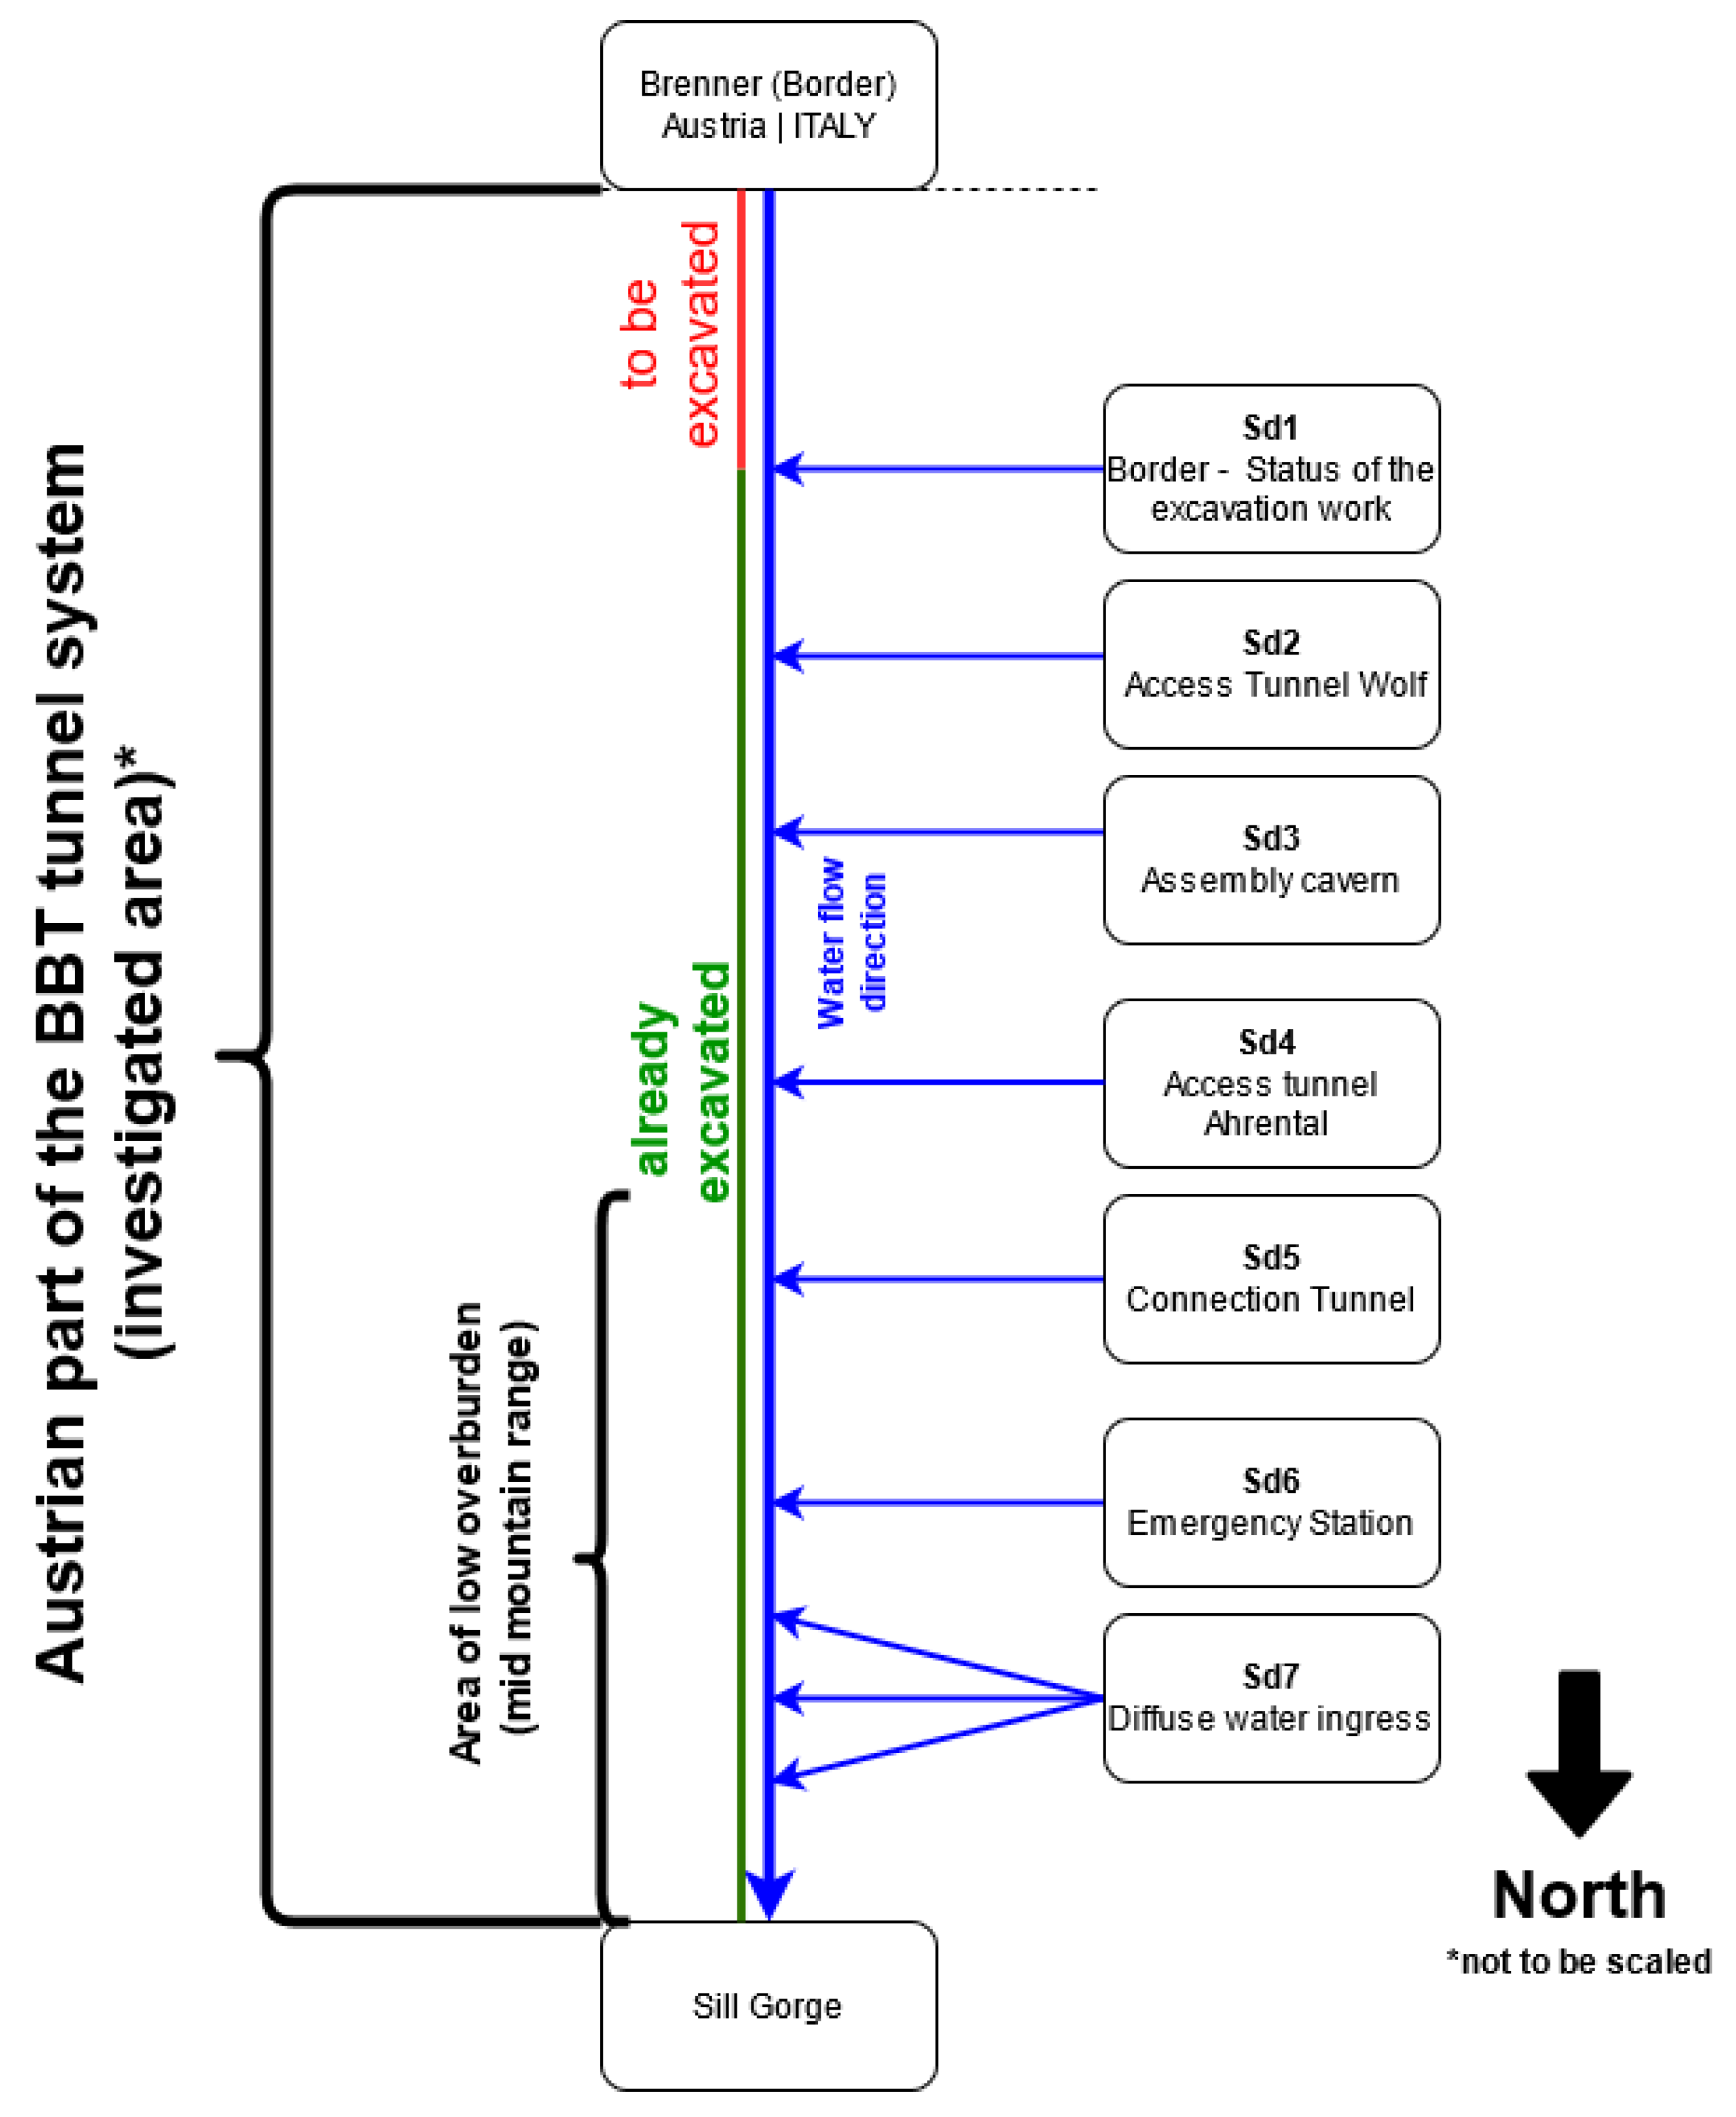
- The southernmost part on the Austrian side of the ET (Sd1) has not yet been excavated; therefore, the quantities of water discharge and the temperature must be estimated in advance for this section. Prognoses, based on hydrogeological models, indicate ranges of 30–49 L/s and temperatures between 23–26 °C. Water from this hydrologically homogeneous area provides the greatest geothermal potential, since this section features the highest overburden on the Austrian side, combined with high water inflows.
- Near the northern tunnel portal (between access tunnel Ahrental and Sill Gorge) there are several diffuse water inflows (Sd7), which cannot be measured directly. However, they are measured as part of the total water discharge at the Sill Gorge. Since the other sectional discharges contributing to the total water discharge are quantified, it is possible to determine the amount of diffuse inflows by subtracting the individual sectional discharges from the total water discharge. The diffuse inflows occur in the area of a low overburden, from the northern tunnel portal to tunnel kilometer 6 (cf. Figure 2). These inflows represent the same hydrological regime as the sectional discharges Sd5 and Sd6. Therefore, the water temperatures are calculated using the average values of Sd5 and Sd6.
- During the construction phase, Sd1 and Sd2, south of access tunnel Wolf—are not yet fed into the overall drainage system. The water of this construction lot is pumped back to the surface and discharged into the receiving water—the Upper Sill. When the BBT will be in operation, Sd1 and Sd2 will be directed into the main drainage system, which will considerably increase the total discharge rate of water. Therefore, in order to give a forecast of water discharge and temperature for the operational phase, Sd1 and Sd2 must be considered.
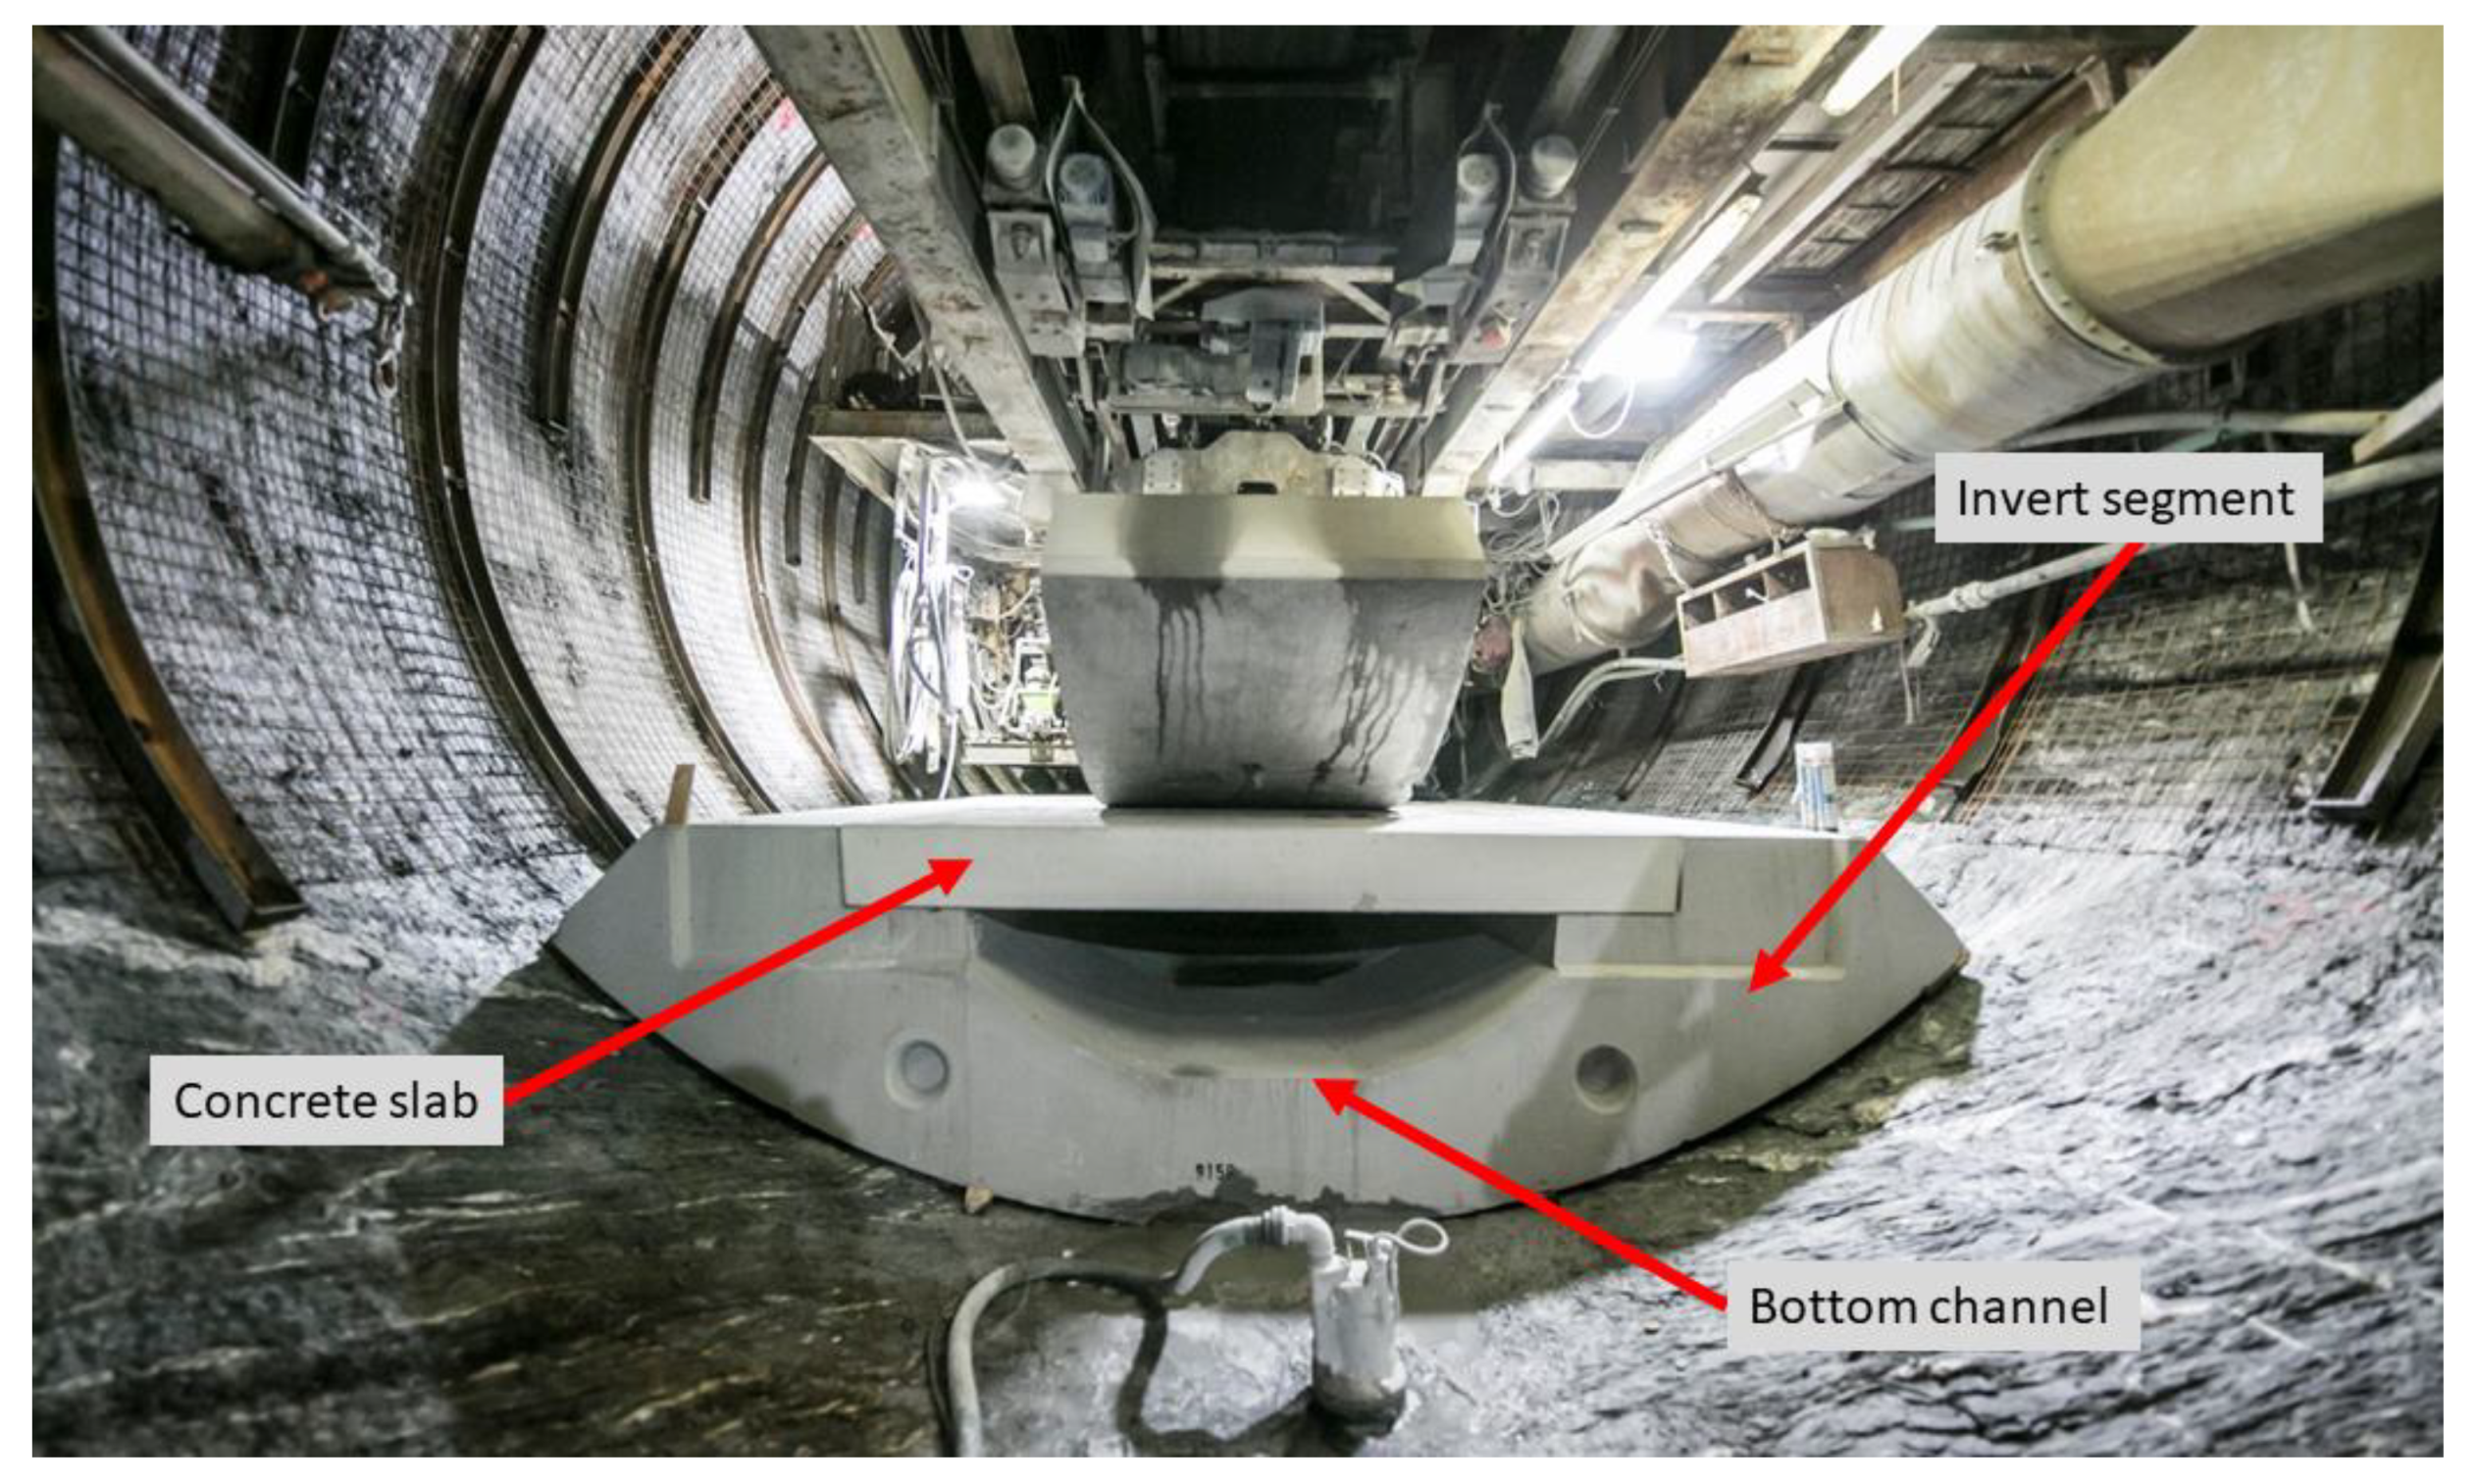
- In the area of the Sill Gorge, the total amount of the tunnel discharge water and its temperature are measured. The measurement location is situated within the tunnel, yet rather close to the surface. Thus, temperatures inside the tunnel adjust according to the outside temperatures. Consequently, the air temperature within the tunnel can drop significantly, especially in wintertime, resulting in a cooling of tunnel water. Therefore, at least the monthly mean data should be used for valid calculations. After completion of the construction, the heat exchange of the tunnel water and the tunnel air will be reduced, as the drainage system will reach its final state. In this phase, all water will be discharged within the invert segment (bottom channel) (Figure 5) from the national border to into the Sill River. In addition, the flow velocity will increase due to higher quantities of water.
- Once the main tunnels are excavated, the amount of water entering the tunnels will increase in the hydrographically homogeneous areas where the main tunnels is excavated. This is related to the increase in surface area through which water can enter the tunnel. This increase in the discharge rate is estimated by a factor of 1.1–1.3, based on experiences of the first excavated main tunnel sections.
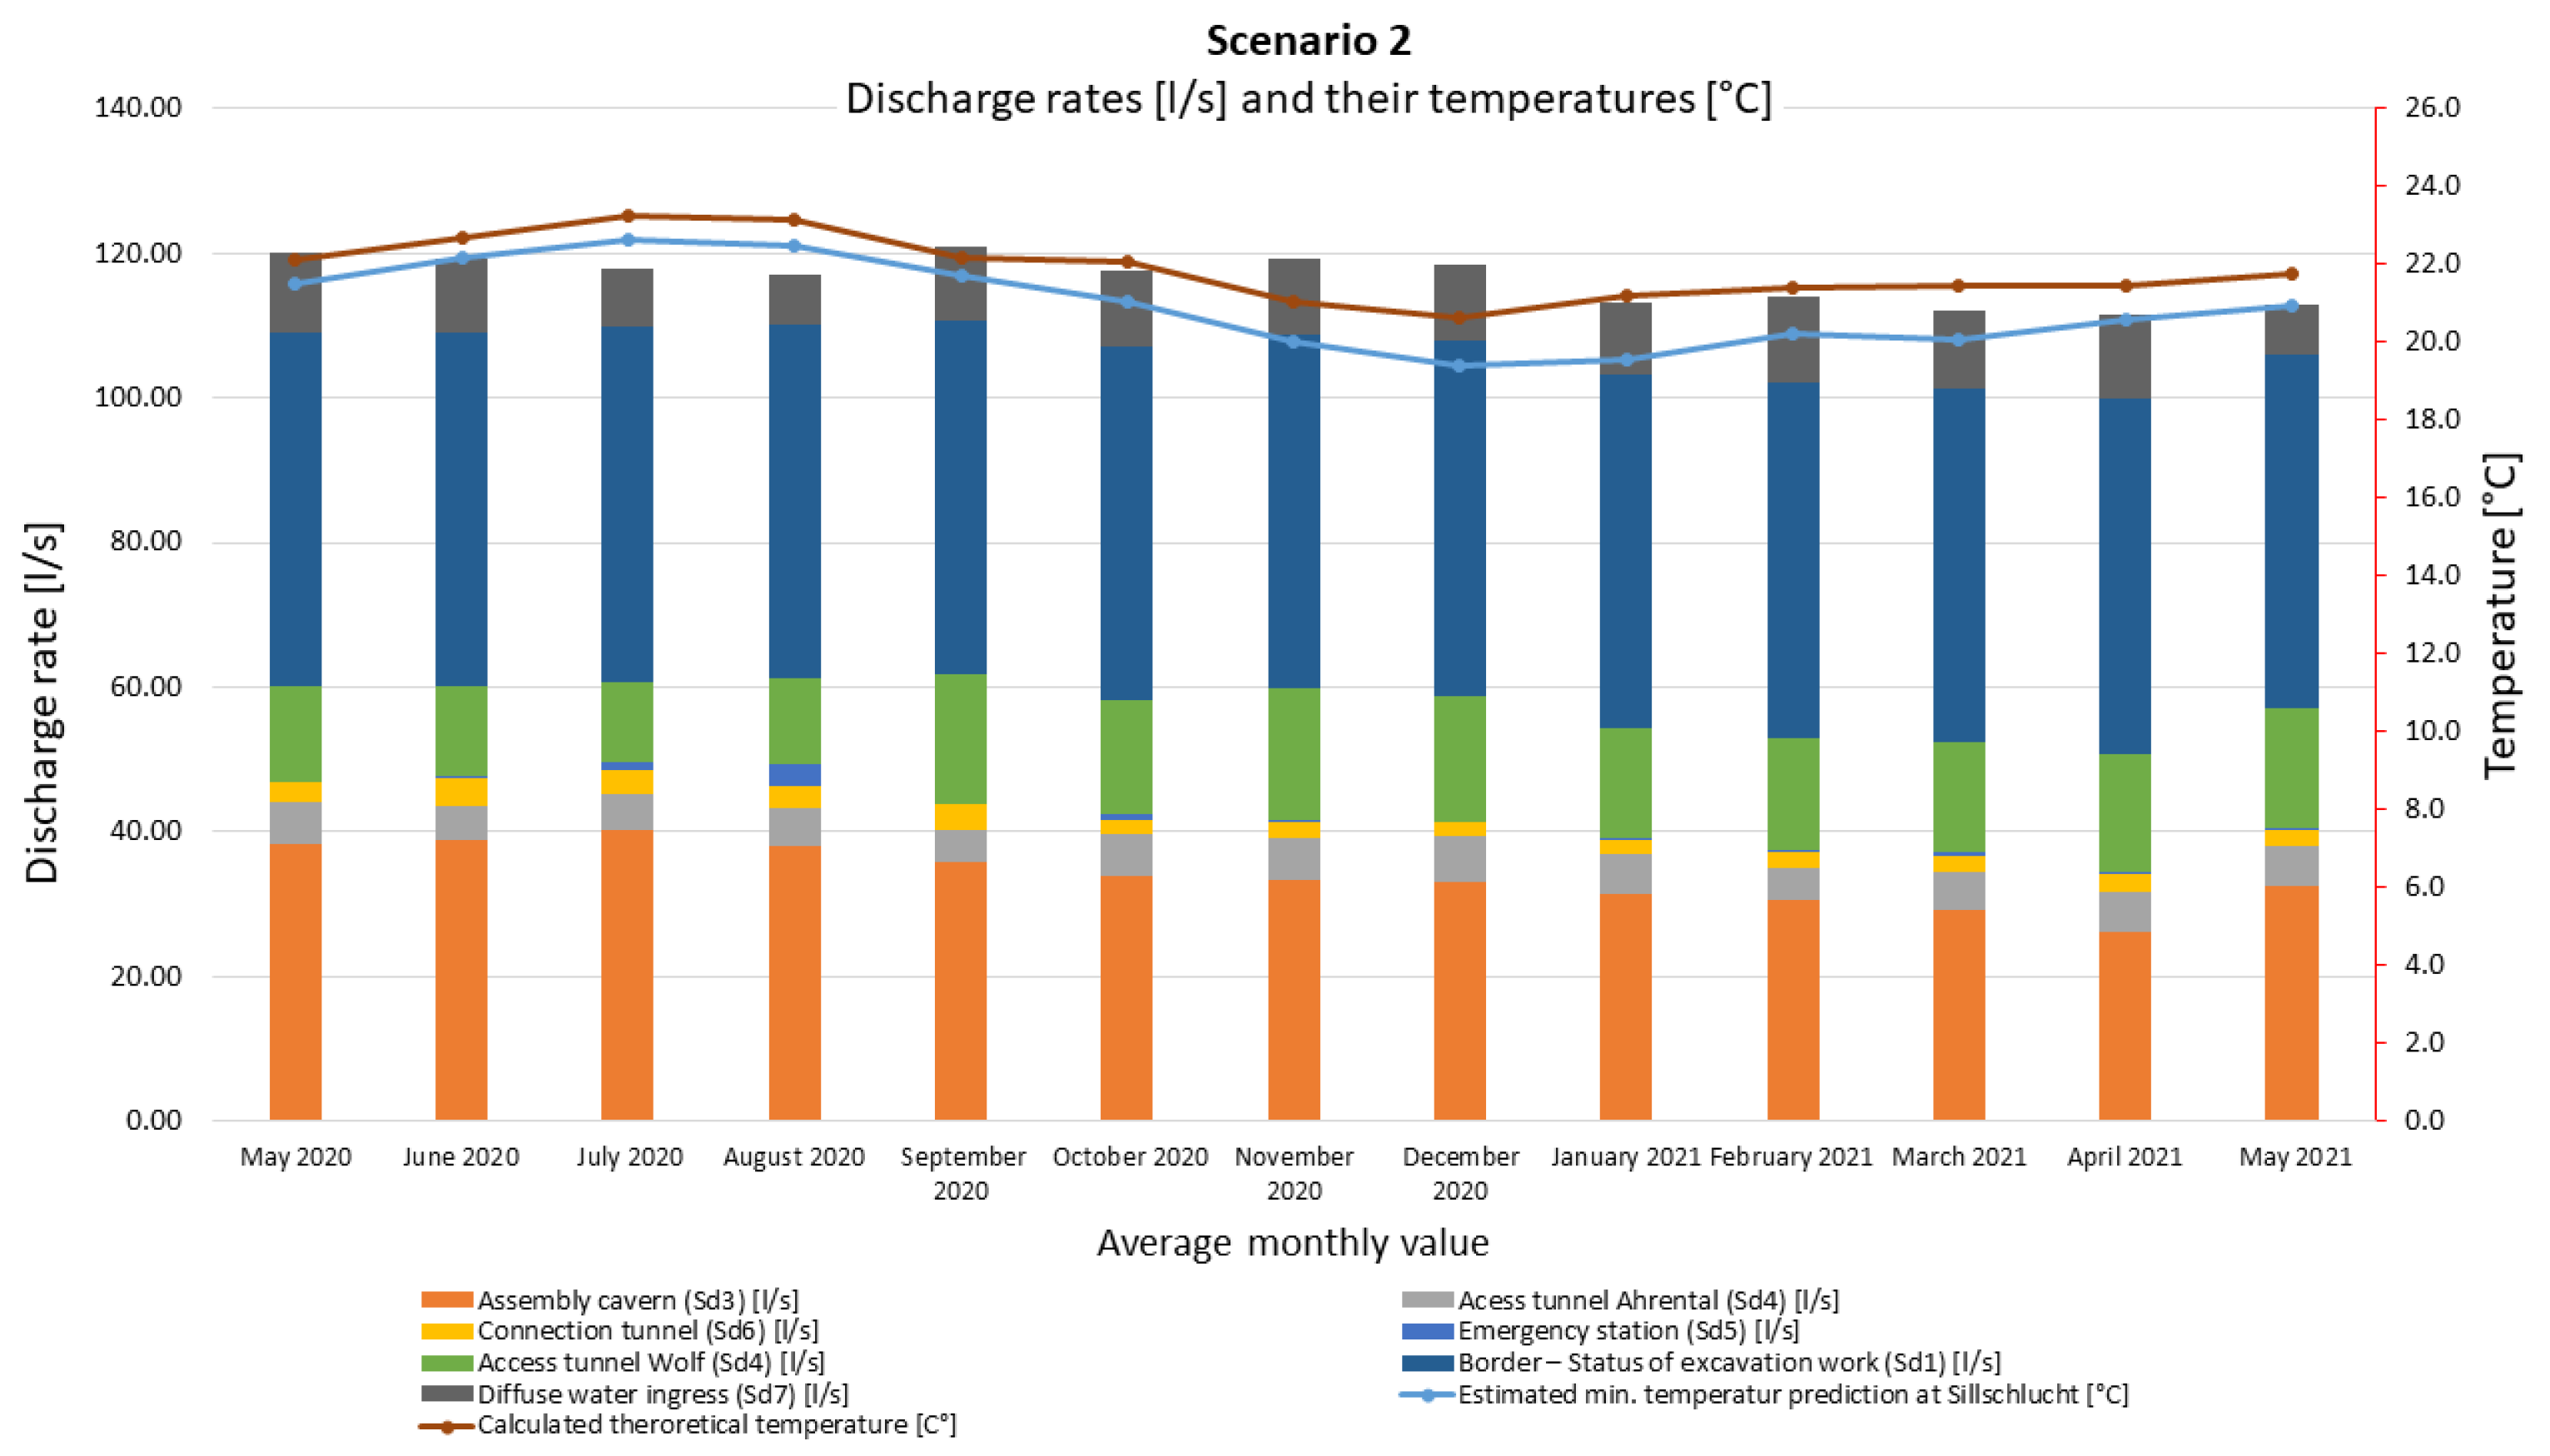
- Regarding the prognoses ranges of Sd1 and Sd3, two scenarios were elaborated. Scenario 1 is predicted on the premise that during the operational phase Sd1 will account for a discharge rate of 30 L/s and 23 °C. An increase in discharge by a factor of 1.1 is further assumed for Sd3, since the main tunnels are not yet excavated and therefore more water will enter the tunnel system. Scenario 2 assumes a contribution of Sd1 to the water discharge rate of 49 L/s and 26 °C during the operational phase. An increase in the discharge induced by the excavation of the main tunnels by a factor of 1.3 is taken for Sd3. These scenarios are the most probable, even if the exact discharge rate will depend on the success of necessary sealing works (cf. Section 3.2). Therefore, inflow volumes could also be significantly lower.
- Sd3
- Sd4
- Sd5
- Sd6
- Sd7
- Air temperature inside the tunnel in the area of the Sill Gorge
- Sd1 taken in Scenario 1 (30 L/s at 23 °C) or Scenario 2 (49 L/s at 26 °C) into account
- Sd2
- Sd3 taken in Scenario 1 (multiplied by 1.1) or Scenario 2 (multiplied by 1.3) into account
- Sd4
- Sd5
- Sd6
- Sd7
- Air temperature inside the tunnel area of Sill Gorge
2.4. Cooling of the Tunnel Water in the Area of the Sill Gorge during Operational Phase
2.5. Calculation of Heating Power of Tunnel Water
3. Results
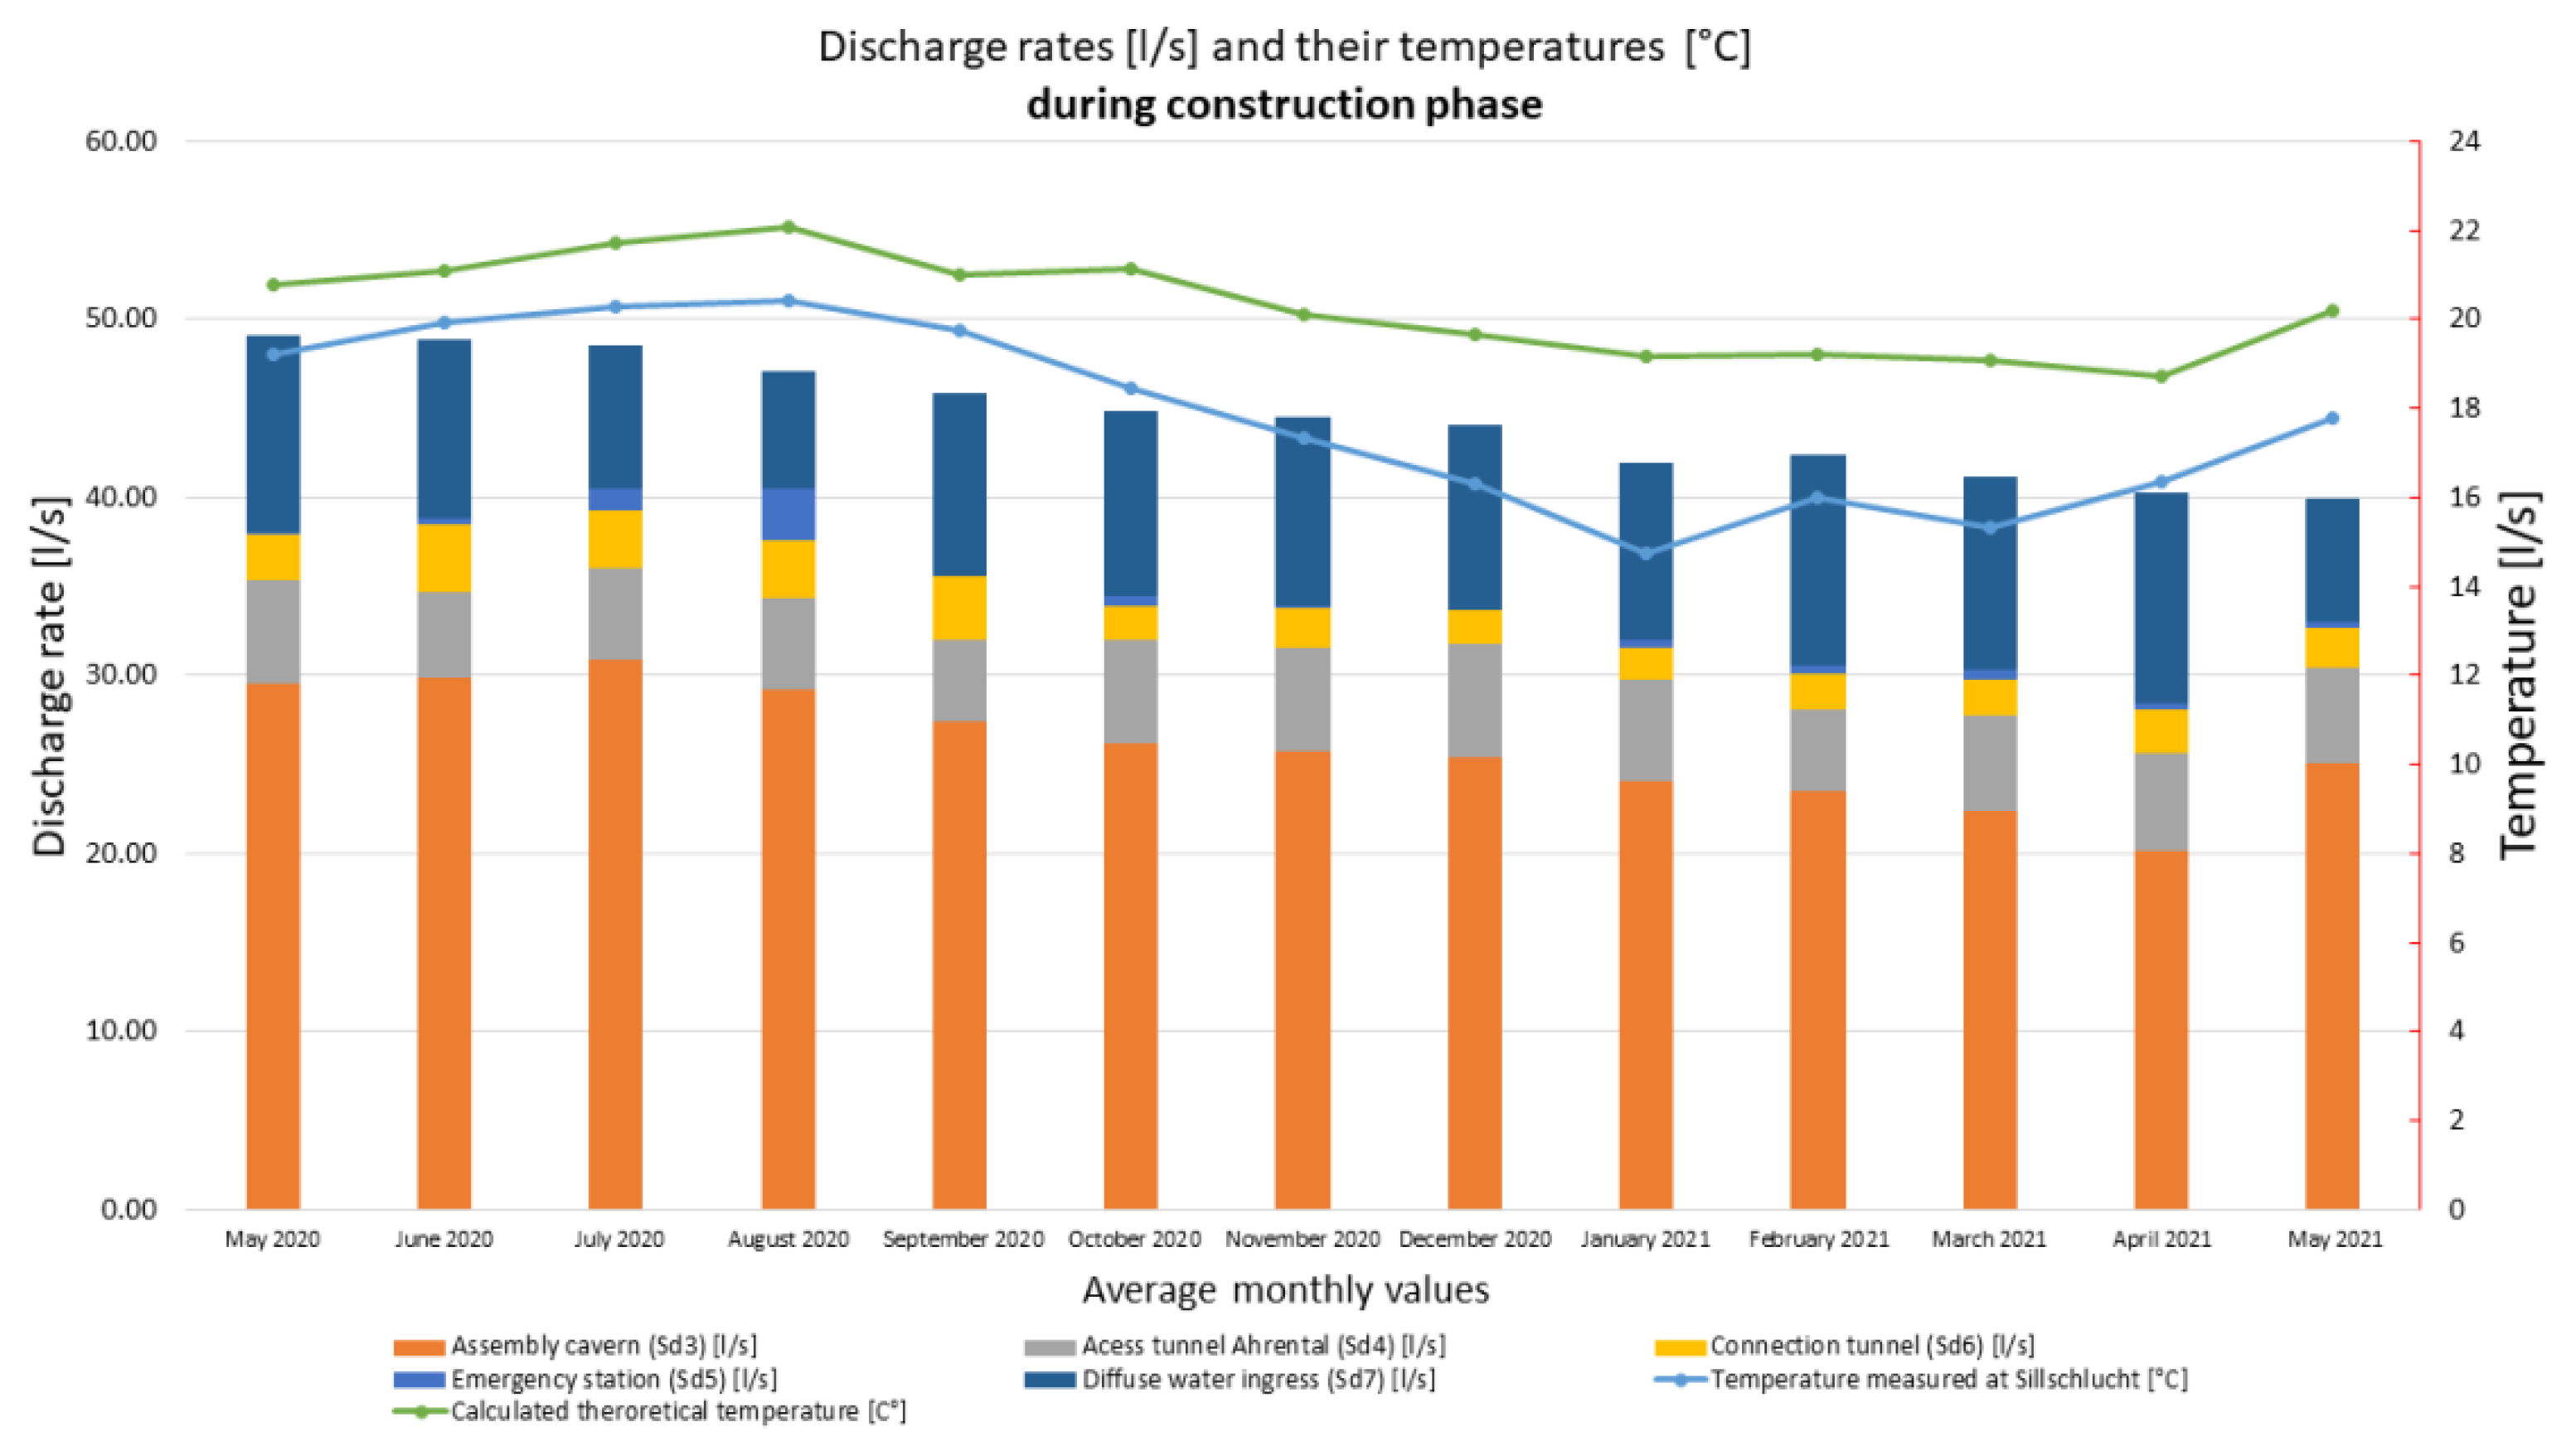
3.1. Discharge Rates and Temperatures during the Construction Phase
3.2. Discharge Rates and Their Temperatures during the Operational Phase
3.2.1. Scenario 1
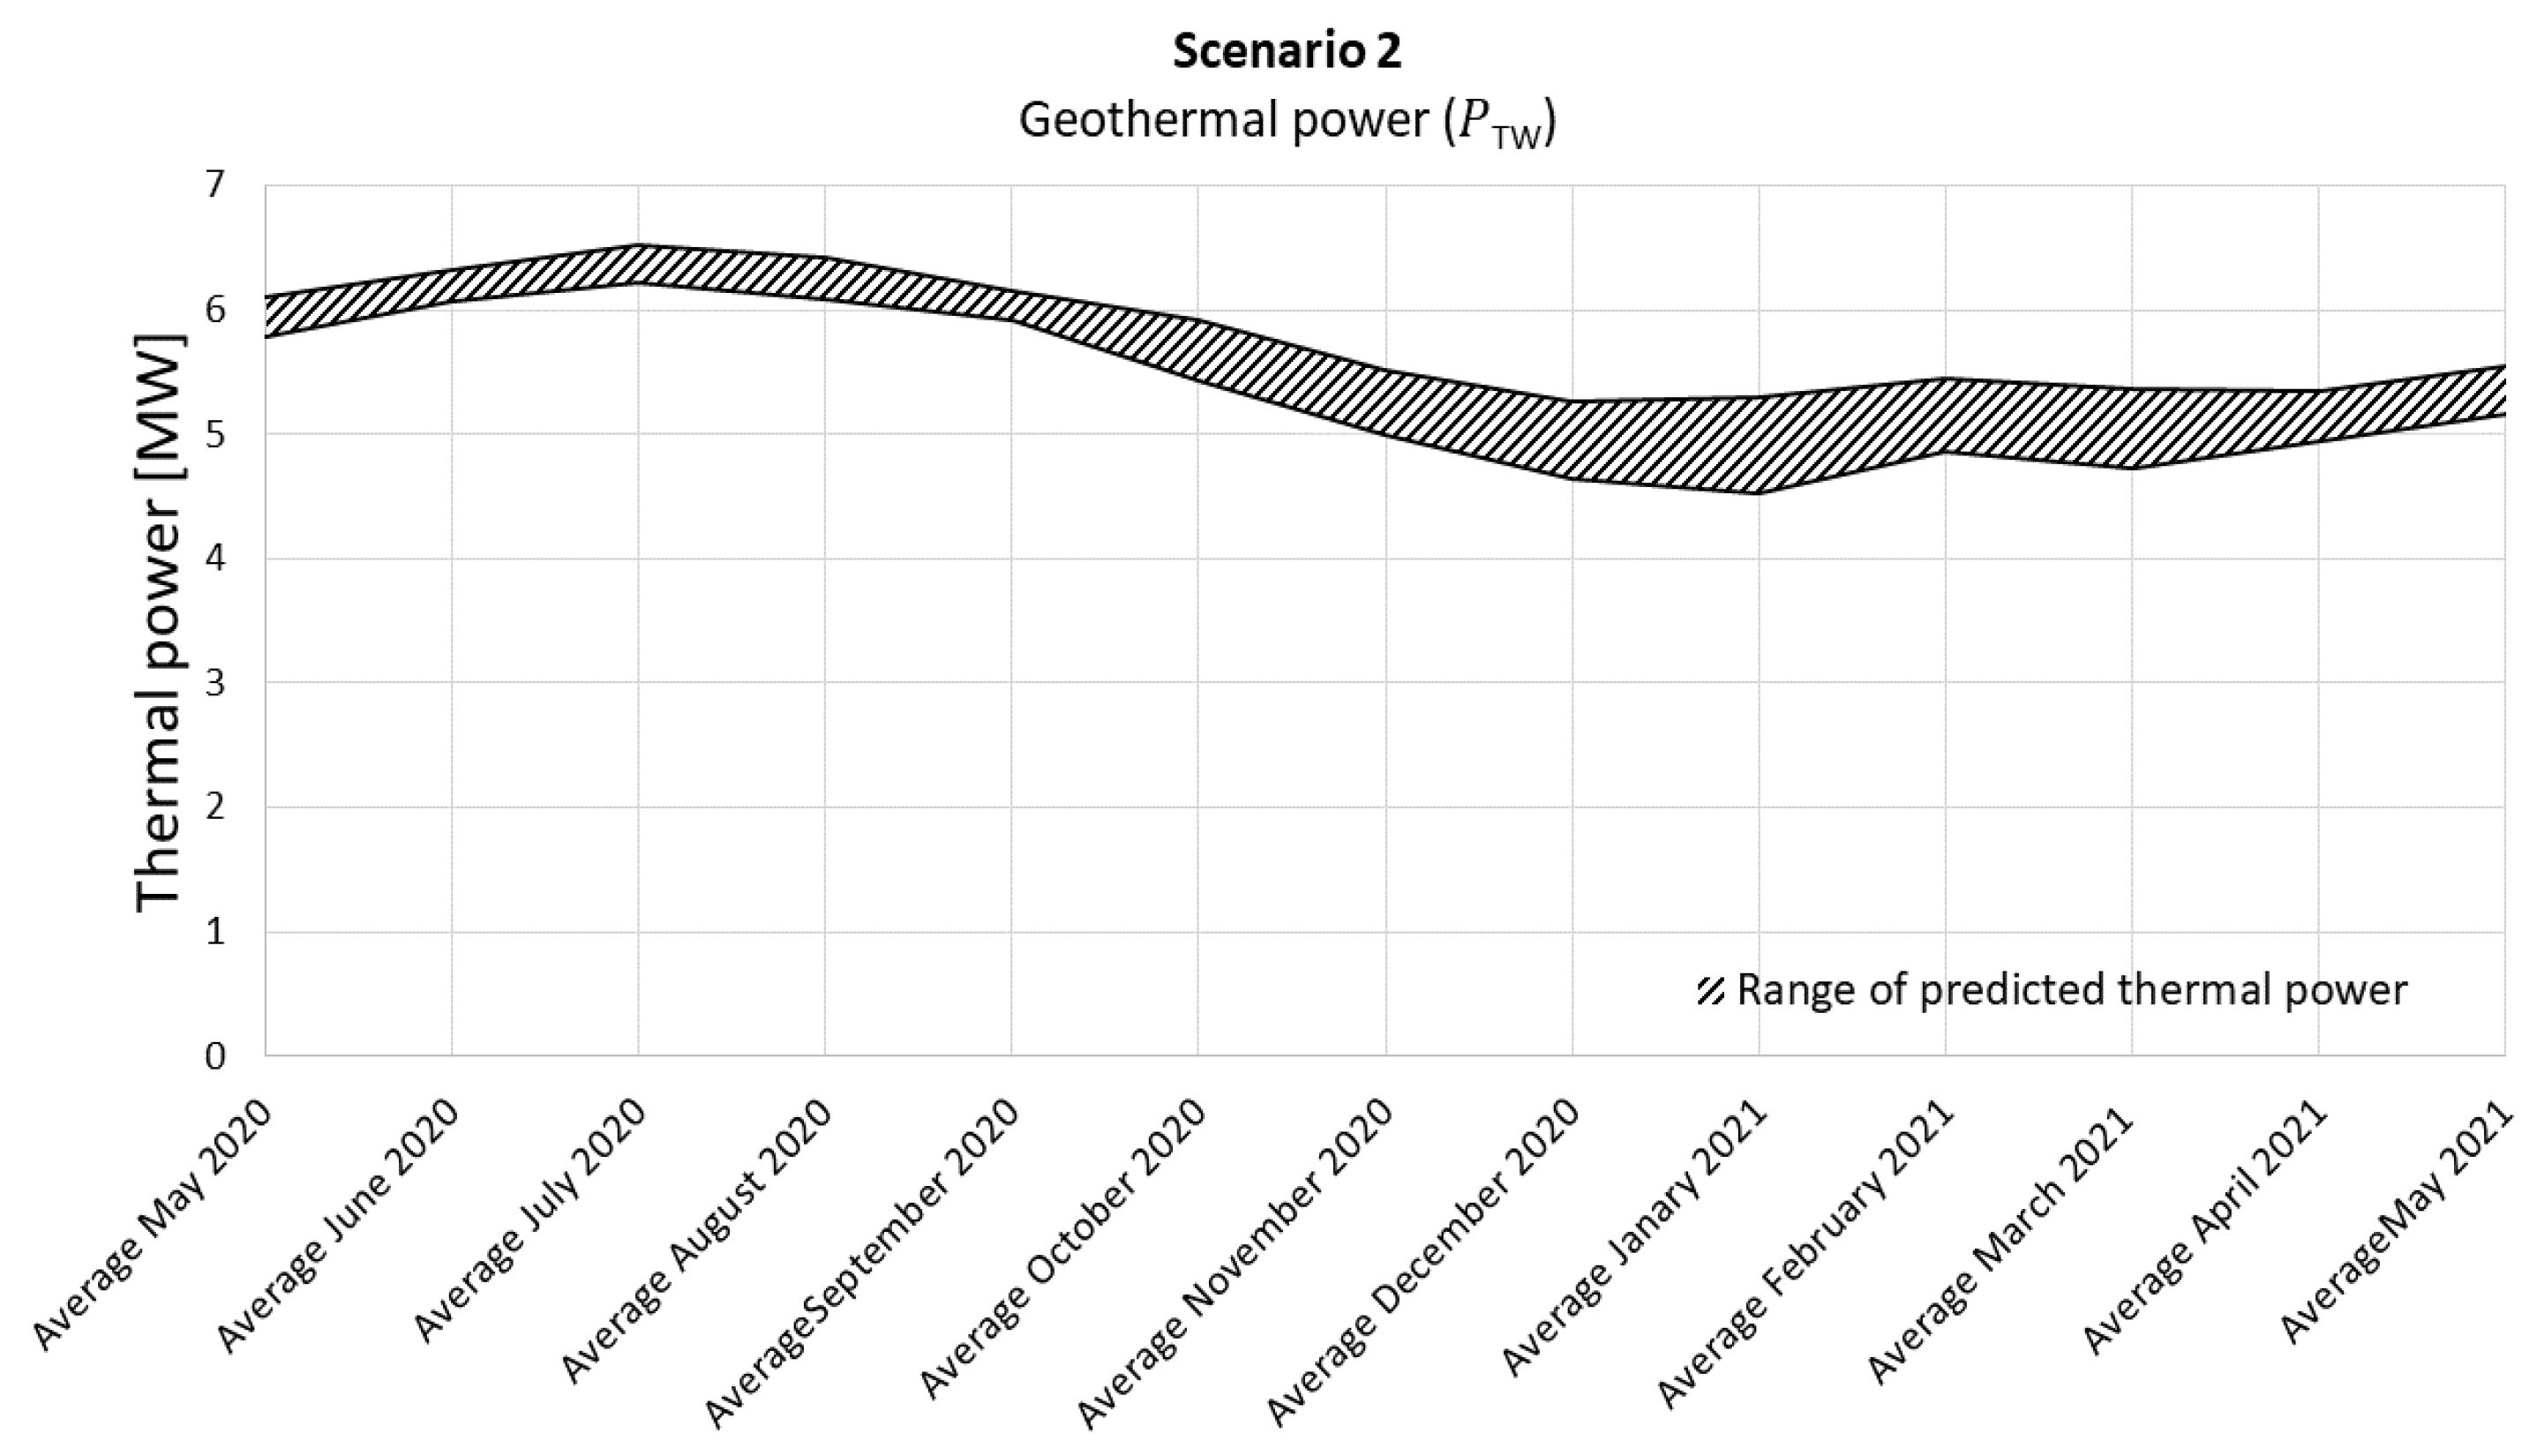
3.2.2. Scenario 2
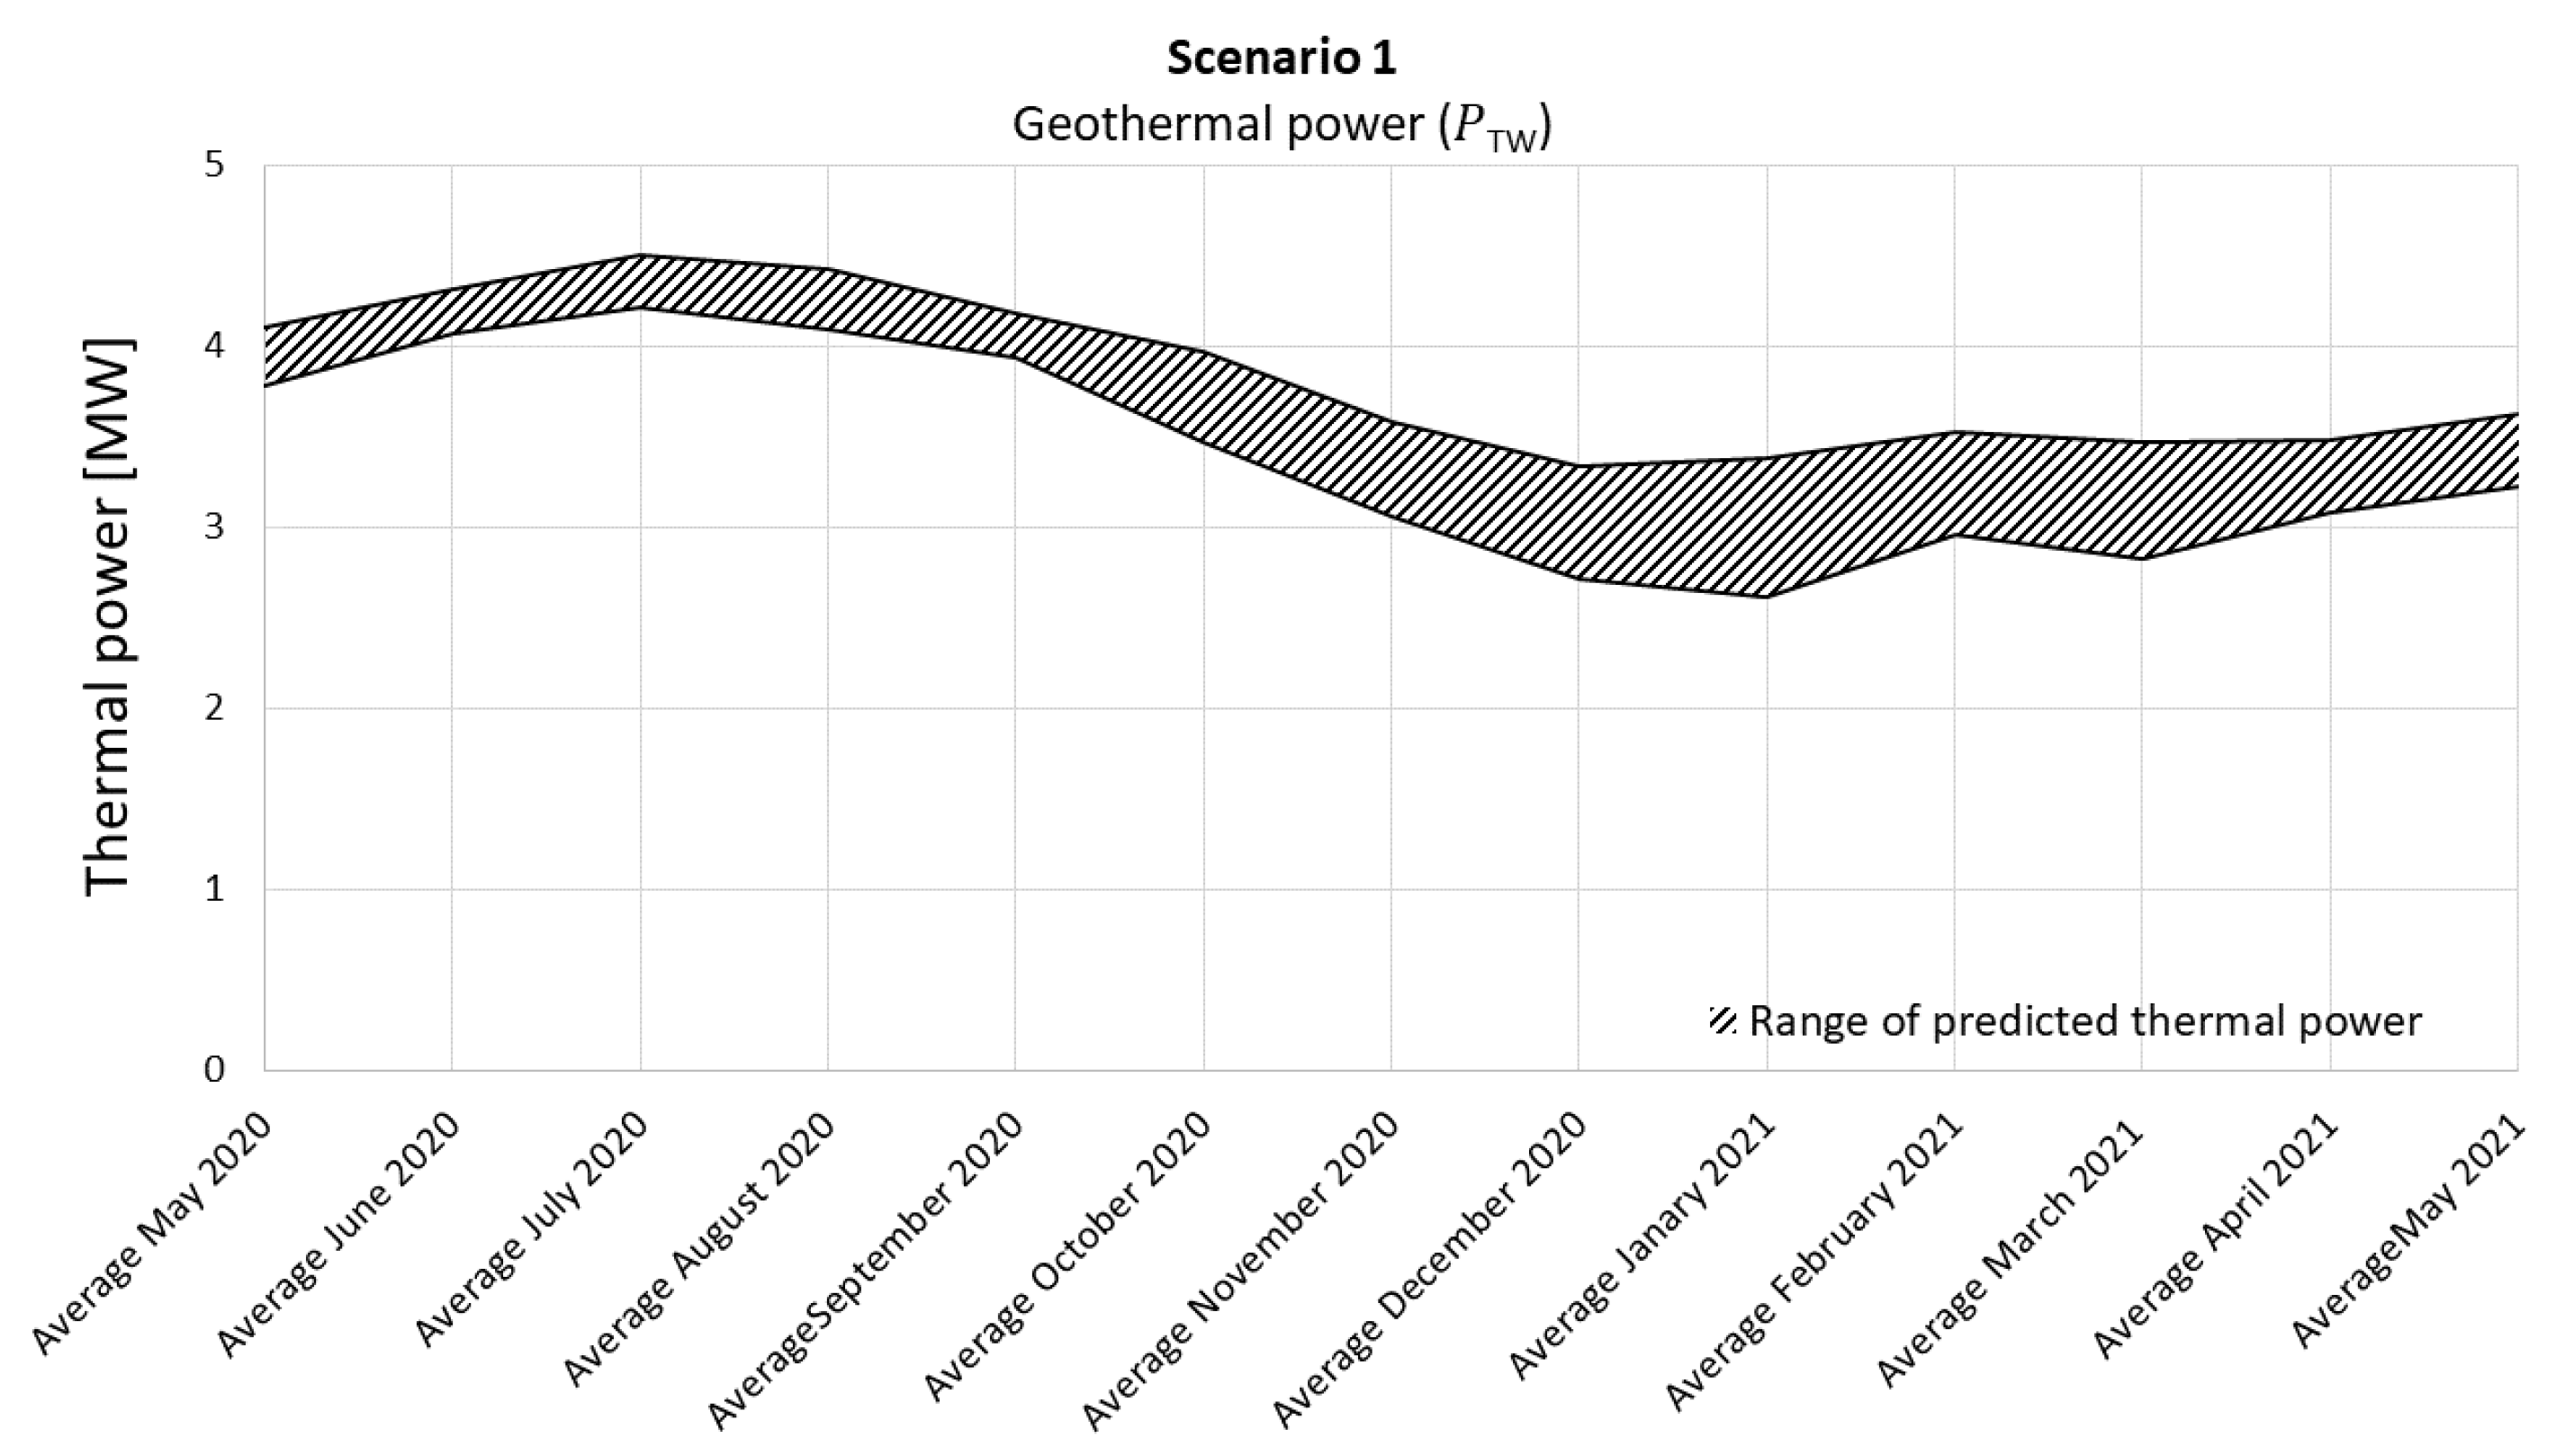
3.3. The Predicted Geothermal Potential after Completion of the BBT
3.4. Interpretation
3.4.1. Total Tunnel Water Discharges and Temperatures during Construction
3.4.2. Total Tunnel Water Discharges and Temperature Predictions during Operation
3.4.3. Geothermal Power of the BBT Tunnel Water
4. Discussion and Conclusions
Author Contributions
Funding
Institutional Review Board Statement
Informed Consent Statement
Data Availability Statement
Acknowledgments
Conflicts of Interest
References
- European Parliament. Decision No 1692/96/EC of the European Parliament and of the Council of 23 July 1996 on Community Guidelines for the Development of the Trans-European Transport Network. 31996D1692. 1996, pp. 1–104. Available online: http://publications.europa.eu/resource/cellar/f34131d1-aae6-4421-8394-c1cd130a4ed5.0006.02/DOC_1 (accessed on 2 April 2022).
- Communication from the Commission to the European Parliament, the European Council, the Council, the European Economic and Social Committee and the Committee of the Regions: The European Green Deal. Available online: https://eur-lex.europa.eu/legal-content/EN/TXT/?uri=COM%3A2019%3A640%3AFIN (accessed on 2 April 2022).
- Tinti, F.; Boldini, D.; Ferrari, M.; Lanconelli, M.; Kasmaee, S.; Bruno, R.; Egger, H.; Voza, A.; Zurlo, R. Exploitation of geothermal energy using tunnel lining technology in a mountain environment. A feasibility study for the Brenner Base tunnel–BBT. Tunn. Undergr. Space Technol. 2017, 70, 182–203. [Google Scholar] [CrossRef]
- BBT-SE. Europäschische Dimension. Available online: https://www.bbt-se.com/tunnel/europaeische-dimension/ (accessed on 27 April 2022).
- Brandner, R.; Reiter, F.; Töchterle, A. Überblick zu den Ergebnissen der geologischen Vorerkundung für den Brenner-Basistunnel. Geo. Alp 2008, 5, 165–174. [Google Scholar]
- Voit, K.; Kuschel, E. Rock Material Recycling in Tunnel Engineering. Appl. Sci. 2020, 10, 2722. [Google Scholar] [CrossRef] [Green Version]
- Adam, D.; Markiewicz, R.; Oberhauser, A. Nachhaltige Nutzung von Erdwärme mittels innovativer Systeme im Ingenieurtiefbau und Tunnelbau. In Ernst & Sohn Verlag (Hrsg.), 1; Department für Bautechnik und Naturgefahren: Wien, Austria; pp. 113–117.
- Pralle, N.; Friedemann, W.; Mayer, P.-M.; Grübl, F.; Ostermeier, B.; Schneider, M. Wärme lieferndes Fertigteil, Energietübbing. 12 September 2007. Available online: https://patentimages.storage.googleapis.com/8d/ea/70/5f9ba66b399d73/EP1905947A1.pdf (accessed on 12 March 2022).
- Markiewicz, R. Numerische und Experimentelle Untersuchungen zur Nutzung von Geothermischer Energie Mittels Erdberührter Bauteile und Neuentwicklungen für den Tunnelbau. Ph.D. Dissertation, Technische Universität Wien, Wien, Austria, 2004. [Google Scholar]
- Oberhauser, A.; Adam, D.; Hosp, M.; Kopf, F. Der Energieanker–Synergien bei der Nutzung eines statisch konstruktiven Bauteils. Oesterreichische Ing.-Z. 2006, 151, 97–102. [Google Scholar]
- Rybach, L. Thermal waters in deep Alpine tunnels. Geothermics 1995, 24, 631–637. [Google Scholar] [CrossRef]
- Stemmle, R.; Menberg, K.; Rybach, L.; Blum, P. Tunnelgeothermie – Ein Überblick. Geomechanik und Tunnelbau 2022, 15, 104–111. [Google Scholar] [CrossRef]
- Buhmann, P.; Blosfeld, J.; Moormann, C. Geothermische Bergwassernutzung–Hydrogeothermische Verfahren an deutschen Straßentunneln. In Fachsektionstage Geotechnik, Interdisziplinäres Forum; Deutsche Gesellschaft für Geotechnik: Essen, Germany, 2017. [Google Scholar]
- Moormann, C. GeoTU6–a geothermal Research Project for Tunnels. Tunnel 2010, 29, 14–21. [Google Scholar]
- Adam, D.; Markiewicz, R. Energy from earth-coupled structures, foundations, tunnels and sewers. Géotechnique 2009, 59, 229–236. [Google Scholar] [CrossRef]
- Rybach, L. Geothermal use of warm tunnel waters-Principles and examples from Switzerland. Trans. Geotherm. Resour. Counc. 2010, 34, 871–874. [Google Scholar]
- Geisler, T.; Wolf, M.; Burger, U.; Voit, K.; Götzl, G.; Lauermann, M.; Haslinger, E.; Auer, R.; Straka, W.; Pol, O.; et al. Geothermal Potential of infrastructure projects using the example of the Brenner base tunnel and the utilization of low-temperature heat in urban regions. Vienna. In Proceedings of the 13th International Conference on Sustainable Energy & Environmental Protection, Vienna, Austria, 13–16 September 2021; Volume 1, pp. 457–463. [Google Scholar]
- Geisler, T.; Wolf, M.; Götzl, G.; Burger, U.; Cordes, T.; Pol, O.; Obradovic, M.; Straka, W.; Voit, K.; Haslinger, E.; et al. ThermoCluster: Wärmegewinnung aus Infrastrukturprojekten und Einbindung in Dezentrale Niedertemperatur-Wärme-und Kältenetze für Plus-Energie-Quartiere. (To Be Published). 2022. Available online: https://projekte.ffg.at/projekt/3793907 (accessed on 15 March 2022).
- Bergmeister, K.; Reinhold, C. Learning and optimization from the exploratory tunnel-Brenner Base Tunnel. Geomech. Tunn. 2017, 10, 467–476. [Google Scholar] [CrossRef]
- BBT-SE. Mediathek. Available online: https://www.bbt-se.com/information/mediathek/#&gid=1&pid=18 (accessed on 22 March 2022).
- Burger, U.; Geisler, T.; Lehner, F.; Cordes, T.; Marcher, T. Sectional discharges as geothermal potentials of deep tunnels. Geomech. Tunn. 2022, 15, 92–103. [Google Scholar] [CrossRef]
- Perello, P.; Baietto, A.; Burger, U.; Skuk, S. Excavation of the Aica-Mules pilot tunnel for the Brenner base tunnel: Information gained on water inflows in tunnels in granitic massifs. Rock Mech. Rock Eng. 2014, 47, 1049–1071. [Google Scholar] [CrossRef]
- Richmann, G.W. De quantitate caloris, quae post miscelam flvidorum, certo gradv calidorum, oriri debet, cogitationes, avctore. Typis Acad. Sci. 1750, 1, 152–167. [Google Scholar]
- Wilhelm, J.; Rybach, L. The geothermal potential of Swiss Alpine tunnels. Geothermics 2003, 32, 557–568. [Google Scholar] [CrossRef]
- Klimamonitoring—ZAMG. Available online: https://www.zamg.ac.at/cms/de/klima/klima-aktuell/klimamonitoring/?station=11803¶m=t&period=period-ym-2020-12&ref=3 (accessed on 4 February 2022).
- Buffa, S.; Cozzini, M.; D’Antoni, M.; Baratieri, M.; Fedrizzi, R. 5th generation district heating and cooling systems: A review of existing cases in Europe. Renew. Sustain. Energy Rev. 2019, 104, 504–522. [Google Scholar] [CrossRef]
- Tentschert, E. Water Prediction for Tunnels—A Game of Chance? Beitr. Zu Hydrogeolgie 2012, 52, 161–168. [Google Scholar]


| Abbreviation | Name of Sectional Discharge |
|---|---|
| Sd1 | Border—status of excavation work |
| Sd2 | Access tunnel Wolf |
| Sd3 | Assembly cavern |
| Sd4 | Access tunnel Ahrental |
| Sd5 | Emergency station |
| Sd6 | Connection tunnel |
| Sd7 | Diffuse water ingress |
| Tunnel water total (TWtot) | Sill Gorge |
| Sectional Discharge | Discharge Rate [L/s] | Temperature [°C] |
|---|---|---|
| Sd1 * | 30–49 | 23–26 |
| Sd2 | 15.0 | 12.2 |
| Sd3 | 26.5 | 23.7 |
| Sd4 | 5.4 | 16.3 |
| Sd5 | 0.5 | 15.6 |
| Sd6 | 2.5 | 14.7 |
| Sd7 | 10.9 | 15.2 |
| Total discharge (TWtot) | 45.8 | 17.8 |
Publisher’s Note: MDPI stays neutral with regard to jurisdictional claims in published maps and institutional affiliations. |
© 2022 by the authors. Licensee MDPI, Basel, Switzerland. This article is an open access article distributed under the terms and conditions of the Creative Commons Attribution (CC BY) license (https://creativecommons.org/licenses/by/4.0/).
Share and Cite
Geisler, T.; Voit, K.; Burger, U.; Cordes, T.; Lehner, F.; Götzl, G.; Wolf, M.; Marcher, T. Geothermal Potential of the Brenner Base Tunnel—Initial Evaluations. Processes 2022, 10, 972. https://0-doi-org.brum.beds.ac.uk/10.3390/pr10050972
Geisler T, Voit K, Burger U, Cordes T, Lehner F, Götzl G, Wolf M, Marcher T. Geothermal Potential of the Brenner Base Tunnel—Initial Evaluations. Processes. 2022; 10(5):972. https://0-doi-org.brum.beds.ac.uk/10.3390/pr10050972
Chicago/Turabian StyleGeisler, Thomas, Klaus Voit, Ulrich Burger, Tobias Cordes, Florian Lehner, Gregor Götzl, Magdalena Wolf, and Thomas Marcher. 2022. "Geothermal Potential of the Brenner Base Tunnel—Initial Evaluations" Processes 10, no. 5: 972. https://0-doi-org.brum.beds.ac.uk/10.3390/pr10050972