
Thermogravimetric Study on Peat Catalytic Pyrolysis for Potential Hydrocarbon Generation


Abstract
:1. Introduction
2. Experimental Part
2.1. Experiments
2.1.1. Materials
2.1.2. Iron Tallates Preparation
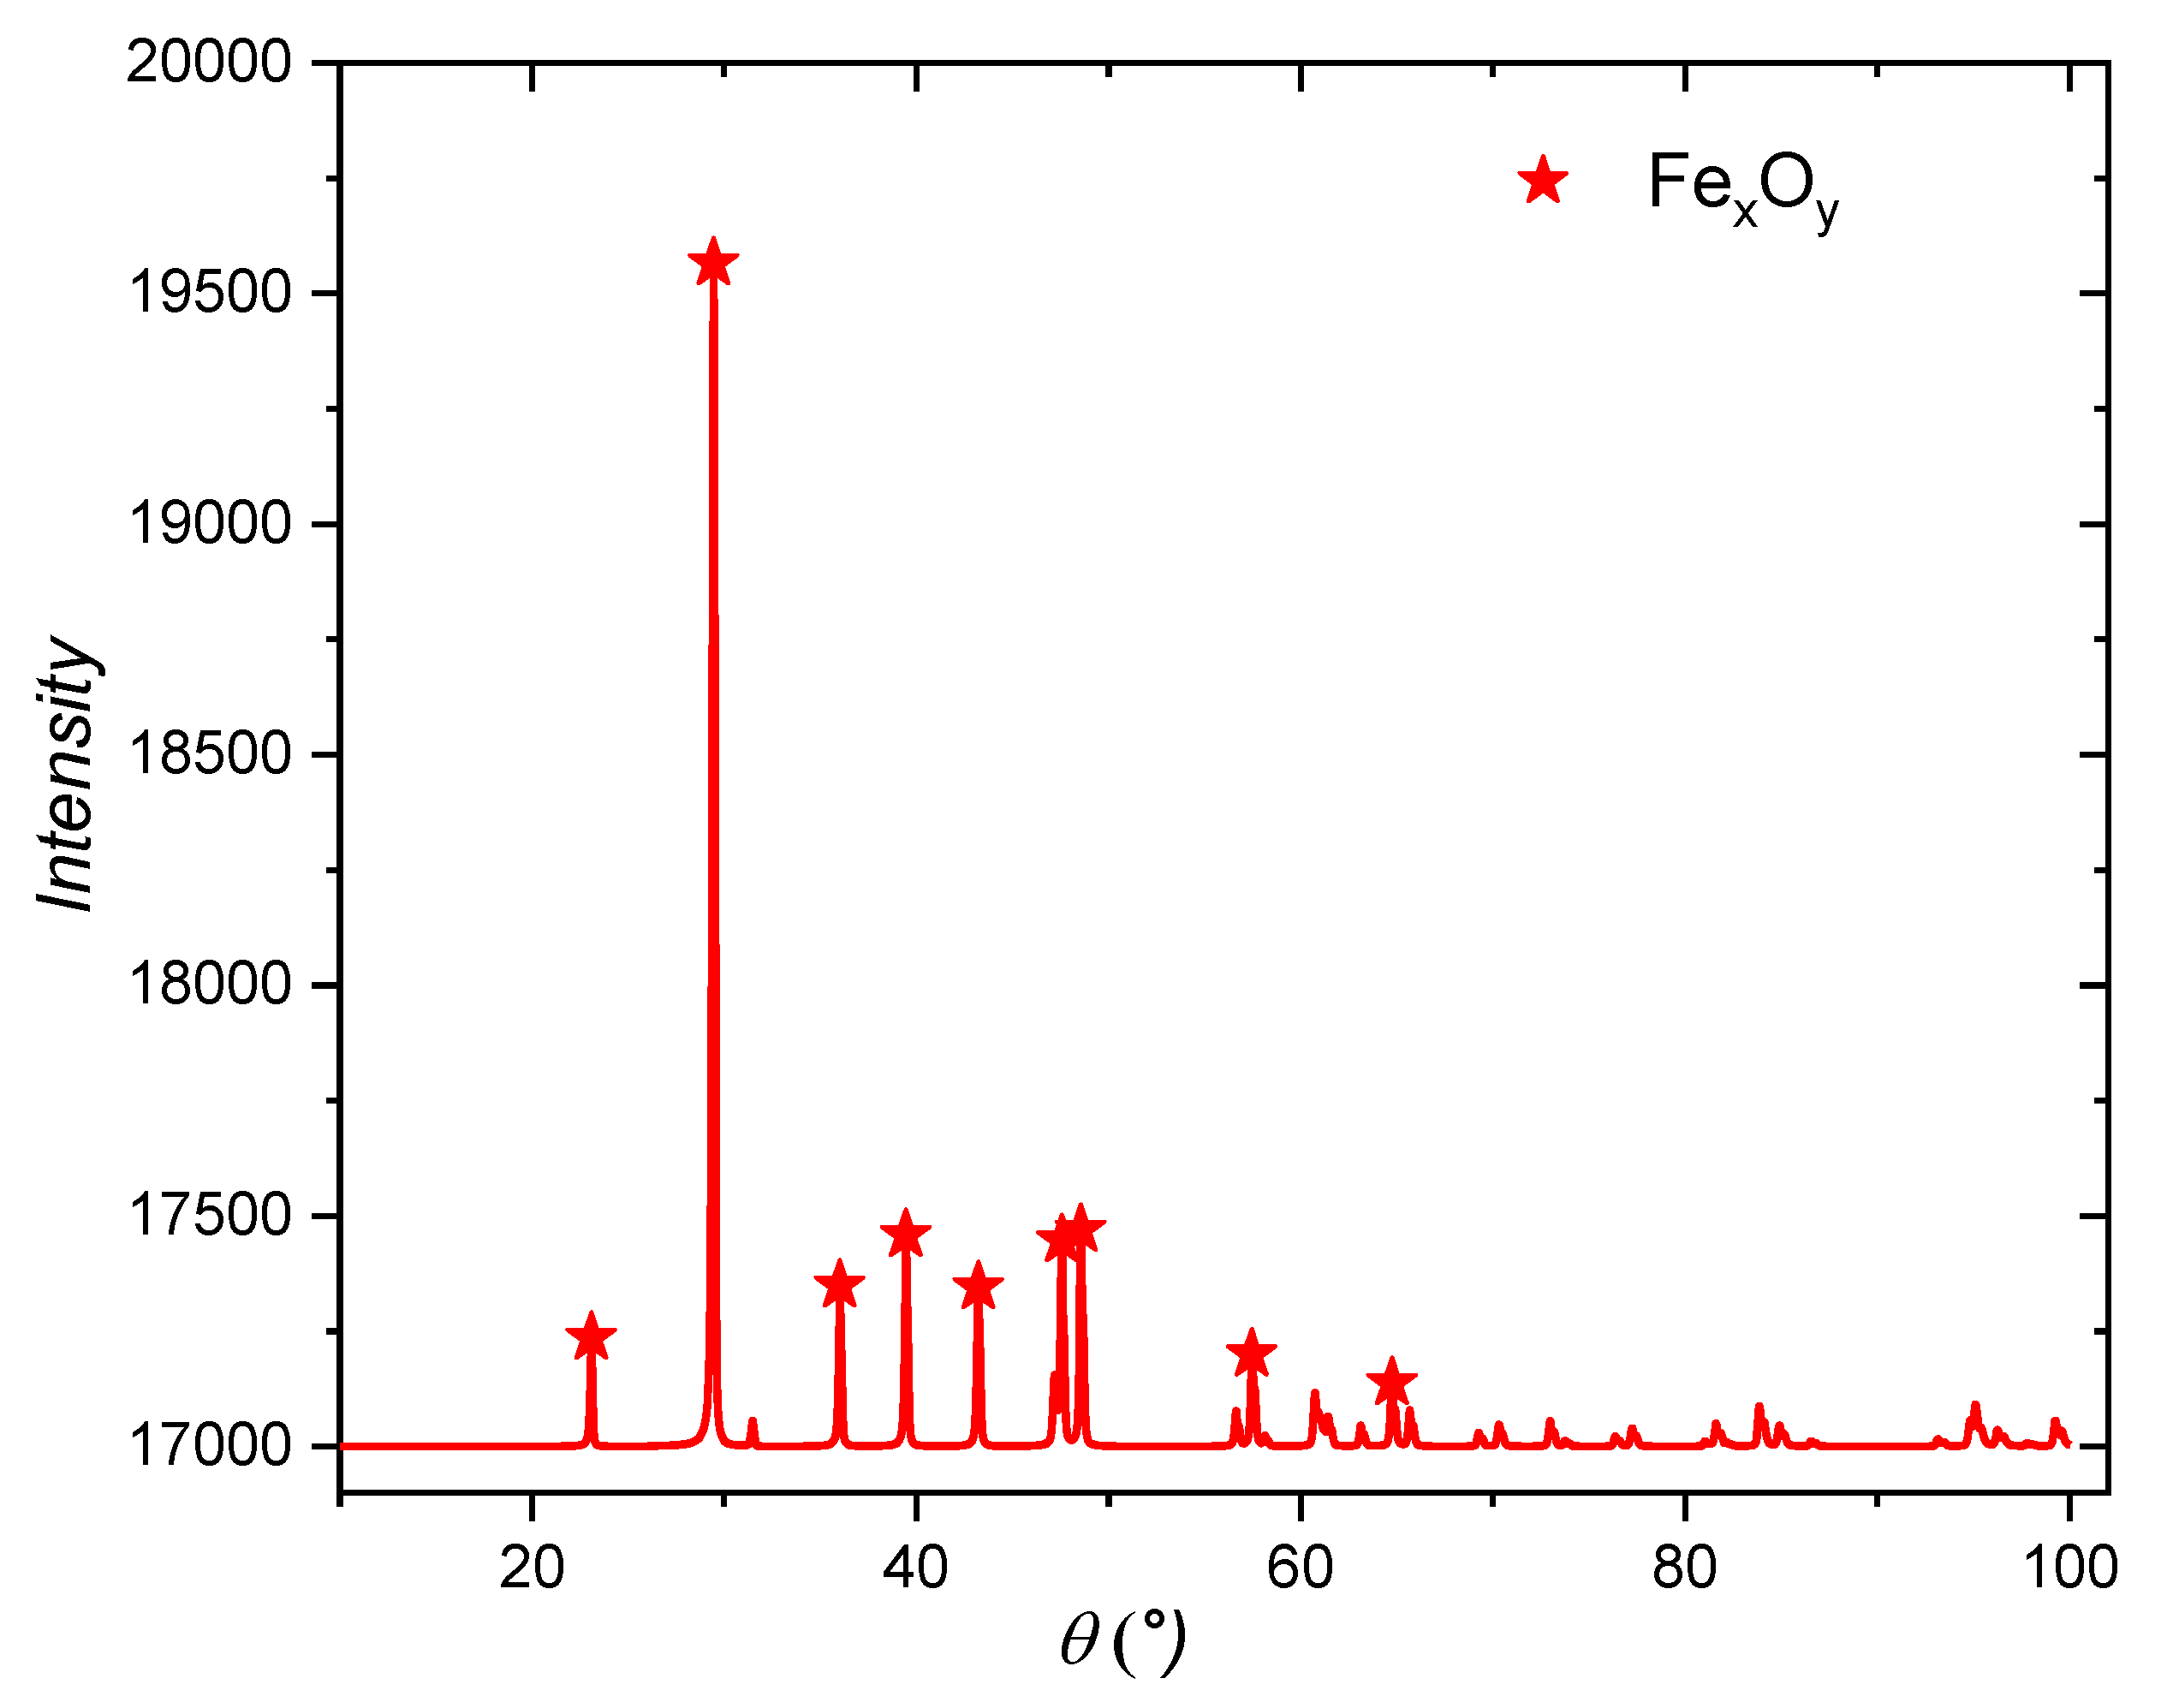
2.1.3. X-ray Diffraction Analysis
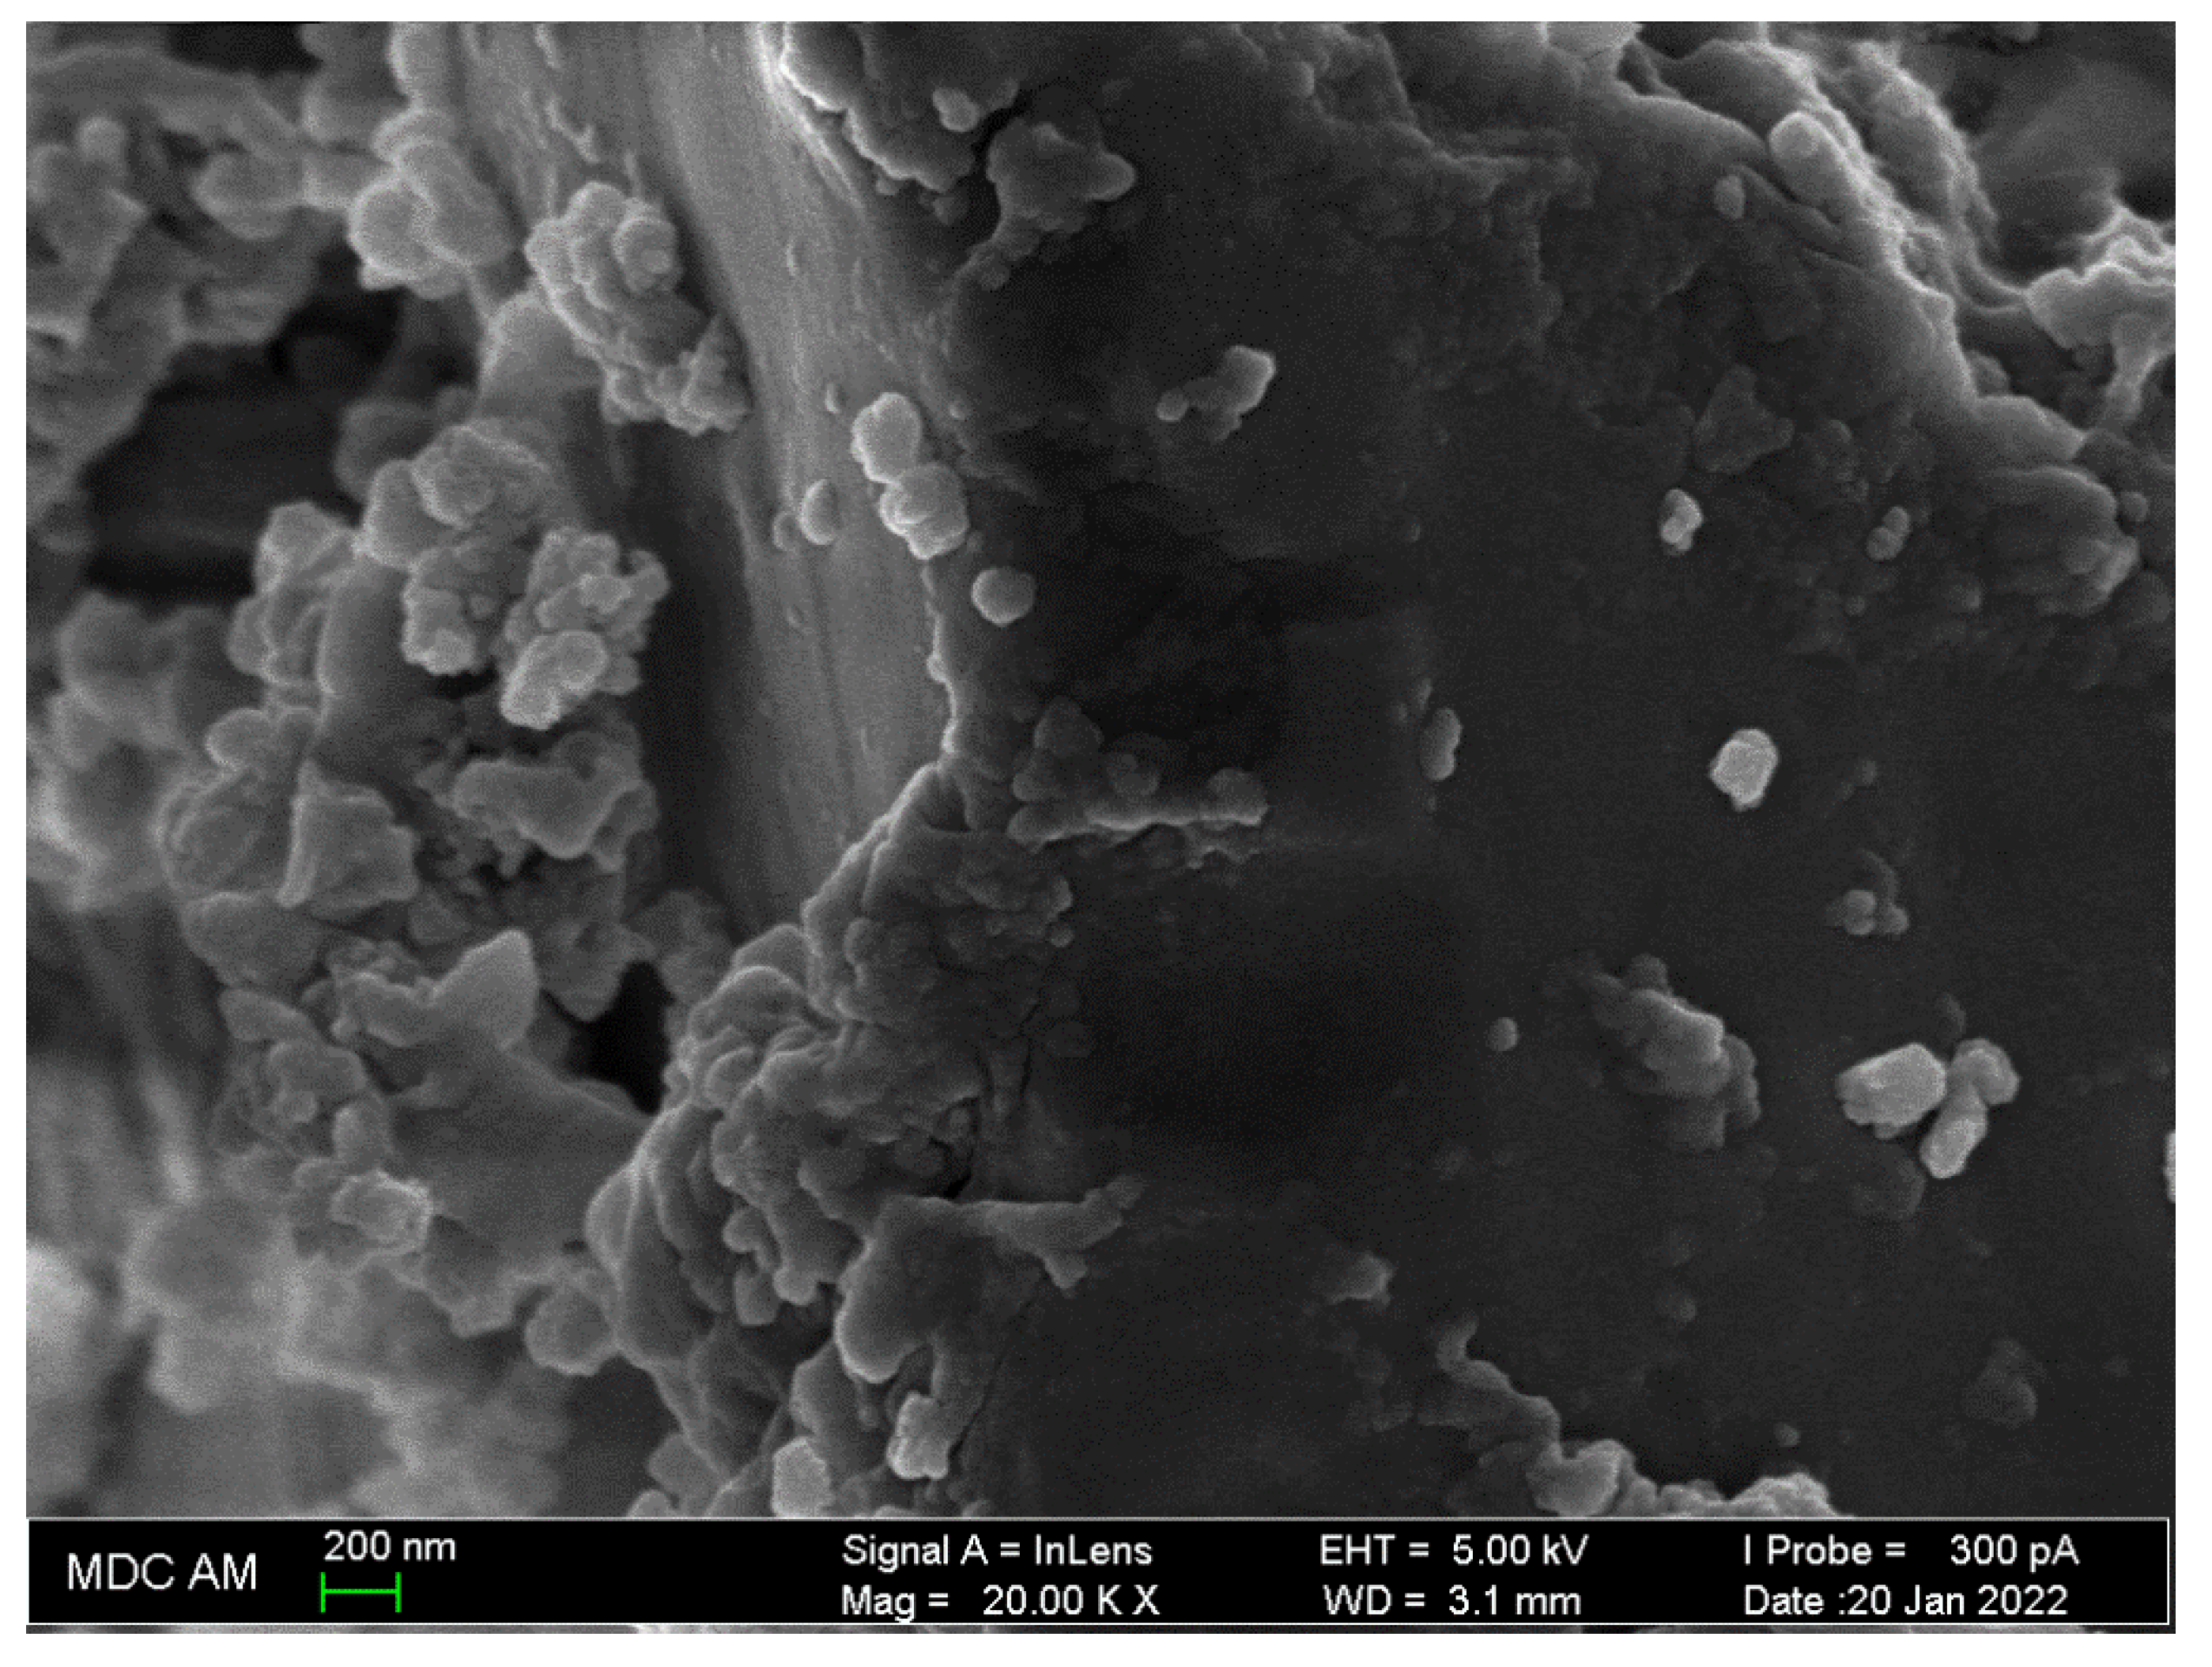
2.1.4. Scanning Electron Microscopy (SEM) Analysis
2.1.5. Thermal Analysis
2.1.6. Kinetic Theory
2.1.7. Isoconversional and Model Approach Kinetic Analysis
2.2. Discussion
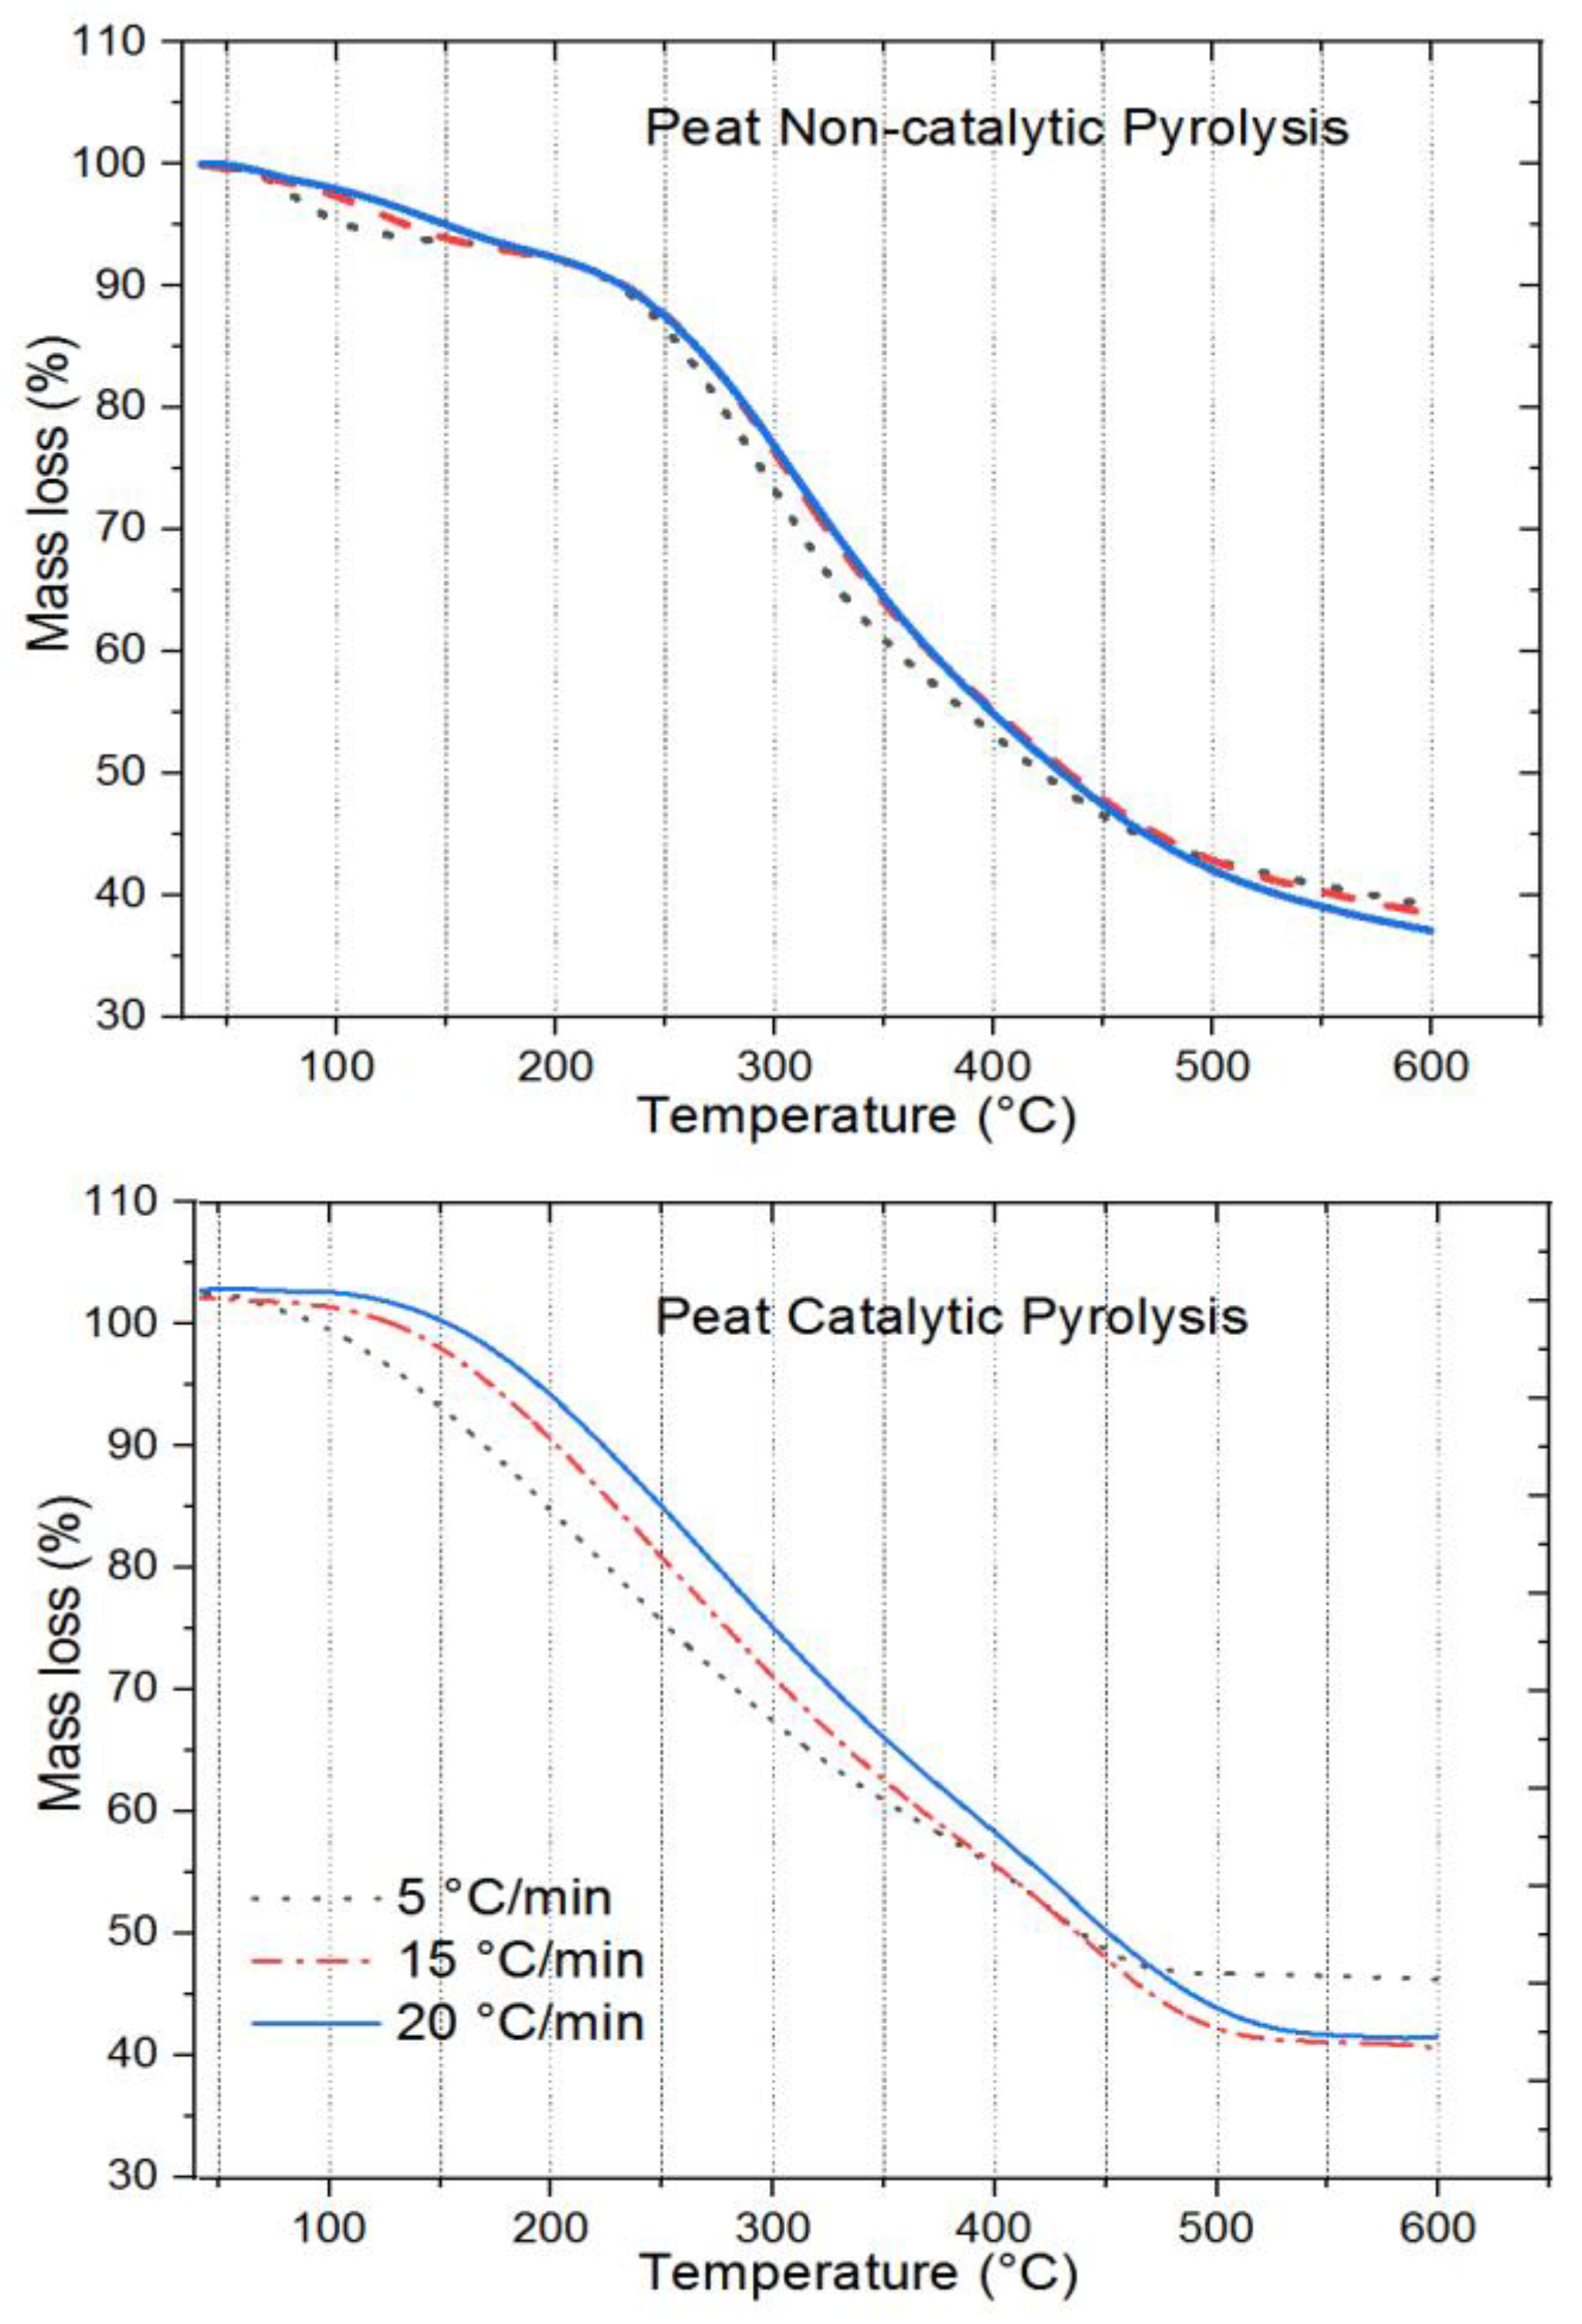
2.2.1. Thermogravimetric Analysis
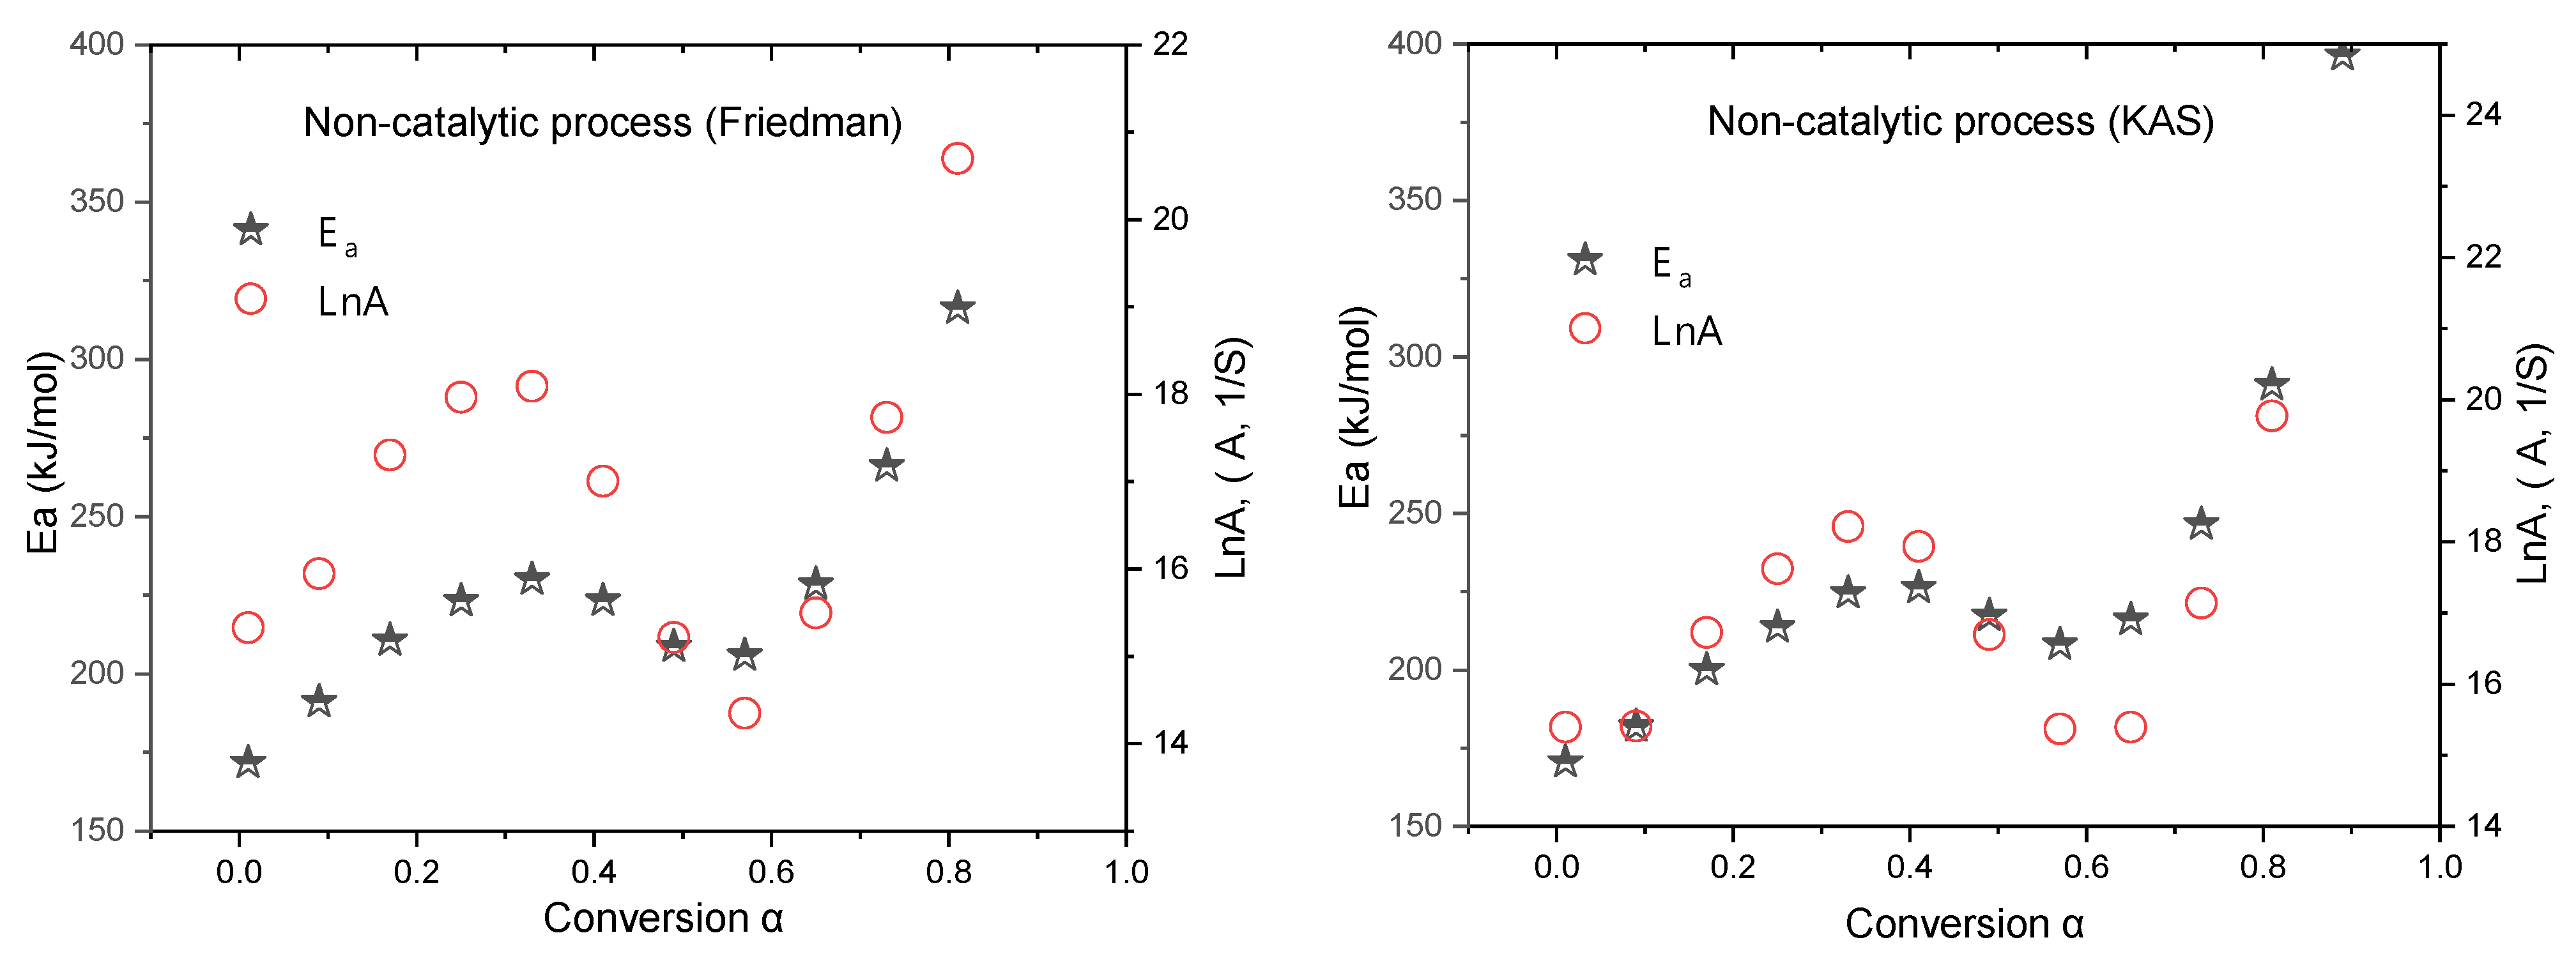
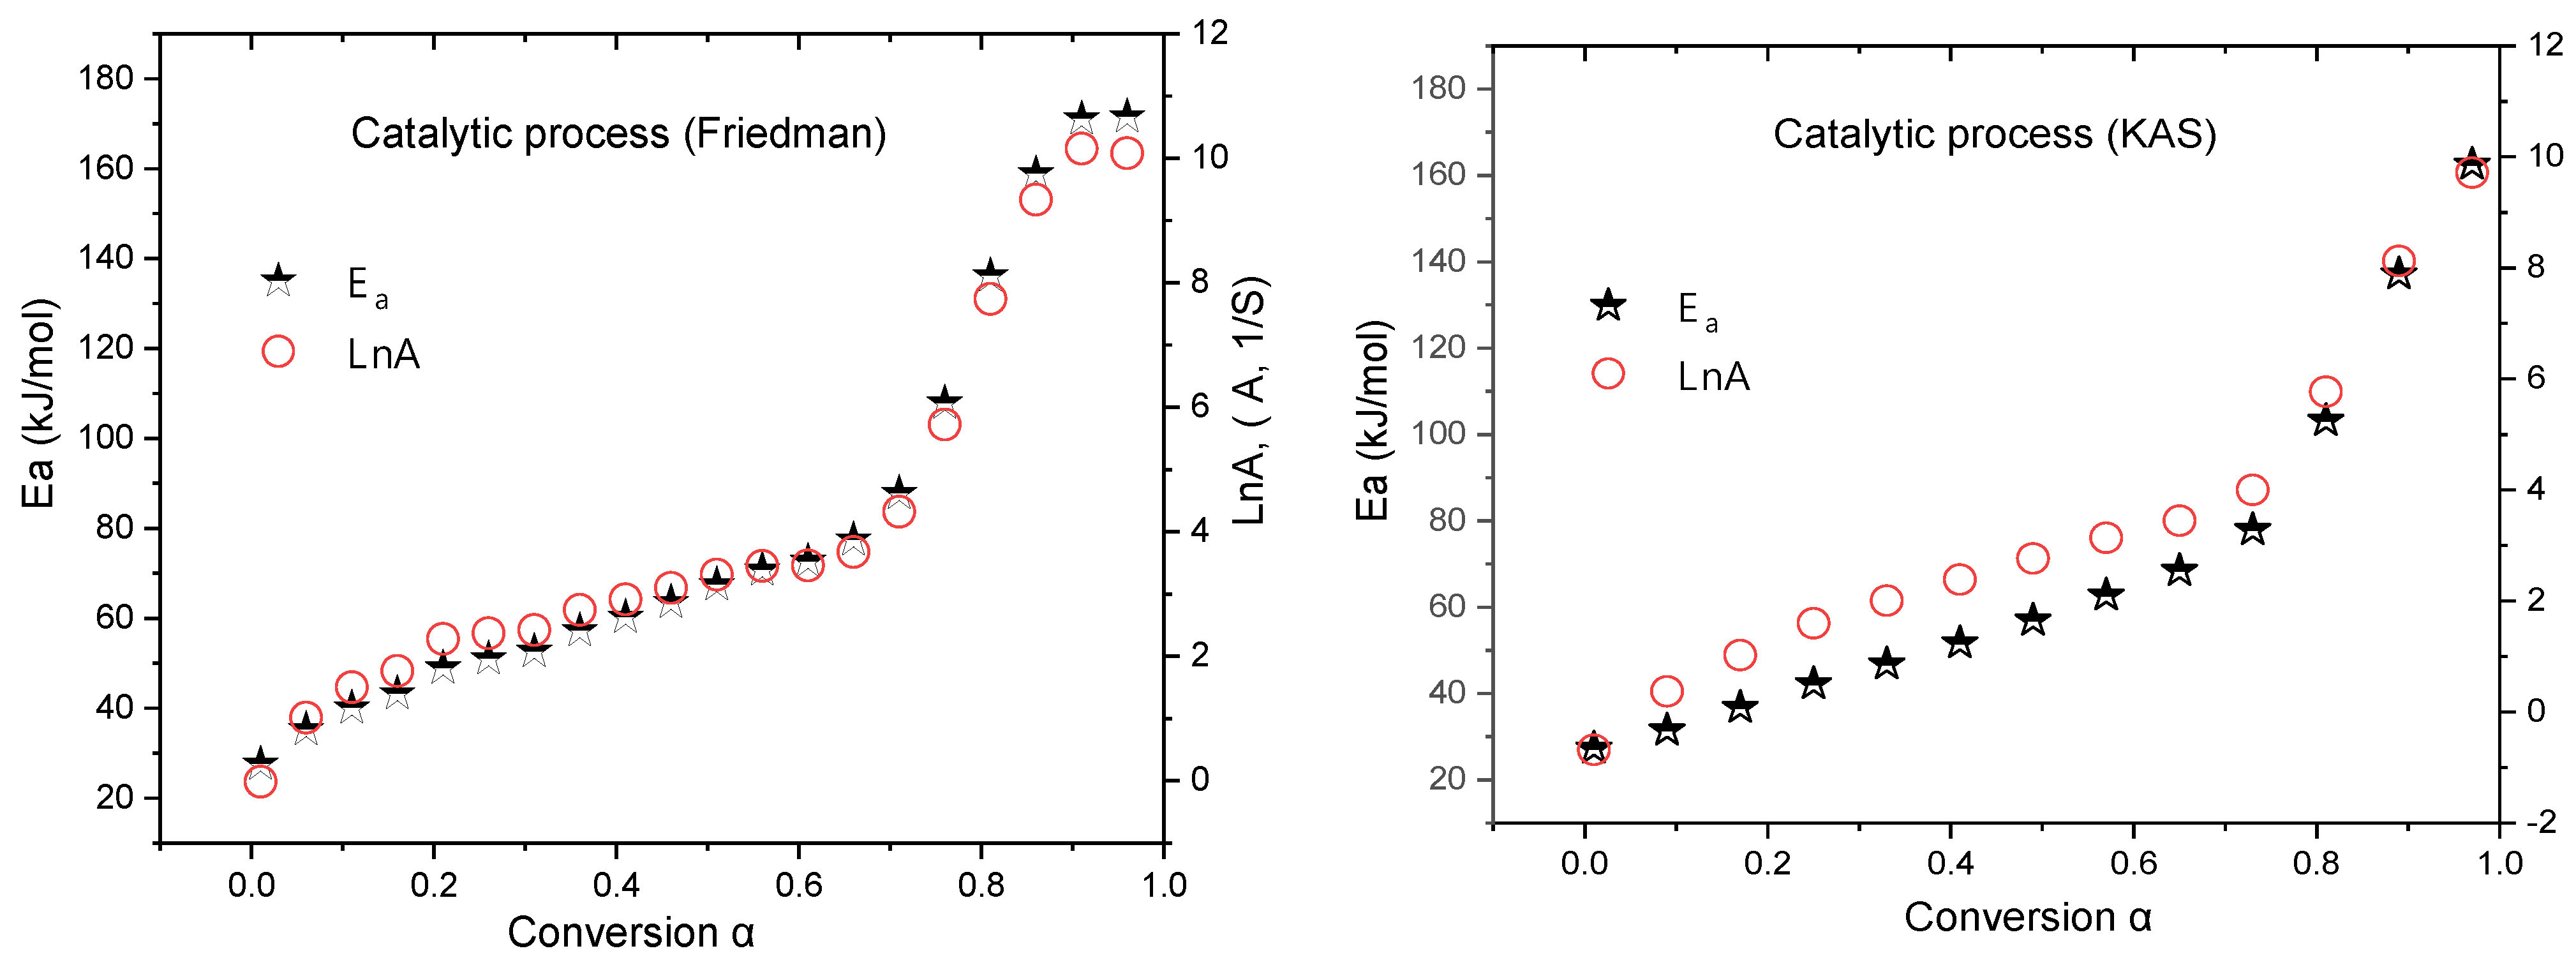
2.2.2. Kinetic Study
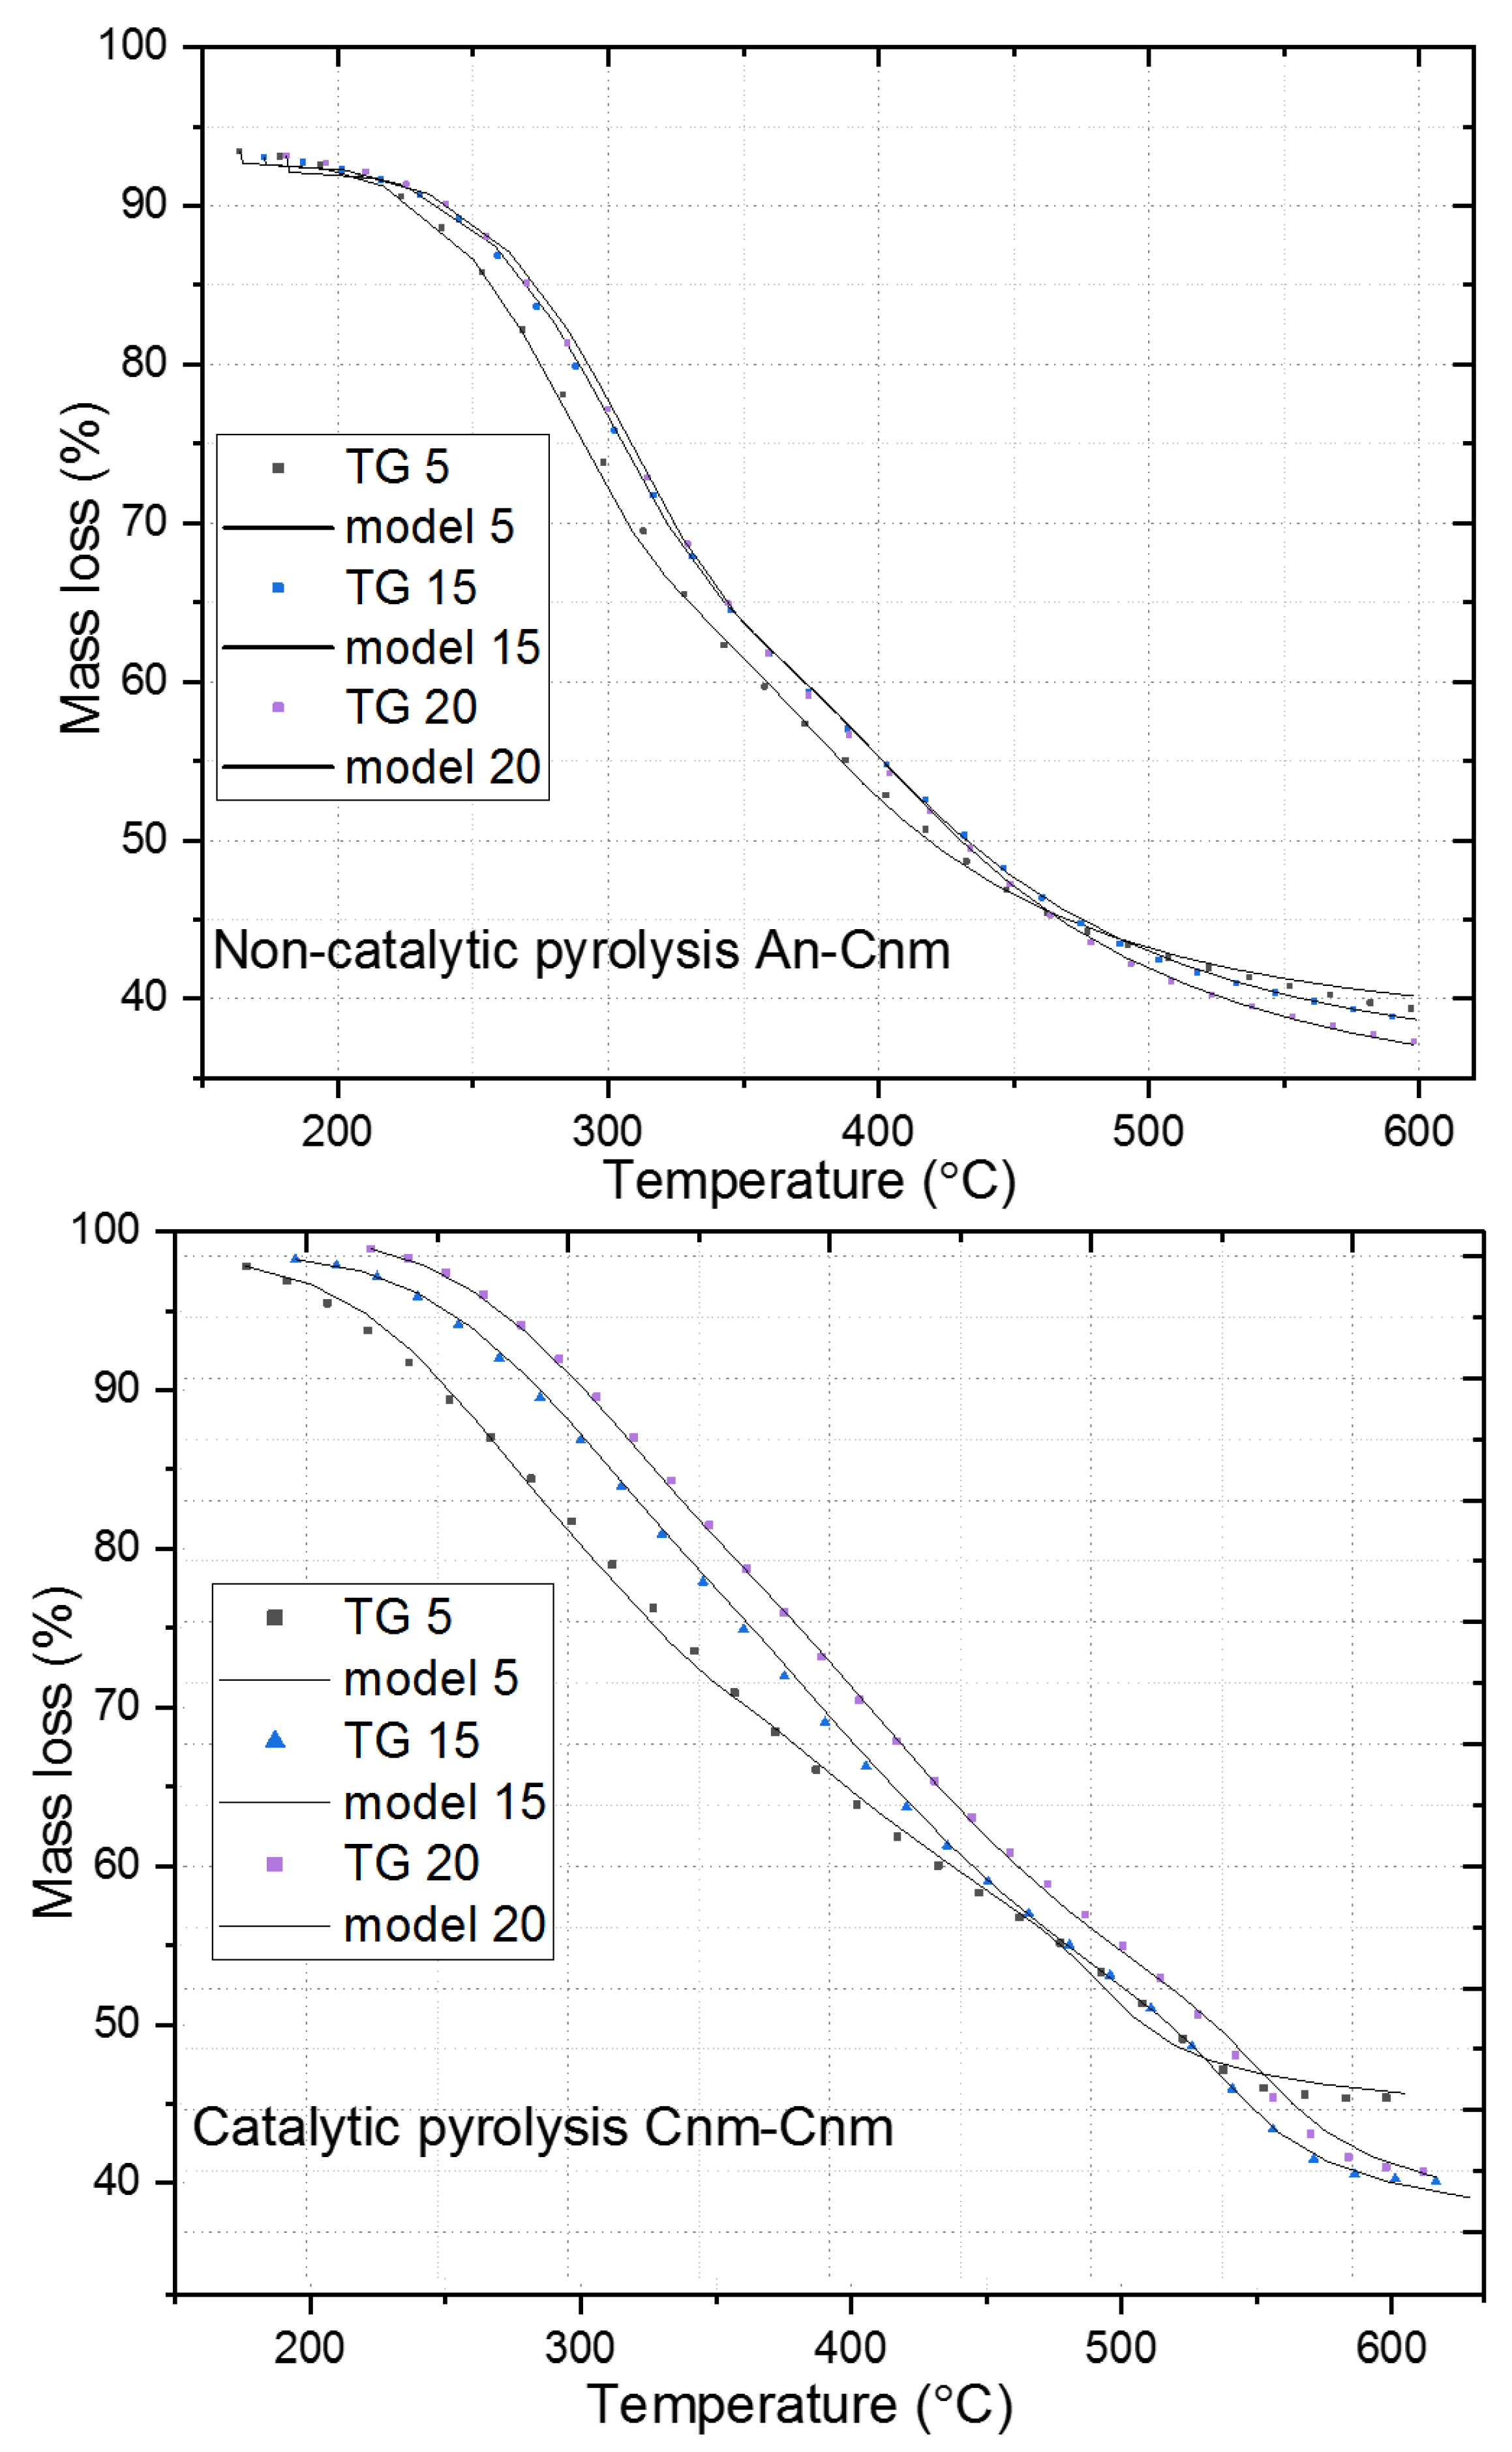
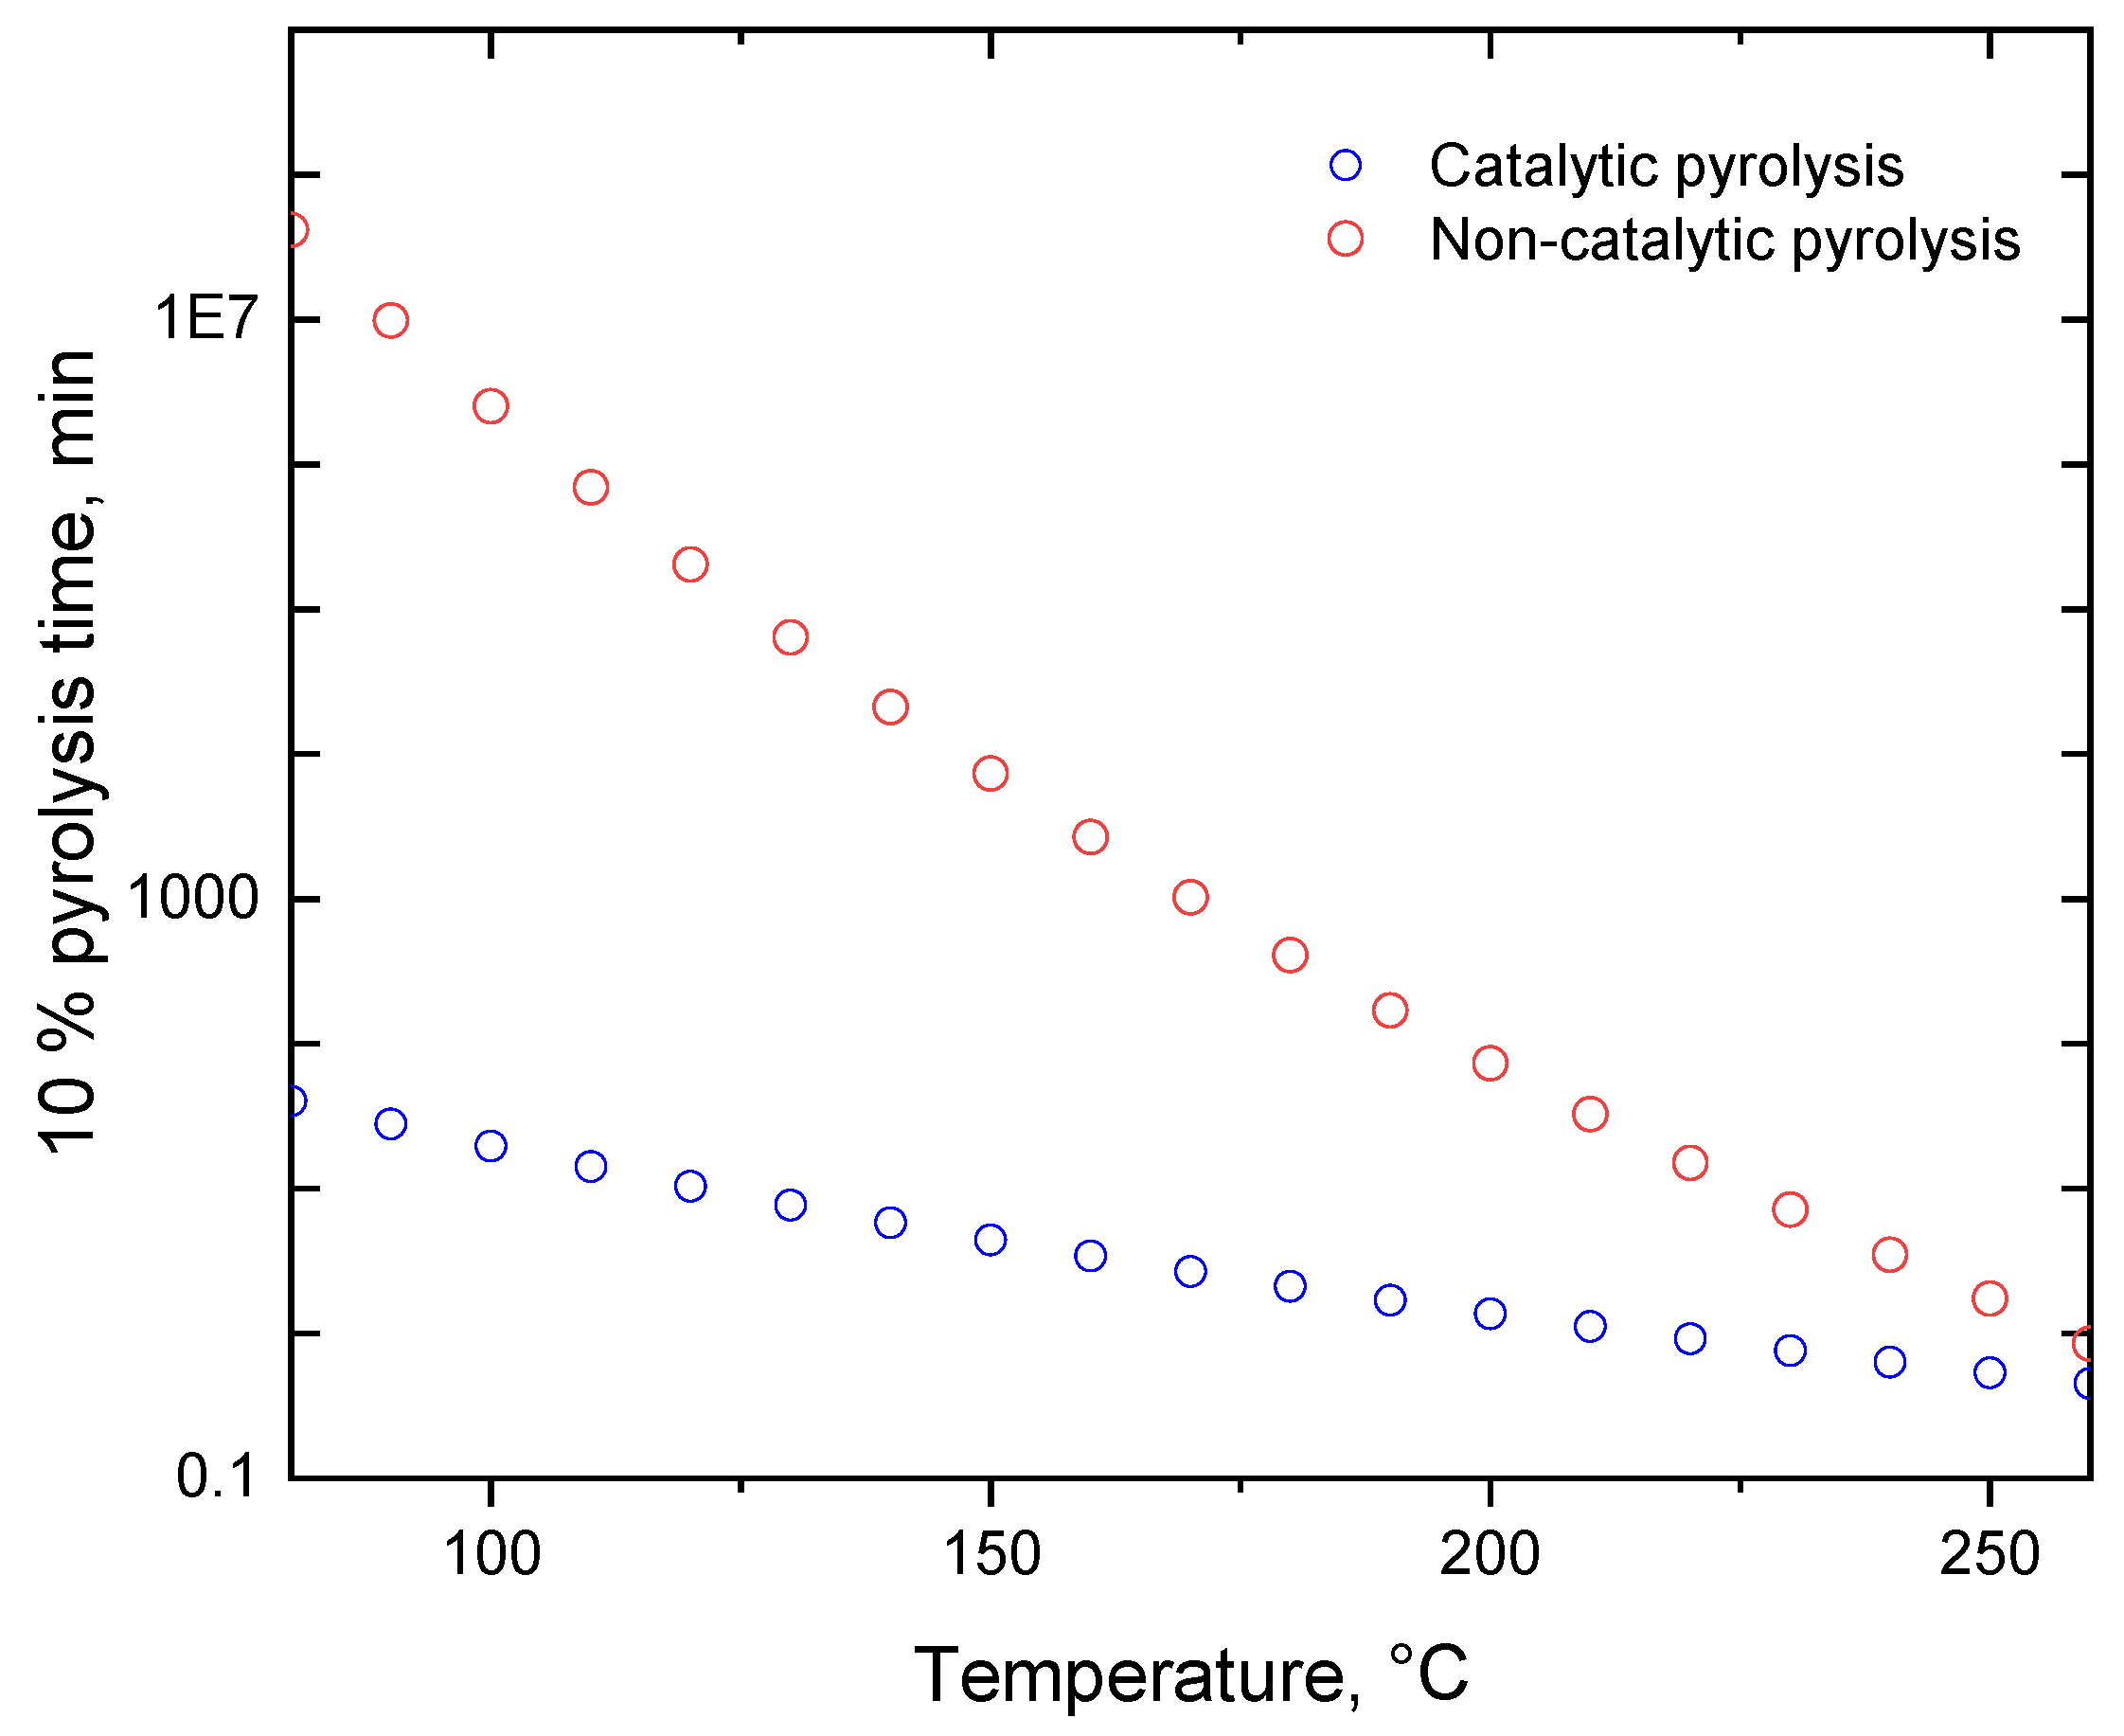
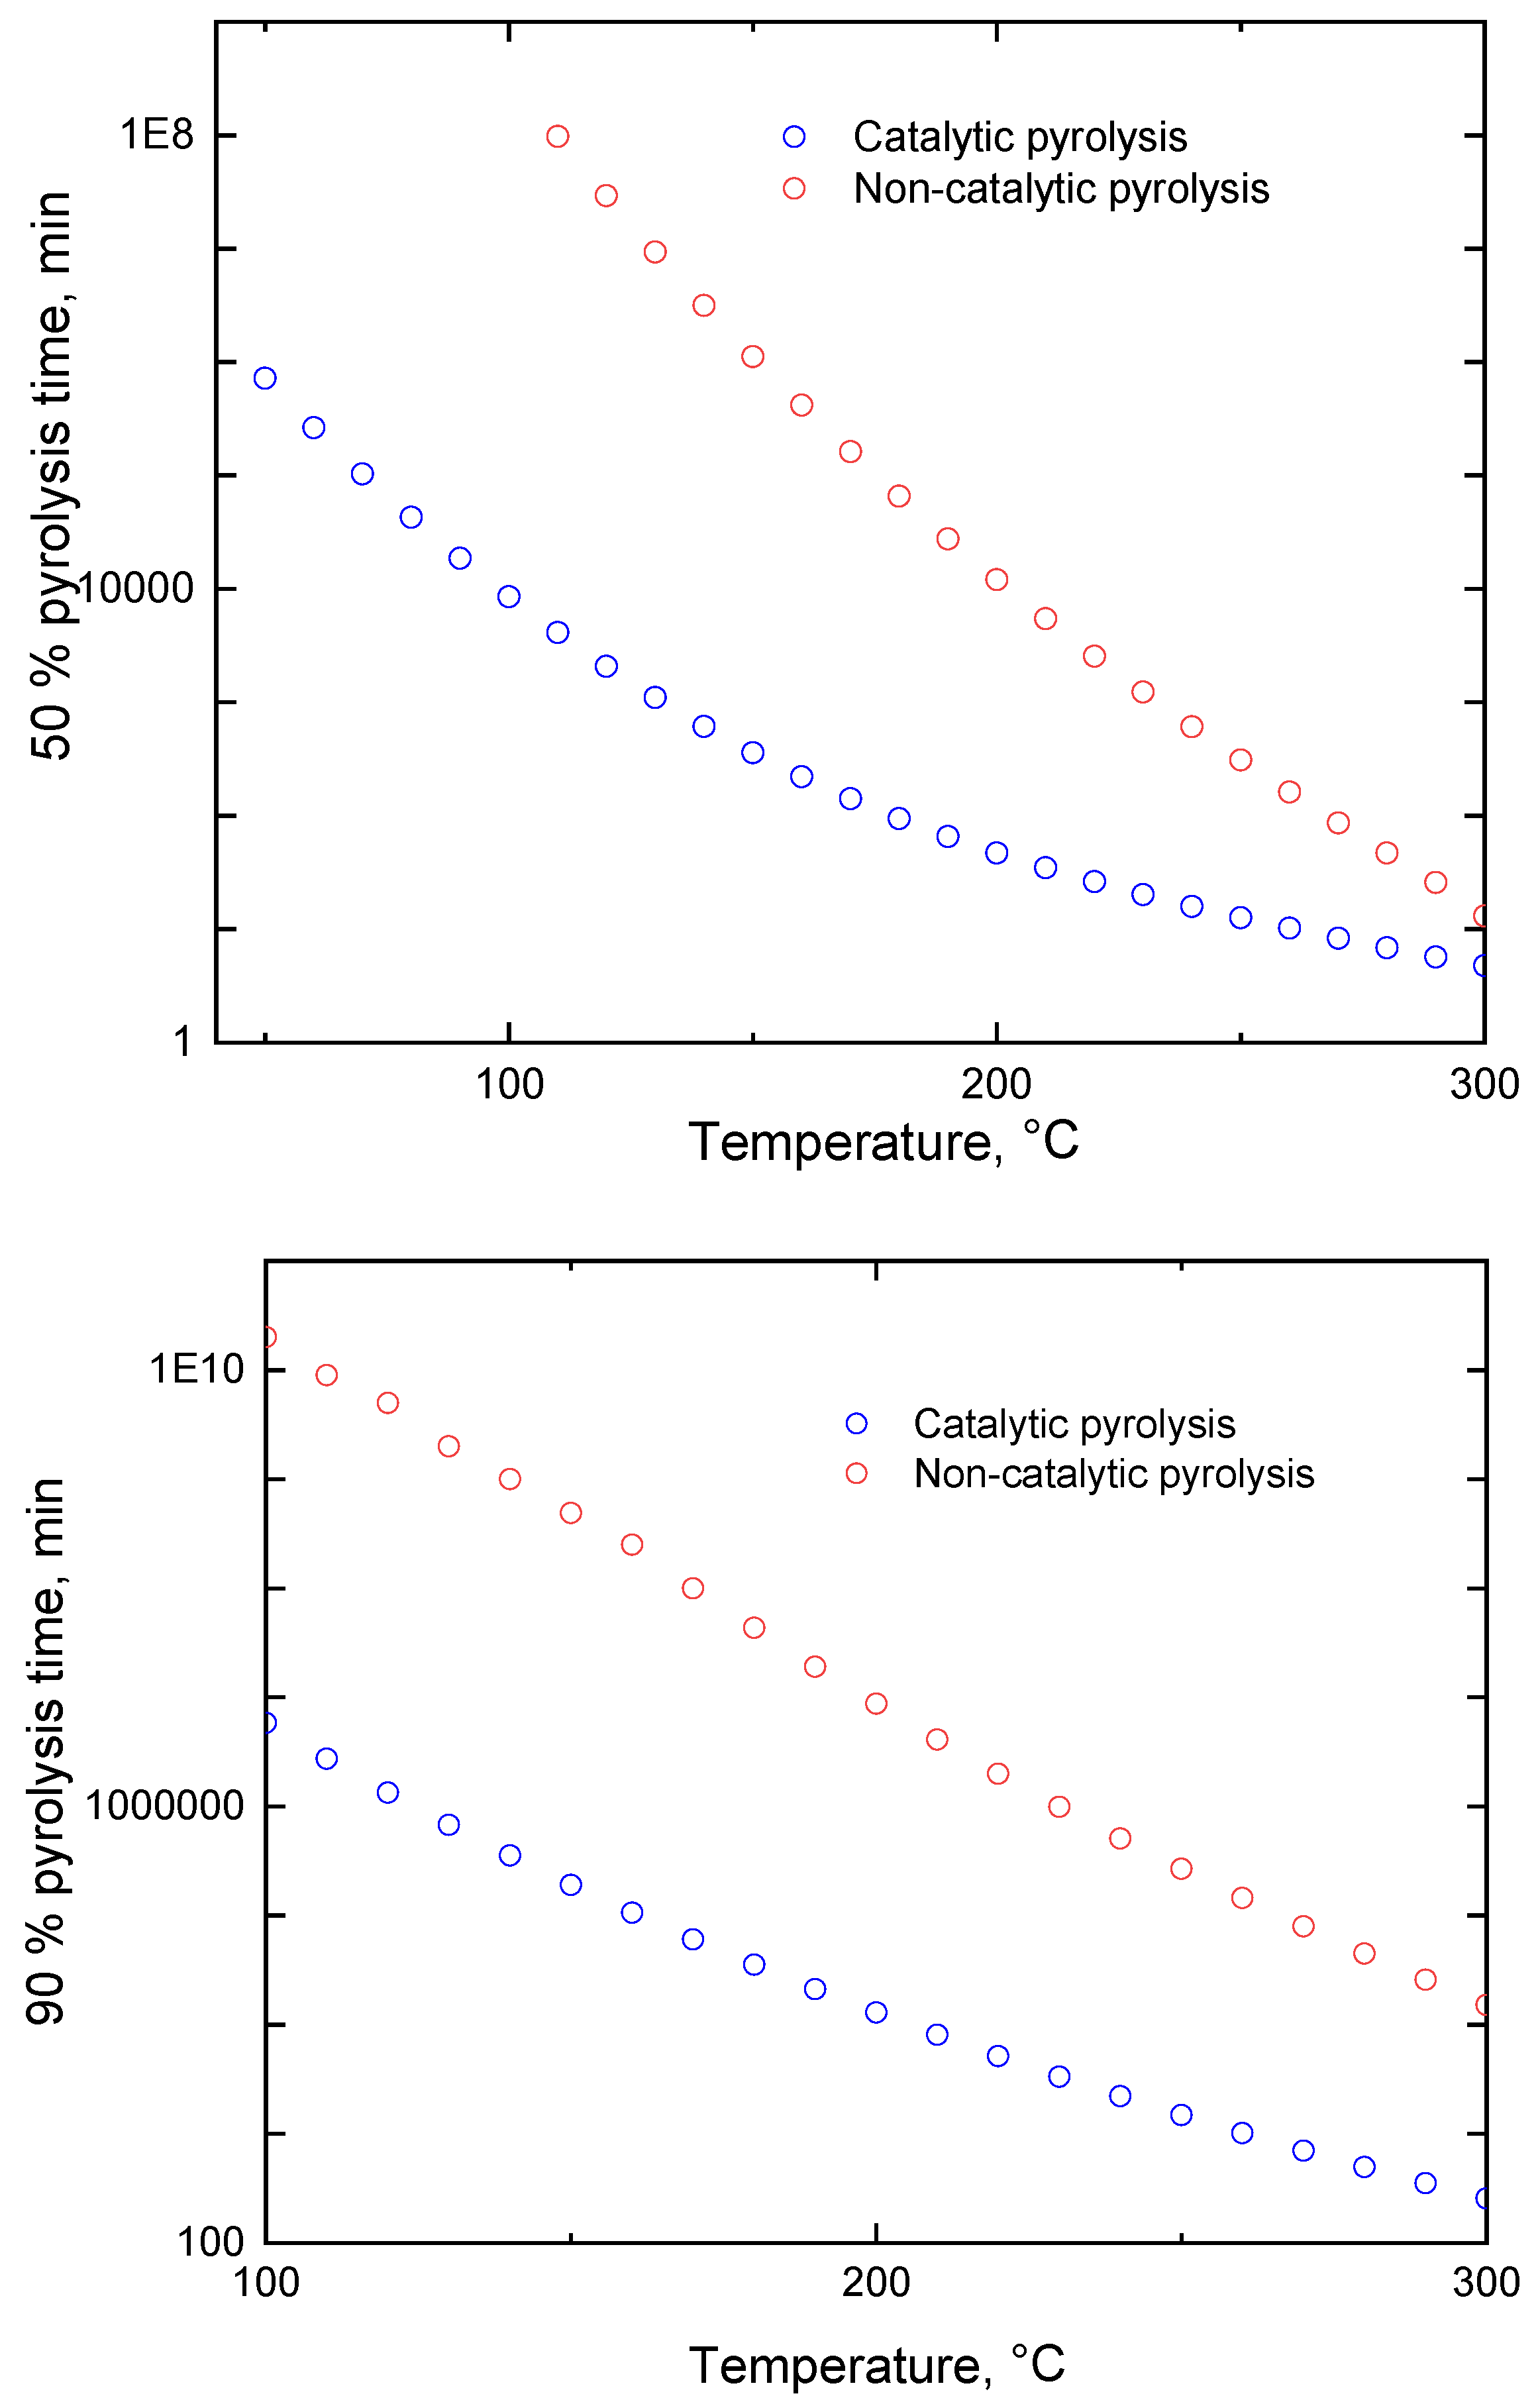
2.2.3. Kinetic Predictions
2.2.4. Thermodynamic Functions of Activated Complexes Formation
3. Conclusions
Supplementary Materials
Author Contributions
Funding
Acknowledgments
Conflicts of Interest
References
- Nemati Zadeh Haghighi, A.; Dabiri, A.; Azdarpour, A.; Karaei, M.A. Oxidation Behavior and Kinetics of Iranian Crude Oil Samples Using Thermal Analysis (TA). Energy Source Part A Recover. Util. Environ. Eff. 2019, 1–13. [Google Scholar] [CrossRef]
- Suwaid, M.A.; Varfolomeev, M.A.; Al-muntaser, A.A.; Yuan, C.; Starshinova, V.L.; Zinnatullin, A.; Vagizov, F.G.; Rakhmatullin, I.Z.; Emelianov, D.A.; Chemodanov, A.E. In-Situ Catalytic Upgrading of Heavy Oil Using Oil-Soluble Transition Metal-Based Catalysts. Fuel 2020, 281, 118753. [Google Scholar] [CrossRef]
- Omajali, J.B.; Hart, A.; Walker, M.; Wood, J.; Macaskie, L.E. In-Situ Catalytic Upgrading of Heavy Oil Using Dispersed Bionanoparticles Supported on Gram-Positive and Gram-Negative Bacteria. Appl. Catal. B Environ. 2017, 203, 807–819. [Google Scholar] [CrossRef] [Green Version]
- Jameel, A.G.A.; Khateeb, A.; Elbaz, A.M.; Emwas, A.-H.; Zhang, W.; Roberts, W.L.; Sarathy, S.M. Characterization of Deasphalted Heavy Fuel Oil Using APPI (+) FT-ICR Mass Spectrometry and NMR Spectroscopy. Fuel 2019, 253, 950–963. [Google Scholar] [CrossRef]
- Wang, L.; Kong, F.; Zheng, M.; Wang, D. Present Situation and Suggestions on the Exploitation and Utilization of Peat Resources in China. Conserv. Util. Miner. Resour. 2019, 39, 142–147. [Google Scholar]
- Waller, M.; Kirby, J. Coastal Peat-beds and Peatlands of the Southern North Sea: Their Past, Present and Future. Biol. Rev. 2021, 96, 408–432. [Google Scholar] [CrossRef]
- Lee, T.; Jung, S.; Hong, J.; Wang, C.-H.; Alessi, D.S.; Lee, S.S.; Park, Y.-K.; Kwon, E.E. Using CO2 as an Oxidant in the Catalytic Pyrolysis of Peat Moss from the North Polar Region. Environ. Sci. Technol. 2020, 54, 6329–6343. [Google Scholar] [CrossRef]
- Gu, J.; Wang, S.; Lu, T.; Wu, Y.; Yuan, H.; Chen, Y. Synthesis and Evaluation of Pyrolysis Waste Peat Char Supported Catalyst for Steam Reforming of Toluene. Renew. Energy 2020, 160, 964–973. [Google Scholar] [CrossRef]
- Fuchsman, C. Peat: Industrial Chemistry and Technology; Elsevier: Amsterdam, The Netherlands, 2012; ISBN 0323157114. [Google Scholar]
- Elliott, D.C.; Baker, E.G.; Piskorz, J.; Scott, D.S.; Solantausta, Y. Production of Liquid Hydrocarbon Fuels from Peat. Energy Fuels 1988, 2, 234–235. [Google Scholar] [CrossRef]
- Boden, T.A.; Marland, G.; Andres, R.J. Global, Regional, and National Fossil-Fuel CO2 Emissions. Carbon Dioxide Inf. Anal. Center Oak Ridge Natl. Lab. US Dep. Energy Oak Ridge Tenn. USA 2009, 10, 501–510. [Google Scholar]
- Weldemichael, Y.; Assefa, G. Assessing the Energy Production and GHG (Greenhouse Gas) Emissions Mitigation Potential of Biomass Resources for Alberta. J. Clean. Prod. 2016, 112, 4257–4264. [Google Scholar] [CrossRef]
- Shuba, E.S.; Kifle, D. Microalgae to Biofuels: ‘Promising’ Alternative and Renewable Energy, Review. Renew. Sustain. Energy Rev. 2018, 81, 743–755. [Google Scholar] [CrossRef]
- Marsh, G. Biofuels: Aviation Alternative? Renew. Energy Focus 2008, 9, 48–51. [Google Scholar] [CrossRef]
- Yang, Q.Z.; Song, B. Sustainability Assessment of Biofuels as Alternative Energy Resources. In Proceedings of the 2008 IEEE International Conference on Sustainable Energy Technologies, Singapore, 24–27 November 2008; pp. 1001–1006. [Google Scholar]
- Lu, Q.; Eid, K.; Li, W.; Abdullah, A.M.; Xu, G.; Varma, R.S. Engineering Graphitic Carbon Nitride (GC3N4) for Catalytic Reduction of CO2 to Fuels and Chemicals: Strategy and Mechanism. Green Chem. 2021, 23, 5394–5428. [Google Scholar] [CrossRef]
- Eid, K.; Lu, Q.; Abdel-Azeim, S.; Soliman, A.; Abdullah, A.M.; Abdelgwad, A.M.; Forbes, R.P.; Ozoemena, K.I.; Varma, R.S.; Shibl, M.F. Highly Exfoliated Ti3C2T x MXene Nanosheets Atomically Doped with Cu for Efficient Electrochemical CO2 Reduction: An Experimental and Theoretical Study. J. Mater. Chem. A 2022, 10, 1965–1975. [Google Scholar] [CrossRef]
- Taherzadeh, M.J.; Karimi, K. Acid-Based Hydrolysis Processes for Ethanol from Lignocellulosic Materials: A Review. BioResources 2007, 2, 472–499. [Google Scholar]
- Taherzadeh, M.J.; Karimi, K. Enzymatic-Based Hydrolysis Processes for Ethanol from Lignocellulosic Materials: A Review. BioResources 2007, 2, 707–738. [Google Scholar]
- Kirkinen, J.; Minkkinen, K.; Penttilä, T.; Kojola, S.; Sievänen, R.; Alm, J.; Saarnio, S.; Silvan, N.; Laine, J.; Savolainen, I. Greenhouse Impact Due to Different Peat Fuel Utilisation Chains in Finland—A Life-Cycle Approach; Boreal Environment Research Publishing Board: Helsinki, Finland, 2007. [Google Scholar]
- Lake, L.W. Enhanced Oil Recovery; Technology & Engineering: Old Tappan, NJ, USA, 1989. [Google Scholar]
- Sheng, J.J. Modern Chemical Enhanced Oil Recovery: Theory and Practice; Gulf Professional Publishing: Houston, TX, USA, 2010; ISBN 0080961630. [Google Scholar]
- Green, D.W.; Willhite, G.P. Enhanced Oil Recovery; Henry, L., Ed.; Doherty Memorial Fund of AIME, Society of Petroleum Engineers: Dallas, TX, USA, 1998; Volume 6. [Google Scholar]
- Mokheimer, E.M.A.; Hamdy, M.; Abubakar, Z.; Shakeel, M.R.; Habib, M.A.; Mahmoud, M. A Comprehensive Review of Thermal Enhanced Oil Recovery: Techniques Evaluation. J. Energy Resour. Technol. 2019, 141, 30801. [Google Scholar] [CrossRef]
- Eid, K.; Sliem, M.H.; Jlassi, K.; Eldesoky, A.S.; Abdo, G.G.; Al-Qaradawi, S.Y.; Sharaf, M.A.; Abdullah, A.M.; Elzatahry, A.A. Precise Fabrication of Porous One-Dimensional GC3N4 Nanotubes Doped with Pd and Cu Atoms for Efficient CO Oxidation and CO2 Reduction. Inorg. Chem. Commun. 2019, 107, 107460. [Google Scholar] [CrossRef]
- Gamal, A.; Eid, K.; Abdullah, A.M. Engineering of Pt-Based Nanostructures for Efficient Dry (CO2) Reforming: Strategy and Mechanism for Rich-Hydrogen Production. Int. J. Hydrog. Energy 2021, 47, 5901–5928. [Google Scholar] [CrossRef]
- Gamal, A.; Eid, K.; El-Naas, M.H.; Kumar, D.; Kumar, A. Catalytic Methane Decomposition to Carbon Nanostructures and COx-Free Hydrogen: A Mini-Review. Nanomaterials 2021, 11, 1226. [Google Scholar] [CrossRef] [PubMed]
- Abdu, H.I.; Eid, K.; Abdullah, A.M.; Lu, X. Data on the Synthesis and Characterizations of Carboxylated Carbon-Based Catalyst from Eucalyptus as Efficient and Reusable Catalysts for Hydrolysis of Eucalyptus. Data Br. 2020, 30, 105520. [Google Scholar] [CrossRef] [PubMed]
- Mukhamatdinov, I.I.; Salih, I.S.S.; Khelkhal, M.A.; Vakhin, A. V Application of Aromatic and Industrial Solvents for Enhancing Heavy Oil Recovery from the Ashalcha Field. Energy Fuels 2020, 35, 374–385. [Google Scholar] [CrossRef]
- Vakhin, A.V.; Khelkhal, M.A.; Tajik, A.; Gafurov, M.R.; Morozov, O.G.; Nasybullin, A.R.; Karandashov, S.A.; Ponomarev, A.A.; Krapivnitskaia, T.O.; Glyavin, M.Y. The Role of Nanodispersed Catalysts in Microwave Application during the Development of Unconventional Hydrocarbon Reserves: A Review of Potential Applications. Processes 2021, 9, 420. [Google Scholar] [CrossRef]
- Khelkhal, M.A.; Eskin, A.A.; Nurgaliev, D.K.; Vakhin, A.V. Thermal Study on Stabilizing Combustion Front via Bimetallic Mn@Cu Tallates during Heavy Oil Oxidation. Energy fuels 2019, 34, 5121–5127. [Google Scholar] [CrossRef]
- Khelkhal, M.A.; Eskin, A.A.; Vakhin, A.V. Kinetic Study on Heavy Oil Oxidation by Copper Tallates. Energy Fuels 2019, 33, 12690–12695. [Google Scholar] [CrossRef]
- Feoktistov, D.A.; Kayukova, G.P.; Vakhin, A.V.; Sitnov, S.A. Catalytic Aquathermolysis of High-Viscosity Oil Using Iron, Cobalt, and Copper Tallates. Chem. Technol. Fuels Oils 2018, 53, 905–912. [Google Scholar] [CrossRef]
- Vyazovkin, S. Isoconversional Kinetics of Thermally Stimulated Processes; Springer: Berlin/Heidelberg, Germany, 2015; ISBN 9783319141756. [Google Scholar]
- Friedman, H.L. Kinetics of Thermal Degradation of Char-forming Plastics from Thermogravimetry. Application to a Phenolic Plastic. J. Polym. Sci. Part C Polym. Symp. 1964, 6, 183–195. [Google Scholar] [CrossRef]
- Freund, J.E.; Perles, B.M. Modern Elementary Statistics; Pearson College Division: Upper Saddle River, NJ, USA, 2007. [Google Scholar]
- Khelkhal, M.A.; Eskin, A.A.; Sharifullin, A.V.; Vakhin, A.V. Differential Scanning Calorimetric Study of Heavy Oil Catalytic Oxidation in the Presence of Manganese Tallates. Pet. Sci. Technol. 2019, 37, 1194–1200. [Google Scholar] [CrossRef]
- Sitnov, S.; Mukhamatdinov, I.; Aliev, F.; Khelkhal, M.A.; Slavkina, O.; Bugaev, K. Heavy Oil Aquathermolysis in the Presence of Rock-Forming Minerals and Iron Oxide (II, III) Nanoparticles. Pet. Sci. Technol. 2020, 38, 574–579. [Google Scholar] [CrossRef]


| Component Composition of Peat Organic Matter | Mass Fraction in the Composition, % |
|---|---|
| Cellulose | 4–10 |
| Humic acids | 15–50 |
| Lignin | 5–20 |
| Easily hydrolysable compounds | 20–40 |
| Water-soluble substances | 1–5 |
| Model | Equation |
|---|---|
| Reaction of nth order (Fn) | f = (1 − α)n |
| Two-dimensional phase boundary (R2) | f = 2(1 − α)1/2 |
| Three-dimensional phase boundary (R3) | f = 3(1 − α)2/3 |
| N-dimensional nucleation according to Avrami–Erofeev (An) | f = n·(1 − α)·[−ln(1 − α)](n−1)/n |
| Expanded Prout–Tompkins equation (Bna) | f = (1 − α) n·αAutocatOrder |
| The reaction of nth order with m-power autocatalysis by-product (Cnm) | f = (1 − α)n·(1 + AutocatOrder · αm) |
| Kamal–Sourur equation (KS) |
| Non-Catalytic Peat Pyrolysis | Catalytic Peat Pyrolysis | |
|---|---|---|
| α/% | ||
| Friedman method | ||
| 10 | 194.1 ± 4 | 39.4 ± 3 |
| 20 | 215.6 ± 0.5 | 48.4 ± 4 |
| 30 | 228.9 ± 0.7 | 52.9 ± 4 |
| 40 | 224.8 ± 2.3 | 59.4 ± 5 |
| 50 | 207.4 ± 0.7 | 66.9 ± 4 |
| 60 | 211.0 ± 6 | 72 ± 6 |
| 70 | 251.0 ± 8 | 84.2 ± 4 |
| 80 | 308.7 ± 1.2 | 130.4 ± 1.8 |
| 90 | 501.9 ± 66 | 169.9 ± 2.5 |
| KAS method | ||
| 10 | 184.5 ± 4 | 32.3 ± 4 |
| 20 | 205.5 ± 0.8 | 38.9 ± 5 |
| 30 | 221.2 ± 0.18 | 45.3 ± 5 |
| 40 | 226.7 ± 2.0 | 51.1 ± 6 |
| 50 | 215.8 ± 1.4 | 57.7 ± 6 |
| 60 | 208.1 ± 4 | 64.7 ± 7 |
| 70 | 233.4 ± 8 | 72.9 ± 6 |
| 80 | 284.1 ± 1.2 | 99 ± 4 |
| 90 | 433.8 ± 43 | 140.9 ± 3 |
| Models | Peat Catalytic Pyrolysis | Peat Pyrolysis |
| Cnm: | An: | |
| E = 39.2 kJ·mole−1, | E = 153.3 kJ·mole−1, | |
| LnA = 1.8 s−1, | LnA = 12 s−1, | |
| ReactOrder n = 1.72, | Dimension n = 0.5 | |
| Cnm: | Fn: | |
| E = 89.7 kJ·mole−1, | E = 143.2 kJ·mole−1, | |
| LnA = 5.4 s−1, | LnA = 9 s−1, | |
| ReactOrder n = 5.76, | ReactOrder n = 4.54 | |
| R2 | 0.99961 | 0.99980 |
| F-test | 1.000 | 1.000 |
| Noncatalytic Peat Pyrolysis | Catalytic Peat Pyrolysis | |||||
|---|---|---|---|---|---|---|
| α/% | ||||||
| Friedman method | ||||||
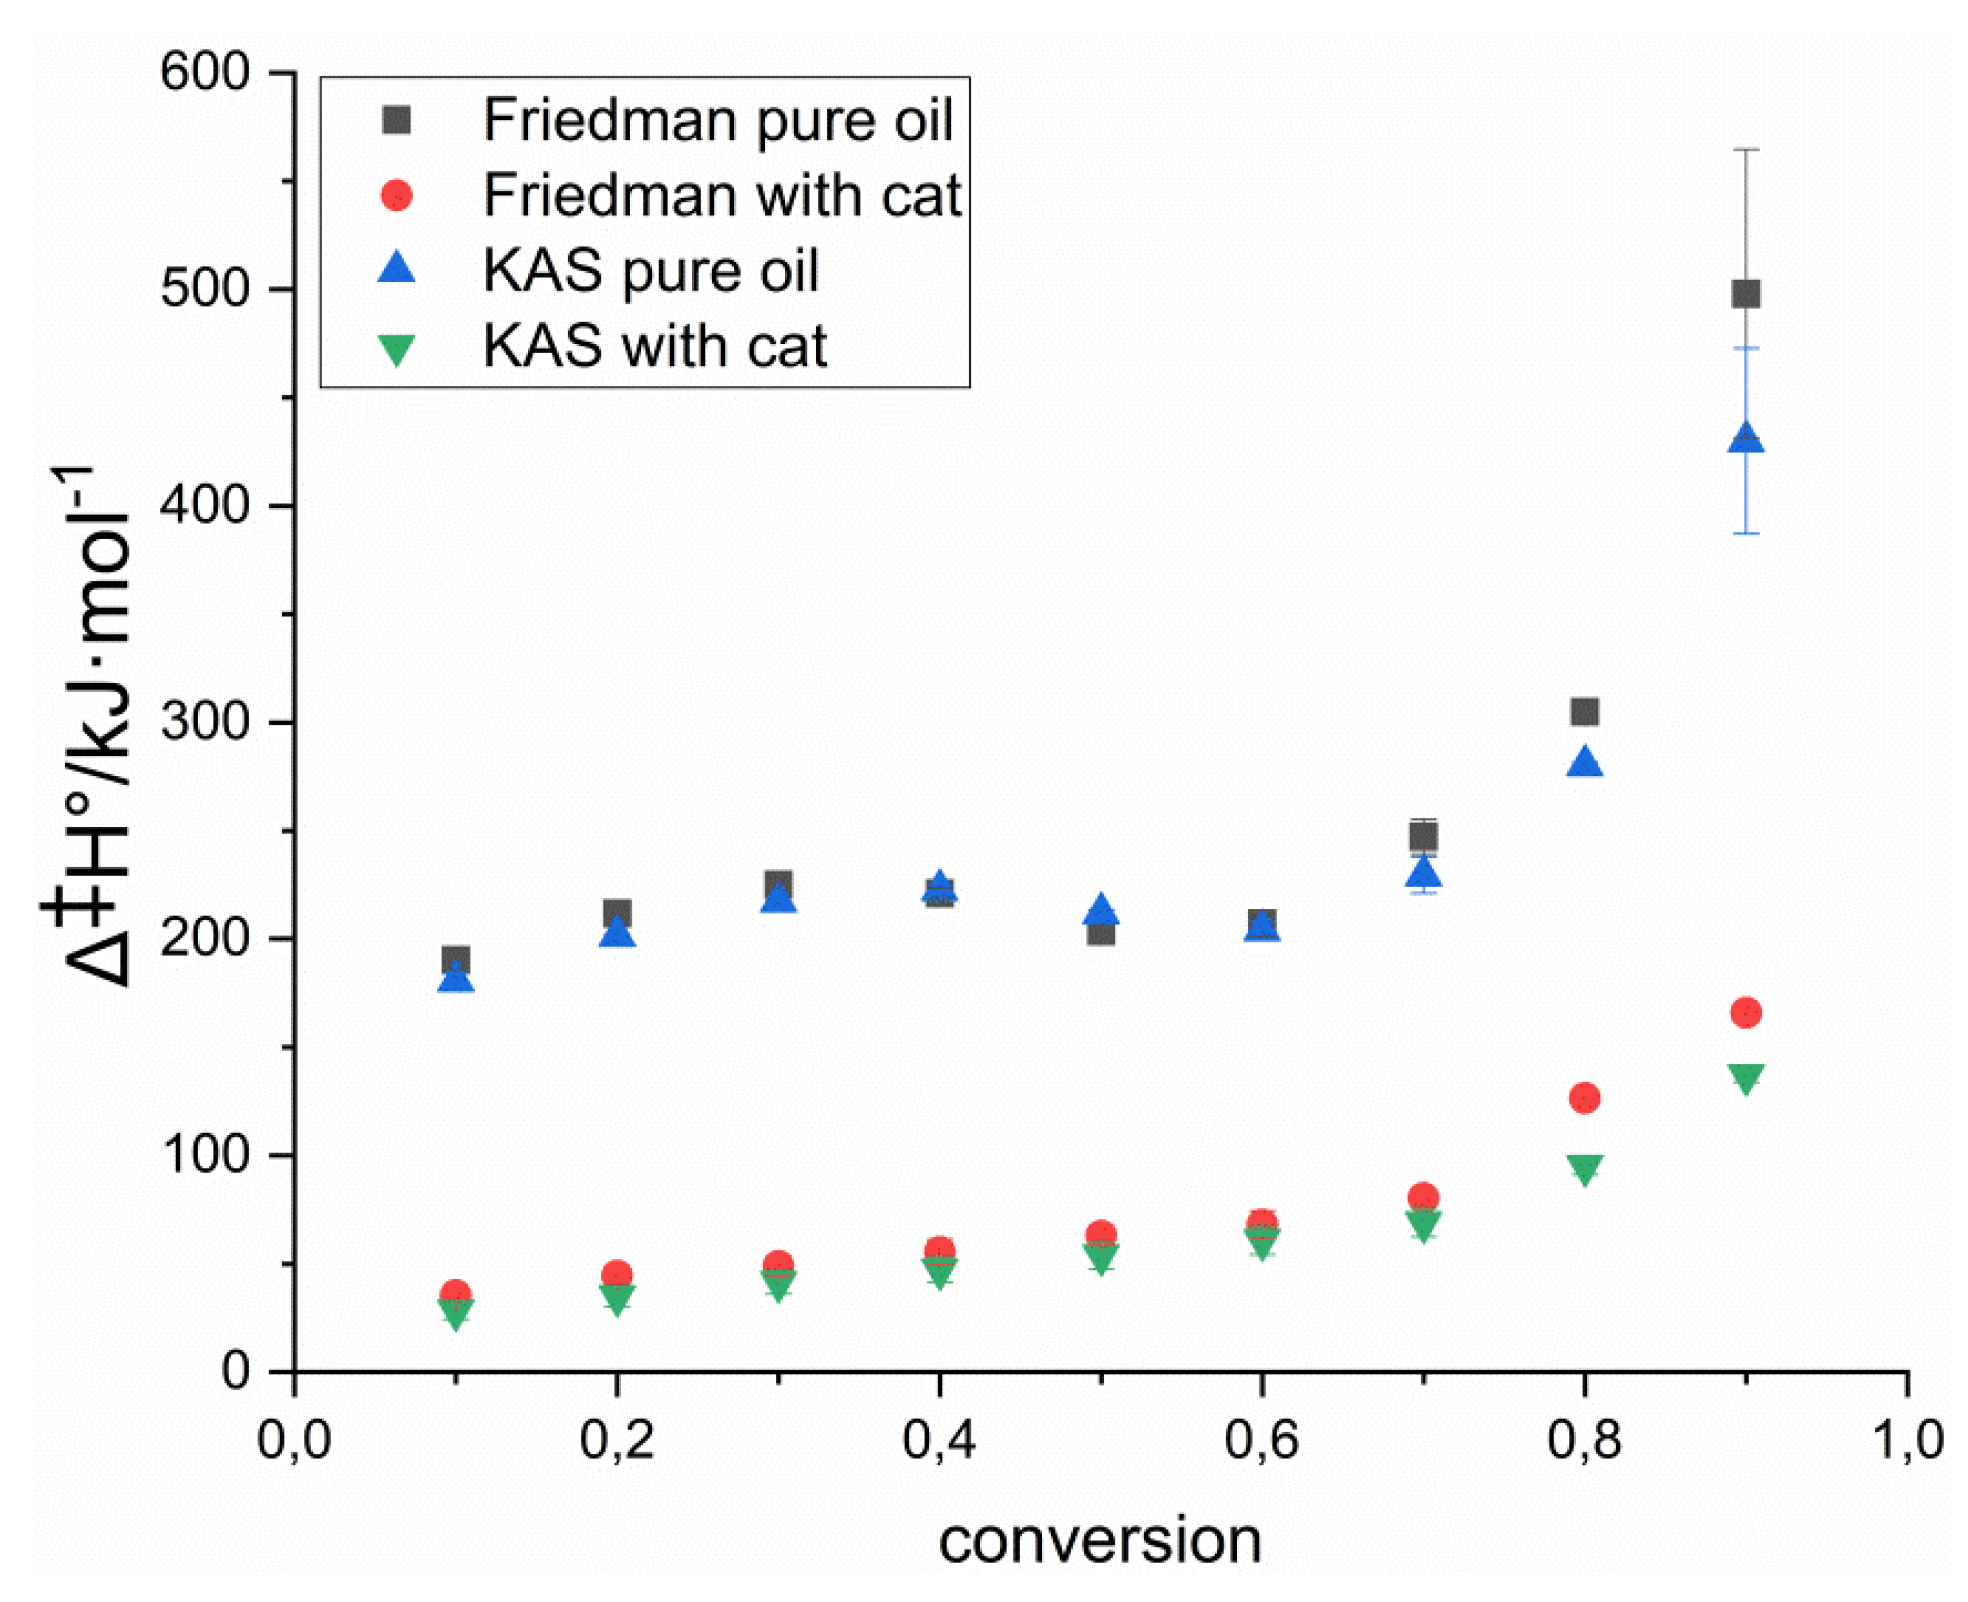
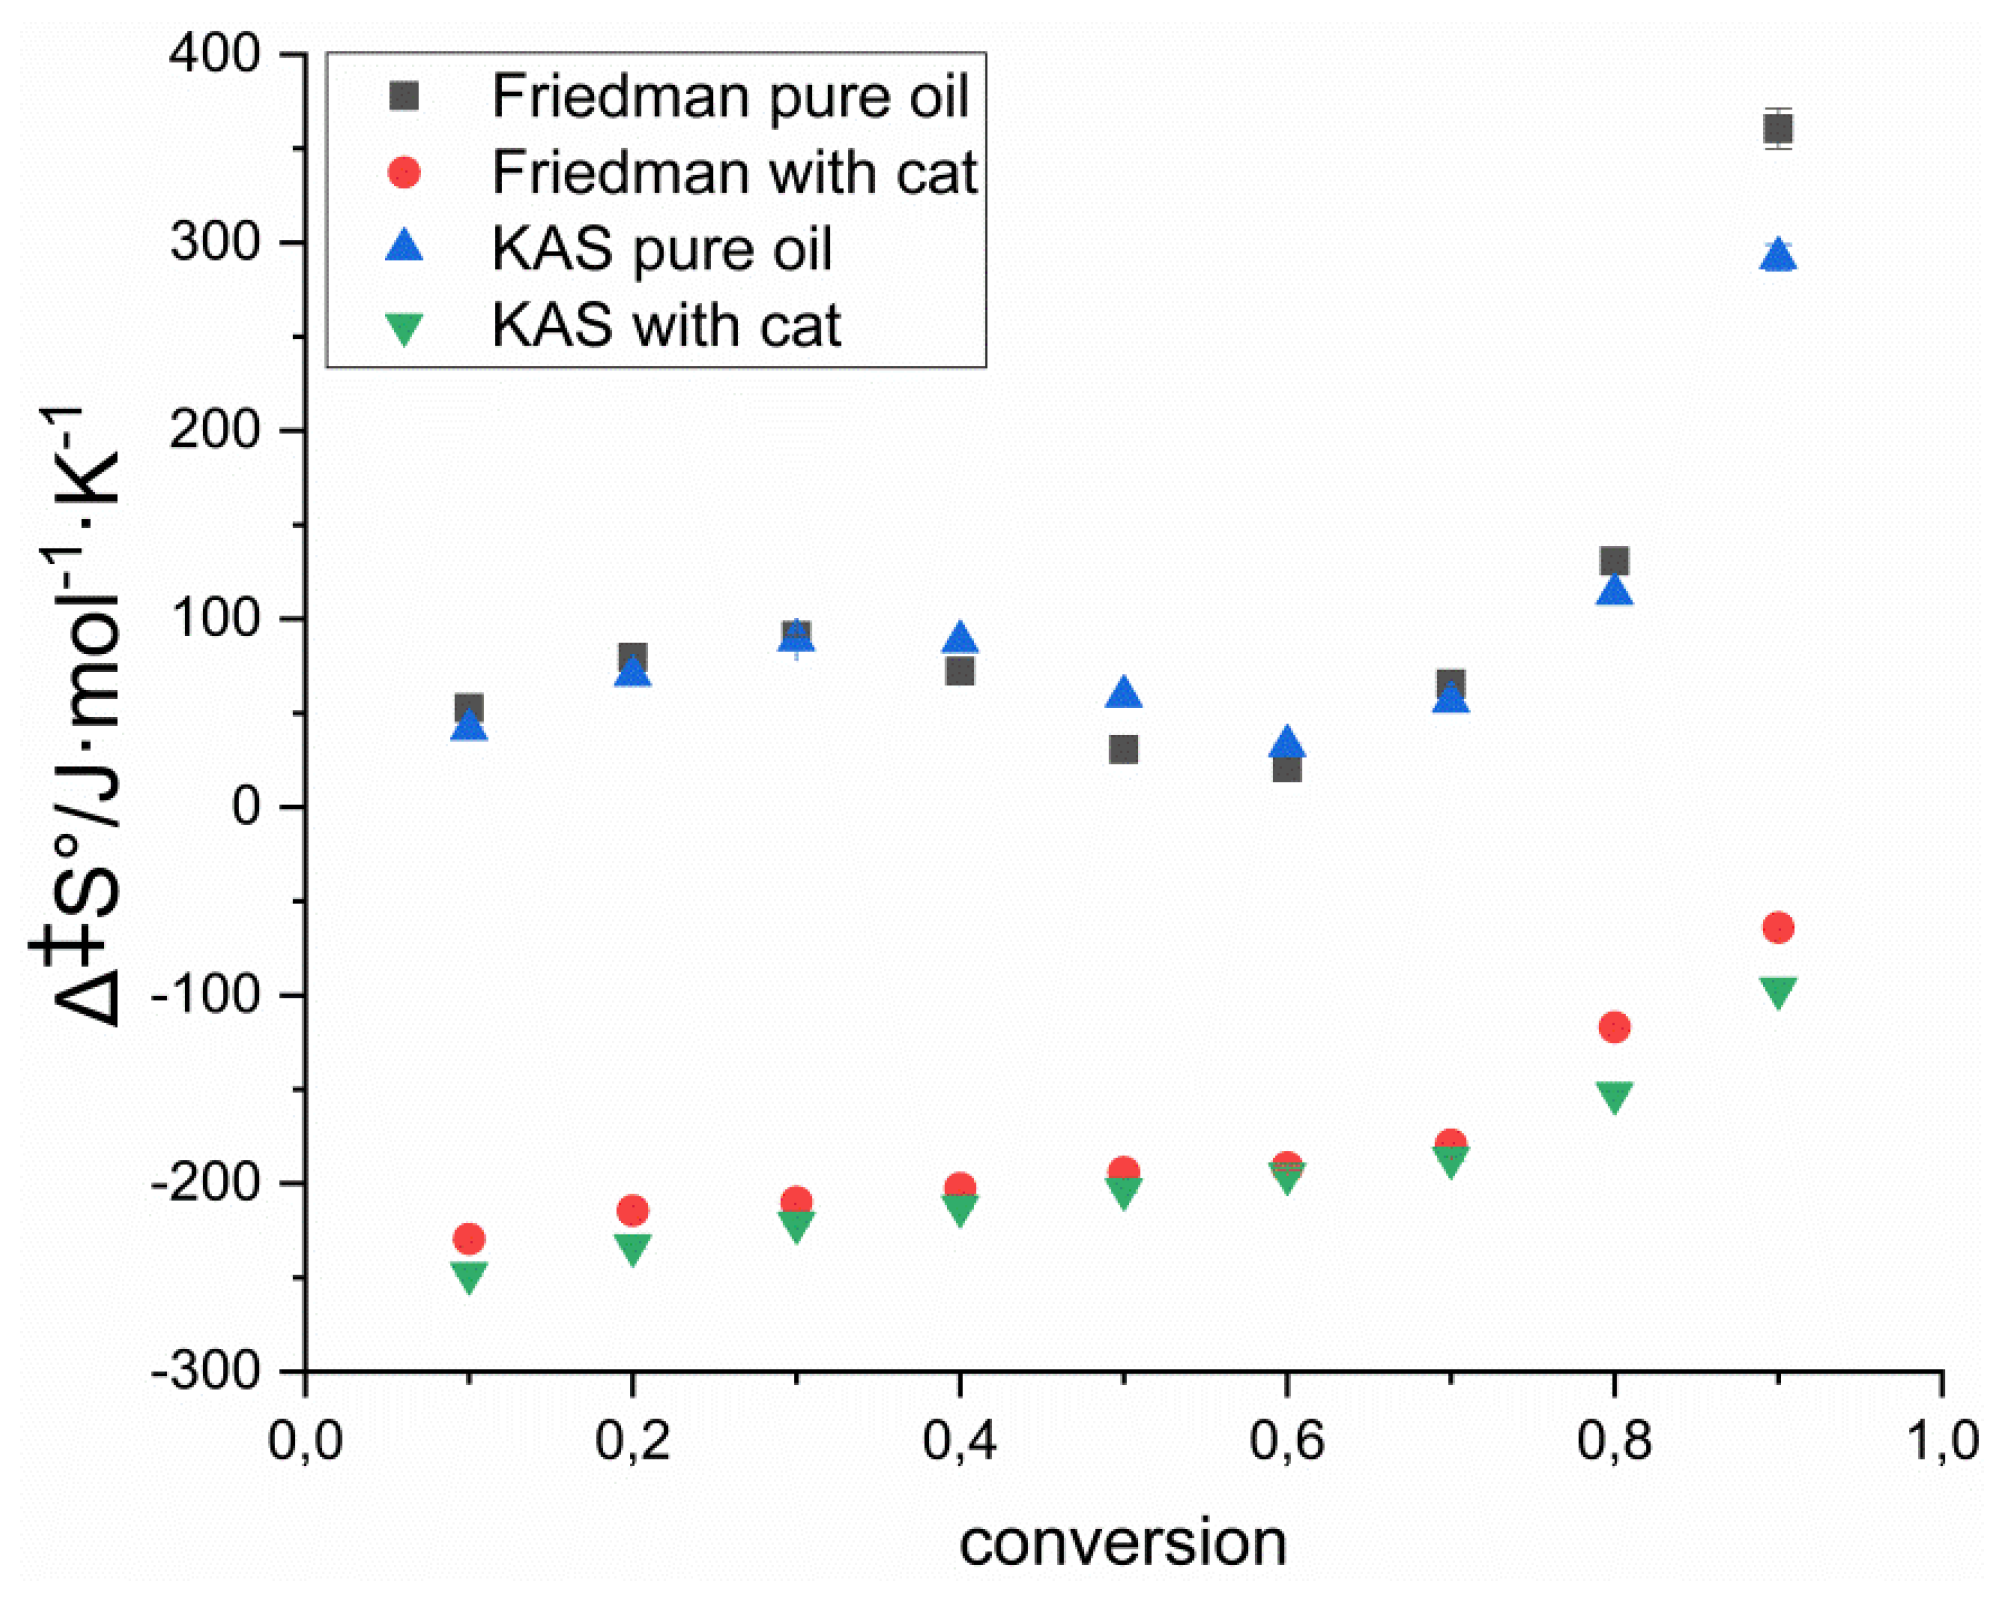
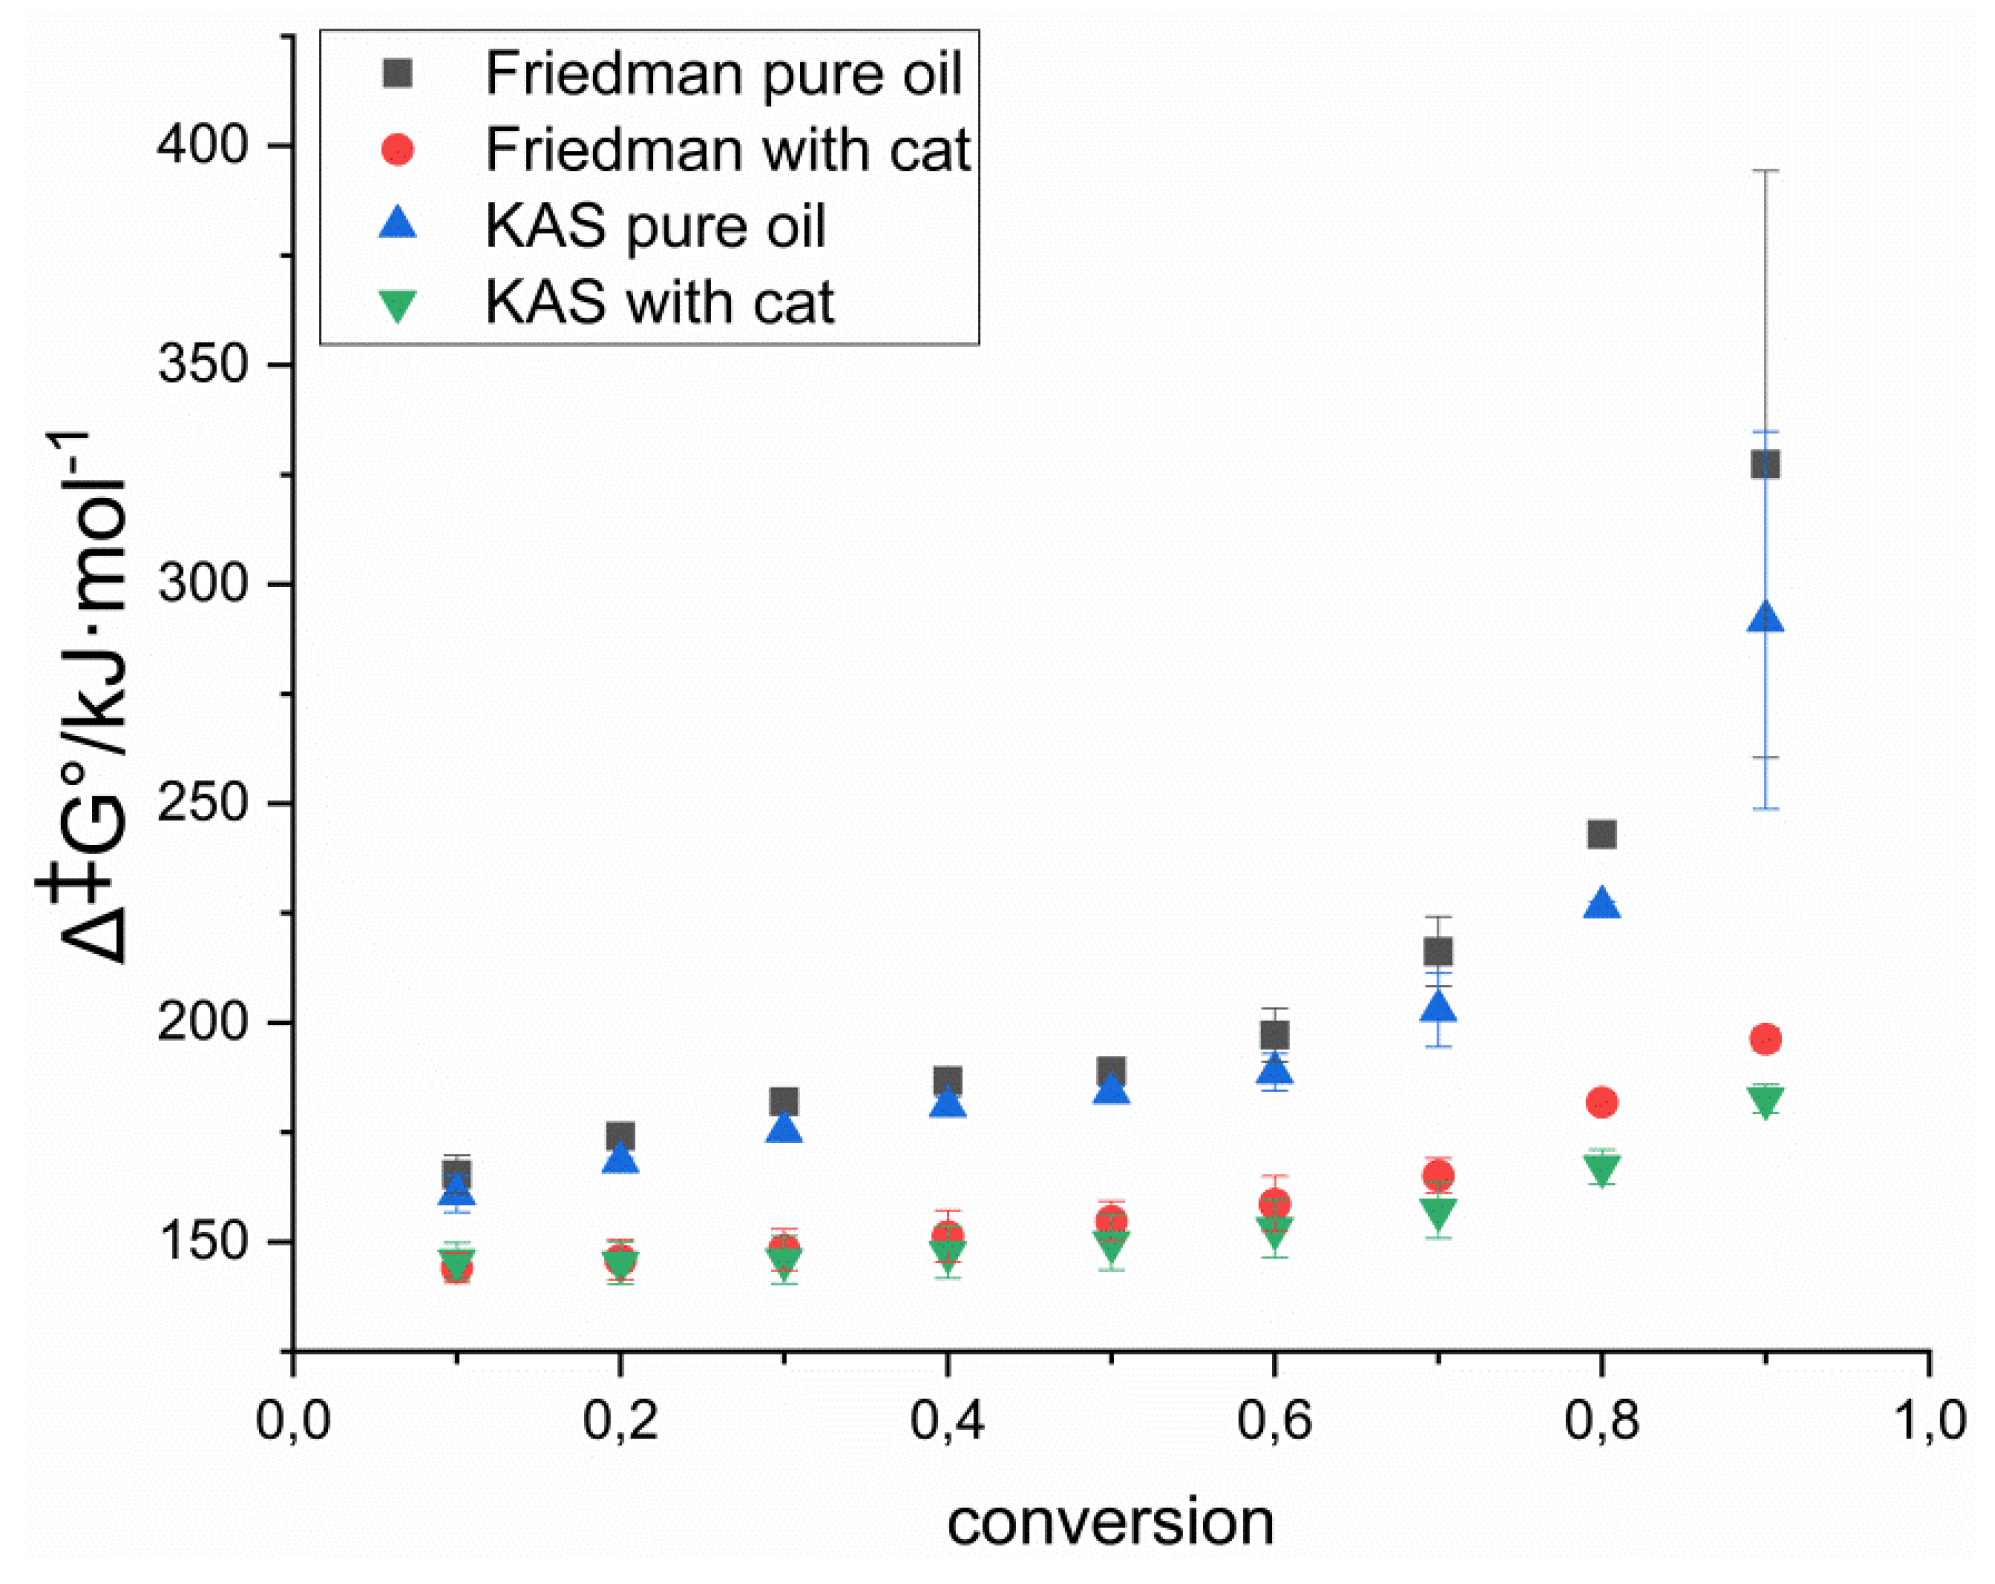
| 10 | 190 ± 4 | 52.6 ± 1.0 | 165 ± 4 | 36 ± 3 | −229.5 ± 0.9 | 144 ± 3 |
| 20 | 211.8 ± 0.5 | 79.61 ± 0.11 | 174.1 ± 0.5 | 45 ± 5 | −214.4 ± 1.2 | 146 ± 5 |
| 30 | 225.0 ± 0.7 | 91.08 ± 0.15 | 182.0 ± 0.7 | 49 ± 5 | −209.8 ± 1.1 | 148 ± 5 |
| 40 | 220.9 ± 2.3 | 72.2 ± 0.5 | 186.8 ± 2.3 | 56 ± 6 | −202.5 ± 1.3 | 151 ± 6 |
| 50 | 203.5 ± 0.7 | 30.8 ± 0.15 | 188.9 ± 0.7 | 63 ± 5 | −194.0 ± 1.0 | 154 ± 5 |
| 60 | 207 ± 6 | 21.0 ± 1.2 | 197 ± 6 | 68 ± 6 | −191.4 ± 1.3 | 159 ± 6 |
| 70 | 247 ± 8 | 65.6 ± 1.4 | 216 ± 8 | 80 ± 4 | −179.2 ± 0.8 | 165 ± 4 |
| 80 | 304.8 ± 1.2 | 130.70 ± 0.20 | 242.9 ± 1.2 | 126.5 ± 1.8 | −116.9 ± 0.3 | 181.8 ± 1.8 |
| 90 | 498 ± 66 | 361 ± 11 | 327 ± 67 | 166.0 ± 2.5 | −64.1 ± 0.4 | 196.3 ± 2.5 |
| KAS method | ||||||
| 10 | 181 ± 4 | 41.6 ± 1.0 | 161 ± 4 | 28 ± 4 | −247.9 ± 1.1 | 146 ± 4 |
| 20 | 201.6 ± 0.8 | 70.35 ± 0.18 | 168.3 ± 0.8 | 35 ± 5 | −232.9 ± 1.2 | 145 ± 5 |
| 30 | 217.35 ± 0.18 | 88.95 ± 0.04 | 175.3 ± 0.3 | 41 ± 5 | −221.0 ± 1.3 | 146 ± 5 |
| 40 | 222.7 ± 2.0 | 88.1 ± 0.4 | 181.1 ± 2.1 | 47 ± 6 | −212.3 ± 1.3 | 148 ± 6 |
| 50 | 212.0 ± 1.4 | 58.95 ± 0.28 | 184.1 ± 1.4 | 54 ± 6 | −203.2 ± 1.3 | 150 ± 6 |
| 60 | 204 ± 4 | 32.8 ± 0.8 | 189 ± 4 | 61 ± 7 | −195.0 ± 1.3 | 153 ± 7 |
| 70 | 230 ± 8 | 56.2 ± 1.5 | 203 ± 8 | 69 ± 6 | −186.6 ± 1.2 | 157 ± 6 |
| 80 | 280.3 ± 1.2 | 113.59 ± 0.20 | 226.5 ± 1.2 | 95 ± 4 | −152.3 ± 0.7 | 167 ± 4 |
| 90 | 430 ± 43 | 292 ± 7 | 292 ± 43 | 137 ± 3 | −96.6 ± 0.5 | 183 ± 3 |
Publisher’s Note: MDPI stays neutral with regard to jurisdictional claims in published maps and institutional affiliations. |
© 2022 by the authors. Licensee MDPI, Basel, Switzerland. This article is an open access article distributed under the terms and conditions of the Creative Commons Attribution (CC BY) license (https://creativecommons.org/licenses/by/4.0/).
Share and Cite
Khelkhal, M.A.; Lapuk, S.E.; Buzyurov, A.V.; Krapivnitskaya, T.O.; Peskov, N.Y.; Denisenko, A.N.; Vakhin, A.V. Thermogravimetric Study on Peat Catalytic Pyrolysis for Potential Hydrocarbon Generation. Processes 2022, 10, 974. https://0-doi-org.brum.beds.ac.uk/10.3390/pr10050974
Khelkhal MA, Lapuk SE, Buzyurov AV, Krapivnitskaya TO, Peskov NY, Denisenko AN, Vakhin AV. Thermogravimetric Study on Peat Catalytic Pyrolysis for Potential Hydrocarbon Generation. Processes. 2022; 10(5):974. https://0-doi-org.brum.beds.ac.uk/10.3390/pr10050974
Chicago/Turabian StyleKhelkhal, Mohammed A., Semen E. Lapuk, Aleksey V. Buzyurov, Tatiana O. Krapivnitskaya, Nikolay Yu. Peskov, Andrey N. Denisenko, and Alexey V. Vakhin. 2022. "Thermogravimetric Study on Peat Catalytic Pyrolysis for Potential Hydrocarbon Generation" Processes 10, no. 5: 974. https://0-doi-org.brum.beds.ac.uk/10.3390/pr10050974