
Tech-Economic Assessment of Power Transmission Options for Large-Scale Offshore Wind Farms in China


College of Electrical Engineering and Information Technology, Sichuan University, Chengdu 610000, China
*
Author to whom correspondence should be addressed.
Processes 2022, 10(5), 979; https://0-doi-org.brum.beds.ac.uk/10.3390/pr10050979
Submission received: 11 April 2022
/
Revised: 10 May 2022
/
Accepted: 11 May 2022
/
Published: 13 May 2022
(This article belongs to the Topic Marine Renewable Energy)
Abstract
:China is taking initiative in energy transition to cope with the long-term controversy of its enormous energy consumption, aiming to use less carbon. Wind power, especially offshore wind energy, has become a prevailing alternative due to its low carbon emissions, renewability, competitiveness, and operation security. The layout of a transmission channel is a key consideration in marine project implementation. This paper investigates the technical characteristics, application status, and viable advantages of a conventional AC transmission, voltage source converter-based high-voltage direct current (VSC-HVDC) transmission, gas-insulated line (GIL) transmission, and hybrid HVDC transmission. A component-resolved evaluation model was proposed to estimate the costs to be incurred of four electrical transmission options for offshore wind power along the coast of Eastern China, with technical feasibility and economical considerations. Cost comparisons and component sensitivity analyses were developed with different transmission distances and capacities. Results suggest HVAC transmission and VSC-HVDC are the preferable solutions for present offshore wind farm development in Eastern China, and the economic potential of the hybrid HVDC makes it feasible for future deployment. Some conclusions can be applied in disparate regions across the globe.
1. Introduction
Deployment of variable renewable energy resources are technical solutions driving global climate change. In order to sharply decrease the carbon emission and accelerate the global energy transition [1], wind power has experienced a rapid development in the last 20 years, which has become the mainstream renewable energy around the world now [2]. In 2019, China maintains the first place in terms of cumulative installed capacity of wind power and is vigorously promoting wind power on a priority basis [3]. Compared with onshore wind power, offshore wind farms have much less negative impacts on humankind as no land resource is needed, which also makes them usually have a larger scale and the offshore turbines have a larger capacity, which means a fall in the capital costs [4].
Because of the above advantages, plenty of studies have been conducted in the cost assessment area of the offshore wind farms (OWFs), which concentrates on the cost evaluation methodologies, potential economical technologies, and cost reduction. The infrastructure costs of OWFs are strongly related to the spatial condition [5,6]. Myhr et al. presented a cost sensitivity analysis and pointed out that the results suffer significant spatial bias and may differ in various countries [7], such as spatially-explicit assessment for the United Kingdom (UK) [8,9], Australia [10], Thailand [11], India [12], and Nigeria [13]. Thus, a Geographic Information System (GIS) makes costs and energy potential estimations possible based on spatially clustered data [14,15]. To obtain the cost reduction potential, the GIS-based levelized production cost (LPC) methodology is a common analysis model [16,17,18]. Furthermore, some assessments take the impacts of marine ecosystem and weather or climate variance into consideration [19,20].
The costs of the OWFs are more expensive than the onshore farms due to its complex foundation, installation, and submarine cabling; with the construction of the marine economy, the transmission vehicle becomes an important part [21]. Furthermore, the costs of different transmission methods are distance- and capacity-dependent functions [22], because the required diameter and number of cables are capacity-resolved, especially for projects with GWs capacity, and there exists a “breakeven” distance [23]. Two prevailing approaches are conventional: alternating current (AC) transmission, which is effective for near shore farms [24], and extensive voltage source converter-based high-voltage direct current (VSC-HVDC) transmission, which is the preferred solution for long-distance transmission. The HVDC transmission technology has many advantages, such as a fast power control speed [25] and oscillation damping control [26], and can be used in ultra-high-voltage occasions [27,28,29]. However, the HVDC implementation also has disadvantages. The first disadvantage compared to AC transmission is the cost, as the VSC is based on so many IGBT components that finally lead a relatively high investment. The second disadvantage is the stability problem, where the VSC often suffers from oscillation risk, especially when the power fluctuates. The third disadvantage is that the IGBT is very sensitive to the fault current, and it requires a fast protection scheme. However, the advantage of VSC makes it still be suitable for offshore wind farm integration. Offshore wind power is often located in the far sea area and the transmission cable also decreases the fault possibilities. The same as with HVDC transmission, a gas-insulated transmission Line (GIL) provides another way due to its advantage of considerably larger capacity, but its exaggerated expense makes it less competitive. Consequently, VSC-HVDC becomes more eye-catching for investors with predominant capability and desirable loss, which is suitable for crossing long-distance water transmission, such as in the North Sea of Germany [30]; but, the terminal converter stations are more expensive. However, the choice of electrical transmission ultimately depends on both technological potential and economic potential [31]. For future technical development of OWFs, there is another competitive option—hybrid VSC/LCC-HVDC technology—which is a novel form of HVDC transmission not widely applied, but it greatly decreases the costs and is planned for use China, possessing huge technological potential.
In China, there are many large-scale blocks with a capacity of more than hundreds of MW planned for OWFs [32]. The existing research has mostly focused on a single offshore wind farm project [33], lacking the overall research on regional offshore transmission systems [34]. There is a need to explore the optimal technical transmission method of the regional offshore transmission network for wind farms, which is conducive to wind energy utilization. This paper conducted regional cost analysis and economic feasibility comparisons of four electricity transmission options for offshore wind power in Guangdong Province using component-resolved evaluation models. Economic costs and sensitivity have been derived using the Discounted Cashflow Model (DCF). This contributes to determining the reasonable scope of technical and economic application of various transmission modes, giving perceptible information for stakeholders for offshore wind transmission infrastructure under indigenous development, economic perspective of relevant technologies, and possible potential to future deployment and implementation of marine projects.
To make clear the characteristics of the different wind power transmission technologies, this paper compares various offshore wind farms with the HVAC, HVDC, GIL, and hybrid HVDC output channels. The novelties of the paper are as follow.
- (1)
- The evaluation models for different wind power integration technologies are investigated, and the techno-economic costs can be calculated according to the proposed method for different technologies.
- (2)
- The economic characteristics of each technology are clarified based on the proposed analysis model, and the compositions of these various transmission solutions are studied and compared.
- (3)
- The influence factors for the investment of different technologies are also investigated, and the suitable application situations are proposed for different wind power output solutions.
This paper is structured as follows: The study area and technical potentials of the four transmission methods are introduced in Section 2. Section 3 proposes specific evaluation models of the various transmission solutions. Then, the techno-economic costs and sensitivity to transmission distance and capacity analysis results are investigated using the DCF approach in Section 4. The conclusions and areas of further work are discussed in Section 5.
2. Study Area and Methodology
2.1. Study Area
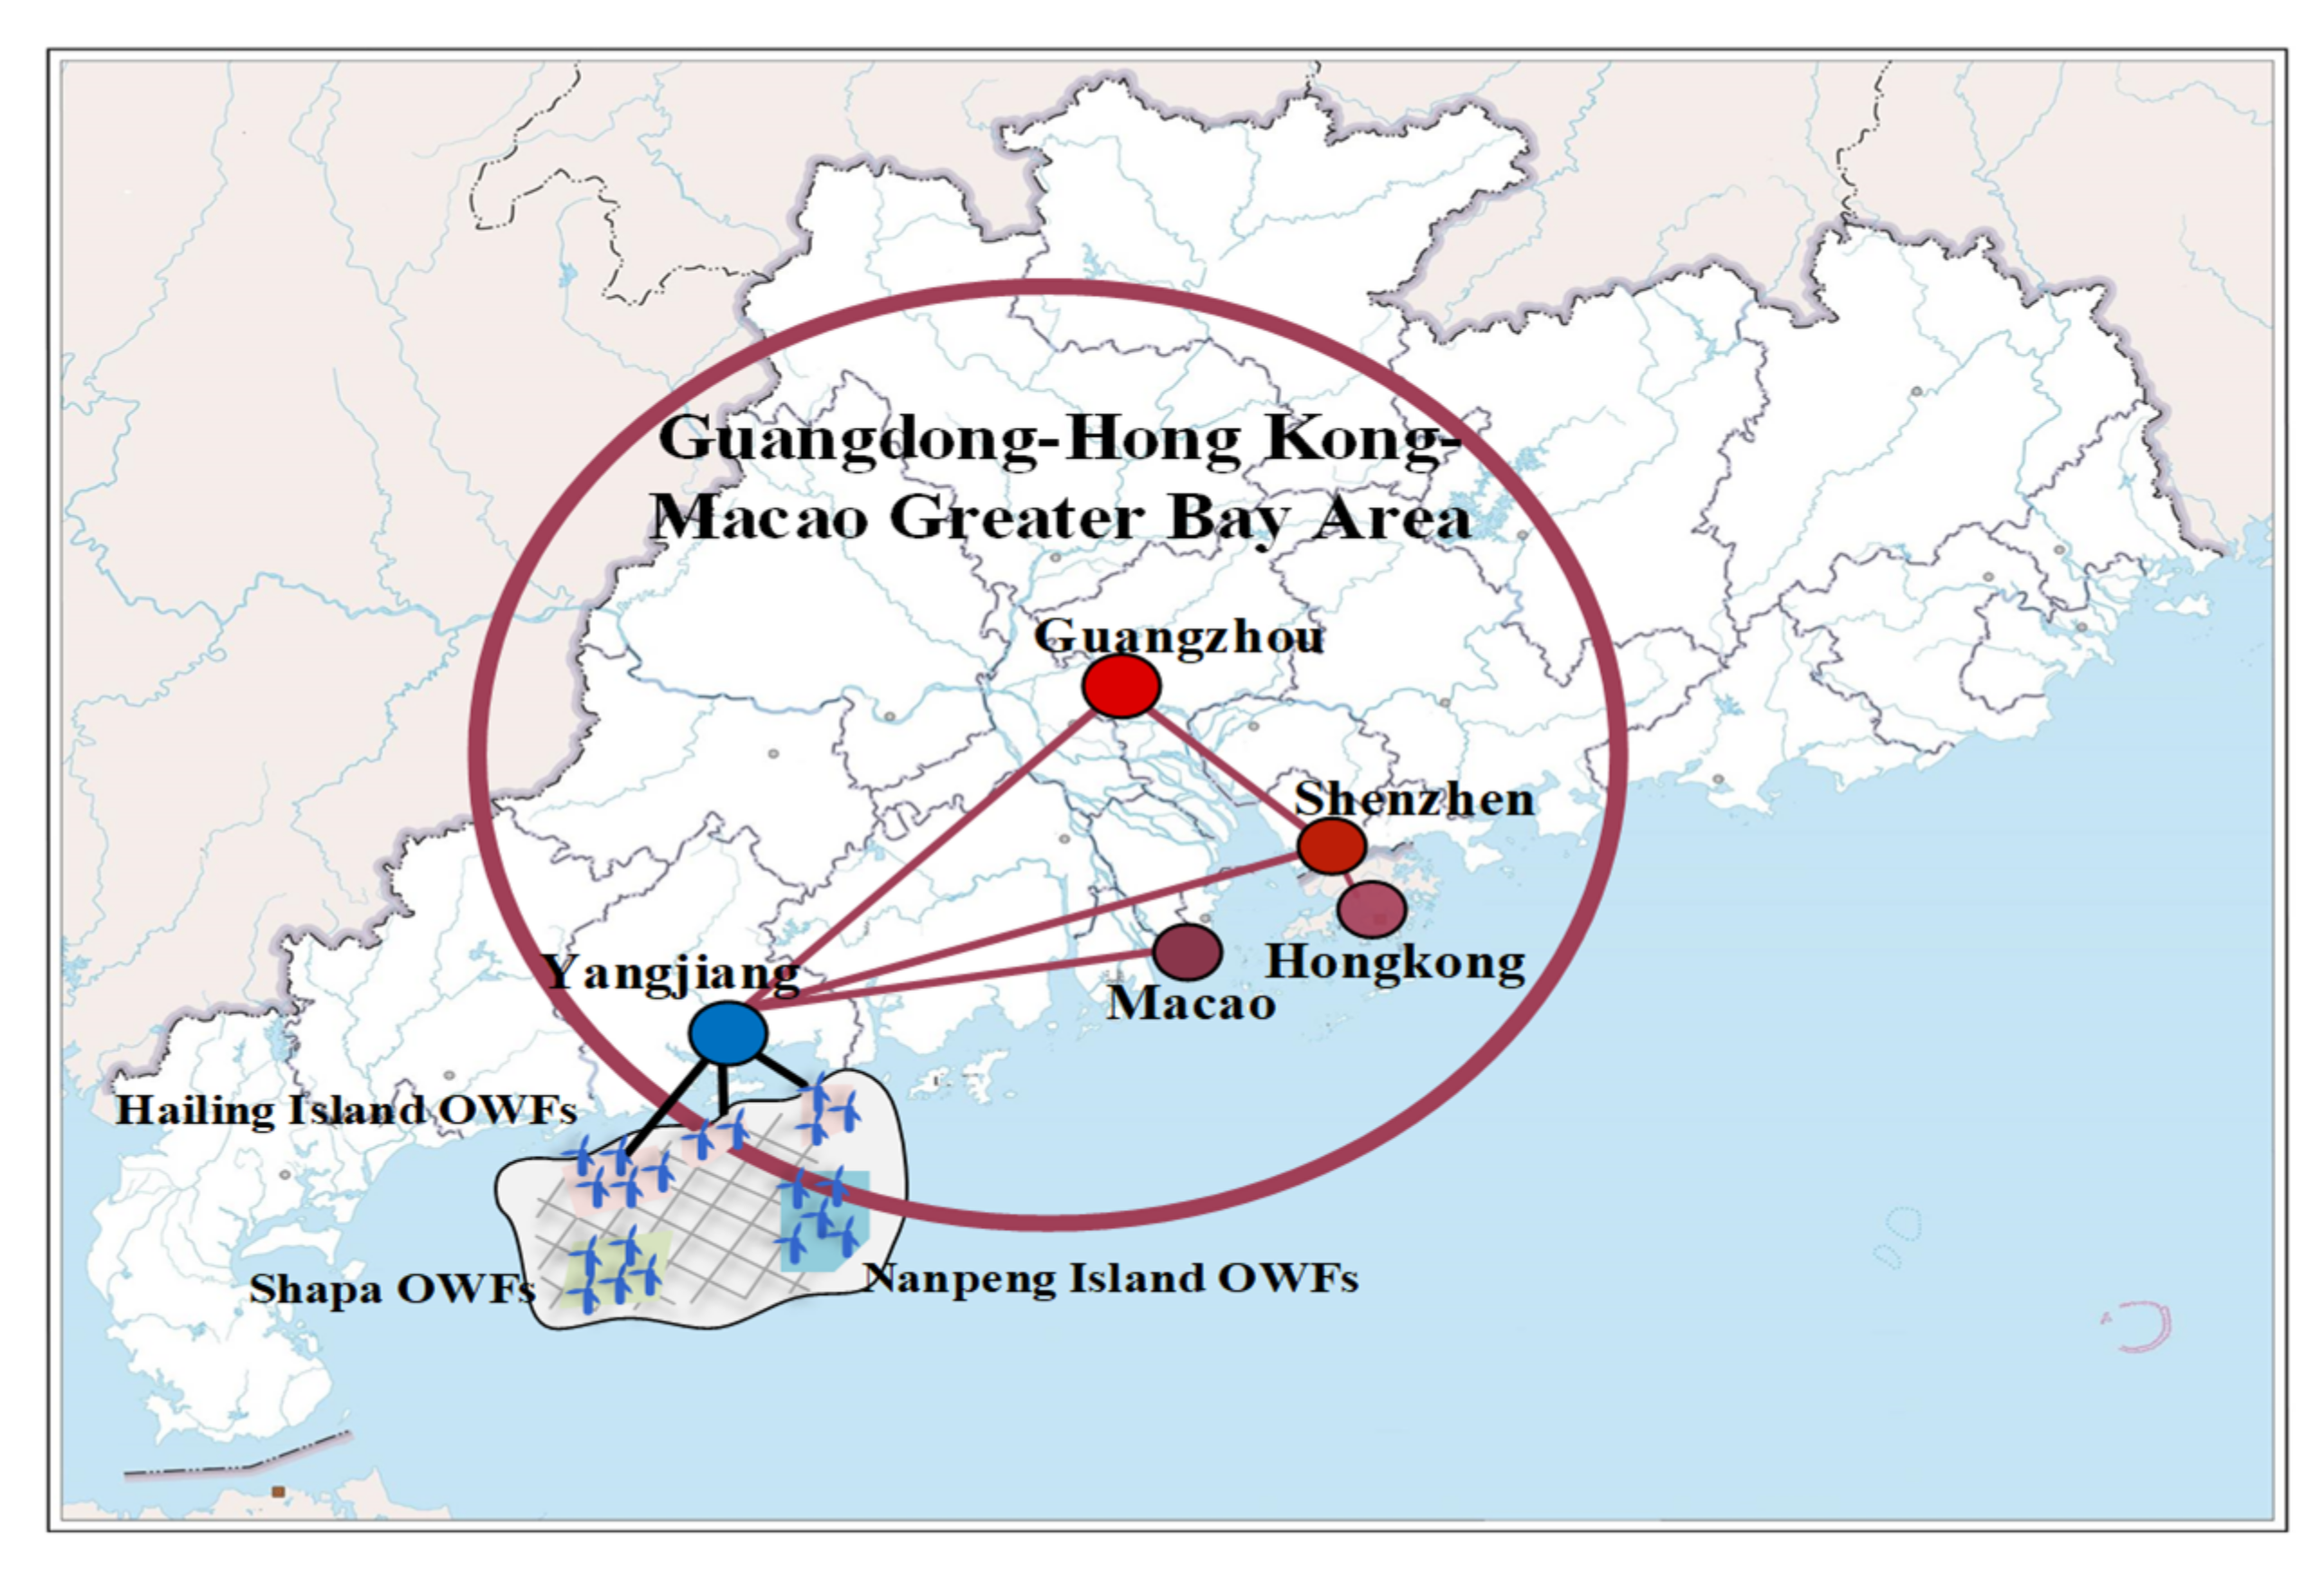
Guangdong is located on the eastern coast of China, which is rich in offshore wind energy; it is also the core area of economic development in southern China. To reach the new goal of deployment of the Guangdong–Hong Kong—Macao Greater Bay area (GBA). It has made great efforts to develop offshore wind power, which is effective to adjust coastal resources in line with a prosperous economy. By 2030, more than 1000 km of transmission lines will be built for grid connections for offshore wind power. For this trend of future planning of OWFs in Guangdong, policymakers are concerned with the cost assessments of efficient electrical transmission options to transport large quantities of offshore energy across great distances.
Offshore wind resources of Guangdong Province are in western and eastern Guangdong. Based on the Notice of Guangdong Development and Reform Commission on Guangdong offshore wind power development plan (2017–2030), 15 offshore wind farm sites are located in the offshore shallow water area, and 8 sites are in the offshore deep-water area. Yangjiang city is the closest with a stable wind power supply base in the west to the GBA. There are three regions for offshore wind farms in the plan: Nanpeng Island OWFs, Hailing Island OWFs, and Shapa OWFs. The total planned installed capacity of the renewable energy is about 36 GW, as indicated in Figure 1.
2.2. Technical Evaluation of the Transmission Solutions
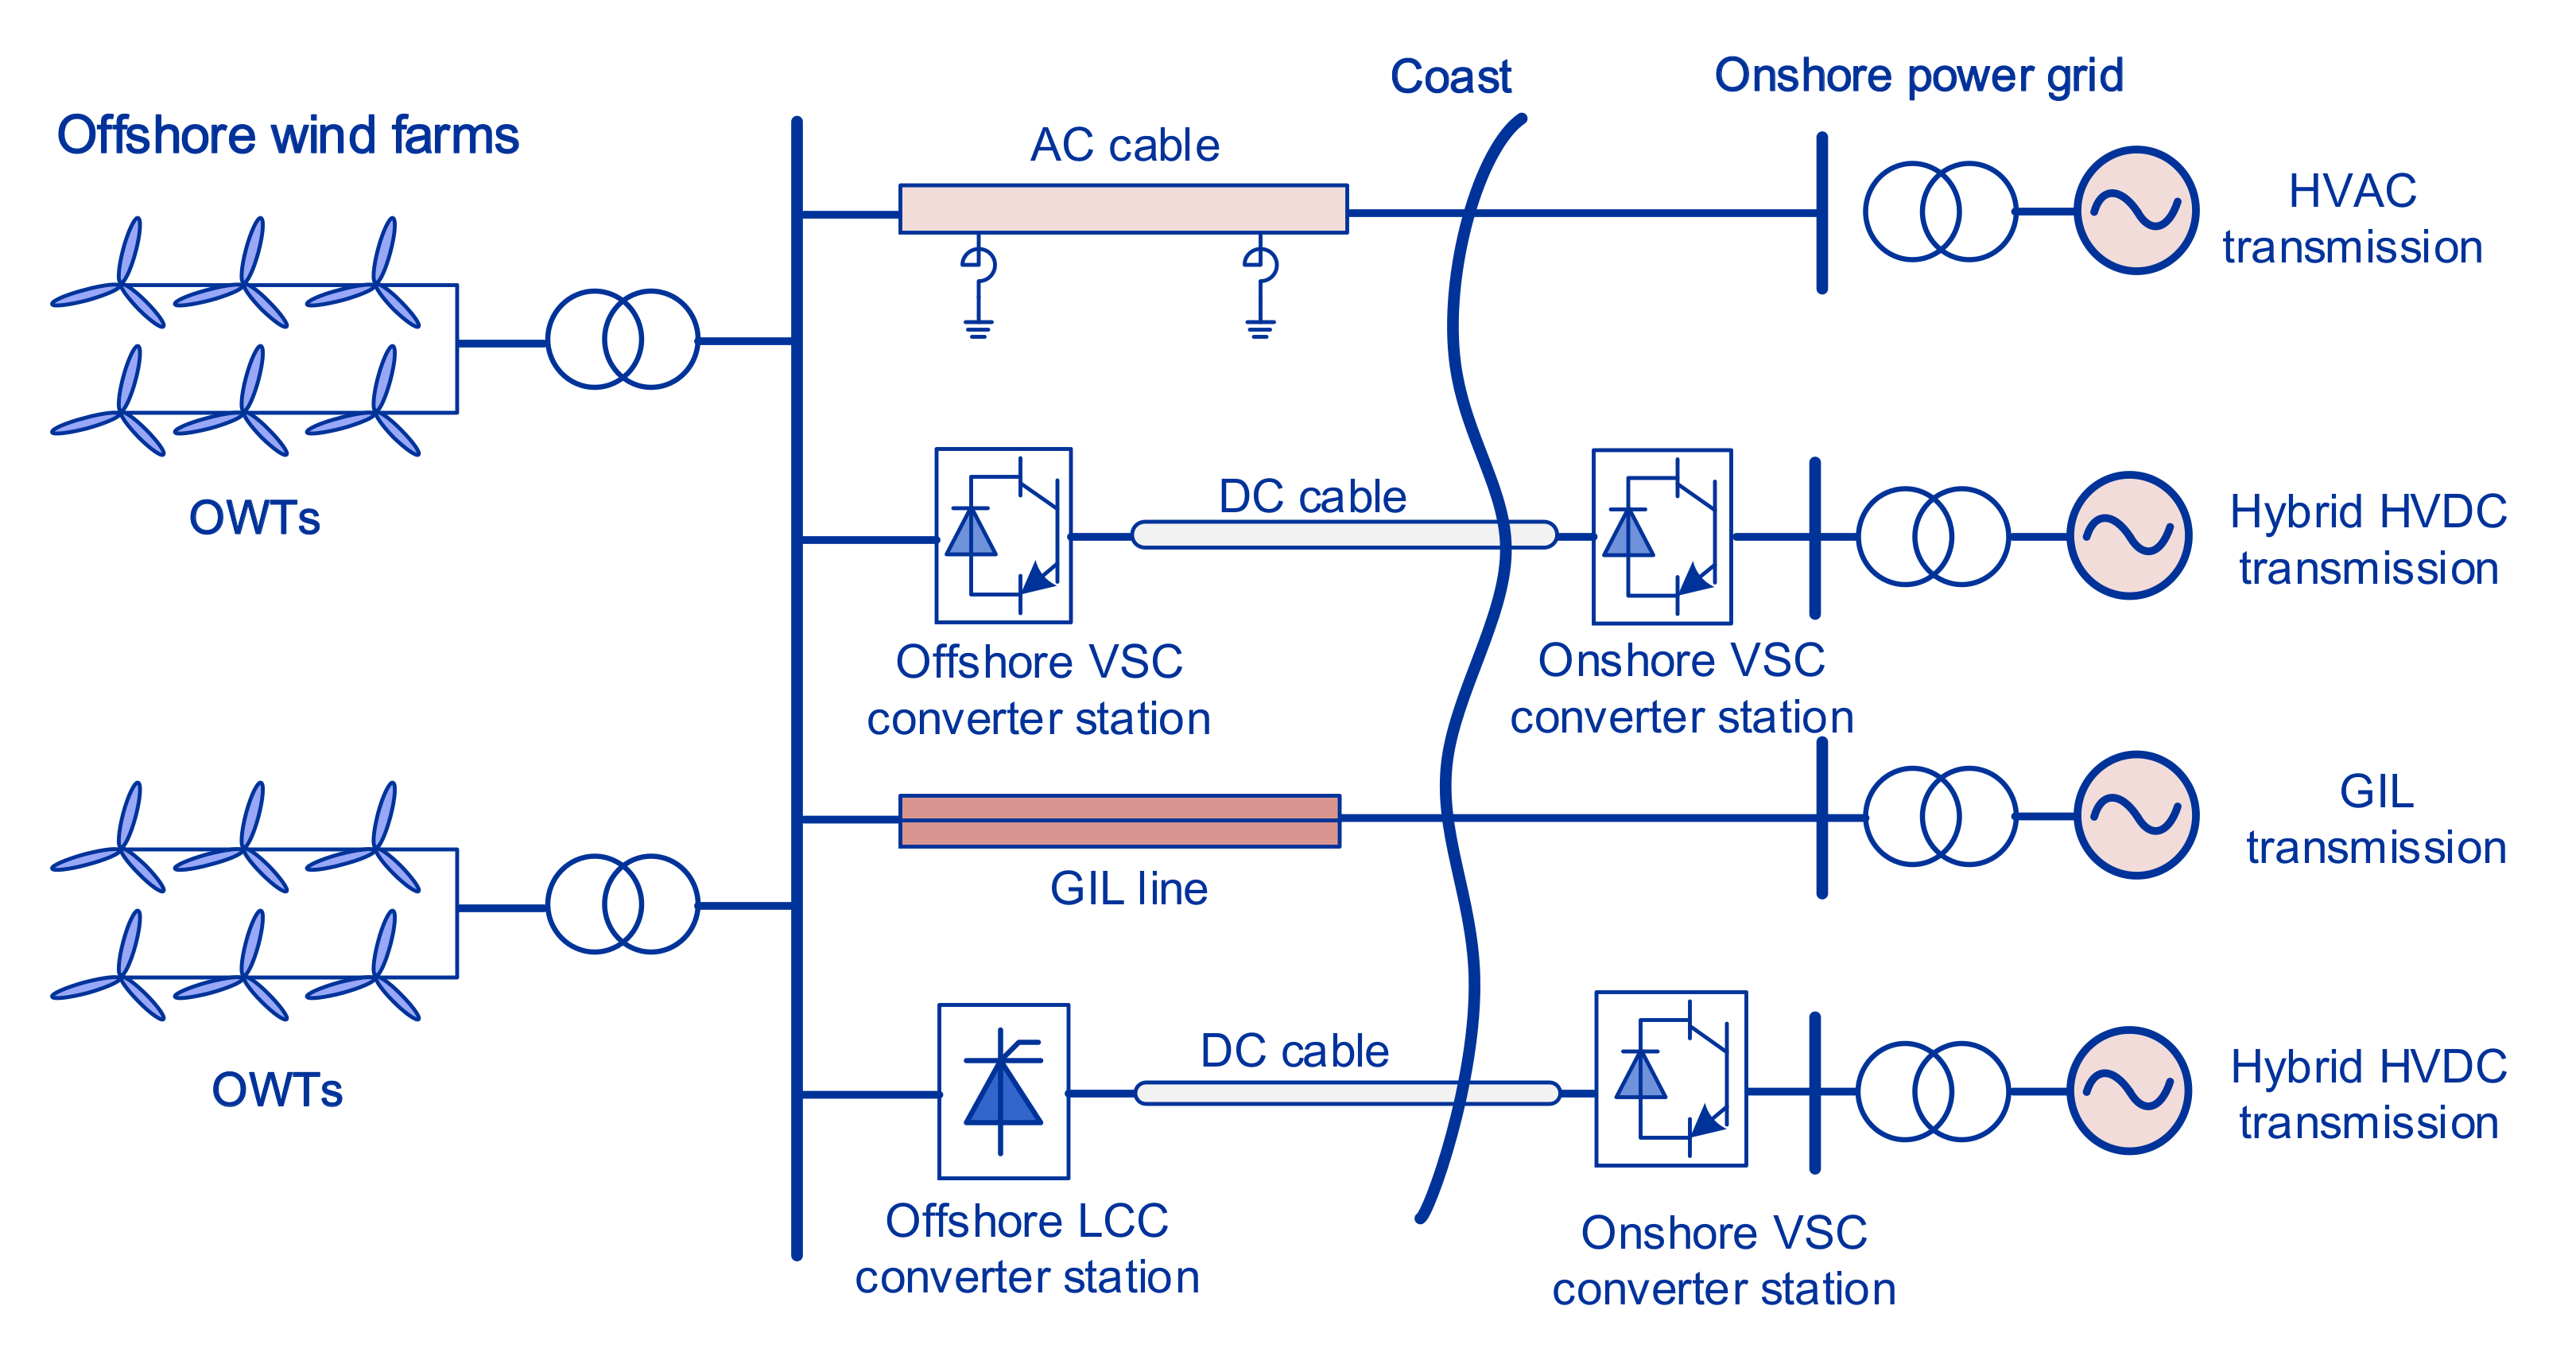
Four transmission solutions are studied in this paper, as shown in Figure 2. The offshore wind power from each farm is collected and transmitted to the offshore step-up transformer station. Then the voltage will be raised and the electrical power will be delivered to the onshore step-up transformer station via a submarine high-voltage transmission line (AC/DC cable or GIL line) and delivered to the onshore booster station.
As mentioned above, AC transmission is widely used in near sea OWFs, compared with others. The distributed capacitance of the AC cable will become larger and larger, and the ampacity will decrease with the increase in length. This significantly reduces the transmission ability; also, multi lines are needed to transfer the large amount of wind power, which means more investment cots in the AC cable. In addition, due to the close electrical connection between the wind farm and the onshore power grid, the fault of either side will quickly spread to the other side; this will cause voltage oscillation and power instability, which reduces the power quality. It is necessary to install dynamic reactive power compensation devices to improve the stability and available transfer capability. A DC cable is cheaper and able to transfer more capacity with lower loss, which is popular in OWF transmission, but an offshore converter station needs to be assembled and a large DC platform should be built for it, which makes the economic investment of VSC-HVDC higher in the early infrastructure. However, it is convenient to build and expand by stages, and the asynchronous connection to onshore grid can suppress the synchronous transmission of faults.
With regard to GIL lines, as derived from GIS, GIL only needs to have basic electrical performance, such as insulation and dynamic thermal stability, and there is no switchgear; it thus has obvious reliability advantages over either AC/DC cable or overhead lines in long-distance and large-capacity power transmission. However, the high costs and high technical requirements of the construction design and the long project period are difficult problems for the actual project. In China, a new hybrid DC transmission mode combines the superior performance of LCC-HVDC and VSC-HVDC technologies and has a lower cost than current VSC-HVDC transmission. Yet, the available transmission power is determined by the VSC-HVDC side, and it is hard to realize power flow reversal due to the voltage polarity that needs to be changed in the LCC converter station. Still, it is a new trend of innovation and becomes an alternative for offshore wind power transmission though it has not been applied due to a lack of research, except in China. In summary, the technical potential of the four methods is in Table 1.
3. Methodology
The costs evaluation can be broken down into multiple components, such as site-dependent variables, fixed water depth, the distance to grid connection point, and fixed costs [35]. Total investment cost equals the summation of the capital cost components, calculated as suggested by Dicorato et al. [35] and Hong and Möller [14,33].
The methodology establishes an empirical component-resolved evaluation model from an industry standard or outline to evaluate four electrical transmission concepts. The economic costs under each concept are intricate, so the main resolved components, including capital costs, OPEX, and loss costs, are considered and calculated in this paper.
3.1. Costs Calculation of HVAC Cables Transmission
The HVAC cable transmission concept is a popular way for offshore wind farms, and the principal cost drivers include capital costs Ccap.AC, operation and maintenance costs Copex.AC, and loss costs Closs.AC. The calculation is given by
3.1.1. Capital Costs
In the concept of HVAC cable transmission, Ccap.AC covers the relative substation foundation costs Cstation.AC, underwater cable foundation and installation costs Ccable.AC, and reactive power compensation foundation costs Creacpc.AC, estimated by
- 1.
- Substation foundation cost
Substation foundation cost in the HVAC transmission system is the total costs of each transformer substation capital expenditure, which is dependent on the infrastructure investment of the substation, expense of the transformer and the investment cost of auxiliary electrical equipment, including the reactive compensation capacitor and switchgear. Then the calculation of Cstation is based on cost CperMVA and determined by the capacity of substation S.
- 2.
- Cable foundation and installation cost
The underwater cable for offshore wind energy is utilized for the link between the transformer substation and offshore substation; hence, Ccable.AC is estimated as a proportion of distance to station L.
where P1 and P2 are the expense and installation cost of one unit (length, km) of cable, respectively.
- 3.
- Reactive power compensation foundation cost
In the HVAC transmission system, the distributed capacitance of the cable is generally much larger than the overhead line, so a large capacitance current will be generated in the AC line, which significantly reduces the available transfer capability. Therefore, reactive power compensation devices should be installed on sides of the cable according to the actual operation. Thus, compared with the VSC-HVDC transmission method, the foundation cost of the reactive power compensation should be considered additionally, which mainly includes the cost of the shunt reactors. To calculate it, the reactive power Qreac (MVAR) of the line capacitance is calculated.
where f is the operational frequency of system, c is the capacitance value per km of the cable, and Ucable is the voltage of AC cable.
The capacity of reactors Creacpc.AC can be determined by
where P3 is the expense of the reactors.
3.1.2. Operation and Maintenance Costs
Copex.AC is usually estimated in the form of percentage A of the annual maintenance cost to total investment cost (excluding land occupation cost and offshore platform costs) or percentage A1 of lifetime maintenance costs to total investment cost. The relation between A and A1 is
where i is the annual interest rate; n is the lifetime; Van Eeckhout gives the specific data of A equals to 1.2%, n is 20 years, i is 5% [36]. Then, Copex.AC is estimated:
3.1.3. Costs of Loss
The loss costs Closs.AC comprise of substation loss Csub.loss and transmission line loss Cline.loss. Csub.loss is dependent on the substation loss rate Psub.loss, as referred to in the literature [36]. The Psub.loss of two substations is 0.8%, that means the loss rate of each substation is 0.4%. Cline.loss includes conductor losses Ccon.loss and losses of sheath and armor Cshar.loss. Ccon.loss can be formulated by the current Icable of the copper conductor, which can be approximately calculated by
where P is the active power; the power factor cosφ is 0.95.
Therefore, with the resistance of conductor Rcu, Ccon.loss is given by
The losses of sheath and armor Cshar.loss is estimated.
where ΔUc, ΔUs, ΔUA, Ic, Is, IA are the voltage and current of the copper core, sheath, and armor, respectively; Z1–Z9 are the matrix of parameters of the cable.
Moreover, since both ends of the sheath are grounded, the armor layer is linked with the sea, with the assumption of Us = UA = 0 and Ic = Icable; so, Cshar.loss can be given by the power loss Par = 3IA2 × R, Psh = 3IS2 × R, and IS and IA are
The costs of Carsh is dependent on the operation time of full generation per year Tf and the on-grid price of electricity Pon-grid, which are
The evaluation of Closs.ac is obtained by total Csh and Car.
3.2. Costs Calculation of VSC-HVDC Transmission
As for the VSC-HVDC transmission concept, the total costs of CVSC compose of capital costs Ccap.VSC, operation and maintenance costs Copex.VSC, and loss costs Closs.VSC.
3.2.1. Capital Costs
Ccap.VSC consists of the converter station foundation cost Cstation.VSC, and the cable foundation and installation costs Ccable.VSC.
- 1.
- Converter station foundation cost
Cstation.VSC is the total infrastructure investment of each converter station. Furthermore, the additional costs of IGBT, converter controller and reactor, DC capacitor and AC filter, as well as the cost of civil construction of the offshore platform for converter station layout are estimated. Then Cstation.VSC is computed as a proportion of the capacity of per converter station P.
- 2.
- Cable foundation and installation cost
Similar to HVAC cable, Ccable.VSC of DC cable is calculated by the transmission distance.
where P1 and P2 are the expense and installation costs of per km DC cable.
3.2.2. Operation and Maintenance Costs
Copex.VSC is obtained in Equation (8), and the A of the DC submarine cable equals to 0.5%, n is 20 years, and i is 5%, which were applied to this study.
3.2.3. Costs of Loss
The loss costs Closs.VSC consist of converter station loss Csub.loss and line loss Cline.loss. Converter station loss rate Psub.loss is the percentage of station power loss to the transmitted power. Psub.loss of two converter stations is 1.6–2.4%, and Zhen points out that Psub.loss is 1–2% [36]. The levelized loss rate of each substation is
Meanwhile, the line losses Cline.loss can be evaluated as
where UDC is the DC voltage; R is resistance.
The evaluation of Closs.VSC is described as
3.3. Costs Calculation of GIL Transmission Concept
The GIL transmission concept is similar to the AC transmission concept, but there is no reactive power compensation costs.
3.3.1. Capital Costs
The capital expenditure Ccap.GIL is dependent on the transformer substation foundation cost Cstation.GIL and cable foundation and installation cost Ccable.GIL.
The foundation cost Cstation.GIL is similar to Cstation.AC in Equation (3); similarly, the calculation of Ccable.GIL is as Equation (4).
3.3.2. Operation and Maintenance Costs
Based on the OPEX in HVAC transmission system, Copex.GIL is expressed by the percentage A as in Equation (7).
3.3.3. Costs of Loss
The loss costs Closs.GIL in the GIL transmission system comprises of Csub.loss and line loss Cline.loss as well.
where Csub.loss is dependent on the Psub.loss, Cline.loss comprises of conductor losses Ccon.loss, as computed by Equation (10), and the eddy current and circulating current loss Cedcir.loss of the shell.
3.4. Costs Calculation of Hybrid HVDC Transmission
3.4.1. Capital Costs
Capital costs in the hybrid HVDC transmission Ccap.HybDC covers the converter station foundation cost Cstation.HybDC, cable foundation cost, and installation cost Ccable.HybDC.
where Cstation.HybDC is dependent on the sum of the investment costs of the different types of converter stations on both sides.
3.4.2. Operation and Maintenance Costs
Since the OPEX in the hybrid HVDC transmission system is in the same way in the VSC-HVDC transmission system, Copex.HybD can be calculated by Equation (8).
3.4.3. Costs of Loss
Similarly, Closs.HybDC consists of substation loss Csub.loss and line loss Cline.loss. Csub.loss is dependent on the converter station loss rate Psub.loss, which is 1.75% for VSC-HVDC and 0.8% for LCC-HVDC. The average value of Psub.loss is 1.275%. The transmission line loss Cline.loss is the same as in Equation (20).
4. Results and Discussion
The empirical component-resolved evaluation models give a crucial message to stakeholders that the economic costs are sensitive to transmission distance and capacity. The cost comparisons of the four electrical transmission options for wind farms with different distances and transmitted power were carried out. The rated voltage is 220 kV, and the frequency is 50 Hz, and the operation hour of full capacity per year is 2500 h. If the capacity is 300 MW, 600 MW, and 900 MW, respectively, the economic evaluations from 25 km to 75 km were conducted.
4.1. Essential Evaluation Data
Based on the DCF model, the costs evaluation results can be converted to cash value. Unlike an onshore power grid, the specific environment and operational conditions of the offshore substation are more complicated; it is necessary to adopt more strict standards for long-term stability. For the AC cable, one line is needed for 300 MW, two lines for 600 MW, and three lines for 900 MW wind power. However, it is important to point out that in the GIL transmission concept, the rated current is 3.15 kA, so the transmission capacity of a single line is 1200 MVA, and there is no need to install additional lines with different capacity. The data are given in Table 2.
4.1.1. Capital Costs Evaluation
The Cstation of the AC cable varies among different projects. For example, according to the materials in Design Control Index of Power Grid Project (2014 standard) provided by the Electric Power Planning and Engineering Institute of China [39], the investment of the 220 kV Yucai substation project (indoor) is 0.303 million RMB per megavolt-ampere (MVA), and the cost of the 220 kV Pingli substation project (Laizhou, Shandong) is CNY 0.435 million/MVA. In this study, for 35 kV wind farms with a 220 kV single-core underwater cable, the foundation costs of substation CperMVA is CNY 0.45 million/MVA. Procurement materials provided by Dongfang Cable Factory in Ningbo city indicates that the expense basis of a 220 kV single-core underwater cable with the 1200 mm2 cross-sectional area of copper core is CNY 3.732 million/km. The installation costs refer to cable crossing barge, sea sweeping, and trench laying. The project of the 66 kV Xin-Guang submarine cable in Dalian city gives the cost P2 around CNY 0.3 million/km. As for the reactive power compensation, the rated power of the AC cable is 427 MVA and the capacitance for the 1200 mm2 cable is 0.179 μF/km. The maximum DC resistances of the 20 °C and AC resistance of 90 °C are 0.0151 Ω/km and 0.02 Ω/km, respectively.
Several studies provide various foundation costs for the converter station for reference. The costs of the traditional ±500 kV and ±800 kV LCC-HVDC converter stations are around CNY 0.52428 million/MW and CNY 0.56228 million/MW, respectively. There is a lack of reports on the cost of a VSC-HVDC converter station in China, which varies widely across the globe. Reference [36] applied the technical materials of ABB Ltd. to evaluate the costs of a VSC-HVDC station as CNY 1.155 to 1.343 million/MW, and the costs of the ±300 kV converter station are CNY 1.2 million/MW. Taking the development of offshore wind power technology into account, the standard of CperMW is CNY 1.1 million/MW. According to the industry date provided by Dongfang Cable Factory, the expense the P1 of XLPE-insulated DC submarine cable (Model: DC200 kV YJQ411 500 + 2 × 12 (core optical cable)) with a cross-sectional area of 500 mm2 is CNY 1.077 million/km. Moreover, considering the difficulty of hybrid HVDC transmission technology, then CperMW is CNY 0.9621 million/MW.
The expense of GIL P1 is CNY 20 million/km. P2 of the four transmission methods equals CNY 0.3 million/km. Thus, the capital costs under different capacity can be obtained.
4.1.2. Operation and Maintenance Costs Evaluation
The annual percentage A of the operation and maintenance cost of the AC submarine cable accounts for 1.2%, and 0.5% is adopted in the other three transmission methods.
4.1.3. Costs of Loss Evaluation
It is assumed that the operation hours are 2500 h per year, referred to in [37], and the on-grid price of offshore wind power is CNY 0.0085 million/MW·h [40]. The substation loss rate Psub.loss in AC cable and GIL transmission system is 0.4%. The apparent power is 427 MVA, based on Equation (9), and the current of copper core with Icable is 0.8287 kA. Rcu is 0.006 Ω/km. Some industry gives Is is 502.4 A and IA is 313.2 A. The resistances of the sheath and armor are 0.21 Ω/km and 0.301 Ω/km. The eddy current loss Ped.loss and circulating current loss Pcir.loss in the GIL lines are 0.0177 MW/km and 0.0062 MW/km, respectively.
For the XLPE-insulated DC submarine cable, the rated power is 324 MW and the DC resistance is 0.0366 Ω/km. Based on Equation (20), the conductor loss of 300 MW is 0.0412 MW/km, 0.0824 MW/km, and 0.1648 MW/km. The substation loss rate Psub.loss in the hybrid HVDC system is 1.275%.
4.2. Evaluation Results
It can be seen from the above analysis that offshore distance and capacity have an important impact on the capital costs of the four types of transmission. Based on the DCF model, the comparisons with different transmission distances and capacities were calculated, and the results shown in Table 3. Components analysis of the total costs was carried out to acquire an importance view for stakeholders, shown in Table 4. The gradual change in color from green to red represents an increase in costs.
4.3. Comparisons of Economic Evaluation
To obtain the best transmission method for Guangdong offshore wind power, the costs comparisons were calculated.
4.3.1. Total Costs Comparisons with Different L
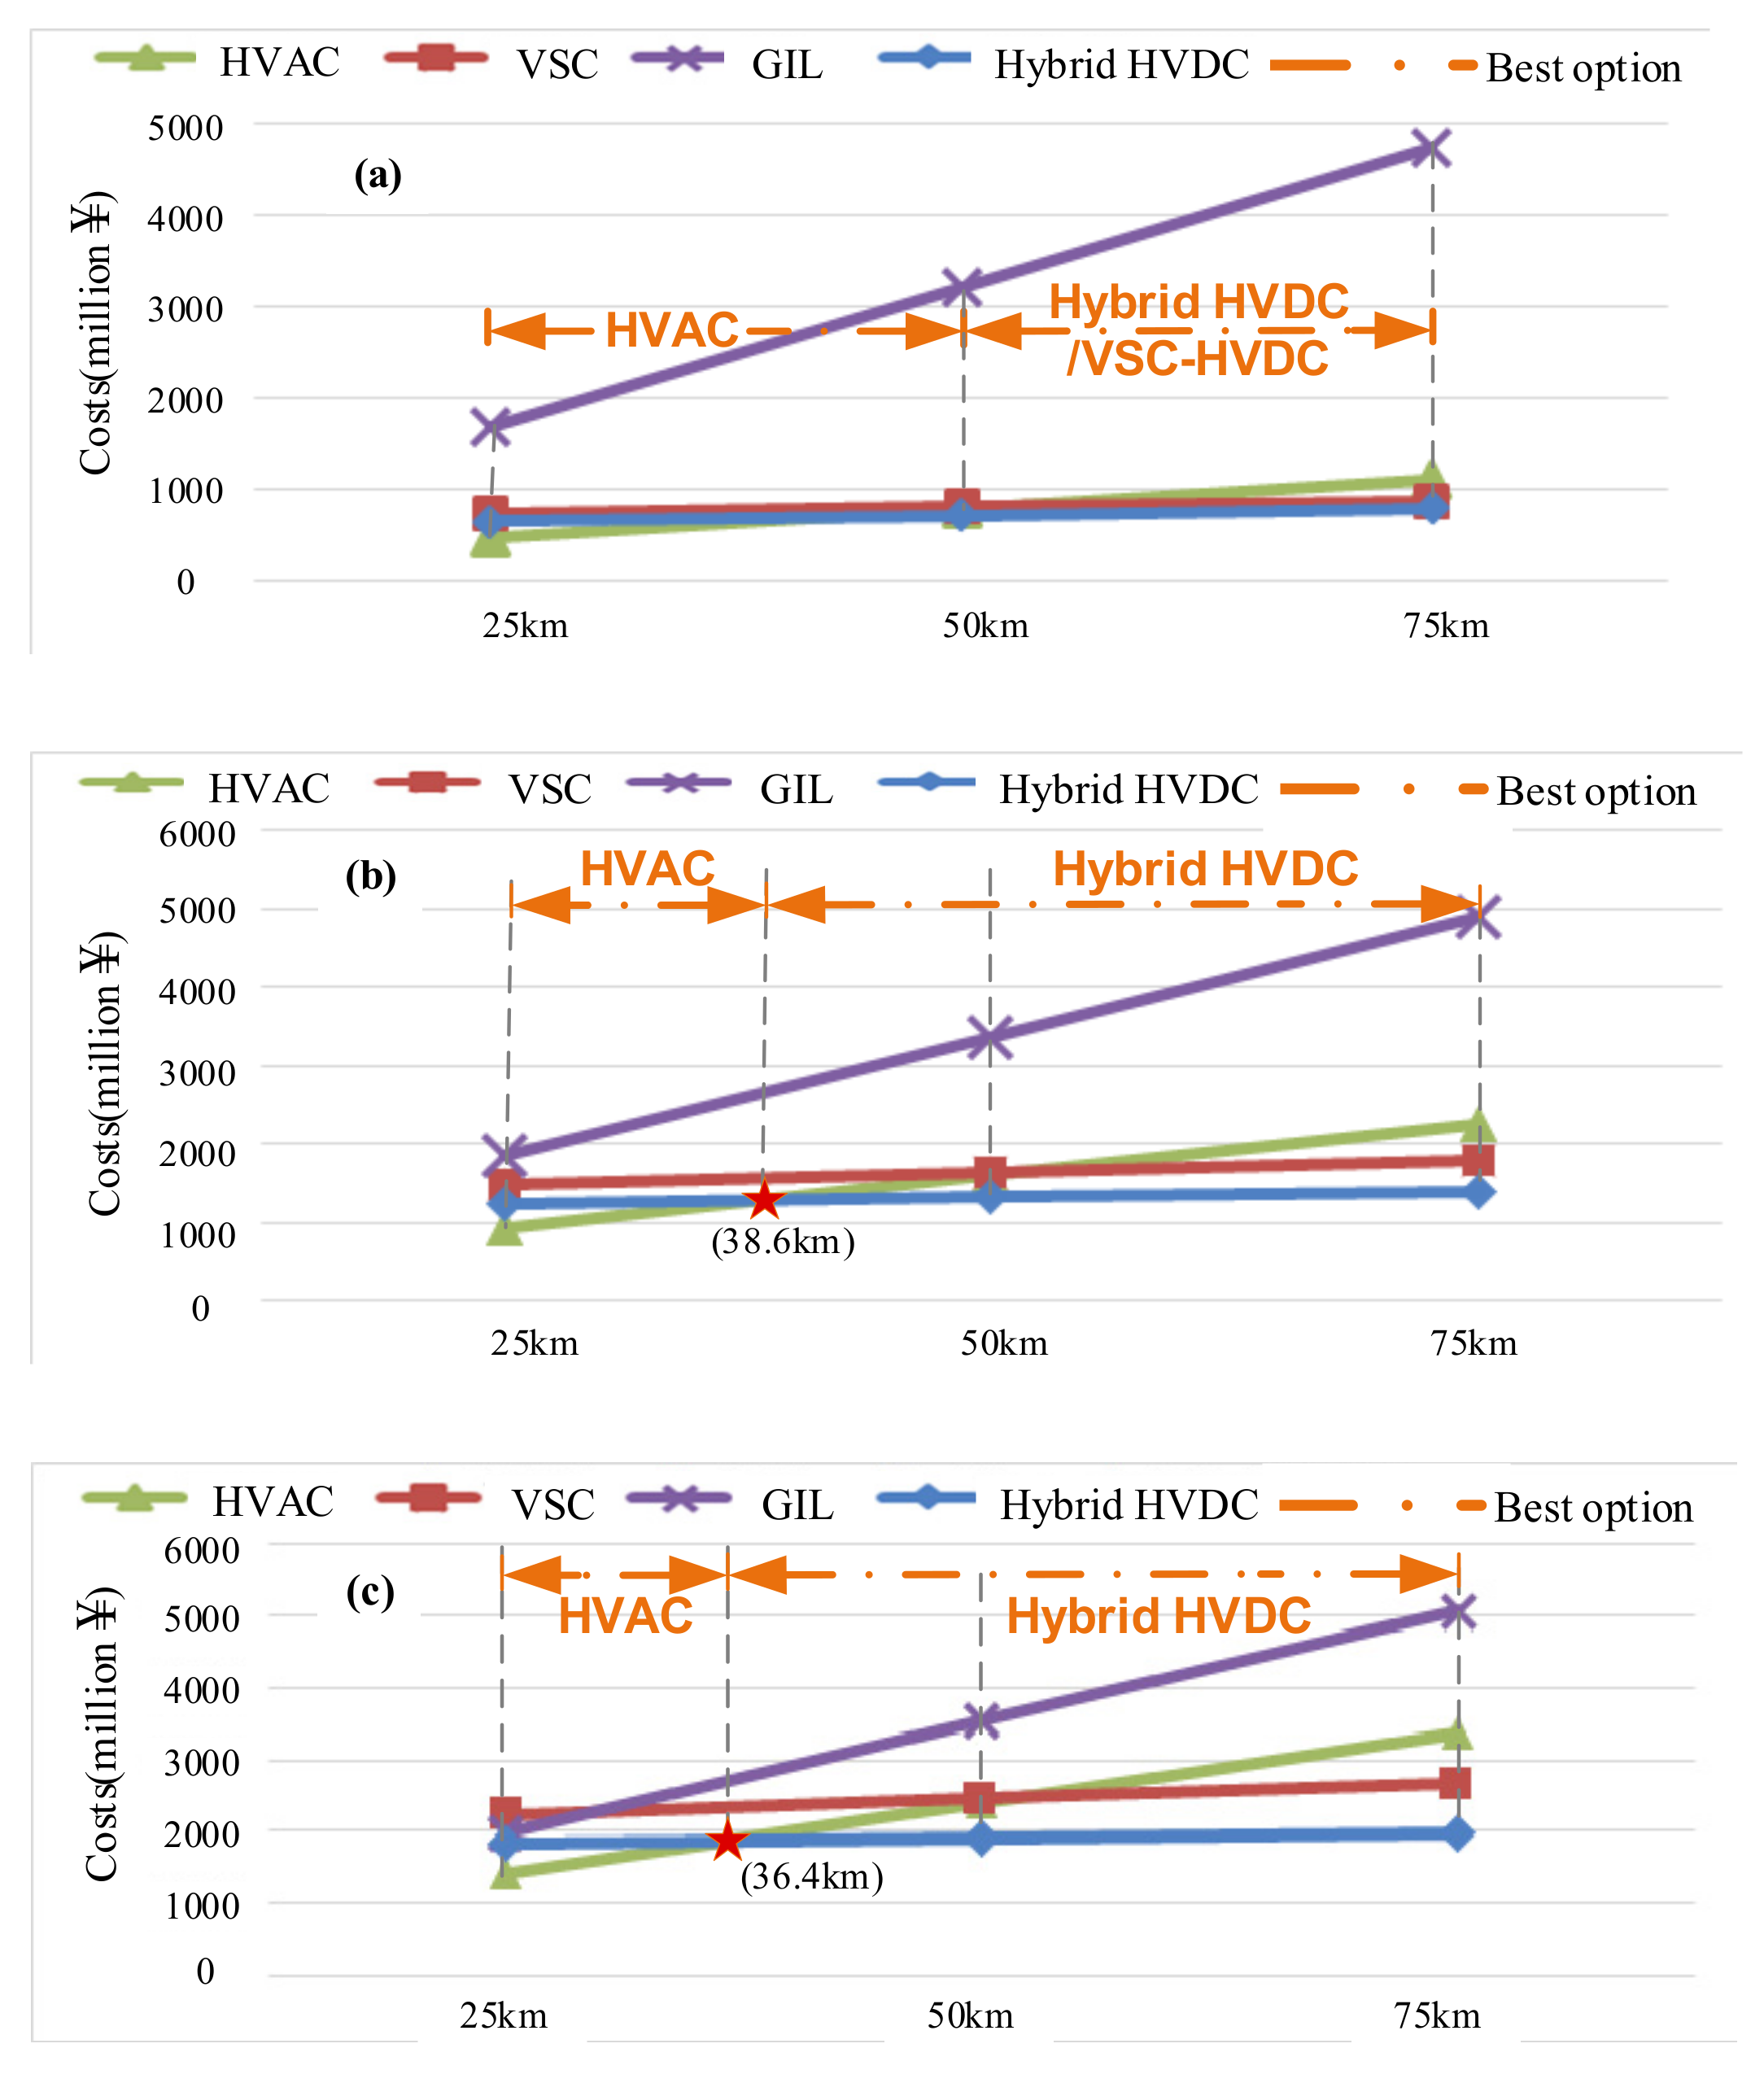
According to the data in Table 2, the relationships between the total costs of transmission distance L from 25 km to 75 km are shown in Figure 3.
It is clear that the economic costs of the GIL electrical transmission concept are considerably much more than either the HVAC or HVDC transmission concept. When the transmission distance is not so long, such as 25 km, the costs of the GIL system is more than twice of that in other systems. In addition, the costs of the GIL changes great when L increases, which means it is most sensitive to transmission distance; it can even be four times that of the others at a distance of 75 km. On the other hand, the hybrid HVDC transmission concept has economic advantages to the VSC-HVDC system, and when the installed capacity increases, the preferred distance range under the hybrid HVDC technology becomes longer from 50 km (300 MW), 38.6 km (600 MW), to 36.4 km (900 Mw). It is feasible if the technology is developed widely in the future.
If the hybrid HVDC is not taken into present planning consideration due to its limited development, compared with VSC-HVDC electrical transmission, the HVAC concept is more superior when L is less than around 50 km in both 300 MW, 600 MW, and 900 MW wind farms. Otherwise, the HVDC transmission concept is preferable with a longer distance. HVDC is also less sensitive to transmission distance than the HVAC system.
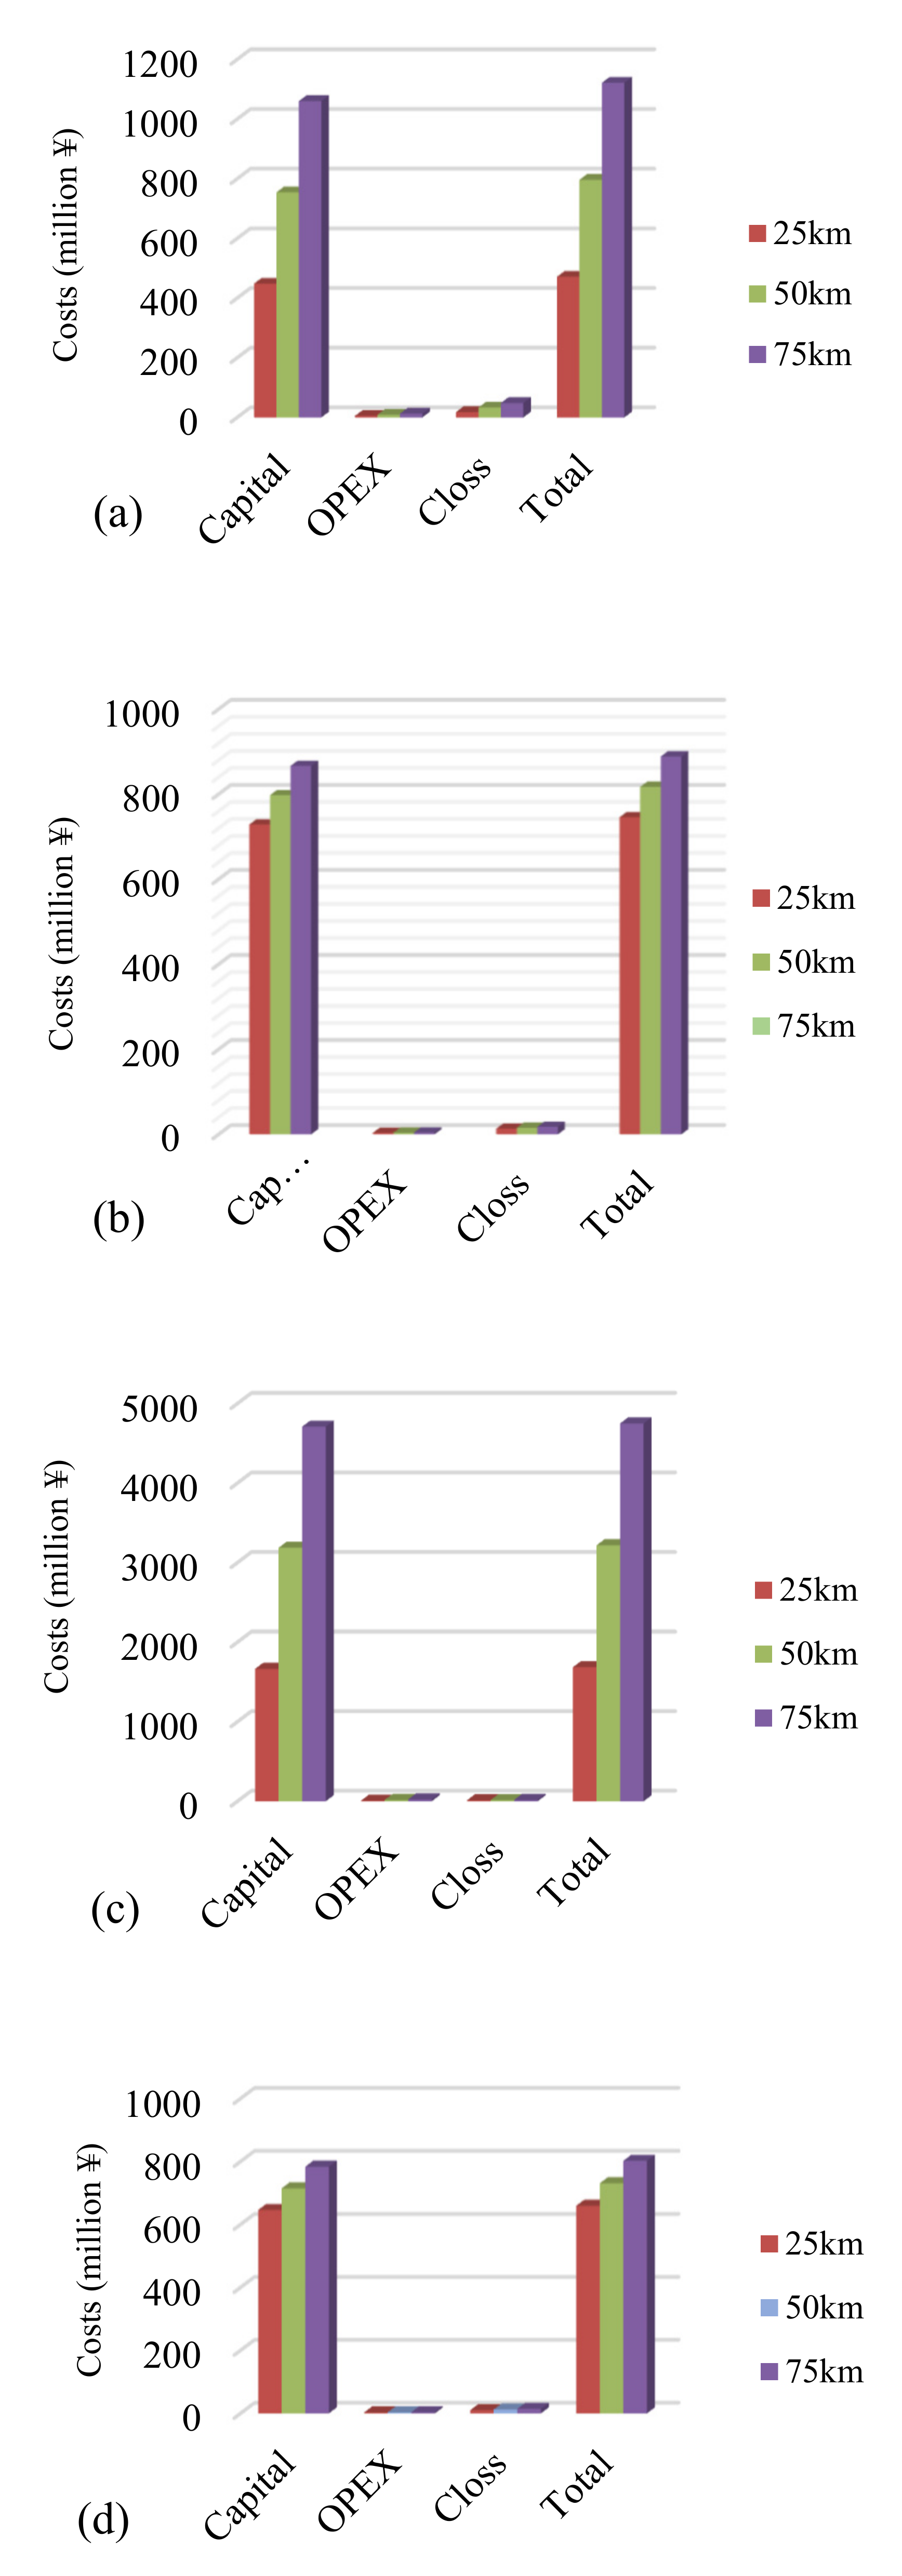
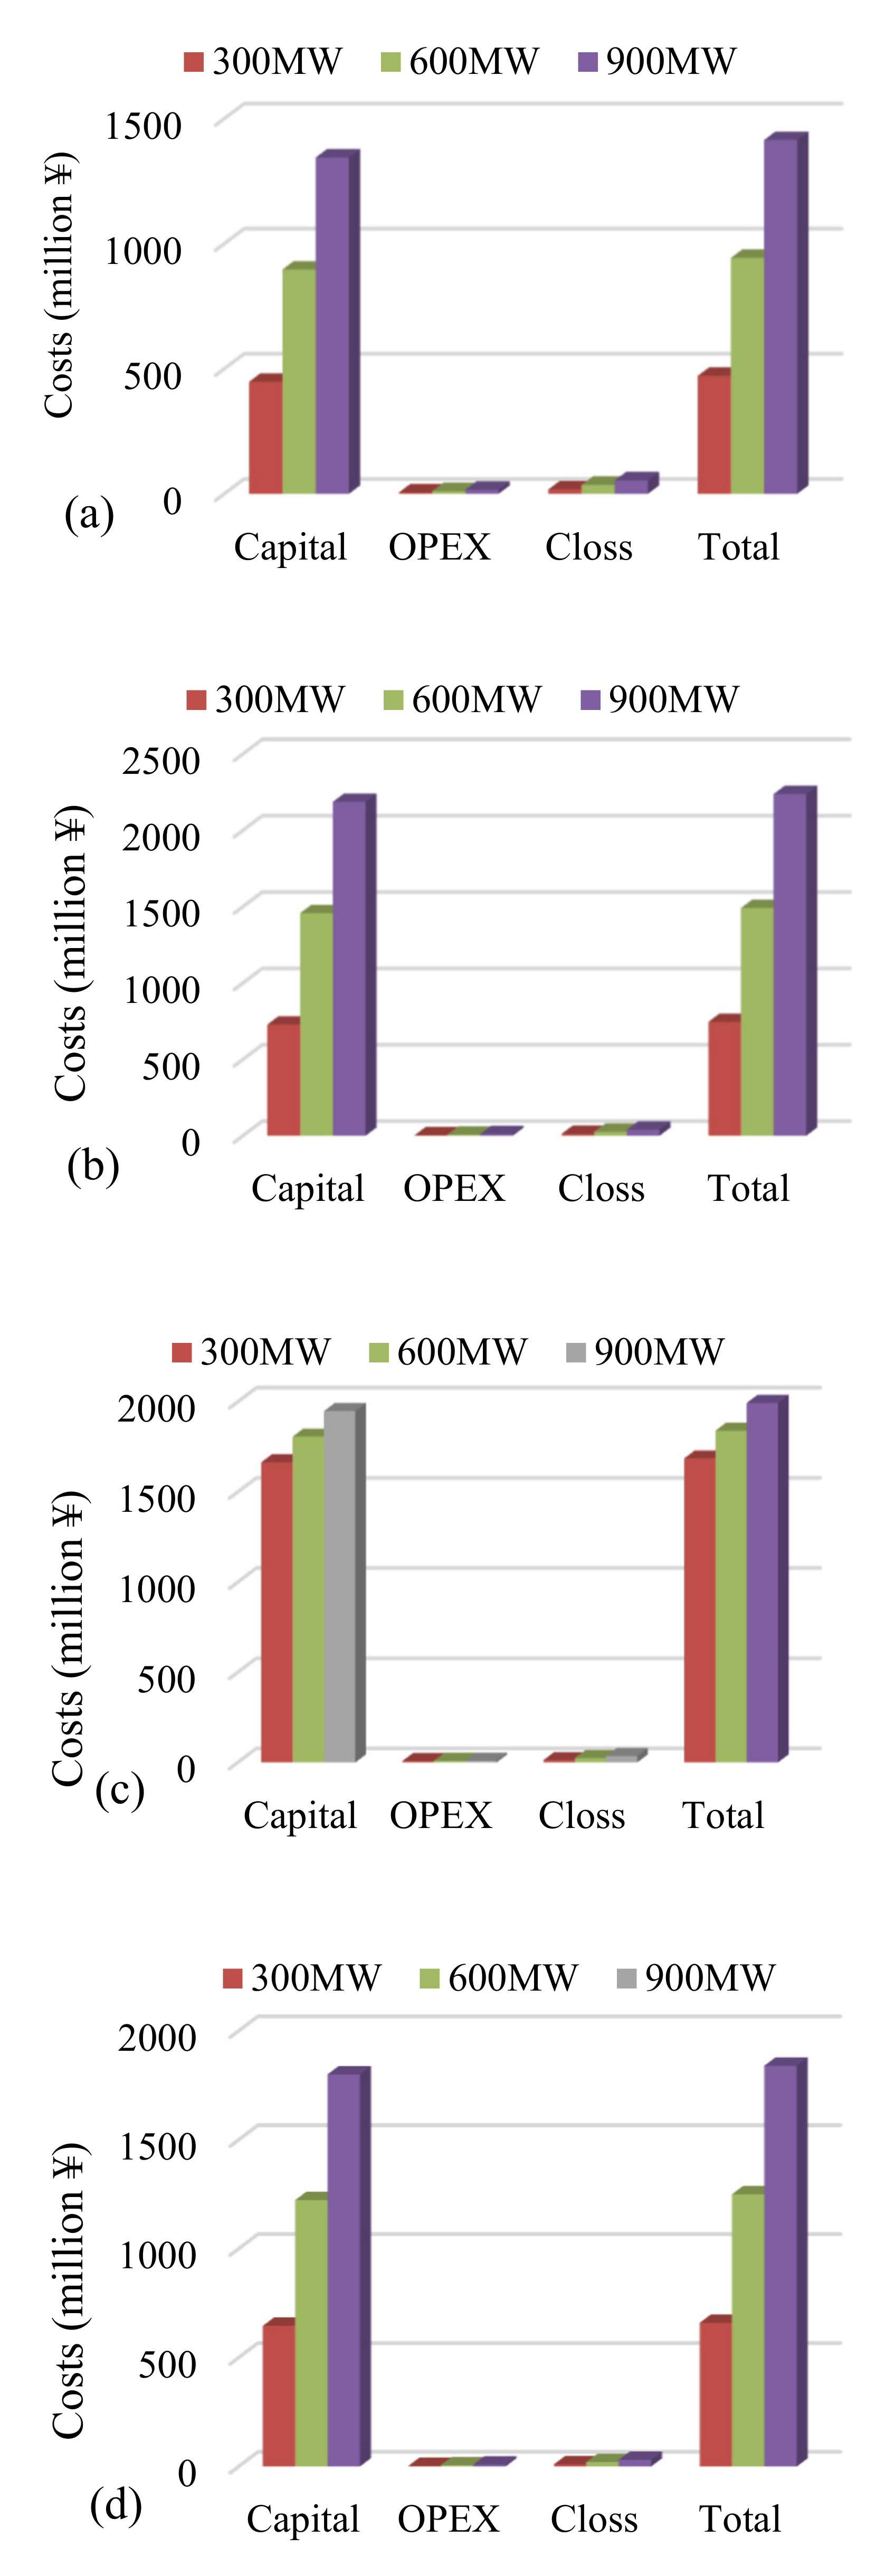
4.3.2. Costs Components Comparisons with Different L
Taking 300 MW wind farms as an example, as Figure 4 shows, in the GIL and AC transmission system, the cable costs account for a large proportion of the total cost, especially the extravagant cable costs of the GIL transmission concept. That means the capital costs are the most important component to be considered, and the HVDC system has huge technological potential for offshore wind power transmission.
For the VSC-HVDC and hybrid HVDC transmission systems, cable costs are cheaper than for the AC transmission system. In turn, he costs of the converter station are much higher than that of the substation, as well as the costs of the converter station loss. It is important to notice that the capital costs in the AC system and GIL system increase greater than in HVDC systems.
4.3.3. Total Costs Comparisons with Different P
The economic costs of various transmission concepts are sensitive to transmission capacity, as shown in Figure 5. In near sea wind energy transmission, the economic costs of GIL transmission for 900 MW wind farms are even lower than that of VSC-HVDC transmission near sea wind farm transmission due to its advantages of large-capacity transmission. Thus, the GIL concept may be a better choice in the scenario under short distances with large-capacity transmission.
Still, the lowest economic costs with different capacities are seen in the hybrid HVDC transmission concept, followed by HVAC electrical transmission and VSC-HVDC transmission. The GIL system increases significantly with a longer transmission distance; so, GIL is not recommended. Considering both economic and technical feasibility, for the offshore wind farms with different distances and transmission capacities, at present, HVAC transmission and VSC-HVDC transmission are selected according to the actual situation. The total costs are more sensitive to the distance than capacity. What is more, there is a need to notice that the hybrid HVDC transmission system is a preferred choice with the economic potential for either large-capacity or long-distance wind farms.
4.3.4. Costs Components Comparisons with Different P
Components comparisons of different P are carried out to acquire a view for investors. Taking the 25 km wind farms as an example, a sensitivity analysis was conducted, and the results shown in Figure 6.
It can be seen that there is an obvious advantage of the GIL system, as the capital costs of the GIL transmission system changed the least compared to the other systems, even when the capacity reached 900 MW. That means it is less sensitive to transmission capacity. However, the HVAC system and HVDC systems are so sensitive to capacity, which should be considered in OWF planning.
5. Conclusions
This paper investigates the four electrical transmission options for current and future Western Guangdong offshore wind farm implementation, including their technical characteristics, application status, and economic costs. Based on the component-resolved evaluation model, the capital costs, OPEX, and loss costs of four concepts of electrical transmission were studied, with the results showing that capital costs are the major component. The capital cost of the DC-type transmission technology is mainly related to the converter investment, while the cost of the AC type and GIL transmission technology is mainly related to the line and compensation cost. Meanwhile, the analysis also indicates that the offshore distance and capacity have an important impact on the capital costs of the four types of transmission. The sensitivity analysis of the four transmission solutions regarding transmission distance and capacity recommends the powerful competitive alternative of the HVAC transmission concept if the transmission system is less than 50.48 km for Yangjiang offshore wind farms, and VSC-HVDC and hybrid HVDC transmission for longer distances and larger capacities. For future planning, the GIL transmission system should be the preferred option in near sea and large-capacity wind farms, and the hybrid HVDC transmission possesses significant economic potential with a wide range of transmission distances and capacities.
Author Contributions
Q.J. performed the conceptualization, formal analysis and original draft preparation; B.L. provided methodology and reviewed the manuscript; T.L. supported the funding acquisition. All authors have read and agreed to the published version of the manuscript.
Funding
This research was funded by Science and Technology project of State Grid Corporation of China “Cloud energy storage framework-based AI dispatching strategy of renewable energy integration and contingency response”, grant number 5100-202199274A-0-0-00.
Data Availability Statement
Data available on request due to privacy restrictions.
Conflicts of Interest
The authors declare no conflict of interest.
References
- Snyder, B.; Kaiser, M.J. Ecological and economic cost-benefit analysis of offshore wind energy. Renew. Energy 2009, 34, 1567–1578. [Google Scholar] [CrossRef]
- IRENA. Global Renewables Outlook: Energy Transformation 2050; International Renewable Energy Agency: Abu Dhabi, United Arab Emirates, 2020. [Google Scholar]
- GWEC. Global Wind Report 2019; Global Wind Energy Council: Brussels, Belgium, 2020. [Google Scholar]
- IEA. Offshore Wind Outlook 2019; International Energy Agency: Paris, France, 2019. [Google Scholar]
- BNEF. Offshore Wind Energy Market Outlook 2017; Bloomberg New Energy Finance: Shanghai, China, 2017. [Google Scholar]
- Sachs, J.; Moya, D.; Giarola, S.; Hawkes, A. Clustered spatially and temporally resolved global heat and cooling energy demand in the residential sector. Appl. Energy 2019, 250, 48–62. [Google Scholar] [CrossRef]
- Staffell, I.; Pfenninger, S. Using bias-corrected reanalysis to simulate current and future wind power output. Energy 2016, 114, 1224–1239. [Google Scholar] [CrossRef] [Green Version]
- Myhr, A.; Bjerkseter, C.; Ågotnes, A.; Nygaard, T.A. Levelised cost of energy for offshore floating wind turbines in a life cycle perspective. Renew. Energy 2014, 66, 714–728. [Google Scholar] [CrossRef] [Green Version]
- Cavazzi, S.; Dutton, A.G. An Offshore Wind Energy Geographic Information System (OWE-GIS) for assessment of the UK’s offshore wind energy potential. Renew. Energy 2016, 87, 212–228. [Google Scholar] [CrossRef]
- Hdidouan, D.; Staffell, I. The impact of climate change on the levelised cost of wind energy. Renew. Energy 2017, 101, 575–592. [Google Scholar] [CrossRef] [Green Version]
- Hearps, P.; McConnell, D. Renewable Energy Technology Cost Review; Melbourne Energy Institute: Melbourne, Australia, 2011. [Google Scholar]
- Waewsak, J.; Landry, M.; Gagnon, Y. Offshore wind power potential of the Gulf of Thailand. Renew. Energy 2015, 81, 609–626. [Google Scholar] [CrossRef]
- Nagababu, G.; Kachhwaha, S.S.; Savsani, V. Estimation of technical and economic potential of offshore wind along the coast of India. Energy 2017, 138, 79–91. [Google Scholar] [CrossRef]
- Effiom, S.O.; Nwankwojike, B.N.; Abam, F.I. Economic cost evaluation on the viability of offshore wind turbine farms in Nigeria. Energy Rep. 2016, 2, 48–53. [Google Scholar] [CrossRef] [Green Version]
- Möller, B.; Hong, L.; Lonsing, R.; Hvelplund, F. Evaluation of offshore wind resources scale of development. Energy 2012, 48, 314–322. [Google Scholar] [CrossRef] [Green Version]
- Yamaguchi, A.; Ishihara, T. Assessment of offshore wind energy potential using mesoscale model and geographic information system. Renew. Energy 2014, 69, 506–515. [Google Scholar] [CrossRef]
- Abdelhady, S.; Borello, D.; Shaban, A. Assessment of levelized cost of electricity of offshore wind energy in Egypt. Wind. Eng. 2017, 41, 160–173. [Google Scholar] [CrossRef]
- Bosch, J.; Staffell, I.; Hawkes, A.D. Global levelised cost of electricity from offshore wind. Energy 2019, 189, 116357. [Google Scholar] [CrossRef]
- Ebenhoch, R.; Matha, D.; Marathe, S.; Muñoz, P.C.; Molins, C. Comparative Levelized Cost of Energy Analysis. Energy Procedia 2015, 80, 108–122. [Google Scholar] [CrossRef] [Green Version]
- Nagababu, G.; Kachhwaha, S.S.; Naidu, N.K.; Savsani, V. Application of reanalysis data to estimate offshore wind potential in EEZ of India based on marine ecosystem considerations. Energy 2017, 118, 622–631. [Google Scholar] [CrossRef]
- Papathanasopoulou, E.; Beaumont, N.; Hooper, T.; Nunes, J.; Queirós, A.M. Energy systems and their impacts on marine ecosystem services. Renew. Sustain. Energy Rev. 2015, 52, 917–926. [Google Scholar] [CrossRef]
- Kim, J.Y.; Oh, K.Y.; Kang, K.S.; Lee, J.S. Site selection of offshore wind farms around the Korean Peninsula through economic evaluation. Renew. Energy 2012, 54, 189–195. [Google Scholar] [CrossRef]
- Pacheco, A.; Gorbeña, E.; Sequeira, C.; Jerez, S. An evaluation of offshore wind power production by floatable systems: A case study from SW Portugal. Energy 2017, 131, 239–250. [Google Scholar] [CrossRef]
- Elliott, D.; Bell, K.R.; Finney, S.J.; Adapa, R.; Brozio, C.; Yu, J.; Hussain, K. A comparison of AC and HVDC options for the connection of offshore wind generation in Great Britain. IEEE Trans. Power Deliv. 2016, 31, 798–809. [Google Scholar] [CrossRef] [Green Version]
- Cui, Y.; Song, X.; Zhao, L.; Yuan, H.; Wu, G.; Wang, C. WSN-Based Measurement of Ion-Current Density Under High-Voltage Direct Current Transmission Lines. IEEE Access 2019, 7, 10947–10955. [Google Scholar] [CrossRef]
- Kimura, N.; Funaki, T.; Matsu-ura, K. Damping of current oscillation in superconductive line applied for high voltage direct current transmission system. IEEE Trans. Appl. Supercond. 1993, 3, 223–225. [Google Scholar] [CrossRef]
- Lu, T.; Feng, H.; Zhao, Z.; Cui, X. Analysis of the Electric Field and Ion Current Density Under Ultra High-Voltage Direct-Current Transmission Lines Based on Finite Element Method. IEEE Trans. Magn. 2007, 43, 1221–1224. [Google Scholar] [CrossRef]
- Jacobs, K.; Heinig, S.; Johannesson, D.; Norrga, S.; Nee, H.-P. Comparative Evaluation of Voltage Source Converters with Silicon Carbide Semiconductor Devices for High-Voltage Direct Current Transmission. IEEE Trans. Power Electron. 2021, 36, 8887–8906. [Google Scholar] [CrossRef]
- Yuan, H.; Yang, Q.; Liu, Y.; Lu, J.; Akhtar, S.A. Development and Application of High-Frequency Sensor for Corona Current Measurement under Ultra High-Voltage Direct-Current Environment. IEEE Trans. Instrum. Meas. 2012, 61, 1064–1071. [Google Scholar] [CrossRef]
- Blanco, M.I. The economics of wind energy. Renew. Sustain. Energy Rev. 2009, 13, 1372–1382. [Google Scholar] [CrossRef]
- ABB. World’s First Power-from-Shore Dynamic ac Cable—Gjoa Floating Oil and Gas Platform; North Sea: Zurich, Switzerland, 2015. [Google Scholar]
- Schell, K.R.; Claro, J.; Guikema, S.D. Probabilistic cost prediction for submarine power cable projects. Int. J. Electr. Power Energy Syst. 2017, 90, 1–9. [Google Scholar] [CrossRef]
- Wu, J.; Wang, J.; Chi, D. Wind energy potential assessment for the site of Inner Mongolia in China. Renew. Sustain. Energy Rev. 2013, 21, 215–228. [Google Scholar] [CrossRef]
- Hong, L.; Möller, B. Offshore wind energy potential in China: Under technical, spatial and economic constraints. Energy 2011, 36, 4482–4491. [Google Scholar] [CrossRef] [Green Version]
- Da, Z.; Xiliang, Z.; Jiankun, H.; Qimin, C. Offshore wind energy development in China: Current status and future perspective. Renew. Sustain. Energy Rev. 2011, 15, 4673–4684. [Google Scholar] [CrossRef]
- 2014 Standard; Design Control Index of Power Grid Project. Electric Power Planning and Engineering Institute of China: Beijin, China, 2014.
- Dicorato, M.; Forte, G.; Pisani, M.; Trovato, M. Guidelines for assessment of investment cost for offshore wind generation. Renew. Energy 2011, 36, 2043–2051. [Google Scholar] [CrossRef]
- Eeckhout, B.V. The Economic Value of VSC-HVDC Compared to HVAC for Offshore Wind Farms; Katholieke Universiteit Leuven: Leuven, Belgian, 2008. [Google Scholar]
- Guozhen, X.; Yonggang, G. Analysis and estimation of circulation and loss of GIS and Gil shells. High Volt. Technol. 2009, 35, 247–249. [Google Scholar]
- National Development and Reform Commission of the People’s Republic of China. Yi Kang, Notice of the National Development and Reform Commission on the on Grid Tariff Policy of Offshore Wind Power; National Development and Reform Commission of the People’s Republic of China: Beijing, China, 2014. [Google Scholar]
Figure 1.
Overview of the study area.

Figure 2.
Structure of the four transmission methods for OWFs.

Figure 3.
Total costs of different L of 300 MW, 600 MW, and 900 MW wind farms: (a) shows the 300 MW offshore wind farm total costs with different distances; (b) shows the 600 MW offshore wind farm total costs with different distances; (c) shows the 900 MW offshore wind farms total costs with different distances.

Figure 4.
Cost component comparisons with different L (P is 300 MW): (a) shows the HVAC system; (b) shows the VSC-HVDC system; (c) shows the GIL system; (d) shows the Hybrid HVDC system.
Figure 4.
Cost component comparisons with different L (P is 300 MW): (a) shows the HVAC system; (b) shows the VSC-HVDC system; (c) shows the GIL system; (d) shows the Hybrid HVDC system.

Figure 5.
Total costs of different P of 25 km, 50 km, and 75 km wind farms: (a) shows the 25 km offshore wind farms total costs with different capacity; (b) shows the 50 km offshore wind farms total costs with different capacity; (c) shows the 75 km offshore wind farms total costs with different capacity.

Figure 6.
Costs components comparisons with different P (L is 25 km): (a) shows the HVAC system; (b) shows the VSC-HVDC system; (c) shows the GIL system; (d) shows the Hybrid HVDC system.
Figure 6.
Costs components comparisons with different P (L is 25 km): (a) shows the HVAC system; (b) shows the VSC-HVDC system; (c) shows the GIL system; (d) shows the Hybrid HVDC system.


Table 1.
Technical comparisons of the four transmission options.
| Methods | Advantage | Restrictions | Potential |
|---|---|---|---|
| HVAC | Easy layout, High reliability, Rich experience | Large distributed capacitance, Additional reactive power compensation, Multi lines for larger capacity, Synchronous fault propagation | Popular for near sea OWFs |
| VSC-HVDC | Better stability, Low line cost and loss, Restrain fault propagation, Easy for construction and capacity expansion | Layout of converter station, Additional offshore platform | Developing rapidly Large-capacity transmission, and long-distance transmission |
| GIL | Best operation reliability, High ampacity, Large transmission capacity of single line and less loss | High cost, High technical requirements, Long project period | Limited application for large-capacity transmission |
| Hybrid HVDC | Better performance than VSC-HVDC or LCC-HVDC, Lower cost than VSC-HVDC | The available transmission power is determined by VSC side, Hard to power flow reversal, Lack research | New trend of transmission, Worth developing |
Table 2.
Overview of basic data related to the economic evaluation of offshore wind farm transmission.
Table 2.
Overview of basic data related to the economic evaluation of offshore wind farm transmission.
| Components | Cost | HVAC | VSC-HVDC | GIL | Hybrid HVDC |
|---|---|---|---|---|---|
| 220 kV, 1200 mm2 Singlecore Underwater AC Cable | ±200 kV, 500 mm2 Core Optical DC Cable | 220 kV GIL Line | ±200 kV, 500 mm2 Core Optical DC Cable | ||
| Capital costs | Foundation costs of substation (converter station) | CNY 0.45 million/MVA [a] | CNY 1.1 million/MW [36] | CNY 0.45 million/MVA [a] | CNY 0.9621 million/MW [b] |
| Expense for P1 | CNY 3.732 million/km [c] | CNY 1.077 million/km [b] | CNY 20 million/km [37] | CNY 1.077 million/km [b] | |
| Installation cost P2(P3) | CNY 0.30533 million/km [a,d] | CNY 0.3 million/km [a] | CNY 0.3 million/km [a] | CNY 0.3 million/km [b] | |
| OPEX | Annual percentage A | 1.2% [36] | 0.5% [36] | 0.5% [36] | 0.5% [b] |
| Loss costs | Power loss of substation (converter station) | 0.4% [36] | 1.75% [36] | 0.4% [36] | 1.275% [b] |
| Loss costs of cables | CNY 0.6145 million/km | CNY 0.0876 million/km [38] | CNY 0.077 million/km [37] | CNY 0.0876 million/km [b] |
[a] Design Control Index of Power Grid Project in China (2014). [b] Presented in this paper considering both LCC-HVDC and VSC-HVDC cost. [c] Materials provided by Dongfang Cable Factory in Ningbo city, China. [d] Materials of the project of 66kV Xin-Guang underwater cable in Dalian city, China.
Table 3.
Economic costs comparisons of different P and different L.
| P (MW) | L (km) | HVAC (CNY Million) | VSC-HVDC (CNY Million) | GIL (CNY Million) | Hybrid HVDC (CNY Million) |
|---|---|---|---|---|---|
| 25 | 471.624 | 745.839 | 1686.1 | 659.657 | |
| 300 | 50 | 796.791 | 817.222 | 3218.2 | 731.04 |
| 75 | 1121.96 | 888.605 | 4750.2 | 802.423 | |
| 25 | 943.247 | 1491.68 | 1840.2 | 1250.12 | |
| 600 | 50 | 1593.58 | 1634.45 | 3372.2 | 1323.69 |
| 75 | 2243.93 | 1777.21 | 4904.3 | 1397.26 | |
| 25 | 1414.47 | 2237.52 | 1993.8 | 1840.58 | |
| 900 | 50 | 2389.99 | 2451.67 | 3525.9 | 1916.34 |
| 75 | 3365.48 | 2665.82 | 5057.9 | 1992.1 |
Table 4.
Economic costs comparisons of different P and different L.
| Options | L (km) | Ccap (CNY Million) | Copex (CNY Million) | Closs (CNY Million) | Ctotal (CNY Million) |
|---|---|---|---|---|---|
| 25 | 448.33 | 5.38 | 17.914 | 471.624 | |
| HVAC | 50 | 754.46 | 9.054 | 33.278 | 796.791 |
| 75 | 1060.59 | 12.727 | 48.641 | 1121.958 | |
| 25 | 728.85 | 3.644 | 13.345 | 745.839 | |
| VSC | 50 | 797.7 | 3.989 | 15.534 | 817.222 |
| 75 | 866.55 | 4.332 | 17.723 | 888.605 | |
| 25 | 1664.7 | 8.323 | 13.083 | 1686.11 | |
| GIL | 50 | 3187.2 | 15.936 | 15.009 | 3218.15 |
| 75 | 4709.7 | 23.549 | 16.935 | 4750.18 | |
| 25 | 646.11 | 3.231 | 10.317 | 659.657 | |
| Hybrid | 50 | 714.96 | 3.575 | 12.506 | 731.04 |
| 75 | 783.81 | 3.919 | 14.694 | 802.423 |
Publisher’s Note: MDPI stays neutral with regard to jurisdictional claims in published maps and institutional affiliations. |
© 2022 by the authors. Licensee MDPI, Basel, Switzerland. This article is an open access article distributed under the terms and conditions of the Creative Commons Attribution (CC BY) license (https://creativecommons.org/licenses/by/4.0/).
Share and Cite
MDPI and ACS Style
Jiang, Q.; Li, B.; Liu, T. Tech-Economic Assessment of Power Transmission Options for Large-Scale Offshore Wind Farms in China. Processes 2022, 10, 979. https://0-doi-org.brum.beds.ac.uk/10.3390/pr10050979
AMA Style
Jiang Q, Li B, Liu T. Tech-Economic Assessment of Power Transmission Options for Large-Scale Offshore Wind Farms in China. Processes. 2022; 10(5):979. https://0-doi-org.brum.beds.ac.uk/10.3390/pr10050979
Chicago/Turabian StyleJiang, Qin, Baohong Li, and Tianqi Liu. 2022. "Tech-Economic Assessment of Power Transmission Options for Large-Scale Offshore Wind Farms in China" Processes 10, no. 5: 979. https://0-doi-org.brum.beds.ac.uk/10.3390/pr10050979
Note that from the first issue of 2016, this journal uses article numbers instead of page numbers. See further details here.