
Exploring Key Decisive Factors in Manufacturing Strategies in the Adoption of Industry 4.0 by Using the Fuzzy DEMATEL Method


Abstract
:1. Introduction
- To propose smart manufacturing strategies outputs (basic elements) based on a thorough literature review and analysis.
- Defining a deeper understanding of the MS outputs and their basic elements in relation to I4.0.
- The outcomes of DEMATEL cause and effect criteria can greatly contribute to enhancing managerial abilities to achieve market competitiveness through proper decision-making.
- As a comprehensible structural model of the system, it can provide researchers and manufacturers with a better understanding of the structural relationship among MSOs.
- To boost performance, the fuzzy DEMATEL approach can manage interdependent relationships under uncertainty and determine the attributes of priority.
2. Theoretical Background and Influencing Factors Formulation
- ▪
- ▪
- Quality (Q): the ability to maintain high standards, quality control, and supervision while increasing customer satisfaction [5,36]. It can be measured by defective products [37], customer satisfaction [38], and the number of customer complaints [38]. Further quality measures include warranty claims [39], scrap rate [40], defective product [37], and customer satisfaction [38].
- ▪
- Delivery: the time required to collect and deliver an order to a customer. Additionally, it can be defined as the ability to provide shorter lead times throughout the supply chain, which includes logistics, manufacturing, and design [41]. It can be measured by on-time delivery and delivery speed [42]. Additional delivery measures include average lateness, inventory accuracy, and order entry time [43].
- ▪
- Flexibility: The ability to quickly respond to customer needs by customizing goods and services as well as increasing or decreasing the number of existing products [5,41]. The flexibility measures includes product mix flexibility [44], process flexibility [44], volume flexibility [45], and machine flexibility [45].
- ▪
- ▪
- Innovativeness: the ability to rapidly introduce new products or redesign existing ones [5]. The number of new products introduced each year, the time required to design new products, the number of engineering change orders placed each year, the level of R&D investment, and the ability to improve existing products are all measures of innovativeness [47].
3. Research Methodology
- 1.
- Normalize the triangular fuzzy numbers, where 0 ≤ ≤ 1:
- 2.
- Calculate the left score (ls) and right score (rs) normalized values:
- 3.
- Compute the crisp values:
- 4.
- Generate the total normalized crisp values of the expert, k:
- 5.
- Obtain the direct relation matrix through aggregating the normalized crisp values from all factors:
- 6.
- The standardized direct influence matrix is obtained from the initial direct influence matrix, where , and 0 ≤ ≤ 1. The calculation is as follows:
- 7.
- Calculate the influence matrix . The element indicates the indirect influence relationship of factors i and j. The influence matrix T reflects the overall impact relationship between elements. The calculation of the matrix is as follows:
- 8.
- Calculate the influence degree, affected degree, center degree, and cause degree of each factor as follows:
- i.
- The degree of influence denotes the extent to which various factors have a cumulative effect on other factors in manufacturing strategies outputs (basic elements).
- ii.
- The affected degree indicates the extent to which each factor in a set of manufacturing strategies’ outputs (basic elements) is influenced by the other factors.
- iii.
- The center degree indicates that the importance of factors in manufacturing strategies outputs (basic elements).
- iv.
- For the cause degree,
- ο
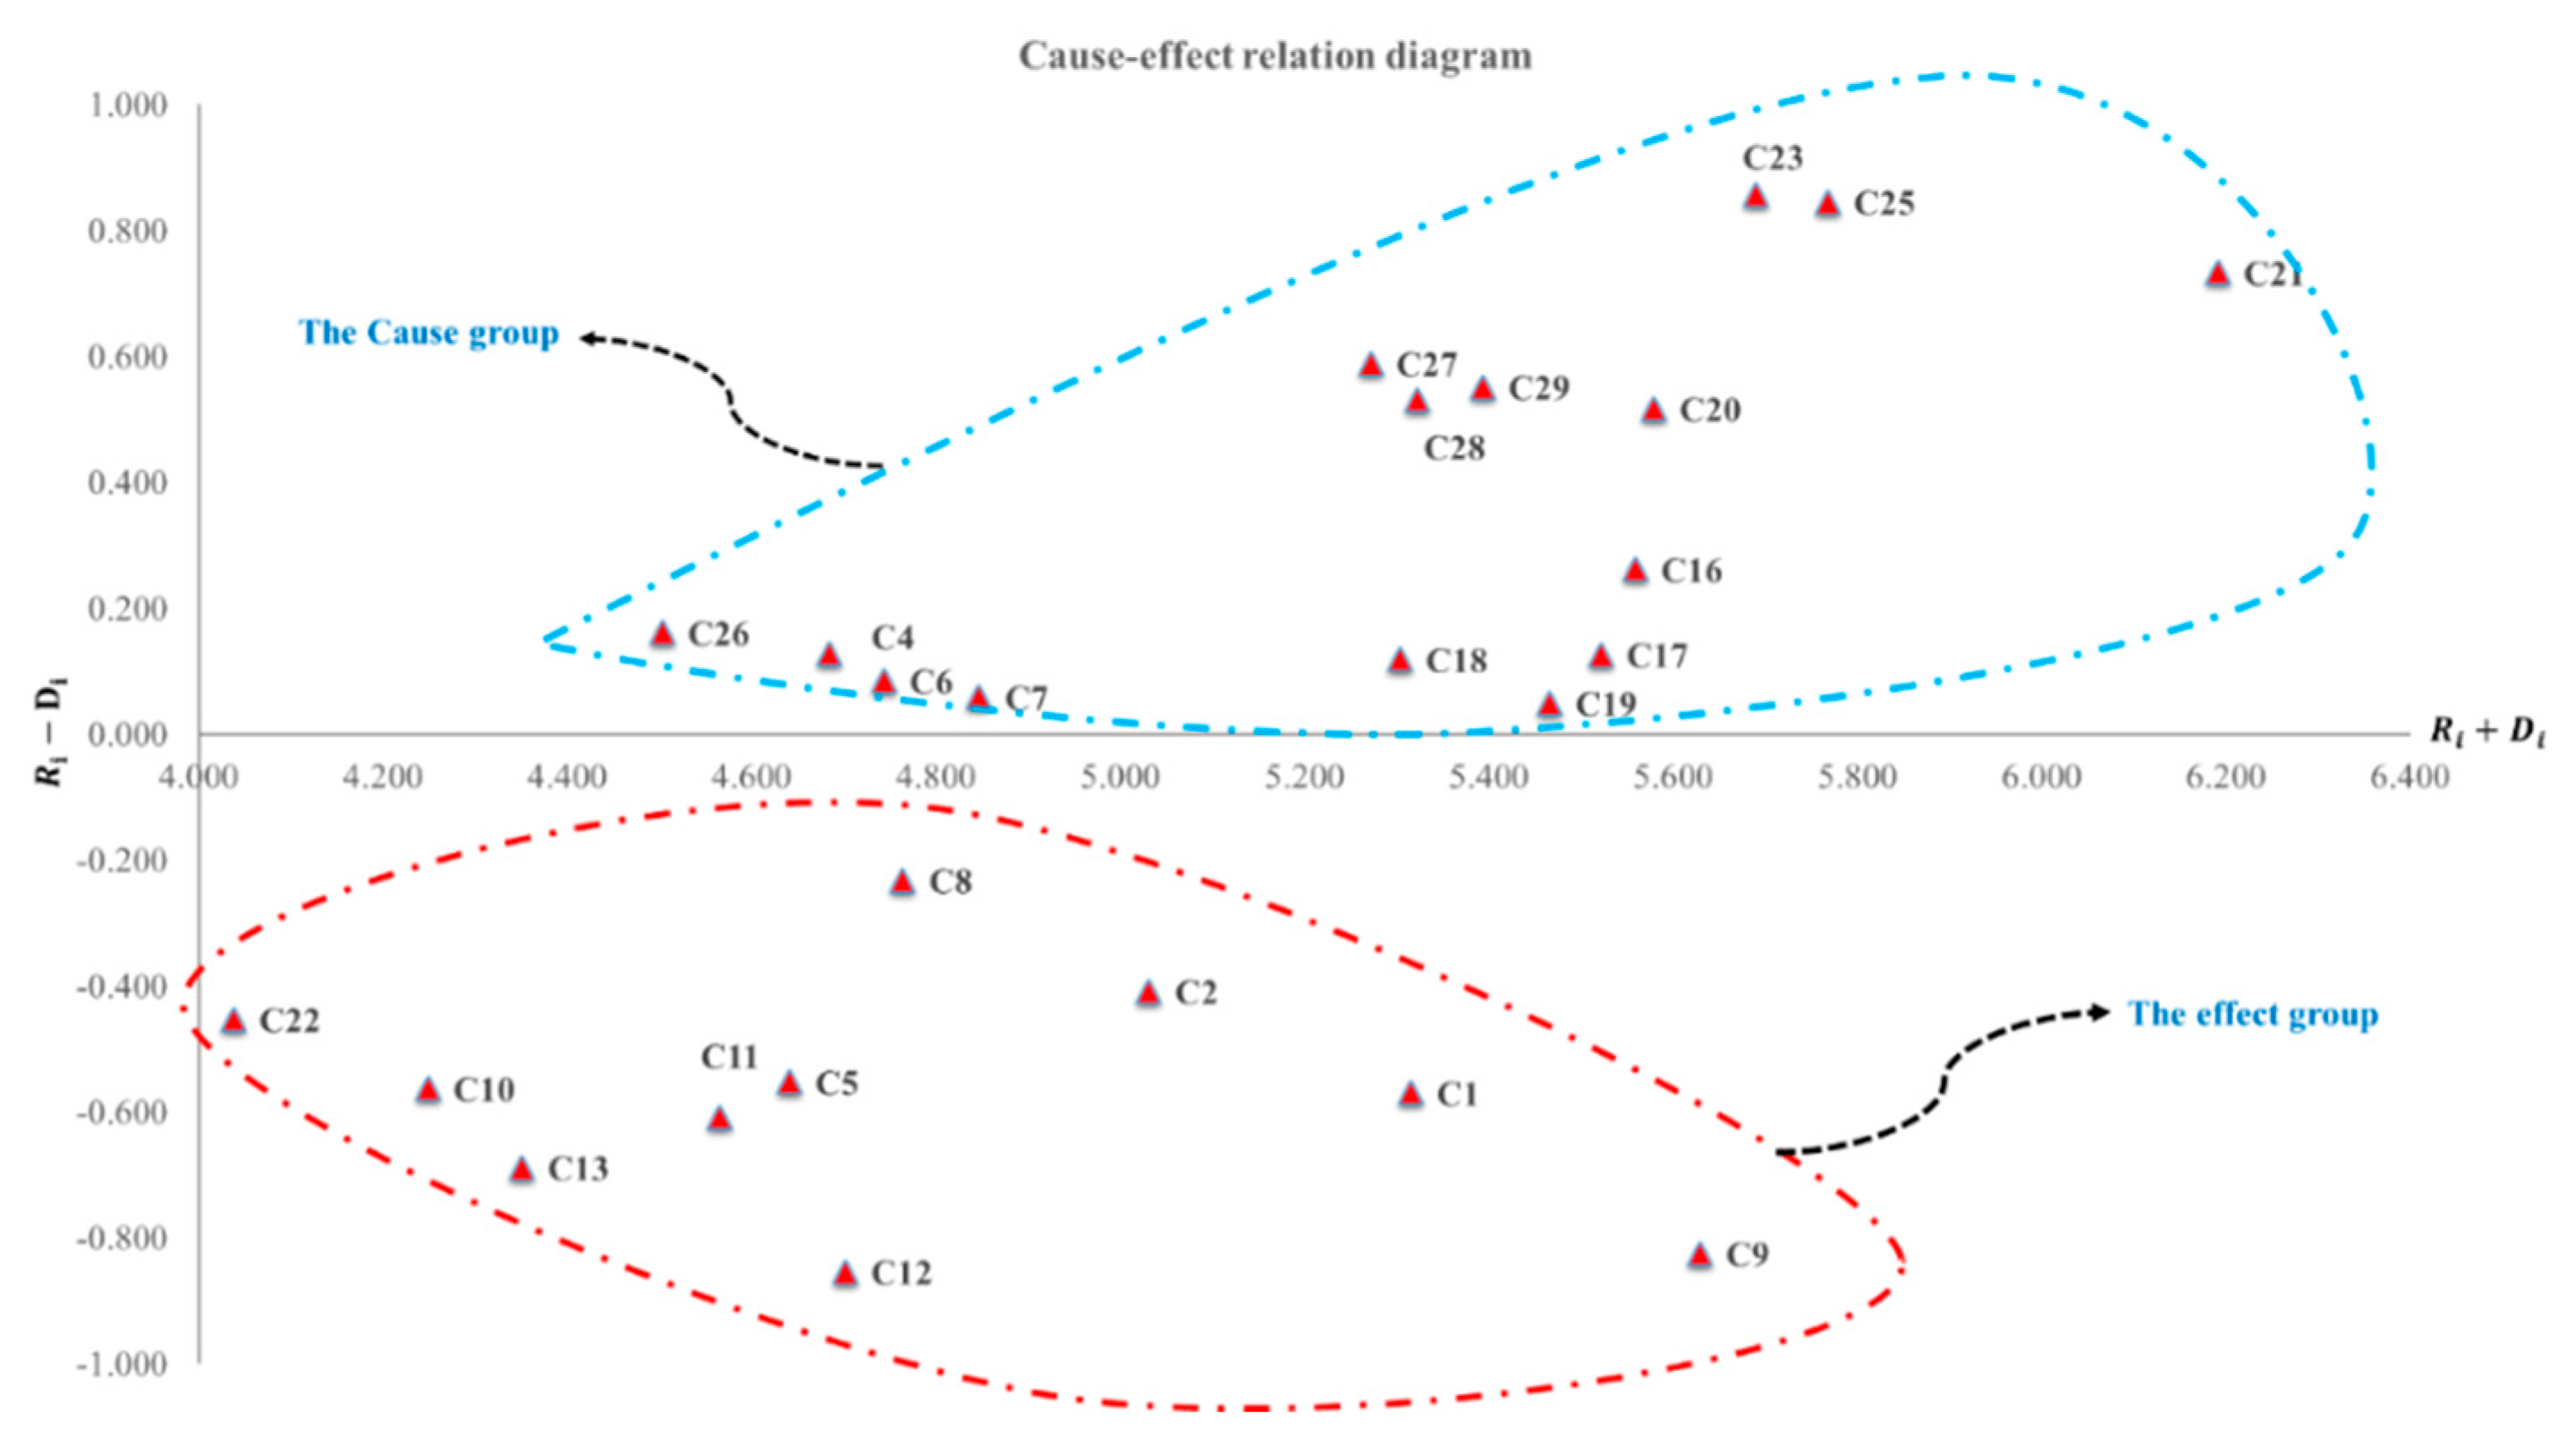
- when is positive, the factor belongs to the cause group
- ο
- when is negative, the factor belongs to the effect group
- 9.
- Create a causal diagram. Within the total relation matrix M, the sum of rows and columns are denoted independently by the vectors and . By mapping the dataset of (,), a cause and effect graph may be obtained. The horizontal axis vector () labeled “Prominence” is created by adding to , indicating the criterion’s relevance. Similarly, the vertical axis () labeled “Relation” is created by subtracting from , which can be used to organize criteria into a cause category. Alternatively, if () is negative, the criterion is assigned to the effect group.
4. Results and Discussions
5. Conclusions and Future Study
- ▪
- Among all the factors, customer satisfaction is the most important enabler for manufacturing strategy outputs. Then comes the cost per unit, delivery speed, and advanced features.
- ▪
- Regarding the root causes of manufacturing strategy outputs, the number of engineering changes has the highest influence among all elements in the cause element group. Other important causes are the number of new products introduced each year, the improvement of existing products, the number of engineering change orders per year, and the number of advanced features.
- ▪
- The results reveal that customer satisfaction has the highest influence of all the elements in the effect element group. Moreover, the cost per unit produced and operating cost have a great influence on manufacturing strategies as effect factors.
Author Contributions
Funding
Institutional Review Board Statement
Informed Consent Statement
Data Availability Statement
Conflicts of Interest
References
- Park, K.; Kremer, G.E.O. Assessment of static complexity in design and manufacturing of a product family and its impact on manufacturing performance. Int. J. Prod. Econ. 2015, 169, 215–232. [Google Scholar] [CrossRef]
- Badurdeen, F.; Jawahir, I.S. Strategies for Value Creation Through Sustainable Manufacturing. Procedia Manuf. 2017, 8, 20–27. [Google Scholar] [CrossRef]
- ElMaraghy, H.; Schuh, G.; ElMaraghy, W.; Piller, F.; Schönsleben, P.; Tseng, M.; Bernard, A. Product variety management. CIRP Ann. 2013, 62, 629–652. [Google Scholar] [CrossRef]
- Dohale, V.; Gunasekaran, A.; Akarte, M.M.; Verma, P. Twenty-five years’ contribution of “Benchmarking: An International Journal” to manufacturing strategy: A scientometric review. Benchmarking Int. J. 2020, 27, 2887–2908. [Google Scholar] [CrossRef]
- Miltenburg, J. Setting manufacturing strategy for a factory-within-a-factory. Int. J. Prod. Econ. 2008, 113, 307–323. [Google Scholar] [CrossRef]
- Patil, P.P.; Narkhede, B.E.; Akarte, M.M. Pattern of manufacturing strategy implementation and implications on manufacturing levers and manufacturing outputs and business performance. Int. J. Indian Cult. Bus. Manag. 2015, 10, 157–177. [Google Scholar] [CrossRef]
- Flynn, B.B.; Schroeder, R.G.; Flynn, E.J. World class manufacturing: An investigation of Hayes and Wheelwright’s foundation. J. Oper. Manag. 1999, 17, 249–269. [Google Scholar] [CrossRef]
- Ketokivi, M.; Schroeder, R. Manufacturing practices, strategic fit and performance: A routine-based view. Int. J. Oper. Prod. Manag. 2004, 24, 171–191. [Google Scholar] [CrossRef]
- Parhi, S.; Joshi, K.; Akarte, M. Smart manufacturing: A framework for managing performance. Int. J. Comput. Integr. Manuf. 2021, 34, 227–256. [Google Scholar] [CrossRef]
- Wagner, T.; Herrmann, C.; Thiede, S. Industry 4.0 Impacts on Lean Production Systems. Procedia CIRP 2017, 63, 125–131. [Google Scholar] [CrossRef]
- Sung, T.K. Industry 4.0: A Korea perspective. Technol. Forecast. Soc. Chang. 2018, 132, 40–45. [Google Scholar] [CrossRef]
- Alcácer, V.; Cruz-Machado, V. Scanning the industry 4.0: A literature review on technologies for manufacturing systems. Eng. Sci. Technol. Int. J. 2019, 22, 899–919. [Google Scholar] [CrossRef]
- Ghobakhloo, M. The future of manufacturing industry: A strategic roadmap toward Industry 4.0. J. Manuf. Technol. Manag. 2018, 29, 910–936. [Google Scholar] [CrossRef] [Green Version]
- Ko, M.; Kim, C.; Lee, S.; Cho, Y. An Assessment of Smart Factories in Korea: An Exploratory Empirical Investigation. Appl. Sci. 2020, 10, 7486. [Google Scholar] [CrossRef]
- Dohale, V.; Gunasekaran, A.; Akarte, M.M.; Verma, P. 52 Years of manufacturing strategy: An evolutionary review of literature (1969–2021). Int. J. Prod. Res. 2022, 60, 569–594. [Google Scholar] [CrossRef]
- Wu, G.-C.; Ding, J.-H.; Chen, P.-S. The effects of GSCM drivers and institutional pressures on GSCM practices in Taiwan’s textile and apparel industry. Int. J. Prod. Econ. 2012, 135, 618–636. [Google Scholar] [CrossRef]
- Tamura, H.; Nagata, H.; Akazawa, K. Extraction and systems analysis of factors that prevent safety and security by structural models. In SICE Annual Conference Program and Abstracts SICE Annual Conference 2002; The Society of Instrument and Control Engineers: Tokyo, Japan, 2002; p. 387. [Google Scholar] [CrossRef]
- Huang, C.-Y.; Shyu, J.Z.; Tzeng, G.-H. Reconfiguring the innovation policy portfolios for Taiwan’s SIP Mall industry. Technovation 2007, 27, 744–765. [Google Scholar] [CrossRef]
- Tzeng, G.-H.; Chiang, C.-H.; Li, C.-W. Evaluating intertwined effects in e-learning programs: A novel hybrid MCDM model based on factor analysis and DEMATEL. Expert Syst. Appl. 2007, 32, 1028–1044. [Google Scholar] [CrossRef]
- Li, J.; Wu, C.-H.; Chen, C.-W.; Huang, Y.-F.; Lin, C.-T. Apply Fuzzy DEMATEL to Explore the Decisive Factors of the Auto Lighting Aftermarket Industry in Taiwan. Mathematics 2020, 8, 1187. [Google Scholar] [CrossRef]
- Boutkhoum, O.; Hanine, M.; Nabil, M.; El Barakaz, F.; Lee, E.; Rustam, F.; Ashraf, I. Analysis and Evaluation of Barriers Influencing Blockchain Implementation in Moroccan Sustainable Supply Chain Management: An Integrated IFAHP-DEMATEL Framework. Mathematics 2021, 9, 1601. [Google Scholar] [CrossRef]
- Si, S.-L.; You, X.-Y.; Liu, H.-C.; Zhang, P. DEMATEL Technique: A Systematic Review of the State-of-the-Art Literature on Methodologies and Applications. Math. Probl. Eng. 2018, 2018, 3696457. [Google Scholar] [CrossRef] [Green Version]
- Manafzadeh, E.; Ramezani, A. Identifying and prioritizing the effect of marketing mix from the customer’s perspective (4C) on the competitiveness of insurance companies using DEMATEL technique: A case study of Tehran Insurance Companies. Mark. Brand. Res. 2016, 3, 86–96. [Google Scholar] [CrossRef] [Green Version]
- Lee, Y.-C.; Hsieh, Y.-F.; Guo, Y.-B. Construct DTPB model by using DEMATEL: A study of a university library website. Program Electron. Libr. Inf. Syst. 2013, 47, 155–169. [Google Scholar] [CrossRef]
- Shao, J.; Taisch, M.; Ortega-Mier, M. A grey-DEcision-MAking Trial and Evaluation Laboratory (DEMATEL) analysis on the barriers between environmentally friendly products and consumers: Practitioners’ viewpoints on the European automobile industry. J. Clean. Prod. 2016, 112, 3185–3194. [Google Scholar] [CrossRef]
- Devadoss, A.V.; Felix, A. A Fuzzy DEMATEL approach to study cause and effect relationship of youth violence. Int. J. Comput. Algorithm 2013, 2, 363–372. [Google Scholar]
- Lin, R.-J. Using fuzzy DEMATEL to evaluate the green supply chain management practices. J. Clean. Prod. 2013, 40, 32–39. [Google Scholar] [CrossRef]
- Wu, W.-W. Choosing knowledge management strategies by using a combined ANP and DEMATEL approach. Expert Syst. Appl. 2008, 35, 828–835. [Google Scholar] [CrossRef]
- Skinner, W. Manufacturing-missing link in corporate strategy. Harv. Bus. Rev. 1969. [Google Scholar]
- Boyer, K.K.; Lewis, M.W. Competitive priorities: Investigating the need for trade-offs in operations strategy. Prod. Oper. Manag. 2002, 11, 9–20. [Google Scholar] [CrossRef]
- Chen, C.; Liu, Y.; Kumar, M.; Qin, J.; Ren, Y. Energy consumption modelling using deep learning embedded semi-supervised learning. Comput. Ind. Eng. 2019, 135, 757–765. [Google Scholar] [CrossRef]
- Abdullah, F.M.; Saleh, M.; Al-Ahmari, A.M.; Anwar, S. The Impact of Industry 4.0 Technologies on Manufacturing Strategies: Proposition of Technology-Integrated Selection. IEEE Access 2022, 10, 21574–21583. [Google Scholar] [CrossRef]
- Stoyanov, S.; Ahsan, M.; Bailey, C.; Wotherspoon, T.; Hunt, C. Predictive analytics methodology for smart qualification testing of electronic components. J. Intell. Manuf. 2019, 30, 1497–1514. [Google Scholar] [CrossRef] [Green Version]
- Castellano, D.; Gallo, M.; Grassi, A.; Santillo, L.C. Batching decisions in multi-item production systems with learning effect. Comput. Ind. Eng. 2019, 131, 578–591. [Google Scholar] [CrossRef]
- Youssef, M.A.; Youssef, E.M. The synergisitic impact of time–based technologies on manufacturing competitive priorities. Int. J. Technol. Manag. 2015, 67, 245–268. [Google Scholar] [CrossRef]
- Ward, P.T.; Duray, R. Manufacturing strategy in context: Environment, competitive strategy and manufacturing strategy. J. Oper. Manag. 2000, 18, 123–138. [Google Scholar] [CrossRef]
- Kucukoglu, I.; Atici-Ulusu, H.; Gunduz, T.; Tokcalar, O. Application of the artificial neural network method to detect defective assembling processes by using a wearable technology. J. Manuf. Syst. 2018, 49, 163–171. [Google Scholar] [CrossRef]
- Petrillo, A.; De Felice, F.; Zomparelli, F. Performance measurement for world-class manufacturing: A model for the Italian automotive industry. Total Qual. Manag. Bus. Excel. 2019, 30, 908–935. [Google Scholar] [CrossRef]
- Alqahtani, A.Y.; Gupta, S.M.; Nakashima, K. Warranty and maintenance analysis of sensor embedded products using internet of things in industry 4.0. Int. J. Prod. Econ. 2019, 208, 483–499. [Google Scholar] [CrossRef]
- Rajput, S.; Singh, S.P. Industry 4.0—Challenges to implement circular economy. Benchmarking Int. J. 2019, 28, 1717–1739. [Google Scholar] [CrossRef]
- Krause, D.R.; Pagell, M.; Curkovic, S. Toward a measure of competitive priorities for purchasing. J. Oper. Manag. 2001, 19, 497–512. [Google Scholar] [CrossRef]
- Salam, M.A. Analyzing manufacturing strategies and Industry 4.0 supplier performance relationships from a resource-based perspective. Benchmarking Int. J. 2019, 28, 1697–1716. [Google Scholar] [CrossRef]
- Leong, G.K.; Snyder, D.L.; Ward, P.T. Research in the process and content of manufacturing strategy. Omega 1990, 18, 109–122. [Google Scholar] [CrossRef]
- Delbrügger, T.; Meißner, M.; Wirtz, A.; Biermann, D.; Myrzik, J.; Rossmann, J.; Wiederkehr, P. Multi-level simulation concept for multidisciplinary analysis and optimization of production systems. Int. J. Adv. Manuf. Technol. 2019, 103, 3993–4012. [Google Scholar] [CrossRef]
- Oh, J.; Jeong, B. Tactical supply planning in smart manufacturing supply chain. Robot. Comput. Manuf. 2019, 55, 217–233. [Google Scholar] [CrossRef]
- Kamble, S.S.; Gunasekaran, A.; Ghadge, A.; Raut, R. A performance measurement system for industry 4.0 enabled smart manufacturing system in SMMEs-A review and empirical investigation. Int. J. Prod. Econ. 2020, 229, 107853. [Google Scholar] [CrossRef]
- Dziallas, M.; Blind, K. Innovation indicators throughout the innovation process: An extensive literature analysis. Technovation 2019, 80–81, 3–29. [Google Scholar] [CrossRef]
- Kilic, K.; Ulusoy, G.; Gunday, G.; Alpkan, L. Innovativeness, operations priorities and corporate performance: An analysis based on a taxonomy of innovativeness. J. Eng. Technol. Manag. 2015, 35, 115–133. [Google Scholar] [CrossRef] [Green Version]
- Tortorella, G.L.; Pradhan, N.; Macias de Anda, E.; Trevino Martinez, S.; Sawhney, R.; Kumar, M. Designing lean value streams in the fourth industrial revolution era: Proposition of technology-integrated guidelines. Int. J. Prod. Res. 2020, 58, 5020–5033. [Google Scholar] [CrossRef]
- Baker, J.; Lovell, K.; Harris, N. How expert are the experts? An exploration of the concept of ‘expert’ within Delphi panel techniques. Nurse Res. 2006, 14, 59–70. [Google Scholar] [CrossRef] [Green Version]
- Tortorella, G.L.; Fettermann, D. Implementation of Industry 4.0 and lean production in Brazilian manufacturing companies. Int. J. Prod. Res. 2018, 56, 2975–2987. [Google Scholar] [CrossRef]
- Zadeh, L.A.; Klir, G.J.; Yuan, B. Fuzzy Sets, Fuzzy Logic, and Fuzzy Systems: Selected Papers; World Scientific: River Edge, NJ, USA, 1996; Volume 6. [Google Scholar]
- Ocampo, L.A.; Tan, T.A.G.; Sia, L.A. Using fuzzy DEMATEL in modeling the causal relationships of the antecedents of organizational citizenship behavior (OCB) in the hospitality industry: A case study in the Philippines. J. Hosp. Tour. Manag. 2018, 34, 11–29. [Google Scholar] [CrossRef]
- Tsai, S.-B.; Chien, M.-F.; Xue, Y.; Li, L.; Jiang, X.; Chen, Q.; Zhou, J.; Wang, L. Using the Fuzzy DEMATEL to Determine Environmental Performance: A Case of Printed Circuit Board Industry in Taiwan. PLoS ONE 2015, 10, e0129153. [Google Scholar] [CrossRef] [PubMed]
- Muhammad, M.N.; Cavus, N. Fuzzy DEMATEL method for identifying LMS evaluation criteria. Procedia Comput. Sci. 2017, 120, 742–749. [Google Scholar] [CrossRef]
- Opricovic, S.; Tzeng, G.-H. Defuzzification within a multicriteria decision model. Int. J. Uncertain. Fuzziness Knowl.-Based Syst. 2003, 11, 635–652. [Google Scholar] [CrossRef]
- Zhou, F.; Wang, X.; Lim, M.K.; He, Y.; Li, L. Sustainable recycling partner selection using fuzzy DEMATEL-AEW-FVIKOR: A case study in small-and-medium enterprises (SMEs). J. Clean. Prod. 2018, 196, 489–504. [Google Scholar] [CrossRef]
- Chang, B.; Chang, C.-W.; Wu, C.-H. Fuzzy DEMATEL method for developing supplier selection criteria. Expert Syst. Appl. 2011, 38, 1850–1858. [Google Scholar] [CrossRef]
- Mohammadi, H.; Nouri, I.; Ehsanifar, M. Applying fuzzy DEMATEL method to analyze supplier selection criteria (Case study: WagonPars Company). Int. Res. J. Financ. Econ. 2013, 115, 76–86. [Google Scholar]
- Feng, C.; Ma, R. Identification of the factors that influence service innovation in manufacturing enterprises by using the fuzzy DEMATEL method. J. Clean. Prod. 2020, 253, 120002. [Google Scholar] [CrossRef]
- Abbasi, M.; Hosnavi, R.; Tabrizi, B. Application of Fuzzy DEMATEL in Risks Evaluation of Knowledge-Based Networks. J. Optim. 2013, 2013, 913467. [Google Scholar] [CrossRef]
- Vinodh, S.; Devadasan, S.; Vasudeva Reddy, B.; Ravichand, K. Agility index measurement using multi-grade fuzzy approach integrated in a 20 criteria agile model. Int. J. Prod. Res. 2010, 48, 7159–7176. [Google Scholar] [CrossRef]
- Bayazit, O. Use of AHP in decision-making for flexible manufacturing systems. J. Manuf. Technol. Manag. 2005, 16, 808–819. [Google Scholar] [CrossRef] [Green Version]
- Qi, Y.; Mao, Z.; Zhang, M.; Guo, H. Manufacturing practices and servitization: The role of mass customization and product innovation capabilities. Int. J. Prod. Econ. 2020, 228, 107747. [Google Scholar] [CrossRef]
- Bollard, A.; Larrea, E.; Singla, A.; Sood, R.J. The next-generation operating model for the digital world. McKinsey Digit. 2017, 1–8. [Google Scholar]
- Wang, J.; Cao, D.-B. Relationships between two approaches for planning manufacturing strategy: A strategic approach and a paradigmatic approach. Int. J. Prod. Econ. 2008, 115, 349–361. [Google Scholar] [CrossRef]
- Genc, T.S.; De Giovanni, P. Closed-loop supply chain games with innovation-led lean programs and sustainability. Int. J. Prod. Econ. 2020, 219, 440–456. [Google Scholar] [CrossRef]
- Sarmiento, R.; Byrne, M.; Contreras, L.R.; Rich, N. Delivery reliability, manufacturing capabilities and new models of manufacturing efficiency. J. Manuf. Technol. Manag. 2007, 18, 367–386. [Google Scholar] [CrossRef]
- Lin, Y.; Ma, S.; Zhou, L. Manufacturing strategies for time based competitive advantages. Ind. Manag. Data Syst. 2012, 112, 729–747. [Google Scholar] [CrossRef]
- Köksal, M.H.; Özgül, E. The export competitive advantages of Turkish manufacturing companies. Mark. Intell. Plan. 2010, 28, 206–222. [Google Scholar] [CrossRef]
- Wang, J.; Wu, H.; Chen, Y. Made in China 2025 and manufacturing strategy decisions with reverse QFD. Int. J. Prod. Econ. 2020, 224, 107539. [Google Scholar] [CrossRef]


| Outputs | Factors Names (Basic Elements) | Description | Rep. |
|---|---|---|---|
| Cost (C) | Cost per unit produced | What a company spends on producing every unit of the product it sells. | C1 |
| Operating cost | Costs associated with running a business or using machines, components, or facilities to prepare a product. | C2 | |
| Unit material cost | The cost of materials used to manufacture a product or perform a service. | C3 | |
| Employee training cost | The cost of training includes both the materials and the time spent training employees. | C4 | |
| Unit overhead cost | It refers to all of a company’s direct and indirect operating expenses. | C5 | |
| Quality (Q) | Defective products | The entire product/service does not meet the specified criterion. When a product or service is found to have one or more defects, the defect is labeled (s) | C6 |
| Scrap rate | Some failed materials cannot be repaired or restored and must be discarded. | C7 | |
| Number of customer complaints | A customer complaint is “a consumer’s expression of dissatisfaction to a responsible party”. | C8 | |
| Customer satisfaction | An indicator measures how satisfied customers are with a company’s products, services, and capabilities. | C9 | |
| Warranty claims | A company promises to repair or replace a defective product free if you discover it within a certain period. | C10 | |
| Delivery (D) | On-time delivery | An indicator of how often deliveries and finished products are produced on time. | C11 |
| Speed delivery | Delivered on time or earlier than expected to the consumer. | C12 | |
| Average lateness | The average time between ordering and the due delivery date. | C13 | |
| Inventory accuracy | It is the significant difference between the amount and type of inventory recorded or what is supposed to be ready for delivery. | C14 | |
| Order entry time | A way of keeping order times in a company’s system in order to view, modify, and/or execute them on a specific date. | C15 | |
| Flexibility (F) | Product mix flexibility | The ability to manufacture a large number of different items or variants with minimal changeover costs. | C16 |
| Process flexibility | The ability of a manufacturing system to produce multiple parts at once. | C17 | |
| Volume flexibility | It is defined as an organization’s ability to change the volume of its operations in response to changing economic conditions. | C18 | |
| Machine flexibility | The system’s ability to produce new products and change the order of operations efficiently and effectively. | C19 | |
| Performance (P) | Number of standard features | Several features or characteristics of anything are interesting or important for the product. | C20 |
| Number of advanced features | The new and upgraded features add value to your customers. | C21 | |
| Product resale price | The manufacturer sets a brand’s resale price, and retailers cannot lower it. | C22 | |
| Number of engineering changes | It is the number of engineering changes made to a product to improve performance. | C23 | |
| Meantime between failures | Measures how long equipment runs between breakdowns or stops. | C24 | |
| Innovativeness (I) | New products introduced each year | The number of products introduced each year | C25 |
| Lead time to design new products | It describes the time it takes to design, develop, and manufacture a new product. | C26 | |
| Existing-product Improvement | Adding benefits to an existing product, either for new or existing customers. | C27 | |
| Number of engineering change orders per year | A document that details a new product’s design or suggests changes to an existing product. | C28 | |
| Level of R&D investment | Investing in R&D develops various solutions to satisfy customer expectations. | C29 |
| Linguistic Terms | Symbol | Corresponding Triangular Fuzzy Numbers (TFNs) |
|---|---|---|
| No influence | NO | (0,0,0.25) |
| Very low influence | VL | (0,0.25,0.5) |
| Low influence | L | (0.25,0.5,0.75) |
| High influence | H | (0.5,0.75,1) |
| Very high influence | VH | (0.75,1,1) |
| Elements | C1 | C2 | C3 | C4 | C5 | C6 | C7 | C8 | C9 | C10 | C11 | C12 | C13 | C14 | C15 | C16 | C17 | C18 | C19 | C20 | C21 | C22 | C23 | C24 | C25 | C26 | C27 | C28 | C29 |
|---|---|---|---|---|---|---|---|---|---|---|---|---|---|---|---|---|---|---|---|---|---|---|---|---|---|---|---|---|---|
| C1 | H | H | L | H | H | L | VH | H | VH | H | H | L | H | VL | L | L | H | L | H | H | L | H | H | VH | H | H | L | L | |
| C2 | VH | NO | H | H | VH | H | H | H | H | L | L | VL | NO | VL | L | H | L | H | H | H | H | H | VL | H | L | L | L | L | |
| C3 | VH | L | L | L | VL | VL | H | VH | H | NO | NO | NO | VL | VL | L | VL | L | NO | NO | NO | H | L | NO | L | VL | L | VL | L | |
| C4 | L | H | NO | NO | L | L | L | H | L | VL | VL | VL | NO | NO | VL | L | NO | L | L | H | L | L | NO | L | H | H | L | H | |
| C5 | H | H | NO | H | L | L | VL | L | L | VL | L | VL | NO | NO | L | H | L | VL | H | VH | L | L | H | L | L | H | L | L | |
| C6 | H | VL | NO | H | L | VH | VH | VH | VH | NO | VL | NO | VL | VL | NO | VL | NO | NO | NO | NO | H | H | VH | NO | VL | VL | VL | VH | |
| C7 | VH | H | L | H | NO | VH | VH | H | H | VH | VH | H | H | L | VL | VL | VL | VL | L | VL | H | H | L | H | NO | H | H | VH | |
| C8 | L | L | VL | H | L | H | L | VH | L | L | H | VL | VL | VL | L | NO | VL | VL | VL | NO | VL | VH | NO | L | L | VH | VH | H | |
| C9 | L | NO | NO | VL | VL | VL | NO | VH | H | VL | NO | NO | VL | VL | L | L | L | L | VL | L | H | H | H | VL | NO | VH | H | VH | |
| C10 | VH | H | H | H | H | H | L | H | H | NO | NO | NO | NO | NO | NO | NO | NO | VL | NO | L | NO | VH | NO | NO | L | H | H | ||
| C11 | VL | NO | NO | L | L | NO | NO | VH | VH | NO | VH | VH | L | H | H | H | H | H | VL | NO | L | NO | NO | VL | NO | NO | NO | NO | |
| C12 | L | L | NO | VL | L | NO | NO | VH | VH | NO | VH | VH | L | H | NO | VL | NO | NO | NO | NO | NO | NO | NO | VL | NO | NO | NO | L | |
| C13 | VL | VL | NO | NO | NO | NO | NO | VH | VH | NO | VH | H | L | H | VL | NO | NO | VL | NO | NO | NO | NO | NO | NO | NO | NO | NO | VL | |
| C14 | H | L | VL | NO | VL | NO | NO | H | H | NO | VL | H | H | VL | NO | L | L | L | NO | NO | NO | NO | NO | NO | NO | NO | NO | NO | |
| C15 | L | L | L | L | NO | NO | NO | VL | NO | VL | VH | VH | H | VL | NO | NO | NO | NO | VL | NO | NO | NO | NO | NO | NO | NO | VL | ||
| C16 | L | H | NO | H | VH | VL | VL | NO | H | NO | NO | NO | NO | VL | NO | VH | VH | VH | H | L | NO | VL | NO | VL | H | NO | NO | H | |
| C17 | L | H | NO | H | VH | VL | VL | NO | H | NO | VL | NO | NO | NO | NO | H | VH | VH | H | VH | VL | VL | NO | NO | H | L | NO | L | |
| C18 | VL | H | NO | L | H | VL | VL | NO | VH | NO | NO | VL | VL | VL | NO | H | VH | VH | L | L | H | NO | NO | L | NO | NO | VL | VL | |
| C19 | VL | H | NO | VH | VH | VL | VL | NO | H | NO | VL | VL | VL | NO | NO | VH | VH | L | H | H | NO | NO | VL | VL | VL | L | VL | L | |
| C20 | H | H | NO | H | H | L | L | VL | H | NO | VL | L | L | NO | NO | L | H | NO | H | VL | NO | VL | VL | NO | VL | L | VL | VL | |
| C21 | VH | VH | NO | VH | VH | VL | VL | NO | VH | VH | VL | VL | L | VL | NO | H | H | VL | H | VL | VH | VL | VL | L | L | L | NO | VH | |
| C22 | L | NO | NO | VL | NO | NO | NO | NO | L | L | NO | NO | VL | VL | NO | L | L | H | VL | H | VH | L | H | VL | NO | H | VL | VL | |
| C23 | H | L | NO | H | VL | H | L | L | H | L | VL | NO | VL | NO | VL | VL | VL | VL | VL | L | L | NO | L | NO | NO | L | NO | H | |
| C24 | H | L | NO | VL | NO | H | H | VH | VH | VH | L | L | H | H | L | VL | VL | NO | VL | NO | VL | L | VL | NO | VL | NO | VL | H | |
| C25 | NO | H | VL | H | H | H | L | H | VH | H | NO | NO | L | VL | NO | VH | H | L | H | VL | L | NO | H | H | H | L | VH | VH | |
| C26 | NO | NO | NO | NO | L | L | H | VL | L | L | VL | VL | VH | L | VL | VL | L | VL | L | H | H | VL | VL | NO | L | NO | VL | L | |
| C27 | L | L | NO | VH | H | VL | VL | VL | VH | H | L | L | VL | NO | NO | L | L | NO | L | L | H | L | L | L | H | NO | H | VH | |
| C28 | H | H | NO | H | H | L | L | L | H | L | L | VL | VL | NO | NO | VL | VL | NO | NO | VL | L | VL | VL | L | L | L | H | H | |
| C29 | H | VL | VL | VH | VH | H | VL | H | VH | L | NO | NO | VL | VL | NO | L | H | L | L | H | VH | L | H | L | H | L | H | H |
| Elements | C1 | C2 | C3 | C4 | C5 | C6 | C7 | C8 | C9 | C10 | C11 | C12 | C13 | C14 | C15 | C16 | C17 | C18 | C19 | C20 | C21 | C22 | C23 | C24 | C25 | C26 | C27 | C28 | C29 |
|---|---|---|---|---|---|---|---|---|---|---|---|---|---|---|---|---|---|---|---|---|---|---|---|---|---|---|---|---|---|
| C1 | 0.00 | 0.73 | 0.77 | 0.54 | 0.77 | 0.77 | 0.54 | 0.99 | 0.77 | 0.99 | 0.77 | 0.77 | 0.54 | 0.77 | 0.29 | 0.54 | 0.54 | 0.77 | 0.54 | 0.77 | 0.77 | 0.54 | 0.77 | 0.77 | 0.99 | 0.77 | 0.77 | 0.54 | 0.54 |
| C2 | 0.99 | 0.00 | 0.03 | 0.77 | 0.77 | 0.99 | 0.77 | 0.77 | 0.77 | 0.77 | 0.54 | 0.54 | 0.29 | 0.03 | 0.29 | 0.54 | 0.77 | 0.54 | 0.77 | 0.77 | 0.77 | 0.77 | 0.77 | 0.29 | 0.77 | 0.54 | 0.54 | 0.54 | 0.54 |
| C3 | 0.99 | 0.47 | 0.00 | 0.54 | 0.54 | 0.29 | 0.29 | 0.77 | 0.99 | 0.77 | 0.03 | 0.03 | 0.03 | 0.29 | 0.29 | 0.54 | 0.29 | 0.54 | 0.03 | 0.03 | 0.03 | 0.77 | 0.54 | 0.03 | 0.54 | 0.29 | 0.54 | 0.29 | 0.54 |
| C4 | 0.54 | 0.73 | 0.03 | 0.00 | 0.03 | 0.54 | 0.54 | 0.54 | 0.77 | 0.54 | 0.29 | 0.29 | 0.29 | 0.03 | 0.03 | 0.29 | 0.54 | 0.03 | 0.54 | 0.54 | 0.77 | 0.54 | 0.54 | 0.03 | 0.54 | 0.77 | 0.77 | 0.54 | 0.77 |
| C5 | 0.77 | 0.73 | 0.03 | 0.77 | 0.00 | 0.54 | 0.54 | 0.29 | 0.54 | 0.54 | 0.29 | 0.54 | 0.29 | 0.03 | 0.03 | 0.54 | 0.77 | 0.54 | 0.29 | 0.77 | 0.99 | 0.54 | 0.54 | 0.77 | 0.54 | 0.54 | 0.77 | 0.54 | 0.54 |
| C6 | 0.77 | 0.22 | 0.03 | 0.77 | 0.54 | 0.00 | 0.99 | 0.99 | 0.99 | 0.99 | 0.03 | 0.29 | 0.03 | 0.29 | 0.29 | 0.03 | 0.29 | 0.03 | 0.03 | 0.03 | 0.03 | 0.77 | 0.77 | 0.99 | 0.03 | 0.29 | 0.29 | 0.29 | 0.99 |
| C7 | 0.99 | 0.73 | 0.54 | 0.77 | 0.03 | 0.99 | 0.00 | 0.99 | 0.77 | 0.77 | 0.99 | 0.99 | 0.77 | 0.77 | 0.54 | 0.29 | 0.29 | 0.29 | 0.29 | 0.54 | 0.29 | 0.77 | 0.77 | 0.54 | 0.77 | 0.03 | 0.77 | 0.77 | 0.99 |
| C8 | 0.54 | 0.47 | 0.29 | 0.77 | 0.54 | 0.77 | 0.54 | 0.00 | 0.99 | 0.54 | 0.54 | 0.77 | 0.29 | 0.29 | 0.29 | 0.54 | 0.03 | 0.29 | 0.29 | 0.29 | 0.03 | 0.29 | 0.99 | 0.03 | 0.54 | 0.54 | 0.99 | 0.99 | 0.77 |
| C9 | 0.54 | 0.00 | 0.03 | 0.29 | 0.29 | 0.29 | 0.03 | 0.99 | 0.00 | 0.77 | 0.29 | 0.03 | 0.03 | 0.29 | 0.29 | 0.54 | 0.54 | 0.54 | 0.54 | 0.29 | 0.54 | 0.77 | 0.77 | 0.77 | 0.29 | 0.03 | 0.99 | 0.77 | 0.99 |
| C10 | 0.99 | 0.73 | 0.77 | 0.77 | 0.77 | 0.77 | 0.54 | 0.77 | 0.77 | 0.00 | 0.03 | 0.03 | 0.03 | 0.03 | 0.03 | 0.03 | 0.03 | 0.03 | 0.00 | 0.29 | 0.03 | 0.54 | 0.03 | 0.99 | 0.03 | 0.03 | 0.54 | 0.77 | 0.77 |
| C11 | 0.29 | 0.00 | 0.03 | 0.54 | 0.54 | 0.03 | 0.03 | 0.99 | 0.99 | 0.03 | 0.00 | 0.99 | 0.99 | 0.54 | 0.77 | 0.77 | 0.77 | 0.77 | 0.77 | 0.29 | 0.03 | 0.54 | 0.03 | 0.03 | 0.29 | 0.03 | 0.03 | 0.03 | 0.03 |
| C12 | 0.54 | 0.47 | 0.03 | 0.29 | 0.54 | 0.03 | 0.03 | 0.99 | 0.99 | 0.03 | 0.99 | 0.00 | 0.99 | 0.54 | 0.77 | 0.03 | 0.29 | 0.03 | 0.03 | 0.03 | 0.03 | 0.03 | 0.03 | 0.03 | 0.29 | 0.03 | 0.03 | 0.03 | 0.54 |
| C13 | 0.29 | 0.22 | 0.03 | 0.00 | 0.03 | 0.03 | 0.03 | 0.99 | 0.99 | 0.03 | 0.99 | 0.77 | 0.00 | 0.54 | 0.77 | 0.29 | 0.03 | 0.03 | 0.29 | 0.03 | 0.03 | 0.03 | 0.03 | 0.03 | 0.03 | 0.03 | 0.03 | 0.03 | 0.29 |
| C14 | 0.77 | 0.47 | 0.29 | 0.00 | 0.29 | 0.03 | 0.03 | 0.77 | 0.77 | 0.03 | 0.29 | 0.77 | 0.77 | 0.00 | 0.29 | 0.03 | 0.54 | 0.54 | 0.54 | 0.03 | 0.03 | 0.03 | 0.03 | 0.03 | 0.03 | 0.03 | 0.03 | 0.03 | 0.03 |
| C15 | 0.54 | 0.47 | 0.54 | 0.54 | 0.03 | 0.03 | 0.03 | 0.29 | 0.03 | 0.29 | 0.99 | 0.99 | 0.77 | 0.29 | 0.00 | 0.00 | 0.03 | 0.03 | 0.03 | 0.03 | 0.29 | 0.03 | 0.03 | 0.03 | 0.03 | 0.03 | 0.03 | 0.03 | 0.29 |
| C16 | 0.54 | 0.73 | 0.03 | 0.77 | 0.99 | 0.29 | 0.29 | 0.03 | 0.77 | 0.03 | 0.03 | 0.03 | 0.03 | 0.29 | 0.03 | 0.00 | 0.99 | 0.99 | 0.99 | 0.77 | 0.54 | 0.03 | 0.29 | 0.03 | 0.29 | 0.77 | 0.03 | 0.03 | 0.77 |
| C17 | 0.54 | 0.73 | 0.03 | 0.77 | 0.99 | 0.29 | 0.29 | 0.03 | 0.77 | 0.03 | 0.29 | 0.03 | 0.03 | 0.03 | 0.03 | 0.77 | 0.00 | 0.99 | 0.99 | 0.77 | 0.99 | 0.29 | 0.29 | 0.03 | 0.03 | 0.77 | 0.54 | 0.03 | 0.54 |
| C18 | 0.29 | 0.73 | 0.03 | 0.54 | 0.77 | 0.29 | 0.29 | 0.03 | 0.99 | 0.03 | 0.03 | 0.29 | 0.29 | 0.29 | 0.03 | 0.77 | 0.99 | 0.00 | 0.99 | 0.54 | 0.54 | 0.77 | 0.03 | 0.03 | 0.54 | 0.03 | 0.03 | 0.29 | 0.29 |
| C19 | 0.29 | 0.73 | 0.03 | 0.99 | 0.99 | 0.29 | 0.29 | 0.03 | 0.77 | 0.03 | 0.29 | 0.29 | 0.29 | 0.03 | 0.03 | 0.99 | 0.99 | 0.54 | 0.00 | 0.77 | 0.77 | 0.03 | 0.03 | 0.29 | 0.29 | 0.29 | 0.54 | 0.29 | 0.54 |
| C20 | 0.77 | 0.73 | 0.03 | 0.77 | 0.77 | 0.54 | 0.54 | 0.29 | 0.77 | 0.03 | 0.29 | 0.54 | 0.54 | 0.03 | 0.03 | 0.54 | 0.77 | 0.03 | 0.77 | 0.00 | 0.29 | 0.03 | 0.29 | 0.29 | 0.03 | 0.29 | 0.54 | 0.29 | 0.29 |
| C21 | 0.99 | 0.99 | 0.03 | 0.99 | 0.99 | 0.29 | 0.29 | 0.03 | 0.99 | 0.99 | 0.29 | 0.29 | 0.54 | 0.29 | 0.03 | 0.77 | 0.77 | 0.29 | 0.77 | 0.29 | 0.00 | 0.99 | 0.29 | 0.29 | 0.54 | 0.54 | 0.54 | 0.03 | 0.99 |
| C22 | 0.54 | 0.00 | 0.03 | 0.29 | 0.03 | 0.03 | 0.03 | 0.03 | 0.54 | 0.54 | 0.03 | 0.03 | 0.29 | 0.29 | 0.03 | 0.54 | 0.54 | 0.77 | 0.29 | 0.77 | 0.99 | 0.00 | 0.54 | 0.77 | 0.29 | 0.03 | 0.77 | 0.29 | 0.29 |
| C23 | 0.77 | 0.47 | 0.03 | 0.77 | 0.29 | 0.77 | 0.54 | 0.54 | 0.77 | 0.54 | 0.29 | 0.03 | 0.29 | 0.03 | 0.29 | 0.29 | 0.29 | 0.29 | 0.29 | 0.54 | 0.54 | 0.03 | 0.00 | 0.54 | 0.03 | 0.03 | 0.54 | 0.03 | 0.77 |
| C24 | 0.77 | 0.47 | 0.03 | 0.29 | 0.03 | 0.77 | 0.77 | 0.99 | 0.99 | 0.99 | 0.54 | 0.54 | 0.77 | 0.77 | 0.54 | 0.29 | 0.29 | 0.03 | 0.29 | 0.03 | 0.29 | 0.54 | 0.29 | 0.00 | 0.03 | 0.29 | 0.03 | 0.29 | 0.77 |
| C25 | 0.03 | 0.73 | 0.29 | 0.77 | 0.77 | 0.77 | 0.54 | 0.77 | 0.99 | 0.77 | 0.03 | 0.03 | 0.54 | 0.29 | 0.03 | 0.99 | 0.77 | 0.54 | 0.77 | 0.29 | 0.54 | 0.03 | 0.77 | 0.77 | 0.00 | 0.77 | 0.54 | 0.99 | 0.99 |
| C26 | 0.03 | 0.00 | 0.03 | 0.00 | 0.54 | 0.54 | 0.77 | 0.29 | 0.54 | 0.54 | 0.29 | 0.29 | 0.99 | 0.54 | 0.29 | 0.29 | 0.54 | 0.29 | 0.54 | 0.77 | 0.77 | 0.29 | 0.29 | 0.03 | 0.54 | 0.00 | 0.03 | 0.29 | 0.54 |
| C27 | 0.54 | 0.47 | 0.03 | 0.99 | 0.77 | 0.29 | 0.29 | 0.29 | 0.99 | 0.77 | 0.54 | 0.54 | 0.29 | 0.03 | 0.03 | 0.54 | 0.54 | 0.03 | 0.54 | 0.54 | 0.77 | 0.54 | 0.54 | 0.54 | 0.77 | 0.03 | 0.00 | 0.77 | 0.99 |
| C28 | 0.77 | 0.73 | 0.03 | 0.77 | 0.77 | 0.54 | 0.54 | 0.54 | 0.77 | 0.54 | 0.54 | 0.29 | 0.29 | 0.03 | 0.03 | 0.29 | 0.29 | 0.03 | 0.03 | 0.29 | 0.54 | 0.29 | 0.29 | 0.54 | 0.54 | 0.54 | 0.77 | 0.00 | 0.77 |
| C29 | 0.77 | 0.22 | 0.29 | 0.99 | 0.99 | 0.77 | 0.29 | 0.77 | 0.99 | 0.54 | 0.03 | 0.03 | 0.29 | 0.29 | 0.03 | 0.54 | 0.77 | 0.16 | 0.54 | 0.77 | 0.99 | 0.54 | 0.77 | 0.54 | 0.77 | 0.54 | 0.77 | 0.77 | 0.00 |
| Elements | C1 | C2 | C3 | C4 | C5 | C6 | C7 | C8 | C9 | C10 | C11 | C12 | C13 | C14 | C15 | C16 | C17 | C18 | C19 | C20 | C21 | C22 | C23 | C24 | C25 | C26 | C27 | C28 | C29 |
|---|---|---|---|---|---|---|---|---|---|---|---|---|---|---|---|---|---|---|---|---|---|---|---|---|---|---|---|---|---|
| C1 | 0.00 | 0.76 | 0.56 | 0.38 | 0.56 | 0.47 | 0.41 | 0.60 | 0.65 | 0.56 | 0.32 | 0.38 | 0.35 | 0.32 | 0.26 | 0.45 | 0.45 | 0.50 | 0.38 | 0.50 | 0.50 | 0.62 | 0.47 | 0.32 | 0.40 | 0.38 | 0.50 | 0.48 | 0.47 |
| C2 | 0.88 | 0.00 | 0.41 | 0.42 | 0.65 | 0.38 | 0.41 | 0.32 | 0.47 | 0.47 | 0.41 | 0.44 | 0.35 | 0.22 | 0.27 | 0.44 | 0.50 | 0.48 | 0.53 | 0.53 | 0.46 | 0.53 | 0.53 | 0.28 | 0.44 | 0.38 | 0.50 | 0.38 | 0.47 |
| C3 | 0.83 | 0.44 | 0.00 | 0.38 | 0.47 | 0.32 | 0.32 | 0.35 | 0.52 | 0.44 | 0.23 | 0.26 | 0.26 | 0.26 | 0.21 | 0.38 | 0.35 | 0.35 | 0.28 | 0.31 | 0.28 | 0.38 | 0.35 | 0.25 | 0.32 | 0.23 | 0.32 | 0.29 | 0.29 |
| C4 | 0.60 | 0.76 | 0.13 | 0.00 | 0.56 | 0.53 | 0.62 | 0.38 | 0.54 | 0.56 | 0.45 | 0.45 | 0.48 | 0.29 | 0.29 | 0.44 | 0.57 | 0.53 | 0.44 | 0.41 | 0.62 | 0.47 | 0.54 | 0.50 | 0.38 | 0.38 | 0.41 | 0.47 | 0.35 |
| C5 | 0.55 | 0.38 | 0.26 | 0.43 | 0.00 | 0.35 | 0.38 | 0.32 | 0.53 | 0.41 | 0.42 | 0.48 | 0.42 | 0.29 | 0.21 | 0.35 | 0.47 | 0.35 | 0.41 | 0.47 | 0.53 | 0.32 | 0.35 | 0.47 | 0.35 | 0.32 | 0.44 | 0.35 | 0.50 |
| C6 | 0.74 | 0.64 | 0.68 | 0.65 | 0.48 | 0.00 | 0.99 | 0.77 | 0.94 | 0.83 | 0.41 | 0.41 | 0.56 | 0.63 | 0.24 | 0.37 | 0.43 | 0.37 | 0.37 | 0.26 | 0.35 | 0.28 | 0.41 | 0.43 | 0.16 | 0.13 | 0.25 | 0.29 | 0.58 |
| C7 | 0.62 | 0.60 | 0.47 | 0.23 | 0.53 | 0.86 | 0.00 | 0.68 | 0.71 | 0.52 | 0.68 | 0.50 | 0.50 | 0.55 | 0.28 | 0.47 | 0.44 | 0.44 | 0.44 | 0.48 | 0.50 | 0.57 | 0.54 | 0.66 | 0.22 | 0.10 | 0.31 | 0.32 | 0.49 |
| C8 | 0.32 | 0.26 | 0.29 | 0.43 | 0.51 | 0.63 | 0.62 | 0.00 | 0.94 | 0.74 | 0.41 | 0.62 | 0.44 | 0.28 | 0.21 | 0.50 | 0.44 | 0.41 | 0.50 | 0.55 | 0.44 | 0.26 | 0.50 | 0.10 | 0.29 | 0.35 | 0.50 | 0.35 | 0.44 |
| C9 | 0.50 | 0.49 | 0.44 | 0.44 | 0.35 | 0.51 | 0.47 | 0.56 | 0.00 | 0.65 | 0.68 | 0.61 | 0.37 | 0.32 | 0.21 | 0.41 | 0.38 | 0.47 | 0.44 | 0.70 | 0.68 | 0.48 | 0.32 | 0.26 | 0.38 | 0.41 | 0.50 | 0.47 | 0.62 |
| C10 | 0.62 | 0.44 | 0.51 | 0.49 | 0.54 | 0.46 | 0.59 | 0.41 | 0.65 | 0.00 | 0.25 | 0.19 | 0.29 | 0.19 | 0.16 | 0.32 | 0.32 | 0.38 | 0.32 | 0.44 | 0.46 | 0.48 | 0.26 | 0.25 | 0.16 | 0.07 | 0.35 | 0.25 | 0.25 |
| C11 | 0.32 | 0.26 | 0.23 | 0.35 | 0.45 | 0.19 | 0.16 | 0.49 | 0.80 | 0.16 | 0.00 | 0.91 | 0.94 | 0.67 | 0.46 | 0.53 | 0.44 | 0.53 | 0.53 | 0.32 | 0.29 | 0.32 | 0.19 | 0.19 | 0.32 | 0.25 | 0.25 | 0.25 | 0.32 |
| C12 | 0.35 | 0.29 | 0.19 | 0.25 | 0.35 | 0.23 | 0.19 | 0.65 | 0.83 | 0.44 | 0.91 | 0.00 | 0.94 | 0.58 | 0.46 | 0.44 | 0.47 | 0.44 | 0.44 | 0.19 | 0.22 | 0.22 | 0.19 | 0.10 | 0.32 | 0.25 | 0.25 | 0.29 | 0.38 |
| C13 | 0.32 | 0.32 | 0.19 | 0.25 | 0.29 | 0.26 | 0.19 | 0.68 | 0.68 | 0.44 | 0.91 | 0.91 | 0.00 | 0.49 | 0.46 | 0.35 | 0.29 | 0.32 | 0.32 | 0.26 | 0.26 | 0.29 | 0.19 | 0.19 | 0.32 | 0.29 | 0.29 | 0.25 | 0.35 |
| C14 | 0.38 | 0.31 | 0.23 | 0.21 | 0.29 | 0.35 | 0.32 | 0.44 | 0.35 | 0.23 | 0.66 | 0.59 | 0.53 | 0.00 | 0.36 | 0.26 | 0.29 | 0.29 | 0.29 | 0.13 | 0.16 | 0.16 | 0.13 | 0.16 | 0.19 | 0.16 | 0.13 | 0.16 | 0.19 |
| C15 | 0.41 | 0.38 | 0.32 | 0.20 | 0.19 | 0.16 | 0.23 | 0.44 | 0.32 | 0.13 | 0.74 | 0.80 | 0.57 | 0.47 | 0.00 | 0.40 | 0.47 | 0.49 | 0.47 | 0.35 | 0.41 | 0.26 | 0.26 | 0.29 | 0.19 | 0.25 | 0.19 | 0.19 | 0.22 |
| C16 | 0.60 | 0.67 | 0.44 | 0.57 | 0.65 | 0.53 | 0.53 | 0.32 | 0.48 | 0.32 | 0.50 | 0.58 | 0.47 | 0.42 | 0.36 | 0.00 | 0.85 | 0.83 | 0.82 | 0.63 | 0.56 | 0.29 | 0.71 | 0.35 | 0.68 | 0.72 | 0.56 | 0.65 | 0.62 |
| C17 | 0.60 | 0.63 | 0.41 | 0.65 | 0.60 | 0.53 | 0.53 | 0.32 | 0.41 | 0.26 | 0.53 | 0.59 | 0.47 | 0.45 | 0.27 | 0.64 | 0.00 | 0.88 | 0.80 | 0.63 | 0.74 | 0.19 | 0.56 | 0.32 | 0.71 | 0.77 | 0.51 | 0.62 | 0.56 |
| C18 | 0.59 | 0.67 | 0.35 | 0.47 | 0.60 | 0.50 | 0.53 | 0.35 | 0.44 | 0.32 | 0.53 | 0.62 | 0.44 | 0.49 | 0.28 | 0.77 | 0.85 | 0.00 | 0.83 | 0.51 | 0.60 | 0.32 | 0.62 | 0.28 | 0.63 | 0.62 | 0.41 | 0.54 | 0.50 |
| C19 | 0.60 | 0.63 | 0.35 | 0.59 | 0.59 | 0.47 | 0.47 | 0.29 | 0.42 | 0.38 | 0.56 | 0.62 | 0.53 | 0.48 | 0.27 | 0.64 | 0.83 | 0.74 | 0.00 | 0.68 | 0.71 | 0.23 | 0.53 | 0.38 | 0.77 | 0.66 | 0.54 | 0.56 | 0.38 |
| C20 | 0.80 | 0.51 | 0.41 | 0.48 | 0.42 | 0.42 | 0.51 | 0.55 | 0.88 | 0.48 | 0.53 | 0.56 | 0.56 | 0.06 | 0.32 | 0.74 | 0.77 | 0.82 | 0.77 | 0.00 | 0.71 | 0.79 | 0.57 | 0.54 | 0.76 | 0.57 | 0.69 | 0.68 | 0.56 |
| C21 | 0.85 | 0.76 | 0.44 | 0.68 | 0.68 | 0.54 | 0.51 | 0.55 | 0.94 | 0.62 | 0.73 | 0.59 | 0.62 | 0.10 | 0.38 | 0.80 | 0.80 | 0.88 | 0.80 | 0.62 | 0.00 | 0.97 | 0.74 | 0.54 | 0.85 | 0.68 | 0.72 | 0.76 | 0.73 |
| C22 | 0.41 | 0.29 | 0.59 | 0.14 | 0.16 | 0.03 | 0.13 | 0.44 | 0.82 | 0.23 | 0.07 | 0.35 | 0.10 | 0.06 | 0.32 | 0.16 | 0.19 | 0.25 | 0.13 | 0.69 | 0.85 | 0.00 | 0.54 | 0.22 | 0.68 | 0.22 | 0.44 | 0.56 | 0.28 |
| C23 | 0.77 | 0.70 | 0.22 | 0.69 | 0.50 | 0.72 | 0.69 | 0.56 | 0.54 | 0.62 | 0.59 | 0.73 | 0.59 | 0.37 | 0.12 | 0.88 | 0.68 | 0.74 | 0.82 | 0.69 | 0.72 | 0.65 | 0.00 | 0.68 | 0.74 | 0.62 | 0.63 | 0.79 | 0.74 |
| C24 | 0.41 | 0.63 | 0.16 | 0.17 | 0.44 | 0.74 | 0.88 | 0.74 | 0.59 | 0.25 | 0.59 | 0.73 | 0.62 | 0.19 | 0.22 | 0.48 | 0.19 | 0.19 | 0.54 | 0.10 | 0.48 | 0.22 | 0.51 | 0.00 | 0.10 | 0.10 | 0.10 | 0.26 | 0.28 |
| C25 | 0.68 | 0.83 | 0.68 | 0.74 | 0.77 | 0.62 | 0.56 | 0.51 | 0.65 | 0.62 | 0.47 | 0.56 | 0.54 | 0.19 | 0.10 | 0.68 | 0.85 | 0.72 | 0.88 | 0.66 | 0.69 | 0.62 | 0.74 | 0.51 | 0.00 | 0.77 | 0.80 | 0.77 | 0.73 |
| C26 | 0.62 | 0.51 | 0.28 | 0.20 | 0.60 | 0.10 | 0.19 | 0.57 | 0.72 | 0.59 | 0.47 | 0.59 | 0.55 | 0.32 | 0.28 | 0.63 | 0.51 | 0.23 | 0.51 | 0.57 | 0.60 | 0.32 | 0.41 | 0.23 | 0.60 | 0.00 | 0.53 | 0.45 | 0.51 |
| C27 | 0.54 | 0.61 | 0.19 | 0.70 | 0.54 | 0.62 | 0.62 | 0.50 | 0.71 | 0.68 | 0.54 | 0.54 | 0.50 | 0.19 | 0.10 | 0.63 | 0.60 | 0.59 | 0.62 | 0.68 | 0.69 | 0.68 | 0.69 | 0.26 | 0.74 | 0.51 | 0.00 | 0.77 | 0.71 |
| C28 | 0.63 | 0.64 | 0.47 | 0.77 | 0.60 | 0.60 | 0.48 | 0.54 | 0.59 | 0.53 | 0.48 | 0.54 | 0.57 | 0.16 | 0.18 | 0.71 | 0.62 | 0.51 | 0.50 | 0.68 | 0.66 | 0.57 | 0.68 | 0.35 | 0.72 | 0.74 | 0.74 | 0.00 | 0.56 |
| C29 | 0.69 | 0.53 | 0.57 | 0.36 | 0.83 | 0.62 | 0.63 | 0.47 | 0.68 | 0.56 | 0.22 | 0.29 | 0.35 | 0.19 | 0.22 | 0.63 | 0.66 | 0.36 | 0.63 | 0.68 | 0.80 | 0.71 | 0.68 | 0.41 | 0.91 | 0.74 | 0.77 | 0.77 | 0.00 |
| Factor | Category | ||||
|---|---|---|---|---|---|
| C1 | 2.373(16) | 2.943(2) | 5.315(11) | −0.57(25) | Net effect |
| C2 | 2.312(18) | 2.72(5) | 5.032(14) | −0.409(21) | Net effect |
| C3 | 1.762(27) | 1.932(26) | 3.693(27) | −0.171(18) | Net effect |
| C4 | 2.406(14) | 2.278(23) | 4.684(19) | 0.129(12) | Net cause |
| C5 | 2.045(20) | 2.597(9) | 4.641(20) | −0.553(23) | Net effect |
| C6 | 2.415(13) | 2.329(22) | 4.743(17) | 0.086(15) | Net cause |
| C7 | 2.453(12) | 2.394(20) | 4.847(15) | 0.059(16) | Net cause |
| C8 | 2.267(19) | 2.498(14) | 4.764(16) | −0.232(19) | Net effect |
| C9 | 2.403(15) | 3.227(1) | 5.629(4) | −0.825(28) | Net effect |
| C10 | 1.844(24) | 2.406(18) | 4.249(24) | −0.563(24) | Net effect |
| C11 | 1.979(21) | 2.587(11) | 4.566(21) | −0.608(26) | Net effect |
| C12 | 1.925(23) | 2.778(3) | 4.702(18) | −0.854(29) | Net effect |
| C13 | 1.832(25) | 2.52(13) | 4.352(23) | −0.688(27) | Net effect |
| C14 | 1.401(29) | 1.696(28) | 3.096(29) | −0.296(20) | Net effect |
| C15 | 1.756(28) | 1.38(29) | 3.135(28) | 0.377(8) | Net cause |
| C16 | 2.911(8) | 2.649(8) | 5.56(6) | 0.263(9) | Net cause |
| C17 | 2.825(9) | 2.698(7) | 5.522(7) | 0.127(13) | Net cause |
| C18 | 2.712(11) | 2.593(10) | 5.304(12) | 0.119(14) | Net cause |
| C19 | 2.758(10) | 2.709(6) | 5.467(8) | 0.05(17) | Net cause |
| C20 | 3.049(4) | 2.531(12) | 5.58(5) | 0.518(7) | Net cause |
| C21 | 3.463(1) | 2.729(4) | 6.192(1) | 0.734(3) | Net cause |
| C22 | 1.793(26) | 2.246(24) | 4.039(25) | −0.453(22) | Net effect |
| C23 | 3.274(3) | 2.416(17) | 5.69(3) | 0.858(1) | Net cause |
| C24 | 1.966(22) | 1.743(27) | 3.709(26) | 0.223(10) | Net cause |
| C25 | 3.307(2) | 2.462(15) | 5.769(2) | 0.846(2) | Net cause |
| C26 | 2.333(17) | 2.171(25) | 4.504(22) | 0.162(11) | Net cause |
| C27 | 2.931(6) | 2.342(21) | 5.272(13) | 0.59(4) | Net cause |
| C28 | 2.927(7) | 2.396(19) | 5.323(10) | 0.532(6) | Net cause |
| C29 | 2.973(5) | 2.421(16) | 5.394(9) | 0.553(5) | Net cause |
Publisher’s Note: MDPI stays neutral with regard to jurisdictional claims in published maps and institutional affiliations. |
© 2022 by the authors. Licensee MDPI, Basel, Switzerland. This article is an open access article distributed under the terms and conditions of the Creative Commons Attribution (CC BY) license (https://creativecommons.org/licenses/by/4.0/).
Share and Cite
Abdullah, F.M.; Al-Ahmari, A.M.; Anwar, S. Exploring Key Decisive Factors in Manufacturing Strategies in the Adoption of Industry 4.0 by Using the Fuzzy DEMATEL Method. Processes 2022, 10, 987. https://0-doi-org.brum.beds.ac.uk/10.3390/pr10050987
Abdullah FM, Al-Ahmari AM, Anwar S. Exploring Key Decisive Factors in Manufacturing Strategies in the Adoption of Industry 4.0 by Using the Fuzzy DEMATEL Method. Processes. 2022; 10(5):987. https://0-doi-org.brum.beds.ac.uk/10.3390/pr10050987
Chicago/Turabian StyleAbdullah, Fawaz M., Abdulrahman M. Al-Ahmari, and Saqib Anwar. 2022. "Exploring Key Decisive Factors in Manufacturing Strategies in the Adoption of Industry 4.0 by Using the Fuzzy DEMATEL Method" Processes 10, no. 5: 987. https://0-doi-org.brum.beds.ac.uk/10.3390/pr10050987