Article

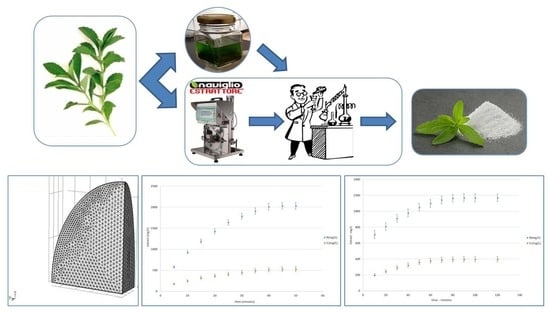
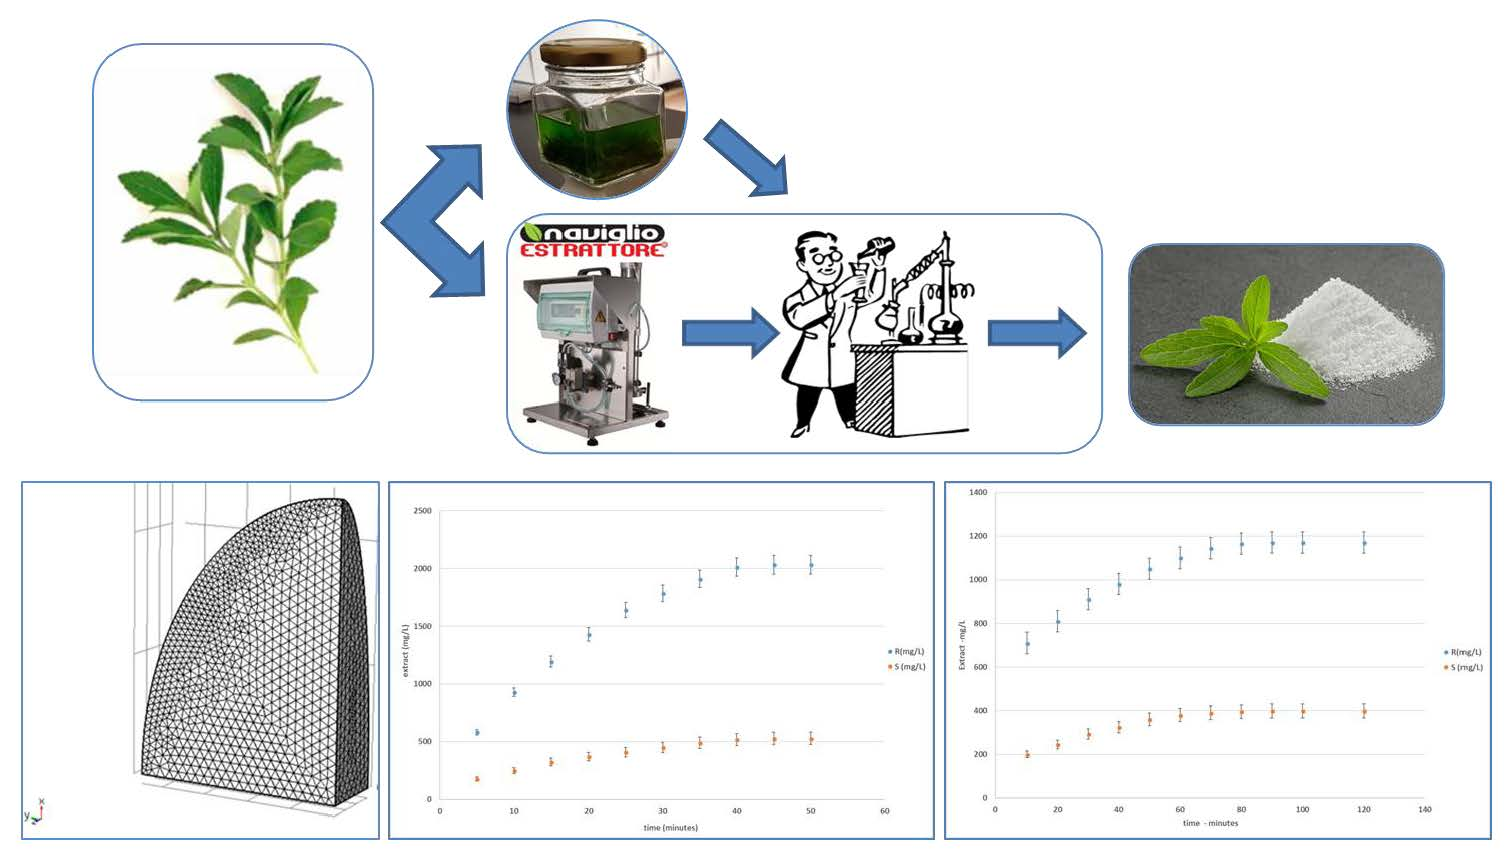
Comparison between Two Solid-Liquid Extraction Methods for the Recovery of Steviol Glycosides from Dried Stevia Leaves Applying a Numerical Approach

1
Department of Molecular Medicine and Medical Biotechnology, University of Naples Federico II, 80131 Naples, Italy
2
Department of Agriculture Science, University of Naples Federico II, 80055 Portici, Naples, Italy
3
Department of Chemical Sciences, University of Naples Federico II, 80126 Naples, Italy
*
Author to whom correspondence should be addressed.
Submission received: 11 June 2018 / Revised: 24 July 2018 / Accepted: 26 July 2018 / Published: 30 July 2018
(This article belongs to the Section Process Control and Monitoring)

Abstract

:

Featured Application

Data of numerical simulation of the rapid solid-liquid dynamic extraction (RSLDE) process of two steviol glycosides from stevia leaves will provide useful indications for further research to extend this methodology to other vegetable matrices.

Abstract

Stevia rebaudiana Bertoni is a perennial shrub belonging to the Asteraceae family. The leaves contain a mixture of steviol glycosides with extraordinary sweetening properties, among which the most important are stevioside and rebaudioside A. These components have a high sweetening power, which is about 300 times that of sucrose, and a negligible calorie content. However, their extraction and purification are not easy. In this paper, the extraction technique under cyclic pressure, known as rapid solid-liquid dynamic extraction (RSLDE), was compared using a Naviglio extractor (NE) with conventional maceration. The aim was to identify an efficient and economically viable method for obtaining high amounts of steviol glycosides in a short time. Furthermore, a numerical model was set up for the solid-liquid extraction process of value-added compounds from natural sources. Several parameters must be evaluated in relation to the characteristics of the parts of the plant subjected to extraction. Therefore, since diffusion and osmosis are highly dependent on temperature, it is necessary to control the temperature of the extraction system. On the other hand, the final aim of this work was to provide a scientific and quantitative basis for RSLDE. Therefore, the results obtained from stevia extracts using the corresponding mathematical model allowed hypothesizing the application of this model to the extraction processes of other vegetable matrices.

Graphical Abstract

1. Introduction

Foods that contain beneficial compounds can help prevent the major diseases affecting western countries, particularly obesity, cardiovascular disease, diabetes, metabolic syndrome, and cancer [1]. For this reason, consumer and industrial interest in natural food supplements, like herbal remedies, preparations obtained from medicine and functional food plants, is growing rapidly [2,3]. Specifically, some food and drink manufacturers replaced simple sugars (fructose, glucose, and sucrose) with natural non-caloric sweeteners to reduce calories [4,5]. An important class of natural sugar substitutes with low calories and high sweetening power is contained in the leaves of Stevia rebaudiana Bertoni, a perennial shrub that belongs to the Asteraceae family, native to Paraguay and Brazil. This plant has lance-shaped leaves that are about 5 cm × 2 cm and an average height that varies from 40 to 80 cm, and can attain heights of 1 m. The dry weight of an adult plant is approximately 70 g, and the weight of the leaves alone varies from 15 to 35 g per plant. Originally, stevia was developed only in the northern regions of Latin America; however, its cultivation soon spread around the world. The stevia plant can be grown on soils that are relatively poor in nutrients, and its adaptation to different climatic conditions is well described [6]. Stevia rebaudiana contains six diterpene glycosides that impart an intense sweet taste to foods or beverages incorporating them. The most important components from a quantitative point of view are stevioside, whose sweetening power is approximately 300 times greater than that of sucrose, and rebaudioside A, which is approximately 400 times sweeter than sucrose [7]. Rebaudioside C and dulcoside A are present as minor constituents, and rebaudioside E and rebaudioside D are present in trace amounts. The commonly observed proportions (w/w) of the four major glycosides are 5–10% stevioside, 2–4% rebaudioside A, 1–2% rebaudioside C, and 0.5–1% dulcoside A. Their sweetness levels vary from 40 to 250 times higher than that of sucrose [8]. The stevioside content in Stevia rebaudiana Bertoni leaves during the cultivation period is not related to the average ambient temperature or to the type of propagation, but is strongly influenced by the average atmospheric precipitation. An increased amount of stevioside in the plant biomass was observed in the first week of September [9]. The major glycosides in Stevia rebaudiana Bertoni leaves are derived from kaurenoic acid. Steviol, a hydroxylated derivative of this acid, is the biosynthetic precursor of the compounds present in stevia sweeteners. To date, several studies were performed on the extraction of glycosides from the stevia plant [10,11,12]. Moreover, given the great interest in these compounds, other methods of separation are available in the literature including, for example, a work by Woelwer-Rieck et al. [13] which developed a simple reversed-phase high-performance liquid chromatographic method for the determination of the major steviol glycosides, the diterpene sweeteners derived from Stevia rebaudiana. The method was based on a water extraction step and a solid-phase extraction (SPE) clean-up. Different SPE cartridges and two HPLC columns were tested in the separation of the main steviol glycosides, stevioside and rebaudioside A. The results obtained revealed that the economic production of Stevia rebaudiana could be feasible even in the temperate zones of Europe [13]. Martins et al. [14] reported the exhaustive extraction from Stevia rebaudiana leaves through a multi-stage dynamic maceration using an agro-renewable solvent, 70% ethanol, combined with process conditions leading to a low consumption of solvent, time, and energy, but with adequate yields, committing to the basic principles of green extraction [14]. Another work by Martins et al. [15] showed that turbolysis was promising for Stevia rebaudiana glycoside extraction. Therefore, these results stimulated new research on the purification of these extracts, which could become an interesting source of income for developing countries, such as India and Brazil [15]. Furthermore, a recent work by Kovačević et al. [16] showed the characterization of antioxidants and steviol glycosides in the extracts obtained from stevia after "green" pressurized hot-water extraction (PHWE), indicating that this extraction method was useful for the recovery of polar and non-polar antioxidants and steviol glycosides, as well as being a suitable technique for a scale-up to industrial applications [16].
The glucoside, stevioside, is the most widely studied, and it was isolated for the first time by Bridel and Lavieille in 1931 [17]; however, its aglycone chemical structure was determined by Mosettig et al. in 1963 [18]. This compound, used as a non-caloric sweetener in many countries and in the food industry, is thermally stable and has a high sweetness index [19]. Recent studies demonstrated that stevioside and the general steviosides contained in the stevia plant do not exhibit toxic or mutagenic activities, but exert therapeutic effects, including the stimulation of insulin secretion in the pancreas, which is important for the treatment of diabetes and other disorders of carbohydrate metabolism [20]. Studies to assess the acute toxicity of stevioside [21,22,23] determined a median lethal dose (LD50) of 8.2 g/kg. Stevioside has antiviral properties and produces positive therapeutic effects in the treatment of patients with neurological, rheumatological, and dermatological disorders and anemia [24,25]. These features enable the use of steviol glycosides as a food additive in beverages, jams, biscuits, chewing gum, sweeteners, tablets, etc. In Europe, the maximum permissible levels are reported in the European Union (EU) Reg. 1131/2011, 2011 [26]. However, their extraction and purification are currently a challenge for the food industry. To overcome the drawbacks of the traditional extraction processes, an effective and economically viable method of obtaining two steviol glycosides (stevioside and rebaudioside A) was reported in a recent work by Gallo et al. [27]. The extractions were carried out using a conventional cyclically pressurized extraction and maceration method known as rapid solid-liquid dynamic extraction (RSLDE) in a Naviglio extractor. This method enabled the extraction of the two steviol glycosides in a shorter amount of time compared to the other current extraction techniques. Starting from these assumptions, we investigated the extraction process, considering both the traditional method by maceration and the extraction method that applies a cyclic pressure to the system. In addition, a numerical simulation of this extraction process yielded useful indications for further research.
The aim of this research was to study the application of cyclic pressure for the extraction of the two major steviol glycosides, stevioside (briefly, component S) and rebaudioside A (briefly, component R), from the leaves of Stevia rebaudiana grown in Benevento (Campania, Italy), and to compare the results obtained using this process (I) with those obtained using a hot-batch extraction method (T). It is worthy to note that cold maceration cannot be applied because the fermentation process is more rapid than the extraction process; for this reason, conventional hot maceration was compared with innovative RLSDE at room temperature (T = 25 °C).

2. Materials and Methods

2.1. Materials

Leaves of Stevia rebaudiana Bertoni were provided by the farms Politano, Lemmo, and Maio (Benevento, Italy). The plants were cultivated in different areas of the province of Benevento to verify the rooting, production capacity, and quality of the finished product. The leaves were harvested and dried in an oven at 60 °C. The solvents and reagents used in this study were of analytical grade for HPLC (high-performance liquid chromatography). The standards of stevioside (purity ≥ 95%) and rebaudioside A (purity ≥ 96%), and acetonitrile were purchased from Sigma-Aldrich (Milan, Italy). MilliQ water was purchased from Carlo Erba (Milan, Italy).
The leaves were comminuted in a knife mill (Marconi, model MA 340, Naples, Italy). The raw material was classified according to particle size using a vibratory system (Bertel, model 1868, Naples, Italy) with 8–80 mesh sieves (Tyler series, Wheeling, IL, USA), and then stored in a domestic freezer at 4 °C prior to extraction. The moisture content of the raw material (9.7 ± 0.5%, w/w) was determined in triplicate [28]. Statistical analysis was performed using ANOVA. The statistical importance of every considered factor was evaluated using the least significant difference (LSD,) method. The obtained data were examined with the Statgraphic Plus 5.1 program (Statgraphics Technologies, Inc., The Plains, VA, USA) [29].
The dried leaves were chopped spheroidally, in very little three-dimensional (3D) pieces, that formed the solid matrix; in other words, the stevia solid matrix was formed by spheroidal components. The solid matrix was weighed on an analytical balance Gibertini Elettronica, Srl (Novate Milanese, Milan, Italy) with an accuracy of 0.1 mg, stored at 4 °C in plastic containers, and sealed to avoid changes in the moisture content. The samples considered were also mixed and aerated for 2 min. Prior to extraction, the moisture content of the stevia leaves was determined by the oven method at 105 °C for 24 h [30], ranging between 9% and 10% (w/w).

2.2. Composition of the Stevia “Benevento” Leaves

According to the literature data, the total amount of steviol glycosides obtainable from stevia leaves is generally 8% to 10% (w/w) of the dry weight [31]. A recent work by Gallo et al. [27] compared the total concentration of steviol glycosides contained in the leaves of varieties of Stevia rebaudiana Bertoni Eirete, Morita, Criollo, and Benevento. The leaves of Stevia rebaudiana var. Morita had a greater rebaudioside (R component) and stevioside (S component) content, equal to 17.91 g/100 g in the dried leaves, than the other varieties. In Benevento, the quantity of steviol glycosides was 15.78 g/100 g, which is approximately 11% lower than the quantity in the Morita variety. The Bertoni and Eirete varieties contained minor contents of sweetener molecules, equal to 10.76 g/100 g and 10.73 g/100 g, respectively. In addition, the previously cited relationship between the R and S components in cultivars showed a higher content of rebaudioside A, a molecule with a higher sweetening power and less bitter aftertaste compared to stevioside, in the Benevento variety. In particular, the dry weight of the two major glycosides found in the leaves of wild stevia plants were 9.1% for stevioside (S) and 3.8% for rebaudioside A (R).

2.3. Extraction Process for the Stevia Solid Matrix

For the batch extraction process, 10 g, accurately weighed, of stevia leaf pieces were placed in 600 mL of distilled water at 70 °C, and 10 mL of sample was collected after 5, 10, 15, 20, 25, 30, 35, 40, 45, and 50 min.
For the extraction process with the application of cyclic pressure, 10 g of Stevia leaf pieces, accurately weighed, were placed in 600 mL of distilled water at room temperature, and 10 mL of sample was collected after 10, 20, 30, 40, 50, 60, 70, 80, 90, 100, and 120 min. The data results were computed in triplicate. Statistical analysis was performed using ANOVA. The statistical importance of every considered factor was evaluated using the LSD method. The obtained data were examined with the Statgraphic Plus 5.1 program.
Under these conditions, the kinetic curves for the extraction of the two R and S components were determined considering the two extraction systems examined.

2.4. HPLC Analysis

The sample aliquots were subjected to analysis as a dry extract evaluation and analysis using high-performance liquid chromatography with a diode-array detector (HPLC/DAD) [32,33]. For the analysis of the dry extract, 10 mL of sample was placed in an oven until a constant weight was obtained. For chromatographic analysis, the samples were appropriately diluted depending on the concentrations of the calibration curve, filtered through 0.25-µm polytetrafluoroethylene (PTFE) filters, and injected into an HPLC/DAD instrument. The injection volume was 20 µL. A Phenomenex Luna C18 (2) column (250 mm × 4.60 mm; Phenomenex Inc., Torrance, CA, USA) was used at a flow rate of 0.7 mL/min. Solvent A, distilled water, and solvent B, HPLC-grade acetonitrile, were used in the following gradient elution program: 0–20 min, from 95% to 60% A; 20–25 min, 60% A; and 25–30 min, from 60% to 5% A. The DAD scanned from 200 to 400 nm, and the operating wavelength was 210 nm. Rebaudioside A eluted at 20.4 min, and stevioside eluted at 20.20 min.

2.5. Determination of the Component Size of the Stevia Solid Matrix

By means of a digital caliper, the dimensions of the stevia matrix were evaluated (width, length, and thickness) before the starting of extractive process. Using the values of these parameters, the sphericity value and geometric mean diameter (GMD) of the particles of the stevia solid matrix were computed [34]. These values were used in the mathematical simulation to realize a numerical model for the considered process.
The data results were computed in triplicate. Statistical analysis was performed using ANOVA. The statistical importance of every considered factor was evaluated using the LSD method. The obtained data were examined with the Statgraphic Plus 5.1 program.

2.6. Determination of the Total Volume

Subsequently, the volume measuring was performed without moisture changing. It was realized with food-grade polyethylene, adhering perfectly to the geometry of the stevia matrix component. By immersion in 200 mL of water contained in a 400-mL graduated cylinder, the initial total volume (Vpt) was measured. After that, the accessory volume values (Va) were depurated from the Vpt values, obtaining the sample’s real volume (Vp), that is, Vp = Vpt − Va.
All the experimental tests were performed in triplicate, and the maximum differences values detected were lower than 7%; the average values were used for numerical modeling and analysis.

2.7. Determination of the Initial Concentration of Stevia Solid Matrix Component

Several tests were realized to examine the extraction process from the stevia matrix via RSLDE (I) and hot-batch extraction (T). The samples consisted of the raw material used to form the stevia solid matrix. The samples were stored at 4 °C, sealed by means of a plastic material, avoiding moisture changing, and were mixed for 2 min. Subsequently, the concentration (Mi = Ci) of the stevia solid matrix was evaluated. The initial concentration of S and R (Ci S, Ci R) was 15.78 g/100 g. After determining the initial weight and volume, the stevia solid matrix was subjected to RSLDE (I).

2.8. Rapid Solid-Liquid Dynamic Extraction Procedure (I)

For extraction in the Naviglio extractor, 10 g of the 3D Stevia solid matrix was placed in 600 mL of distilled water at room temperature, and 10 mL of sample was collected after 10, 20, 30, 40, 50, 60, 70, 80, 90, 100, and 120 min.
The weight and volume parameters were determined as described above at the time points listed in the tables, describing the samples treated with method (I) [27]. These samples were subjected to programmed cycles of pressure applied to the distilled water at ambient temperature in contact with the stevia leaf pieces: 30 cycles (max pressure of 10 bar); total cycle duration, 2 h; number of hits in the dynamic phase (nd), 12; duration of the dynamic phase (td), 2 min; and duration of the static phase (ts), 2 min.

2.9. Determination of the Dry Residue of the Extract at 105 °C

During the considered process, 10 mL of extract solute was filtered and transferred to a porcelain graduated dish. The extract solute was dried at 50 °C using an oven until the liquid volume became negligible, at a temperature of 105 °C. The capsule was placed in a desiccating and cooling system until room temperature was reached, and the considered product was weighed. This process was repeated until a constant weight was reached. The dry matter weight was obtained by subtracting the tare values.
The two considered extraction processes were compared, and using the methods described in the current literature and applied successfully to other foods [35,36,37,38,39,40,41], a numerical analysis to simulate the diffusion process into the stevia matrix was performed.

2.10. Analytical Approach

The diffusion phase, at constant temperature, was performed following Fick’s second law in 3D in rectangular coordinates.
M t = D ( 2 M x 2 + 2 M y 2 + 2 M z 2 ) ,
where M represents the concentration value at time t of the extract from the considered matrix, and D is the diffusion coefficient.
If the diffusion process is performed in axisymmetric conditions, we can consider Fick´s second law in one-dimensional (1D) spherical coordinates. In this case, a suitable solution for a matrix with a spherical geometry with radius r was shown by Crank [42], that is
M R = 1 ( 6 π 2 ) i = 1 ( 1 i 2 ) e x p ( D i 2 π 2 t r 2 ) ,
M R = M M i M e M i ,
M R = 1 ( 6 π 2 ) ( ( e x p ( D π 2 t r 2 ) ) + ( 1 4 ) e x p ( 4 D π 2 t r 2 ) ) ,
where MR is the concentration ratio, and Me and Mi are the equilibrium and initial concentration values for the considered extraction process. Very often, only a finite number in Equation (2) is considered to determine MR. In this case, we utilized exclusively the first two terms of Equation (4).
Equations (1)–(4) represent Fick’s second law applied to diffusion of a solute in a media, and the analytical solution (Equation (2)) was obtained assuming that, in media boundary conditions, the concentration is equal to equilibrium concentration.
In this study, the MR values were computed at each considered time t, and they were used as input for the MATLAB (R2016b) program (The MathWorks Inc., Natick, MA, USA), obtaining the diffusion coefficient values (D) for the time considered and for the spherical shape examined.
Therefore, on the basis of the above-said hypothesis, it was possible to evaluate the coefficient D at each considered instant in a suitable way. Successively, these values were considered in the numerical simulation. Furthermore, because the stevia solid matrix components had an ellipsoid geometry, the diffusion values in Equation (1) had to be altered. Gaston et al. [43] found a procedure to evaluate the correct De value for the considered geometry, using the following expression:
De = fe2 × D,
where fe is the sphericity parameter for the ellipsoid shape considered [44]. Then, the diffusion value D in Equation (2) should be substituted with the computed De value.

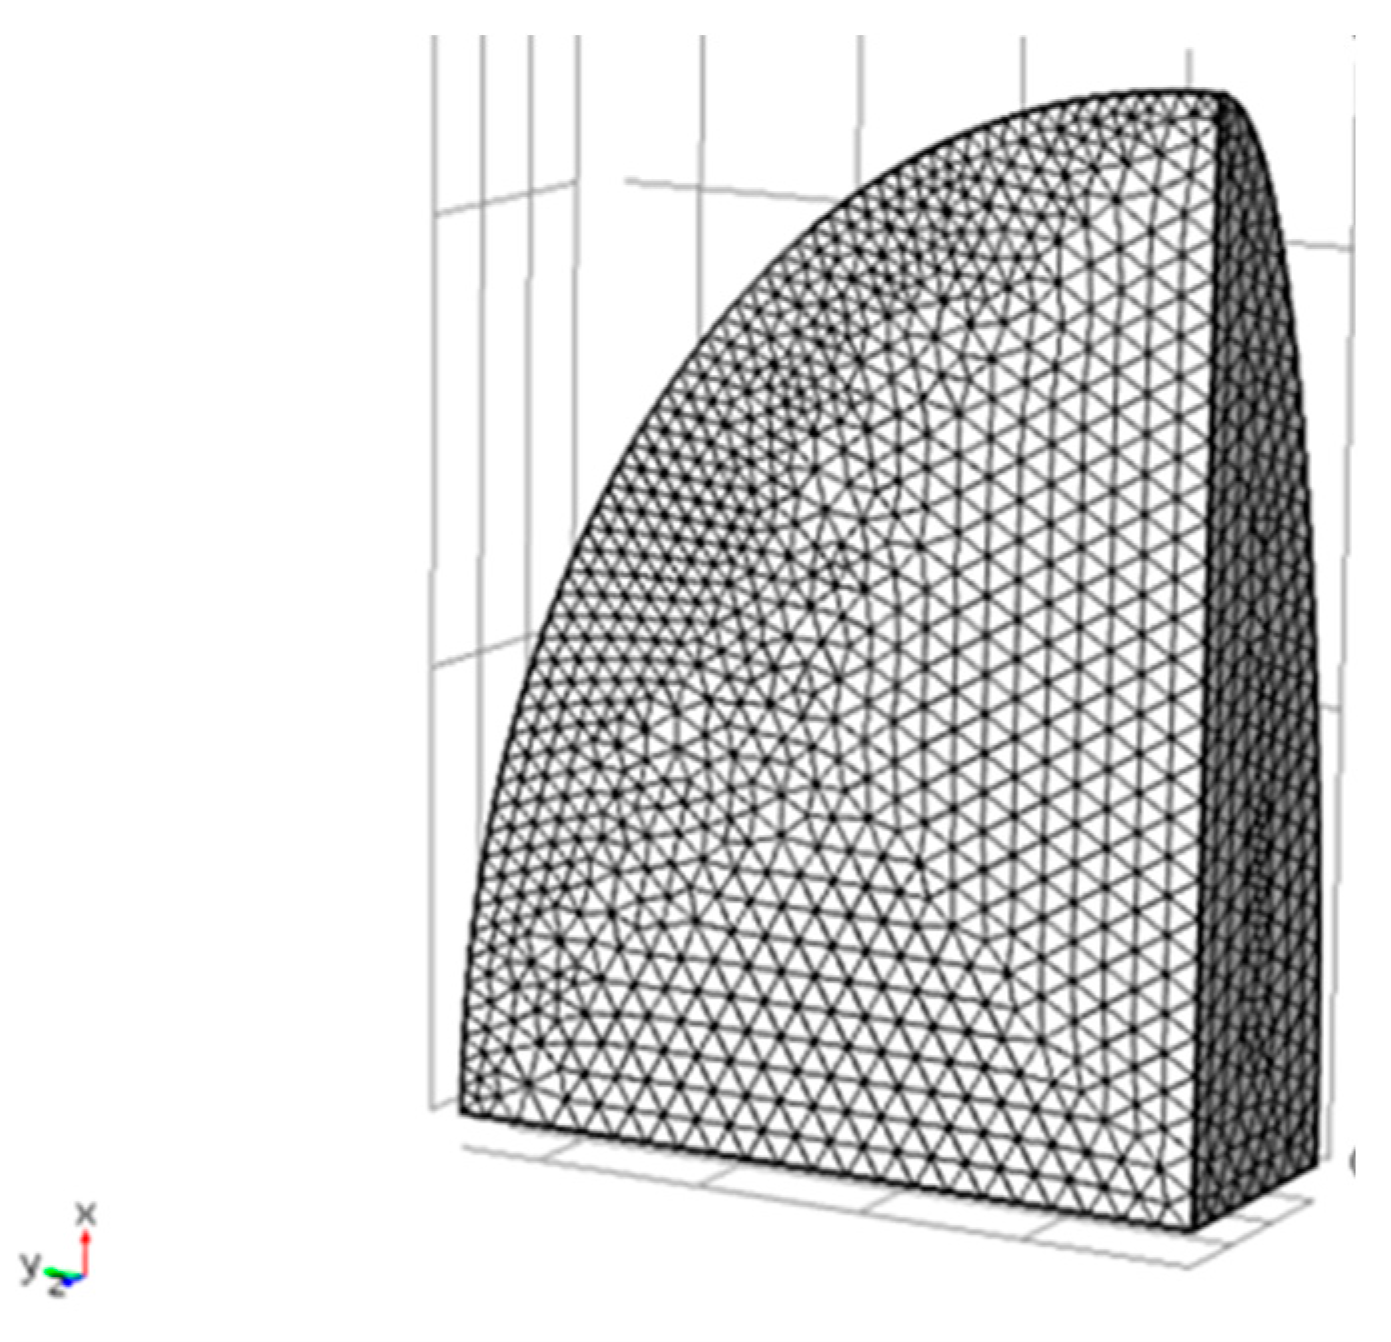
2.11. Finite Element Approach for the Cyclically Pressurized Extraction Process

To mathematically simulate the extraction process considered, a mathematical model was set up utilizing the Comsol (Rel 5.1) code (Comsol, Inc 2017, Burlington, MA, USA) This software allowed the evaluation of the exchange between the stevia solid matrix and the liquid phase during the considered extraction process.
With this program, the distributions of concentration were determined for each time considered.
The same method was used to compute the distribution of moisture and temperature during the cooling process in a grape cryomaceration phase [35].
Using a finite element method (FEM) approach, the computed De values were placed into Equation (1), and MR parameters were evaluated for every node at the considered instant t.
Using this approach, we made the following hypotheses for the considered extraction process:
  • The diffusion values are independent of the value of the concentration.
  • The considered process is assumed as isothermal; therefore, the thermal exchanges are neglected.
  • The stevia solid matrix is homogeneous and isotropic.
  • During the considered process, the matrix surface maintains the saturation concentration value (boundary condition).
  • The solute content initial value for the stevia solid matrix had a uniform distribution and was constant within the solid matrices.
As mentioned in Section 2.1, the geometry of the components of the stevia solid matrix was considered to be ellipsoid. To model a solid matrix, one quarter of an ellipse was used (Figure 1). A complete mesh consisted of 38,366 3D tetrahedral domain elements, 3906 boundary elements, and 178 edge elements.
Moreover, the physico-chemical behavior was defined by specifying the following parameters:
(1)
The effective diffusion coefficient of the moisture in the grain for a spherical geometry of the initial essential oil content of the grain;
(2)
The equilibrium essential oil content of the grain;
(3)
The total experimental time of the oil extraction.
Mathematical modeling using the COMSOL 5.1 code (Comsol, Inc 2017, Burlington, MA, USA) was using the following equations:
(a) Concentration continuity equation (convection–diffusion)
c i t + ( D i c i ) + u c i = R i ,
where Ci is the concentration of the solute i, Di is the diffusion of the solute i in the solvent, and u is the velocity of the solute (in the considered case = 0). When the velocity u = 0, the equation applies only to purely diffusive phenomena. The transitory diffusion values are non-constant over time. Ri describes “sources” or “sinks” of the quantity Ci. The process is not affected by external sources; thus, the value of Ri throughout the simulation is 0.
(b) Diffusive flux equation
N i = D i c i + u c i ,
where N is solute flux.
The simulation was performed for only one quarter of the total geometry, due to symmetry. Symmetry walls had the normal component of the concentration gradient equal to 0, as follows:
n Ni = 0 on the symmetric boundary.
The other boundary was described by Dirichlet boundary conditions from the data of extraction, as follows:
Ci = C (data from experiments) on the other boundary.
The coefficient of diffusion, estimated by fitting Equation (2) to the experimental data, was input into the software, and the equations were solved using a finite element approach to estimate the nodal flux–time diagrams for the components, as reported by Naviglio et al. [41], and to evaluate the distribution of the concentrations of each node, at one-second time steps. The overall concentration for a solid matrix was also calculated at the time range considered by averaging the contents of the nodes. All these procedures were performed for the extraction process (I). Specifically, the input parameters for the COMSOL program were as follows:
(1)
Diffusivity coefficient (m2/s) for each component R and S;
(2)
Uniform initial value (mol/m3), where the relative activities of each fraction were determined on the basis of molar concentration (mol/L) or mass concentration (g/L);
(3)
Mass flow that was withdrawn by means of a kinetics curve.

3. Results and Discussion

3.1. Steviol Glycosides Analysis

The leaves of Stevia rebaudiana Bertoni were provided by the farms Politano, Lemmo, and Maio (Benevento, Italy). These plants were cultivated in different areas of the province of Benevento to verify the rooting, production capacity, and quality of the finished product. The leaves were harvested and dried in the sun. Before testing, the samples were comminuted, weighed, placed in bags for food use, vacuum heat-sealed, and stored at room temperature. For identification and quantification of steviol glycosides, two calibration curves were constructed using scalar concentrations of 50, 100, 200, and 400 mg/L of stevioside and rebaudioside A standards. The curves were constructed by analyzing the standard solutions for each concentration in triplicate, and by estimating the peak areas against the corresponding concentrations using weighted linear regression. Following the construction of the calibration curve, the extract samples were suitably diluted on the basis of the initial concentrations of dry material, and subjected to HPLC/DAD. Chromatographic peaks of stevioside and rebaudioside A present in the extracts were identified and quantified by comparing retention times and UV spectra with the standards used for the construction of the calibration curves. Finally, the leaves were chopped and shredded in order to obtain 3D spheroidal elements, and was considered as the 3D element obtained. This made it possible to apply the numerical model considered.

3.2. Determination of the Kinetics of Steviol Glycoside Extraction from Stevia Solid Matrix in Hot Batches

Figure 2 shows the kinetics of the extraction of the two major steviol glycosides, rebaudioside A and stevioside, during the hot-batch extraction (T).
After 5 min of extraction, the concentrations of R and S in the extract were equal to 582.4 mg/L and 178 mg/L, respectively.
At 40 min, the concentrations of R and S had increased by 250% and 178% to reach 2033.1 mg/L and 529.1 mg/L, respectively.
After 50 min, the concentrations of the two steviol glycosides were almost constant, such that the analysis of variance (ANOVA) revealed no statistically significant differences between the samples extracted for 40, 50, and 70 min. The total content of R and S was estimated to be 15.9 g/100 g of leaves, of which 78.7% corresponded to R and 21.3% corresponded to S.

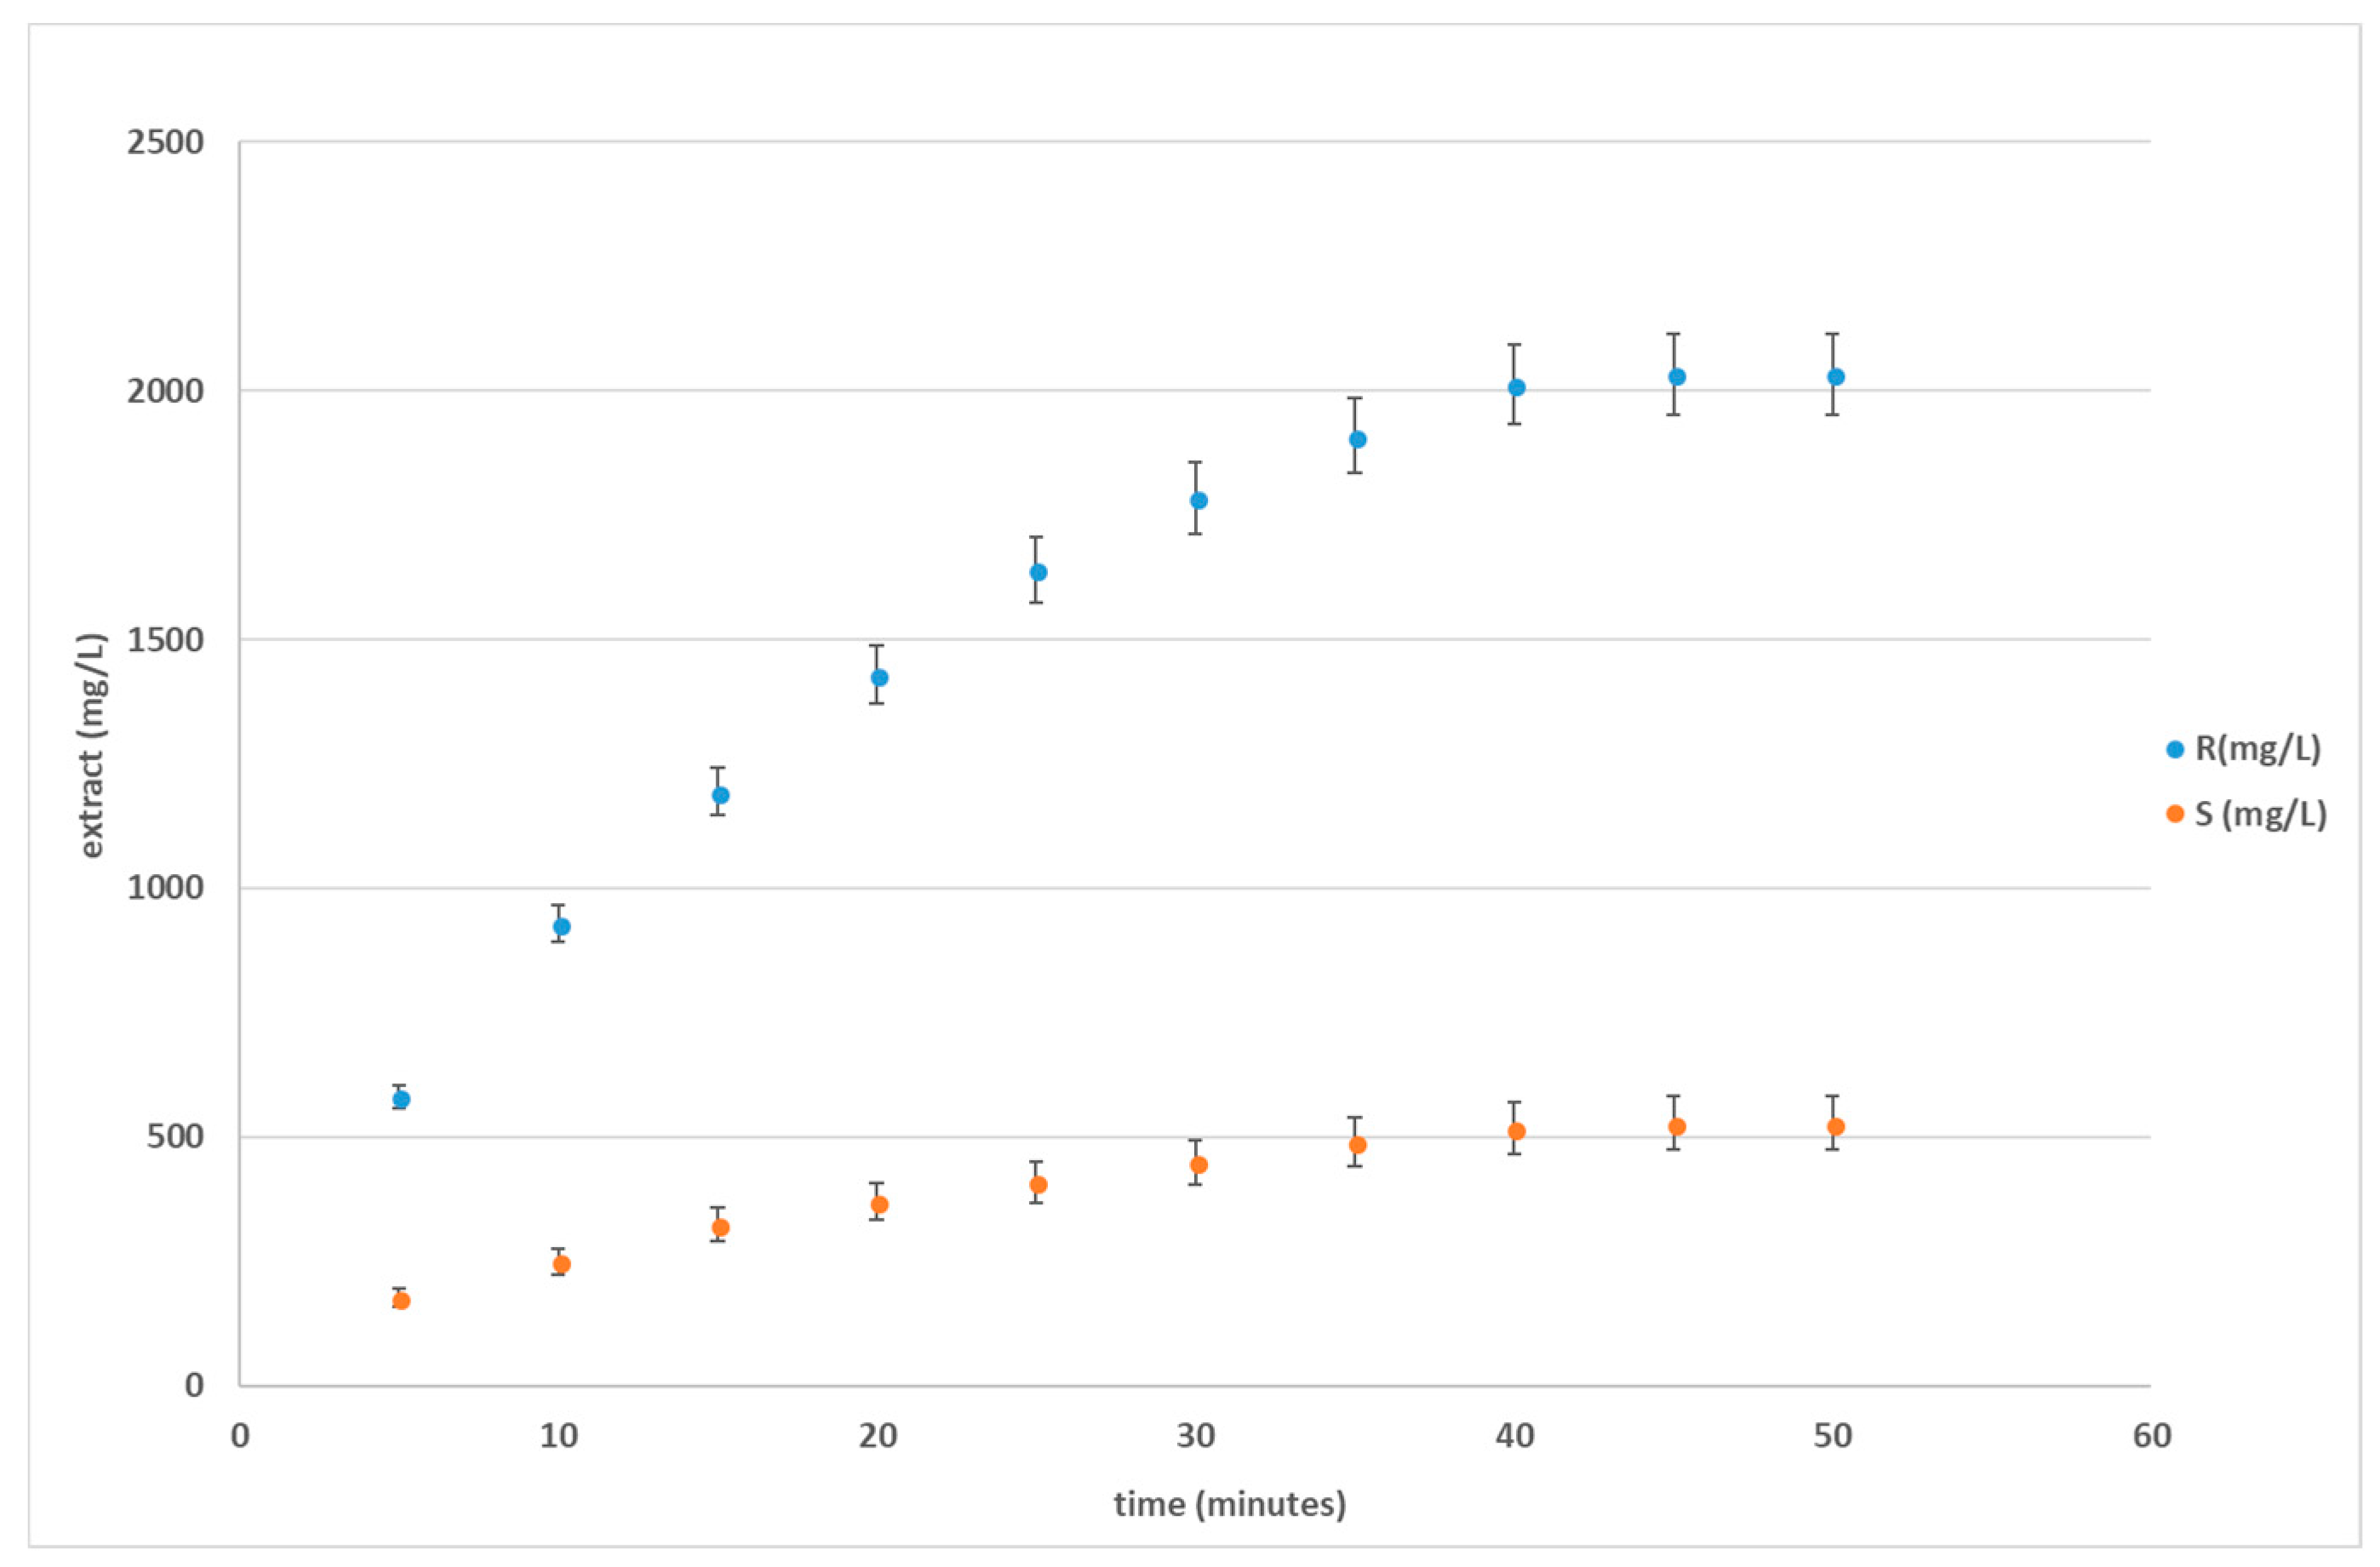
3.3. Kinetics of the Cyclically Pressurized Cold Extraction (I)

Figure 3 shows the extraction kinetics for the cyclically pressurized cold extraction (I). After 90 min, the process reached equilibrium.
The error bars reported in Figure 2 and Figure 3 showed that the maximum error detected was always less than 7%, i.e., all the calculated values were included between the two limit curves.
After 30 min of contact between the stevia Benevento leaves and the liquid extractant (distilled water), the concentration of R was 920.4 mg/L, and the concentration of S was 298 mg/L. The curve showed a constant trend only after 90 min of extraction, at which time the concentrations of steviol glycosides were 1170.1 mg/L (R) and 399.2 mg/L (S). The total content of R and S was estimated to be 9.42 g/100 g of leaves, of which 74.5% corresponded to R and 25.4% corresponded to S.
Compared to the hot-batch extraction process (T), the cyclically pressurized extraction process (I) was less than 40% efficient; however, the dry extract from the analysis showed that the extracted (time, 40 min) sample batch (process T) had a higher solids content than that obtained by process I (58.2% with process T compared to 36.2% with process I). However, the first extract obtained from process T was more difficult to purify than the second extract obtained from process I, and the steviol glycosides were present in greater quantities along with unidentified impurities in the second extract. Therefore, process I is more suitable for further industrial use.
Importantly, the approach of process I is more innovative than the traditional maceration process. The extraction in process I occurs in the compartments of the Naviglio extractor, and the extraction generates a negative pressure gradient between the interior and the exterior of the solid matrix. This gradient forces the molecules that lie within the solid matrix to the outside. Therefore, when using an appropriate solvent, the generation of a negative pressure gradient between the outside and inside of the solid matrix containing the extractable material, followed by the sudden restoration of the initial equilibrium conditions, induces the forced extraction of the compounds not chemically bonded to the main structure of the solid.

3.4. Rapid Solid-Liquid Dynamic Extraction Process (I)

For the RSLDE of stevia in process I, a range of extraction times, including 0, 10, 20, 30, 40, 50, 60, 70, 80, 90, 100, and 120 min were considered, and, after each time point considered, the dimensions of the components of the stevia solid matrix were determined, precisely evaluating the following geometric characteristics:
(1)
L1 length along the X-axis of the considered component (largest principal dimension, mm);
(2)
L2 length along the Y-axis of the considered component (second largest principal dimension, mm);
(3)
L3 length along the Z-axis of the considered component (smallest principal dimension, mm).
The physical characteristics of the component of the stevia solid matrix measured during extraction process I are presented in Table 1.
The sphericity parameter value was determined utilizing the method reported by Jain and Bal [34].
The sphericity value is an index of the roundness of the component. For non-spherical elements, the sphericity parameter is determined as the ratio of the surface of the equivalent sphere to the surface of the considered component [45], where GMD (mm) = D = (L2* × L3)1/2 for the considered stevia solid matrix.
Based on the dimensions reported in Table 1, the component of the stevia solid matrix had a nearly ellipsoid geometry, and it maintain its general geometry after the considered process. However, due to the relative decrease in the thickness and width of the component of the stevia solid matrix, the sphericity parameter changed from 0.860 to 0.833.
The sphericity factor (fe) for a component of the stevia solid matrix decreased from 0.519 to 0.395.
This decrease was provoked by the solute migration within the stevia solid matrix, which caused deflation of the stevia solid matrix. Ahromrit et al. gave a detailed report of the dimension changes during the considered process [46].
Using Equations (2) and (3), the coefficient of diffusion (De) was calculated for component R as ranging from 0.26 × 10⁻¹⁰ to 0.46 × 10⁻¹⁰ m2/s, and for component S as ranging from 0.246 × 10⁻¹⁰ to 0.482 × 10⁻¹⁰ m2/s.

3.5. Numerical Analysis Data

The obtained diffusion coefficient (De) was input into Equation (1), which was then solved using the finite element approach to estimate the nodal flux–time diagrams for the extract components and the concentration distribution within the solid matrix at different time intervals considered. The MR values were computed for the considered instant. The graphs of the obtained data results for the concentration parameter using the finite element method are shown in Figure 4a–c at times t = 30, 60, and 90 min after that the considered process was started.
Figure 4a–c put into evidence a migration of the solute from inside the solid matrix toward the external surface. Furthermore, the FEM method used, as can be seen in Figure 4a–c, denoted that the concentration parameter inside the stevia matrix was not constant.
Figure 4a–c show that the gradient of the solute value inside the stevia matrix was high during the initial phase of the extraction process, and decreased as the extraction process progressed.
The three figures are shown at the three times considered, using the same scale; the respective minimum and maximum values are also represented in each figure.
It is possible to note that, during the considered extraction process, there was a sudden initial water uptake that was due to the capillaries of the stevia matrix filling [47]. With the proceeding of water uptake absorption, the rate decreased, due to the extraction increase of soluble elements from the stevia matrix, and to the capillaries and intermicellar spaces filling with process water [48].
Cyclically pressurized extraction has the advantage of enhancing the plasticity of the stevia coats and of eliminating the presence of hard-shelled cells that fail to intake water during the extraction process by alternating the pressure (0–10 bar). The rapid changes in pressure (0–10 bar) produce driving forces that allow the opening of new channels within the solid matrix through which the water flows, increasing the overall solute concentration in the matrix. This phenomenon does not occur when the pressure remains constant during extraction because constant pressure cannot induce the formation of new channels within the solid matrix.
In summary, the kinetic curves showed that, using the RSLDE process, the extracted substance was lower than that obtained using the hot process at 80 °C (about 57%). In fact, using the hot-batch process at 80 °C for 40 min, the concentrations of steviol glycosides R and S was increased by 250% and 178% to reach values of R = 2033.1 mg/L and S = 529.1 mg/L, respectively, while, using RSLDE after 90 min of extraction, the concentrations of steviol glycosides were R = 1170.1 mg/L and S = 399.2 mg/L, respectively. However, the considerable advantage of the RSLDE process with respect to the hot batch was that the RSLDE process was carried out at ambient temperatures, while the hot batch was done at 80 °C. As is known, at high temperature, there is the degradation of many organoleptic and/or bioactive substances, very important components for the quality of a final product, especially for the food industry. Moreover, the hot extraction required more energy than RLSDE at room temperature. Currently, the larger NE model does not allow industrial use; however, studies and research are under way to achieve a scaled-up NE. As a result, the extraction process using NE and its subsequent purification developed in this study was a simple, economical, environmentally friendly method for producing steviol glycosides. Therefore, this method constitutes a valid alternative to conventional extraction by reducing the extraction time and the consumption of toxic solvents, and by favoring the use of the extracted metabolites as food additives and/or nutraceuticals. On the other hand, the main purpose of this work was the comparison between RSLDE and maceration, as it was complicated to compare with other existing methods. Furthermore, a numerical model was set up for the extraction process, and the model obtained could be applied to any extraction process.

4. Conclusions

Two extraction processes applied to a stevia solid matrix were evaluated: hot extraction in batches and cyclically pressurized extraction. Compared to the hot-batch extraction (T), cyclically pressurized extraction (I) was less efficient by 40%; however, the dry material extracted using process T produced more dry residue than process I (58.2% with process T compared to 36.2% with process I).
Therefore, the extract from process T is more difficult to purify than that obtained from process I, and a higher content of steviol glycosides is extracted along with unidentified impurities via process T. Accordingly, process I is more suitable for further industrial applications. A numerical model of process I gave useful indications for the future development of cyclically pressurized extraction. The obtained model can be applied to any extraction process. Different systems must be evaluated in relation to the characteristics of the solid matrix, such as the entirety, freshness, and part of the plant subjected to extraction, and the temperature of the extraction system must be controlled, since diffusion and osmosis are highly dependent on temperature. The aim of this work was to provide a scientific and quantitative basis for RSLDE, and the results obtained for stevia extracts using the corresponding mathematical model prompted us to expand the model to the extraction of different vegetable matrices.

Author Contributions

Conceptualization, M.G. and D.N.; Methodology, A.F.; Software, G.F.; Validation, D.N., A.F. and G.F.; Formal Analysis, G.F.; Investigation, D.N.; Resources, A.F.; Data Curation, G.F.; Writing-Original Draft Preparation, M.G.; Writing-Review & Editing, M.G; Visualization, G.F.; Supervision, D.N.; Project Administration, A.F.; Funding Acquisition, M.G.

Funding

The authors acknowledge the financial support from the Italian Ministry of University and Research (MIUR) through the program FFABR 2017 assigned to Monica Gallo.

Conflicts of Interest

The authors declare that they have no conflict of interest.

References

  1. Shahidi, F.; Ambigaipalan, P. Phenolics and polyphenolics in foods, beverages and spices: Antioxidant activity and health effects—A review. J. Funct. Foods 2015, 18, 820–897. [Google Scholar] [CrossRef]
  2. Savita, S.M.; Sheela, K.; Sunanda, S.; Shankar, A.G.; Ramakrishna, P. Stevia rebaudiana—A functional component for food industry. J. Hum. Ecol. 2004, 15, 261–264. [Google Scholar] [CrossRef]
  3. Serio, L. La Stevia rebaudiana, une alternative au sucre. Phytothérapie 2010, 8, 26–32. [Google Scholar] [CrossRef]
  4. Liu, S.; Manson, J.E. Dietary carbohydrates, physical inactivity, obesity, and the “metabolic syndrome” as predictors of coronary heart disease. Curr. Opin. Lipidol. 2001, 12, 395–404. [Google Scholar] [CrossRef] [PubMed]
  5. Mitchell, H. (Ed.) Sweeteners and Sugar Alternatives in Food Technology; John Wiley & Sons: Hoboken, NJ, USA, 2008. [Google Scholar]
  6. Pereira, C.; Storck, L.; Lopes, S.J.; Martin, T.N.; Bisognin, D.A. Dry biomass and glycosides yield from Stevia rebaudiana leaves under different harvesting times. Biosci. J. 2016, 32. [Google Scholar] [CrossRef]
  7. Abou-Arab, A.E.; Abou-Arab, A.A.; Abu-Salem, M.F. Physico-chemical assessment of natural sweeteners steviosides produced from Stevia rebaudiana Bertoni plant. Afr. J. Food Sci. 2010, 4, 269–281. [Google Scholar]
  8. Lemus-Mondaca, R.; Vega-Gálvez, A.; Zura-Bravo, L.; Ah-Hen, K. Stevia rebaudiana Bertoni, source of a high-potency natural sweetener: A comprehensive review on the biochemical, nutritional and functional aspects. Food Chem. 2012, 132, 1121–1132. [Google Scholar] [CrossRef] [PubMed]
  9. Tateo, F.; Sanchez, M.; Escobar, L.; Bononi, M.; Lubian, E. Stevioside content of Stevia rebaudiana (Bertoni) Bertoni grown in east Paraguay. Ital. J. Food Sci. 1999, 11, 265–269. [Google Scholar]
  10. Jaitak, V.; Bandna, B.S.; Kaul, V.K. An efficient microwave-assisted extraction process of stevoiside and rebaudioside A from Stevia rebaudiana (Bertoni). Phytochem. Anal. 2009, 20, 240–245. [Google Scholar] [CrossRef] [PubMed]
  11. Huang, X.; Fu, J.-F.; Di, D.-L. Preparative isolation and purificationof steviol glycosides from Stevia rebaudiana Bertoni using high-speed counter-corrent chromatography. Sep. Purif. Technol. 2010, 71, 220–224. [Google Scholar] [CrossRef]
  12. Puri, M.; Sharma, D.; Barrow, C.J.; Tiwary, A.K. Optimisation of novel method for the extraction of steviosides from Stevia rebaudiana leaves. Food Chem. 2012, 132, 1113–1120. [Google Scholar] [CrossRef] [PubMed]
  13. Woelwer-Rieck, U.; Lankes, C.; Wawrzun, A.; Wüst, M. Improved HPLC method for the evaluation of the major steviol glycosides in leaves of Stevia rebaudiana. Eur. Food Res. Technol. 2010, 231, 581–588. [Google Scholar] [CrossRef]
  14. Martins, P.M.; Thorat, B.N.; Lanchote, A.D.; Freitas, L.A. Green extraction of glycosides from Stevia rebaudiana (Bert.) with low solvent consumption: A desirability approach. Resour.-Effic. Technol. 2016, 2, 247–253. [Google Scholar] [CrossRef]
  15. Martins, P.M.; Lanchote, A.D.; Thorat, B.N.; Freitas, L.A. Turbo-extraction of glycosides from Stevia rebaudiana using a fractional factorial design. Rev. Bras. Farmacogn. 2017, 27, 510–518. [Google Scholar] [CrossRef]
  16. Kovačević, D.B.; Barba, F.J.; Granato, D.; Galanakis, C.M.; Herceg, Z.; Dragović-Uzelac, V.; Putnik, P. Pressurized hot water extraction (PHWE) for the green recovery of bioactive compounds and steviol glycosides from Stevia rebaudiana Bertoni leaves. Food Chem. 2018, 254, 150–157. [Google Scholar] [CrossRef] [PubMed]
  17. Bridel, M.; Lavieille, R. Le principe à saveur sucrée du Kaà-hê-é (Stevia rebaudiana) Bertoni. J. Pharm. Clin 1931, 14, 99–154. [Google Scholar]
  18. Mosettig, E.; Beglinger, U.; Dolder, F.; Lichti, H.; Quitt, P.; Waters, J.A. The absolute configuration of steviol and isosteviol. J. Am. Chem. Soc. 1963, 85, 2305–2309. [Google Scholar] [CrossRef]
  19. Wölwer-Rieck, U.; Tomberg, W.; Wawrzun, A. Investigations on the stability of stevioside and rebaudioside A in soft drinks. J. Agric. Food Chem. 2010, 58, 12216–12220. [Google Scholar] [CrossRef] [PubMed]
  20. Jeppesen, P.B.; Gregersen, S.; Poulsen, C.R.; Hermansen, K. Stevioside acts directly on pancreatic beta cells to secrete insulin: actions independent of cyclic adenosine monophosphate and adenosine triphosphate-sensitive K+-channel activity. Metabolism 2000, 9, 208–214. [Google Scholar] [CrossRef]
  21. Lee, S.J.; Lee, K.R.; Park, J.R.; Kim, K.S.; Tchai, B.S. A study on the safety of the stevioside as a new sweetening source. Korean J. Food Sci. Technol. 1979, 11, 224–231. [Google Scholar]
  22. Geuns, J.M.C. Safety evaluation of Stevia and stevioside. Stud. Nat. Prod. Chem. 2002, 27, 299–319. [Google Scholar]
  23. Geuns, J.M.; Augustijns, P.; Mols, R.; Buyse, J.G.; Driessen, B. Metabolism of stevioside in pigs and intestinal absorption characteristics of stevioside, rebaudioside A and steviol. Food Chem. Toxicol. 2003, 41, 1599–1607. [Google Scholar] [CrossRef]
  24. Dozono, F. U.S. Patent No. 5262161, 1993. (1993-11-16). Available online: http: //www.chemweb.com/ databases /patents (accessed on 30 July 2018).
  25. Takahashi, K.; Matsuda, M.; Ohashi, K.; Taniguchi, K.; Nakagomi, O.; Abe, Y.; Mori, S.; Sato, N.; Shigeta, S. Analysis of anti-rotavirus of extract from Stevia rebaudiana. Antivir. Res. 2001, 49, 15–24. [Google Scholar] [CrossRef]
  26. COMMISSION REGULATION (EU) No 1131/2011, 2011. (OJ L 295, p205, 12/11/2011) of 11 November 2011 amending Annex II to Regulation (EC) No 1333/2008 of the European Parliament and of the Council with regard to steviol glycosides. Available online: https://www.fsai.ie/uploadedFiles/Reg1131_2011.pdf (accessed on 30 July 2018).
  27. Gallo, M.; Vitulano, M.; Andolfi, A.; DellaGreca, M.; Naviglio, D. Rapid solid-liquid dynamic extraction (RSLDE), a new rapid and greener method to extract two steviol glycosides (stevioside and rebaudioside A) from Stevia leaves. Plant Foods Hum. Nutr. 2017, 72, 141–148. [Google Scholar] [CrossRef] [PubMed]
  28. American Society of Agriculture Engineers (ASAE). ASAE Standard S352.2: Moisture Measurement—Unground Grain and Seeds; ASAE: St. Joseph, MI, USA, 1997. [Google Scholar]
  29. Jacobes, M.B. The Chemical Analysis of Foods and Food Products; Van Nostrand Reinhold Company: New York, NY, USA; Cincinnati, OH, USA; Toronto, ON, Canada; London, UK; Melbourne, Australia, 2013. [Google Scholar]
  30. Association of Official Analytical Chemists (AOAC). Official Methods of Analysis of the Association of Official Analytical Chemists; Williams, S. Publisher: Arlington, VA, USA, 2016. [Google Scholar]
  31. Ceunen, S.; Geuns, J.M. Steviol glycosides: chemical diversity, metabolism, and function. J. Nat. Prod. 2013, 76, 1201–1228. [Google Scholar] [CrossRef] [PubMed]
  32. Vanek, T.; Nevopim, A.; Valicek, P. Determination of Stevioside in plant material and fruit teas. J. Food Compos. Anal. 2001, 14, 383–388. [Google Scholar] [CrossRef]
  33. Kedik, S.A.; Fedorov, S.V.; Yanul’, N.A.; Prokhorova, L.V.; Smirnova, E.V.; Panov, A.V. Chromatographic determination of stevioside in raw plant material. Pharm. Chem. J. 2003, 37, 529–532. [Google Scholar] [CrossRef]
  34. Jain, R.K.; Bal, S. Properties of pearl millet. J. Agric. Eng. Res. 1997, 66, 85–91. [Google Scholar] [CrossRef]
  35. Carillo, M.; Formato, A.; Fabiani, A.; Scaglione, G.; Pucillo, G.P. An inertizing and cooling process for grapes cryomaceration. Electron. J. Biotechnol. 2011, 14. [Google Scholar] [CrossRef]
  36. Formato, A.; Naviglio, D.; Pucillo, G.P.; Nota, G. Improved fumigating process for stored foodstuffs by phosphine in sealed chambers. J. Agric. Food Chem. 2012, 60, 331–338. [Google Scholar] [CrossRef] [PubMed]
  37. Formato, A.; Gallo, M.; Ianniello, D.; Montesano, D.; Naviglio, D. Supercritical fluid extraction of alpha- and beta-acids from hops compared to cyclically pressurized solid-liquid extraction. J. Supercrit. Fluids 2013, 84, 113–120. [Google Scholar] [CrossRef]
  38. Gallo, M.; Formato, A.; Ianniello, D.; Andolfi, A.; Conte, E.; Ciaravolo, M.; Varchetta, V.; Naviglio, D. Supercritical fluid extraction of pyrethrins from pyrethrum flowers (Chrysanthemum cinerariifolium) compared to traditional maceration and cyclic pressurization extraction. J. Supercrit. Fluids 2017b, 119, 104–112. [Google Scholar] [CrossRef]
  39. Naviglio, D.; Formato, A.; Pucillo, G.P.; Gallo, M. Cyclically pressurized soaking process for hydration and aromatization of cannellini beans. J. Food Eng. 2013, 116, 765–774. [Google Scholar] [CrossRef]
  40. Naviglio, D.; Formato, A.; Gallo, M. Comparison between 2 methods of solid-liquid extraction for the production of Cinchona calisaya elixir: An experimental kinetics and numerical modeling approach. J. Food Sci. 2014, 79, E1704–E1712. [Google Scholar] [CrossRef] [PubMed]
  41. Naviglio, D.; Formato, A.; Vitulano, M.; Cozzolino, I.; Ferrara, L.; Zanoelo, E.F.; Gallo, M. Comparison between the kinetics of conventional maceration and a cyclic pressurization extraction process for the production of lemon liqueur using a numerical model. J. Food Process Eng. 2017. [Google Scholar] [CrossRef]
  42. Crank, J. The Mathematics of Diffusion; Oxford University Press: New York, NY, USA, 1975. [Google Scholar]
  43. Gaston, A.L.; Abalone, R.M.; Giner, S.A.; Bruce, D.M. Effect of modelling assumptions on the effective water diffusivity in wheat. Biosyst. Eng. 2004, 88, 175–185. [Google Scholar] [CrossRef]
  44. Gaston, A.L.; Abalone, R.M.; Giner, S.A. Wheat drying kinetics. Diffusivities for sphere and ellipsoid by finite elements. J. Food Eng. 2002, 52, 313–322. [Google Scholar] [CrossRef]
  45. McCabe, W.L.; Smith, J.C.; Harriott, P. Unit Operation of Chemical Engineering; McGraw Hill Book Company: New York, NY, USA, 1993. [Google Scholar]
  46. Ahromrit, A.; Ledward, D.A.; Niranjan, K. 2006. High pressure induced water uptake characteristics of Thai glutinous rice. J. Food Eng. 2006, 72, 225–233. [Google Scholar] [CrossRef]
  47. Hsu, K.H.; Kim, C.J.; Wilson, L.A. Factors affecting water uptake of soybeans during soaking. Cereal Chem. 1983, 60, 208–211. [Google Scholar]
  48. Plhak, L.C.; Caldwell, K.B.; Stanley, D.W. Comparison of methods used to characterize water inhibition in hard-to-cook beans. J. Food Sci. 1989, 54, 326–329. [Google Scholar] [CrossRef]
Figure 1. Finite element grid for a component of the stevia solid matrix.
Processes 06 00105 g001
Figure 2. Diagram of the kinetics of the hot-batch extraction (with error bars) of rebaudioside A (blue, above) and stevioside (orange, under).
Processes 06 00105 g002
Figure 3. Diagram of the kinetics of cold extraction in the Naviglio extractor (with error bars) of rebaudioside A (blue, above) and stevioside (orange, under).
Processes 06 00105 g003
Figure 4. Concentration at various points along a cross-section from the surface to the center of the component of the stevia solid matrix at different time points: (a) t = 30 min, concentration value = 0.19998–0.38777 mol/m3; (b) t = 60 min, concentration value = 0.10004–0.15184 mol/m3; (c) t = 90 min, concentration value = 0.049976–0.079217 mol/m3.
Processes 06 00105 g004aProcesses 06 00105 g004b
Table 1. Physical characteristics of the components of the stevia solid matrix.
Time
(min)
L1 Length
(mm)
L2 Width
(mm)
L3 Thickness
(mm)
Geometric Mean Diameter (GMD) = D
(mm)
SphericitySphericity Factor
(fe)
t0 = 07.05 ± 1.815.22 ± 1.511.51 ± 1.212.800.8600.519
t1 = 107.01 ± 1.785.01 ± 1.551.49 ± 1.192.730.8560.510
t1 = 206.93 ± 1.784.98 ± 1.551.46 ± 1.192.690.8550.501
t1 = 306.90 ± 1.784.95 ± 1.551.43 ± 1.192.660.8530.490
t1 = 406.86 ± 1.784.93 ± 1.551.40 ± 1.192.620.8520.460
t1 = 506.84 ± 1.784.90 ± 1.551.36 ± 1.192.580.8490.435
t1 = 606.81 ± 1.784.86 ± 1.551.33 ± 1.192.540.8460.421
t1 = 706.78 ± 1.784.83 ± 1.551.29 ± 1.192.490.8430.749
t1 = 806.75 ± 1.784.80 ± 1.551.26 ± 1.192.450.8410.744
t2 = 906.71 ± 1.694.77 ± 1.361.22 ± 1.132.410.8380.401
t2 = 1006.67 ± 1.694.74 ± 1.361.19 ± 1.132.370.8360.730
t2 = 1206.64 ± 1.684.70 ± 1.241.16 ± 1.122.330.8330.395

