Daytime/Nighttime Event-Based PI Control for the pH of a Microalgae Raceway Reactor
by
 , and
, and
Enrique Rodríguez-Miranda
1, 
Manuel Beschi
2,
José Luis Guzmán
3,* ,
,
Manuel Berenguel
3 and
and
Antonio Visioli
1 1
Department of Mechanical and Industrial Engineering, University of Brescia, 25123 Brescia, Italy
2
Institute of Intelligent Industrial Technologies and Systems for Advanced Manufacturing, National Research Council of Italy, 20133 Milan, Italy
3
Department of Computer Science, University of Almería, 04120 Almería, Spain
*
Author to whom correspondence should be addressed.
Processes 2019, 7(5), 247; https://0-doi-org.brum.beds.ac.uk/10.3390/pr7050247
Submission received: 12 March 2019
/
Revised: 18 April 2019
/
Accepted: 19 April 2019
/
Published: 28 April 2019
(This article belongs to the Special Issue Advances in Condition Monitoring, Optimization and Control for Complex Industrial Processes)
Abstract
:In this paper, a new solution to improve the traditional control operation of raceway microalgae reactors is presented. The control strategy is based on an event-based method that can be easily coupled to a classical time-driven proportional-integral controller, simplifying the design process approach. The results of a standard Proportional-Integral (PI) controller, as well as of two event-based architectures, are presented in simulation and compared with each other and with traditional On/Off control. It is demonstrated that the event-based PI controller—operating during the whole day instead of only during daytime—achieves a better performance by reducing the actuator effort and saving costs related to gas consumption.
1. Introduction
The importance of environmental sustainability and the rising of renewable energies promote the development of new energy sources, such as microalgae reactors. These biological processes have become very popular nowadays due to their great potential to produce biofuels and high-value products. The biomass obtained in these processes can be useful for applications such as cosmetics at the pharmaceutical industry, or even products for agriculture and aquaculture coupled to wastewater treatment [1]. Among many advantages, these biological systems stand out for the capability of microalgae to produce valuable compounds from photosynthesis while consuming CO and nutrients, even coming from flue gases and wastewater.
There are mainly two types of reactors: tubular photobioreactors, for high-value microalgae strains, and raceway or open reactors. This second type of reactor is the most common one on an industrial scale due to its operation simplicity and its low maintenance costs [2,3].
Biological systems have complex dynamics, difficult to control, and can be affected by several variables. Microalgae growth depends on temperature, solar radiation, pH and dissolved oxygen [4]. The incidence of solar radiation and temperature conditions are determined by the reactor design. Therefore, the controlled variables are pH and dissolved oxygen, both of which are disturbed by solar radiation [5]. Concretely, pH is more critical in the growth process because of its direct influence on the photosynthesis process, and thus it is the controlled variable analysed in this work.
Traditionally, microalgae reactors are operated by On/Off controllers that work only during the daytime period. In this way, the pH of the microalgae varies significantly during the whole day, especially during nighttime, being harmful to the algae. Furthermore, this type of control does not achieve enough efficiency in productivity to compete against other biofuel sources in the energy market. Therefore, it is necessary to improve the control algorithms that allow the critical variables of the system to be maintained at optimum values while reducing the cost of biomass production. The Proportional-Integral-Derivative (PID) controllers are widely used in industry with satisfactory control results (performance) and can be used for these type of processes. Different examples can be found in the literature. An example of a linear Proportional-Integral (PI) controller with feedforward for pH control in tubular bioreactors can be found in [6]. A robust PID controller for pH control in raceway reactors based on Quantitative Feedback Theory (QFT) has been used in [7]. On the other hand, event-based control is gaining great interest for these kinds of processes, where the sensors are at a considerable distance from the control device. Moreover, these sensors can be wireless, so the use of event-based controllers would increase their life span. In [8], a controller with a sensor deadband produces a considerable reduction of CO losses in a microalgae tubular reactor. Another example of the application of event-based control can be seen in [9], where an event-based Generalized Predictive Controller (GPC) with a disturbance compensation approach is used for the effective use of CO in a raceway reactor. Subsequently, this GPC scheme was improved and combined with a selective control for dissolved oxygen [5]. Thus, through the event-based control paradigm, the desired trade-off between control performance and control effort was achieved. In addition, the actuator provides only the amount of gas needed, keeping the pH at an optimum value while reducing gas consumption.
In this work, the advantages of using PI control during the whole day (daytime and nighttime periods) against traditional On/Off control (performed only during daytime) are demonstrated. The greatest advantage that can be found in the use of PI control is the reduction in CO consumption, despite operating the reactor during the whole day. In this way, the necessary amount of CO must be injected to avoid losses to the atmosphere, while maintaining the pH at certain levels allowing the growth of the algae. Another advantage is the reduction in the Integrated Absolute Error (IAE) for pH, which helps to maintain the pH close to the set-point throughout daytime and nighttime. However, On/Off control leaves the pH to evolve free during nighttime, increasing the IAE value.
Moreover, this paper presents an event-based control architecture for PID controllers. The objective is to tune a classical time-driven PI for pH control in the raceway reactor, and then to add event-based capabilities but keeping the initial PI control design. The event-based systems allow a trade-off between control performance and control effort, being perfect for the microalgae process in raceway reactors. Thus, this type of event-based control improves the PI controller behaviour so that the CO consumed can be further reduced at the expense of a slight degradation of the pH, also reducing the associated valve control effort.
One of the best-known event-based sampling methods is the so-called Send-On-Delta (SOD) sampling [10,11], a deadband or level-crossing sampling method where a node samples the signal only when it changes of a fixed value with respect to the previously sampled value. A modified version of the SOD technique, called Symmetric-Send-on-Delta (SSOD) sampling [12,13,14], applied to a Proportional-Integral (PI) controller, has been used in this work. In particular, two control schemes from this sampling method, called SSOD-PI and PI-SSOD have been proposed. The difference between both architectures depends on were the triggering function is applied in the control loop. This method improves the SOD sampling with a symmetric deadband mapping. The stability properties and limit cycles conditions for first-order-plus-dead-time (FOPDT) processes are highlighted in [12].
Therefore, this work focuses on a simulation study of the event-based SSOD approach combined with a PI controller in a dynamic model for microalgae production [15]. Two control architectures of the SSOD event-based method (SSOD-PI and PI-SSOD) are compared to an On/Off control method, which is traditionally used to operate these kinds of reactors for pH control. The performed tests were oriented to establish a trade-off between control effort and control performance and present an alternative to traditional control. In addition, the advantages and disadvantages over classical time-driven PI control techniques are presented.
The paper is organized as follows. The control scheme is presented in Section 2, where the control problem and the SSOD architecture are also described. The controller design, results, and discussion obtained from the simulation study are presented in Section 3. Finally, conclusions are drawn in Section 4.
2. Material and Methods
This section describes the control problem, the Symmetric-Send-on-Delta approach and two configurations applied to a PI controller.
2.1. Microalgae Raceway Reactor
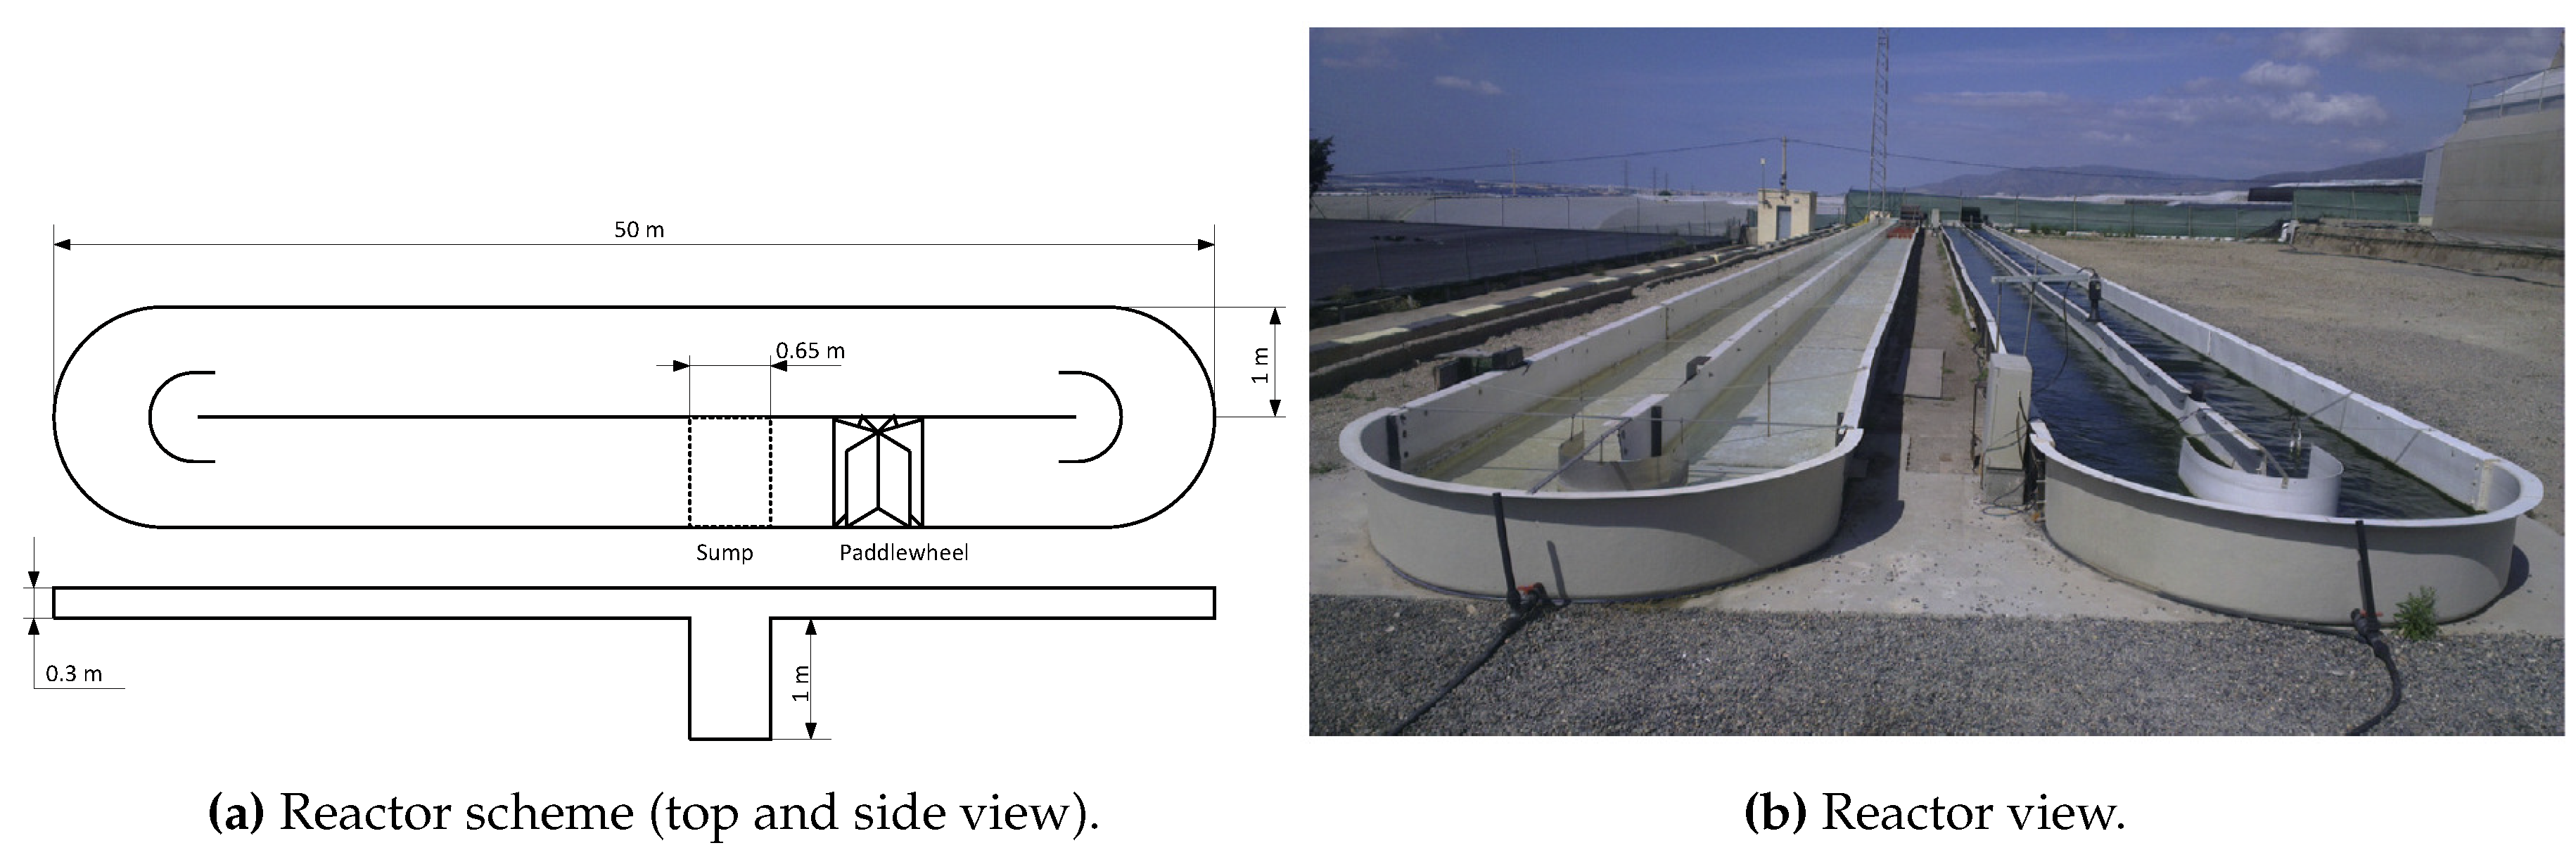
The reactor simulator model represents a raceway reactor located at “Estación Experimental Las Palmerillas” owned by the Fundación Cajamar Cajamar, Almería, Spain. This reactor has a total surface area of 100 , formed of two channels of 50 m that are connected by 1 m width U-shaped bends (Figure 1). The raceway reactor is operated at 0.2 m constant depth (20 total volume), as recommended in [16] to achieve the best overall hydraulic performance in terms of power consumption. Mixing is made with a 1.2 m diameter paddlewheel with eight blades of marine plywood, operated by an electric motor. Otherwise, carbonation is carried out in a sump (1 m deep and 0.65 m wide) at 1.8 m from paddlewheel. Three plate membrane diffusers at the bottom inject flue gas in the sump.
2.2. Reactor Dynamic Model
For the simulation results presented, a dynamic model of microalgae production in raceway reactors has been used [15]. The model is based on fundamental principles instead of empirical equations and takes into account mass balances, thermodynamic relationships and biological phenomena. This model can be used to predict the evolution of the main reactor variables, such as biomass concentration, pH and dissolved oxygen. It has been calibrated and validated using experimental data from a 100 pilot-scale raceway reactor, as can be seen in [15].
The culture growth is modelled as a function of the photosynthesis rate. The main parameter that determined the photosynthesis rate is the available light, which is based on different parameters such as external irradiance, culture characteristic, and reactor design [17]. The following equation represents the available light:
where t is the time, x the space, is the solar irradiance on an obstacle-free horizontal surface, is the extinction coefficient, is the biomass concentration, and h is the liquid height on the channels.
The photosynthesis rate is modelled with the available light by the following equation [4]:
where is the photosynthesis rate, is a solar distributed factor that represents the shadow projection on the perpendicular axis of the reactor walls, is the maximum photosynthesis rate for microalgae under culture conditions, n is the form exponent, and m are form factors for the exponential function of average irradiance. Furthermore, and are pre-exponential factors for the pH influence on the photosynthesis rate, and and are the activation energies of the Arrhenius model. is a respiration constant that represents the respiration phenomenon.
The influence of pH and dissolved oxygen in the photosynthesis rate equation is of special attention, being the main variables of the system that have to be controlled.
These equations describe the biological part of the system, while the mixing and the gas–liquid mass transfer are expressed by several balances formulated in terms of Partial Differential Equations (PDE).
In [18], the pH is related to other variables such dissolved oxygen, carbonate or bicarbonate by several equilibrium equations. From these balances’ equations, a prediction of pH along time and space can be obtained. In the following equation, the inorganic carbon concentration () is modelled taking into account the microalgae photosynthesis process and transport phenomena due to recirculation along the raceway reactor. We assumed constant velocity (v), and constant cross-sectional area due to the multiplication between the liquid height (h) and the channel width (w):
where is the carbon consumption rate, is the molecular weight of CO, and is the mass transfer coefficient for CO. The term represents the carbon dioxide in the liquid phase and represents the equilibrium concentration in the gas phase, which can be calculated by Henry’s law taking into account the CO properties in the air.
As for the inorganic carbon concentration, a balance equation for the dissolved oxygen is presented:
where is the photosynthesis rate previously described, is the molecular weight of the oxygen, and is the volumetric gas–liquid mass transfer coefficient for oxygen. The term represents the driving force, where the equilibrium concentration in the gas phase can be calculated by Henry’s law, as a function of the oxygen concentration in the gas phase.
Other mass balances can be applied to the paddlewheel and sump of the raceway reactor and represented by Ordinary Differential Equations (ODE) expressions. In the sump, CO is injected in a gaseous form to control pH, and the air is injected to remove dissolved oxygen accumulated in the reactor.
The oxygen balance is established from the relationship of the gases to the nitrogen molar ratio due its solubility is approximately zero and can be considered constant:
where is the oxygen to nitrogen molar ratio in the gas phase, defined in the inlet and outlet of the sump, is the molar volume under reactor conditions, and is the nitrogen molar fraction.
An analogous mass balance can be described for the carbon dioxide, where is the carbon dioxide to nitrogen molar ratio in the gas phase:
2.3. Microalgae Strain
The microalgae strain used corresponds to Scenedesmus almeriensis (CCAP 276/24). This microalga is characterized by a high growth rate, withstanding temperature up to 45 C and pH values from 7 up to 10, although its optimum conditions are 30 C and pH around 8. In particular, in this work, a set-point of 7.8 will be considered.
2.4. Control Problem
To maintain the microalgae culture in good conditions inside the raceway reactor, it is necessary to maintain two main variables at their optimal values, the pH and dissolved oxygen. These variables are controlled by injecting CO and air, respectively, into the sump. However, the pH has a more critical role than the dissolved oxygen and it will be the controlled variable in this work.
The control problem consists of maintaining the pH of the culture at a given level. The injection of CO coming from flue gases reduces the pH level due to the formation of carbonic acid, while the photosynthesis process increases the pH due to consuming CO and producing .
When more CO is injected in excess and it cannot be completely dissolved in the water, it is released into the atmosphere, being harmful to the environment. Thus, an adequate control algorithm is required to look for a trade-off between the pH control and the CO injections. Furthermore, reducing the number of CO injections in the reactor implies a reduction of the costs and an increment of the life-span of the electronic valves. Summarizing, the control scheme is presented in the following way: the process output is the culture pH, the aperture of the flue gas injection valve is the manipulated variable, and the solar radiation acts as the main disturbance.
The On/Off controllers are widely used for pH control in raceway reactors as in other industrial processes, due to its simplicity. Its behaviour is a relay with hysteresis and represents the most simple feedback controller that can be used to control a process. This type of control is suitable for processes that have two states (open and close) because the controller switches the control variable between two states (on or off), depending on the set-point error with respect to the controlled variable. However, this type of control is characterized by low accuracy and pH oscillations due to the changes in the control signal, causing a negative influence on microalgae. The On/Off valve is opened and flue gases are injected until the pH measure decreases below the set-point; then, the control valve is closed until the pH reaches a value above the set-point, and so on.
On the other hand, PI control has proven to be advantageous over traditional On/Off control, as shown in [6,7]. This type of control allows the pH to be maintained close to the set-point, reducing the characteristic oscillations of On/Off control and, in addition, improving the control signal of the valve.
Recently, the use of event-based PI controllers is increasing thanks to the advantages they have over the use of classical PI controllers. Using event-based architectures applied to PI controllers allows the reduction the CO consumption in the injections, granting a smooth degradation in pH. Moreover, it is also possible to reduce the control effort in the valve and, in addition, to increase the battery life span of wireless sensors.
2.5. Symmetric-Send-on-Delta Method
The event-based method, applied to a PI controller, used in this work is derived from the Send-On-Delta method [10,11]. This derivation is called Symmetric-Send-On-Delta [12], and, generally, it can be seen as a relay behaviour with hysteresis.
The behaviour can be described with the following equation:
In [12], it has been demonstrated that the parameter influences the system tolerance without affecting the system stability. For this reason, it has to be properly tuned to establish a trade-off between the increments of the steady-state error and the decrements of the number of events.
2.6. Event-Based Control Architectures
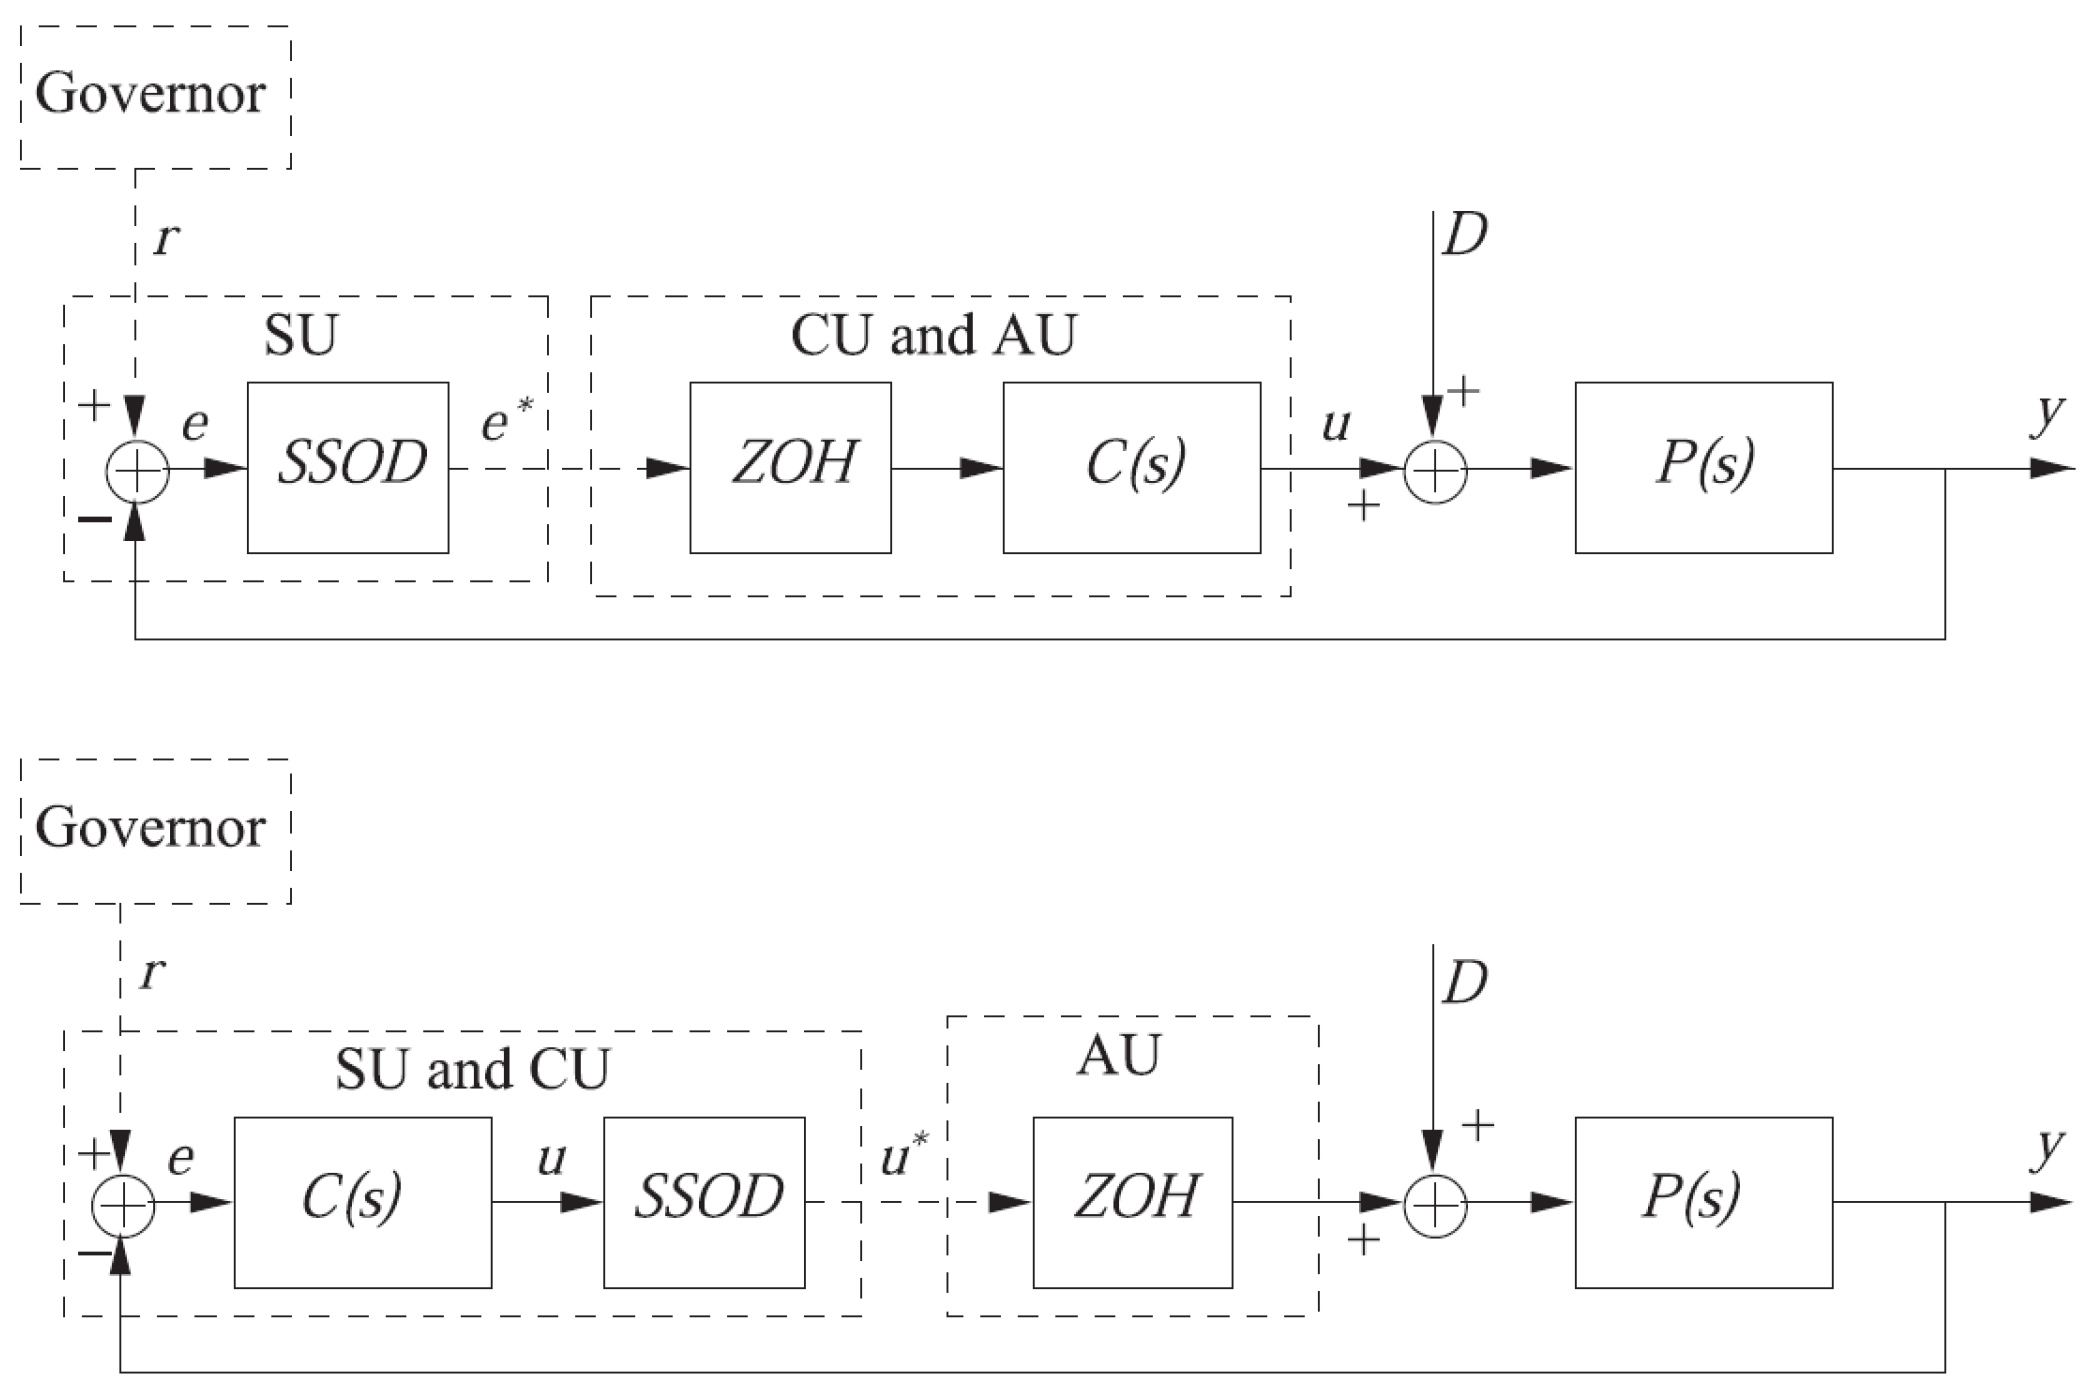
Two different architectures are implemented with the SSOD technique based on the event-triggered data exchange position in the control loop and are shown in Figure 2. In this figure, the dashed blocks are as follows:
- Governor: establishes the set-point for the process.
- Sensor Unit (SU): composed by the hardware associated with the sensors.
- Control Unit (CU): which corresponds to the controller hardware and software that computes the control signal.
- Actuator Unit (AU): which receives the control signal and applies it to the actuator.
These blocks can be coupled depending on the control configuration, being possible to use wireless devices when are far from the main control.
2.6.1. SSOD-PI Scheme
The first architecture is called SSOD-PI controller because the SSOD block is placed in the SU, before the PI controller in the control loop. In this scheme (Figure 2 top), the CU and the AU are located in the same machine while the SU is located separately. Thus, the communication from the sensor could be wireless. The control action is computed by the controller at a regular sampling rate, considering the last received sampled error. One of the benefits of this configuration is the reduction on the communication between the sensor and the control unit, improving the life span of the batteries of wireless sensors.
2.6.2. PI-SSOD Scheme
In the other scheme, the SSOD block is located after the PI controller in the control loop and it is called PI-SSOD. In this case, the SU and the CU are placed in the same machine, while the AU is located separately and can be powered independently. The control action is sent to the actuator, which holds the last received control signal until the next data exchanging triggering event. Analogous as the SSOD-PI scheme, this configuration presents a reduction of the number of changes in the control action, thus the actuator wear can be reduced.
3. Results and Discussion
This section discusses the results obtained in simulation with the application of two SSOD event-based architectures for the pH control problem in a raceway simulator [15]. Several experiments were performed with different solar radiation profiles during five days to observe how the event-based controller reacts to changes in the photosynthesis rate and in the pH variable. An evaluation of the pH referred to the Integrated Absolute Error, to the control effort and to the CO consumption associated with the injection time have been carried out.
The aim is to establish a comparison between the traditional On/Off controller architecture and the SSOD event-based method. An initial comparison was made between the traditional On/Off control operating during daytime and a PI control architecture that operates both during daytime and nighttime periods. Afterwards, further comparisons have been made with the SSOD event-based control architectures (SSOD-PI and PI-SSOD) from the initially designed PI controllers and applied to the combined daytime-nighttime solution. Results about the stability of SSOD-PI and PI-SSOD for FOPDT processes can be found in [12].
Usually, the pH control is performed only during the diurnal period because of its influence on the photosynthesis process. Thus, the system is working in open-loop during the night period to save CO injections and thus saving costs and CO losses. However, in this work, the control scheme will be evaluated for the whole day in order to analyse how the (event-based) control approach can contribute to control the system also during the night and without increasing the costs too much. Notice that the pH presents different dynamics at the diurnal and nocturnal periods. Thus, two different PI controllers will be designed for diurnal and nocturnal situations.
In a previous work [19], two different linear models were identified for both daytime and nighttime periods:
It is worth noting that the normalized dead time of the system, that is, the ratio between the dead time and the time constant, in both cases, is very small, i.e., the process is lag dominant. For this reason, among the wide variety of PID tuning rules [20], a Simple-Internal-Model-Control (SIMC) tuning rule [21,22] has been selected, which states that the PI parameters have to be selected as:
where is the dead time of the process, T is its time constant and is the desired closed-loop time constant. The value of should be greater than or equal to the system dead time. The closed-loop time constant, in the two cases, has actually been fixed as 0.2 times the open-loop time constants, which results in = 678 (daytime) and = 434.2 (nighttime) seconds. These values result, indeed, to be much higher than the dead times, ensuring a high robustness to the system, which is desirable by considering the linealization procedure of the system model (2)–(6). Then, the following PI controllers were obtained:
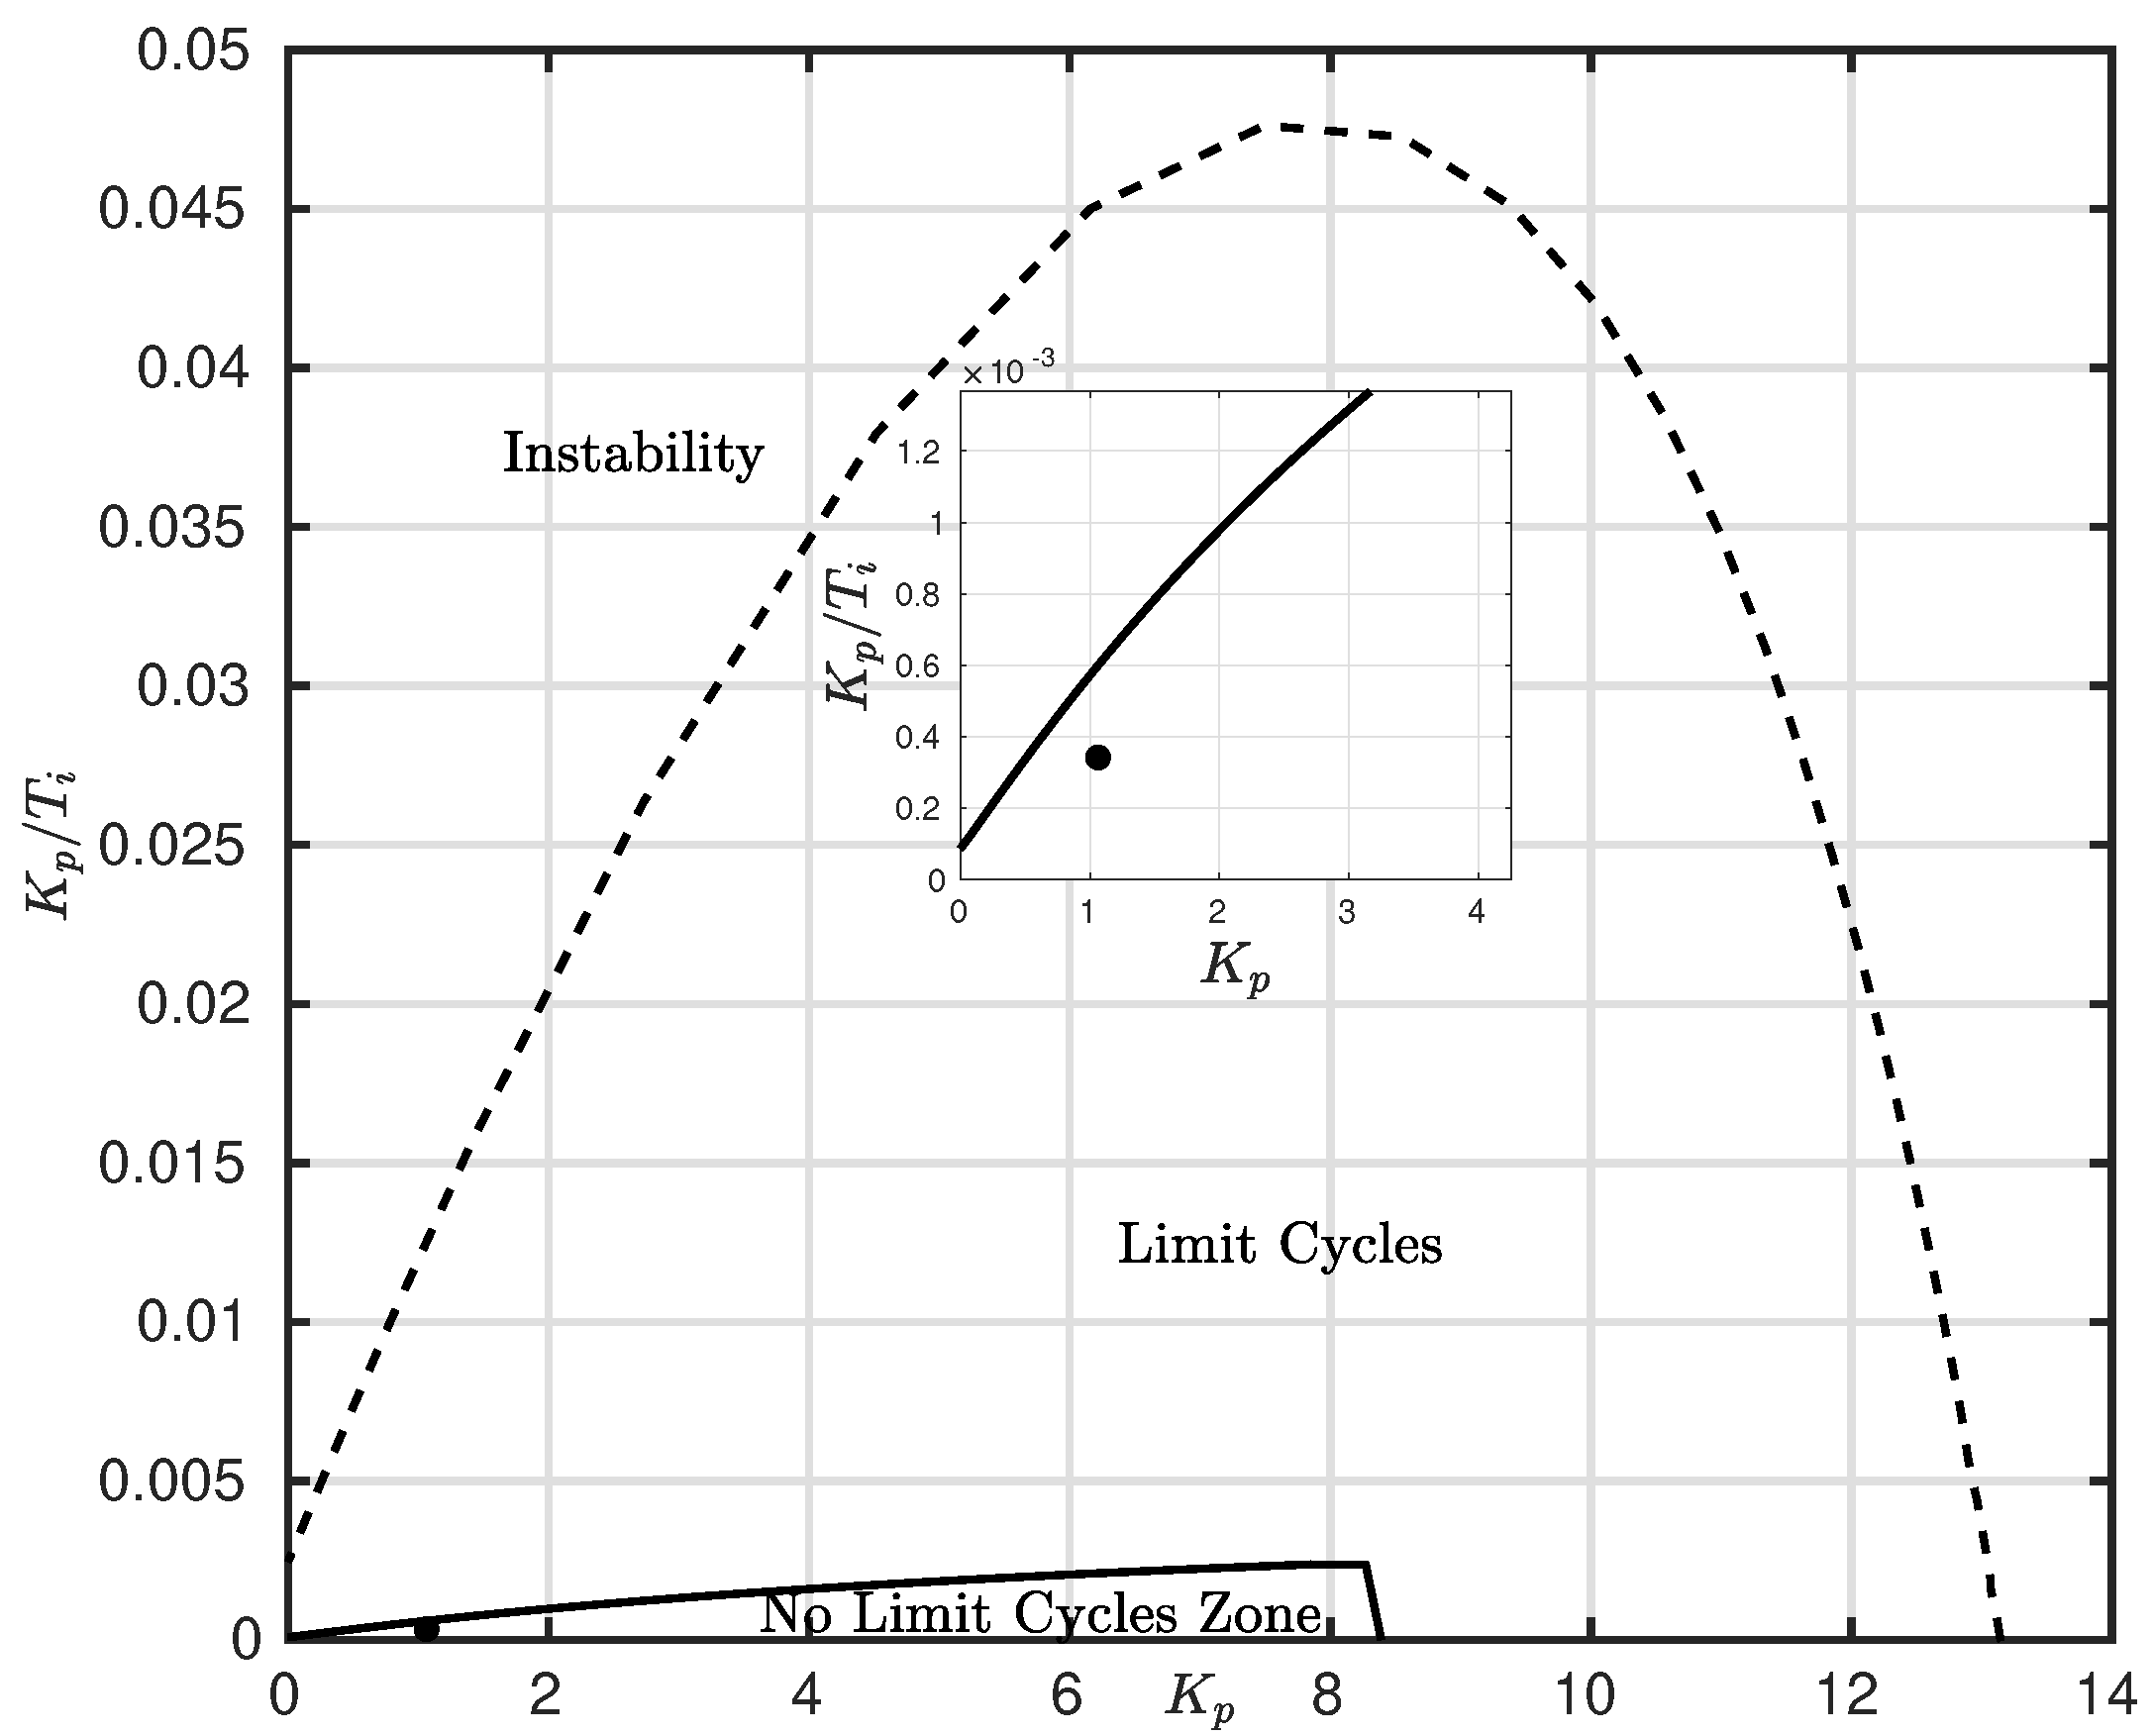
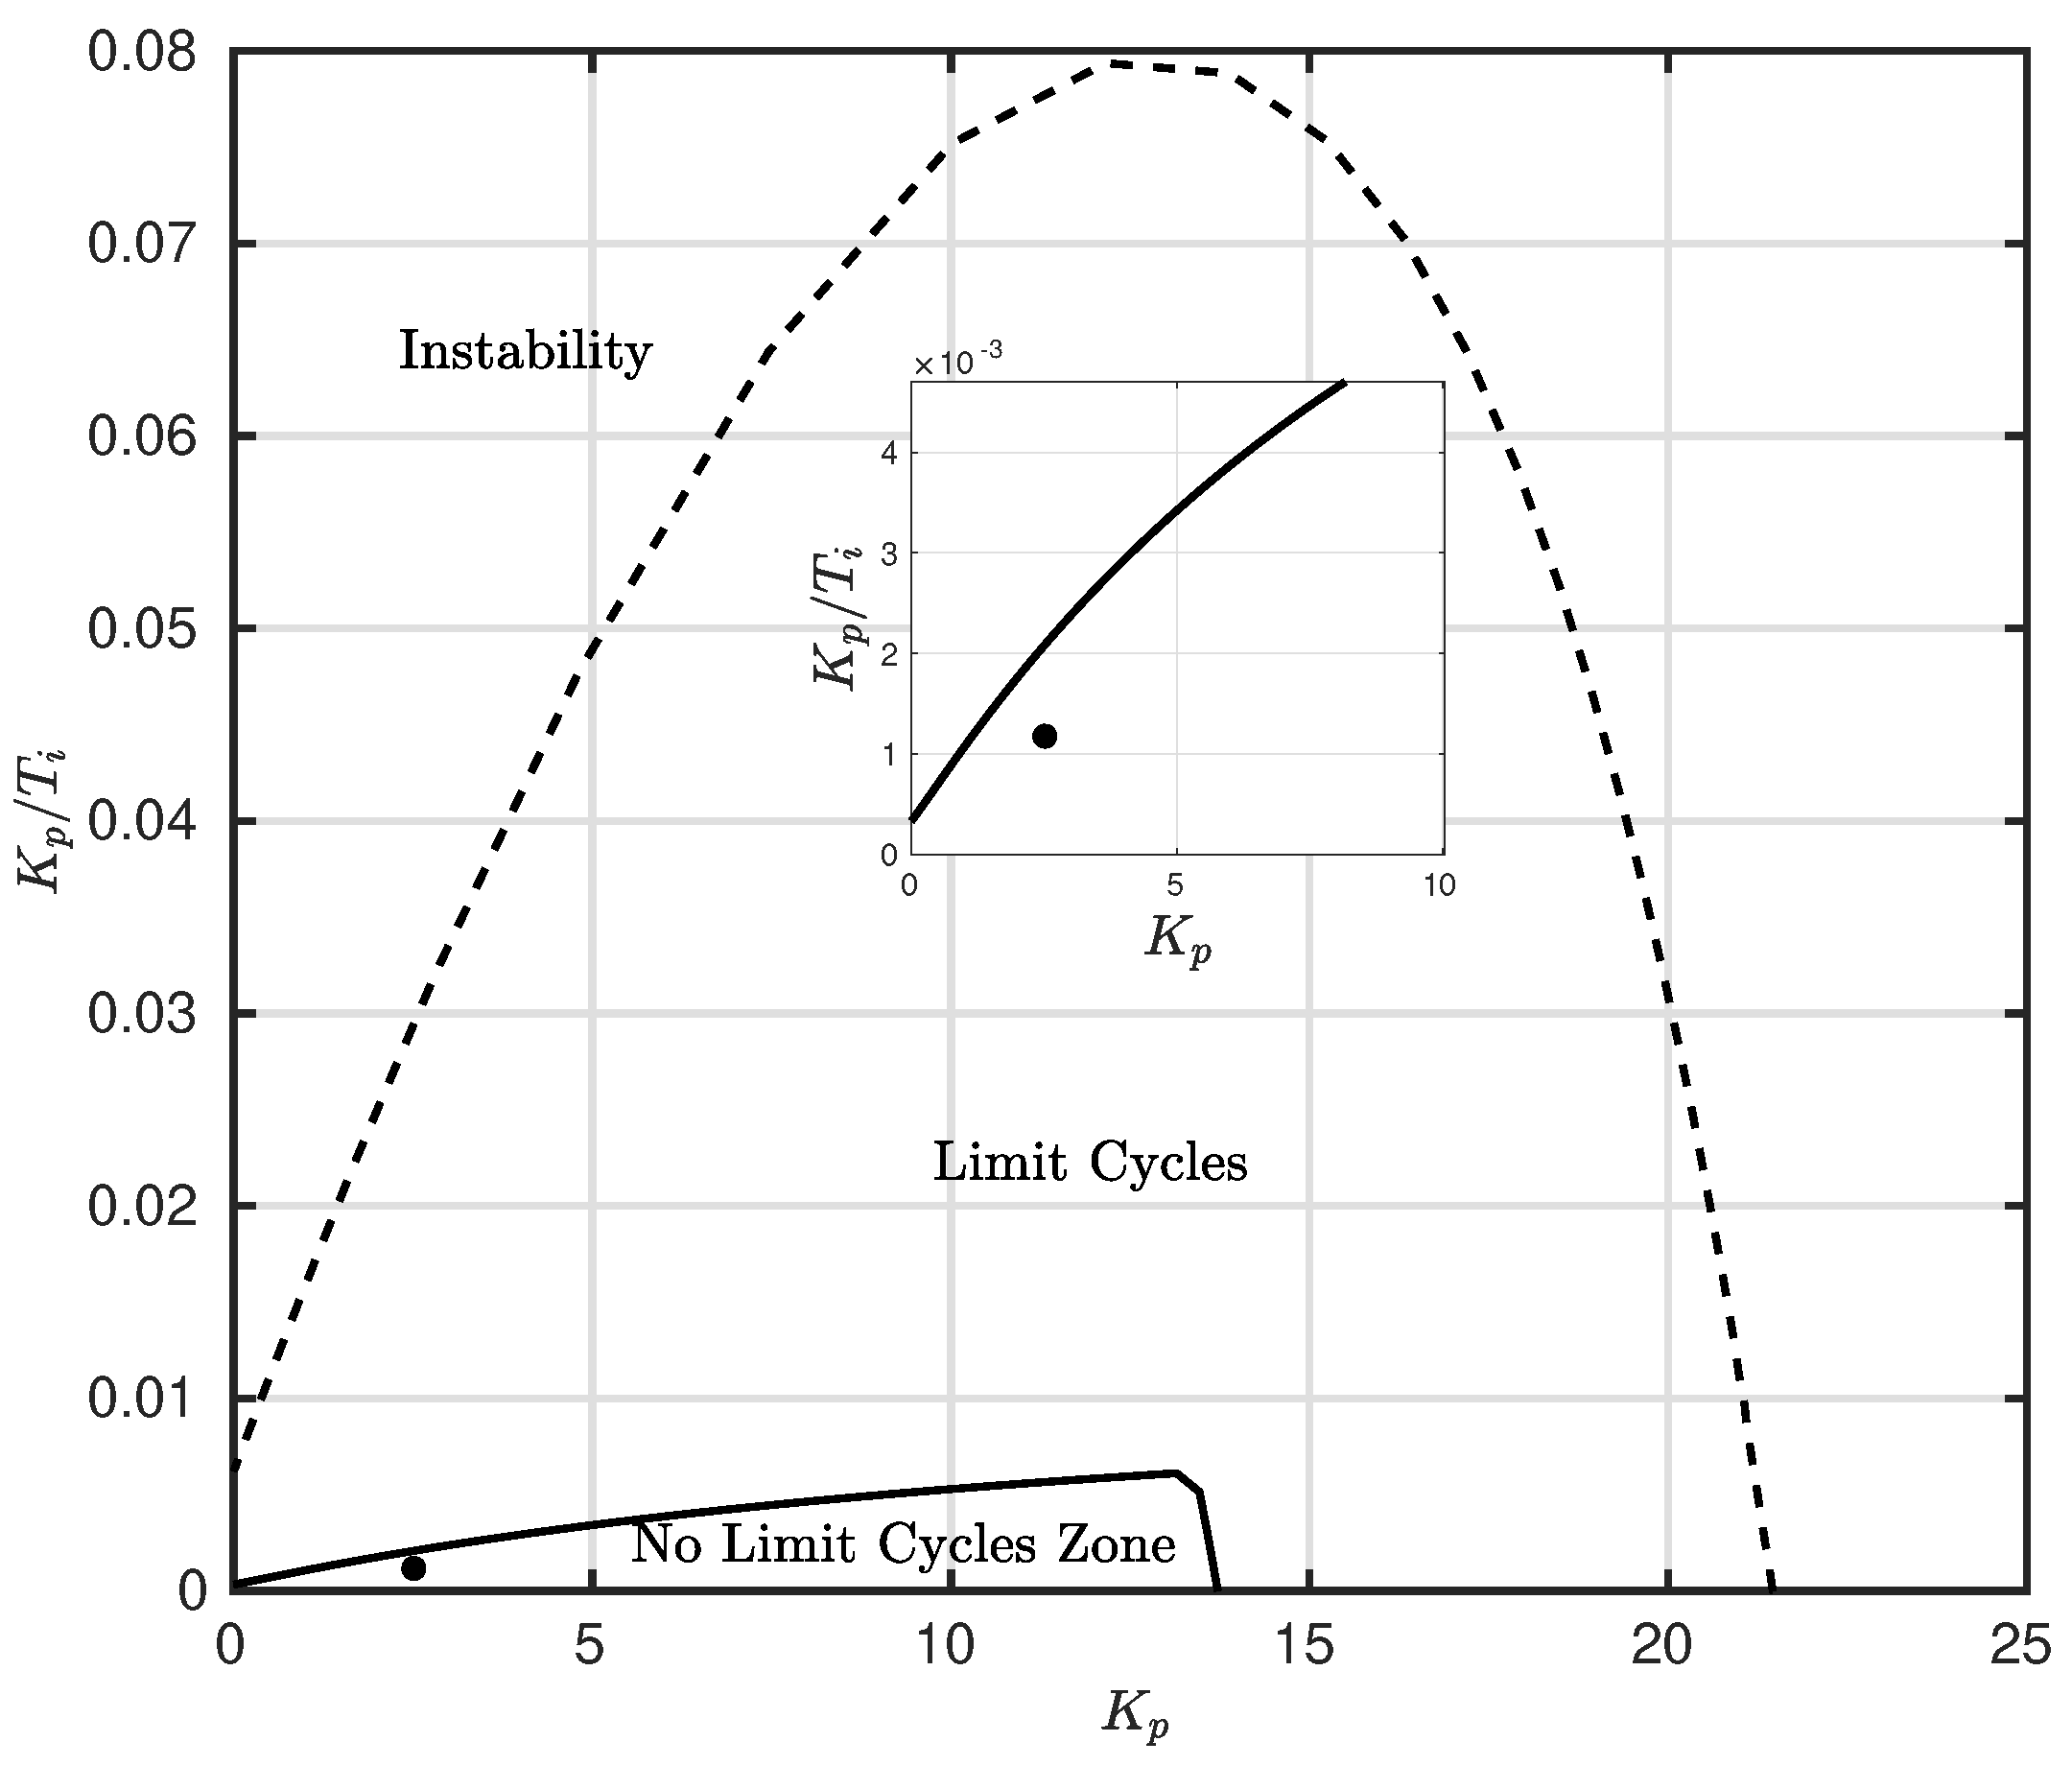
Obviously, when tuning a PI controller, it is important to ensure the asymptotic stability of the system [23,24,25]. For this reason, the analysis provided in [12] to determine the parameter stability region for which there are no limit cycles for the two systems (8) and (9) have been performed. Results are shown in Figure 3 and Figure 4 and they confirm that, for both controllers, the parameters have been selected so that the avoidance of limit cycles and instability is ensured. Moreover, the tuning is also robust as the parameters are far from the border of the region.
Table 1, Table 2 and Table 3 show the performance indexes for the control architectures tested during the five days. In these tables, is the Integrated Absolute Error (also during daytime and nighttime), is the total variation in the control signal, and are the number of events during daytime and nighttime periods, is the CO injection time to the reactor (also during daytime and nighttime) and is the CO consumption.
3.1. PI Controller Results
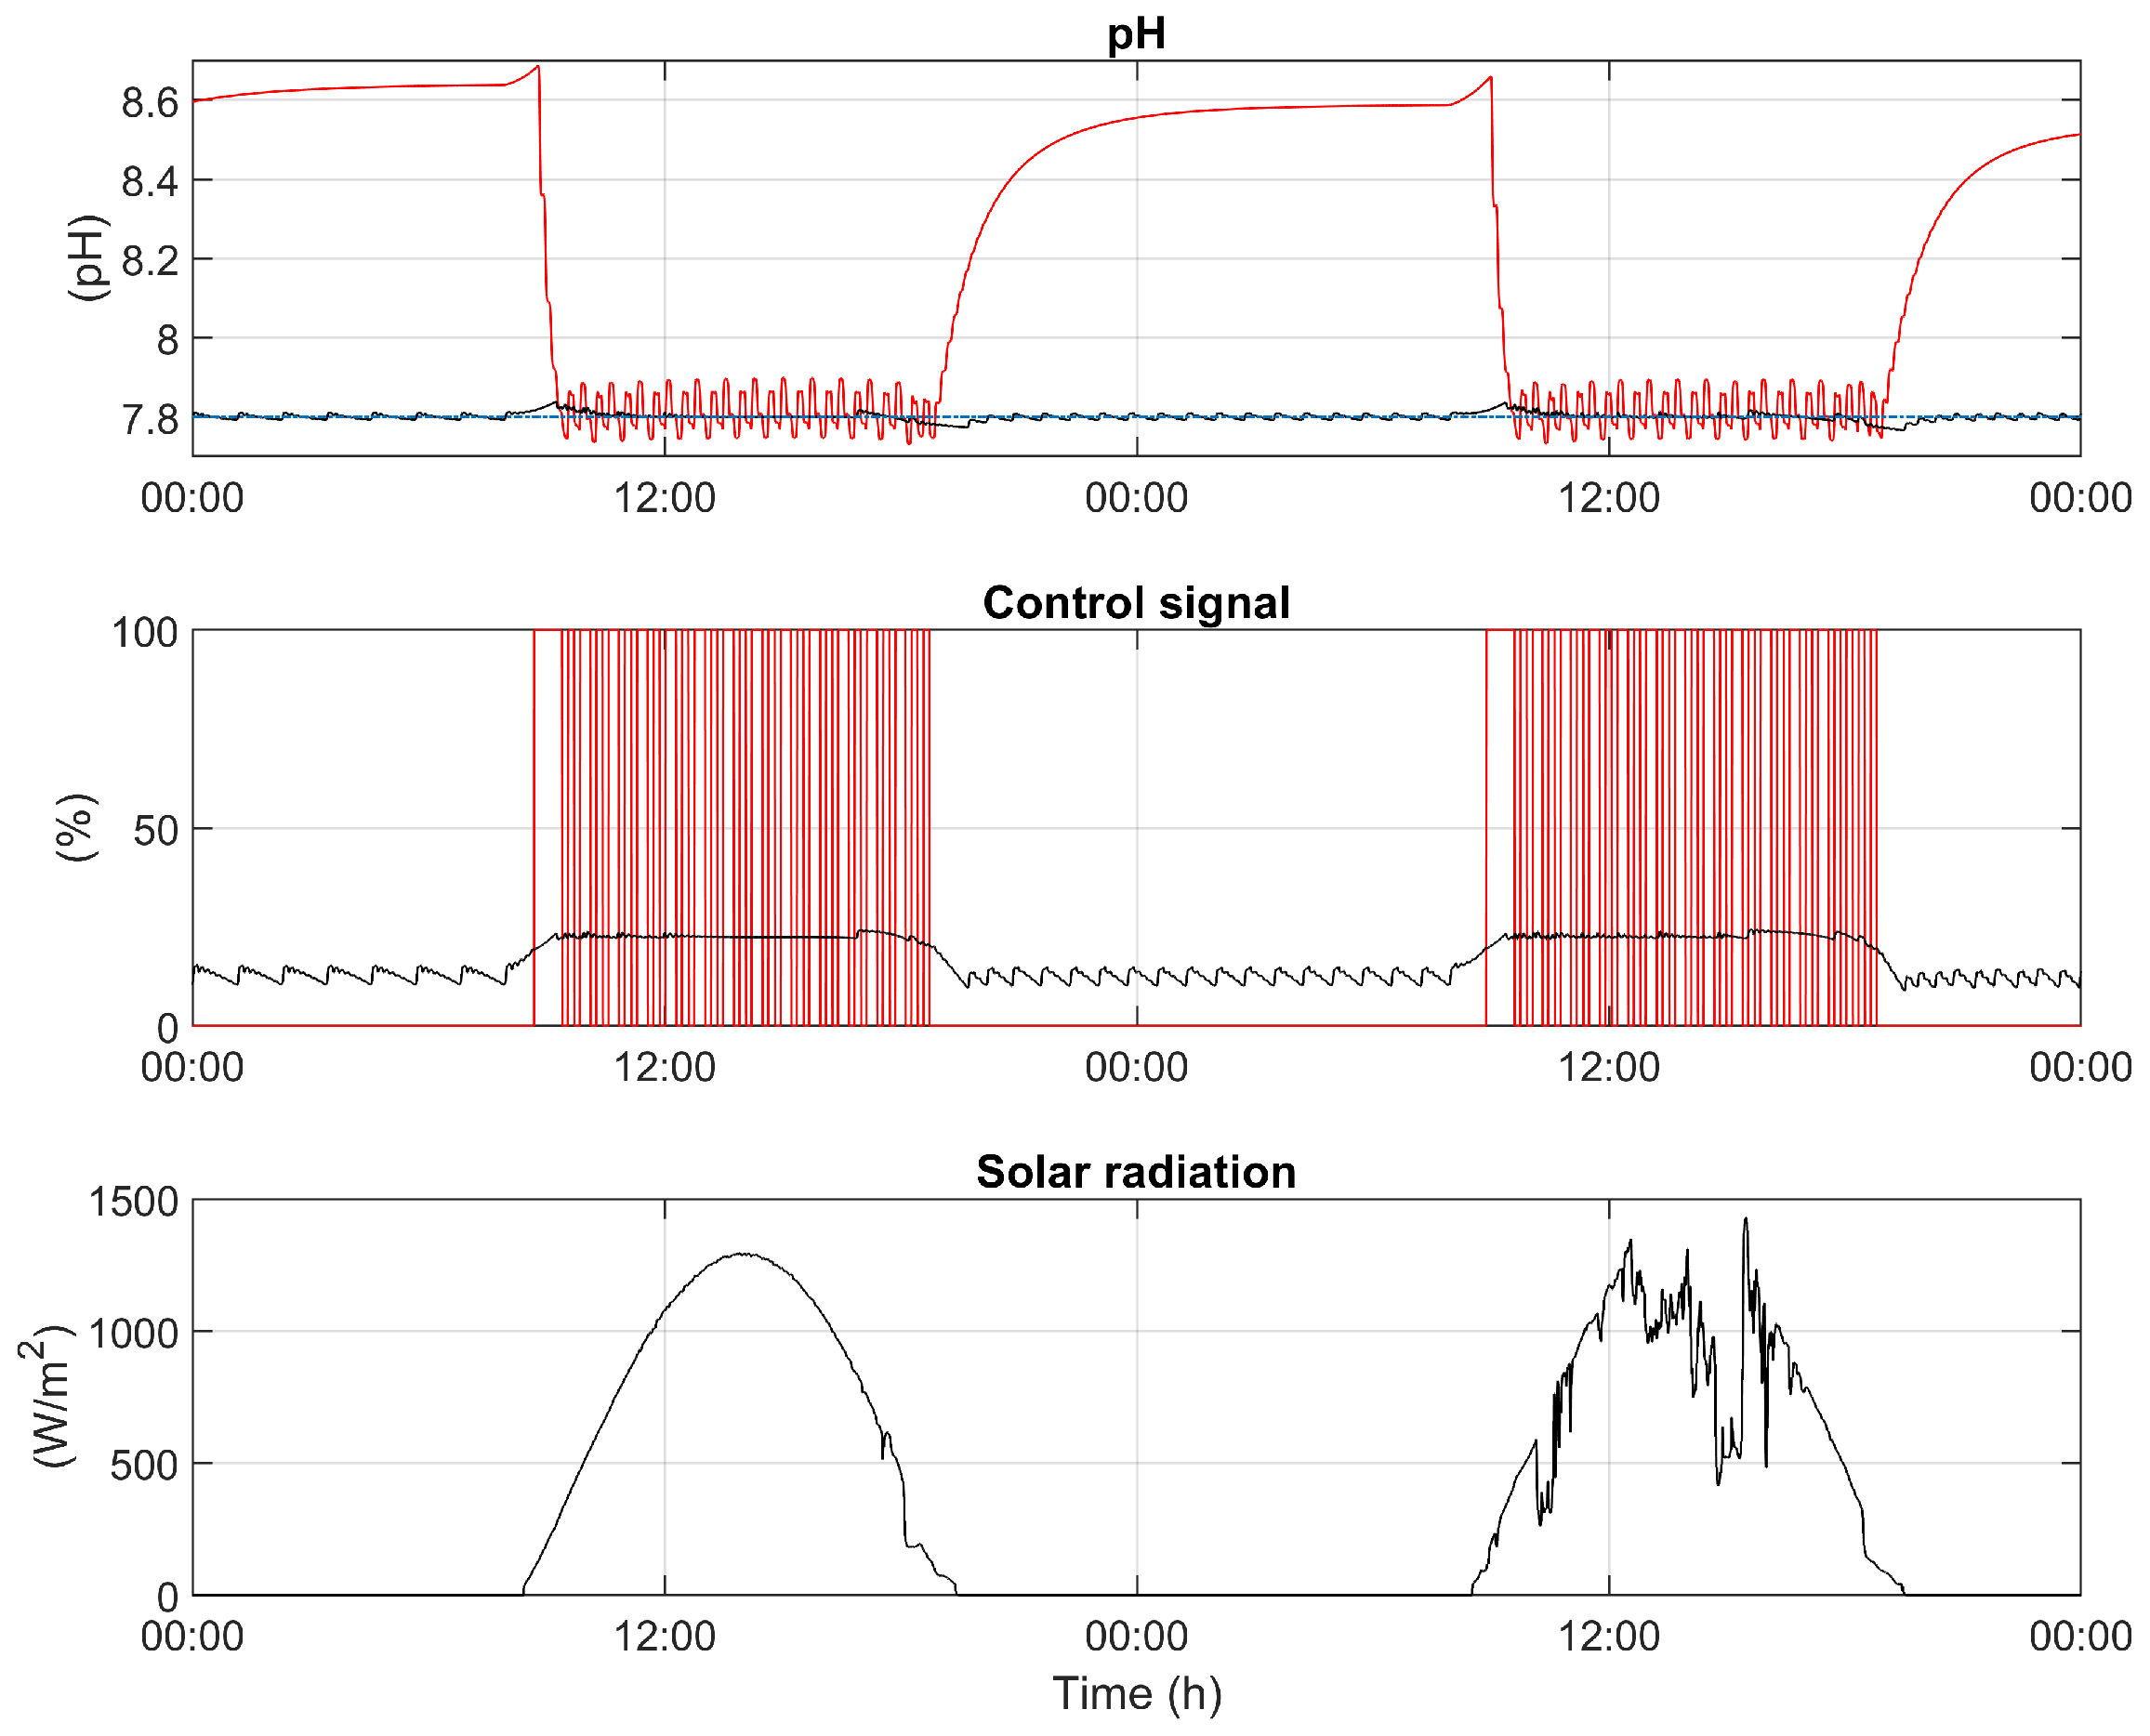
The first scenario shows the simulation results considering two control architectures, a traditional On/Off controller (red) operated during daytime (the system is in open loop during the nighttime) and a combined daytime-nighttime PI control (black). Figure 5 shows a two days simulation where it can be seen how the pH oscillates around set-point (7.8) during daytime for the On/Off controller. These oscillations range from 7.73 to 7.9 while, for the PI controller, the pH remains close to the set-point. Another remarkable fact is the variation of the pH during nighttime, which, in the case of On/Off control, can reach values of 8.7. On the opposite, the nighttime PI controller keeps the pH around set-point in that period.
Referring to the control effort, the control signal graphic of Figure 5 represents the opening of the injection valve for both control schemes. In this graphic, it can be verified that, in the case of the On/Off controller, the valve opens completely in short periods of time, which causes a great control effort. In the case of the PI controller, the maximum opening of the valve is around 23% and 12.5% for the daytime and nighttime periods, respectively.
In Table 1, the indexes for these two control schemes during the five days can be seen. Starting with the IAE, it is very remarkable how the PI controller reduces this error by up to 98.40% with respect to the On/Off control, since it also operates during the nighttime. Observing this error independently between the daytime and nighttime periods, reductions of the order of 88.21% and 99.08% respectively for the IAE can be achieved. From the point of view of the total variation in the control signal, the PI control reduces this variation by 94.16%, due to a more accurate control during the daytime and even the nighttime. This improvement in the control signal is reflected in a reduction of the control effort. The most remarkable comparison that can be made is about injection time and gas consumption. The PI controller reduces these values by 13.78% compared to the On/Off control, despite operating during the entire day and not only during the daytime period.
3.2. SSOD-PI Controller Results
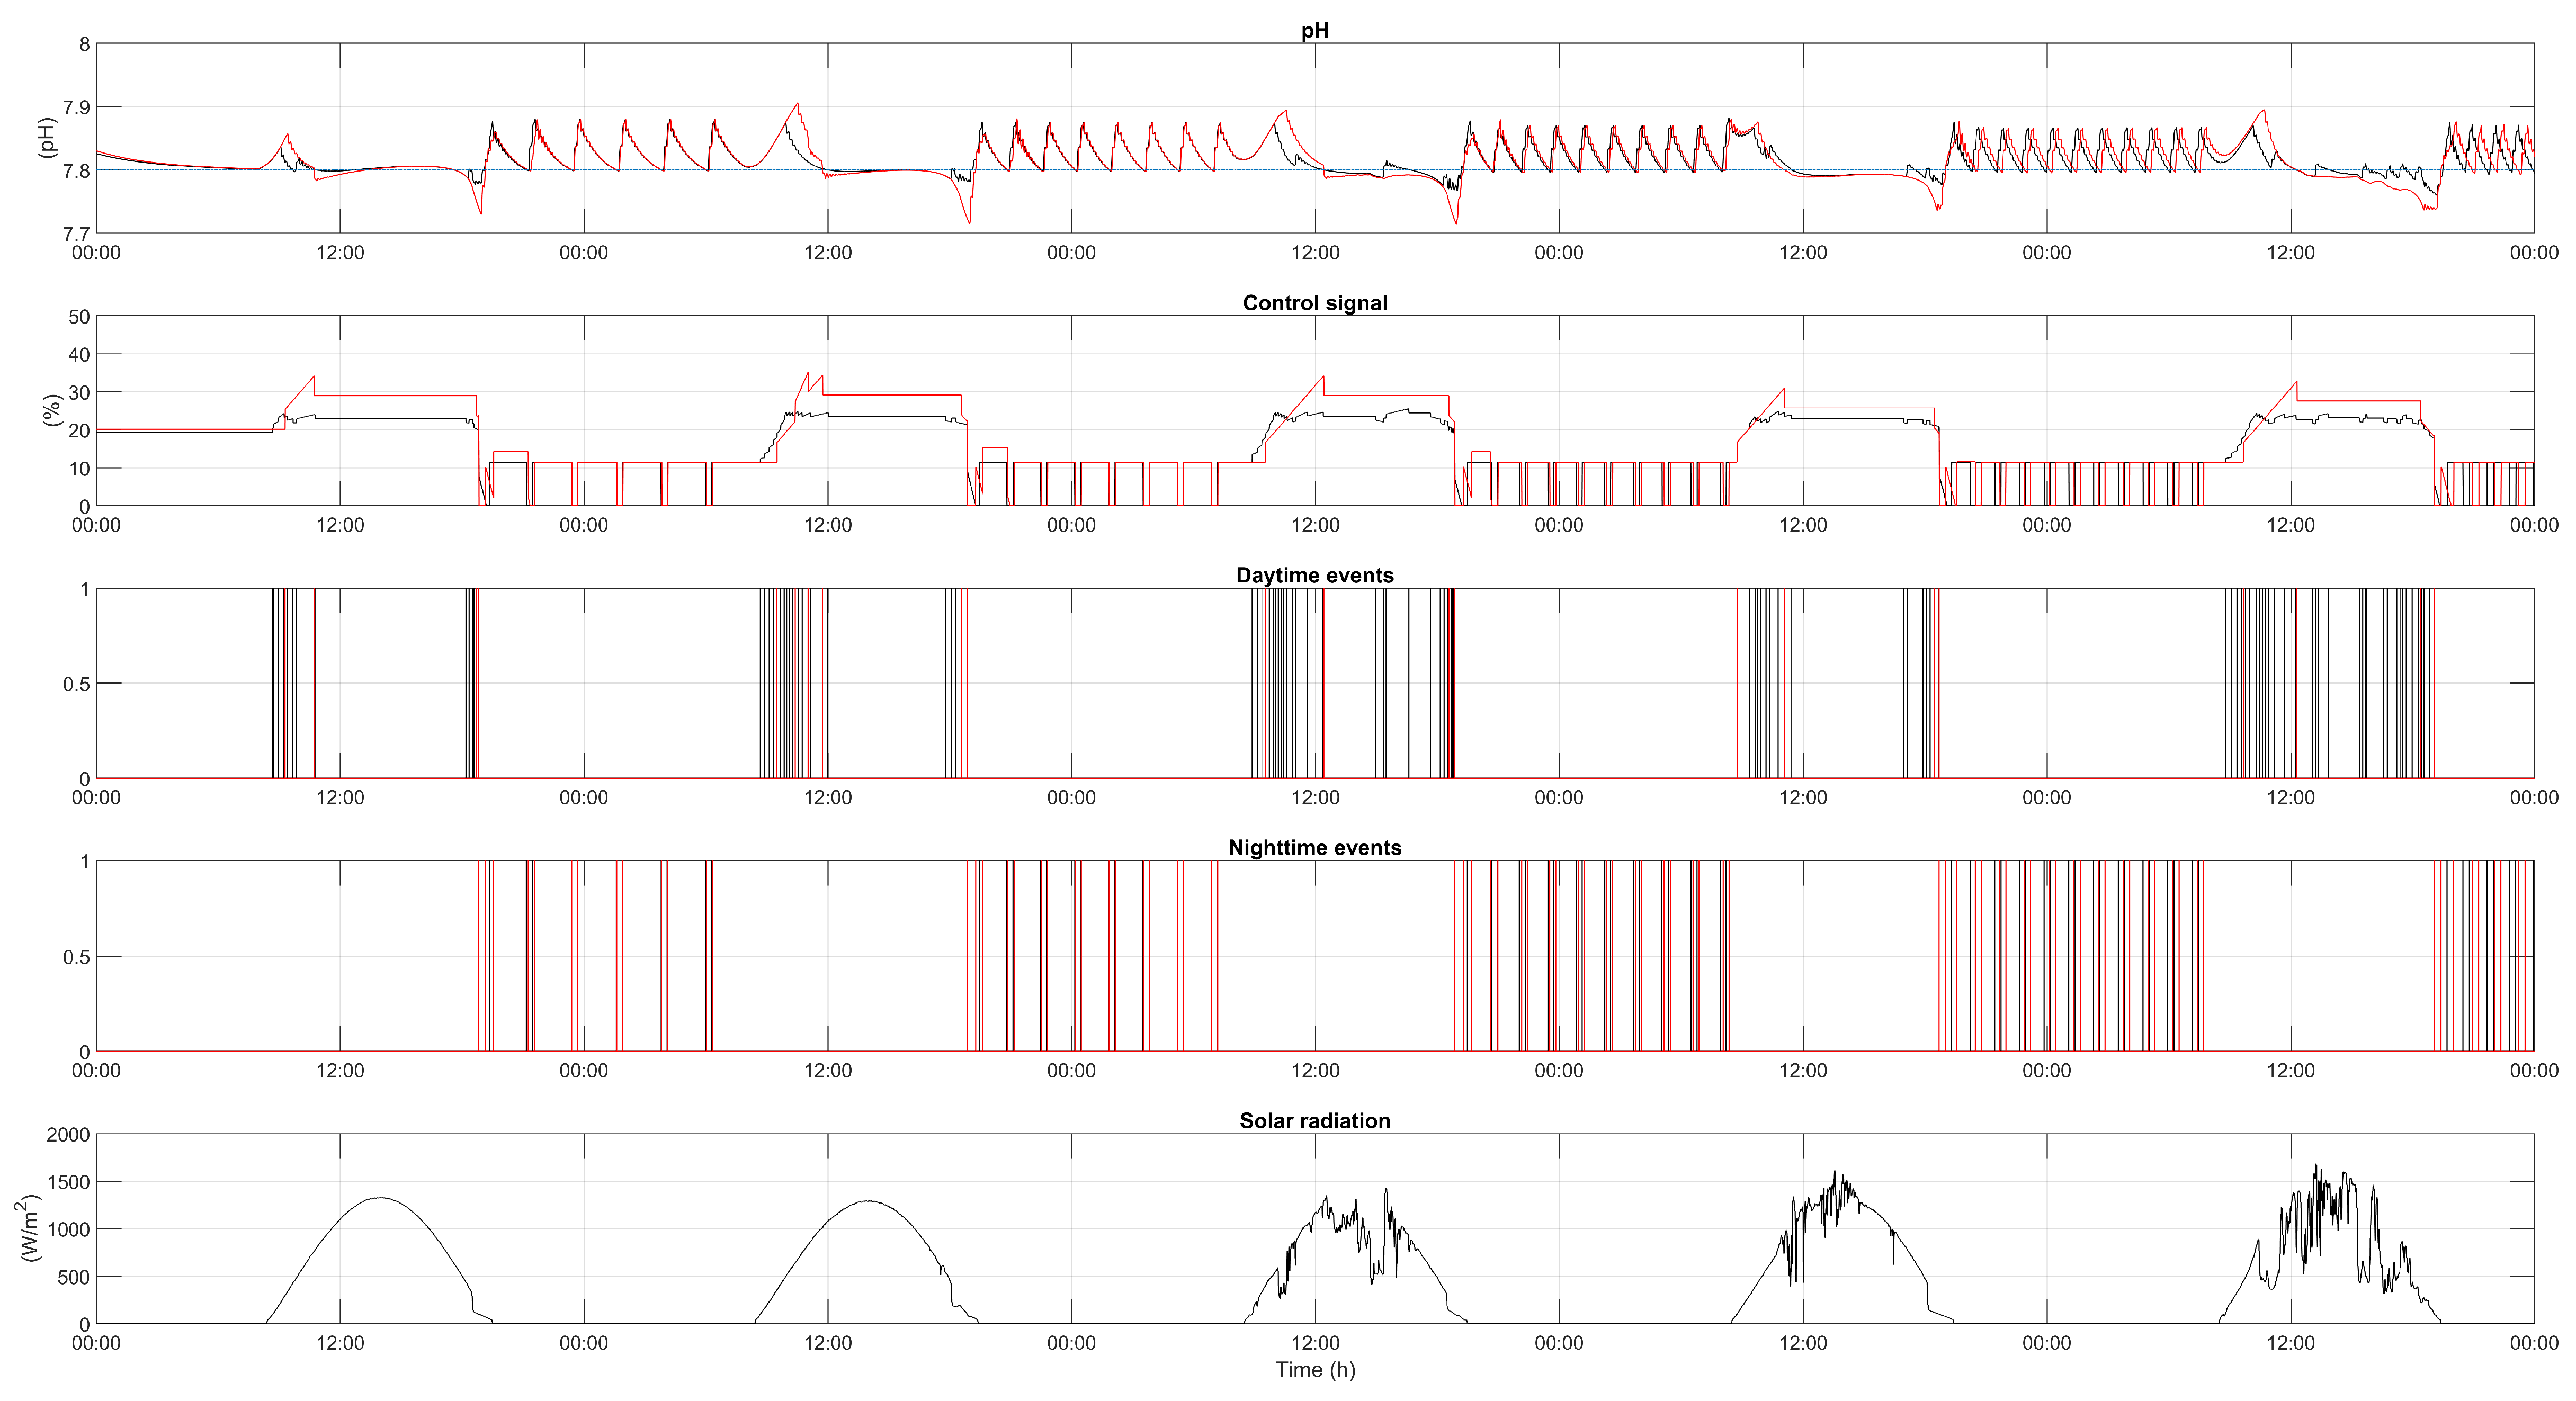
The second scenario presents the results of the SSOD-PI control architecture for five days. Figure 6 represents the SSOD-PI approach for the pH control problem with two different values ( = 0.01 and = 0.05 for daytime and = 0.05 for nighttime). By analysing the graphics of Figure 6, a comparison can be established between both values, which represent the lowest and higher values studied for this SSOD configuration. Regarding pH (first plot), during the night, both signals show similar behaviour, due to a value of 0.05. On the contrary, during the daytime period, the change in the tolerance produced by the parameter is appreciated. With a value of 0.01 (black), it can be seen that the pH it kept around set-point with a peak at the beginning of the daytime period caused by the dilution process (microalgae raceway reactor works in continuous mode, where biomass is extracted every morning at the same hour and medium is injected to keep the same volume in the reactor). On the other hand, with a value of 0.05 (red), this dilution peak is increased due to a lower tolerance caused by a higher value.
Moreover, at the end of the daytime, a peak is observed, which is produced by a decrease in solar radiation and greater tolerance in the event-band. For the control signal (second plot), during the nighttime period, the response of the valve is the same in both cases. Regarding the daytime, the control signal corresponding to a value of 0.05 shows a slower rise at the beginning of the daytime period and a higher average value with respect to the value of 0.01. In relation to the events (third and fourth plots), a decrease in the number of events can be appreciated when the value of the parameter increases, as it can be seen in Table 2.
The SSOD-PI performance indexes are presented in the Table 2, where the test carried out with different values ( = 0.01, 0.02, 0.03, 0.04 and 0.05) are collected for five days each. The IAE error increases during the daytime period as the value increases, while for the nighttime similar values result for all cases. This is due to the fact that a fixed value was used for the nighttime period while a value from 0.01 to 0.05 was used for the daytime, thus increasing the error tolerance. Therefore, due to this increase in the error tolerance, the number of events—or communications between the sensor and the control unit—will be reduced with the increase of the value, as can be seen in the table, especially during the daytime period. The total variation increases slightly in every case due to the tolerance imposed by the value, which makes the control signal during the daytime period more constant but higher in the case of = 0.05. Regarding the injection time and gas consumption, there is no significant variation between cases, ranging from 1537.70 min ( = 0.01) to 1545.70 maximum ( = 0.04), with the highest consumption during the daytime period.
3.3. PI-SSOD Controller Results
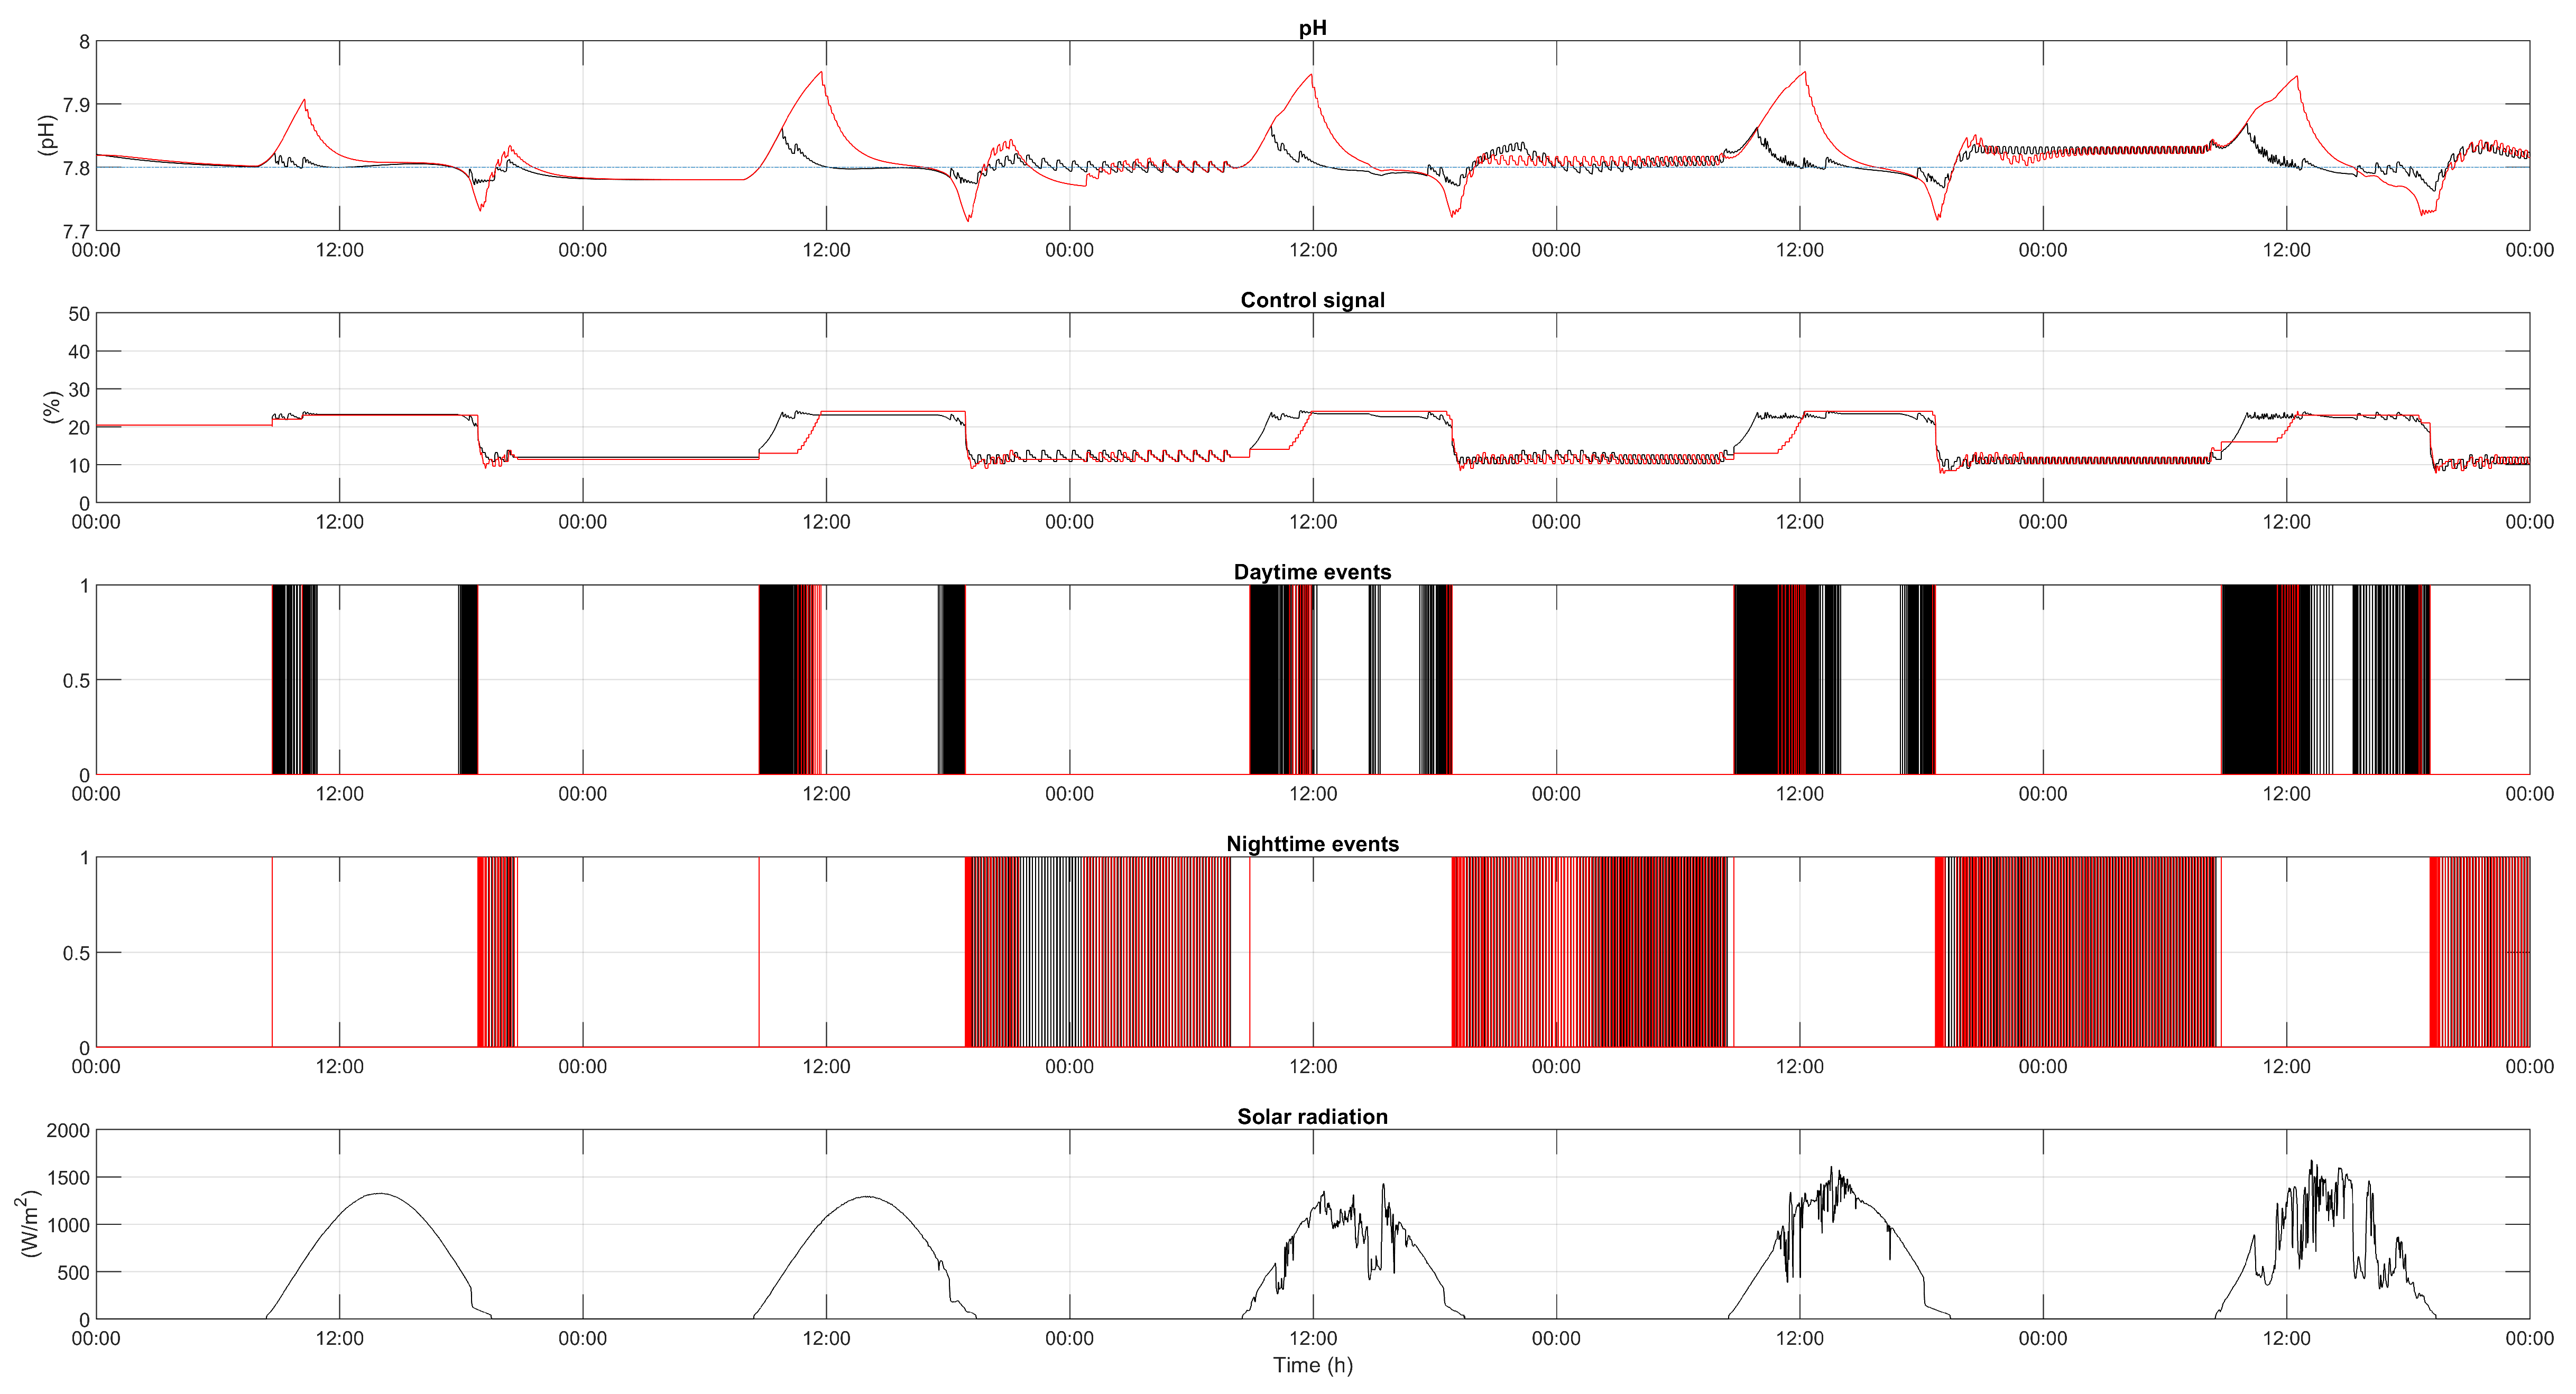
The last scenario presents the results of the PI-SSOD control architecture for five days. Figure 7 shows the simulation performed using different values ( = 0.001 and 0.01) to compare both results. In the top plot, the pH behaviour during the whole experiment is presented, where the pH reaches a higher value during the dilution process on daytime for the value of 0.01. This dilution process acts as a disturbance at the same hour for every simulated day and the controller reacts later than for a value of 0.001 because the event-based control method has a higher tolerance regarding the step in the control signal. On the other hand, for the value of 0.001, this peak is smaller and the pH remains around the set-point. In the nighttime period, a value of 0.006 for the PI controller was used for all the experiments, to maintain the pH oscillating close to the set-point.
In the second plot, the combined control signal applied to the actuator is shown. This signal is similar during the nighttime period for both simulations, and during the start of the daytime period, it can be seen that the signal corresponding to value of 0.01 begins to act later than for the value of 0.001.
The daytime and nighttime events are presented in the third and fourth plots, respectively. It can be seen that, during the daytime, there are fewer events than during nighttime, as it can be checked in Table 3, because of the small deadband in the nighttime period.
Table 3 shows the performance indexes for all cases studied ( = 0.001, 0.003, 0.005, 0.007 and 0.01) during a period of five days. Comparing the IAE, it can be appreciated that it increases as the value increases because the increments in the control signal are greater. The error during nighttime is similar in all cases, due to the same value used in that period. The total variation does not show a regular increase or decrease, and it varies depending on the value because the control signal is similar in all cases. The only observed difference is a later actuation during the daytime period. The daytime events are reduced as the value increases and they remain similar during nighttime as the IAE and the nighttime events. The injection time and gas consumption do not show much variation in the analyzed cases. In the case of = 0.01, the reduction in the injection time due to the dilution peak above the set-point is compensated with an increase due to the opposite effect, the period in which the pH remains below the set-point. Thus, gas consumption is similar to the case of = 0.001, where the pH remains close to the set-point.
3.4. Discussion
As verified from the first scenario comparing the On/Off control with the PI control architecture, this last scheme brings a series of benefits to the pH control problem with respect to the traditional one. It provides an improvement in the CO usage even operating the reactor during both daytime and nighttime, while the On/Off control was used only during the diurnal period.
On the other hand, the event-based control architectures based on the SSOD method and coupled with a classical time-driven PI (SSOD-PI and PI-SSOD) controller also count with the benefits that improve the reactor control compared to the traditional On/Off control. Comparing these event-based control architectures with respect to the PI control, certain advantages are obtained accompanied by a series of disadvantages related to the trade-off between tolerance and control accuracy. Looking at Table 1, Table 2 and Table 3, the first advantage for the event-based schemes is the reduction of the CO consumption, at the expense of degrading the pH control performance slightly by increasing the IAE values. This reduction is obviously more relevant when the plant operates for long periods of time (i.e., months). The second advantage is related to the control effort, which is reduced due to control tolerances established in both daytime and nighttime periods, as can be seen, by the total variation and injection time.
Finally, the two event-based control architectures (SSOD-PI and PI-SSOD) show some differences between them regarding the event-based architectures and the values suitable for its operation. One of the main differences that can be seen between the two architectures is that the parameter has a greater influence on the PI-SSOD scheme since small variations of this parameter showed greater changes in IAE, as from Table 2 and Table 3. The PI-SSOD scheme shows a greater reduction in the total variation of the control signal with respect to the SSOD-PI. On the contrary, the SSOD-PI scheme shows less number of events, being more suitable for use with wireless sensors. Regarding the injection time, it can be appreciated that, for the PI-SSOD architecture, it is slightly higher than for the SSOD-PI one. These differences are due to the event-based triggering method in both cases, where the parameter does not work in the same way, and therefore, it must be selected regarding the needs of the process.
4. Conclusions
In this paper, two event-based control architectures derived from the SSOD method have been presented. Two event-based PI controllers (for daytime and nighttime periods) with different values were evaluated to establish a comparison with classical time-based PI controllers and traditional On/Off control. The main objective is to reduce CO injection and control effort in the reactor maintaining a satisfactory pH control within established thresholds.
Simulation tests with both event-based architectures have been carried out obtaining promising results in the response of pH and gas consumption. These proposed event-based controllers provide improvements in the Integrated Absolute Error, gas consumption and control effort with respect to the traditional On/Off control for this process. The use of classical PI controllers improves traditional control, and then the use of event-based controllers coupled with PI ones offers even more advantages. One of the most remarkable results is the need to operate the reactor throughout the whole day (daytime and nighttime periods) versus the daytime operation of the traditional control to improve the pH control and save CO. The tolerance in the output signal for the daytime and nighttime periods was better controlled, reducing CO consumption and improving the control effort at the same time, which results in benefits in terms of cost savings and maintenance.
The results have shown that the output tolerance can be varied by adjusting the parameter, becoming another tuning variable in the control architecture. The higher this parameter is, the greater the process tolerance, reducing the number of events at the expense of degrading control performance.
The use of the proposed event-based controllers can improve the biomass production and would reduce the costs of the operations. In general, these controllers allow the use of wireless sensors/actuators and its implementation does not require a special hardware for the controller, as the control code is fairly simple. It is also worth stressing that event-based control somehow mimics the manual control of an operator, who usually changes the value of the manipulated variable when an event occurs. For this reason, it is likely that this strategy is well accepted by operators. Future work will consist of the implementation of the proposed control strategies in a real raceway reactor.
Author Contributions
E.R.-M. participates in the implementation, validation and analysis of the presented data. He also contributed in the writing—original draft preparation. M.B. (Manuel Beschi) participated in the writing—original draft preparation and the design of the proposed event-based control methodology. A.V., M.B. (Manuel Berenguel) and J.L.G. contributed in writing—review and editing, formal analysis and funding acquisition. Moreover, A.V. participated in the evaluation of the event-based control approaches, and M.B. (Manuel Berenguel) and J.L.G. in the implementation and analysis of the simulator for the microalgae raceway reactor.
Funding
This work has been partially funded by the following projects: DPI2014-55932-C2-1-R and DPI2017-84259-C2- 1-R (financed by the Spanish Ministry of Science and Innovation and EU-ERDF funds), and the European Union’s Horizon 2020 Research and Innovation Program under Grant Agreement No. 727874 SABANA.
Conflicts of Interest
The authors declare no conflict of interest.
Abbreviations
The following abbreviations are used in this manuscript:
| FOPDT | First-Order-Plus-Dead-Time |
| QFT | Quantitative Feedback Theory |
| IAE | Integrated Absolute Error |
| IT | Injection Time |
| ODE | Ordinary Differential Equation |
| PDE | Partial Differential Equation |
| PID | Proportional-Integral-Derivative |
| PI-SSOD | Proportional-Integral-Symmetric-Send-On-Delta |
| SIMC | Simple-Internal-Model-Control |
| SOD | Send-On-Delta |
| SSOD | Symmetric-Send-On-Delta |
| SSOD-PI | Symmetric-Send-On-Delta-Proportional-Integral |
| TV | Total Variation |
References
- Bahadar, A.; Bilal Khan, M. Progress in energy from microalgae: A review. Renew. Sustain. Energy Rev. 2013, 27, 128–148. [Google Scholar] [CrossRef]
- Oswald, W.J.; Golueke, C.G. Biological transformation of solar energy. Appl. Microbiol. 1960, 2, 223–262. [Google Scholar]
- Weissman, J.; Goebel, R. Design And Analysis of Pond System for the Purpose of Producing Fuels; Solar Energy Research Institute, U.S. Department of Energy, Microbial Products, Inc.: Fairfield, CA, USA, 1987.
- Costache, T.A.; Acién, F.G.; Morales, M.M.; Fernández-Sevilla, J.M.; Stamatin, I.; Molina, E. Comprehensive model of microalgae photosynthesis rate as a function of culture conditions in photobioreactors. Appl. Microbiol. Biotechnol. 2013, 97, 7627–7637. [Google Scholar] [CrossRef]
- Pawlowski, A.; Mendoza, J.L.; Guzmán, J.L.; Berenguel, M.; Acién, F.G.; Dormido, S. Selective pH and dissolved oxygen control strategy for a raceway rector within an event-based approach. Control Eng. Pract. 2013, 44, 209–218. [Google Scholar] [CrossRef]
- Fernández, I.; Peña, J.; Guzmán, J.L.; Berenguel, M.; Acién, F.G. Modelling and control issues of pH in tubular photobioreactors. IFAC Proc. 2010, 43, 186–191. [Google Scholar] [CrossRef]
- Hoyo, A.; Guzmán, J.L.; Moreno, J.C.; Berenguel, M. Control Robusto con QFT del pH en un Fotobiorreactor Raceway. In Proceedings of the Jornadas de Automática, Gijón, Spain, 6–8 September 2017. [Google Scholar]
- Pawlowski, A.; Fernández, I.; Guzmán, J.L.; Berenguel, M.; Acién, F.G.; Normey-Rico, J.E. Event-based predictive control of pH in tubular photobioreactors. Comput. Chem. Eng. 2014, 65, 28–39. [Google Scholar] [CrossRef]
- Pawlowsli, A.; Mendoza, J.L.; Guzmán, J.L.; Berenguel, M.; Acién, F.G.; Dormido, S. Effective utilization of flue gases in raceway reactor with event-based pH control for microalgae culture. Bioresour. Technol. 2014, 170, 1–9. [Google Scholar] [CrossRef] [PubMed]
- Miskowicz, M. Send-on-delta: An event-based data reporting strategy. Sensors 2006, 6, 49–63. [Google Scholar] [CrossRef]
- Vasyutynskyy, V.; Kabitzsh, K. Implementation of PID controller with send-on-delta sampling. In Proceedings of the International Control Conference, Glasgow, UK, 8–11 May 2006. [Google Scholar]
- Beschi, M.; Dormido, S.; Sánchez, J.; Visioli, A. Characterization of symmetric send-on-delta PI controllers. J. Process Control 2012, 22, 1930–1945. [Google Scholar] [CrossRef] [Green Version]
- Beschi, M.; Dormido, S.; Sánchez, J.; Visioli, A. Tuning rules for event-based SSOD-PI controllers. In Proceedings of the 20th Mediterranean Conference on Control & Automation, Barcelona, Spain, 3–6 July 2012; pp. 1073–1078. [Google Scholar]
- Pawlowski, A.; Beschi, M.; Guzmán, J.L.; Visioli, A.; Berenguel, M.; Dormido, S. Application of SSOD-PI and PI-SSOD event-based controllers to greenhouse climatic control. ISA Trans. 2016, 65, 525–536. [Google Scholar] [CrossRef] [PubMed]
- Fernández, I.; Acién, F.G.; Guzmán, J.L.; Berenguel, M.; Mendoza, J.L. Dynamic model of an industrial raceway reactor for microalgae production. Algal Res. 2016, 17, 67–78. [Google Scholar] [CrossRef]
- Mendoza, J.L.; Granados, M.R.; de Godos, I.; Acién, F.G.; Molina, E.; Banks, C.J.; Heaven, S. Fluid-dynamic characterization of real-scale raceway reactors for microalgae production. Biomass Bioenergy 2013, 54, 267–275. [Google Scholar] [CrossRef]
- Acién, F.G.; Fernández, J.M.; Molina-Grima, E. Photobioreactors for the production of microalgae. Rev. Environ. Sci. Biotechnol. 2013, 12, 2–21. [Google Scholar]
- Camacho, F.; Acién, F.G.; Sánchez, J.; García, F.; Molina, E. Prediction of dissolved oxygen and carbon dioxide concentration profiles in tubular photobioreactors for microalgal culture. Biotechnol. Bioeng. 1999, 62, 71–86. [Google Scholar]
- Rodríguez Miranda, E.; Beschi, M.; Guzmán, J.L.; Berenguel, M.; Visioli, A. Application of a Symmetric-Send-On-Delta Event-Based Controller for a Microalgal Raceway Reactor. Available online: https://ecc19.eu (accessed on 12 March 2019).
- O’Dwyer, A. Handbook of PI and PID Controller Tuning Rules; Imperial College Press: London, UK, 2009. [Google Scholar]
- Skogestad, S. Simple analytic rules for model reduction and PID controller tuning. In Proceedings of the 2nd IFAC Conference on Advances in PID Control, Brescia, Italy, 28–30 March 2003; pp. 291–309. [Google Scholar]
- Grimholt, C.; Skogestad, S. Optimal PI-Control and verification of the SIMC tuning rule. In Proceedings of the 2nd IFAC Conference on Advances in PID Control, Brescia, Italy, 28–30 March 2012; pp. 11–22. [Google Scholar]
- Tan, N.; Kaya, I.; Yeroglu, C.; Atherton, D. Computation of stabilizing PI and PID controllers using the stability boundary locus. Energy Convers. Manag. 2006, 47, 3045–3058. [Google Scholar] [CrossRef]
- Gao, R.; Gao, Z. Pitch control for wind turbine systems using optimization, estimation and compensation. Renew. Energy 2016, 91, 501–515. [Google Scholar] [CrossRef]
- Turksoy, O.; Ayasun, S.; Hames, Y.; Sonmez, S. Gain-phase margins-based delay-dependent stability analysis of pitch control system of large wind turbines. Trans. Inst. Meas. Control 2019. [Google Scholar] [CrossRef]
Figure 1.
Raceway reactor used in this work for simulation.

Figure 2.
Symmetric-Send-On-Delta (SSOD) control architecture schemes: Symmetric-Send-On-Delta- Proportional-Integral (SSOD-PI) controller (top) and Proportional-Integral-Symmetric-Send-On-Delta (PI-SSOD) controller (bottom). Dashed blocks: Governor, Sensor Unit (SU), Control Unit (CU) and Actuator Unit (AU).

Figure 3.
Stability region for daytime controller.

Figure 4.
Stability region for nighttime controller.

Figure 5.
Two days comparison between traditional On/Off daytime control (red) and PI control during daytime and nighttime (black).
Figure 5.
Two days comparison between traditional On/Off daytime control (red) and PI control during daytime and nighttime (black).

Figure 6.
Results with the SSOD-PI controller. = 0.01 (black) and = 0.05 (red). First plot: pH output. Second plot: control signal. Third plot: diurnal events. Fourth plot: nocturnal events. Fifth plot: solar radiation.
Figure 6.
Results with the SSOD-PI controller. = 0.01 (black) and = 0.05 (red). First plot: pH output. Second plot: control signal. Third plot: diurnal events. Fourth plot: nocturnal events. Fifth plot: solar radiation.

Figure 7.
Results with the PI-SSOD controller. = 0.001 (black) and = 0.01 (red). First plot: pH output. Second plot: control signal. Third plot: diurnal events. Fourth plot: nocturnal events. Fifth plot: solar radiation.
Figure 7.
Results with the PI-SSOD controller. = 0.001 (black) and = 0.01 (red). First plot: pH output. Second plot: control signal. Third plot: diurnal events. Fourth plot: nocturnal events. Fifth plot: solar radiation.


Table 1.
Performance On/Off and Proportional-Integral (PI) control indexes.
| Indexes | On/Off Controller | PI Controller |
|---|---|---|
| 185,513.10 | 2972.96 | |
| 11,590.10 | 1366.30 | |
| 173,923.00 | 1606.66 | |
| 274.00 | 15.99 | |
| (min) | 1856.47 | 1600.70 |
| (m) | 1.86 | 1.60 |
| (min) | 1856.47 | 851.05 |
| (min) | - | 749.65 |
Table 2.
Performance Symmetric-Send-On-Delta-Proportional-Integral (SSOD-PI) indexes.
| Indexes | SSOD-PI | ||||
|---|---|---|---|---|---|
| 0.01 | 0.02 | 0.03 | 0.04 | 0.05 | |
| 9418.45 | 9743.28 | 10,196.29 | 10,805.44 | 11,484.70 | |
| 2089.36 | 2416.45 | 2899.45 | 3309.99 | 3974.87 | |
| 7329.09 | 7326.83 | 7296.84 | 7495.45 | 7509.81 | |
| 11.38 | 11.39 | 11.86 | 11.82 | 12.41 | |
| (daytime) | 132 | 55 | 43 | 32 | 26 |
| (nighttime) | 91 | 93 | 95 | 93 | 96 |
| (min) | 1537.70 | 1541.90 | 1253.50 | 1545.70 | 1542.97 |
| (m) | 1.54 | 1.54 | 1.54 | 1.55 | 1.54 |
| (min) | 852.42 | 857.53 | 864.33 | 867.03 | 865.70 |
| (min) | 685.28 | 684.37 | 679.97 | 678.67 | 677.27 |
Table 3.
Performance Proportional-Integral-Symmetric-Send-On-Delta (PI-SSOD) indexes.
| Indexes | PI-SSOD | ||||
|---|---|---|---|---|---|
| 0.001 | 0.003 | 0.005 | 0.007 | 0.01 | |
| 6643.80 | 7339.80 | 8109.32 | 9260.24 | 12,799.96 | |
| 2093.44 | 2782.69 | 3555.31 | 4462.89 | 7847.62 | |
| 4550.36 | 4557.11 | 4554.01 | 4797.35 | 4952.34 | |
| 7.73 | 9.43 | 6.31 | 5.85 | 6.09 | |
| (daytime) | 1226 | 332 | 161 | 88 | 68 |
| (nighttime) | 700 | 1040 | 720 | 688 | 724 |
| (min) | 1577.60 | 1585.30 | 1579.00 | 1570.30 | 1540.03 |
| (m) | 1.58 | 1.59 | 1.58 | 1.57 | 1.54 |
| (min) | 849.03 | 856.63 | 851.63 | 845.23 | 818.90 |
| (min) | 728.57 | 728.67 | 727.37 | 725.07 | 721.13 |
© 2019 by the authors. Licensee MDPI, Basel, Switzerland. This article is an open access article distributed under the terms and conditions of the Creative Commons Attribution (CC BY) license (http://creativecommons.org/licenses/by/4.0/).
Share and Cite
MDPI and ACS Style
Rodríguez-Miranda, E.; Beschi, M.; Guzmán, J.L.; Berenguel, M.; Visioli, A. Daytime/Nighttime Event-Based PI Control for the pH of a Microalgae Raceway Reactor. Processes 2019, 7, 247. https://0-doi-org.brum.beds.ac.uk/10.3390/pr7050247
AMA Style
Rodríguez-Miranda E, Beschi M, Guzmán JL, Berenguel M, Visioli A. Daytime/Nighttime Event-Based PI Control for the pH of a Microalgae Raceway Reactor. Processes. 2019; 7(5):247. https://0-doi-org.brum.beds.ac.uk/10.3390/pr7050247
Chicago/Turabian StyleRodríguez-Miranda, Enrique, Manuel Beschi, José Luis Guzmán, Manuel Berenguel, and Antonio Visioli. 2019. "Daytime/Nighttime Event-Based PI Control for the pH of a Microalgae Raceway Reactor" Processes 7, no. 5: 247. https://0-doi-org.brum.beds.ac.uk/10.3390/pr7050247
Note that from the first issue of 2016, this journal uses article numbers instead of page numbers. See further details here.