Article

The Effect of Very Cohesive Ultra-Fine Particles in Mixtures on Compression, Consolidation, and Fluidization

by
Abbas Kamranian Marnani
1,*,
Andreas Bück
2,
Sergiy Antonyuk
3,
Berend van Wachem
1,
Dominique Thévenin
4 and
Jürgen Tomas
1,†
1
Institute of Mechanical Process Engineering, Otto von Guericke University (OvGU), Universitätsplatz 2, 39106 Magdeburg, Germany
2
Institute of Particle Technology (LFG), Friedrich-Alexander-University Erlangen-Nürnberg, Cauerstraße 4, 91058 Erlangen, Germany
3
Institute of Particle Process Engineering, Technische Universität Kaiserslautern, Gottlieb-Daimler Street, 67663 Kaiserslautern, Germany
4
Institute of Fluid Dynamics and Thermodynamics, Otto von Guericke University (OvGU), Universitätsplatz 2, 39106 Magdeburg, Germany
*
Author to whom correspondence should be addressed.
Passed away. He has initiated and supervised the project.
Submission received: 30 May 2019 / Revised: 21 June 2019 / Accepted: 8 July 2019 / Published: 10 July 2019
(This article belongs to the Special Issue Multiphase Reaction Engineering, Reactors and Processes )

Abstract

:
This paper focuses on the effect of ultra-fine ( d < 10 µm) powders in mixtures with fine ( d < 100 µm) bulk material on compression processes and also evaluates the re-fluidization behavior of the compressed bed (history effect). Achieving this goal, different mixtures of fine and ultra-fine Ground-Carbonate-Calcium were compressed at three pressure levels. The results show that by increasing the applied pressure, the compressibility decreases due to change in compaction regime. Subsequently, for the higher pressure, the slope of packing density versus applied stress curves is noticeably different. However, this slope does not depend on the size distribution of mixtures, but on the type of material. Comparing fluidization and re-fluidization curves (bed pressure drop vs. gas velocity) shows an increase in the maximum bed pressure drop ( Δ P p e a k ) for re-fluidization. By increasing the portion of ultra-fine particles in the binary mixture, Δ P p e a k increases in a non-linear manner. Furthermore, the incipient fluidization point moves to a higher gas velocity. After compression, the peak of the bed pressure drop in the re-fluidization test happens at a lower gas velocity than in the initial fluidization test. Thus, the slope of the loading curve is much larger for re-fluidization. The opposite is observed for the unloading curves.

Graphical Abstract

1. Introduction

The importance of forced compaction as one of the essential steps for the manufacturing of tablets in the pharmaceutical industries is obvious. In addition, the natural compaction or densification due to gravitation happens during storage of particulate materials and is one of the main issues in bulk material handling, impacting flowability, and particle flow rates in many applications of chemical, pharmaceutical, food, and petrochemical industries. During compaction, two main processes occur, i.e., compression and consolidation. The compressibility is the ability of a particle bed to reduce its volume due to rearrangement, deformation, and breakage under pressure [1,2]. The consolidation is characterized by the formation of inter-particle interactions; it describes the ability of a powder bed to form mechanically durable bonds with sufficient strength [1,3].
Compaction of a particle bed depends not only on the physical properties of the particles but also on the apparatus setting [4] like filling method. In this process, the rate of increase and also the absolute magnitude of the applied pressure force play significant roles [1]. Additionally, the pre-conditioning of the particle bed before applying the compression force has a critical effect on the final results [4]. The pre-conditioning is more significant for processes using fine and ultra-fine particles. In fact, the history of the applied forces and the previous deformations of particles before a new process might completely change the outcome.
In practical applications, compaction is affected by many parameters, such as the applied force and inter-particle forces when the range of particle sizes is less than 50 μm [5,6]. Increasing the role of inter-particle cohesion forces between particles is the starting point of lasting arch formation in the arrangement of particles adjacent to each other in the bed [7]. Due to the creation of these arches between adjacent particles, the number and the volume of voids between them increase, which results in a decrease in the bulk density of the bed and in a looser structure of the particulate material for finer particle beds. The reduced bulk density of fine and ultra-fine particulate material has an essential effect on the behavior of the bed after applying stress (pressure); they show increased compressibility.
Considering the complex microscopic behavior of fine particles and their interactions, understanding the compression process for particulate materials is far more difficult than for fluids [7]. Experimental studies on the compression of solid particles go back to the early 20th century when Walker [8] used a logarithmic-law to fit his empirical data as ( 1 / φ ) = ( 1 / φ J ) n   l o g ( σ c / σ c 0 ) . In this equation, φ is the particle volume fraction (packing density), n is the compressibility index, σ c is the applied compression stress, and σ c 0 and φ J are two empirical parameters. The ratio σ c / σ c 0 is normally shown as the dimensionless applied pressure ( σ ^ c ). In civil engineering, when the powder bed has a loose structure and the rearrangement of particles is the main phenomenon occurring during compression, this logarithmic equation is satisfactory. However, for fine and ultra-fine particles, the cohesive inter-particle forces are essential. Experimental results for cohesive particles indicate that the compressibility index increases when increasing the void fraction of the particle bed at initial condition (unconsolidated state) [9].
The compressibility and compactability of powders are affected by their mechanical properties and the inter-particle forces at the macro and micro-scale. The mechanical properties of bulk materials can be analyzed using a shear-cell. The compression function relates changes in the bulk density of the powder to increase in the applied pressure. The equation for isotropic compaction of a random powder bed packing could be [1]:
d ρ b ρ b = n · d P P = n · d σ M , s t σ M , s t + σ 0 ,
where ρ b is the bulk density, n is the compressibility index, σ 0 is isostatic tensile strength for a loose random packing, and P = σ M , s t + σ 0 is the total pressure (according to Mohr’s circle [10]). In addition, σ M , s t is the average pressure ( σ M , s t = ( σ 1 + σ 2 ) / 2 , where σ 1 and σ 2 are the major and minor principal normal stresses of Mohr’s circle, respectively). The compression function is obtained by integrating Equation (1) with the initial condition of: for σ M , s t =   0 , ρ b = ρ b , 0 .
ρ b ρ b , 0 = ( 1 + σ M , s t σ 0 ) n ,
where ρ b , 0 is the bulk density for a loose packing without any compaction. The compressibility index, n , characterizes how the volume of a cohesive powder reduces under a compressive force. Figure 1 shows the compression function for different compressibility indices (n = 0 shows the behavior of an incompressible solid material, and n = 1 indicates an ideal gas compressibility index) [11]. The compressibility indices of different particulate materials are summarized in Table 1 [1].
The focus of this study is on the behavior of two fine ( d < 100 μm) and ultra-fine ( d < 10 μm) materials as well as of their mixtures in a series of compression tests. For the fine particles, the ratio between inter-particle attractive force and weight (called the granular Bond number ( B o g ) [7]) is in the range of 1 to 100 [12]. Consequently, they correspond to slightly adhesive particles with aggregating or bubbling fluidization (classified as group A in Geldart classification [13]). However, for ultra-fine powders which are categorized in the group C of Geldart’s classification, this ratio ( B o g ) is in the range of 100 to 104, and they are cohesive or very cohesive materials [12]. These powders are characterized by poor flowability and noticeable compressibility.
Consequently, storage, mixing, and discharge of this kind of bulk solids are difficult. Fine and ultra-fine particles tend to agglomerate and form bridges or stable ratholes around the outlet of a silo. These problems can only be solved effectively using discharge aids. Fluidization is one of the modern methods for mixing and discharge of stored fine particles with diameters between a few microns and 200 µm using injecting air. After discharging, the remaining fine particulate solids continue to gain strength if stored at rest under compressive stress for a long period of time [14]. This effect is called time consolidation. The time consolidation is the result of adhesive forces. Discharging the consolidated material using fluidization is not similar to the first fluidization (before consolidation) and the behavior of the bulk material is entirely different. Such processes often happen in chemical, pharmaceutical, and food industries, where the fine and ultra-fine particulate materials are used in different compositions for getting different final products.
The fluidization of particles in a fluid is a result of the force balance between hydrodynamics, gravitational, and inter-particle forces [15]. For ultra-fine cohesive powders, the attractive inter-particle forces greatly affect the fluidization behavior. Since the adhesion is often stronger than the forces that the fluid can exert on the particles, these powders are difficult to fluidize. In a dry bulk material, when the size and the distance between the particles are tiny, the dominant and controlling interaction force is the van der Waals force. For this condition, the contact between particles is the key particle-particle interaction mechanism [16].
In most applications, the initial conditions include some level of consolidation stress due to the weight of the upper layer of particles acting on the lower layers. The ideal initial condition of a compaction process is defined as unconsolidated condition ( σ c 0 , where σ c is the applied compression stress). In this study, to control the inter-particle cohesion force and to ensure a loose structure of particle beds (with minimum initial consolidation effect), the bed was initially fluidized with gas (dried air at ambient temperature). After fluidization of the bed (in that case, σ c is near zero), the air flow rate was decreased gradually. In this manner, the transition of a fluidized bed to the jamming condition takes place under very small applied stress [17]. The fluidization tests of cohesive ultra-fine and also mixtures of fine and ultra-fine particles show a size enlargement due to agglomeration [15] (new agglomerate size is d a g ). In this process, increasing the size of agglomerates is related to the granular Bond number [7] as K ~ B o g 1 / ( D + 2 ) . In this equation, K is the ratio of size enlargement ( d a g / d p ) and D is the fractal dimension of the formed agglomerates.
When unloading (decreasing the gas velocity) the fluidized bed, the agglomerates are jammed in a loose packing that is very close to the random loose packing of particles obtained when cohesion effects are negligible [18]. The agglomerate Bond number for the formed agglomerates during fluidization is small [7]. Thus, the agglomerates are practically low-cohesive, quasi-spherical particles; then, the effect of inter-particle forces can be neglected. In this condition, if some low pressure (<10 Pa) is applied to the particle bed, a small level of consolidation first happens for agglomerates (without any breakage). The arrangement of the formed agglomerates in the packed system changes from loosely packing to close-packing. A further increase in the pressure (more than σ c 0 10 Pa) [7] leads to a new regime of compaction; i.e., disruption of the formed agglomerates and filling the voids between agglomerates with single particles or fragmented agglomerates. This regime is called the logarithmic-law regime [8].
Valverde and Castellanos [7] showed that a further increase in the applied pressure up to a few dozen kPa could be the cause of a new transition in the compaction regime. In this condition, the compression takes place by rearranging the single particles. This process does not depend on the agglomerates’ distribution in the initial state [7] and leads to a different logarithmic law regime.
Effect of adding fine particles to improve the fluidization of ultra-fine cohesive beds is investigated by other researchers. In previous publications (e.g., [19,20,21,22]), the authors considered the addition of coarser particles with different origins leading in particular to a different density, size, and surface properties. In contrast, this study considers only mixtures of the same material; the fine and ultra-fine material fractions have the same origin, and they differ only in the particle size distribution. The present study involving fluidization, compression, and re-fluidization after applying different pressure levels should deliver useful information for a better understanding of the underlying processes. The knowledge about the behavior of mixtures of materials in different processes also helps to improve the manufacturing and process efficiency of a variety of products in particle-based industries [23]. Practically, most of the bulk materials are mixtures of different size distributions of the same material (multimodal particle size distributions). However, the effect of increasing the amount of ultra-fine materials in a fine particle bed on the compression process and re-fluidization of compressed bed is still not fully understood.
The main goal of this study is to investigate the behavior of different mixtures of fine and ultra-fine particles during compression tests and also to evaluate the re-fluidization behavior of the compressed bed to investigate the history effect, i.e., the effect of the compression on (re-) fluidization. In the next section, the test rig, the used material, and the methodology of performing the experiments will be introduced. Thereafter, experimental results of initial fluidization, compression, and re-fluidization of compressed bed will be discussed, in particular regarding the effect of the presence of ultra-fine powders in a fine particle bed. The paper will close by summary and conclusion in Section 4.

2. Experimental Apparatus, Materials, and Methodology

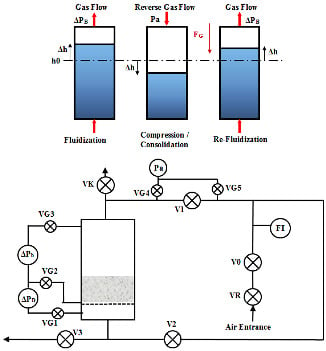
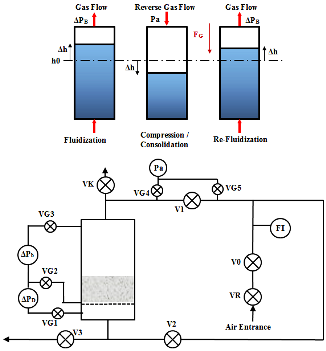
2.1. Experimental Apparatus

The experimental apparatus for this study with all of its components has been already described in our previous publication [15]; the details can be found there. Only the essential features are listed in what follows. The main part of the experimental test rig is a transparent glass column of 760 mm height, 100 mm diameter and 10 mm wall thickness. In this column, the particle bed is placed on a paper filter above the gas distributor plate. The fluidizing gas is dried conditioned air at ambient temperature. The temperature and humidity of air are measured and controlled during the tests with a Testo-480 device to ensure negligible changes concerning moisture content. By opening/closing the control valves, the dried compressed air can be supplied to the system either upward (as used in fluidization steps) or downward (for compression steps). The bed pressure drop ( Δ P b ), distributor pressure loss ( Δ P D ), and the gage pressure in the column ( P a ) are measured by three Kalinsky pressure transducers (DMU4 model). The height of the bed ( h b ) is measured by the ultrasonic method, based on sending an ultrasonic wave and measuring the reflection time. In this study, the bed height in each measurement is obtained by averaging the measured heights at eight different locations. The particle volume fraction can be determined by dividing the total weight of particles per cross section area of the bed ( P w b ) on the hydrostatic pressure of the bed ( ρ p g h ), where g is the acceleration of gravity.

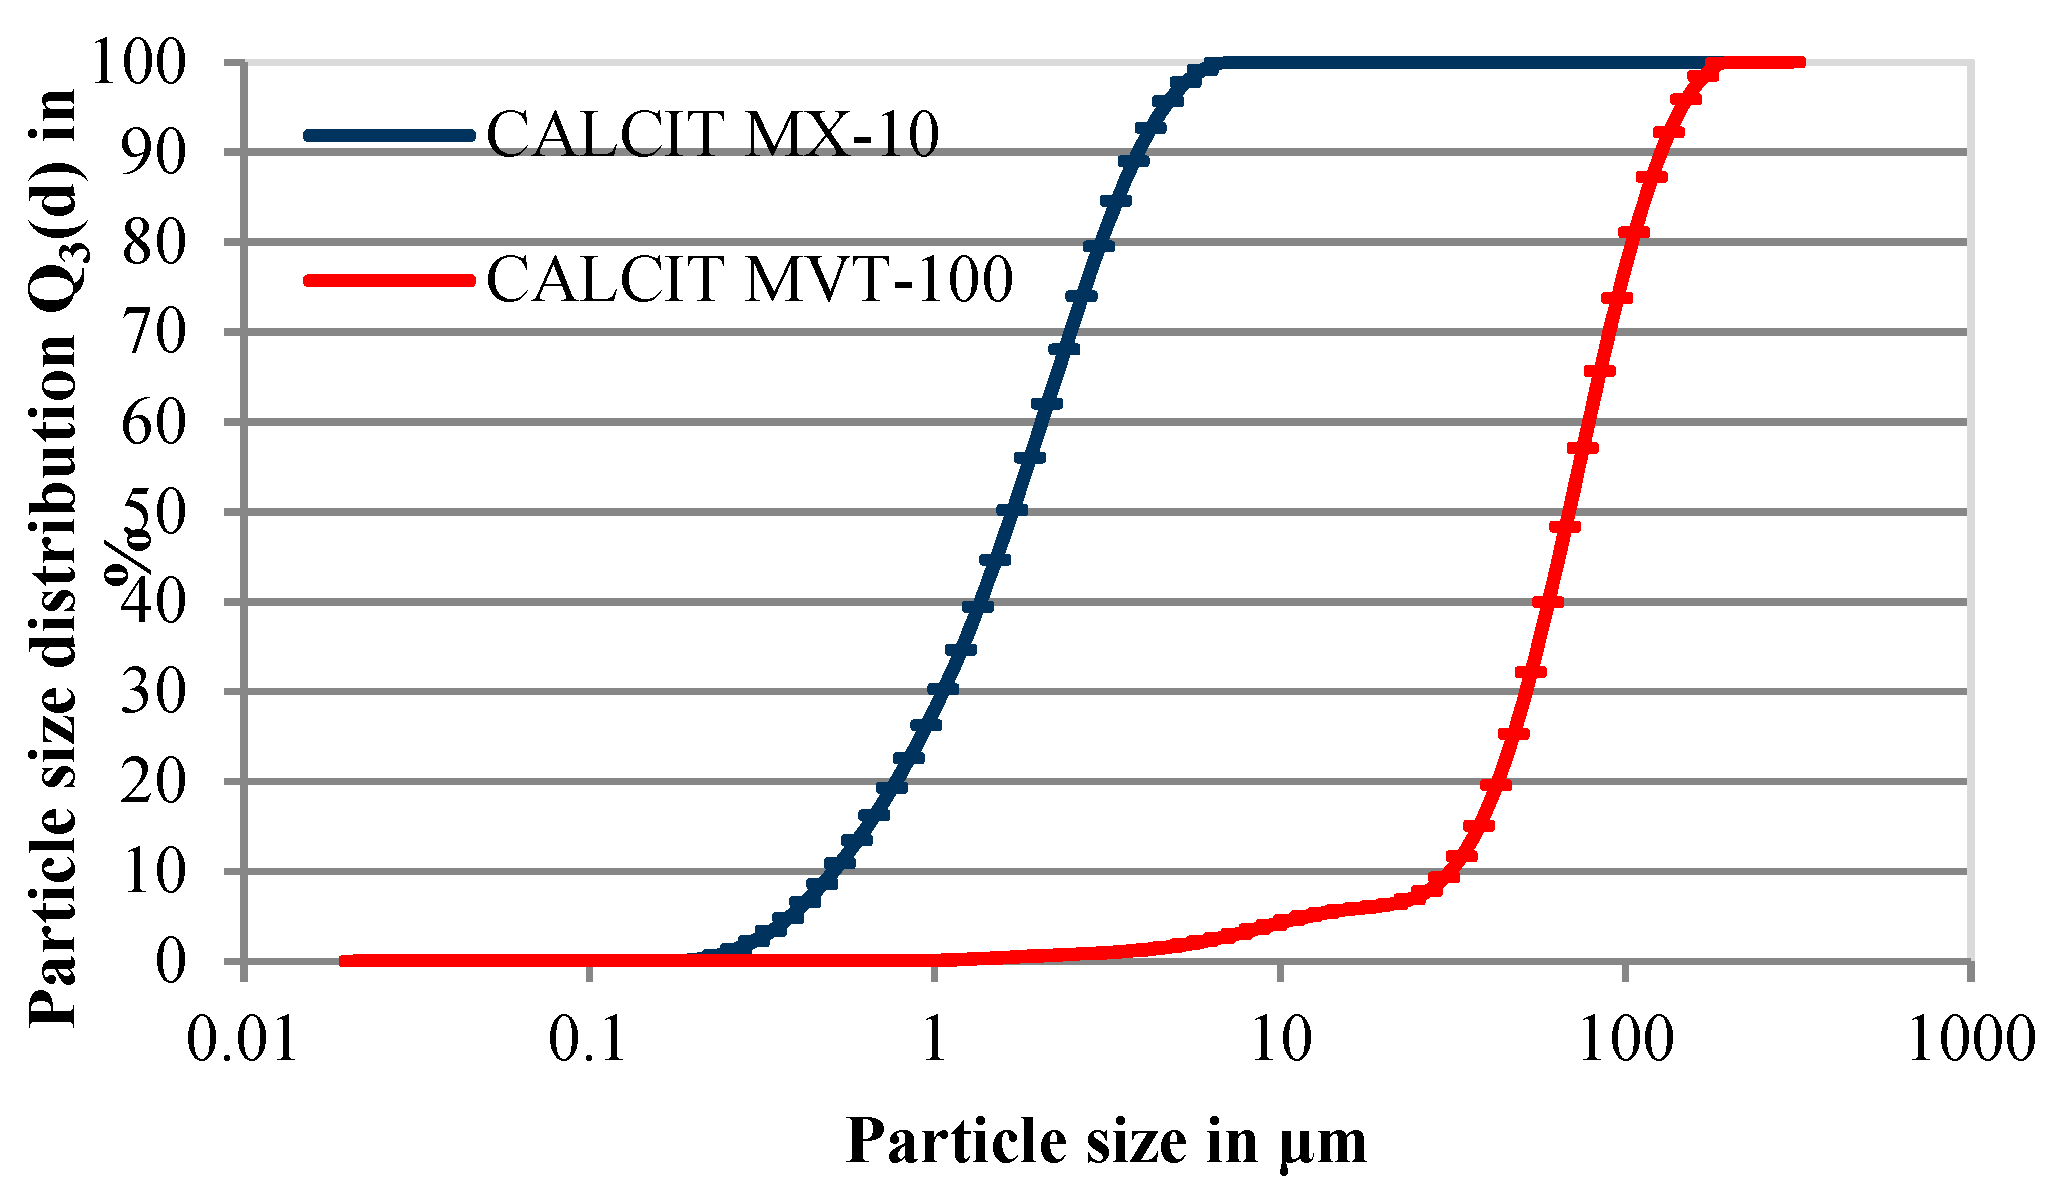
2.2. Powder Bed Materials

The particulate materials used in this study are two Ground Calcium Carbonate (GCC) milled products with a rhombohedral crystalline structure [15]. As discussed before in the previous paper [15], Calcium Carbonate (also called CALCIT in this article) is a versatile and inexpensive mineral. It has a wide variety of uses in constructional, industrial, and environmental applications as the main ingredient of fillers, ceramic tile adhesives, and sealants materials. It is a natural source of alkalinity used for de-acidification of rivers, desulphurization of flue gas in power plants, and treatment of drinking water. In food industries, GCC is used as a dietary calcium supplement or as a chemical binder. Due to the importance and wide applications of this material, most previous studies of our research group were based on this material [6,11,24]. In this study also, GCC was used as the test material.
The fine (Group A) material called CALCIT MVT 100 was prepared by classification of CALCIT FW 270 with a water-jet sieving method followed by a drying process, as described in [25]. The ultra-fine (Group C) material was CALCIT MX 10. Both raw materials (CALCIT FW 270 and CALCIT MX 10) had the same origin (Heidenheim Plant, Heidenheim, Germany) and were supplied by the same company (Sh minerals GmbH, Heidenheim an der Brenz, Germany). The only difference between them was the particle size distribution (PSD). Figure 2 shows the cumulative size distribution functions of these two particulate materials. The PSD is measured by a laser diffraction dry method (Malvern Mastersizer 2000) [15].
For this measurement, the dispersing of the agglomerates is important. In the present work, a dry sample dispersion method was used. The dry dispersion process normally needs a higher energy process than wet dispersion. Three different dispersion mechanisms act simultaneously on the sample during a dry method. These mechanisms of increasing energy input are velocity gradients due to shear stress, particle-particle, and also particle-wall collisions, respectively. The shear stress was induced by controlling the pressure drop of the disperser. The significance of each mechanism depends on the material type, air flow rate or its induced pressure drop, and also the geometry of disperser. By employing these mechanisms, all agglomerates were disintegrated into primary particles. To reduce attrition, high flow rates of air were used. To check reproducibility, all measurements were repeated several times [15].
The properties of the particles used in this study are summarized in Table 2. This table contains the mass-mean particle diameter ( d 50 , 3 ), Sauter mean diameter ( d S T ), bulk density ( ρ b ), particle density ( ρ p ), and also flow function ( f f c ) of these two materials. The latter macro-property of the materials ( f f c ) as well as particle bulk density were obtained using a ring shear-cell (Dr. Dietmar Schulze-RST-XS.S) [26]. The flow function of a bulk solid was calculated as the ratio between its consolidation stress, σ 1 and the unconfined yield strength, σ c in a determined storage period, t. It is written as f f c = σ 1 / σ c . A smaller f f c represents a worse bulk solid flowability. According to Table 2, the fine material is a free-flowing material ( f f c > 10), while the ultra-fine material is classified as a very cohesive material (1 < f f c < 2) [11].

2.3. Experimental Methodology

In this study, each experiment involved three steps: (1) initial fluidization, (2) compression of the bed (starting from a low level of consolidation), and (3) re-fluidization of compressed and consolidated particle bed, as depicted in Figure 3.
In the fluidization and re-fluidization process, the dried air used as fluidization gas enters the system from the bottom of the bed and, after passing through the bed, exits from the top of the bed. Conversely, for the compression tests, the dried compressed air comes to the system from the top side and there is not any exit. During compression (realized in four equidistant sub-steps), the propagation of pressure waves in the bed results in a decrease in total volume. The pressure waves, classified as elastic waves, are transmitted from the top to the bottom of the bed by particle contacts [27]. Considering the free movement of particles relative to other ones, the force chains in the bed can deform or collapse. Previous experiments [28] have depicted the capability of these force chains to rearrangement of the particles. The volume decrease is affected by the amount of pressure as well as by the arrangement of particles.
In this study, two mixtures with a dominant mass fraction of either fine or ultra-fine particles and a mixture of these two materials in the same weight fraction were considered; i.e., the portions of ultra-fine powders in the mixtures were 30%, 68%, and 50%, respectively.

3. Results and Discussion

The effect of the presence of ultra-fine particles on a fine particle bed fluidization has been previously researched [15]. Repeating some results is necessary for a better understanding of the compression and re-fluidization steps, and is briefly summarized in Section 3.1. In Section 3.2 and Section 3.3, the results of compression tests and re-fluidization tests will be discussed thoroughly.

3.1. Initial Fluidization Results

For ultra-fine powders (Geldart group C), the fluidization is partial and includes cracks, channels, and the formation of agglomerates (due to inter-particle forces in micro-scale). Therefore, their fluidization is a non-reproducible and time-varying process. High fluctuations were observed in the bed pressure drop during the loading process. At higher gas velocities, due to high cohesive forces between particles, some agglomerates are formed with different sizes during fluidization [14,15]; the largest ones are found at the bottom of the bed (some of them are even de-fluidized) and the smallest at the top of it [2]. The unloading curve (the bed pressure drop curve during the reduction of the gas velocity) shows an almost linear behavior, corresponding to a constant permeability. During the unloading process, the segregation effect of sorting agglomerates by size from the bottom to the top of the bed is partly visible; especially in the fluidization zones (channels).
In contrast with ultra-fine powders, the fluidization behavior of fine particles (Geldart Group A) in gas is characterized by an easy, aggregative (bubbling) fluidization with partial mixing. For fine particles, the adhesion force is in the range corresponding to slightly adhesive particles [12]. However, this range of inter-particle forces is beneficial, since it is responsible for the expanded dense phase which limits the growth of bubbles in the first stage of fluidization [29]. Experimental results show that the loading and unloading curves follow one another closely; only a slight hysteresis effect is visible.
Finally, for mixtures of fine and ultra-fine materials, the physical properties of the mixtures (macro-scale) are closer to those of ultra-fine powders. Therefore, the fluidization behavior of these mixtures is also non-reproducible and includes cracking, channeling, and agglomeration. When increasing the ultra-fine material in the mixture, the peak value of Δ P b increases. The velocities corresponding to these points ( U a d ) also increase. Overall, increasing the portion of ultra-fine materials in the mixture causes a delay in starting partial fluidization, an increase in the bed pressure drop, as well as a delay in reaching the peak point.

3.2. Compression Test Results

The jamming transition is a crucial slowing down of system dynamics far from equilibrium as a result of the overcrowding of particles. The dynamics of the system is stopped by reducing possible particle movements; this condition is referred to as jamming [30]. According to Castellanos et al. [17], at jamming transition, the dynamics of the agglomerates of fine particles after fluidization show a critical behavior, characterized by a power law relating the increase of particle volume fraction with consolidation stress ( σ ^ c     ( Δ φ ) β ) where Δ φ = φ φ J and φ J is particle volume fraction in jamming condition. For fine cohesive powders, β 1 is normally obtained for soft particle granular systems [7]. At a critical pressure ( σ c 0 10 Pa), agglomerates begin to break and one obtains a logarithmic law ( Δ φ = ϑ   l o g σ ^ c ), similar to the situation in silos.
Sederman et al. [31] used Magnetic Resonance Imaging (MRI) and considered statistical distributions of the pores’ characteristics to show that the logarithmic law during the consolidation of particles can also be anticipated considering statistical mechanics of non-cohesive spherical particles. During consolidation, the large pores become filled and the distribution of voids undergo an irreversible change (rearrangement of pores). Simultaneously, the number of small pores is increased, the number of large pores is decreased, and the relative size of pore space is decreased. Therefore, the overall porosity is also decreased during consolidation, which will alter the characteristics of the bed hydrodynamics [32]. According to the maximum entropy principle, the volume distribution of the pores shows an exponential law. Its reduction becomes slower when increasing the compaction of the system [33].
The logarithmic law is also valid for the behavior of cohesive particle beds [17]. However, the compressibility index is a material-dependent index and increases almost linearly with the ratio of void-to-particle fractions of unconsolidated particle bed [9]. A looser packed bed yields higher compressibility.
In this study, three levels of applied pressures were tested for each mixture of fine and ultra-fine particles. The equidistant sub-steps used for increasing the applied pressure (compression) in each experiment are summarized in Table 3. The same sub-steps were used for decreasing the pressures (decompression) in the opposite direction. Peak pressure levels are 20, 40, and 80 kPa, respectively. They were chosen in such a way to be large enough for getting a logarithmic law compaction regime, but also low enough to avoid getting a deformed structure with stable consolidated regions hindering re-fluidization.
The focus of this study is on the logarithmic law compaction regimes. At the end of the initial fluidization, the consolidation stress in the system at rest is already higher than the limit of the power-law regime ( σ c σ c 0 ).

3.2.1. Effect of Applied Pressure on the Specific Volume Fraction of Particles

The behaviors of fine, ultra-fine, and different mixtures of fine and ultra-fine particles in the compression tests are shown considering the logarithmic scale of the horizontal axis in Figure 4, in which the specific volume fraction of particles in the bed ( 1 / φ ) is plotted as a function of dimensionless compression stress. For each mixture of materials, three sets of data are plotted, corresponding to the three pressure levels listed in Table 3. The maximum variation coefficient of repeated experiments for these tests is related to the CALCIT MX 10 (100% of ultra-fine material). It is equal to 7.22%. The dashed lines show the best fits for the data related to each set of pressures. The fitted graphs are well fitted to a logarithmic law as 1 / φ 1 / φ J n   l o g ( σ c / σ c 0 ) [7]. In these fitted graphs, the factor of the log-function is the compressibility index, n , while the constant indicates the specific jammed particle volume fraction (inverse of φ J ). Table 4 summarizes the compressibility indices for different mixtures of fine and ultra-fine particles as well as for different pressure levels. In addition, the obtained jammed particle volume fractions are also shown in this table.
By comparing the results of Table 4 with the compressibility indices of different classes of materials introduced in Table 1, it can be confirmed that the fine particle bed (CALCIT MVT 100) is a low compressible material with free-flowing behavior. However, adding the ultra-fine particles increases the compressibility index and changes the mixtures’ behavior toward compressible and cohesive materials. Pure ultra-fine powders correspond to a very cohesive and very compressible material.
Additionally, Table 4 shows that the compressibility index is almost the same for the low and intermediate pressure level. However, increasing the applied pressure to the highest level (80 kPa) leads to a noticeable decrease in the compressibility index. For ultra-fine materials, although the material behavior at low and intermediate pressure corresponds to a very compressible and very cohesive material, it changes under high pressure to only compressible and cohesive.
At low and intermediate pressure, compaction of the materials is mostly controlled by the distribution of pore areas within the porous media formed by particles and agglomerates. For the high-pressure level, it seems that the agglomerates are broken, so that compaction is controlled by the distribution of pores between individual particles. In this condition, the bed has lost the memory of its initial fluidization, as in [7]. In addition, as mentioned before, when increasing the compaction of the system, the changes in the volume distribution of the pores show an exponential law and its reduction becomes slower [33]. This argument can also explain the cause of a reduction in the compressibility index at higher compression pressures.

3.2.2. Effect of Applied Pressure on the Volume Fraction of Particles

Another form of the logarithmic law can also be used to describe the compaction regimes. This form is remarkably similar to the empirical equation usually employed to describe the compaction of granular materials such as soils in the rearrangement regime [34]. It is written as φ φ J + ϑ l o g σ ^ c [7]. Figure 5 shows the volume fraction of particles in the bed ( φ ) as a function of the dimensionless applied consolidation stress for the three pressure levels applied on different mixtures of fine and ultra-fine particles. Again, the dashed lines show the best fits for the data related to each set of pressures. Considering this form of logarithmic law, as it is clear from all graphs, the slopes of the particle volume fraction versus logarithmic display of dimensionless stress ( ϑ ) are the same for the different mixtures of fine and ultra-fine particles. For the first set of applied pressures (low pressure level), this slope is ϑ = 0.0069 for all material combinations. For the second set of applied pressures (intermediate pressure level), the slope is slightly decreased to 0.0067 (a 3% decrease relative to the first case). However, the third sets (high pressure level) show a noticeably different slope and ϑ decreases to about 0.0056 (more than 18% change relative to the first case).
Therefore, it can be concluded that the slope of particle volume fraction versus the dimensionless applied stress ( ϑ ) does not depend on the particle size distribution of the material, but it depends on the type of material itself. This behavior is also reported by Castellanos et al. [17] for toner particles. On the other hand, this slope decreases when increasing the applied pressure level during the compression tests. For the three considered pressure levels, the decrease in the slope seems to be non-linear, being faster at a higher applied pressure.
Table 5 summarizes the extracted particle volume fraction of different mixtures in the jammed state ( σ c 0 ) to compare with the results of Table 4. These results are based on the best logarithmic fit of the data shown in Figure 5. The results show that the particle volume fraction in the jammed state decreases when increasing the percentage of ultra-fine powders in the mixtures. It means that a higher ratio of ultra-fine particles results in a looser pack structure (higher fraction of voids). At the same time, the applied pressure level only shows a negligible effect on the jammed particle volume fraction extracted from the best fit of the curves. In fact, the particle volume fraction in jamming condition does not correlate with the amount of applied compression pressure after it.
Combining two forms of logarithmic laws, n ( 1 / φ J ) 2 ϑ or ϑ n φ J 2 . Therefore, it can be concluded that although the jammed particle volume fraction is reduced by increasing the ratio of ultra-fine powders in the mixture, the compressibility index increases in such a way that the reduction of φ J is counterbalanced and ϑ remains constant. As mentioned before, there is a noticeable decrease in the compressibility index ( n ) of different mixtures of materials due to controlling the pore distribution by individual particles and slowing down the rate of reduction in volume distribution of the pores by increasing the applied pressure to a higher one (80 kPa). This decrease could be the main reason for a noticeable decrease in ϑ (from 0.0069 to 0.0056).

3.2.3. Decompression Phase

The compression step is followed by a decompression phase. The applied pressure is decreased in four steps, identical to those used during compression until reaching back atmospheric pressure. Studies concerning the decompression phase are very scarce. However, the decompression phase is found in many industrial applications or processes and has an important effect on the final results. For instance, in a tableting process, the rate of loading and unloading can have crucial effects on the quality of final products [3].
From the total work delivered during the compression phase, only a small portion is recoverable. The rest of the work is dissipated due to friction, particle deformation, heat, and other irreversible processes during compression [35]. After decompression, as a result of an elastic recovery in the bed, the stresses within the bed change, and the height of the bed increases slightly. However, most of the bed height reduction during compression is irreversible, as a result of irreversible plastic deformation, rearrangement of particles or agglomerates from a loosely packed bed to a close-packed bed [7].
Therefore, the re-fluidization of the bed will start from a different height (compared to the end of the initial fluidization) due to the compression process. A lower bed height results in a higher bulk density, higher interparticle cohesion effects, and lower flowability.

3.3. Re-Fluidization Tests

Re-fluidization was performed after compression tests as the last step of each experiment to investigate the history effect and to compare the behavior of different mixtures of materials after consolidation. As explained previously, three different pressure levels were systematically considered. The results of the re-fluidization tests will be shown on the diagrams for the intermediate pressure level (40 kPa); the results related to low and high pressures will be reported in tables.

3.3.1. Re-Fluidization of Pure Materials (Macro-Scale)

First, results for pure materials (100% of fine and 100% of ultra-fine) are discussed. Figure 6 and Figure 7 show the fluidization curves (bed pressure drop versus superficial gas velocity ( U s g )) for initial fluidization and re-fluidization of pure ultra-fine and pure fine particle beds, respectively.
The fluidization, compression, and re-fluidization (FCR) experiments were repeated three times each, in order to increase the statistical certainty of measurements. Though the individual repetitions differ when involving ultra-fine powders in the beds [15], these repetitions show that the key quantities discussed in what follows, the increase in bed pressure drop at the peak point Δ P p e a k and the corresponding superficial gas velocity, are nearly the same for all three repetitions. As a consequence, only the average values are listed in what follows.
The history effect can be quantified by measuring the increase in bed pressure drop between the peak points of the initial fluidization curve and the curve showing re-fluidization after compression (denoted Δ P p e a k in Figure 6 and Figure 7). In all of these figures, loading means the variation of the bed pressure drop during the increment of the gas velocity (solid lines) and unloading means the variation of the bed pressure drop during the reduction of the gas velocity (dashed lines). The corresponding results when compressing at different pressure levels are presented in Table 6.
Table 6 reveals the impact of the pressure applied during the compression step on Δ P p e a k for the two pure materials (CALCIT MVT 100 and CALCIT MX 10). Increasing the applied pressure results in increasing Δ P p e a k for both materials. However, the increment of Δ P p e a k for the ultra-fine cohesive powder bed is an order of magnitude larger than for the fine particle bed. After the initial fluidization, the powder bed of ultra-fine particles shows a loosely packed condition with low consolidation; the height of the bed denotes a lower bulk density, resulting in higher compressibility. During compression, decreasing the distance between particles results in an increase in the cohesive forces between them. For fluidization of a consolidated bed, the applied force should be enough to overcome the extra forces due to the consolidation effect in the bed.
For the case of fine particles, due to the weaker cohesive forces between them, the arrangement of particles after initial fluidization is denser; this leads to a higher bed bulk density and lower compressibility index. Thus, the effect of compression on the fine particle bed is much lower.

3.3.2. Re-Fluidization of Different Mixtures of Fine and Ultra-Fine Particulate Materials (Macro-Scale)

In the following, the effect of the presence of some percentage of ultra-fine particles in a fine particle bed on Δ P p e a k is investigated. Figure 8, Figure 9 and Figure 10 show the results of initial fluidization along with re-fluidization after compression at the intermediate pressure (40 kPa) for mixtures containing 30%, 50%, and 68% (weight ratio) of ultra-fine materials, respectively.
The results of increasing the peak of bed pressure drop (in the loading process) due to applying the other sets of compression pressures are summarized in Table 7. As can be seen from Table 7, when increasing the portion of ultra-fine particles, Δ P p e a k increases monotonously; the lowest value of Δ P p e a k is always related to the pure fine particles, the highest one to the pure ultra-fine powder (Table 6).
Figure 11 shows the evolution of the normalized value of Δ P p e a k (extracted from Table 6 and Table 7 and normalized by the value of Δ P p e a k for CALCIT MX 10 for the same applied pressure) for different mixtures. It can be seen that Δ P p e a k does not rise linearly with increasing the portion of ultra-fine particles. It first shows a slow increase (with a small slope) with increasing the portion of ultra-fines until about 50% in the mixture. Then, a region with a rapid increase is found, between 50% and 70% of ultra-fine particles. Afterwards, the slope decreases again. The normalized results are very close to each other for three different pressure levels employed during compression.

3.3.3. Analysis of the Re-Fluidization Behavior in Micro-Scale

To interpret these measurements, micro-processes taking place during FCR tests should be considered. For the fine materials, after fluidization, the particles are close to each other and build a relatively dense arrangement. In addition, the resistance to deformation of fine particles is higher than for ultra-fine powders (the decrease in particle size offers a larger surface area and greater contact points [36]). A similar phenomenon was reported by Tomas [37]: “Obviously, the finer the particles, the “softer” are the contacts and the more cohesive is the powder.” Taking into account the initially denser arrangement as well as the reduced number of contacts, it can be concluded that the effect of compression is less marked for fine particles than for ultra-fine powders.
For different mixtures, taking into account the results discussed in [15] and using the Kozeny–Carman equation [38] for the unloading curve of initial fluidization shortly before reaching rest ( R e p < 1 ), the mean value of the particle (agglomerate) size in the fluidization region can be estimated as:
d a = 150 μ L 0 ( 1 ε ) 2 ε 3 U s g Δ P b ,
where L 0 is the settled bed height, μ is the dynamic viscosity of the fluidizing gas, ε is the porosity of the particle bed, and d a is the mean value of the formed agglomerate size in the fluidization zone. By increasing the amount of ultra-fine powders in the mixture, L 0 is increased and ε is increased. Therefore, the ratio of ( 1 ε ) 2 / ε 3 sharply decreases. Considering the unloading curves near rest (left part of the diagram) in Figure 8, Figure 9 and Figure 10, it is seen that the slope of Δ P b / U s g is also noticeably increased when increasing the portion of ultra-fine powders.
Consequently, Equation (3) predicts a decrease in d a when increasing the ultra-fine material in the mixture; the mean value of calculated agglomerates’ size is decreased from 284 μ m for 30% of ultra-fine portion in the mixture to almost 100 μ m for pure ultra-fine powders during unloading (near to rest condition). In other words, at the end of the unloading process of the initial fluidization, the mean value of agglomerate size is predicted to be larger for the mixtures with a higher ratio of fine particles. In addition, due to fluidization, segregation might occur. Then, the coarser particles or agglomerates are positioned at the bottom of the bed and their available pores are filled by finer particles or agglomerates. The top part of the bed is preferentially formed by the finer agglomerates and particles.
Increasing the size of agglomerates, filling the pores by smaller ones, and decreasing the intensity of cohesiveness by increasing the portion of fine particles are the main reasons for a denser particle bed, as confirmed by the measurement of the bed height (or particle volume fraction). As a consequence, the effect of compression is decreased when the proportion of fine particles is increased; Δ P p e a k for the mixtures with a higher ratio of fine materials is smaller. As long as there are less than 50% of ultra-fine powders in the mixture, Δ P p e a k increases only slowly (see Figure 11).
However, when the ultra-fine powders become dominant in the mixture, decreasing the agglomerate size, increasing the intensity of cohesiveness, and decreasing the bulk density, lead a much stronger impact of compression process; Δ P p e a k increases rapidly.

3.3.4. The Role of Ultra-Fine Powders in the Mixture on the Value and the Corresponding Superficial Gas Velocity of Peak Point

Considering the superficial gas velocities corresponding to the maximum pressure drop (see Table 8) for each mixture of fine and ultra-fine particles (macro-scale), it is observed that the peak of bed pressure drop occurs at higher gas velocities when increasing the amount of ultra-fine particles in the mixture. This behavior is observed as well for the re-fluidization step. It can also be seen that the peak of bed pressure drop during re-fluidization systematically happens at a superficial gas velocity smaller than for the initial fluidization test. In other words, as visible in Figure 8, Figure 9 and Figure 10, the slope of the corresponding loading curve is much higher; the peak of bed pressure drop is larger and obtained for a lower superficial gas velocity.
From Figure 8, Figure 9 and Figure 10, it is observed that the opposite behavior occurs during the unloading process; i.e., the slope of the unloading curve is larger for the initial fluidization and (at least slightly) lower for re-fluidization after compression. Based on Darcy’s law, the fluid volumetric flow rate, V ˙ , passing through a particle porous medium can be expressed using the cross-section area and height of the particle bed as:
V ˙ / A   = u = k   · Δ h w / h b   ,
where Δ h w (m) is the pressure drop across the bed, h b (m) is the height of the bed, and k (1/s) is a constant depending on the physical properties of the particle bed and on the fluid (permeability). Therefore, k u / Δ h w . In addition, Δ P b = ρ f g Δ h w . In the recent equations, u (m/s) is the mean velocity of the fluid and Δ P b (Pa) is the bed pressure drop. Consequently, the slope of the Δ P b versus U s g graphs is inversely correlated to the permeability of the particle bed.
Table 9 gives the corresponding values of the slope of all Δ P b U s g curves for loading and unloading conditions, for initial fluidization, as well as for re-fluidization after compression test. All these results correspond to the intermediate pressure level (40 kPa) during compression. Table 9 indicates that the trends concerning the slopes (and thus bed permeability) are similar for initial fluidization and re-fluidization after compression. However, the compression step increases the slopes for loading condition, while decreases them for unloading.
Increasing the slope of loading curve in re-fluidization is a result of the compression process; decreasing the distance between particles, decreasing the porosity, and consequently permeability and increasing the inter-particle cohesive forces, as occurs during consolidation. It results in a larger resistance to the air-flow through the bed, particularly so for the mixtures containing ultra-fine powders.
Usually, agglomerates in cohesive powders (Geldart C) are not formed through a dynamic aggregation process between initially single particles [39] in micro-scale. The enhancement of the interparticle attractive force by visco-plastic deformation at inter-particle contacts [40] gives rise to compact and strong agglomerates in the settled powders that cannot be easily broken by the kinetic energy of the gas flow, thus impeding the development of dynamic aggregation in the fluidized bed. Cohesive aggregation is responsible for heterogeneous fluidization behavior (Geldart C) [39]. After the re-fluidization loading, the unloading process starts. Then, the activated channels start to deactivate. When decreasing gas velocity, a new arrangement of particles forms.
When applying compression pressure, some of the particles’ contact areas become flattened due to cohesive forces between close particles. For ultra-fine particles, these flattened contact areas share more contact surface with each contact; resulting in intense cohesive forces between them. Therefore, they can form greater agglomerates, leading to a more permeable bed. However, increasing the size of the agglomerates during the unloading stage is limited by the breakage of agglomerates due to the weight of the upper layers and to collisions. On the other hand, in the mixtures with a higher portion of fine particles, increasing the number of coarser fine particles along with forming agglomerates by ultra-fine particles increase the permeability of the bed (decrease the slope of Δ P b U s g curves).

4. Summary and Conclusions

This study is a comprehensive study about the effect of the presence of ultra-fine powders in a fine particle bed on compression and consolidation processes and also on the re-fluidization of the compressed and consolidated bed of a binary mixture. The compression and fluidization of compressed bed are very important in the storage and flow of bulk materials. Discharging the consolidated material by fluidization aid is not similar to the fluidization of a loosed packed bed and the behavior of the bulk material is entirely different. These kinds of processes often happen in chemical, pharmaceutical, and food industries where the fine and ultra-fine particulate materials are used for producing different products.
  • Methodology: Systematic measurements of the compression and re-fluidization behavior were conducted for different mixtures of fine and ultra-fine material fractions. The first step of each experiment (initial fluidization) was performed to minimize the initial level of stresses in the bed, before compression. Then, a compression step was carried out, using three different pressure levels. Finally, re-fluidization was the last step of the experiment to evaluate the effect of compression on fluidization behavior of a compressed bed.
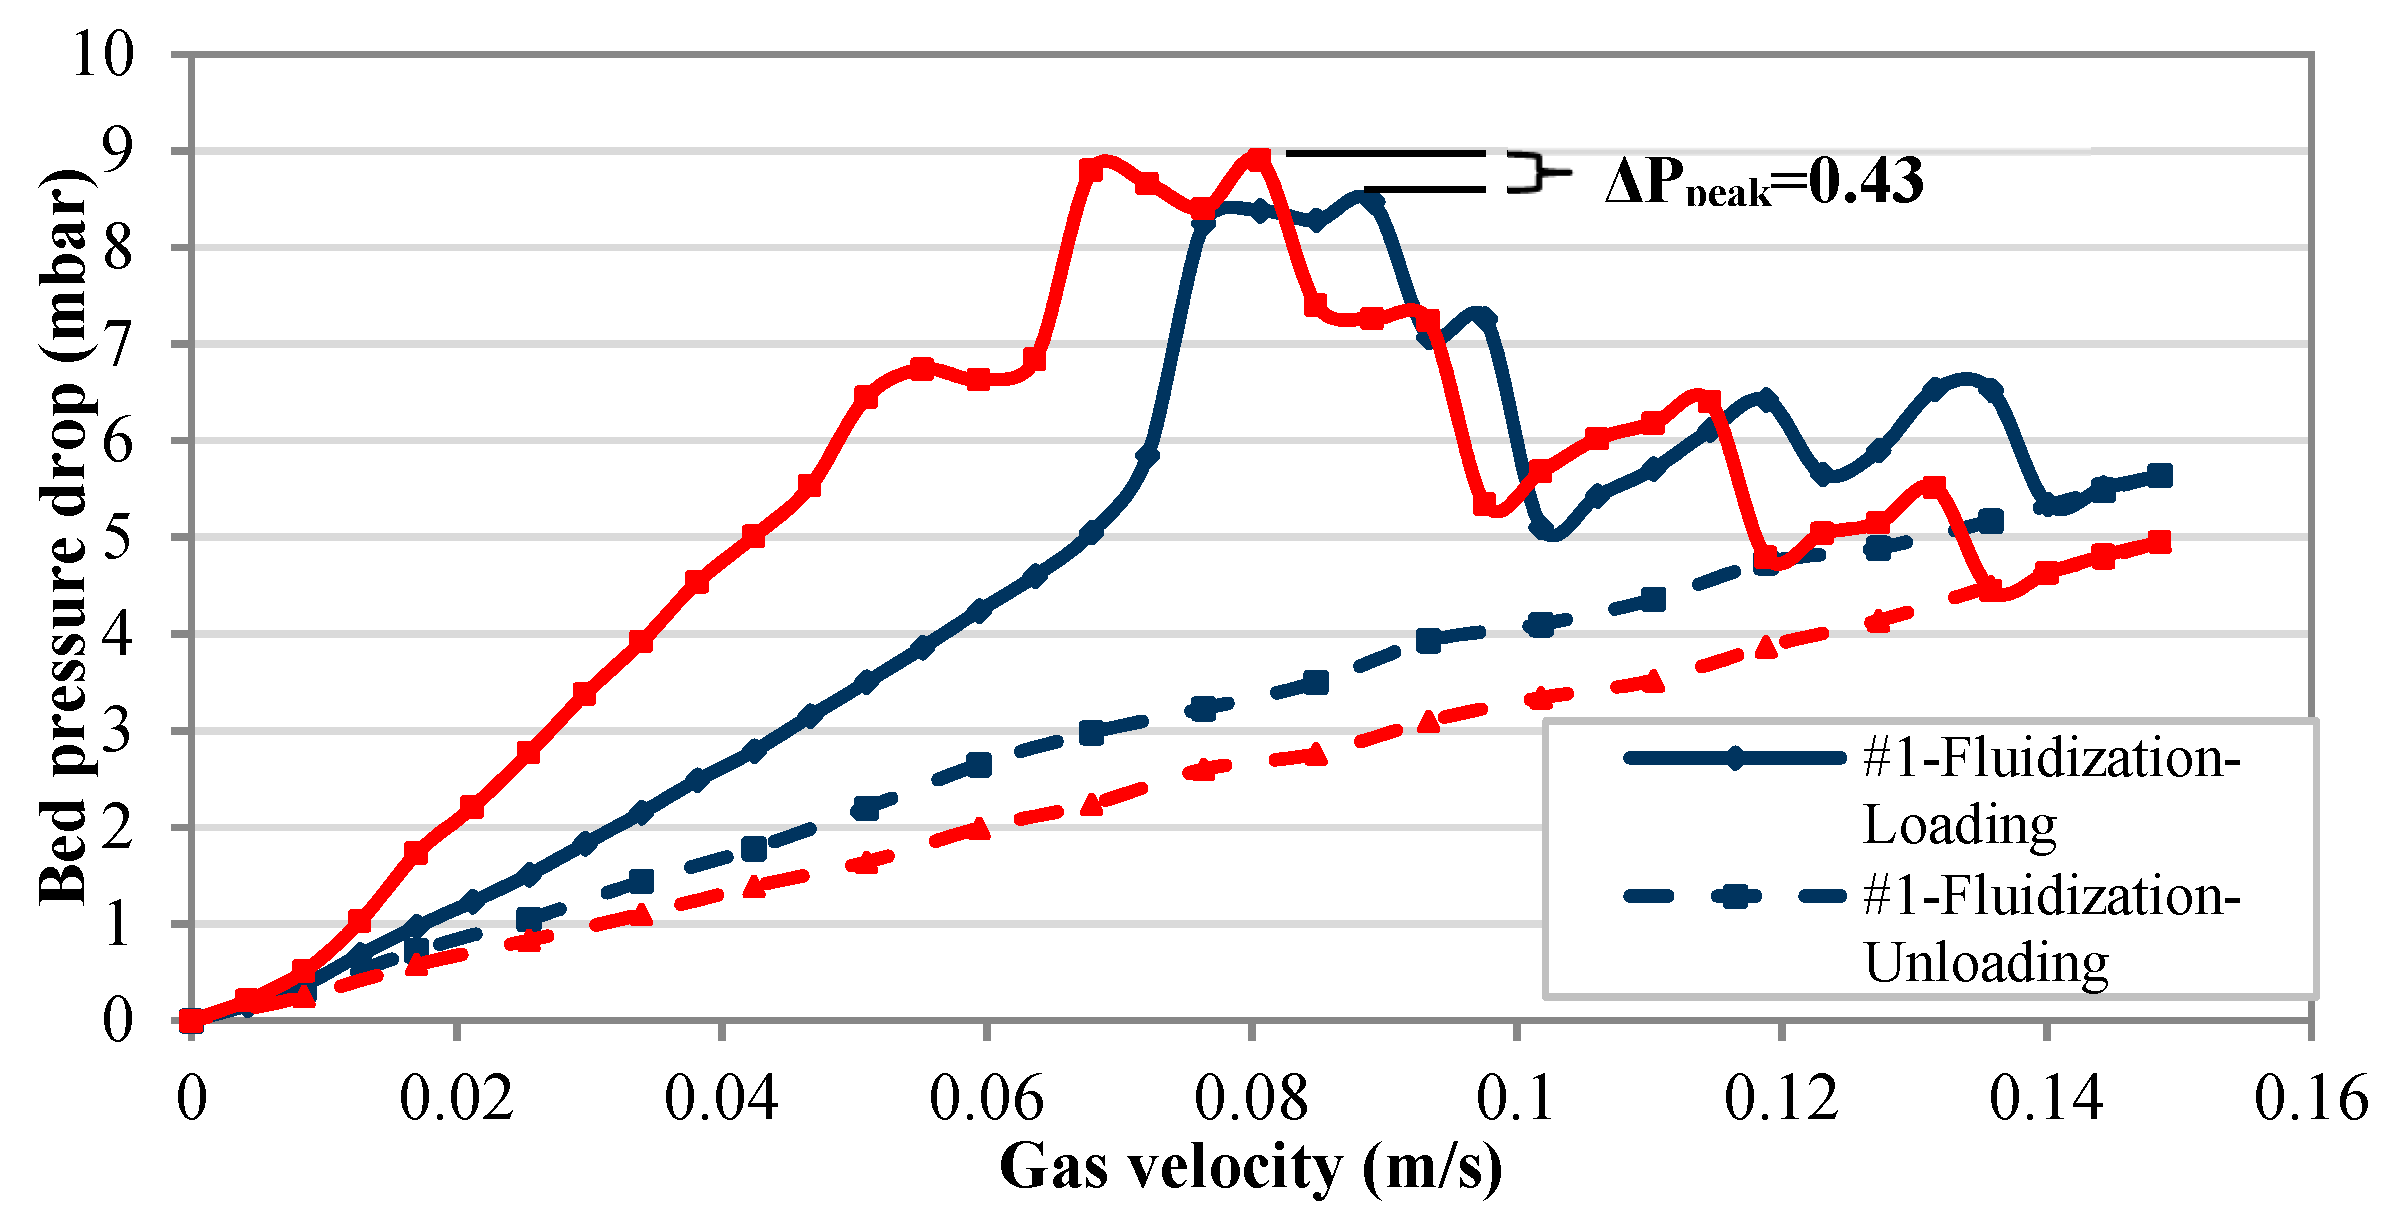
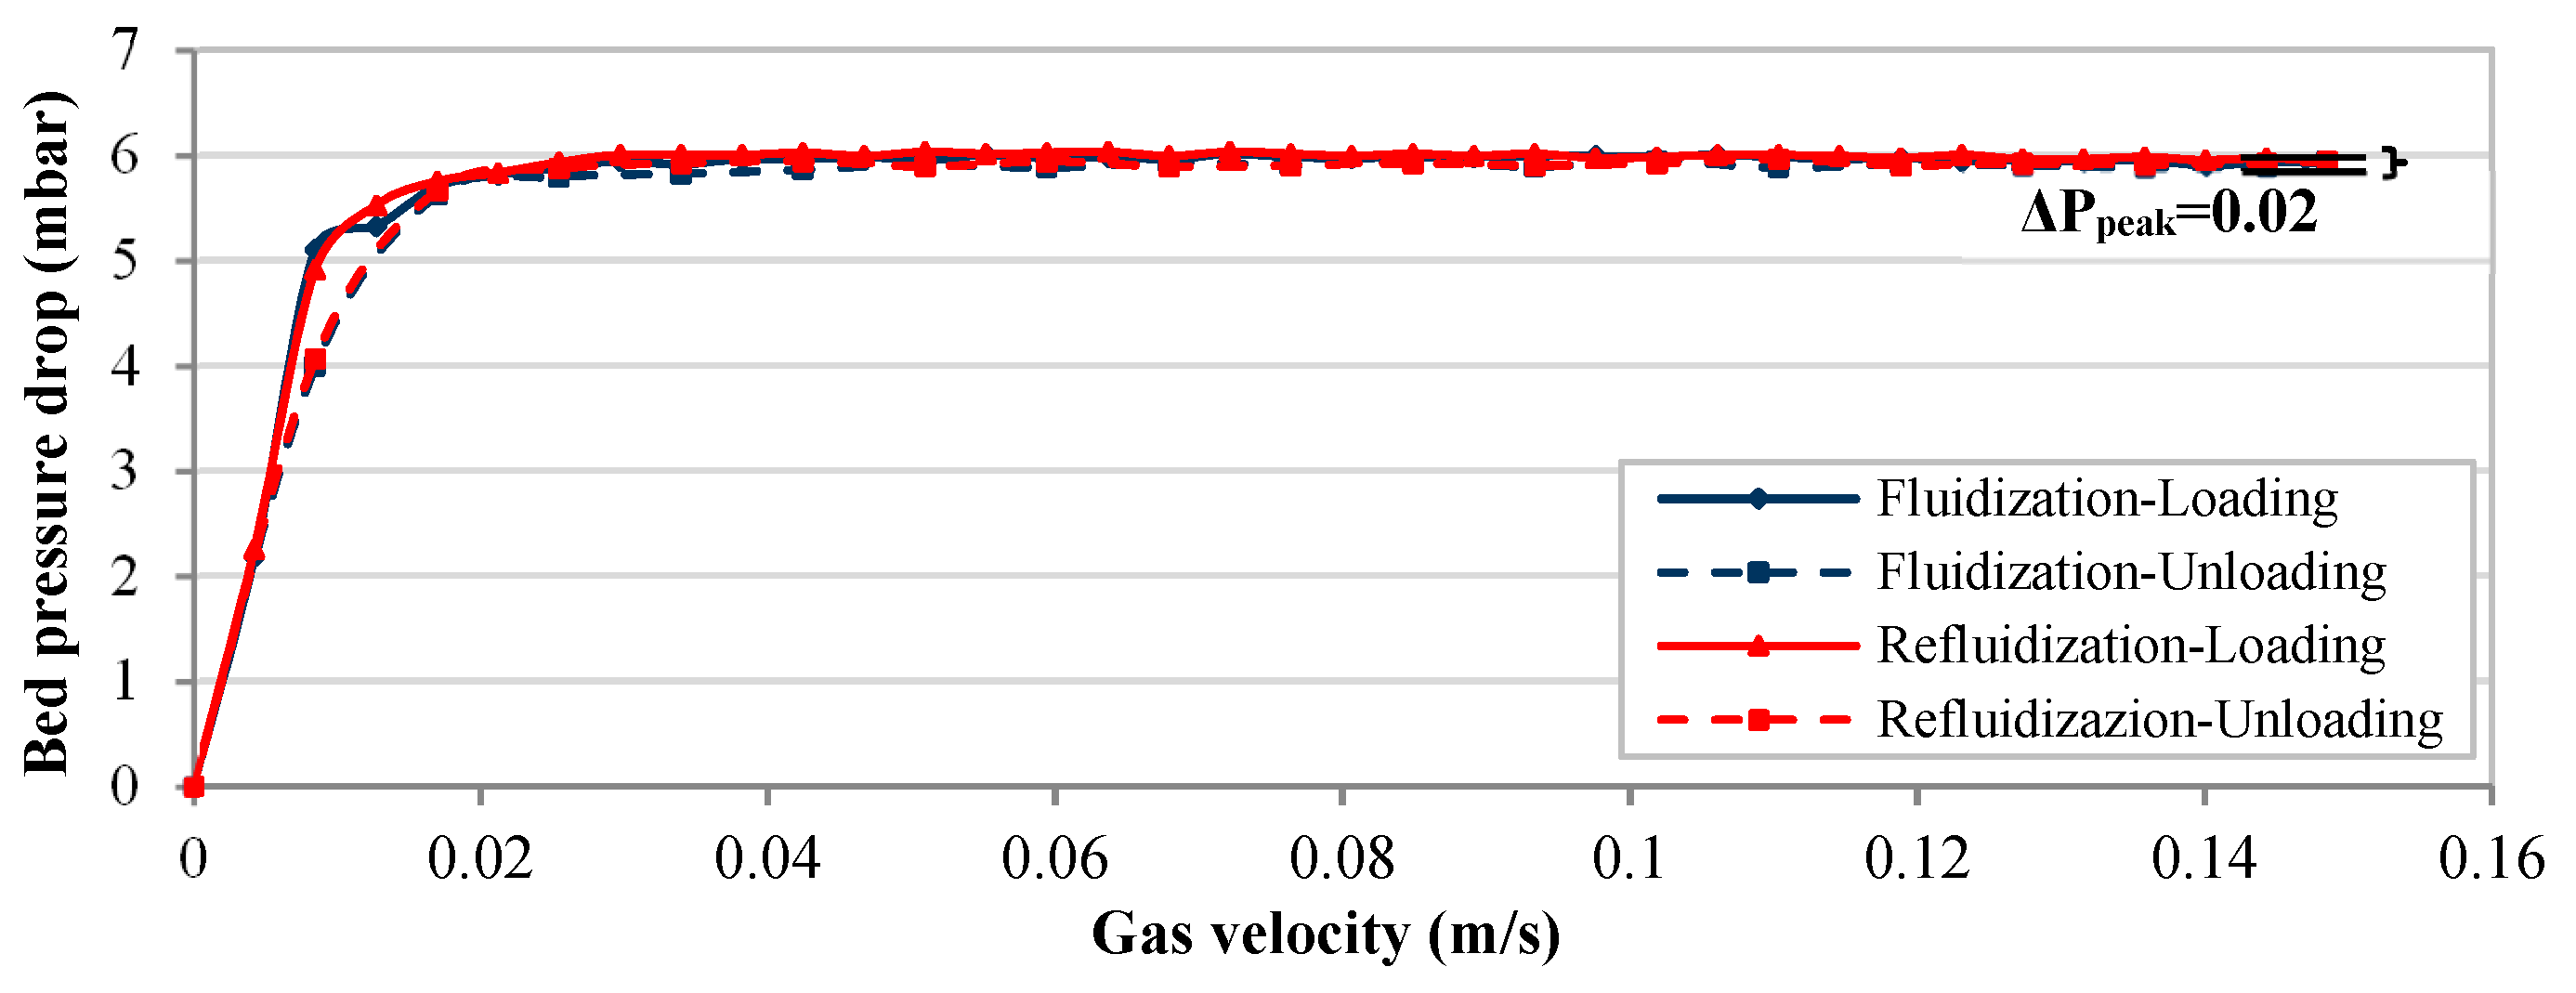
  • Initial Fluidization: Concerning the initial fluidization, the fluidization of fine material is characterized by easy fluidization; only a slight hysteresis effect is visible. For each mixture containing ultra-fine powders, the fluidization is partial and includes cracks, channels, and the formation of agglomerates (due to inter-particle forces). Therefore, their fluidization is a non-reproducible and time-varying process. High fluctuations were observed in the bed pressure drop during the loading process. However, the fluidization unloading curve shows an almost linear behavior, denoting an approximately constant permeability.
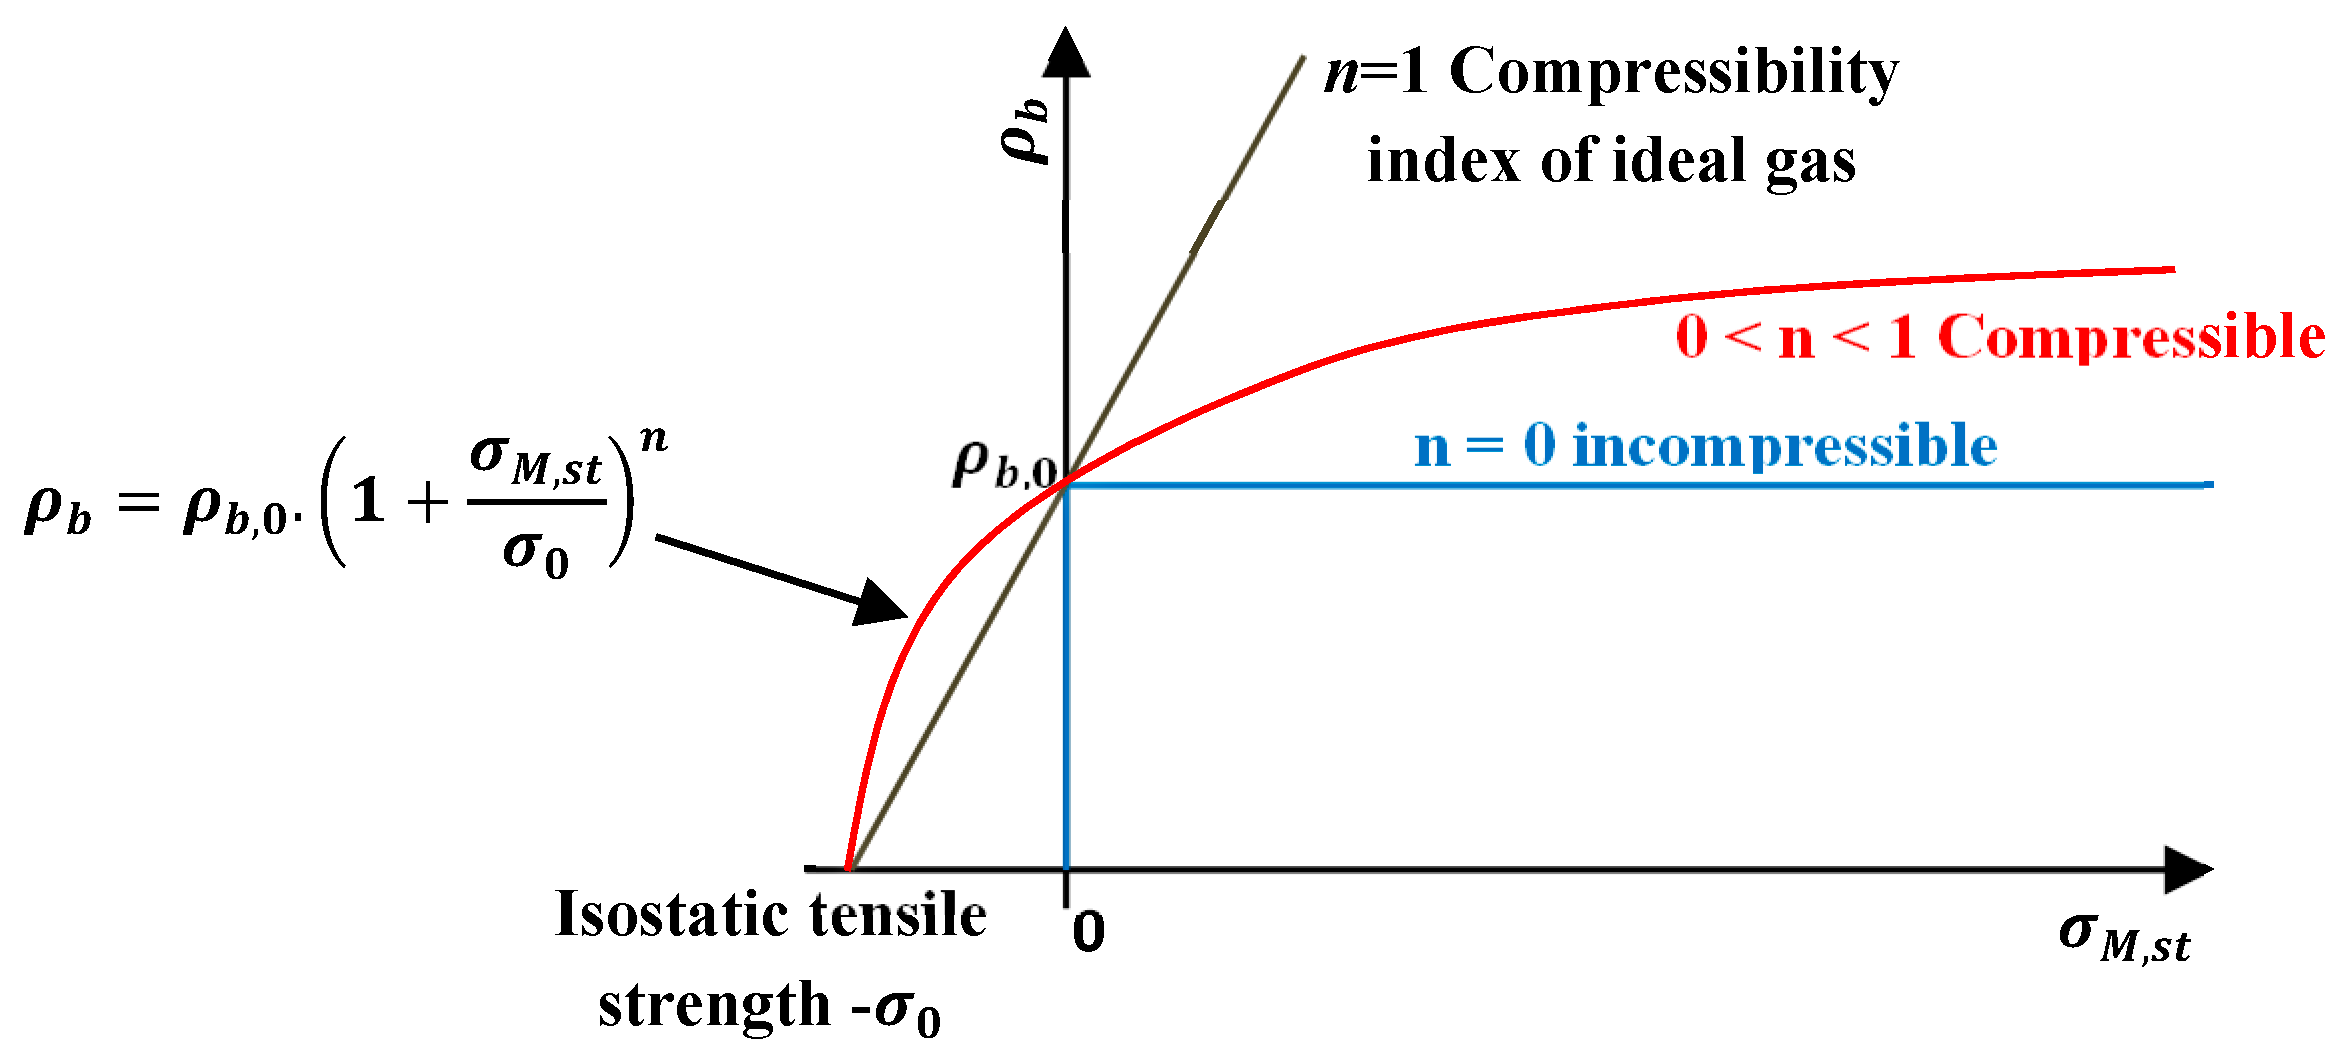
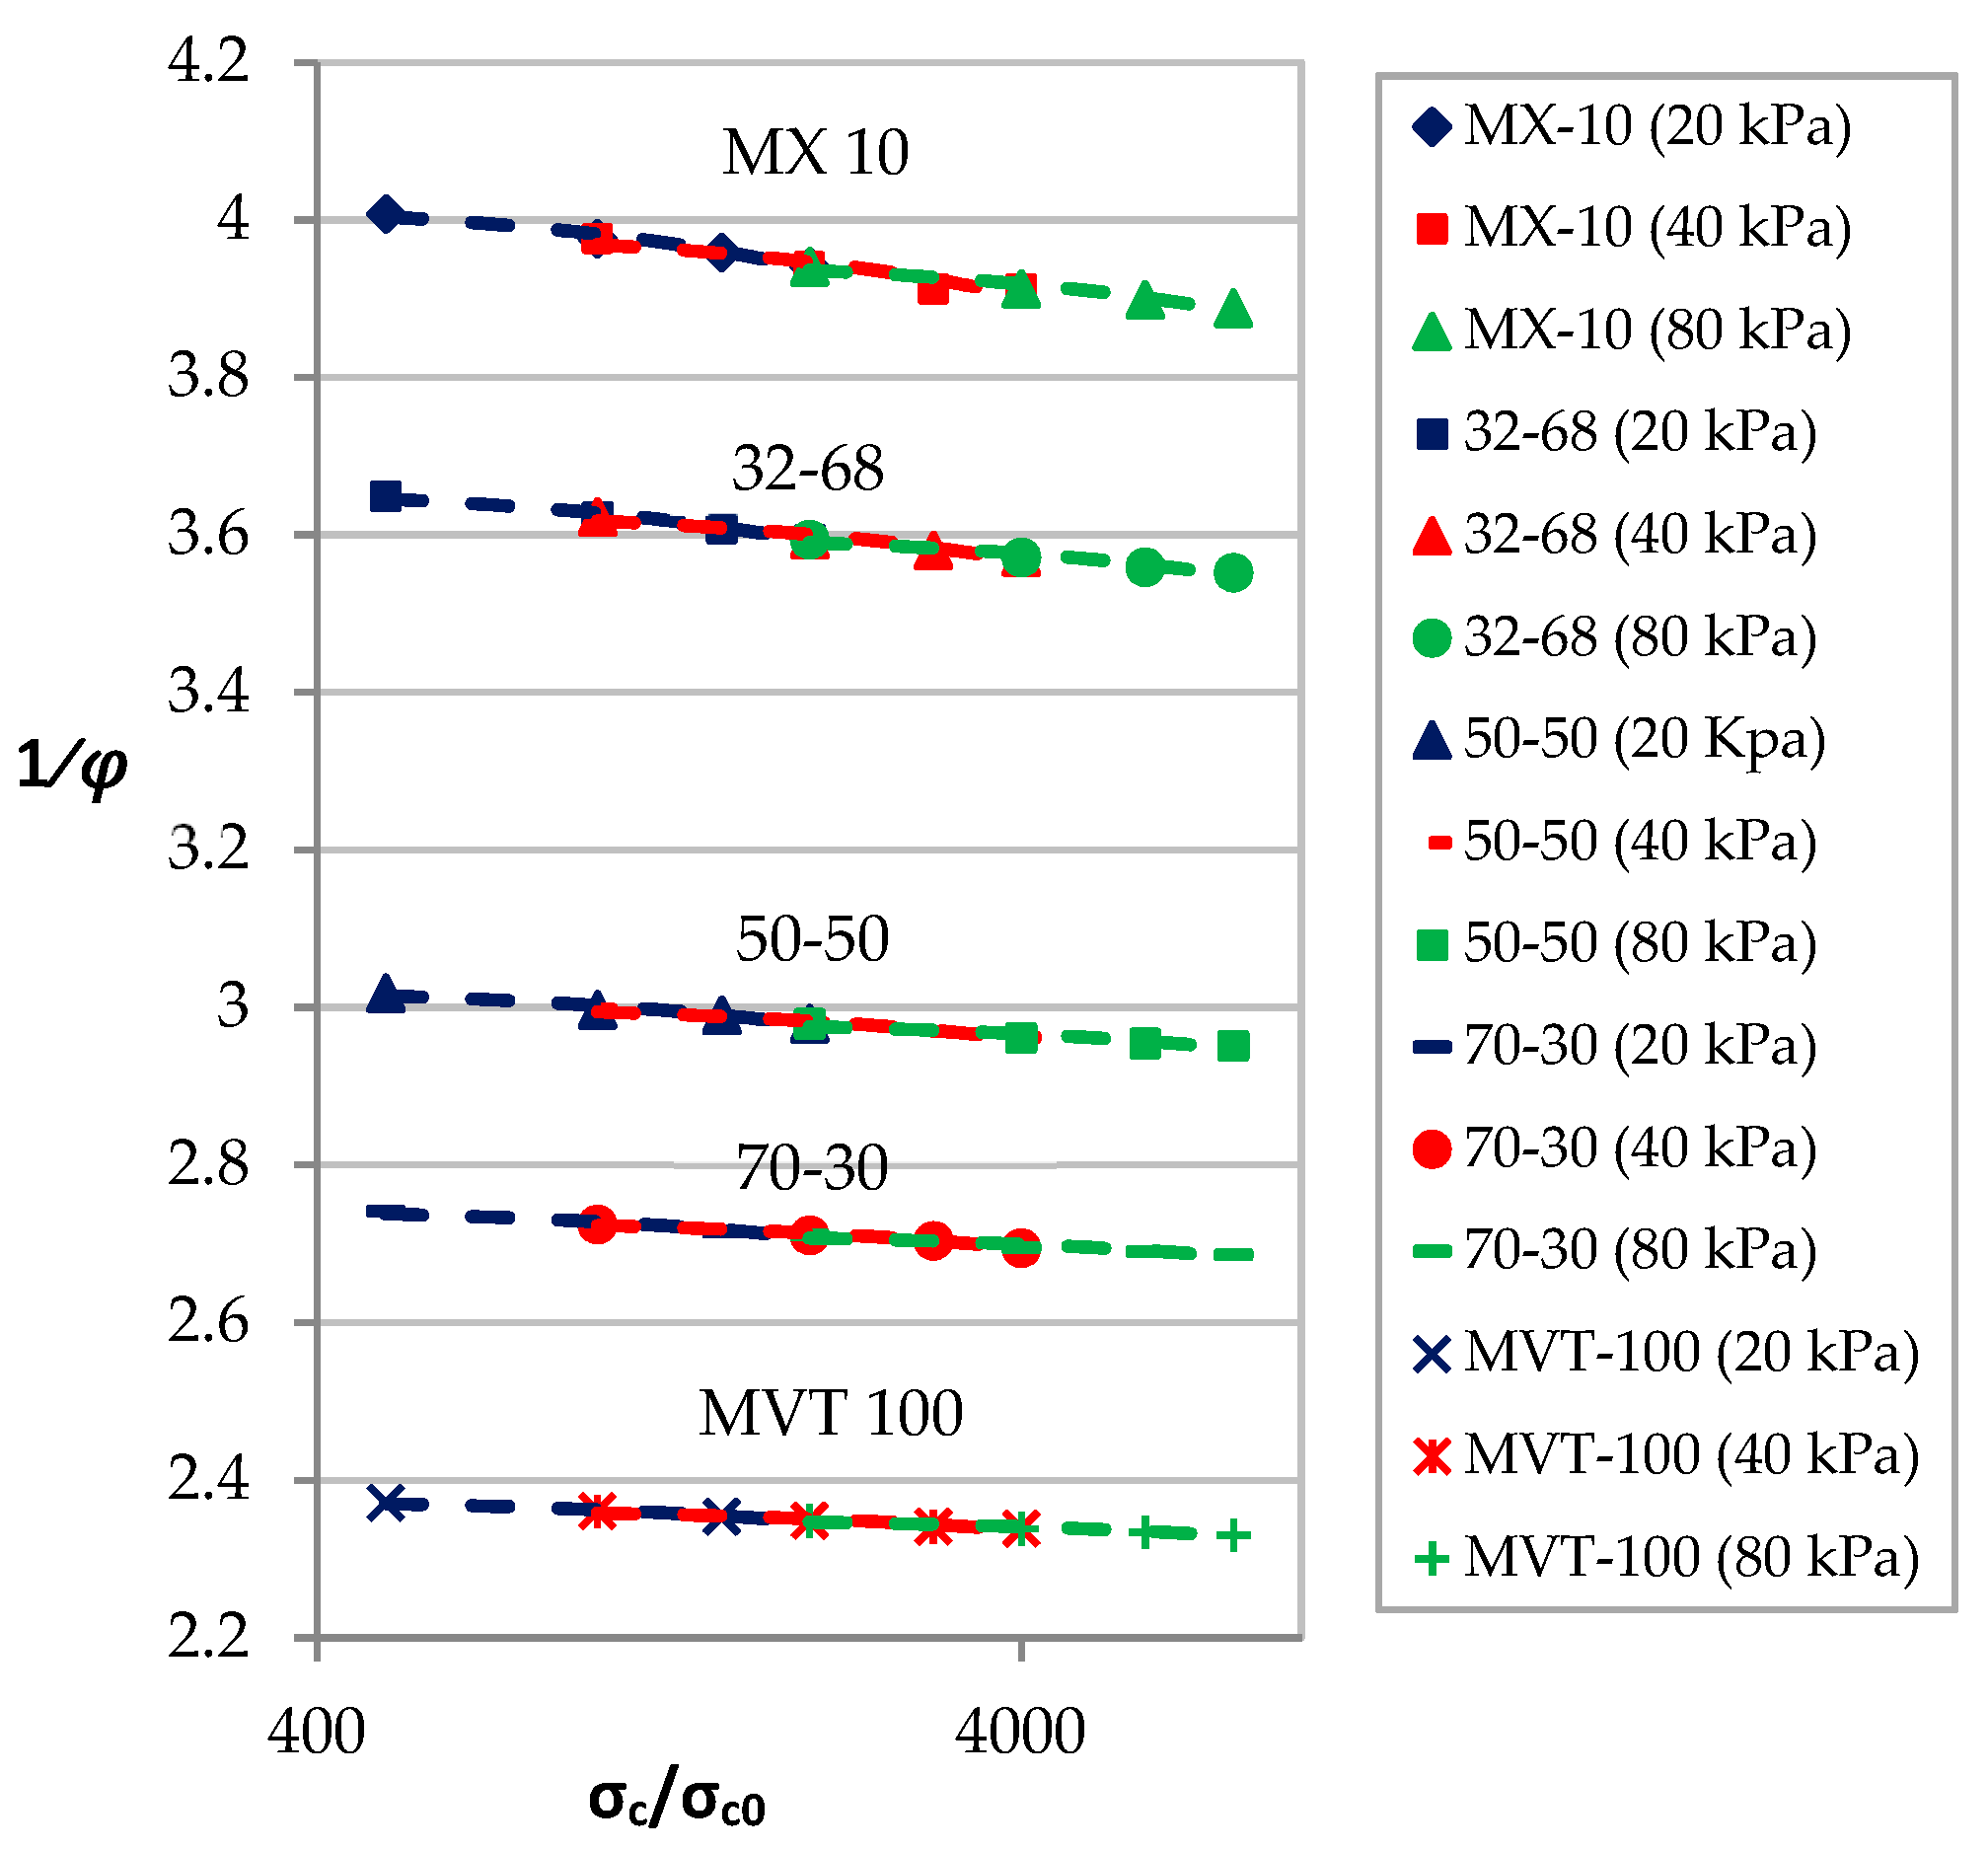
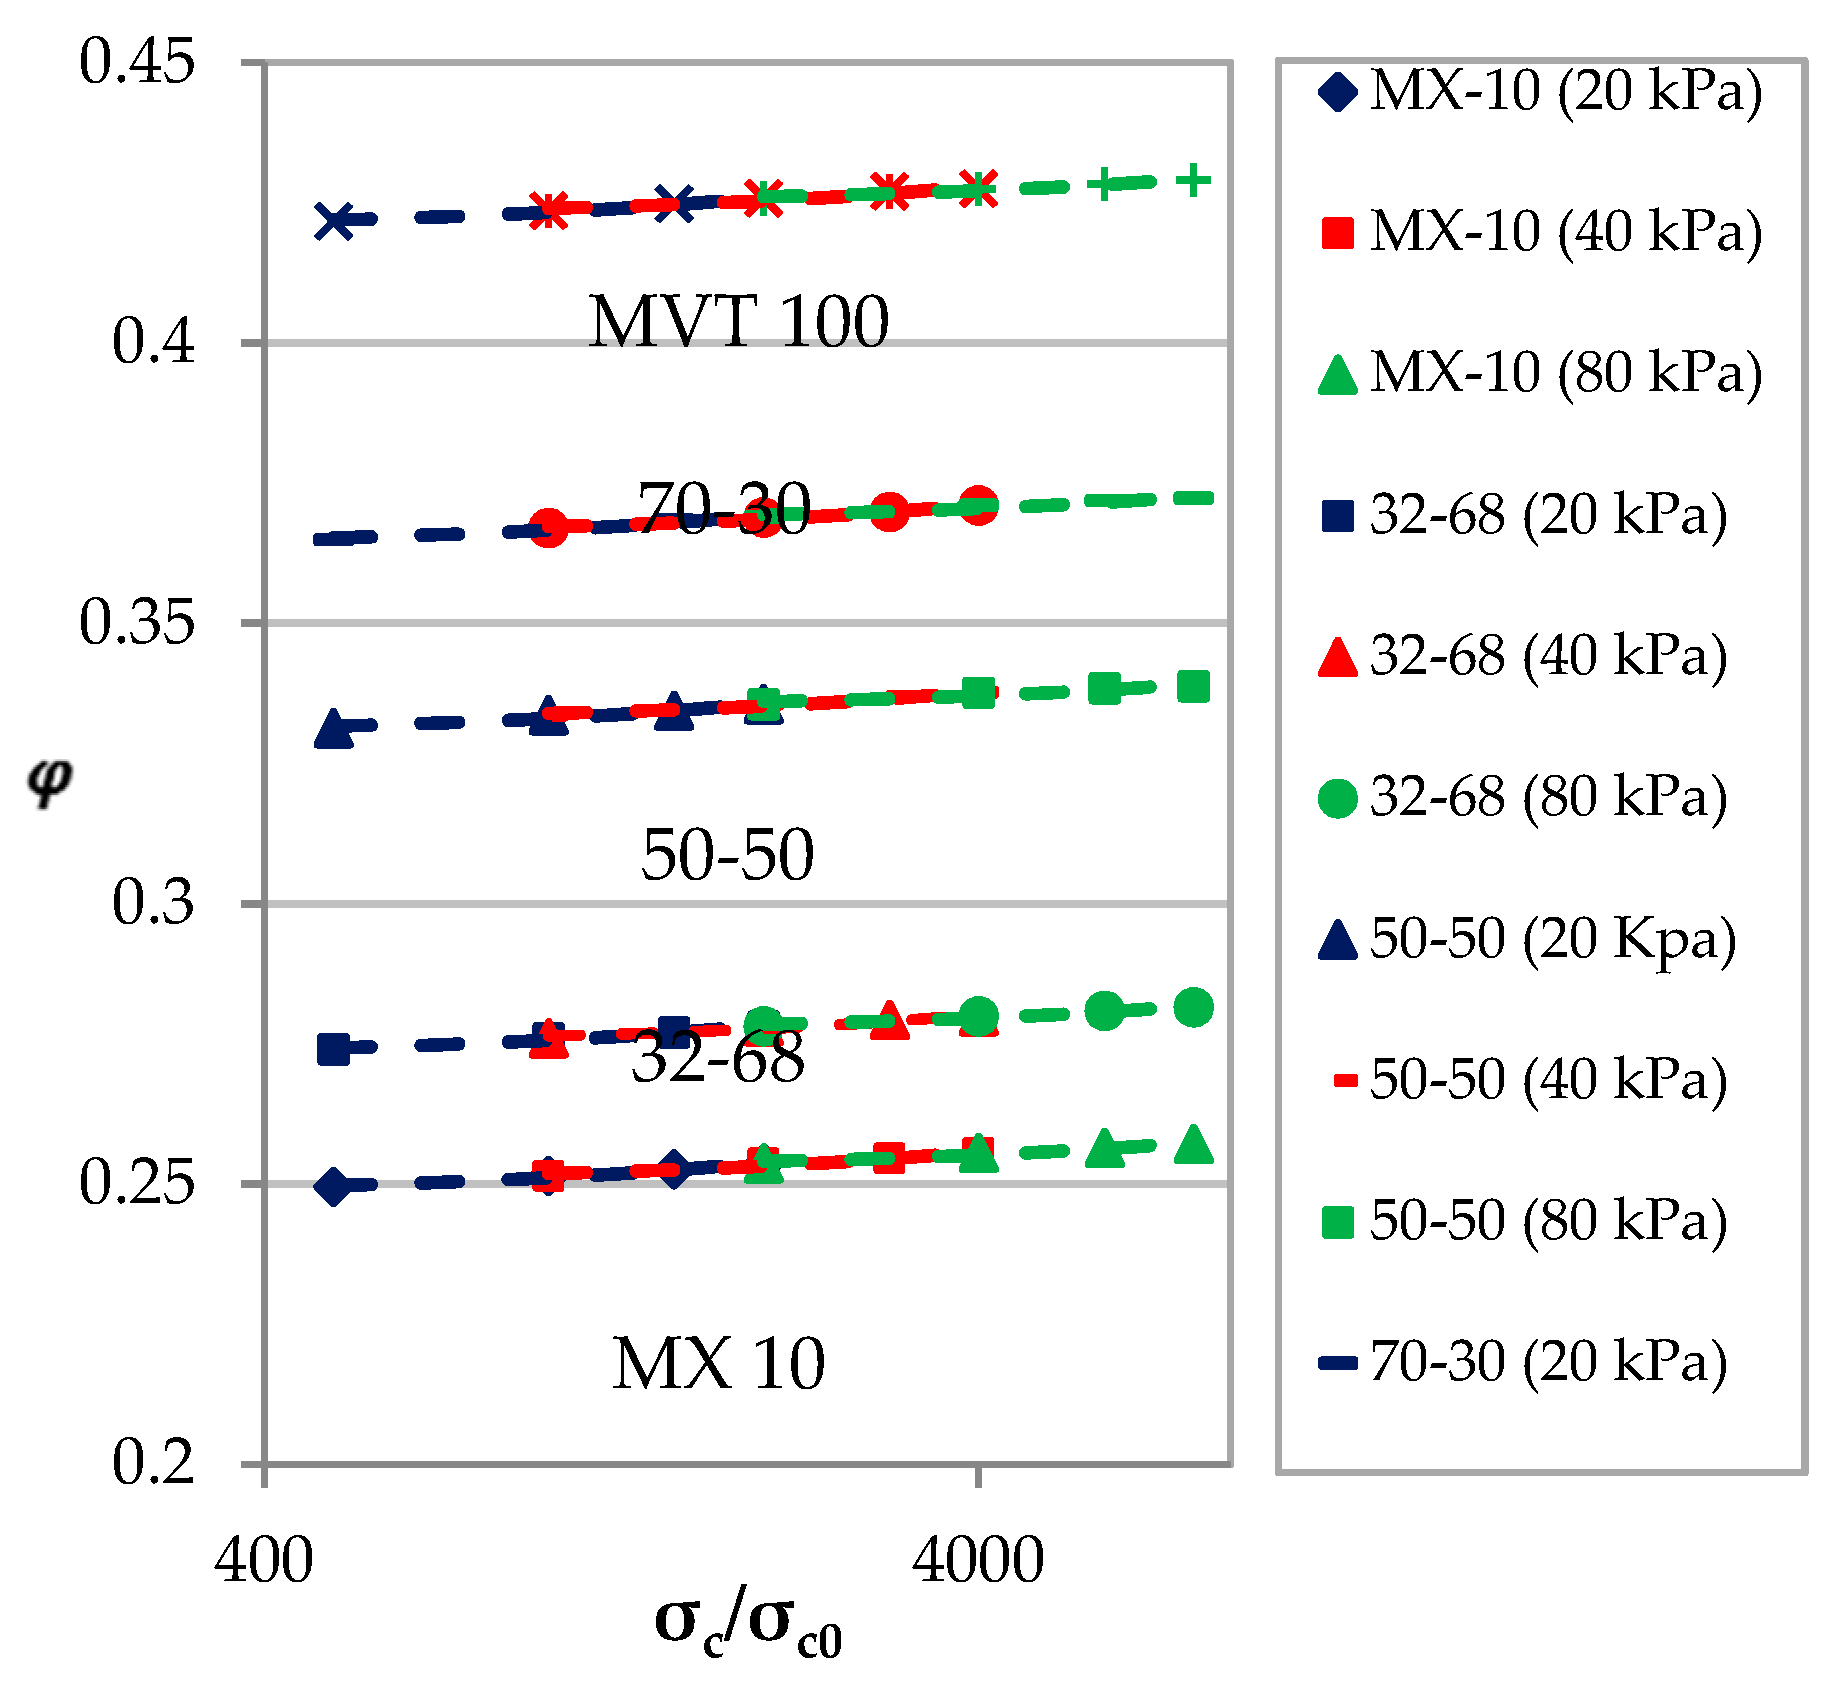
  • Compression: The results of the compression step show that the compression behavior follows the logarithmic law for all three pressures levels (20, 40, and 80 kPa). The compressibility index is almost the same for the low and intermediate pressure levels. However, for higher pressures, the compressibility index decreases strongly due to change in the compaction regime. Similarly, for the higher pressure, the slope of the particle volume fraction versus logarithmic display of dimensionless stress is noticeably different. The results of compression experiments further reveal that this slope does not depend on the size distribution of the mixtures but on the type of material itself.
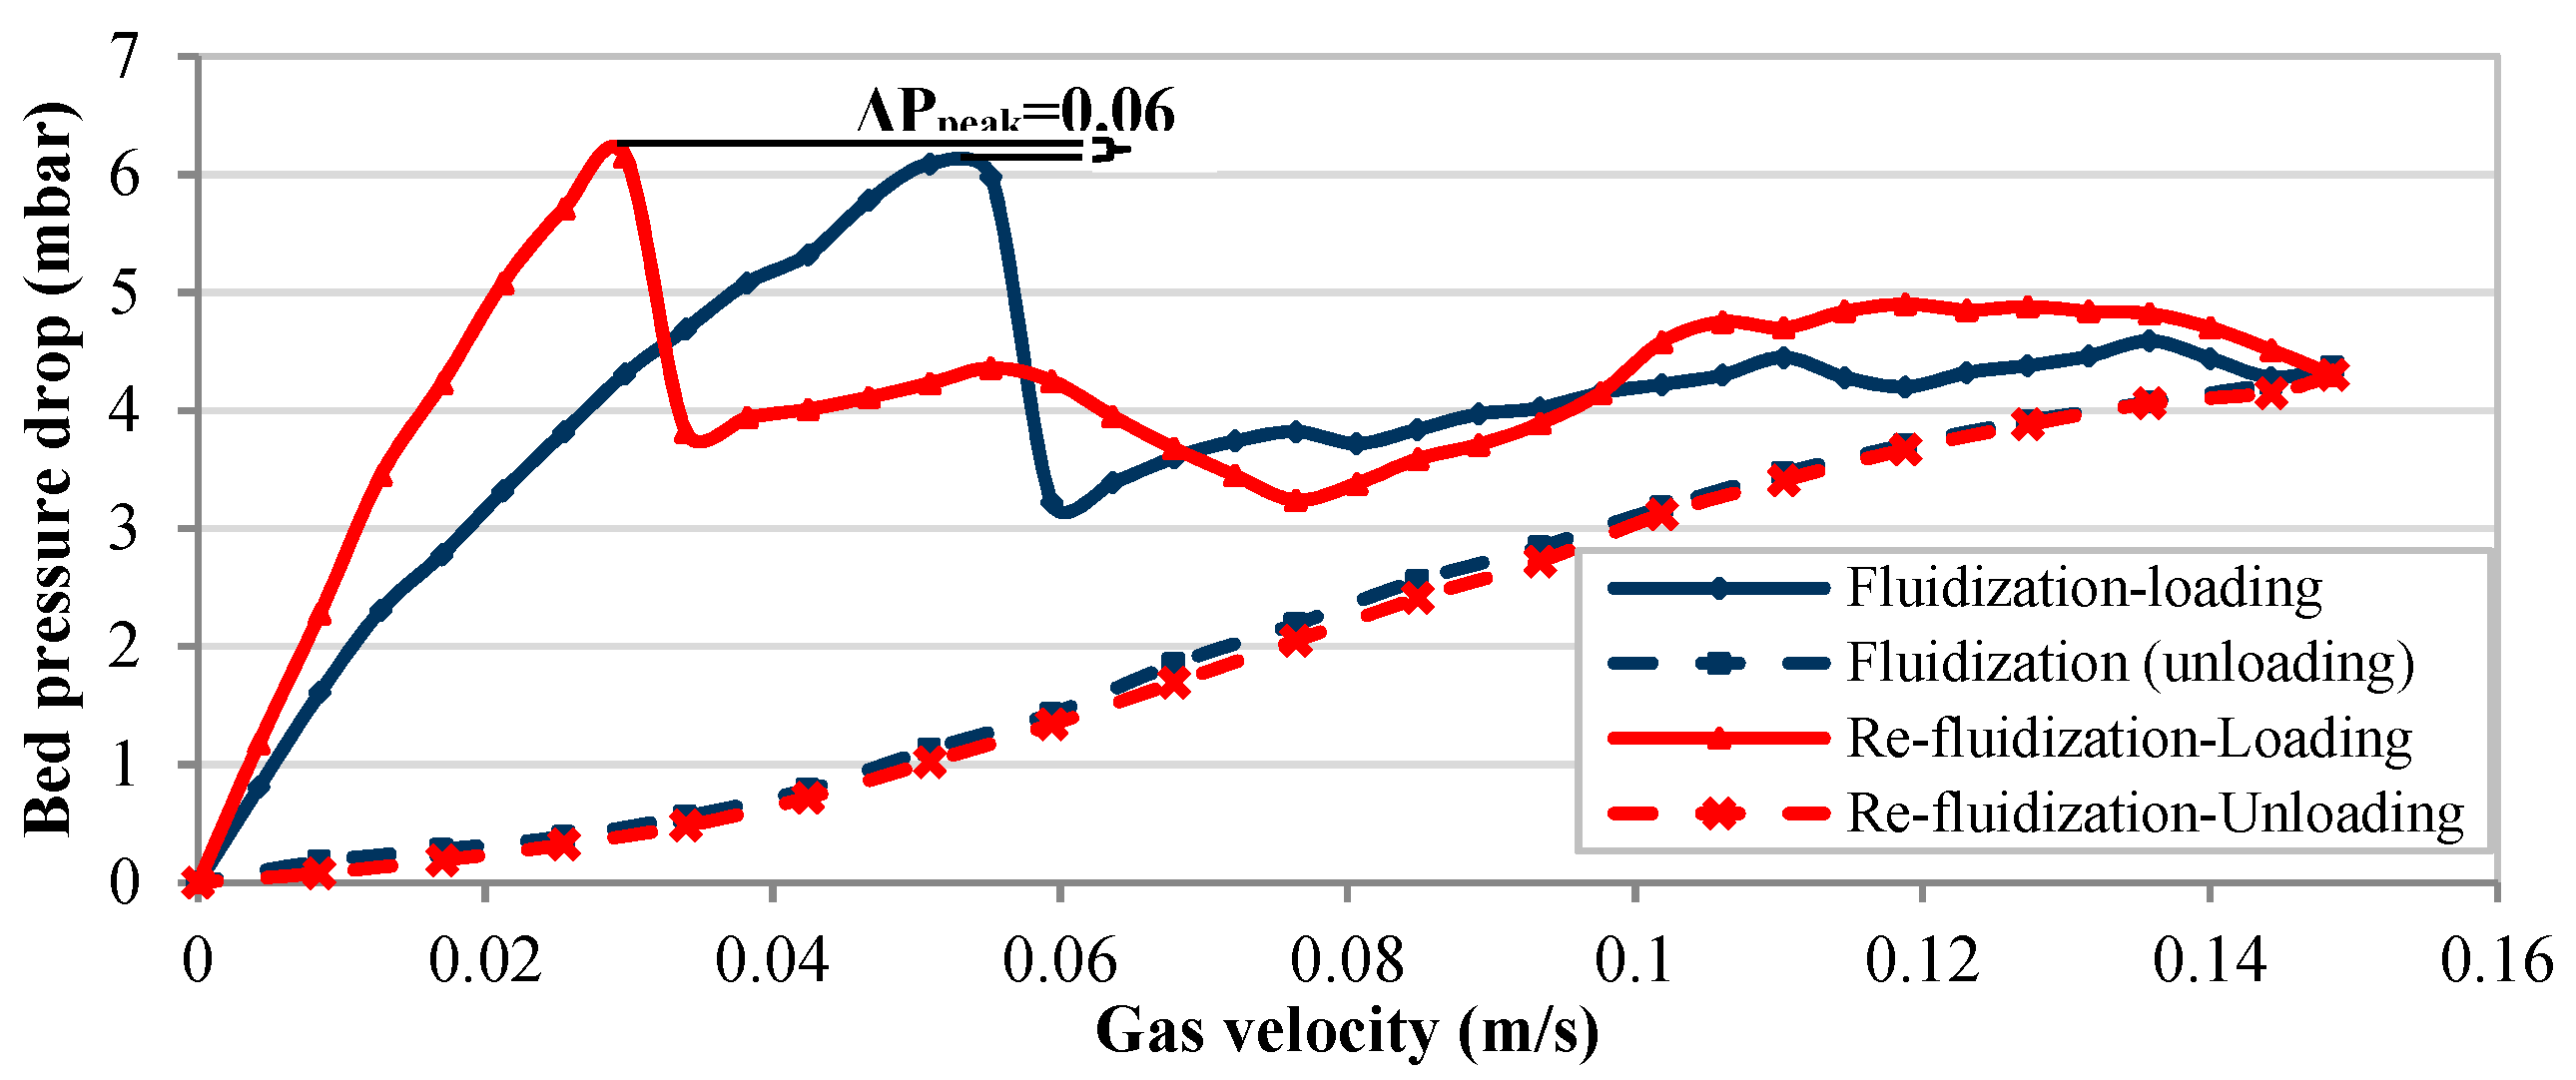
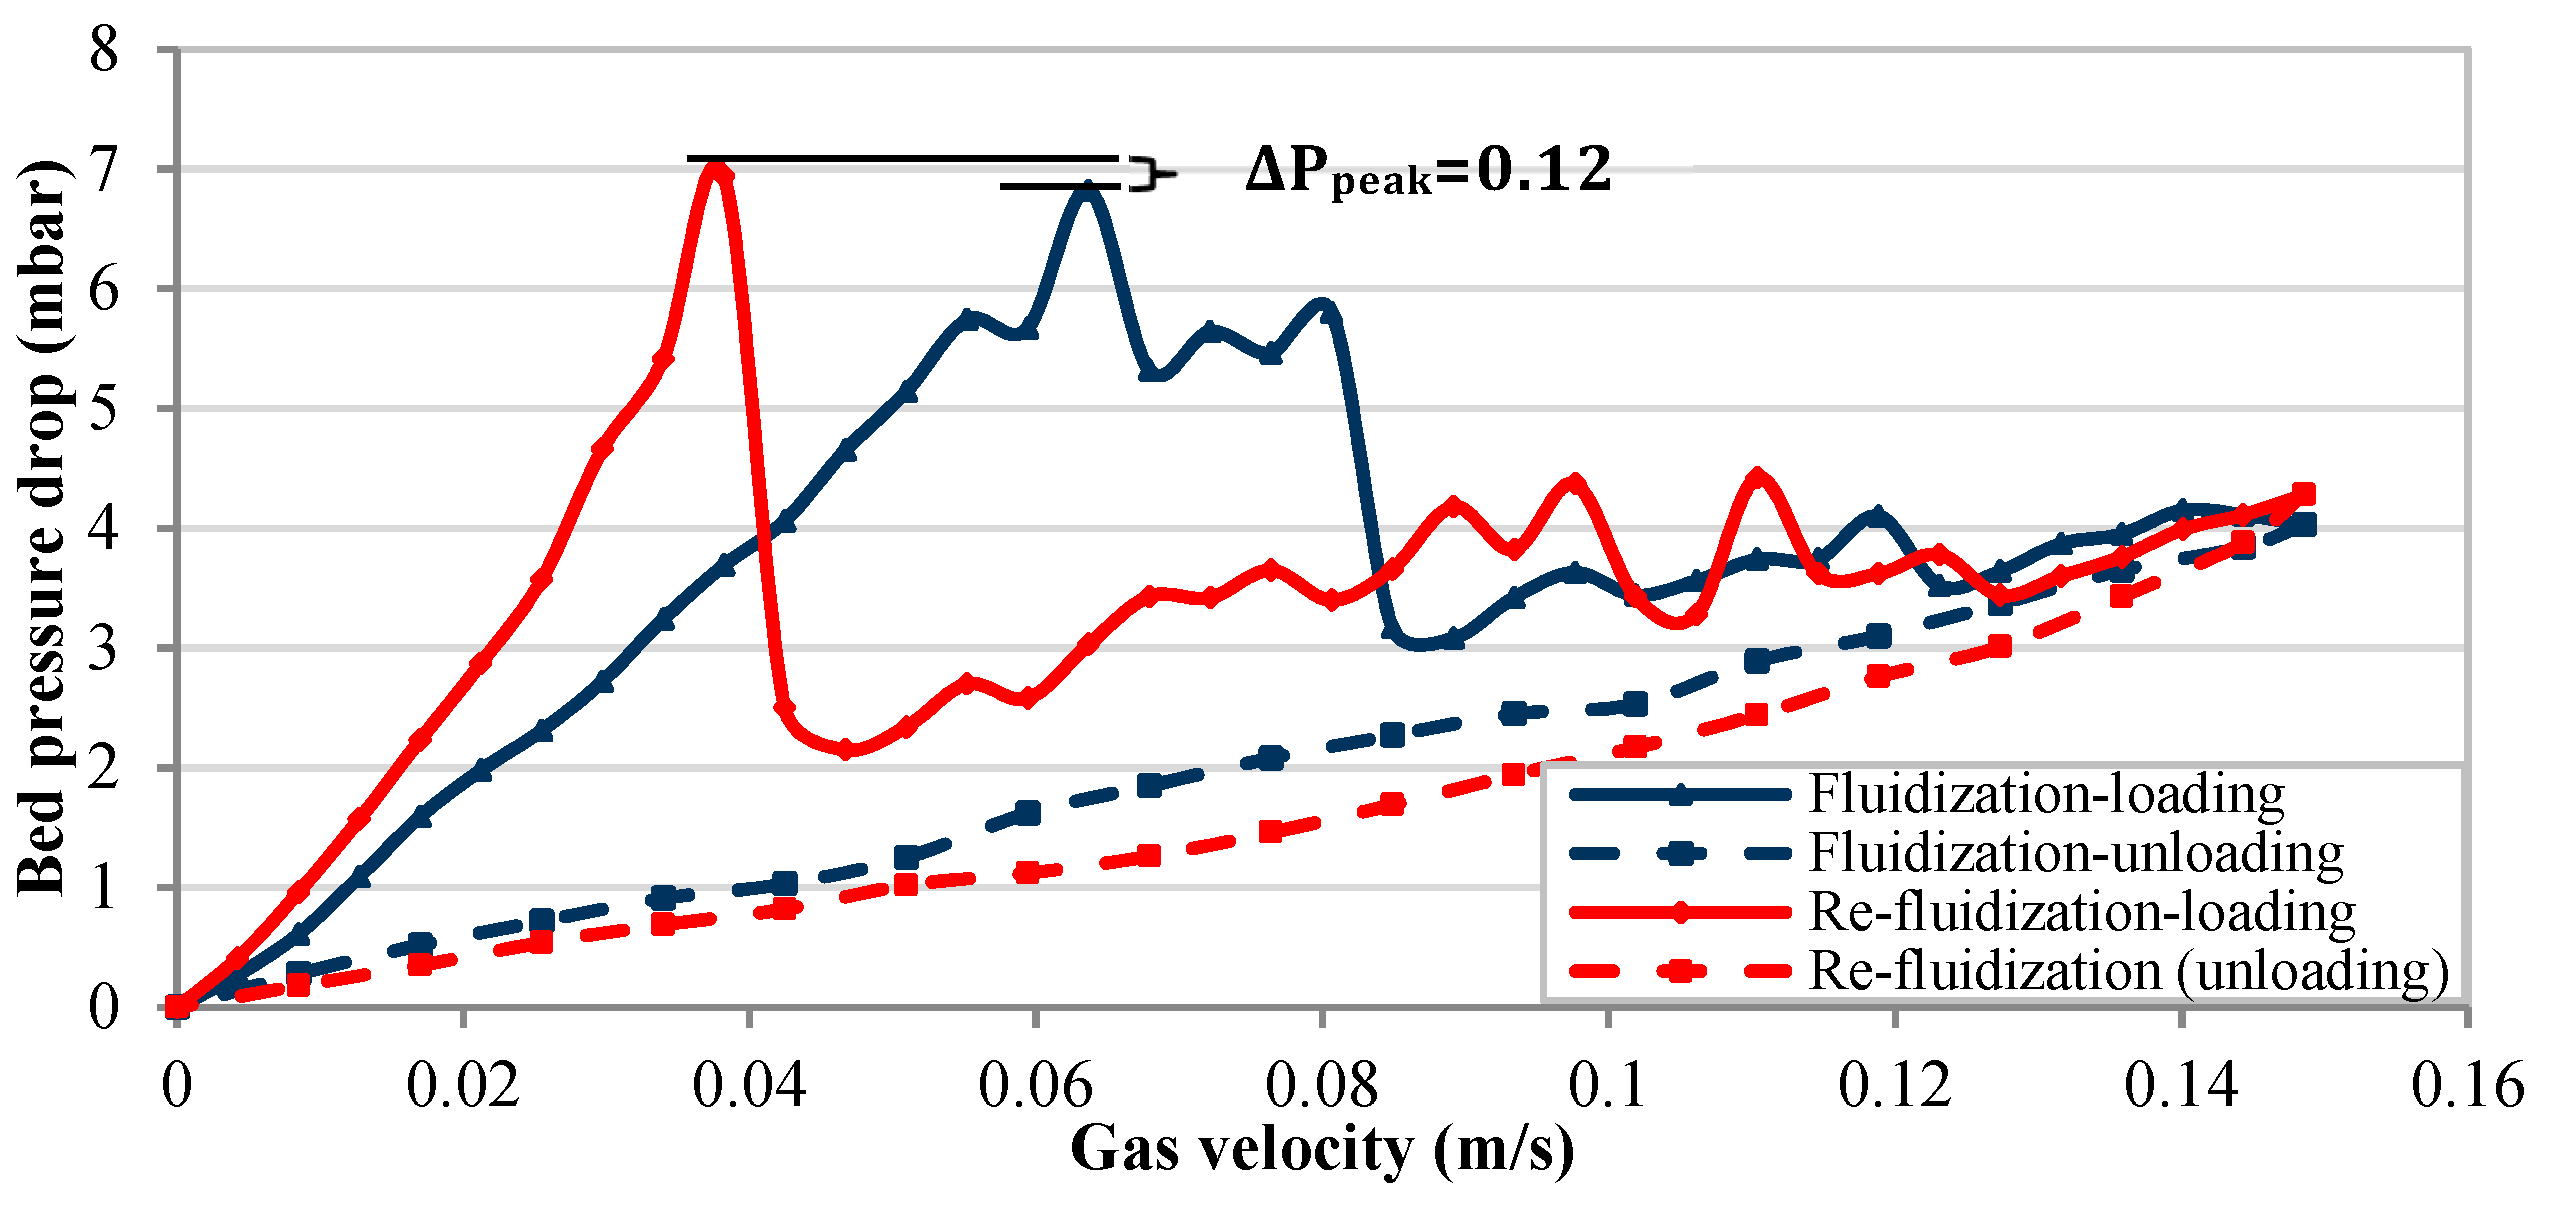
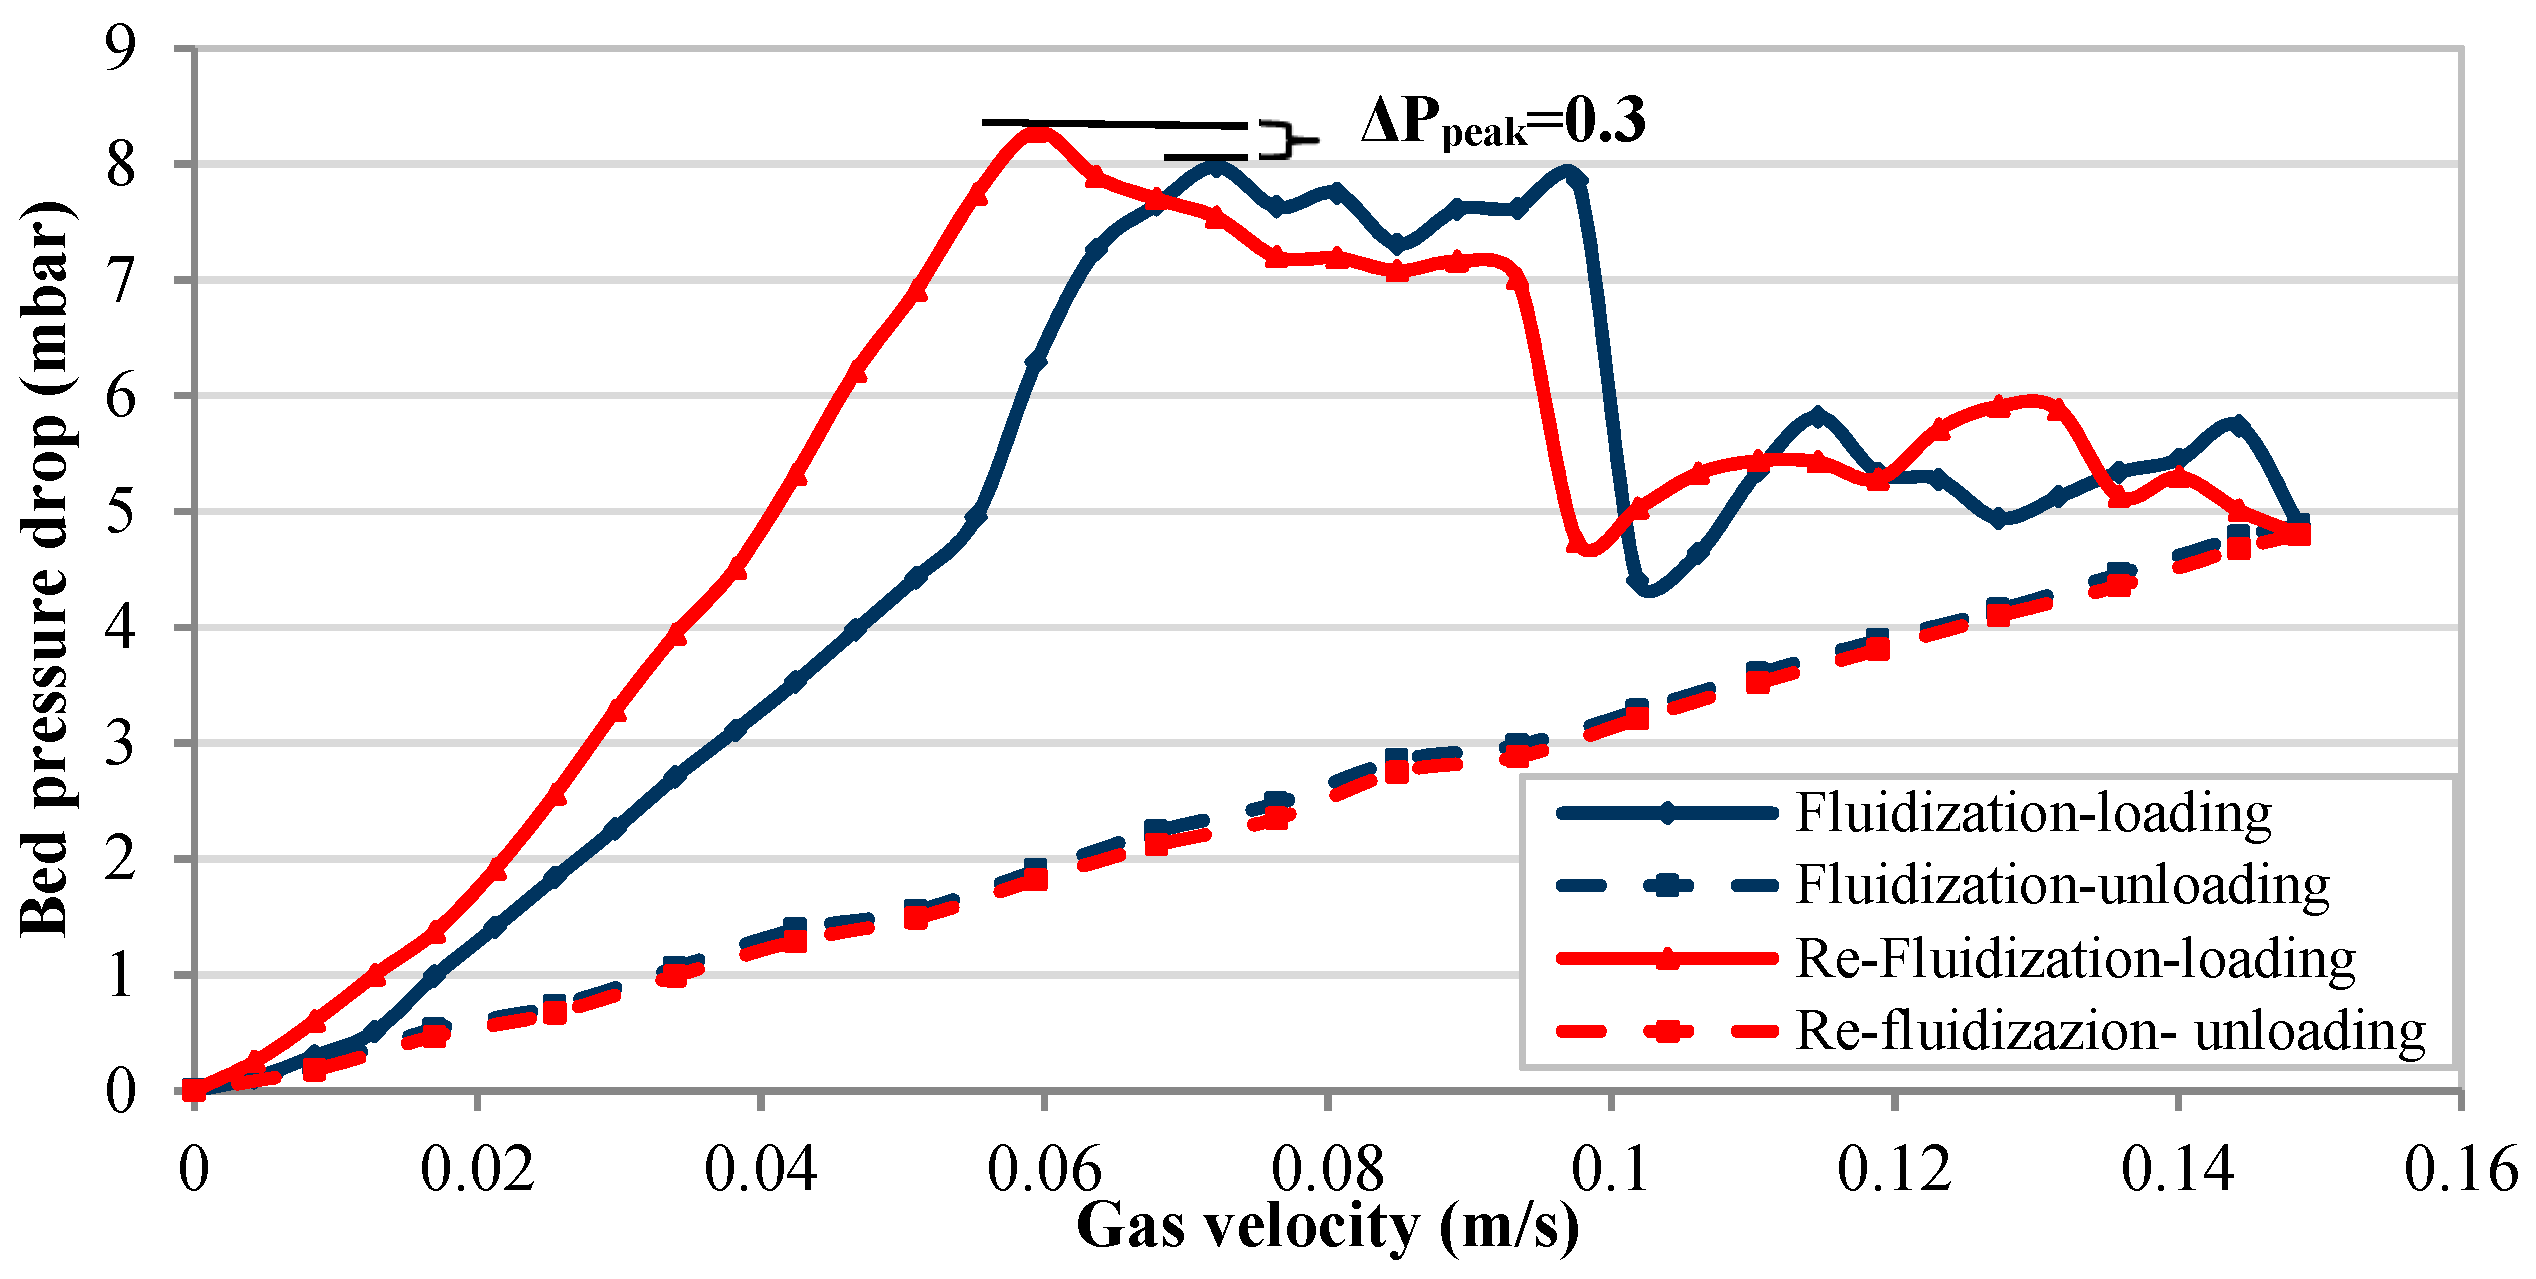
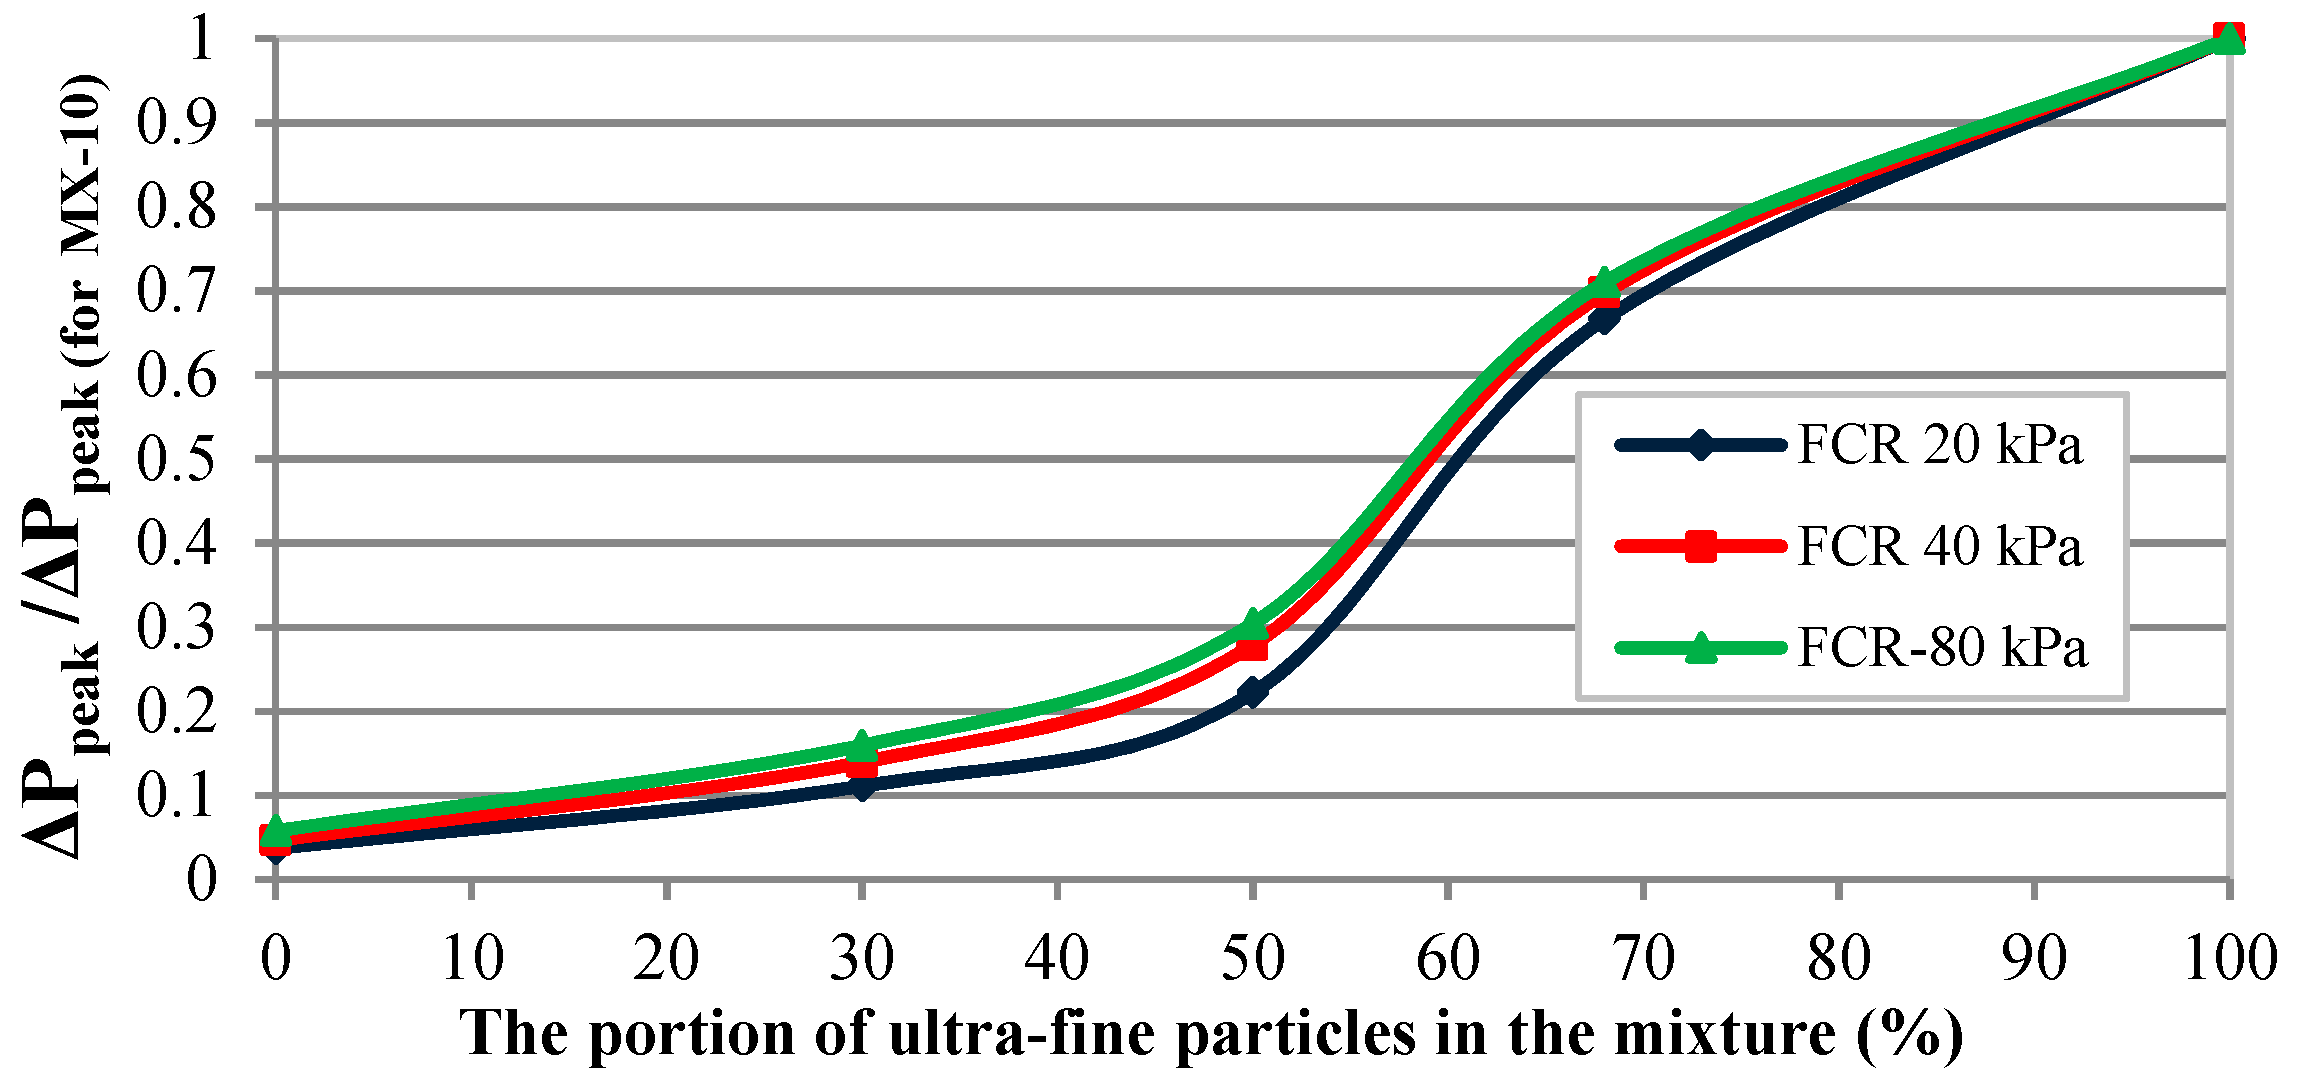
  • Re-fluidization: When analyzing the re-fluidization test results, history effects are observed leading to an increase in the bed pressure drop at peak point ( Δ P p e a k ) between initial fluidization and re-fluidization of compressed bed. While the peak of the bed pressure drop increases, the superficial gas velocity corresponding to the peak point is smaller for re-fluidization after compression, compared to initial fluidization; consequently, the slope of the loading curve is much larger for re-fluidization. The opposite is observed for the unloading curves. When increasing the proportion of ultra-fine particles in the binary mixture, Δ P p e a k increases as well, particularly strongly in the intermediate range of 50% to 70% of ultra-fine particles, when the ultra-fine powders start to be dominant in the mixture.
  • Future work: One of the most important processes in particle technology is the permeation of a fluid (air) in a particulate porous media. It could be more interesting if the porous media is a compressed and consolidated bed of a binary mixture. However, knowledge about this issue is limited. Therefore, investigating the permeation after compression and the effect of permeation on the re-fluidization of a binary mixture of fine and ultra-fine particles could be the next step of this study.

Author Contributions

A.K.M. and J.T. conceived and designed the experiments; A.K.M. performed the experiments; A.K.M. and D.T. analyzed the data and wrote the initial draft of the manuscript; J.T., D.T., S.A. and A.B. assisted the experiment procedures; A.K.M., D.T., S.A., B.v.W. and A.B. reviewed and contributed to the final manuscript.

Funding

This work was funded by the German Research Foundation (DFG) within the research training group “Micro-Macro-Interactions in Structured Media and Particle Systems” (GRK 1554).

Conflicts of Interest

The authors declare no conflict of interest.

Symbols and Notations

Greek Symbols
ε The void fraction of particle bed (-)
ϑ The slope of particle volume fraction versus the dimensionless applied stress (-)
μ g The dynamic viscosity of the fluidizing gas (kg/m.s)
ρ b The bulk density of particulate material (kg/m3)
ρ f ,   ρ g The density of the fluid or gas (kg/m3)
ρ p The density of particle (kg/m3)
σ Normal stress (kg/m.s2)
σ 1 Major principal normal stress
σ 2 Minor principal normal stress
σ 0 Isostatic tensile strength
σ c Applied compression stress
σ c 0 Critical pressure (Empirical parameter)
σ ^ c The dimensionless applied pressure ( σ c / σ c 0 )
σ M ,   s t Average pressure (( σ 1 + σ 2 )/2)
τ Shear stress (kg/m.s2)
φ Particle volume fraction (-)
φ j The jammed particle volume fraction (-)
Roman Symbols
A Bed cross-section area (m2)
B o g Granular Bond number (-)
DThe fractal dimension of formed agglomerates (-)
d ,   d p Particle diameter (m)
d 50 , 3 Mass-mean particle diameter (m)
d a g Size of new agglomerates (m)
d S T Sauter mean diameter (m)
f f c Bulk solid flowability (-)
g Gravity acceleration (m/s2)
h b The height of the bed (m)
Δ h w The pressure drop across the bed (m)
K The ratio of size enlargement (-)
k Permeability (m2)
L 0 Settled initial bed height (m)
n Compressibility index (-)
PTotal Pressure (kg/m.s2)
PaGage pressure within the apparatus (kg/m.s2)
PwbTotal weight per cross-section area of the particle bed (kg/m.s2)
Δ P b Bed pressure drop (kg/m.s2)
Δ P D The pressure drop of the gas distributor (kg/m.s2)
u The mean velocity of the fluid (m/s)
U a d The velocity of after disruption point (Peak point) (m/s)
U s g Superficial gas velocity (m/s)
V ˙ The volumetric flow rate of the fluid passing through a porous medium (m3/s)

References

  1. Grossmann, L.; Tomas, J.; Csöke, B. Compressibility and flow properties of a cohesive limestone powder in a medium pressure range. Granul. Matter 2004, 6, 103–109. [Google Scholar] [CrossRef]
  2. Gochioco, K. The Effect of Crystalline and Amorphous Lactose on Mechanical Properties of Roller Compaction Ribbon and Tablets. Master’s Thesis, University of Kansas, Lawrence, KS, USA, 2014. [Google Scholar]
  3. Faldu, B.; Zalavadiya, B. Compaction Behaviour: Force Distribution Through Powder Bed. Int. J. Pharm. Res. Dev. 2012, 4, 38–50. [Google Scholar]
  4. Darwin, G.H. On the Horizontal Thrust of a Mass of Sand. In Minutes of the Proceedings of the Institution of Civil Engineers; ICE Virtual Library: London, UK, 1883; Volume 71, pp. 350–378. [Google Scholar] [CrossRef]
  5. Castellanos, A. The relationship between attractive interparticle forces and bulk behaviour in dry and uncharged fine powders. Adv. Phys. 2005, 54, 263–276. [Google Scholar] [CrossRef]
  6. Tomas, J. Adhesion of ultrafine particles—A micromechanical approach. Chem. Eng. Sci. 2007, 62, 1997–2010. [Google Scholar] [CrossRef]
  7. Valverde, J.M.; Castellanos, A. Compaction of fine powders: From fluidized agglomerates to primary particles. Granul. Matter 2007, 9, 19–24. [Google Scholar] [CrossRef]
  8. Walker, E.E. The properties of powders. Part VI. The compressibility of powders. Trans. Faraday Soc. 1923, 19, 73–82. [Google Scholar] [CrossRef]
  9. Poquillon, D.; Lemaitre, J.; Baco-Carles, V.; Tailhades, P.; Lacaze, J. Cold compaction of iron powders-relations between powder morphology and mechanical properties-Part I: Powder preparation and compaction. Powder Technol. 2002, 126, 65–74. [Google Scholar] [CrossRef]
  10. Tomas, J. Energy Absorption at Particle Contact, Compression, and Shear Flow of Dry Ultrafine Powder. Part. Sci. Technol. 2009, 27, 337–351. [Google Scholar] [CrossRef]
  11. Tomas, J. The mechanics of dry, cohesive powders. Powder Handl. Process. 2003, 15, 296–314. [Google Scholar]
  12. Rumpf, H. Die Wissenschaft des Agglomerierens. Chemie Ing. Tech. - CIT 1974, 46, 1–11. [Google Scholar] [CrossRef]
  13. Geldart, D. Types of gas fluidization. Powder Technol. 1973, 7, 285–292. [Google Scholar] [CrossRef]
  14. Schulze, D. Powders and Bulk Solids; English Ed.; Springer: Berlin/Heidelberg, Germany, 2007; ISBN 978-3-540-73767-4. [Google Scholar]
  15. Kamranian Marnani, A.; Bück, A.; Antonyuk, S.; van Wachem, B.; Thévenin, D.; Tomas, J. The Effect of the Presence of Very Cohesive Geldart C Ultra-Fine Particles on the Fluidization of Geldart A Fine Particle Beds. Processes 2019, 7, 35. [Google Scholar] [CrossRef]
  16. Turki, D.; Fatah, N. Behavior and fluidization of the cohesive powders: Agglomerates sizes approach. Brazilian J. Chem. Eng. 2008, 25, 697–711. [Google Scholar] [CrossRef]
  17. Castellanos, A.; Valverde, J.M.; Quintanilla, M.A.S. Physics of compaction of fine cohesive particles. Phys. Rev. Lett. 2005, 94, 075501. [Google Scholar] [CrossRef] [PubMed]
  18. Valverde, J.M.; Quintanilla, M.A.S.; Castellanos, A. Jamming Threshold of Dry Fine Powders. Phys. Rev. Lett. 2004, 92, 258303. [Google Scholar] [CrossRef] [PubMed]
  19. Ajbar, A.; Alhumazi, K.; Asif, M. Improvement of the fluidizability of cohesive powders through mixing with small proportions of group A particles. Can. J. Chem. Eng. 2008, 83, 930–943. [Google Scholar] [CrossRef]
  20. Zhou, T.; Li, H. Effects of adding different size particles on fluidization of cohesive particles. Powder Technol. 1999, 102, 215–220. [Google Scholar] [CrossRef]
  21. Duan, H.; Liang, X.; Zhou, T.; Wang, J.; Tang, W. Fluidization of mixed SiO2 and ZnO nanoparticles by adding coarse particles. Powder Technol. 2014, 267, 315–321. [Google Scholar] [CrossRef]
  22. Song, L.; Zhou, T.; Yang, J. Fluidization behavior of nano-particles by adding coarse particles. Adv. Powder Technol. 2009, 20, 366–370. [Google Scholar] [CrossRef]
  23. Tomas, J.; Kache, G. Micro- and macromechanics of hopper discharge of ultrafine cohesive powder. Int. J. Chem. React. Eng. 2012, 10, 47–65. [Google Scholar] [CrossRef]
  24. Tomas, J. Micromechanics of Fine Particle Adhesion - Contact Models and Energy Absorption. In APM Proceedings; Russian Academy of Sciences Institute for Problems in Mechanical Engineering: St. Petersburg (Repino), Russia, 2008; pp. 652–667. [Google Scholar]
  25. Kamranian Marnani, A.; Idowu, R.; Bück, A.; Antonyuk, S.; Thévenin, D.; Tomas, J. Classification of ultra-fine adhesive particles at fine cohesive powders. In Proceedings of the 12th International Conference on Bulk Materials Storage, Handling and Transportation (ICBMH 2016), Darwin, Australia, 11–14 July 2016. [Google Scholar]
  26. Schulze, D. Flow properties of powders and bulk solids (fundamentals). Powder Technol. 2010, 65, 321–333. [Google Scholar]
  27. Hostler, S.R. Wave propagation in granular materials. Ph.D. Thesis, California Institute of Technology, Pasadena, CA, USA, 2005. [Google Scholar]
  28. Liu, C. Spatial patterns of sound propagation in sand. Phys. Rev. B 1994, 50, 782–794. [Google Scholar] [CrossRef] [PubMed]
  29. Geldart, D.; Harnby, N.; Wong, A.C. Fluidization of cohesive powders. Powder Technol. 1984, 37, 25–37. [Google Scholar] [CrossRef]
  30. Majmudar, T.S.; Sperl, M.; Luding, S.; Behringer, R.P. Jamming Transition in Granular Systems. Phys. Rev. Lett. 2007, 98, 058001. [Google Scholar] [CrossRef] [PubMed] [Green Version]
  31. Sederman, A.J.; Alexander, P.; Gladden, L.F. Structure of packed beds probed by Magnetic Resonance Imaging. Powder Technol. 2001, 117, 255–269. [Google Scholar] [CrossRef]
  32. Boutreux, T.; de Gennes, P.G. Compaction of granular mixtures: A free volume model. Phys. A Stat. Mech. Appl. 1997, 244, 59–67. [Google Scholar] [CrossRef]
  33. Richard, P.; Philippe, P.; Barbe, F.; Bourlès, S.; Thibault, X.; Bideau, D. Analysis by X-ray microtomography of a granular packing undergoing compaction. Phys. Rev. E 2003, 68, 02030. [Google Scholar] [CrossRef] [PubMed]
  34. Atkinson, J. The Mechanics of Soils and Foundations, 2nd ed.; Taylor & Francis Group: New York, NY, USA, 2007; ISBN 9780415362566. [Google Scholar]
  35. Dwivedi, S.K. Analysis of Particle Deformation Mechanisms and Compact Expansion During Compaction on a high speed Rotary Tablet Press. Ph.D. Thesis, The University of British Columbia, Vancouver, BC, Canada, 1992. [Google Scholar]
  36. Khomane, K.S.; Bansal, A.K. Effect of particle size on in-die and out-of-die compaction behavior of ranitidine hydrochloride polymorphs. AAPS PharmSciTech 2013, 14, 1169–1177. [Google Scholar] [CrossRef] [PubMed]
  37. Tomas, J. Product design of cohesive powders - Mechanical properties, compression and flow behavior. Chem. Eng. Technol. 2004, 27, 605–618. [Google Scholar] [CrossRef]
  38. McCabe, W.L.; Smith, J.; Harriot, P. Unit Operations of Chemical Engineering, 5th ed.; McGraw-Hill, Inc.: Singapore, 1993; Volume 7, ISBN 0070448442. [Google Scholar]
  39. Millán, J.M.V. Fluidization of Fine Powders; Particle Technology Series; Springer: Dordrecht, The Netherlands, 2013; Volume 18, ISBN 978-94-007-5586-4. [Google Scholar]
  40. Quintanilla, M.A.S.; Valverde, J.M.; Castellanos, A. The transitional behaviour of avalanches in cohesive granular materials. J. Stat. Mech. Theory Exp. 2006, P07015. [Google Scholar] [CrossRef]
Figure 1. Compression function of a cohesive powder.
Processes 07 00439 g001
Figure 2. Cumulative size distribution functions of the used fine and ultra-fine particulate materials (measured by Malvern Mastersizer 2000).
Processes 07 00439 g002
Figure 3. Working principle for each experiment, involving three steps (Fluidization, Compression, and Re-fluidization).
Processes 07 00439 g003
Figure 4. Specific particle volume fraction ( 1 / φ ) as a function of dimensionless applied consolidation stress.
Processes 07 00439 g004
Figure 5. Particle volume fraction as a function of dimensionless applied consolidation stress.
Processes 07 00439 g005
Figure 6. Fluidization and re-fluidization behaviors (after compression at 40 kPa, intermediate pressure) for ultra-fine powder (CALCIT MX 10).
Processes 07 00439 g006
Figure 7. Fluidization and re-fluidization behaviors (after compression at 40 kPa, intermediate pressure) for fine powder (CALCIT MVT 100).
Processes 07 00439 g007
Figure 8. Fluidization and re-fluidization behaviors (after compression at 40 kPa) for a mixture of 30% of ultra-fine + 70% of fine particles.
Processes 07 00439 g008
Figure 9. Fluidization and re-fluidization behaviors (after compression at 40 kPa) for a mixture of 50% of ultra-fine + 50% of fine particles.
Processes 07 00439 g009
Figure 10. Fluidization and re-fluidization behaviors (after compression at 40 kPa) for a mixture of 68% of ultra-fine + 32% of fine particles.
Processes 07 00439 g010
Figure 11. Normalized value of Δ P p e a k (using the value of Δ P p e a k of ultra-fine particles for each pressure level) for fluidization, compression, and re-fluidization (FCR) tests at 20, 40, and 80 kPa compression pressure.
Processes 07 00439 g011
Table 1. Classification of the particulate materials based on their compressibility indices [1].
Index nEvaluationExamplesFlowability
0–0.01IncompressibleGravelFree flowing
0.01–0.05Low compressibilityFine sandFree flowing
0.05–0.1CompressibleDry powder (Calcite)Cohesive
0.1–1Very compressibleMoist powderVery cohesive
Table 2. Properties of the fine and ultra-fine particulate materials used in this study [15].
Particulate Material d 50 , 3   × 10 6
( m )
d S T   × 10 6
( m )
ρ b
( k g / m 3 )
ρ p
( k g / m 3 )
f f c
CALCIT MVT 10073381241270011
CALCIT MX 101.81.2375627001.37
Table 3. Applied air pressures (kPa) at each sub-step of compression tests.
Sub-Step 1Sub-Step 2Sub-Step 3Sub-Step 4
Level 1 (Low)5101520
Level 2 (Intermediate)10203040
Level 3 (High)20406080
Table 4. Compressibility index and calculated jammed particle volume fraction of different mixtures during various sets of applied pressures.
Material NamePressure Leveln φ J
CALCIT MVT 100
(100% fine)
Low0.0390.403
Intermediate0.0370.403
High0.0300.408
70–30%
(fine–ultra-fine)
Low0.0500.346
Intermediate0.0480.347
High0.0410.350
50–50%
(fine–ultra-fine)
Low0.0620.313
Intermediate0.0600.314
High0.0480.318
32–68%
(fine–ultrafine)
Low0.0900.256
Intermediate0.0850.256
High0.0710.260
CALCIT MX 10
(100% ultra-fine)
Low0.1100.231
Intermediate0.1040.232
High0.0880.235
Table 5. Jammed particle volume fraction of different mixtures for different pressure levels.
Material NamePressure Level φ J
CALCIT MVT 100
(100% fine)
Low 0.403
Intermediate0.403
High0.408
70–30%
(fine–ultra-fine)
Low 0.346
Intermediate0.347
High0.350
50–50%
(fine–ultra-fine)
Low 0.313
Intermediate0.314
High0.318
32–68%
(fine–ultra-fine)
Low 0.256
Intermediate0.256
High0.260
CALCIT MX 10
(100% ultra-fine)
Low 0.231
Intermediate0.232
High0.235
Table 6. Differences between peaks of bed pressure drop ( Δ P p e a k ) in fluidization and re-fluidization after compression, in mbar (Mean ± Standard deviation).
FCR TestMVT 100MX 10
Applied pressure (kPa) Δ P p e a k (mbar)
200.01 ± 0.0060.27 ± 0.025
400.02 ± 0.0060.43 ± 0.035
800.04 ± 0.0060.69 ± 0.035
Table 7. Differences between peaks of bed pressure drop ( Δ P p e a k ) in initial fluidization and re-fluidization after compression, in mbar (Mean ± Standard deviation).
Mixture Ratio (% of Fine–% of Ultra-Fine)
Applied pressure during compression (kPa)70–3050–5032–68
Δ P p e a k   ( mbar )
20 0.03 ± 0.010.06 ± 0.010.18 ± 0.015
40 0.06 ± 0.0120.12 ± 0.0120.30 ± 0.015
80 0.11 ± 0.0120.21 ± 0.0150.49 ± 0.025
Table 8. Value and corresponding superficial gas velocity of the peak of bed pressure drop (FCR test results) for the applied pressure of 40 kPa during compression.
MVT 10030–7050–5068–32MX 10
FCR-Fluidization6.01 mbar
at 0.0467 m/s
6.09 mbar
at 0.0509 m/s
6.82 mbar
at 0.0637 m/s
7.98 mbar
at 0.0722 m/s
8.47 mbar
at 0.0891 m/s
FCR-Refluidization6.03 mbar
at 0.0255 m/s
6.15 mbar
at 0.0297 m/s
6.94 mbar
at 0.0382 m/s
8.28 mbar
at 0.0594 m/s
8.90 mbar
at 0.0806 m/s
Table 9. Slope of Δ P b U s g curves for fluidization and re-fluidization and for different mixtures (mbar·s/m).
MVT 100 (100% Fine)Mixture Ratio (% of Fine–% of Ultra-Fine)MX 10 (100% Ultra-Fine)
70–3050–5032–68
Fluidization (FCR)Loading569173875549
Fluidization (FCR)Unloading36216283641
Re-fluidization (FCR)Loading5832591257873
Re-fluidization (FCR)Unloading35913222833

