Thermal Assessment of a Micro Fibrous Fischer Tropsch Fixed Bed Reactor Using Computational Fluid Dynamics

Abstract
:1. Introduction
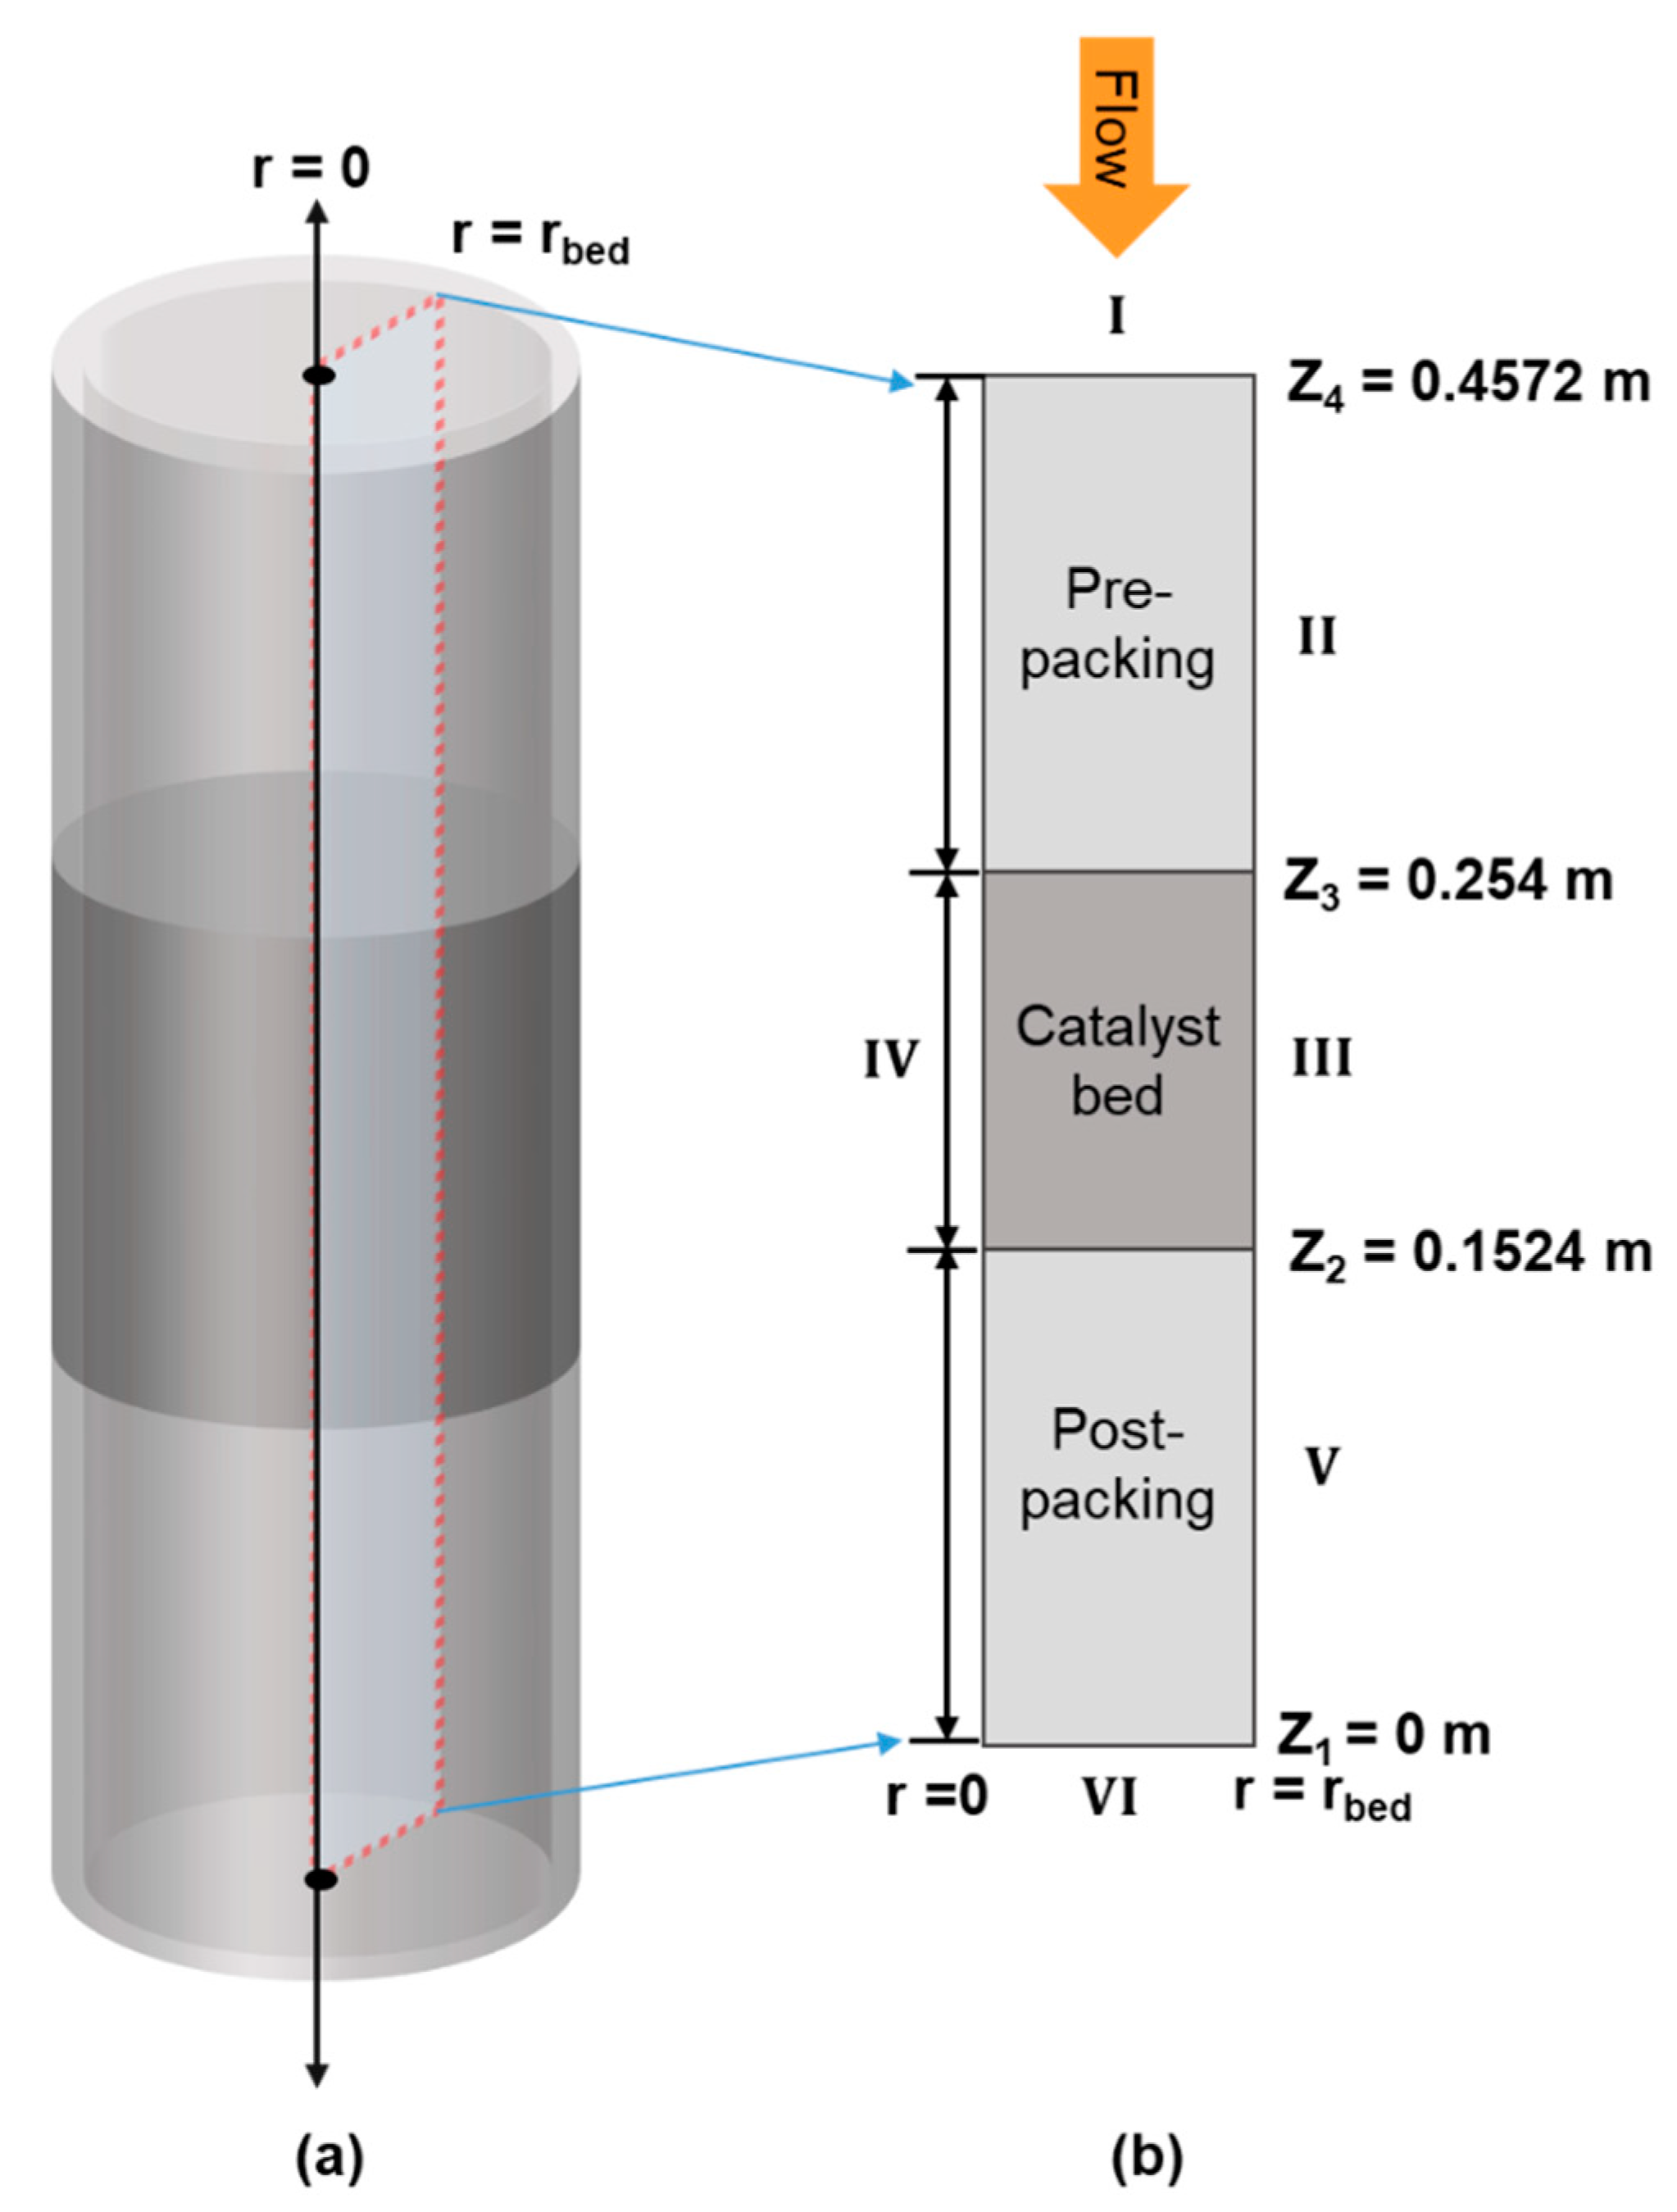
2. Materials and Methods
2.1. Momentum Transport Expressions
2.2. Mass Transport Expressions
2.3. Heat Transport Expressions
- (1)
- Radial Heat Transfer Coefficient at the Wall
- (2)
- Effective Radial Thermal Conductivity
2.4. Kinetics
3. Results
3.1. Comparison of Model Predictions with Experimental Data
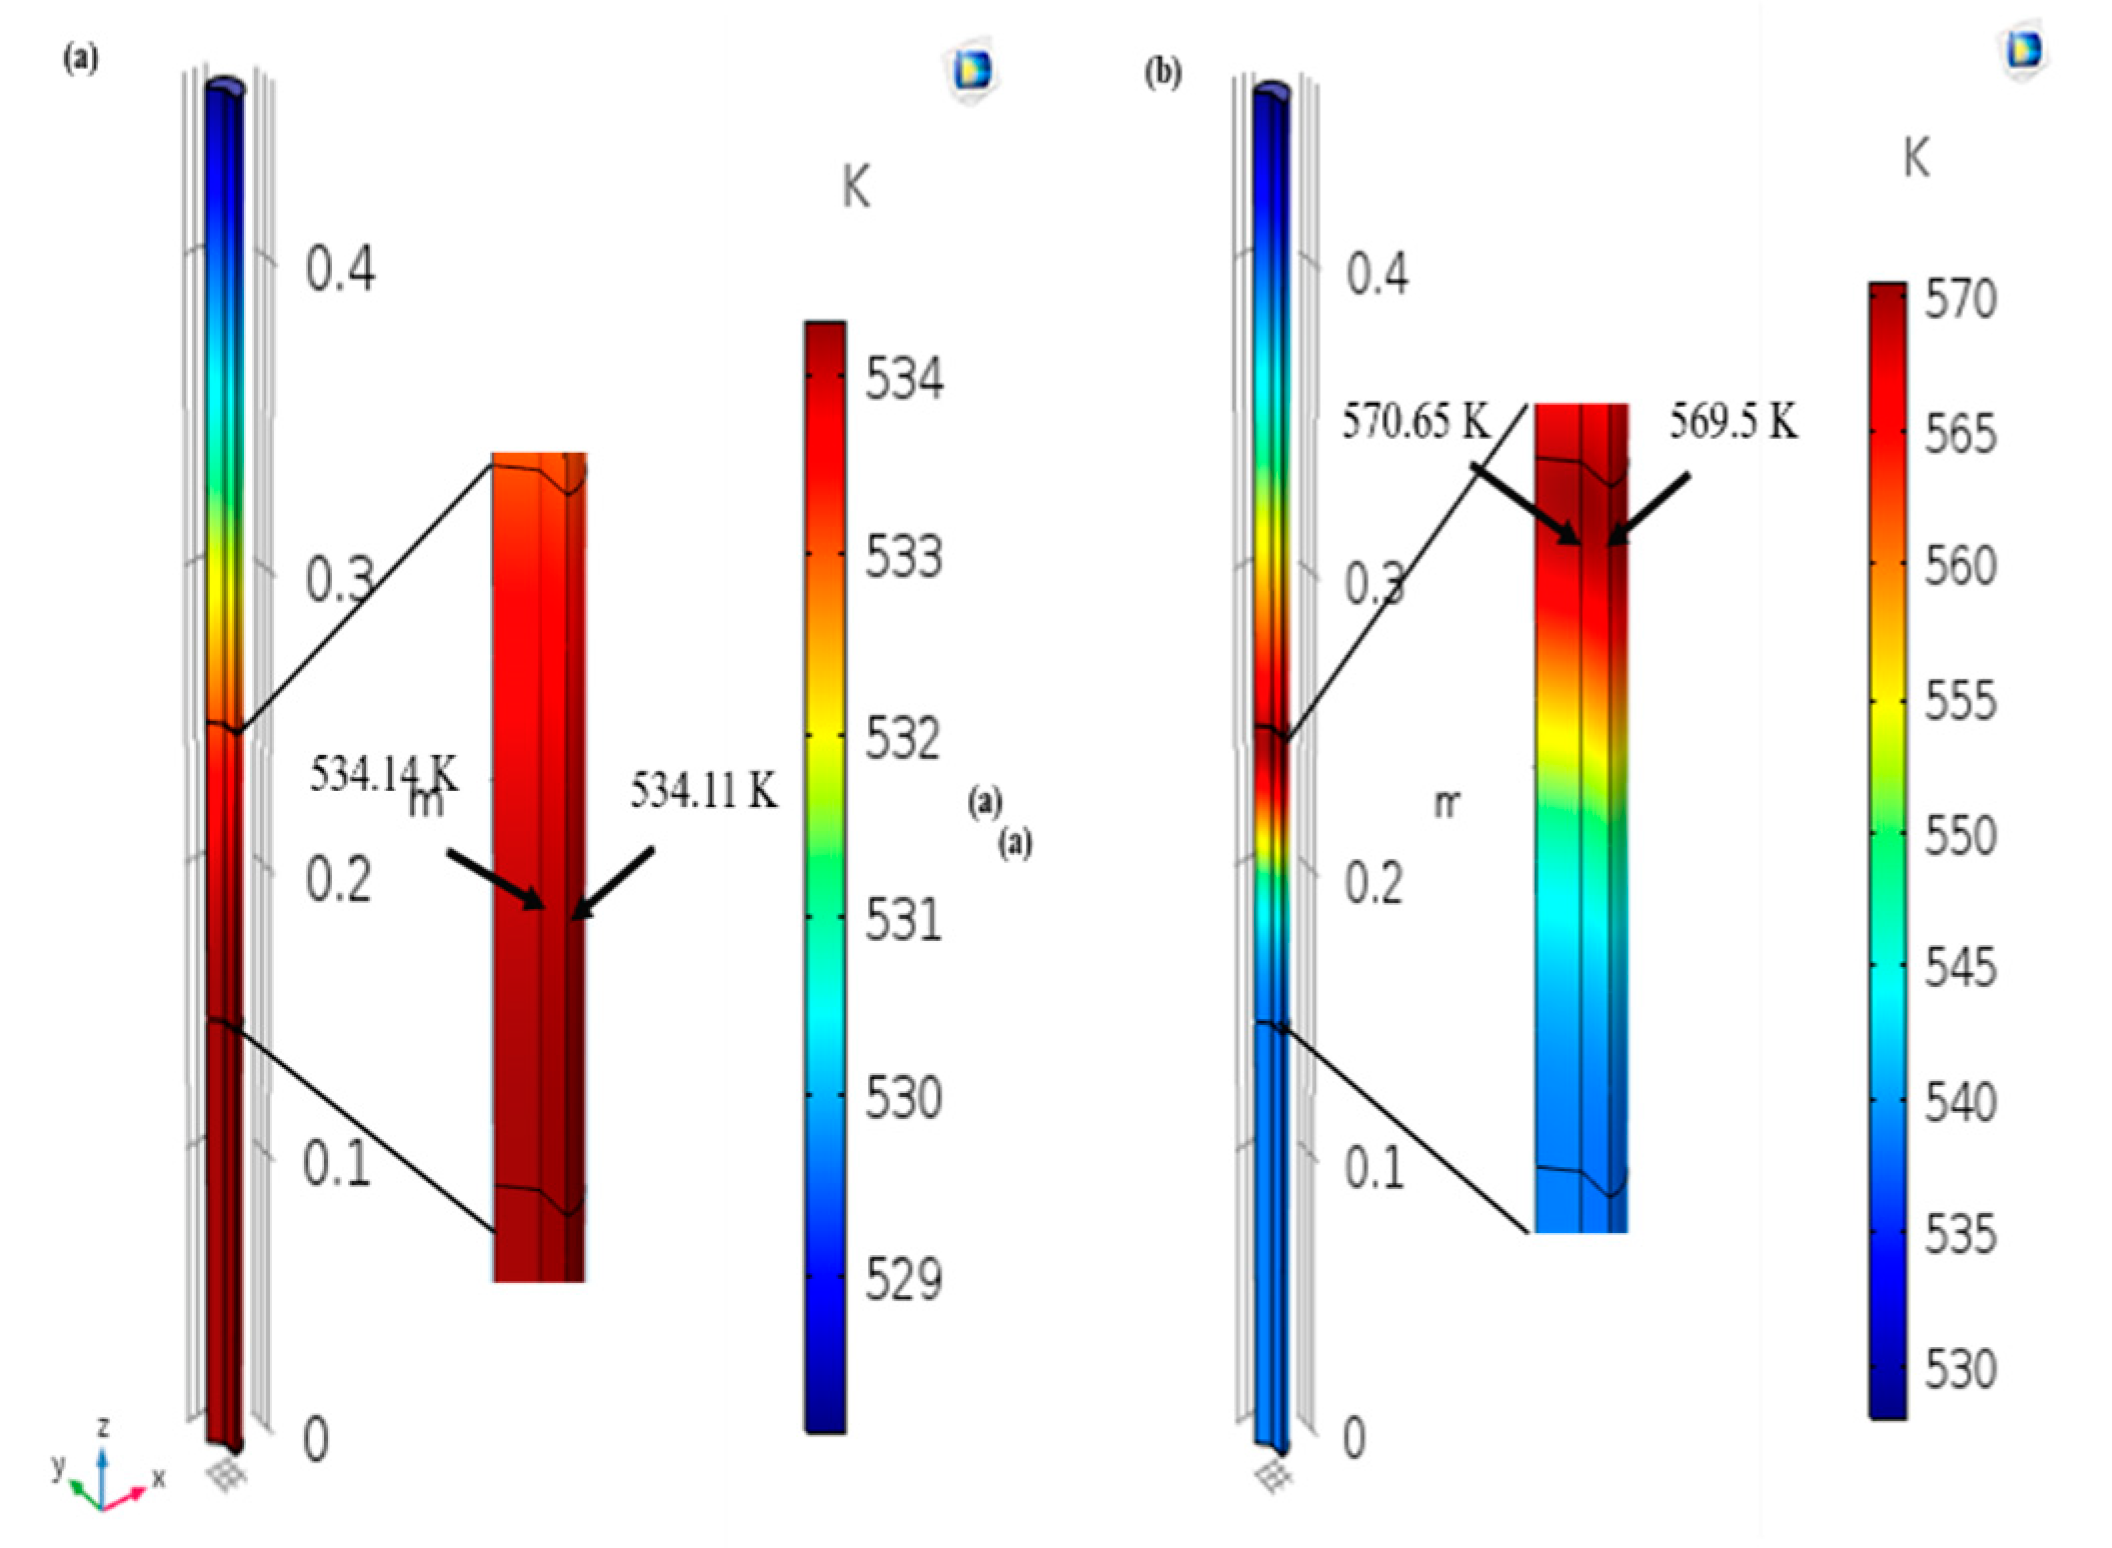
3.2. Comparison of Thermal Profiles
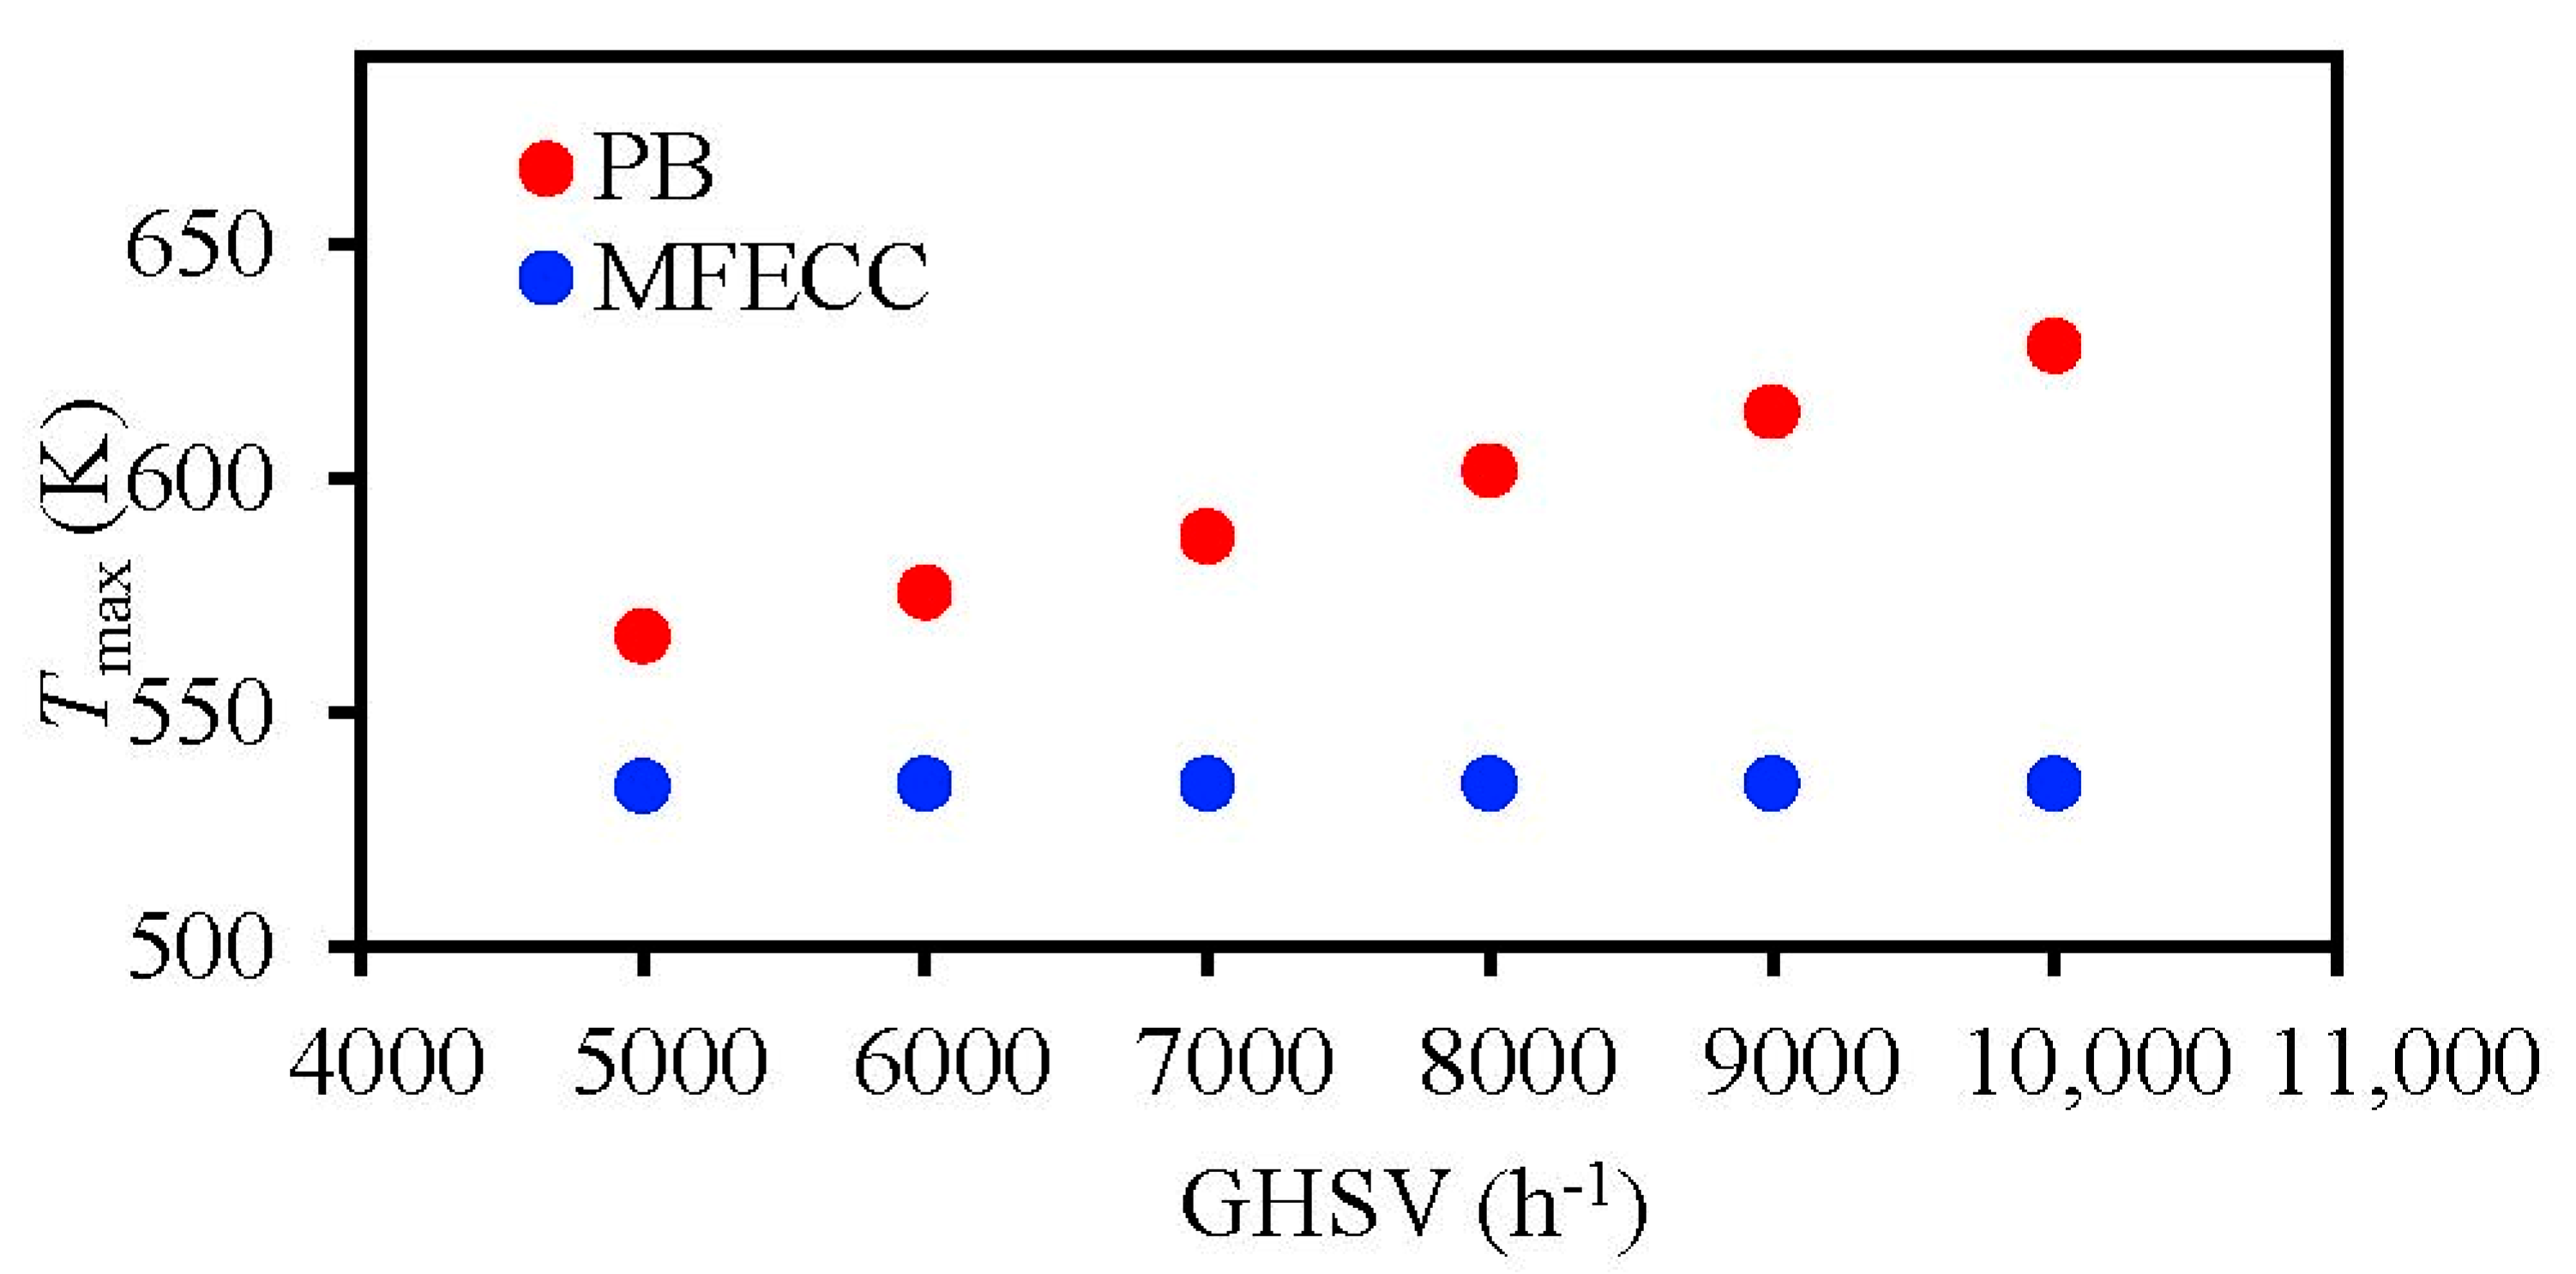
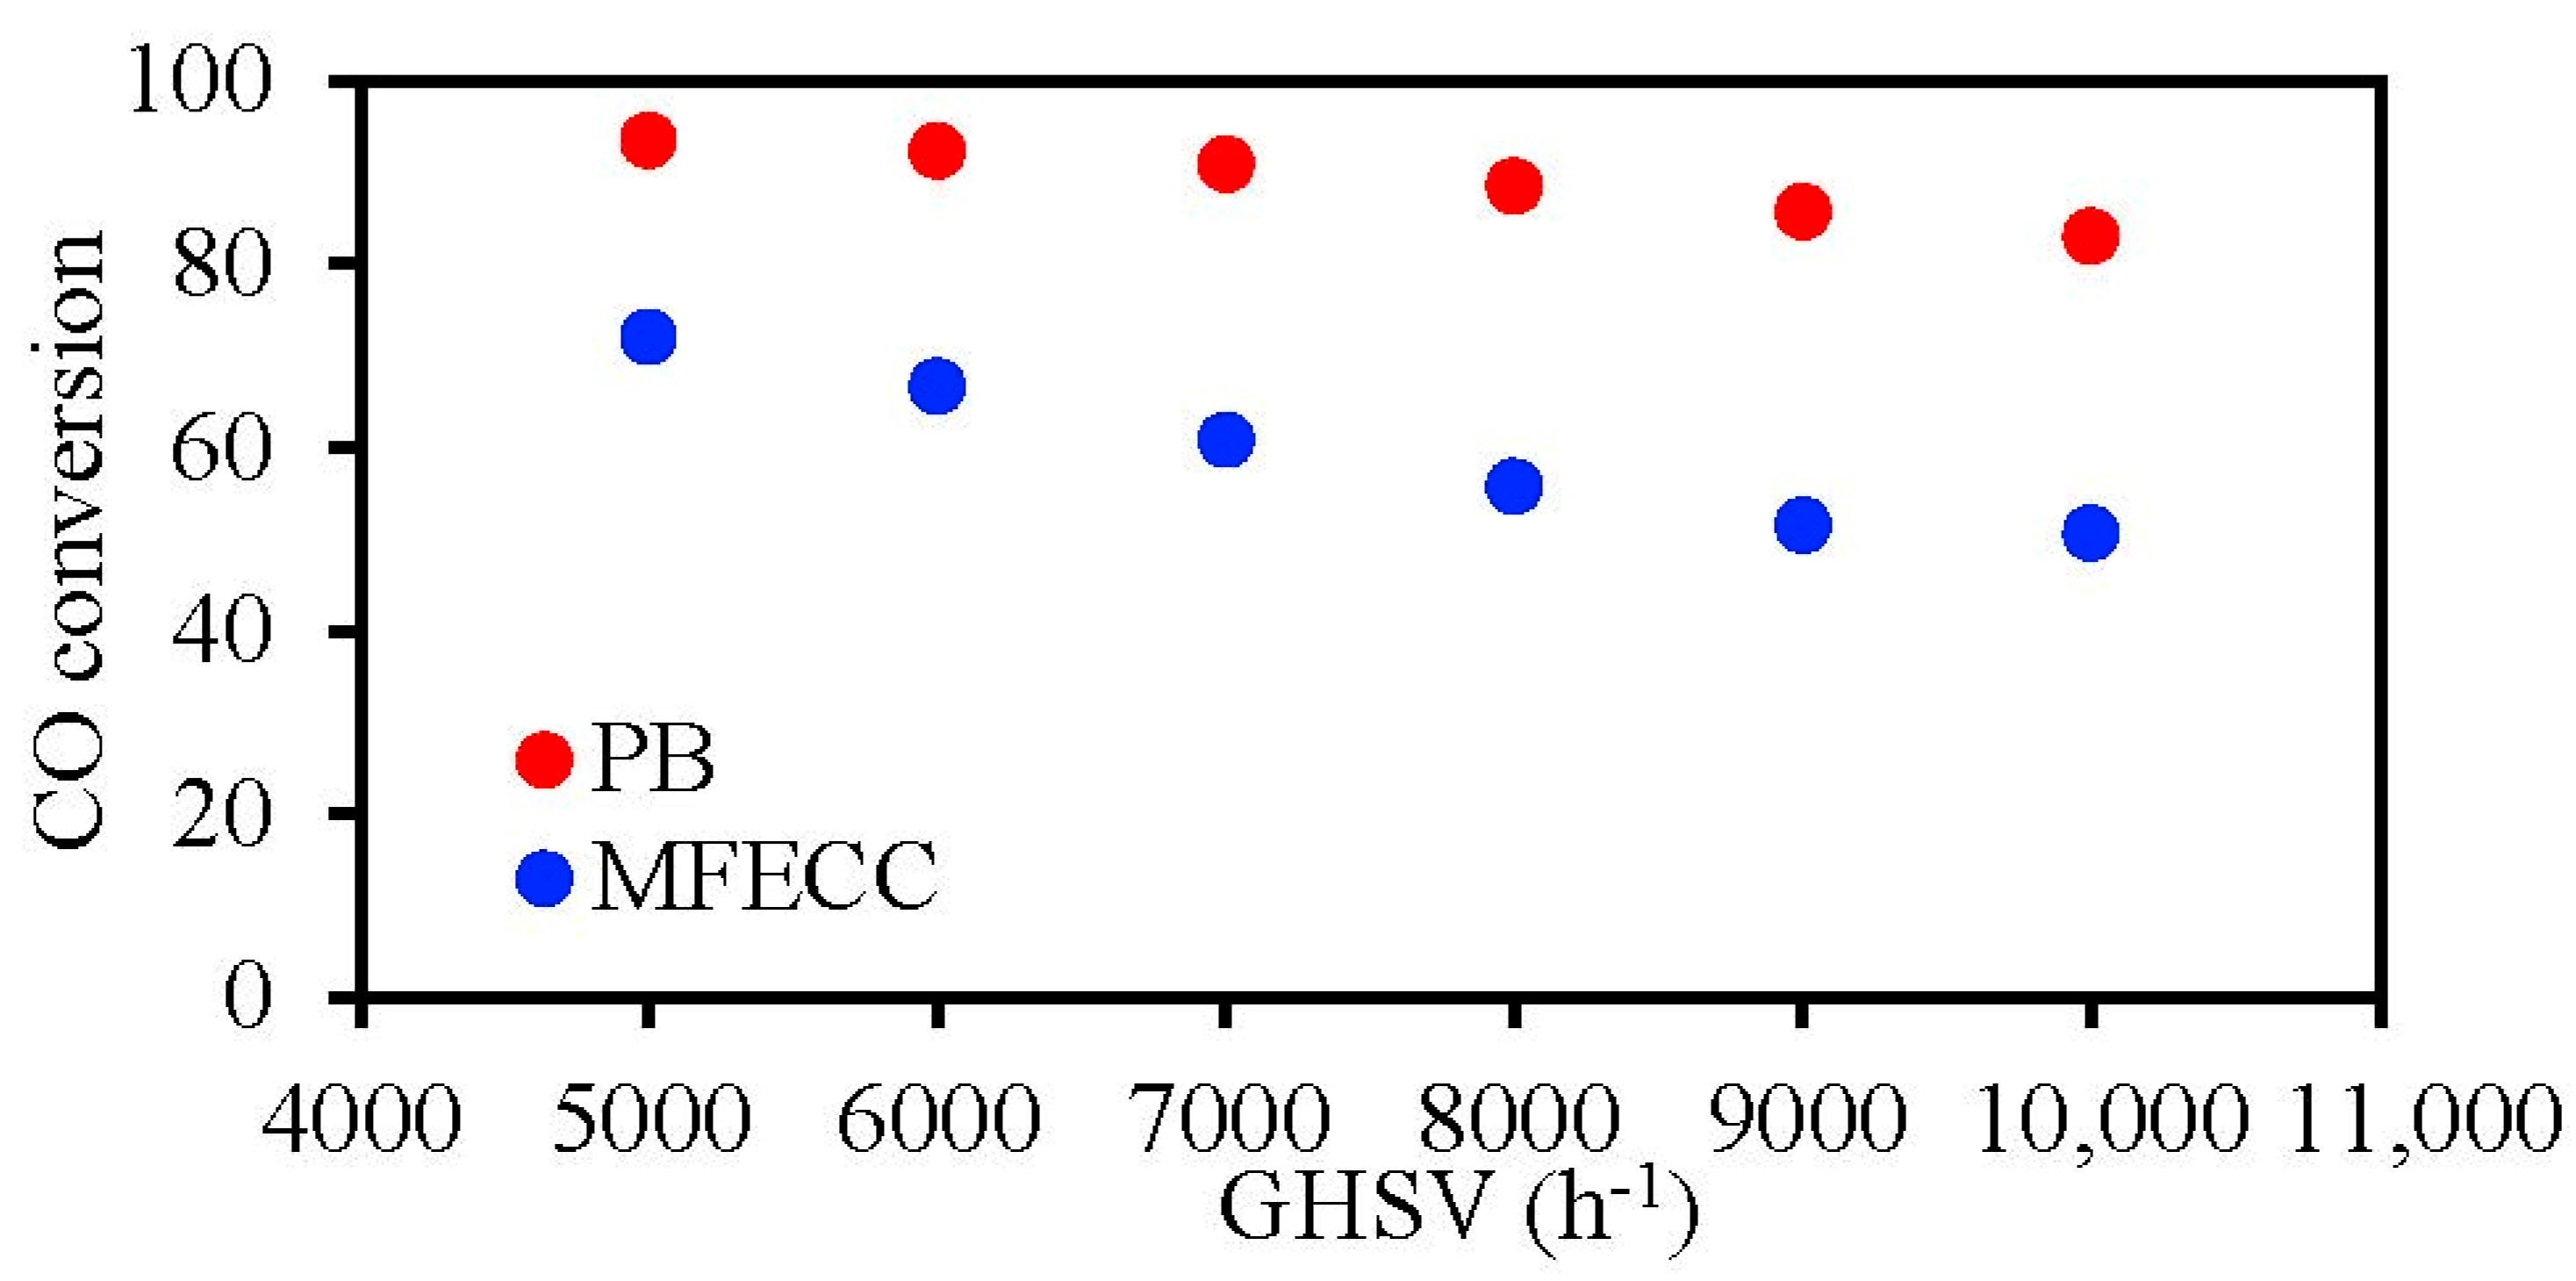
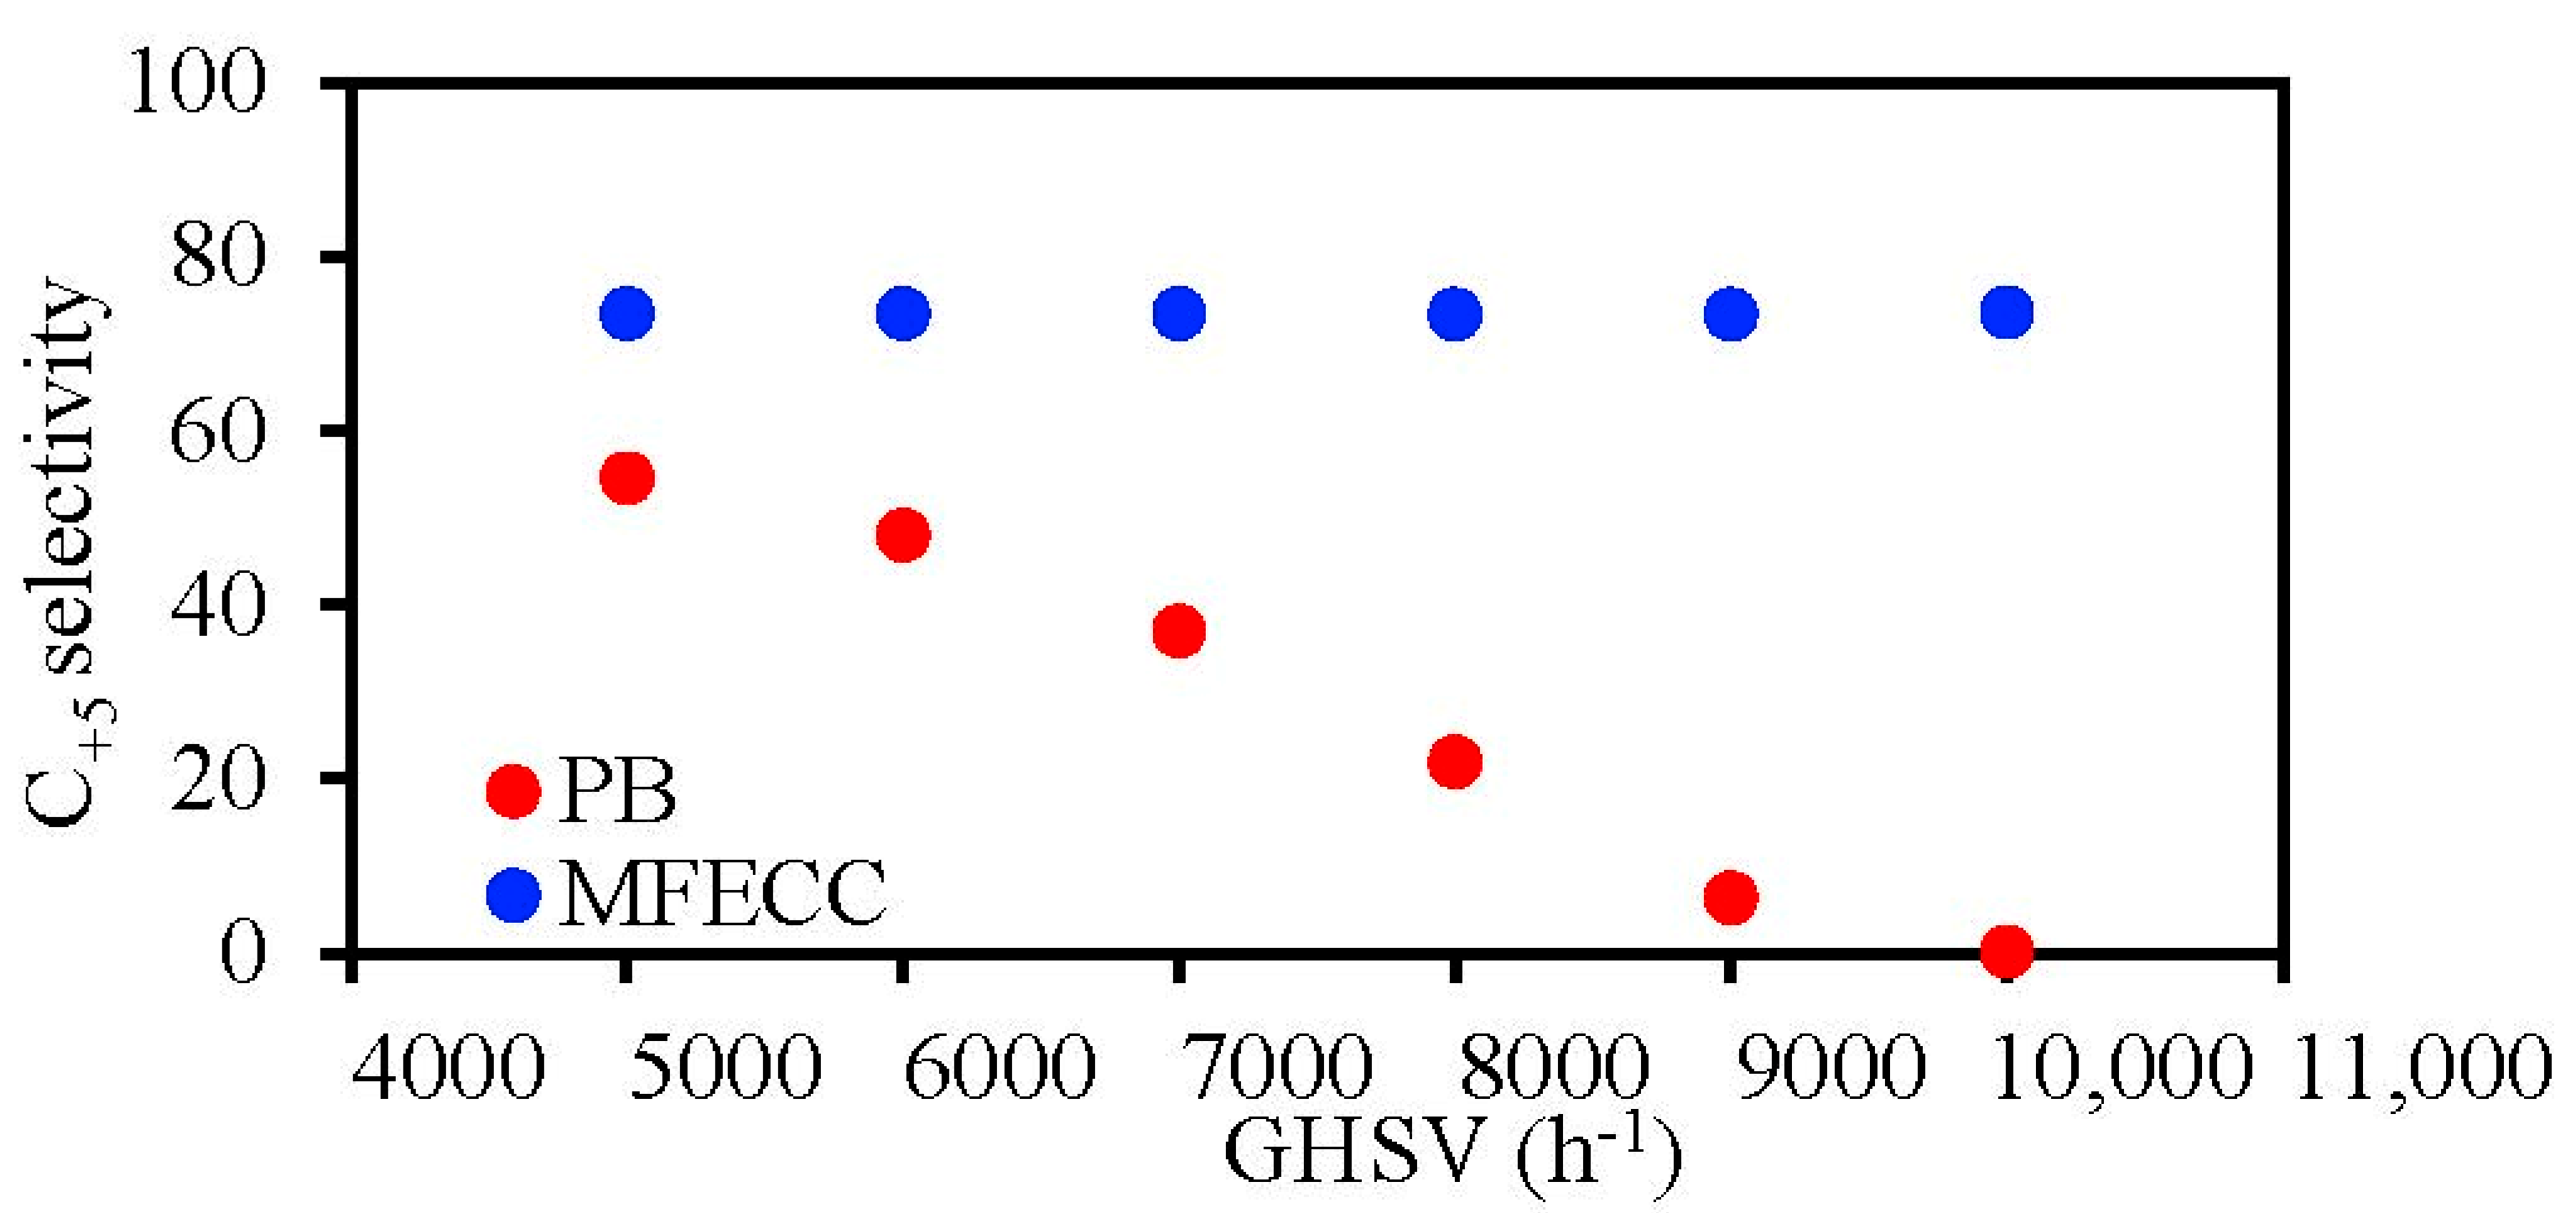
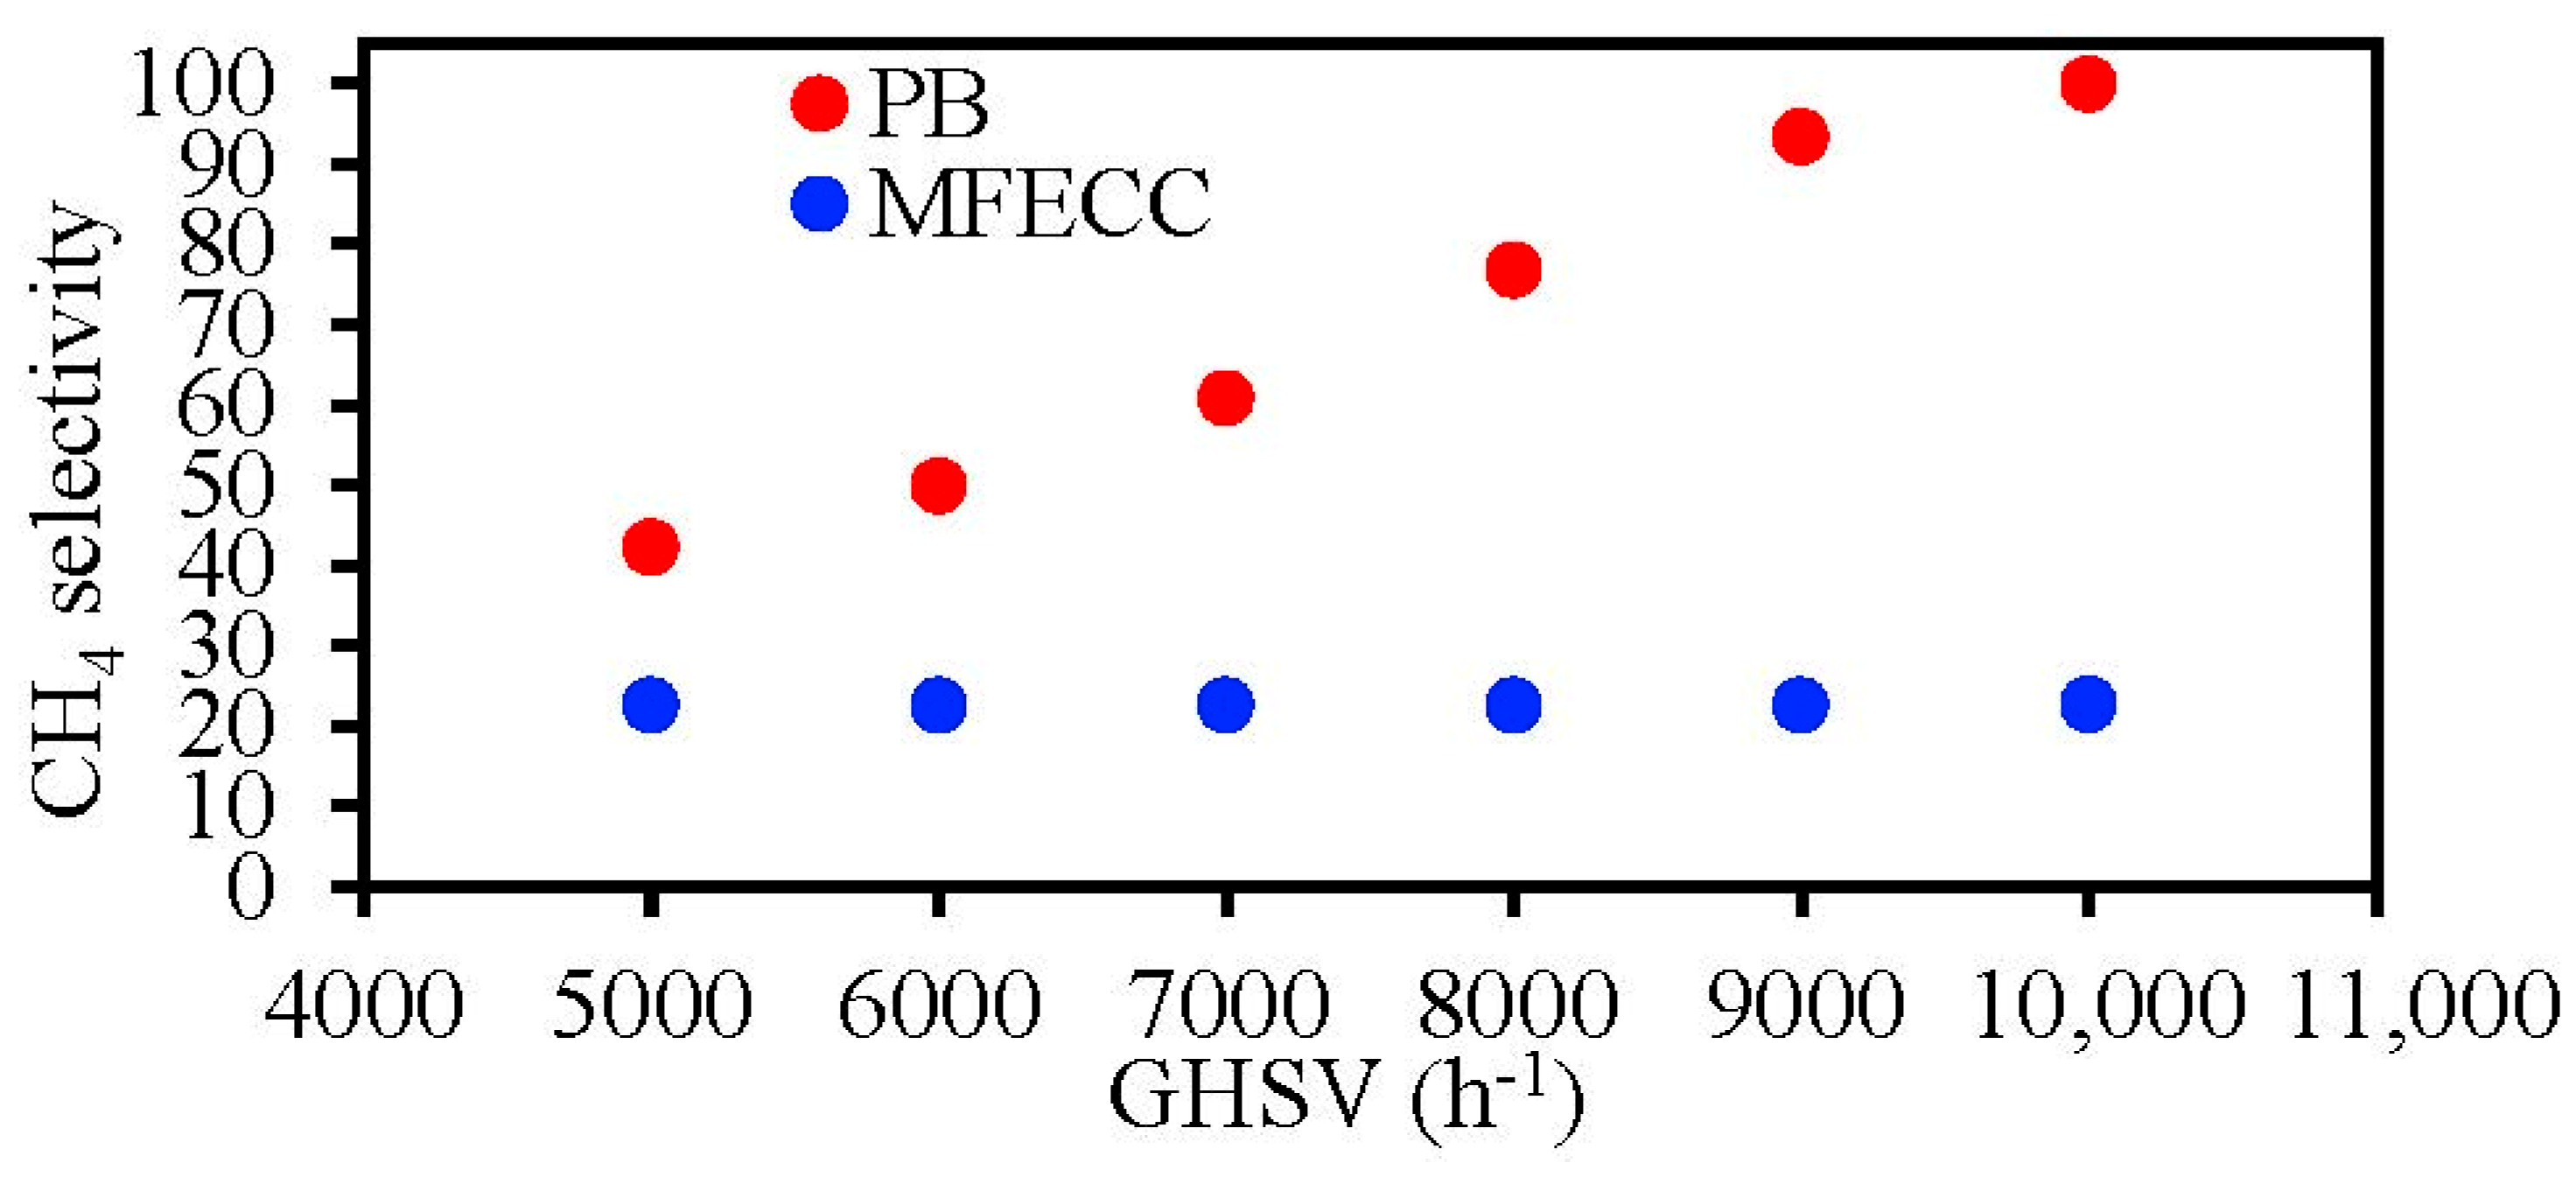
3.3. Effect of Varying the GHSV
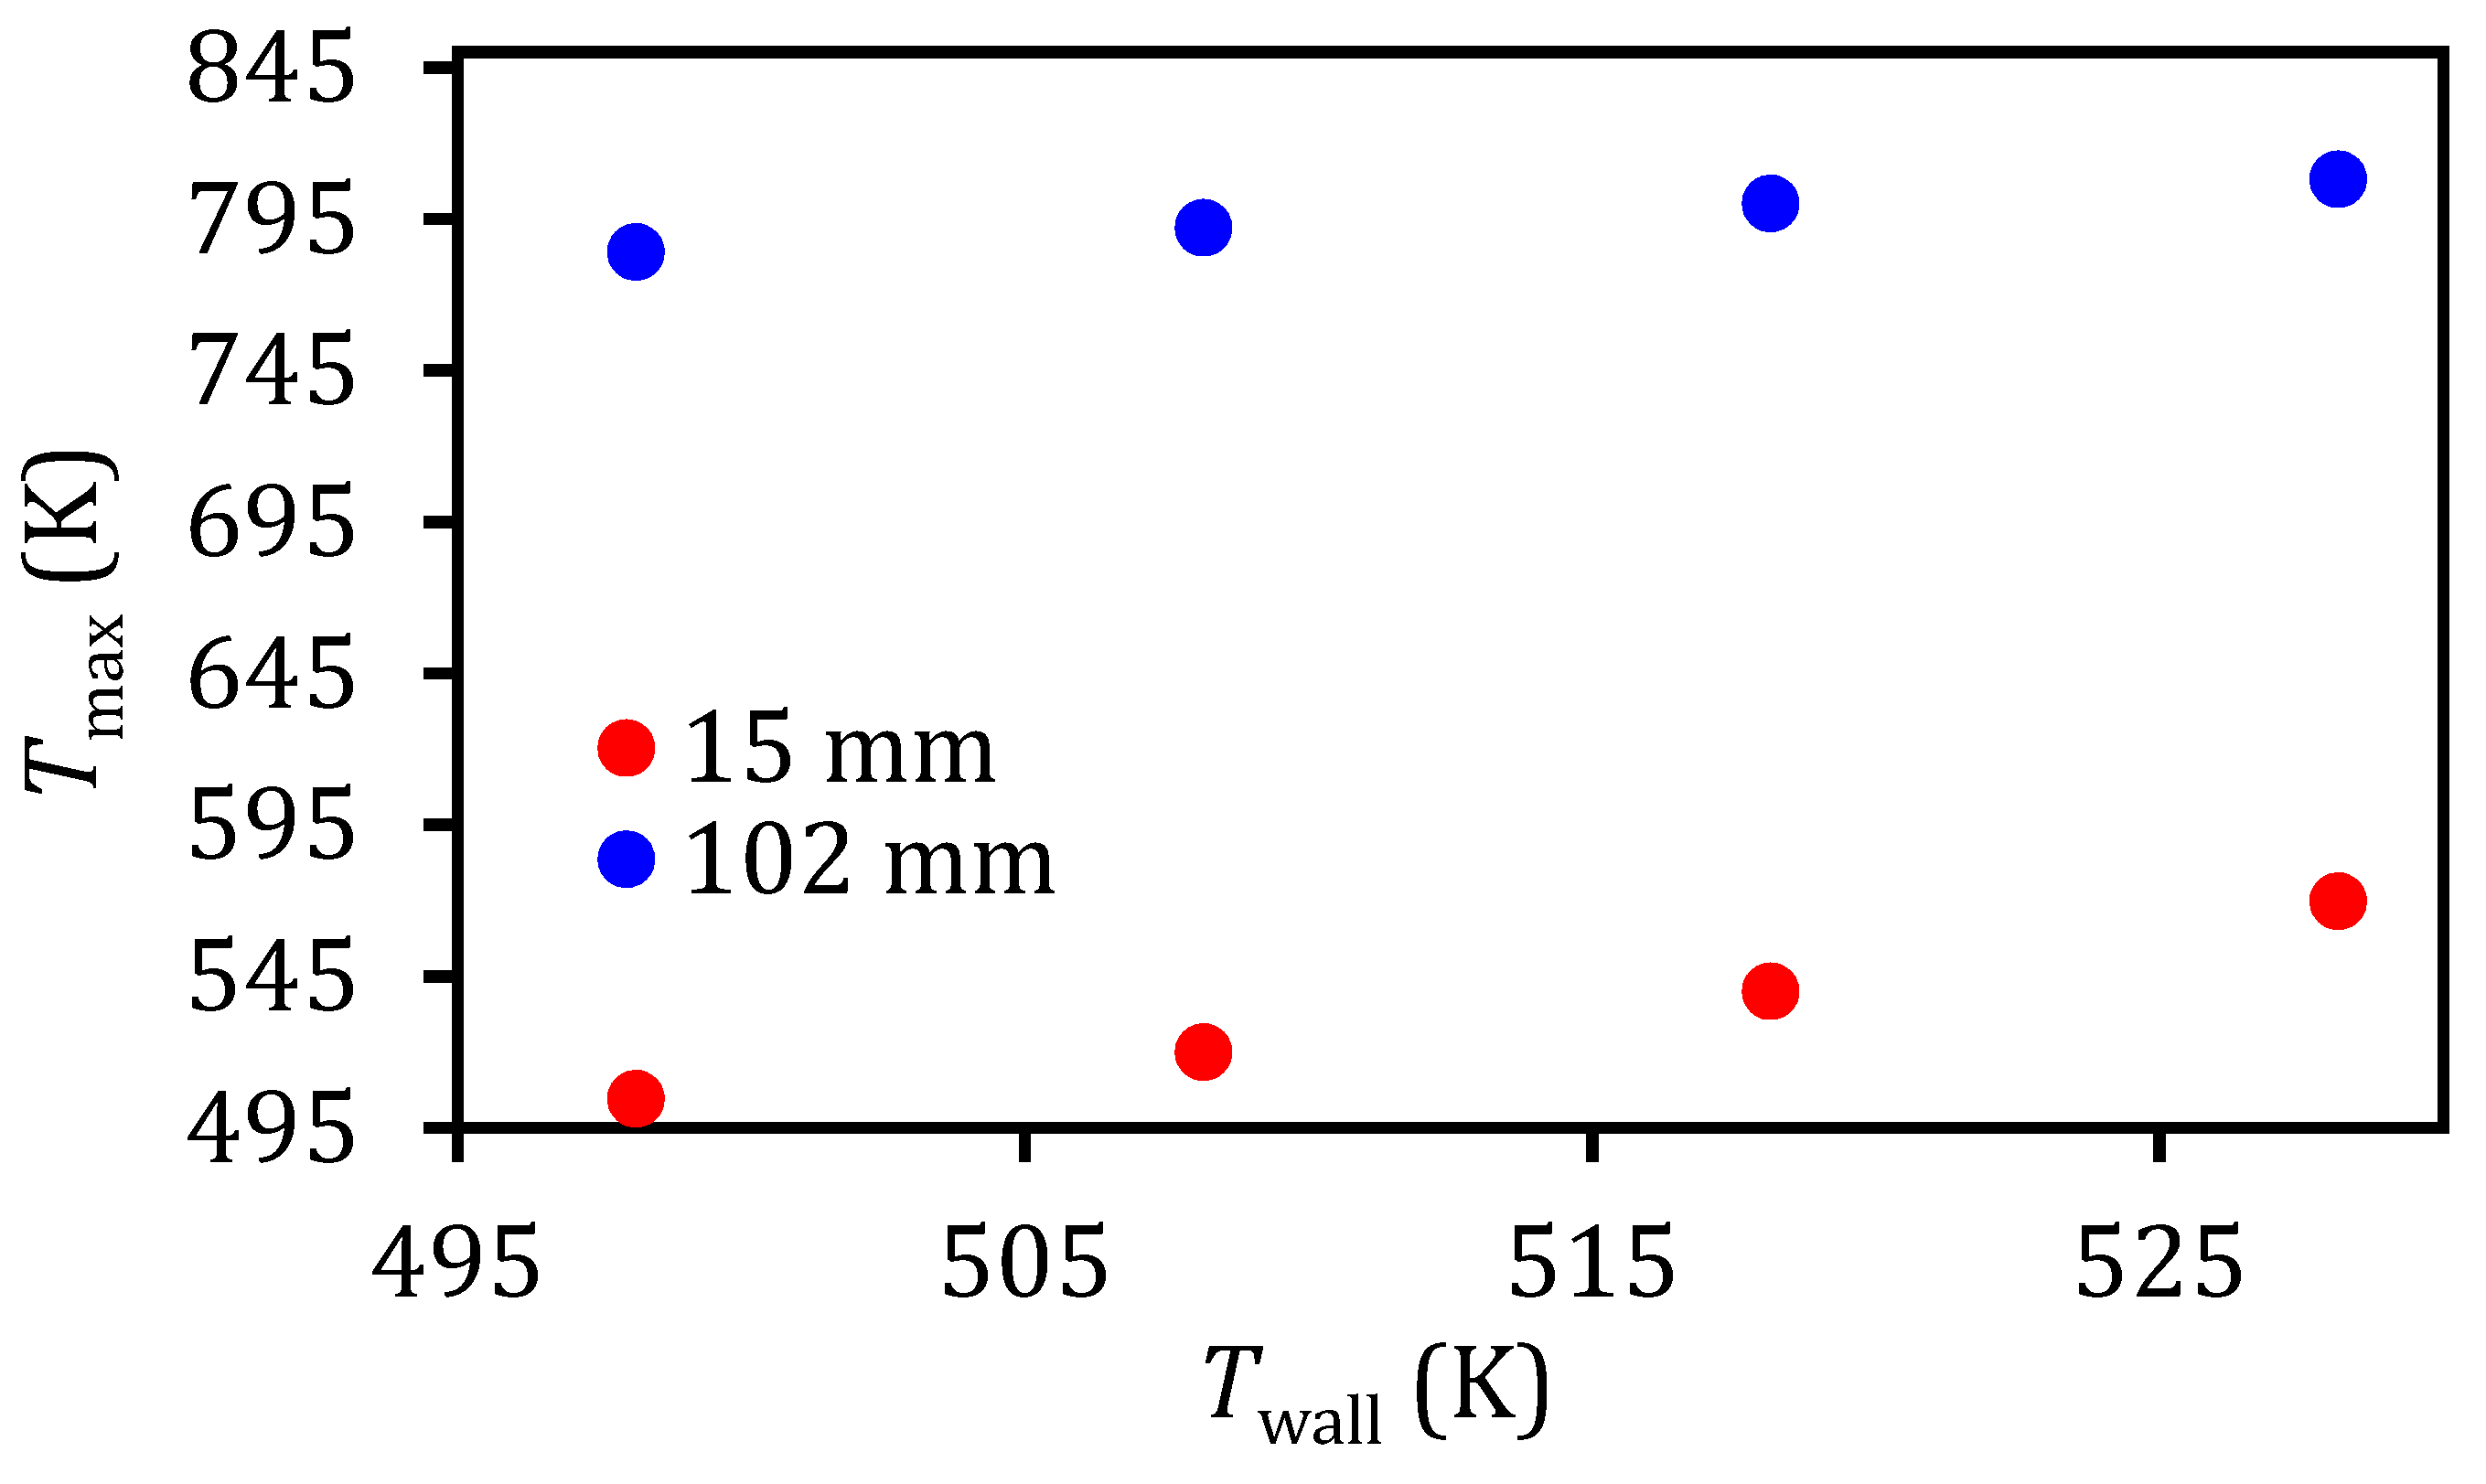
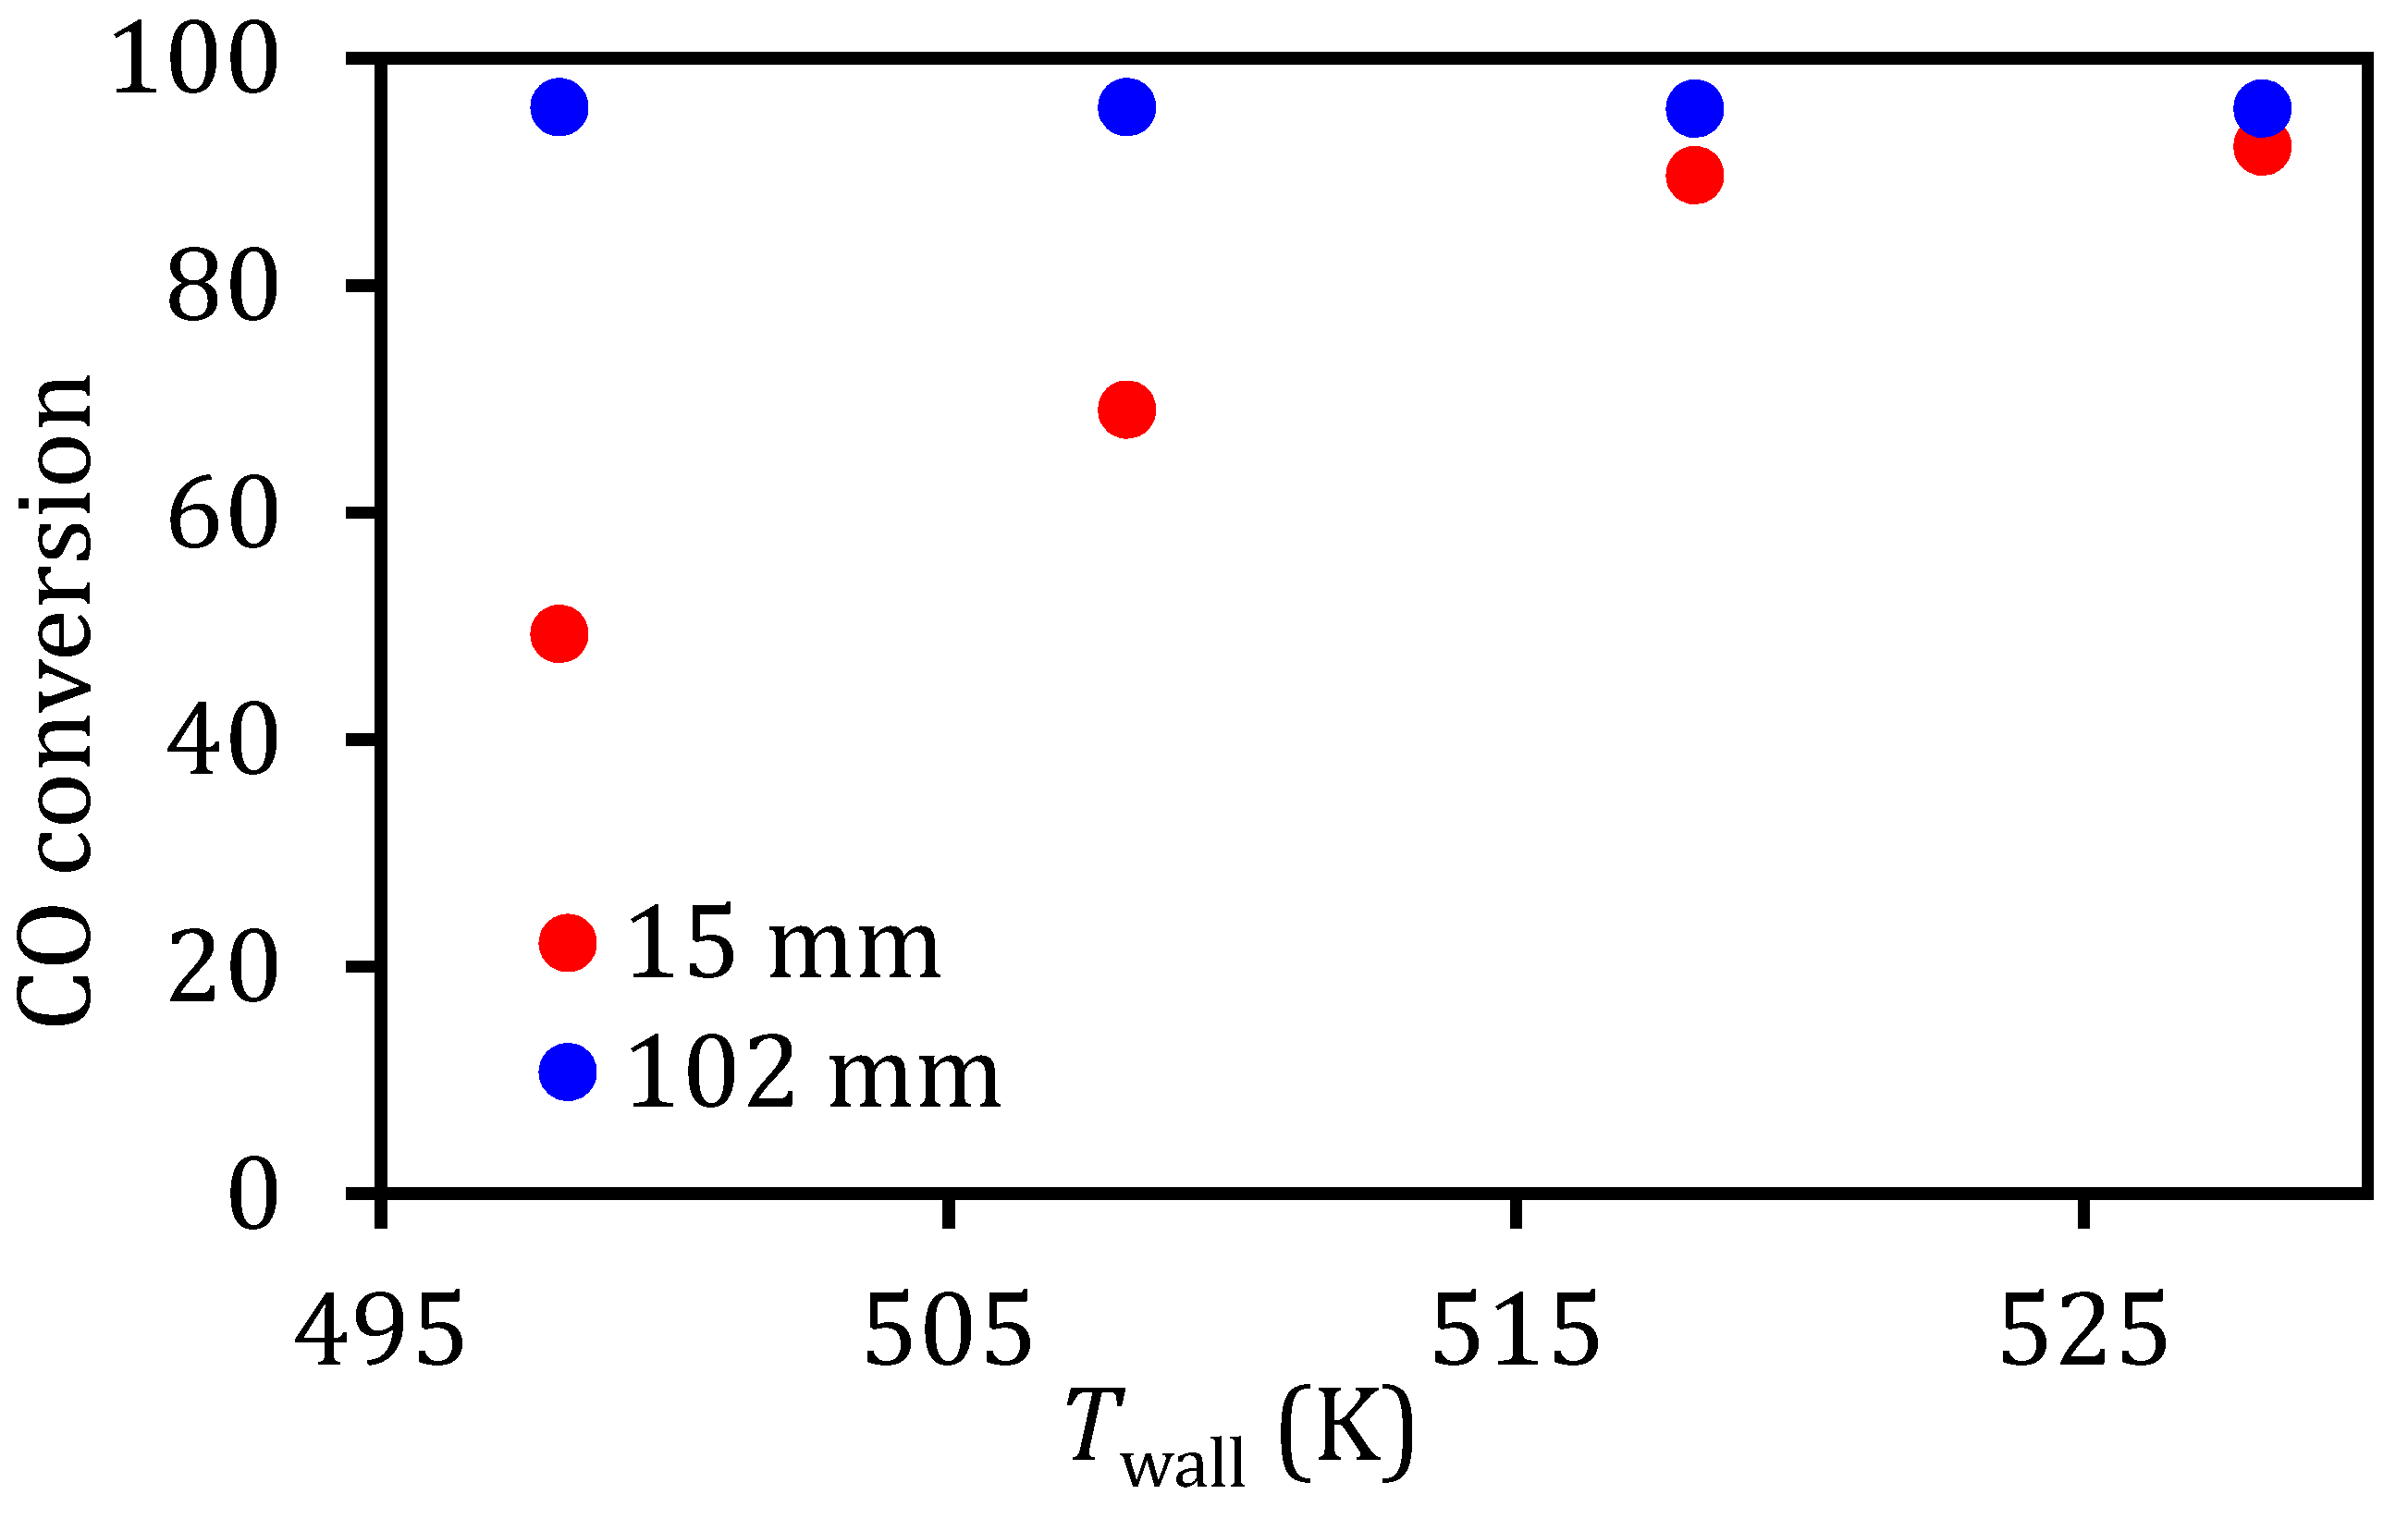
3.4. Effect of Reactor Tube Size (Scaling-Up)
4. Conclusions
Author Contributions
Funding
Acknowledgments
Conflicts of Interest
References
- Challiwala, M.; Ghouri, M.; Linke, P.; El-Halwagi, M.; Elbashir, N. A combined thermo-kinetic analysis of various methane reforming technologies: Comparison with dry reforming. J. CO2 Util. 2017, 17, 99111. [Google Scholar] [CrossRef]
- Alsuhaibani, A.S.; Afzal, S.; Challiwala, M.; Elbashir, N.O.; El-Halwagi, M.M. The impact of the development of catalyst and reaction system of the methanol synthesis stage on the overall profitability of the entire plant: A techno-economic study. Catal. Today 2019. [Google Scholar] [CrossRef]
- Abusrafa, A.E.; Challiwala, M.S.; Choudhury, H.A.; Wilhite, B.A.; Elbashir, N.O. Experimental verification of 2-Dimensional computational fluid dynamics modeling of supercritical fluids Fischer Tropsch reactor bed. Catal. Today 2020, 343, 165–175. [Google Scholar] [CrossRef]
- Elbashir, N.O.; Chatla, A.; Spivey, J.J.; Lemonidou, A. Reaction Engineering and Catalysis Issue in Honor of Professor Dragomir Bukur: Introduction and Review. Aristotle Univ. Thessalon. 2020, 343, 1–7. [Google Scholar] [CrossRef]
- Challiwala, M.S.; Wilhite, B.; Ghouri, M.M.; Elbashir, N. 2-D Modeling of Fischer Tropsch Packed Bed Reactor: First Step Towards Scale-Up; AIChE: Minneapolis, MN, USA, 2017. [Google Scholar]
- Alsuhaibani, A.S.; Afzal, S.; Challiwala, M.; Elbashir, N.O.; El-Halwagi, M.M. Process Systems Engineering and Catalysis: A Collaborative Approach for the Development of Chemical Processes. In Computer Aided Chemical Engineering; Muñoz, S.G., Laird, C.D., Realff, M.J., Eds.; Elsevier: Amsterdam, The Netherlands, 2019; pp. 409–414. [Google Scholar]
- Dry, M.E. Practical and theoretical aspects of the catalytic Fischer–Tropsch process. Appl. Catal. A Gen. 1996, 138, 319–344. [Google Scholar] [CrossRef]
- Park, N.; Kim, J.-R.; Yoo, Y.; Lee, J.; Park, M.-J. Modeling of a pilot-scale fixed-bed reactor for iron-based Fischer–Tropsch synthesis: Two-Dimensional approach for optimal tube diameter. Fuel 2014, 122, 229–235. [Google Scholar] [CrossRef]
- Challiwala, M.S.; Wilhite, B.A.; Ghouri, M.M.; Elbashir, N.O. Multidimensional modeling of a microfibrous entrapped cobalt catalyst Fischer–Tropsch reactor bed. AIChE J. 2017, 64, 1723–1731. [Google Scholar] [CrossRef]
- Elbashir, N.O.; Challiwala, M.S.; Sengupta, D.; El-Halwagi, M.M. System and Method for Carbon and Syngas Production, World Intellectual Property and Organization. Production, System and Method for Carbon and Syngas. WO Patent 2018187213A1, 11 October 2020. [Google Scholar]
- Elbashir, N.; Challiwala, M.S.; Ghouri, M.M.; Linke, P.; El-Halwagi, M. Modeling Development of a Combined Methane Fixed Bed Reactor Reformer; Hamad bin Khalifa University Press (HBKU Press): Doha, Qatar, 2016; p. EESP2384. [Google Scholar]
- Chatla, A.; Ghouri, M.M.; el Hassan, O.W.; Mohamed, N.; Prakash, A.V.; Elbashir, N.O. An experimental and first principles DFT investigation on the effect of Cu addition to Ni/Al2O3 catalyst for the dry reforming of methane. Appl. Catal. A Gen. 2020, 602, 117699. [Google Scholar] [CrossRef]
- Challiwala, M.S.; Sengupta, D.; El-Halwagi, M.; Elbashir, N. A Process Integration Approach for a Sustainable Gtl Process Using Tri-Reforming of Methane; AIChE: Minneapolis, MN, USA, 2017. [Google Scholar]
- Challiwala, M.S.; Ghouri, M.M.; Linke, P.; Elbashir, N.O. Kinetic and thermodynamic modelling of methane reforming technologies: Comparison of conventional technologies with dry reforming. In Proceedings of the Conference: Qatar Foundation Annual Research Conference (ARC), Doha, Qatar, 8–13 November 2015. [Google Scholar]
- Challiwala, M.S.; Afzal, S.; Choudhury, H.A.; Sengupa, D.; El-Halwagi, M.M.; Elbashir, N.O. Alternative via Pathways Dry Reforming for CO of 2 Utilization Methane. Adv. Carbon Manag. Technol. 2020, 1, 253. [Google Scholar]
- Omran, A.; Yoon, S.H.; Khan, M.; Ghouri, M.; Chatla, A.; Elbashir, N. Mechanistic Insights for Dry Reforming of Methane on Cu/Ni Bimetallic Catalysts: DFT-Assisted Microkinetic Analysis for Coke Resistance. Catalysts 2020, 10, 1043. [Google Scholar] [CrossRef]
- Dry, M.E. The fischer-tropsch process: 1950–2000. Catal. Today 2002, 71, 227–241. [Google Scholar] [CrossRef]
- Filip, L.; Zámostný, P.; Rauch, R. Mathematical model of Fischer-Tropsch synthesis using variable alpha-Parameter to predict product distribution. Fuel 2019, 243, 603–609. [Google Scholar] [CrossRef]
- Espinoza, R.; Steynberg, A.; Jager, B.; Vosloo, A. Low temperature Fischer-Tropsch synthesis from a Sasol perspective. Appl. Catal. A Gen. 1999, 186, 13–26. [Google Scholar] [CrossRef]
- Wender, I. Reactions of synthesis gas. Fuel Process. Technol. 1996, 48, 189–297. [Google Scholar] [CrossRef]
- Todic, B.; Mandic, M.; Nikacevic, N.; Bukur, D.B. Effects of process and design parameters on heat management in fixed bed Fischer-Tropsch synthesis reactor. Korean J. Chem. Eng. 2018, 35, 875–889. [Google Scholar] [CrossRef]
- Steynberg, A.; Espinoza, R.; Jager, B.; Vosloo, A. High temperature Fischer–Tropsch synthesis in commercial practice. Appl. Catal. A Gen. 1999, 186, 41–54. [Google Scholar] [CrossRef]
- Yang, J.H.; Kim, H.-J.; Chun, D.H.; Lee, H.-T.; Hong, J.-C.; Jung, H.; Yang, J.-I. Mass transfer limitations on fixed—Bed reactor for Fischer-Tropsch synthesis. Fuel Process. Technol. 2010, 91, 285–289. [Google Scholar] [CrossRef]
- Fratalocchi, L.; Visconti, C.G.; Groppi, G.; Lietti, L.; Tronconi, E. Intensifying heat transfer in Fischer-Tropsch tubular reactors through the adoption of conductive packed foams. Chem. Eng. J. 2018, 349, 829–837. [Google Scholar] [CrossRef]
- Mandić, M.; Todić, B.; Živanić, L.; Nikačević, N.; Bukur, D.B. Effects of Catalyst Activity, Particle Size and Shape, and Process Conditions on Catalyst Effectiveness and Methane Selectivity for Fischer-Tropsch Reaction: A Modeling Study. Ind. Eng. Chem. Res. 2017, 56, 2733–2745. [Google Scholar] [CrossRef]
- Sie, S.; Krishna, R. Fundamentals and selection of advanced Fischer–Tropsch reactors. Appl. Catal. A Gen. 1999, 186, 55–70. [Google Scholar] [CrossRef]
- Botes, F.; Niemantsverdriet, J.; Van De Loosdrecht, J. A comparison of cobalt and iron based slurry phase Fischer–Tropsch synthesis. Catal. Today 2013, 215, 112–120. [Google Scholar] [CrossRef]
- Lu, X. Fischer-Tropsch Synthesis: Towards Understanding. 2011. Available online: http://hdl.handle.net/10539/11175 (accessed on 27 September 2020).
- Sheng, M.; Yang, H.; Cahela, D.R.; Tatarchuk, B. Novel catalyst structures with enhanced heat transfer characteristics. J. Catal. 2011, 281, 254–262. [Google Scholar] [CrossRef]
- Sheng, M.; Yang, H.; Cahela, D.R.; Yantz, W.R., Jr.; Gonzalez, C.F.; Tatarchuk, B.J. High conductivity catalyst structures for applications in exothermic reactions. Appl. Catal. A Gen. 2012, 445, 143–152. [Google Scholar] [CrossRef]
- Sheng, M.; Cahela, D.R.; Yang, H.; Gonzalez, C.F.; Yantz, W.R.; Harris, D.K.; Tatarchuk, B. Effective thermal conductivity and junction factor for sintered microfibrous materials. Int. J. Heat Mass Transf. 2013, 56, 10–19. [Google Scholar] [CrossRef]
- Kalluri, R.R.; Cahela, D.R.; Tatarchuk, B. Microfibrous entrapped small particle adsorbents for high efficiency heterogeneous contacting. Sep. Purif. Technol. 2008, 62, 304–316. [Google Scholar] [CrossRef]
- Yang, H.; Cahela, D.R.; Tatarchuk, B. A study of kinetic effects due to using microfibrous entrapped zinc oxide sorbents for hydrogen sulfide removal. Chem. Eng. Sci. 2008, 63, 2707–2716. [Google Scholar] [CrossRef]
- Zhu, W.H.; Flanzer, M.E.; Tatarchuk, B. Nickel–zinc accordion-fold batteries with microfibrous electrodes using a papermaking process. J. Power Sources 2002, 112, 353–366. [Google Scholar] [CrossRef]
- Greiner, A.; Wendorff, J.H. Electrospinning: A fascinating method for the preparation of ultrathin fibers. Angew. Chem. Int. Ed. 2007, 46, 5670–5703. [Google Scholar] [CrossRef]
- Le Bars, M.; Worster, M.G. Interfacial conditions between a pure fluid and a porous medium: Implications for binary alloy solidification. J. Fluid Mech. 2006, 550, 149–173. [Google Scholar] [CrossRef] [Green Version]
- Nield, D. The limitations of the Brinkman-Forchheimer equation in modeling flow in a saturated porous medium and at an interface. Int. J. Heat Fluid Flow 1991, 12, 269–272. [Google Scholar] [CrossRef]
- Hicks, R.E. Pressure Drop in Packed Beds of Spheres. Ind. Eng. Chem. Fundam. 1970, 9, 500–502. [Google Scholar] [CrossRef]
- Fuller, E.N.; Schettler, P.D.; Giddings, J.C. New method for prediction of binary gas-phase diffusion coefficients. Ind. Eng. Chem. 1966, 58, 18–27. [Google Scholar] [CrossRef]
- Chabot, G.; Guilet, R.; Cognet, P.; Gourdon, C. A mathematical modeling of catalytic milli-fixed bed reactor for Fischer–Tropsch synthesis: Influence of tube diameter on Fischer Tropsch selectivity and thermal behavior. Chem. Eng. Sci. 2015, 127, 72–83. [Google Scholar] [CrossRef]
- Ghouri, M.; Afzal, S.; Hussain, R.; Blank, J.; Bukur, D.B.; Elbashir, N. Multi-scale modeling of fixed-bed Fischer Tropsch reactor. Comput. Chem. Eng. 2016, 91, 38–48. [Google Scholar] [CrossRef]
- Mamonov, N.A.; Kustov, L.; Alkhimov, S.A.; Mikhailov, M.N. One-dimensional heterogeneous model of a Fischer-Tropsch synthesis reactor with a fixed catalyst bed in the isothermal granules approximation. Catal. Ind. 2013, 5, 223–231. [Google Scholar] [CrossRef]
- Bunnell, D.G.; Irvin, H.B.; Olson, R.W.; Smith, J.M. Effective Thermal Conductivities in Gas-Solid Systems. Ind. Eng. Chem. 1949, 41, 1977–1981. [Google Scholar] [CrossRef]
- Campbell, J.; Huntington, R. Part II, Heat Transfer and Temperature Gradients. Pet. Refin. 1952, 31, 123–131. [Google Scholar]
- De Wasch, A.; Froment, G. Heat transfer in packed beds. Chem. Eng. Sci. 1972, 27, 567–576. [Google Scholar] [CrossRef]
- Specchia, V.; Baldi, G.; Sicardi, S. Heat transfer in packed bed reactors with one phase flow. Chem. Eng. Commun. 1980, 4, 361–380. [Google Scholar] [CrossRef]
- Bauer, R. Effective radial thermal conductivity of packings in gas flow. Int. Chem. Eng. 1978, 18, 181–204. [Google Scholar]
- Dixon, A.G. Wall and particle-shape effects on heat transfer in packed beds. Chem. Eng. Commun. 1988, 71, 217–237. [Google Scholar] [CrossRef]
- Specchia, V.; Sicardi, S. Modified correlation for the conductive contribution of thermal conductivity in packed bed reactors. Chem. Eng. Commun. 1980, 6, 131–139. [Google Scholar] [CrossRef]
- Plautz, D.A.; Johnstone, H.F. Heat and mass transfer in packed beds. AIChE J. 1955, 1, 193–199. [Google Scholar] [CrossRef]
- Quinton, J.; Storrow, J.A. Heat transfer to air flowing through packed tubes. Chem. Eng. Sci. 1956, 5, 245–257. [Google Scholar] [CrossRef]
- Kunii, D.; Smith, J.M. Heat transfer characteristics of porous rocks. AIChE J. 1960, 6, 71–78. [Google Scholar] [CrossRef]
- Yates, I.C.; Satterfield, C.N. Intrinsic kinetics of the Fischer-Tropsch synthesis on a cobalt catalyst. Energy Fuels 1991, 5, 168–173. [Google Scholar] [CrossRef]
- Vervloet, D.; Kapteijn, F.; Nijenhuis, J.; Van Ommen, J.R. Fischer-Tropsch reaction–diffusion in a cobalt catalyst particle: Aspects of activity and selectivity for a variable chain growth probability. Catal. Sci. Technol. 2012, 2, 1221–1233. [Google Scholar] [CrossRef]
- Stamenic, M.; Dikić, V.; Mandić, M.; Todić, B.; Bukur, D.B.; Nikačević, N.M. Multiscale and Multiphase Model of Fixed Bed Reactors for Fischer-Tropsch Synthesis: Intensification Possibilities Study. Ind. Eng. Chem. Res. 2017, 56, 9964–9979. [Google Scholar] [CrossRef]
- Bukur, D.B.; Mandić, M.; Todic, B.; Nikačević, N.M. Pore diffusion effects on catalyst effectiveness and selectivity of cobalt based Fischer-Tropsch catalyst. Catal. Today 2020, 343, 146–155. [Google Scholar] [CrossRef]
- Maretto, C.; Krishna, R. Design and optimisation of a multi-stage bubble column slurry reactor for Fischer–Tropsch synthesis. Catal. Today 2001, 66, 241–248. [Google Scholar] [CrossRef]
- Ma, W.; Jacobs, G.; Das, T.K.; Masuku, C.M.; Kang, J.; Pendyala, V.R.R.; Crocker, M.; Klettlinger, J.L.S.; Yen, C.H. Fischer–Tropsch Synthesis: Kinetics and Water Effect on Methane Formation over 25%Co/γ-Al2O3 Catalyst. Ind. Eng. Chem. Res. 2014, 53, 2157–2166. [Google Scholar] [CrossRef]
- Todic, B.; Bhatelia, T.J.; Froment, G.F.; Ma, W.; Jacobs, G.; Davis, B.H.; Bukur, D.B. Kinetic Model of Fischer–Tropsch Synthesis in a Slurry Reactor on Co-Re/Al2O3 Catalyst. Ind. Eng. Chem. Res. 2013, 52, 669–679. [Google Scholar] [CrossRef]
- Chernobaev, I.; Yakubovich, M.; Tripol’skii, A.; Pavlenko, N.; Struzhko, V. Investigation of the mechanism of methane formation in the fischer-tropsch synthesis on a Co/SiO2 Zr IV catalyst. Theor. Exp. Chem. 1997, 33, 38–40. [Google Scholar] [CrossRef]
- Lee, W.; Bartholomew, C.H. Multiple reaction states in CO hydrogenation on alumina-supported cobalt catalysts. J. Catal. 1989, 120, 256–271. [Google Scholar] [CrossRef]
- Sheng, M.; Gonzalez, C.F.; Yantz, W.R.; Cahela, D.R.; Yang, H.; Harris, D.R.; Tatarchuk, B. Micro Scale Heat Transfer Comparison between Packed Beds and Microfibrous Entrapped Catalysts. Eng. Appl. Comput. Fluid Mech. 2013, 7, 471–485. [Google Scholar] [CrossRef]


| Twall (K) | Tmax − Twall (K) Experimental | Tmax − Twall (K) Model | CO Conversion Experimental | CO Conversion Model | CH4 Selectivity Experimental | CH4 Selectivity Model | C5+ Selectivity Experimental | C5+ Selectivity Model |
|---|---|---|---|---|---|---|---|---|
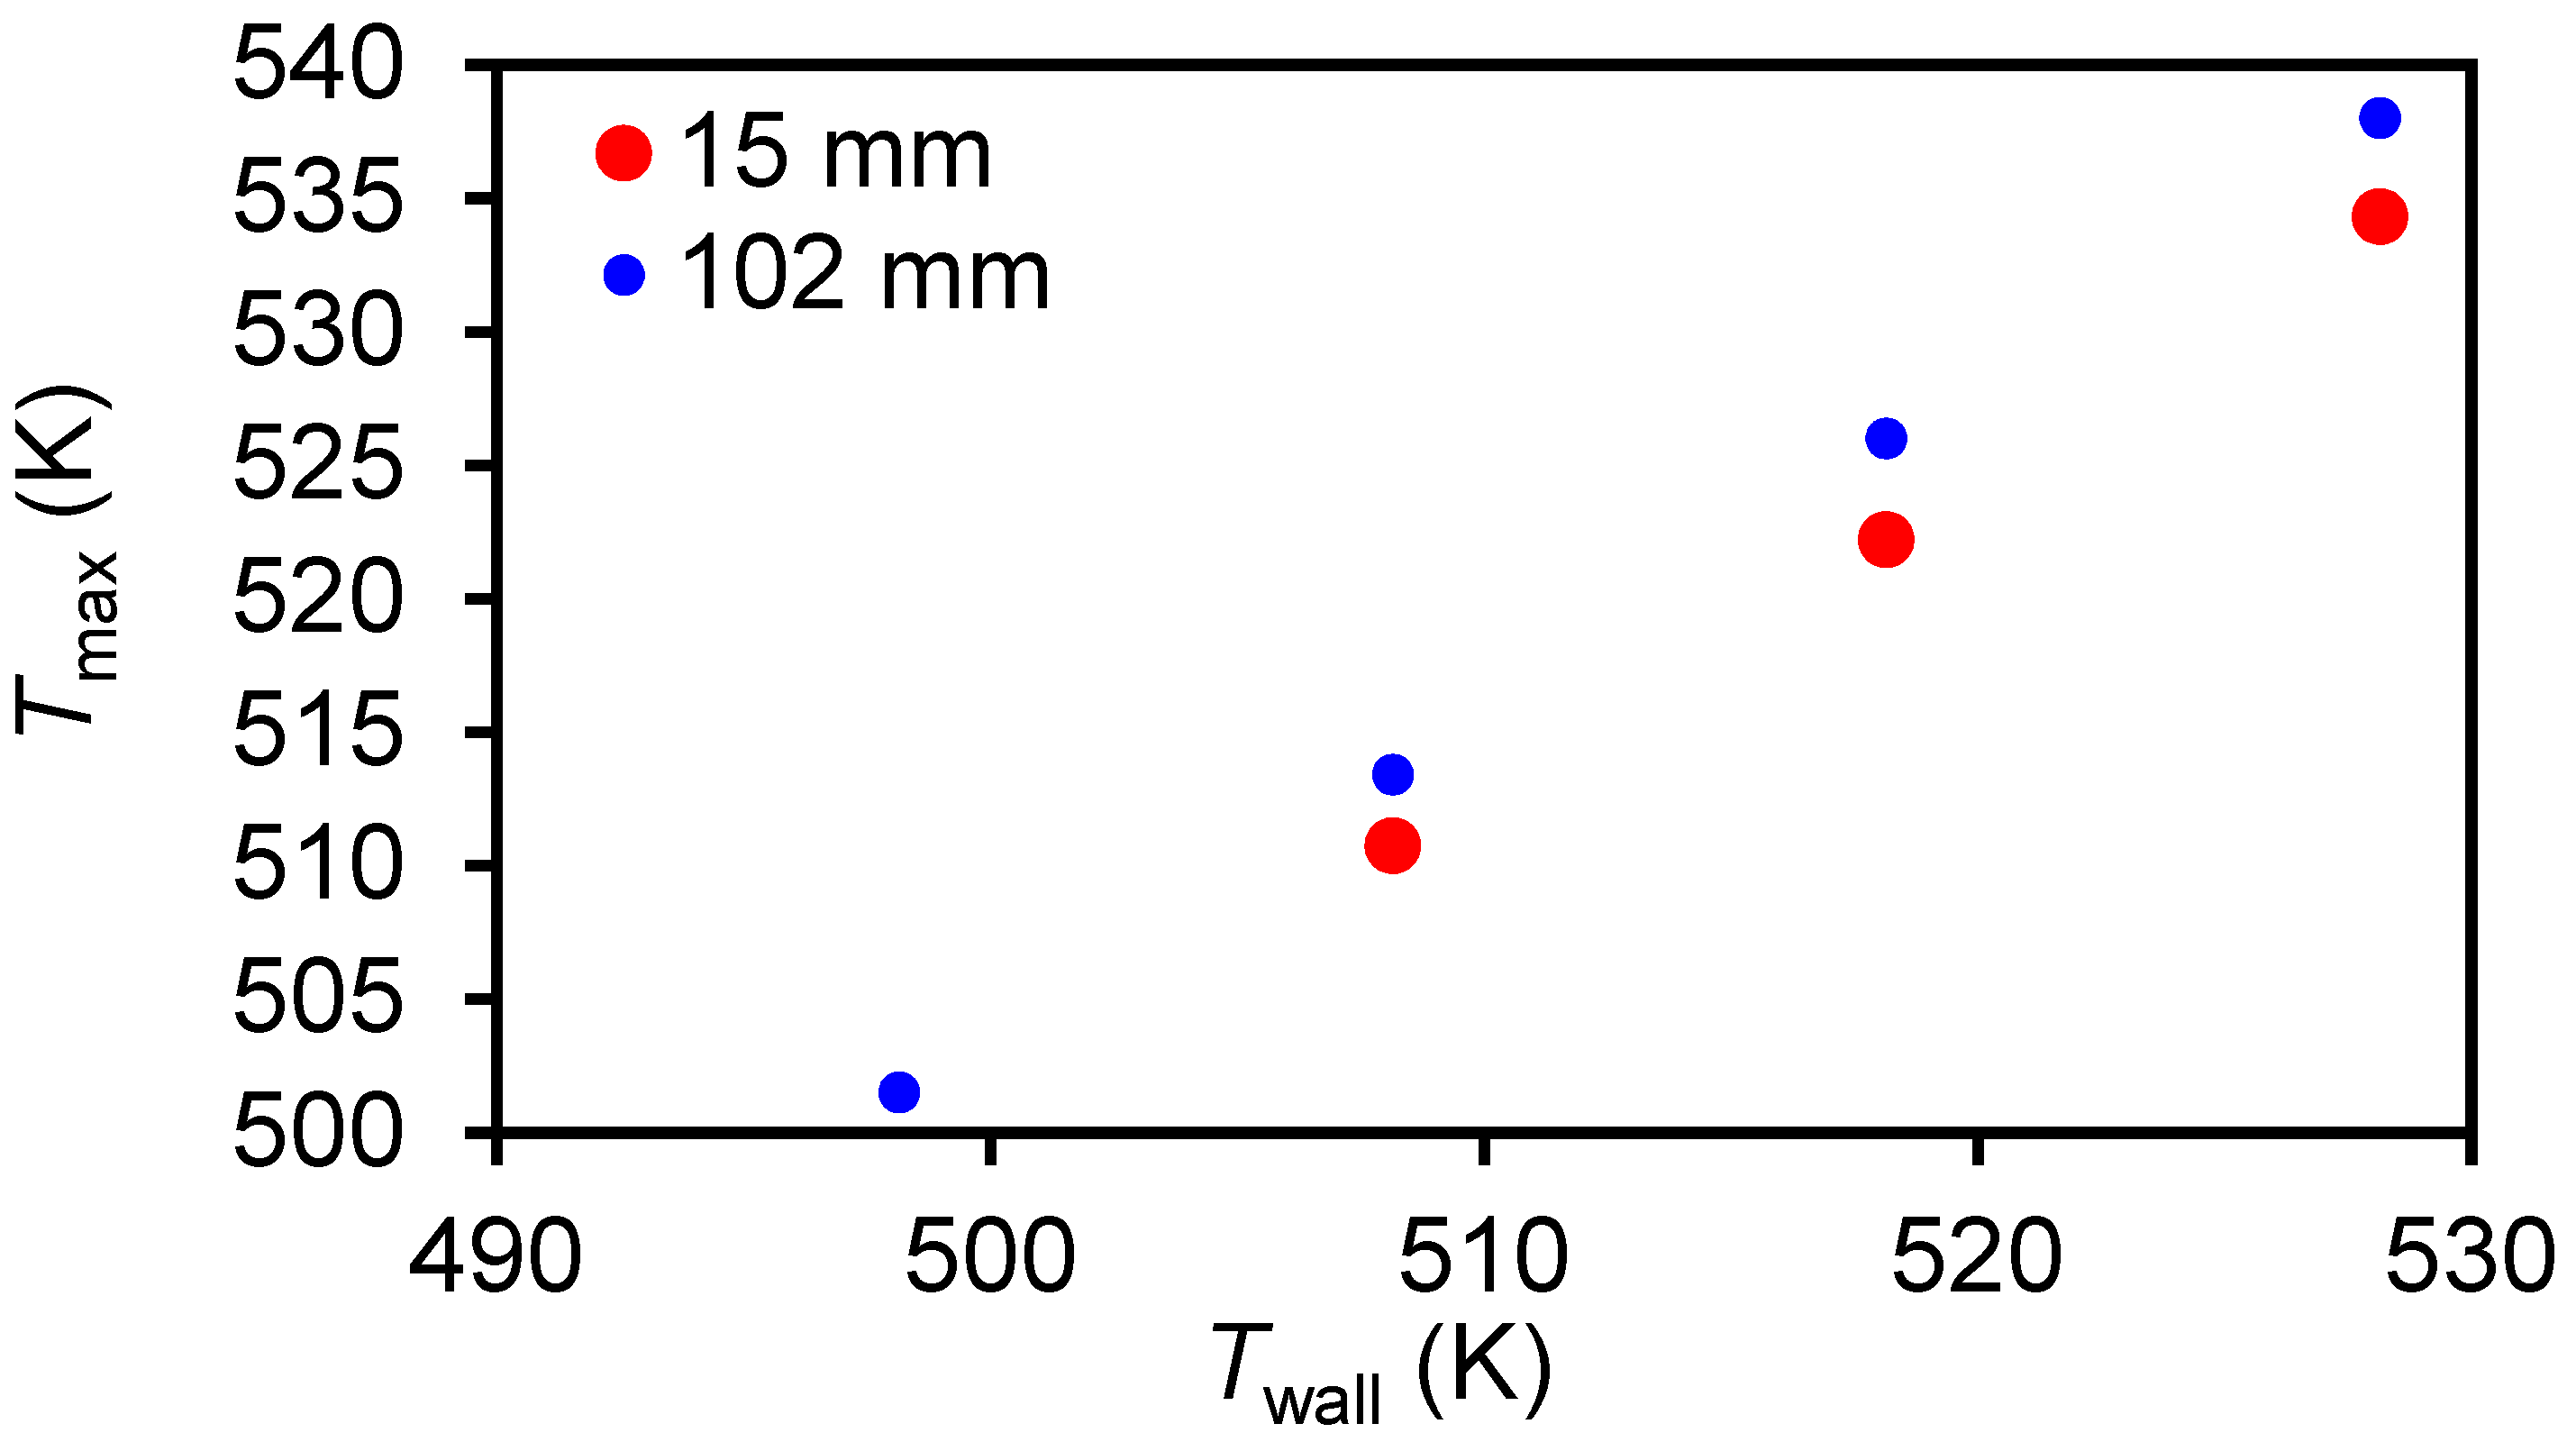
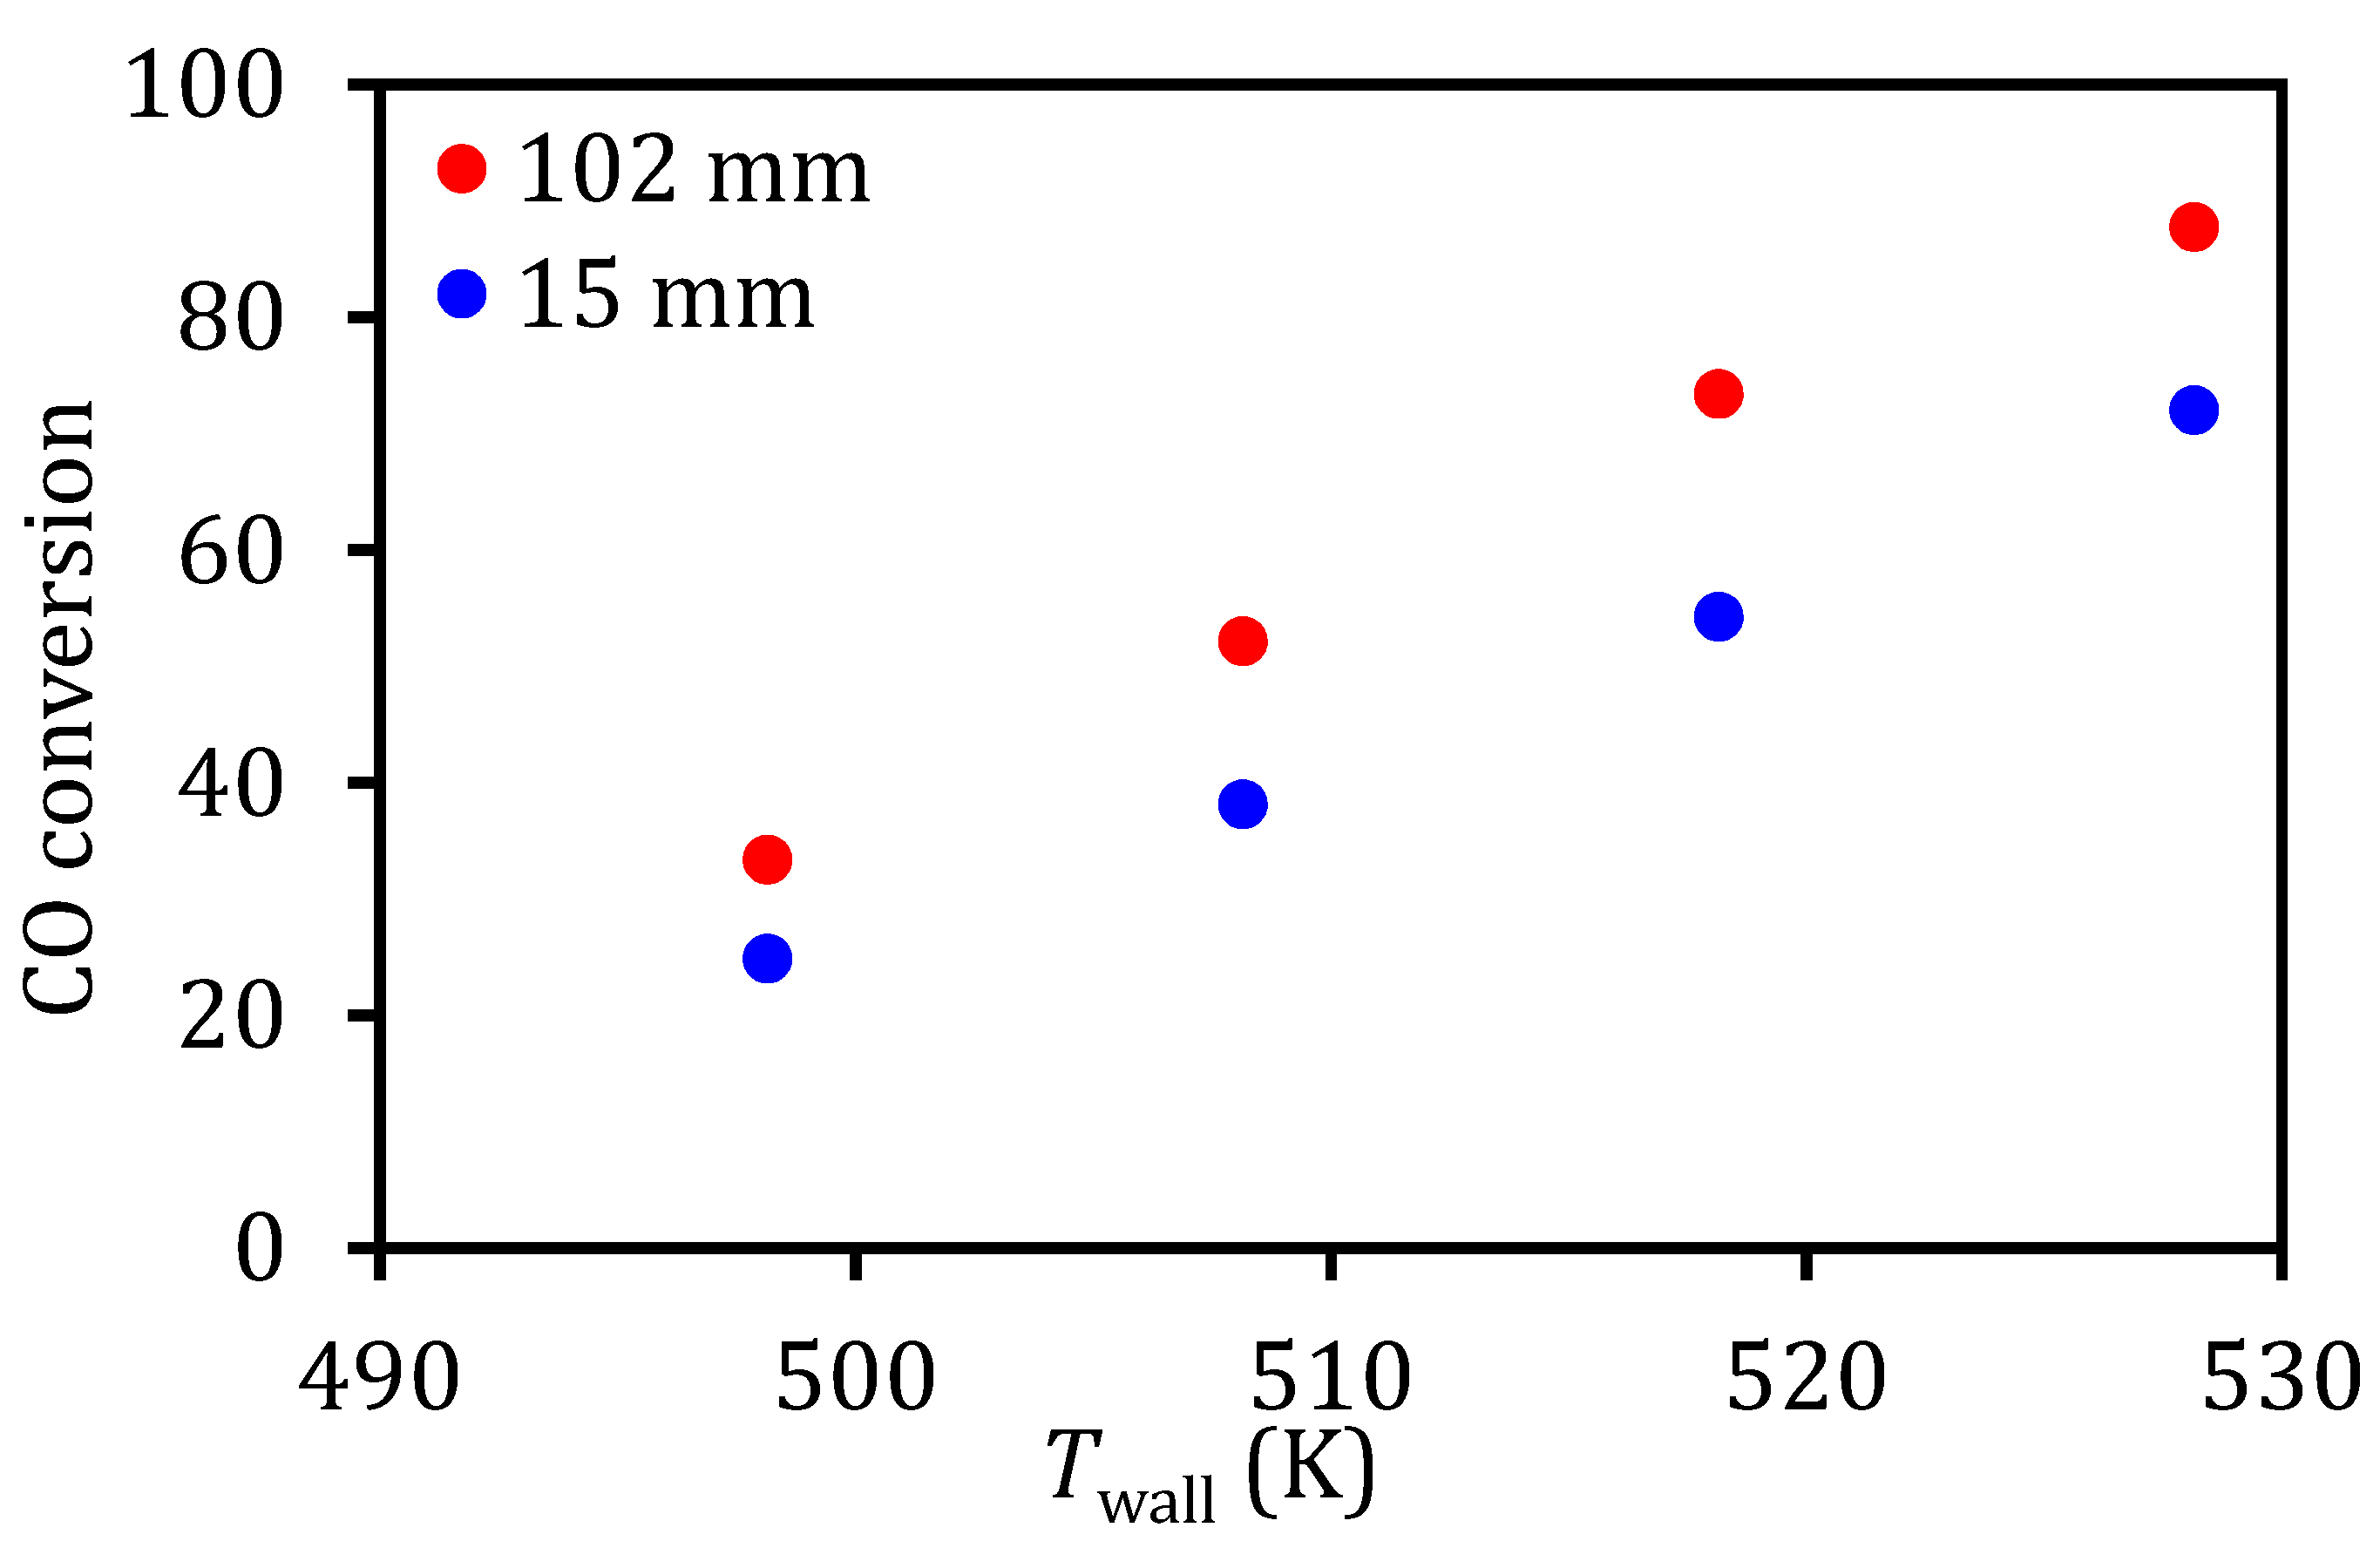
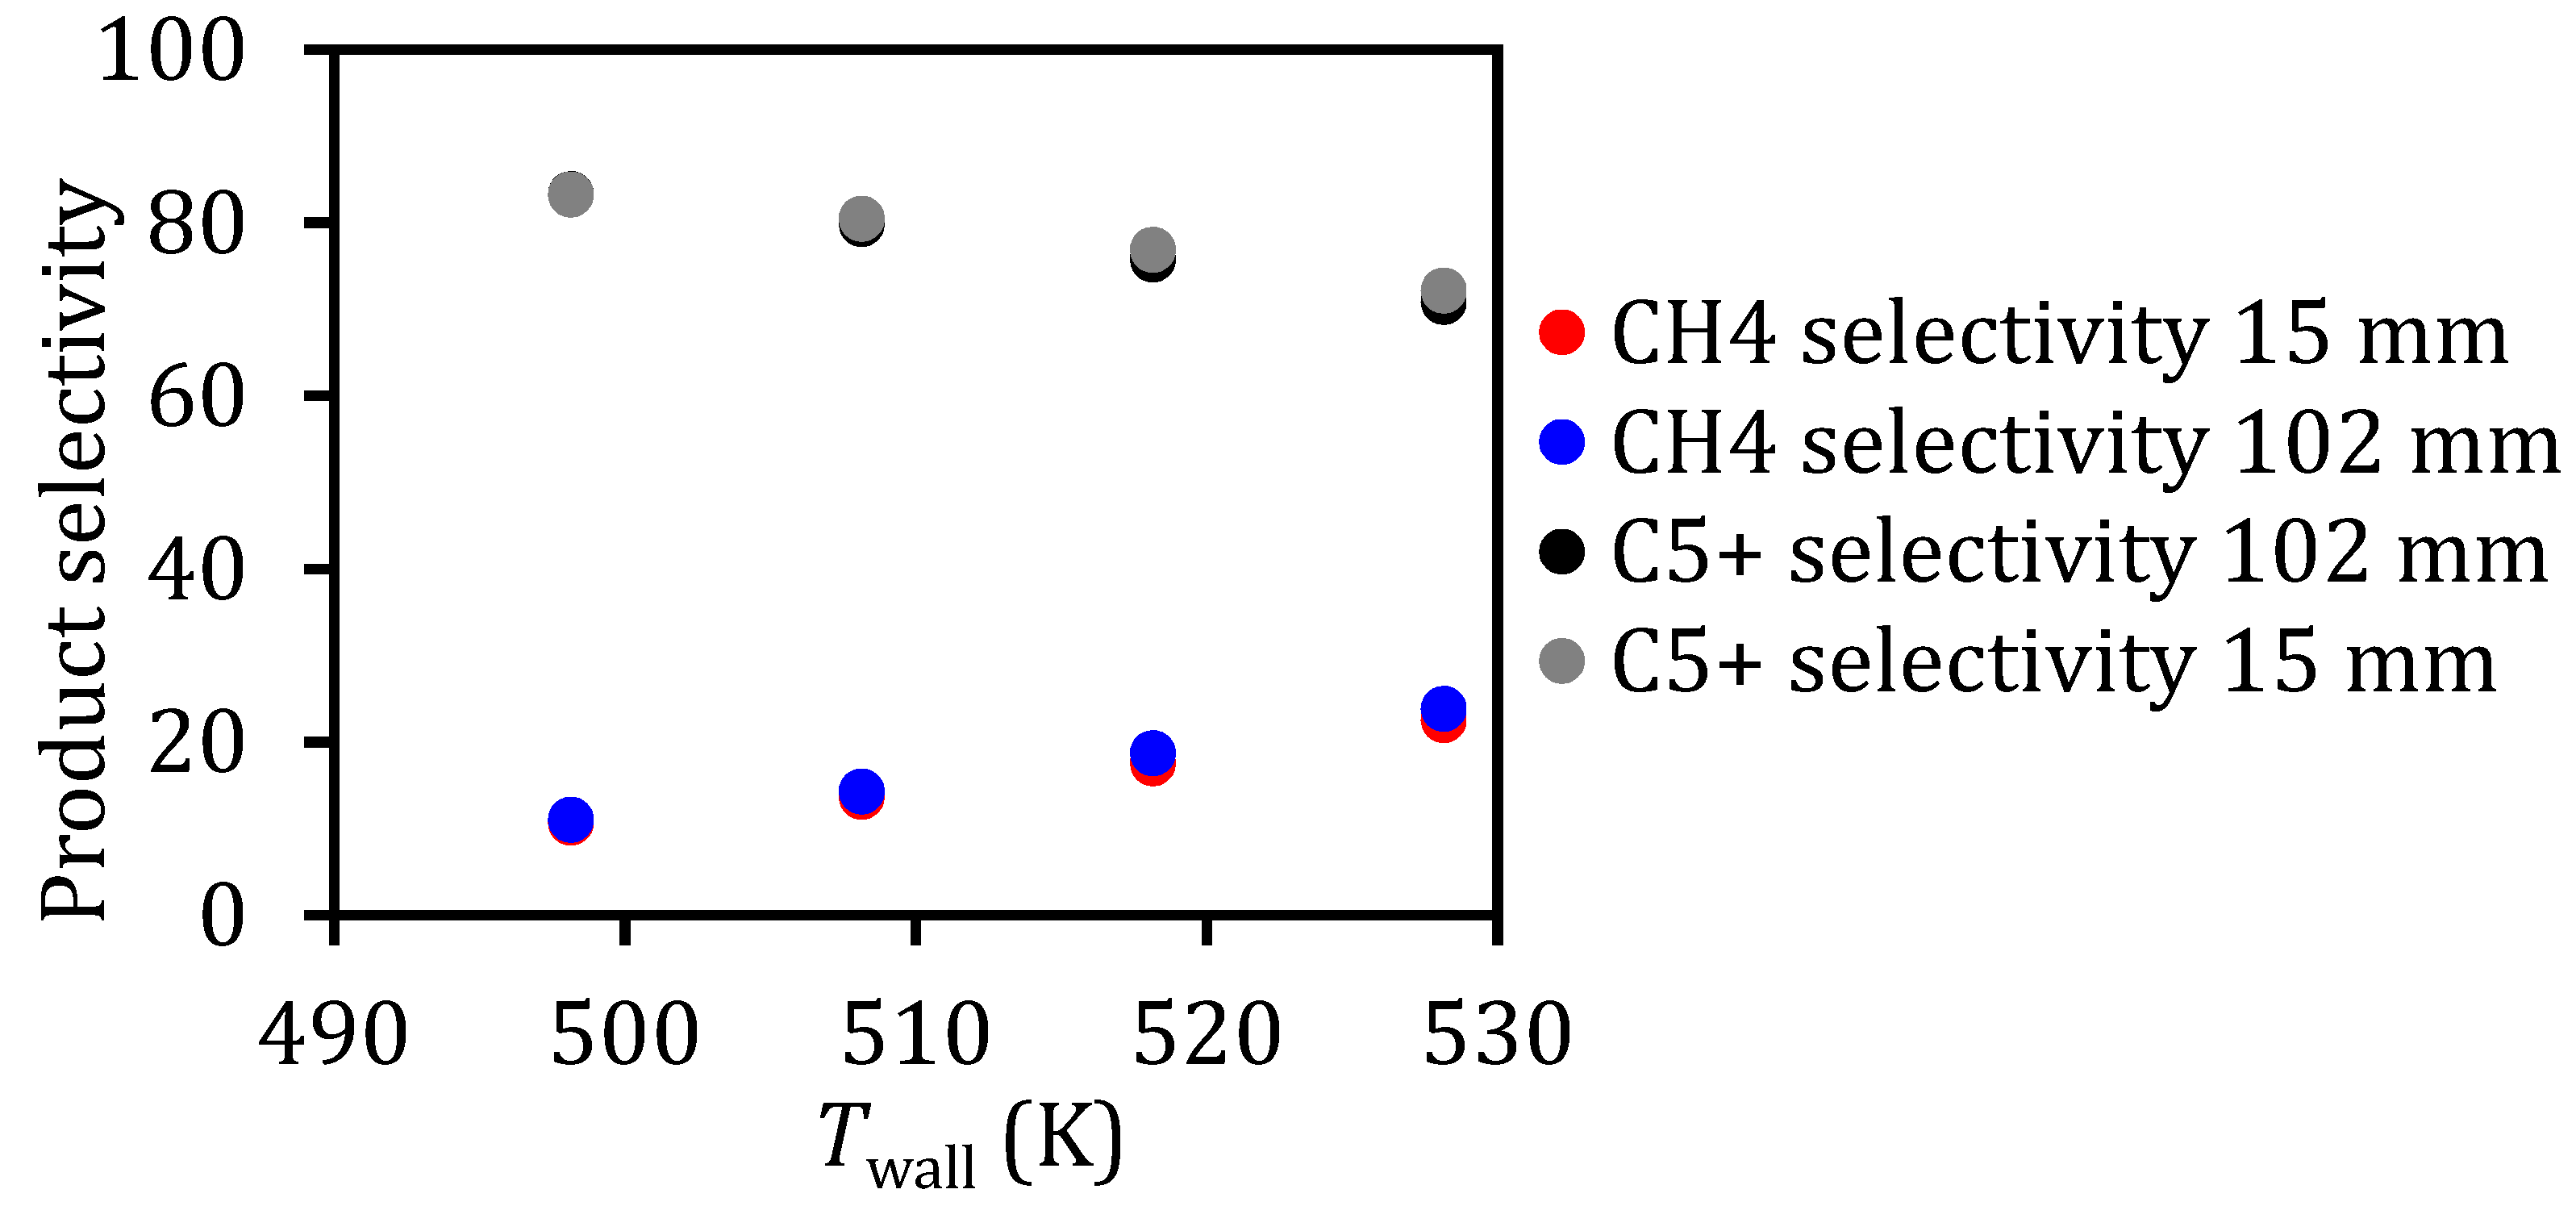
| 498.15 | 0 | 1.65 | 17 | 24.85 | 13 | 10.64 | 82.1 | 83.23 |
| 508.15 | 2.5 | 2.59 | 38.25 | 38.13 | 17 | 13.64 | 80.1 | 80.42 |
| 518.15 | 4.8 | 4.05 | 51.67 | 54.24 | 19 | 17.49 | 73.8 | 76.81 |
| 528.15 | 9.5 | 6.16 | 78.75 | 72 | 21 | 22.48 | 70.2 | 72.1 |
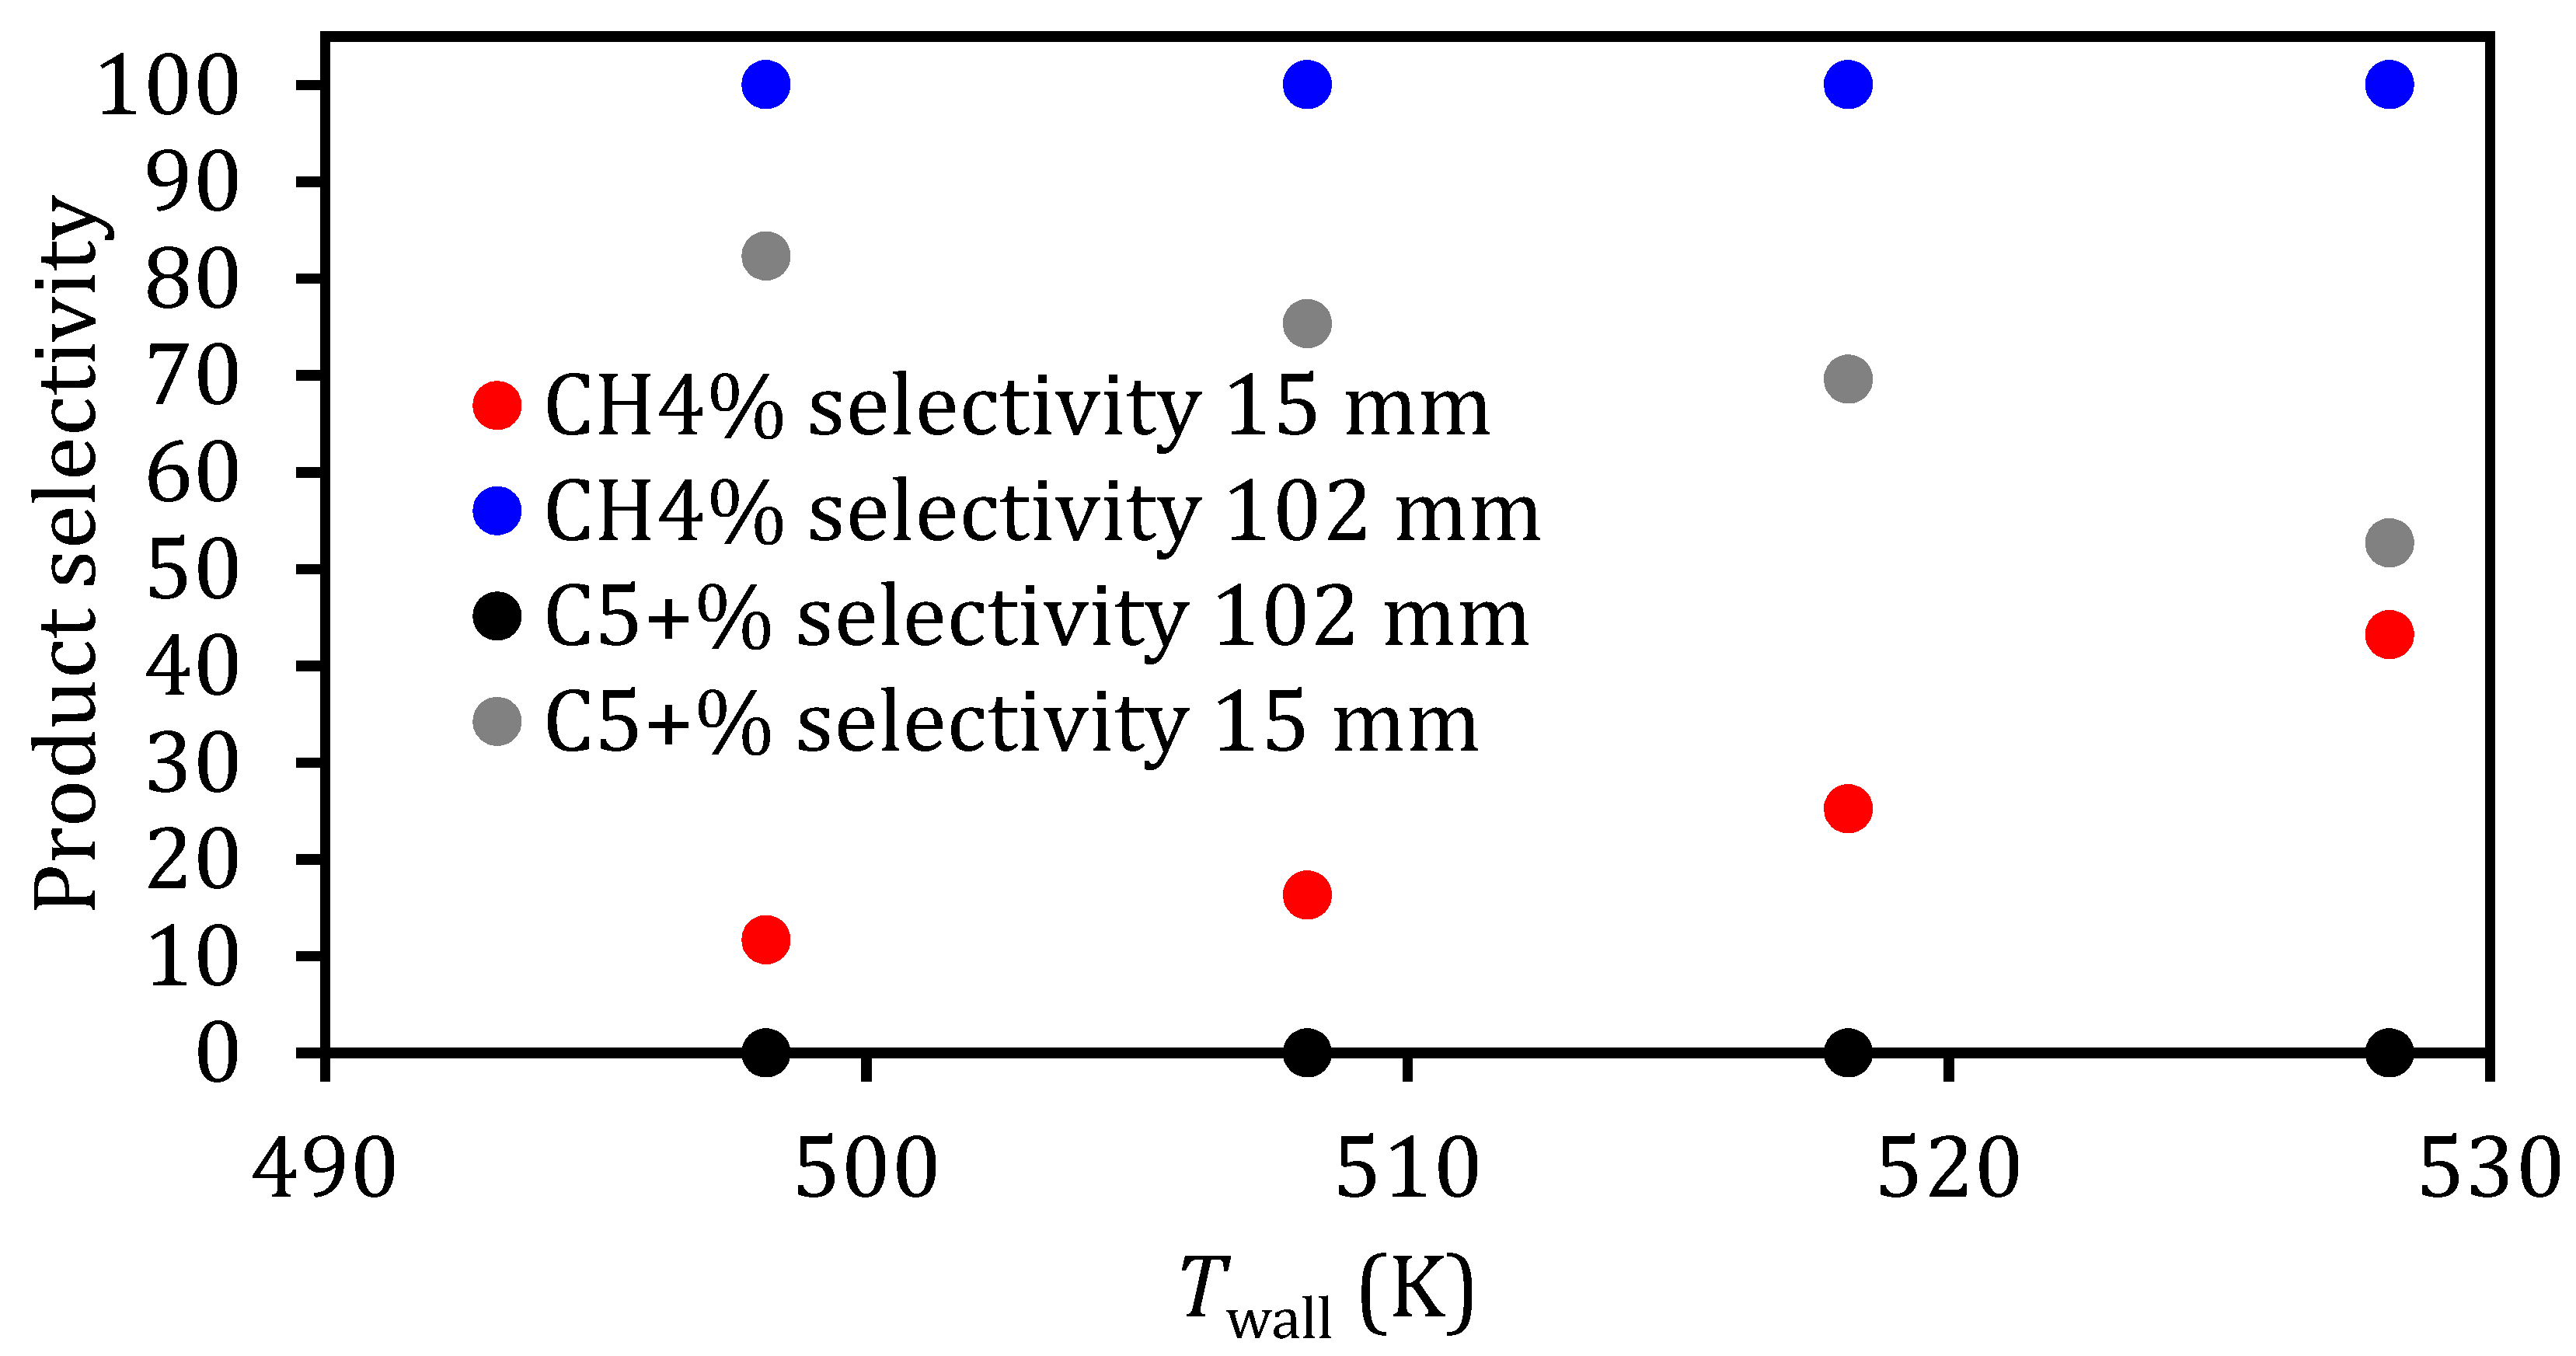
| Twall (K) | Tmax − Twall (K) Experimental | Tmax − Twall (K) Model | CO Conversion Experimental | CO Conversion Model | CH4 Selectivity Experimental | CH4 Selectivity Model | C5+ Selectivity Experimental | C5+ Selectivity Model |
|---|---|---|---|---|---|---|---|---|
| 498.15 | 5.6 | 6.35 | 35.71 | 49.33 | 15 | 11.66 | 79.7 | 82.28 |
| 508.15 | 9 | 11.75 | 53.13 | 69.08 | 19 | 16.3 | 73.4 | 75.3 |
| 518.15 | 14.1 | 21.85 | 86.81 | 89.74 | 30 | 25.2 | 50.6 | 69.55 |
| 528.15 | 69.8 | 48.4 | 99.32 | 92.27 | 83 | 43.2 | 12.4 | 52.68 |
© 2020 by the authors. Licensee MDPI, Basel, Switzerland. This article is an open access article distributed under the terms and conditions of the Creative Commons Attribution (CC BY) license (http://creativecommons.org/licenses/by/4.0/).
Share and Cite
Abusrafa, A.E.; Challiwala, M.S.; Wilhite, B.A.; Elbashir, N.O. Thermal Assessment of a Micro Fibrous Fischer Tropsch Fixed Bed Reactor Using Computational Fluid Dynamics. Processes 2020, 8, 1213. https://0-doi-org.brum.beds.ac.uk/10.3390/pr8101213
Abusrafa AE, Challiwala MS, Wilhite BA, Elbashir NO. Thermal Assessment of a Micro Fibrous Fischer Tropsch Fixed Bed Reactor Using Computational Fluid Dynamics. Processes. 2020; 8(10):1213. https://0-doi-org.brum.beds.ac.uk/10.3390/pr8101213
Chicago/Turabian StyleAbusrafa, Aya E., Mohamed S. Challiwala, Benjamin A. Wilhite, and Nimir O. Elbashir. 2020. "Thermal Assessment of a Micro Fibrous Fischer Tropsch Fixed Bed Reactor Using Computational Fluid Dynamics" Processes 8, no. 10: 1213. https://0-doi-org.brum.beds.ac.uk/10.3390/pr8101213