Article

Characterization and Demulsification of the Oil-Rich Emulsion from the Aqueous Extraction Process of Almond Flour

by
Fernanda F. G. Dias
1,
Neiva M. de Almeida
2,
Thaiza S. P. de Souza
1,
Ameer Y. Taha
1 and
Juliana M. L. N. de Moura Bell
1,3,*
1
Department of Food Science and Technology, University of California, Davis, One Shields Avenue, Davis, CA 95616, USA
2
Departamento de Gestão e Tecnologia Agroindustrial, Universidade Federal da Paraíba, Bananeiras, PB 58000-000, Brazil
3
Biological and Agricultural Engineering, University of California, Davis, One Shields Avenue, Davis, CA 95616, USA
*
Author to whom correspondence should be addressed.
Submission received: 22 August 2020 / Revised: 22 September 2020 / Accepted: 27 September 2020 / Published: 1 October 2020

Abstract

:
The aqueous extraction process (AEP) allows the concurrent extraction of oil and protein from almond flour without the use of harsh solvents. However, the majority of the oil extracted in the AEP is present in an emulsion that needs to be demulsified for subsequent industrial utilization. The effects of scaling-up the AEP of almond flour from 0.7 to 7 L and the efficiency of enzymatic and chemical approaches to demulsify the cream were evaluated. The AEP was carried out at pH 9.0, solids-to-liquid ratio of 1:10, and constant stirring of 120 rpm at 50 °C. Oil extraction yields of 61.9% and protein extraction yields of 66.6% were achieved. At optimum conditions, enzymatic and chemical demulsification strategies led to a sevenfold increase (from 8 to 66%) in the oil recovery compared with the control. However, enzymatic demulsification resulted in significant changes in the physicochemical properties of the cream protein and faster demulsification (29% reduction in the incubation time and a small reduction in the demulsification temperature from 55 to 50 °C) compared with the chemical approach. Reduced cream stability after enzymatic demulsification could be attributed to the hydrolysis of the amandin α-unit and reduced protein hydrophobicity. Moreover, the fatty acid composition of the AEP oil obtained from both demulsification strategies was similar to the hexane extracted oil.

Graphical Abstract

1. Introduction

Almond (Prunus dulcis L.) is the most widely consumed tree nut in the United States, with the state of California being responsible for 100% of the U.S. almond supply and 80% of the world’s almond production [1]. The consumption of almonds has been linked to nutritional and health benefits arising from its composition [2,3]. Almonds are rich in oil, protein, and carbohydrates, as well as micronutrients such as vitamin E, manganese, magnesium, copper, phosphorus, fiber, and riboflavin [4]. The lipid content in almonds is around 55% and consists mainly of polyunsaturated oleic and linoleic fatty acids [4,5]. Almonds also contain a high protein content (27%), which contributes significantly to nutrition, flavor, and other important functional properties when used as the main ingredient in several food products [6].
Almond proteins possess unique functional properties that make them a desirable ingredient for use in several food applications, especially plant-based beverages. Similarly, almond oil is also known for its health-promoting benefits (anti-inflammatory and anti-hepatotoxic) [7] and less harsh and environmentally friendly extraction methods are needed. However, the isolation of almond proteins for subsequent food/nutraceutical applications requires prior oil removal and the development of environmentally friendly strategies able to preserve the functional properties of the extracted protein. Oil extraction is commonly achieved by solvent extraction and/or mechanical pressing, the choice of which depends on the composition of the starting material. Pressing is usually the method of choice to produce specialty oils (i.e., tree nuts), however, it might generate a high oil protein-meal that needs to be subjected to subsequent solvent extraction to improve oil removal [8,9]. However, the use of hazardous solvents (i.e., hexane) has raised several environmental, safety, and consumer concerns [10,11]. In response to these concerns, research has been undertaken to develop alternative environmentally friendly strategies [12,13,14] to fractionate oil and protein from many oil-bearing materials. The aqueous extraction process (AEP) is a promising alternative for the fractionation of the almond constituents (i.e., protein, lipids, and carbohydrates) for subsequent use in the development of new food products and nutraceuticals. This water-based technology allows the simultaneous extraction of oil and proteins without the use of solvents, with potential value-added products [10,15,16,17,18]. Although this technique has been more extensively evaluated for soybeans [10,16,19], peanuts [20,21], linseed [22], flaxseed [23], olive [24,25], and corn [26,27], its use for the fractionation and production of almond ingredients for food and nutraceutical applications is still in its early stages [28,29,30].
The AEP of almond flour and almond cake (the protein-rich meal generated by the mechanical expression of the almond oil) achieved oil extraction yields from 50 to 70% at laboratory scale [28,30]. However, only a reduced fraction of the almond oil was extracted as free oil (1 to 3%) [28,30]. As a matter of fact, 25–27% of the almond cake oil [30] and 40–64% of the almond flour oil [28], although extracted from their respective starting material, ended up entrapped in the cream emulsion. Therefore, the development of viable methods to demulsify the cream emulsion, a necessary step to increase the recovery of the extracted oil, is essential to maximize the feasibility of the AEP [31,32,33].
The stability of the cream emulsion depends on the molecular and chemical properties of the emulsifier at the interface and on the process conditions [33,34]. Enzymatic and physical treatments have been exploited to reduce the cream stability and increase free oil release from the AEP and enzyme-assisted aqueous extraction processing (EAEP) of soybeans [10,33,35,36], peanut [20], yellow mustard [37], sunflower [38], and almond cake [29]. However, the effects of different demulsification strategies on the release of free oil from the almond cream and resulting physicochemical changes in the cream remain a challenge to the development of a structural-based approach to improve oil recovery and quality.
The objectives of this study were to (i) scale up the aqueous extraction process of almond flour from 0.07 to 0.7 kg of almond flour using a 1:10 solids-to-liquid ratio (SLR) (~7 L of slurry) to produce adequate quantities of cream for the demulsification and characterization experiments, (ii) assess the distribution of the extracted oil and protein among the fractions generated (skim, cream, and insoluble), (iii) evaluate the resistance of the cream against enzymatic and chemical demulsification strategies, (iv) determine the effects of chemical and enzymatic demulsification strategies in the physicochemical properties of the cream proteins (peptide profile and surface hydrophobicity), and (v) determine the fatty acid profile of the AEP almond oil. With the goal of maximizing free oil recovery, sequential optimization strategies using response surface methodology were employed to destabilize the cream produced by the AEP.

2. Materials and Methods

2.1. Material

The almond flour used in this study (ultra-fine granulometry) was provided by Blue Diamond Growers (Sacramento, CA, USA). Whole almonds (Prunus dulcis) were grounded and sieved in a #12 mesh sieve (minimum recovery of 85%). The almond flour composition was 43% oil, 22% protein, and 5% moisture (determined according to Section 2.6).

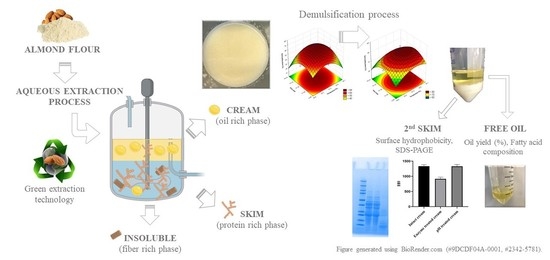
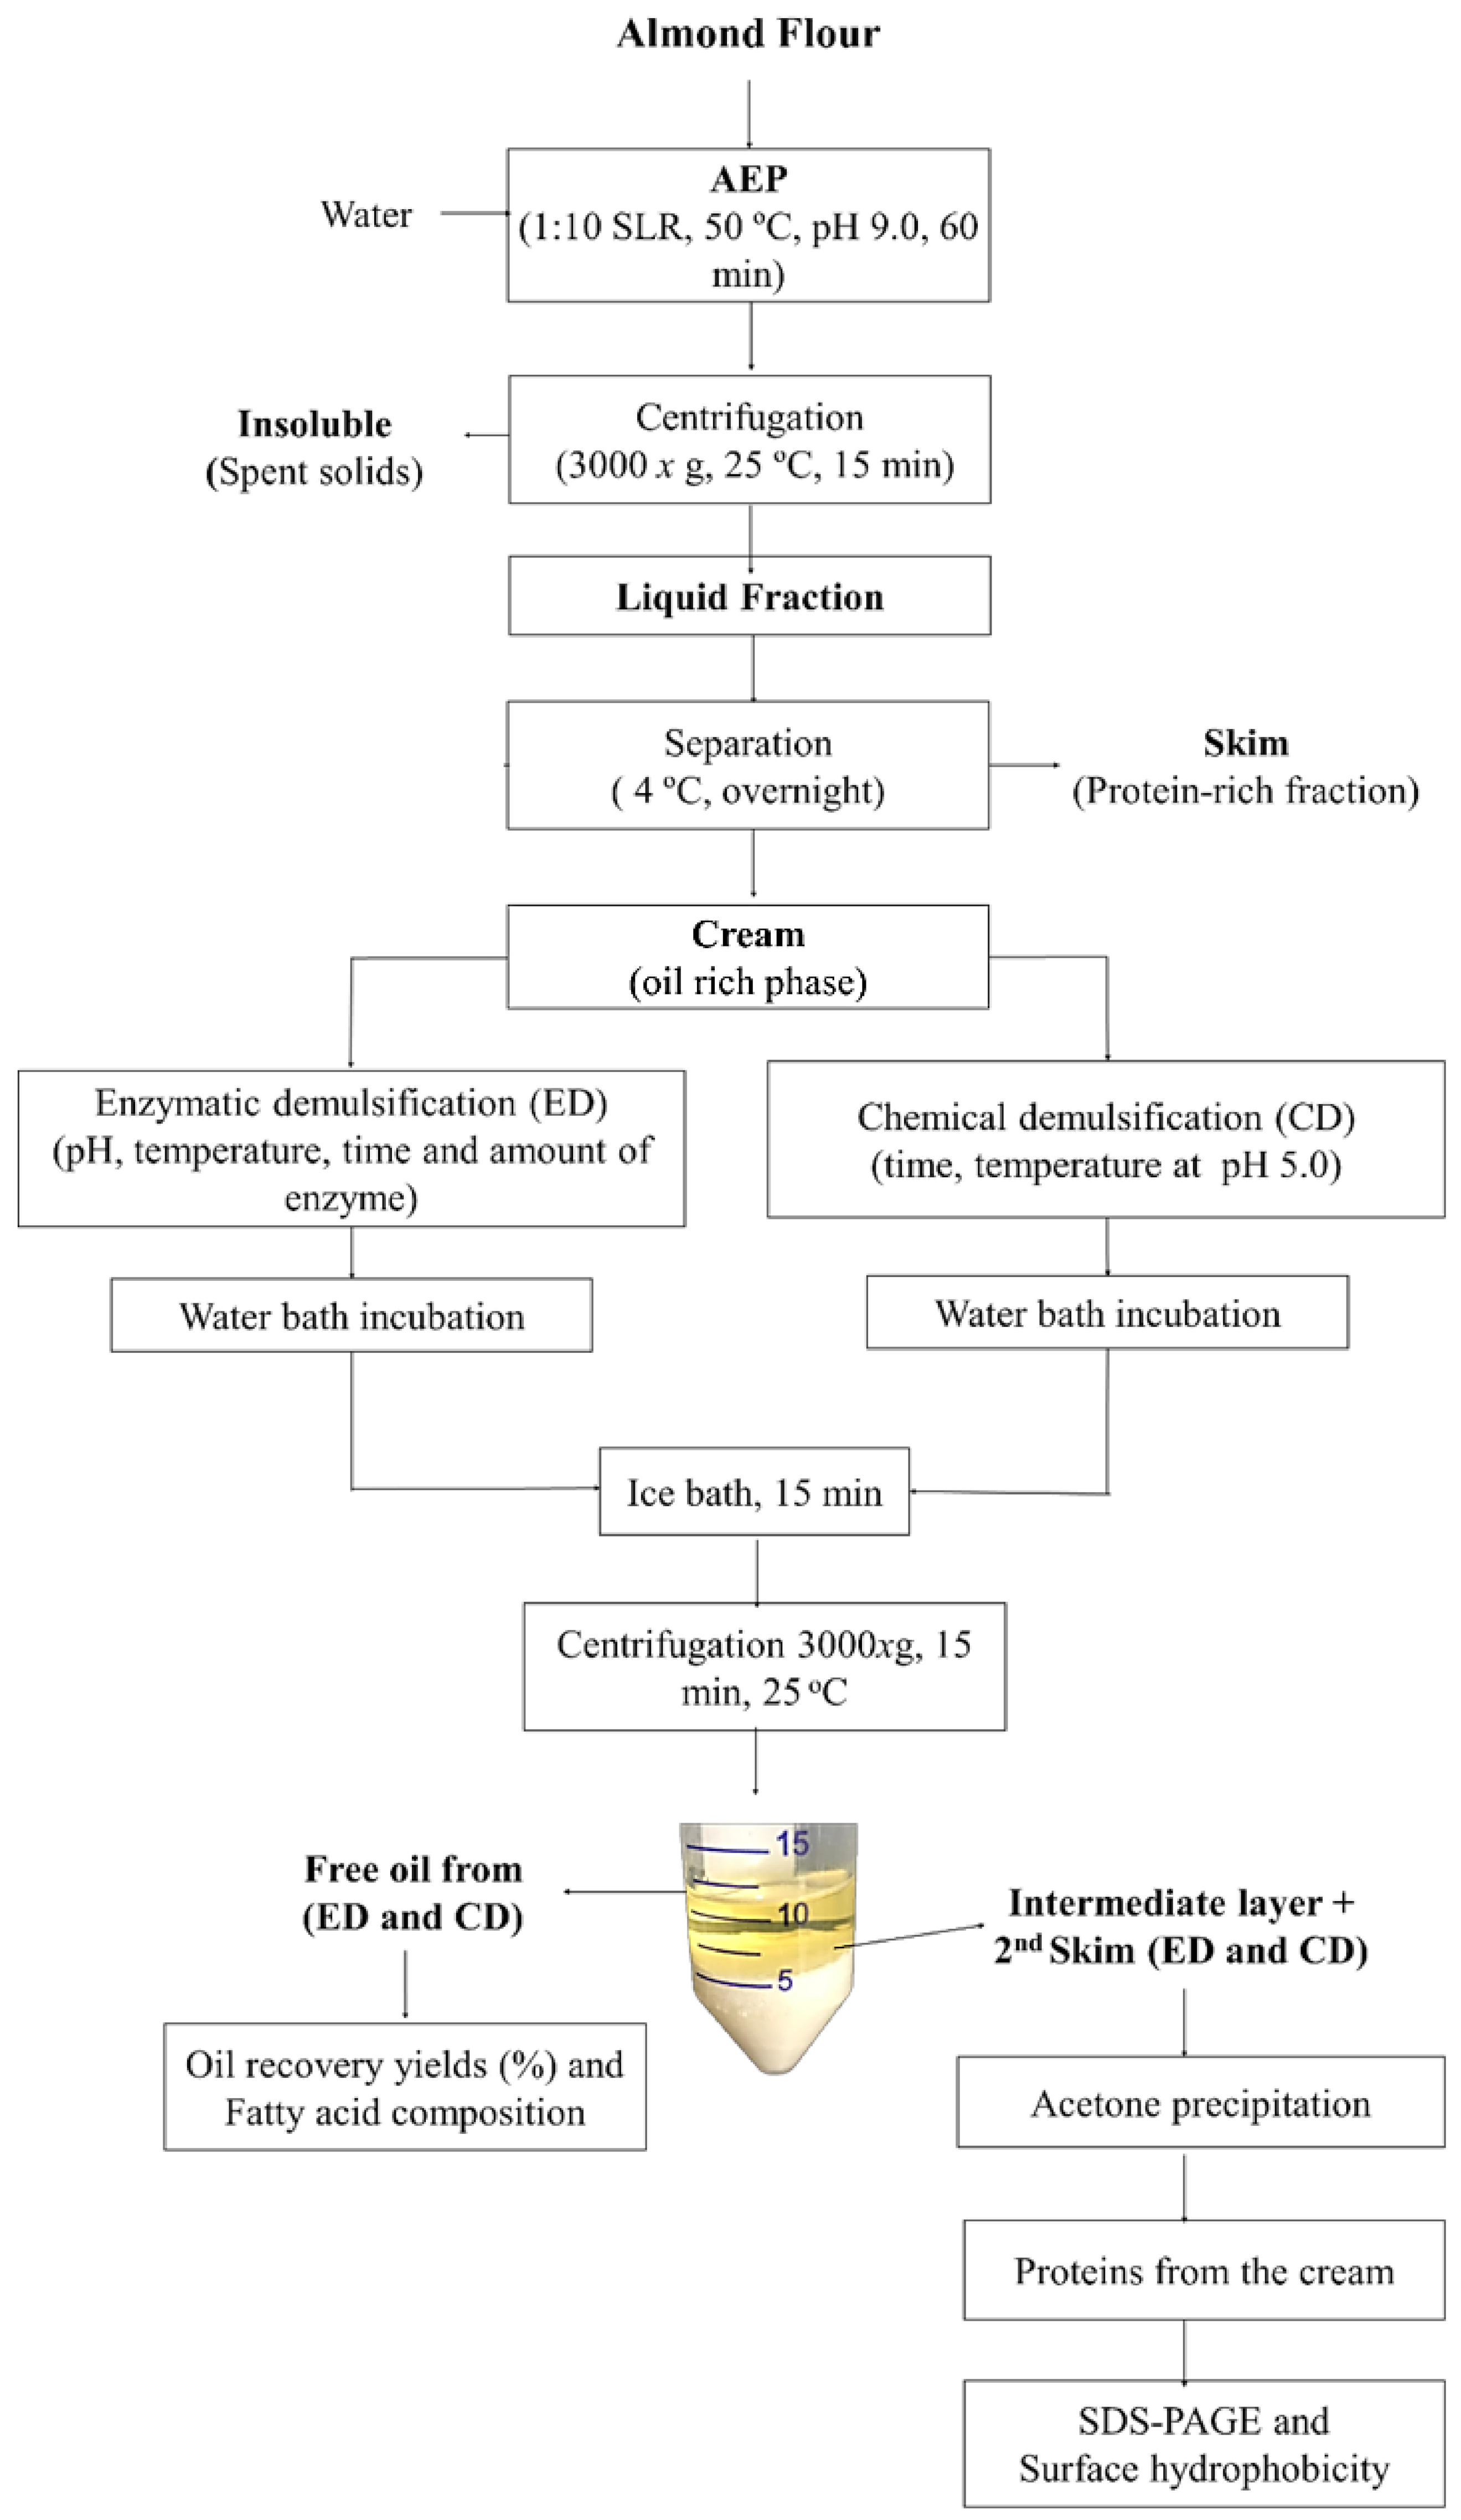
2.2. Processing Scale-Up of the Aqueous Extraction Process (AEP) of Oil and Protein from Almond Flour

Almond flour (0.7 kg) was mixed with water to achieve a 1:10 solids-to-liquid ratio (SLR) in a 10 L jacketed glass reactor model CG-1965-610M (Chemglass Life Sciences LLC, Vineland, NJ, USA). The slurry pH was adjusted and kept at 9.0 for 60 min. The slurry pH was constantly monitored with a pH meter and it was maintained at pH 9.0 with the addition of 2 M NaOH or 2 MHCl. Extractions were performed at 50 °C under constant agitation at 120 rpm. Extraction conditions were previously optimized by Almeida et al. [28] at laboratory-scale. After the extraction, the slurry was centrifuged at 3000× g for 30 min to separate the insoluble fraction (Figure 1) from the liquid phase (cream and skim). The liquid phase was cooled to 4 °C and subsequently fractionated into (i) skim–protein-rich fraction and (ii) cream–oil-rich fraction. The separation was performed based on the density difference among the fractions; the skim was the lower phase and the cream was the upper phase The fractionation of cream and skim was performed by opening the chemical reactor valve and letting the skim fraction flow until the cream fraction reached the valve. The cream fraction was subsequently collected in a separate container. The weight of both fractions was recorded for mass balance calculations. The extraction process was performed in triplicate.
The AEP fractions (skim, cream, and insoluble) and the starting material (almond flour) were evaluated for oil and protein content. Total oil extraction (TOE) yield, oil distribution in the fractions, total protein extraction (TPE) yield, and protein distribution in the fractions were determined according to Equations (1)–(4), respectively [28].
TOE   % = 100 Oil   g   in   the   insoluble   fraction   Oil   g   in   the   almondflour   ×   100
Oil   distribution   in   each   fraction   % = Oil   g   in   each   fraction * Oil   g   in   the   almond   flour     ×   100
TPE   % = 100 Protein   g   in   the   insoluble   fraction Protein   g   in   the   almond   flour   ×   100
Protein   distribution   in   each   fraction   % = Protein   g   in   each   fraction * Protein   g   in   the   almond   flour   ×   100
* with fraction corresponding to either cream, skim, or insoluble.

2.3. Recovering the Extracted Oil: Enzymatic (ED) and Chemical Demulsification (CD) of the Almond Cream

Considering that the majority of the oil extracted by the AEP is entrapped in the cream [18,31,33], the development of strategies to demulsify the cream is necessary to free the entrapped oil for subsequent utilization. Understanding the effects of processing variables (i.e., pH, time, temperature, amount of enzyme) on the release and quality of the extracted oil is a key step to maximize the feasibility of the AEP.
Overall, cream demulsification was performed using 10 g of well-mixed cream (cream + free oil) placed in a 30 mL beaker. For the enzymatic demulsification, the cream pH was adjusted to different pH values (Table 1, fractional factorial design matrix) using a 2 N NaOH solution before the addition of the Neutral Protease 2 million (NP2M) (BIO-CAT, Virginia, NY, USA). Enzyme selection was based on the ability of this enzyme to extract a higher amount of almond oil in its free form in laboratory scale experiments [28]. No enzyme was added during the chemical demulsification and control sample after pH adjustment. Cream demulsification was performed under constant stirring (120 rpm) and controlled temperature in a water bath with a multipoint inductive-drive stirrer (ThermoScientific Variomag, Thermo Scientific, Daytona Beach, FL, USA). After the demulsification treatment, samples were transferred to a 50 mL centrifuge tube and centrifuged at 3000× g for 15 min at 25 °C. Three distinct layers were obtained (free oil, an intermediate layer, and a water phase referred to as second skim) (Figure 1). Most of the free oil was collected using a Pasteur pipette and the remaining free oil was extracted by rinsing the cream twice with hexane (2 mL in total), which was subsequently evaporated under nitrogen flux, as described by Lamsal and Johnson 2007. The free oil yield (%) was calculated as follows (5) [12]:
Demulsification   yield   % = free   oil   g × 100 cream   g × oil   content   % / 100 %

2.3.1. Enzymatic Demulsification (ED): Tailoring Enzyme Use to Maximize the Cream Demulsification Efficiency

A sequential strategy based on the use of a fractional factorial design (FFD) followed by a central composite rotatable design (CCRD) was used to optimize the enzymatic demulsification of the cream emulsion. The effects of pH (6.0–9.0), amount of enzyme (0.5–1.0%), time (30–90 min), and temperature (50–65 °C) on the destabilization of the cream emulsion were evaluated using a FFD. The fractional factorial design matrix is described in Table 1. The levels of the variables used in the experimental design were selected based on preliminary experiments, optimum conditions of enzyme activity, and existing literature data [15,32]. Cream demulsification yield (%) was the dependent variable, indicating the amount of oil recovered from the cream emulsion.
According to the FFD experiments, pH and amount of enzyme significantly affected the stability of the cream emulsion. On the basis of the significance and type of effect (i.e., positive or negative) of pH and amount of enzyme observed in the FFD, a CCRD with three central points and four axial points (total of 11 runs) was developed to maximize the cream demulsification yield. The variables with negative effects had their values shifted to lower levels, and the variables with positive effects had their values shifted to higher levels in the CCRD. Therefore, the effects of pH (6.6–9.4) and amount of enzyme (0.1–1.51%) on the demulsification of the cream were evaluated. Demulsification yields were calculated as described in Equation (5) and the second-order equation used for the model is represented by Equation (6):
Y = β 0   +   i = 1 n β i x i +   i = 1 n 1 j = i + 1 n β i j x i x j
where Y is the estimated response, i and j are values from 1 to the number of variables (n), β0 is the intercept term, βi are the linear coefficients, βij are quadratic coefficients, and xi and xj are coded independent variables. The significance of the model was tested by analysis of variance (ANOVA). Best experimental conditions determined by the CCRD were subsequently validated in triplicate and compared with the predicted value generated by the regression model.

2.3.2. Chemical Demulsification (CD): Effects of Temperature and Incubation Time on the Cream Demulsification Efficiency

For the chemical demulsification, the pH of the cream was kept at 5.0, which is the almond protein isoelectric point [39]. The effects of incubation temperature (46.9–68.1 °C) and time (5.8–69.2 min) on the demulsification of the cream were evaluated. Cream demulsification yield (%) was calculated as described in Equation (5). The best experimental condition identified by the CCRD was validated in triplicate and compared with the predicted value generated by the regression model.

2.4. Effects of Demulsification Strategies on the Physicochemical Properties of the Cream Proteins

2.4.1. Low Molecular Weight (MW) Polypeptide Profile Characterization of the Cream Proteins by Sodium Dodecyl Sulfate-Polyacrylamide Gel Electrophoresis (SDS-PAGE)

The proteins in the intact cream (IC) (before demulsification) and in the chemically (CD) and enzymatically (ED) demulsified creams were isolated as described by Chabrand and Glatz [35]. Briefly, proteins in the cream oil/water interface were isolated by precipitation with ice-cold acetone in the proportion of 1:20 (sample/acetone), followed by incubation at −20 °C for 2 h and centrifugation at 12,000× g for 15 min at 4 °C. The protein pellets obtained were washed three times with cold acetone and air-dried at 25 °C. Air-dried proteins were mixed with Laemmli buffer containing β-mercaptoethanol and placed in a water bath at 95 °C for 5 min as described by Laemmli [40]. A total of 30 μg of protein was loaded per well onto a precast gradient acrylamide 4–20% gel (Criterion TM TGX Precast Gels, Bio Rad, Hercules, CA, USA). A 25 mM Tris buffer pH 8.3 containing 192 mM glycine and 0.1% of sodium dodecyl sulfate (Bio Rad, Hercules, CA, USA) was used as the running buffer at 200 V at room temperature for 60 min. A Precision Plus Protein™ Dual Color Standards SDS-PAGE standard (0–250 kDa) (Bio Rad, Hercules, CA, USA) was used as the molecular weight size marker. Relative quantification and polypeptide distribution were performed using a Gel Doc TM EZ Imager system and Image Lab software (Bio-Rad, Hercules, CA, USA).

2.4.2. Surface Hydrophobicity (H0) of the Cream Proteins

The H0 of the cream proteins was determined using the ANS (1-anilino-8-naphthalenesulfonate) fluorescence probe as described by Zhang et al. [41] with a few modifications. Protein samples from intact cream (before demulsification, IC) and after chemical (pH treated cream, CD) and enzymatic (enzymatically treated cream, ED) demulsification (prepared as described in item 2.4) were dispersed into a 100 mM PBS (phosphate-buffered saline solution) at pH 7.0 and centrifuged at 10,000× g for 20 min. The amount of protein in the supernatant was quantified by the fluorometric based method Qubit (Protein assay kit, ThermoFisher, Waltham, MA, USA) using the Qubit Fluorometer 4.0 (ThermoFisher, Waltham, MA, USA). The amount of protein was adjusted to concentrations ranging from 0.04 to 0.70 mg/mL and 1.25 µL of ANS solution (8.0 mM in 100 mM PBS, pH 7.0, solution) was added to 250 µL of sample solution in a 96-well plate. Fluorescence intensity was measured in a plate reader (SpectraMax M5, Molecular Devices, San Jose, CA, USA) at 390 and 470 nm of excitation and emission wavelength, respectively. Sample hydrophobicity was defined as the slope of the fluorescence intensity versus protein concentration curve and was calculated by linear regression analysis [31]. The H0 value was calculated as the average of six measurements.

2.5. Fatty Acid Composition of the Almond Oil Recovered by Chemical and Enzymatic Demulsification Strategies and Solvent Extraction

Total fatty acids were measured by gas chromatography coupled to a flame ionization detector (GC-FID). An aliquot of 400 µL of toluene spiked internal standard (triheptadecanoic acid) was added to 10 mg of almond oil (oil recovered from chemical and enzymatic demulsification and solvent extraction), followed by the addition of 3 mL of 100% methanol and 600 µL of HCl/methanol (8:92 v/v). Sample derivatization was performed at 90 °C for 60 min followed by a cooling step of 5 min at room temperature. The fatty acid methyl esters (FAMEs) were extracted using 1 mL of hexane and 1 mL of ultrapure water and separating the hexane layer (containing the FAMEs) to a new centrifuge tube containing 450 µL of ultrapure water. Samples were centrifuged at 15,000× g for 1 min at 0 °C, and the top hexane layer was transferred to a new tube, dried under nitrogen, and reconstituted in 200 µL of hexane.
FAMEs were analyzed by a gas chromatograph (GC, Clarus 500, Perkin Elmer, Waltham, MA, USA) coupled with a flame ionization detector (FID) with helium as the carrier gas at 1.0 mL/min. The column used was a DB-FFAP (30 m × 0.25 mm id × 0.25 µm; Agilent, Santa Clara, CA, USA). The injector temperature was 240 °C with a split of 1:10 and injection volume of 1 µL. The oven program temperature was 80 °C for 2 min, increased to 180 °C at 10 °C/min, increased to 240 °C at 5 °C/min, and held at 240 °C for 13 min. The detector temperature was kept at 300 °C. A mix of 29 FAME standards was used to identify the different fatty acids (FAs) based on their retention times. For comparison purposes, hexane extracted almond oil was used as the control for the oil recovered by chemical and enzymatic demulsification strategies. Almond oil solvent extraction was performed using a Soxhlet apparatus for 5 h at 65–68 °C using hexane as the solvent, according to the AOAC official method for oil extraction [42]. The hexane was removed from the oil under nitrogen flux and the oil was stored at −80 °C until further analysis.

2.6. Proximate Analyses

Total oil content was determined by the Mojonnier method (AOAC Method 922.06 for solid samples, and AOAC Methods 995.19 and 989.05 for cream and skim fractions, respectively) [43]. Nitrogen content was determined using the Dumas method (Vario Max Cube, Elementar Americas, Ronkonkoma, NY, USA). Protein content (%) was calculated as total nitrogen (%) × 5.18 (conversion factor). Total solids (dry matter) was determined by weighing after drying the samples in a vacuum oven at 65 °C until constant weight (AACC Method 44–40) [44]. All analyses were conducted in duplicate for each extraction replicate (n = 3) and a mass balance was provided for all extracted compounds.

2.7. Statistical Analyses

Multivariate statistical analyses were performed for the FFD and CCRD using the Protimiza Experimental Design® Software (http://experimental-design.protimiza.com.br). GraphPad Prism (Version 7.0, La Jolla, CA, USA) was used for additional experiments. Replicates of each measurement were analyzed by analysis of variance (ANOVA) followed by Tukey with a level of significance set at p < 0.05.

3. Results and Discussion

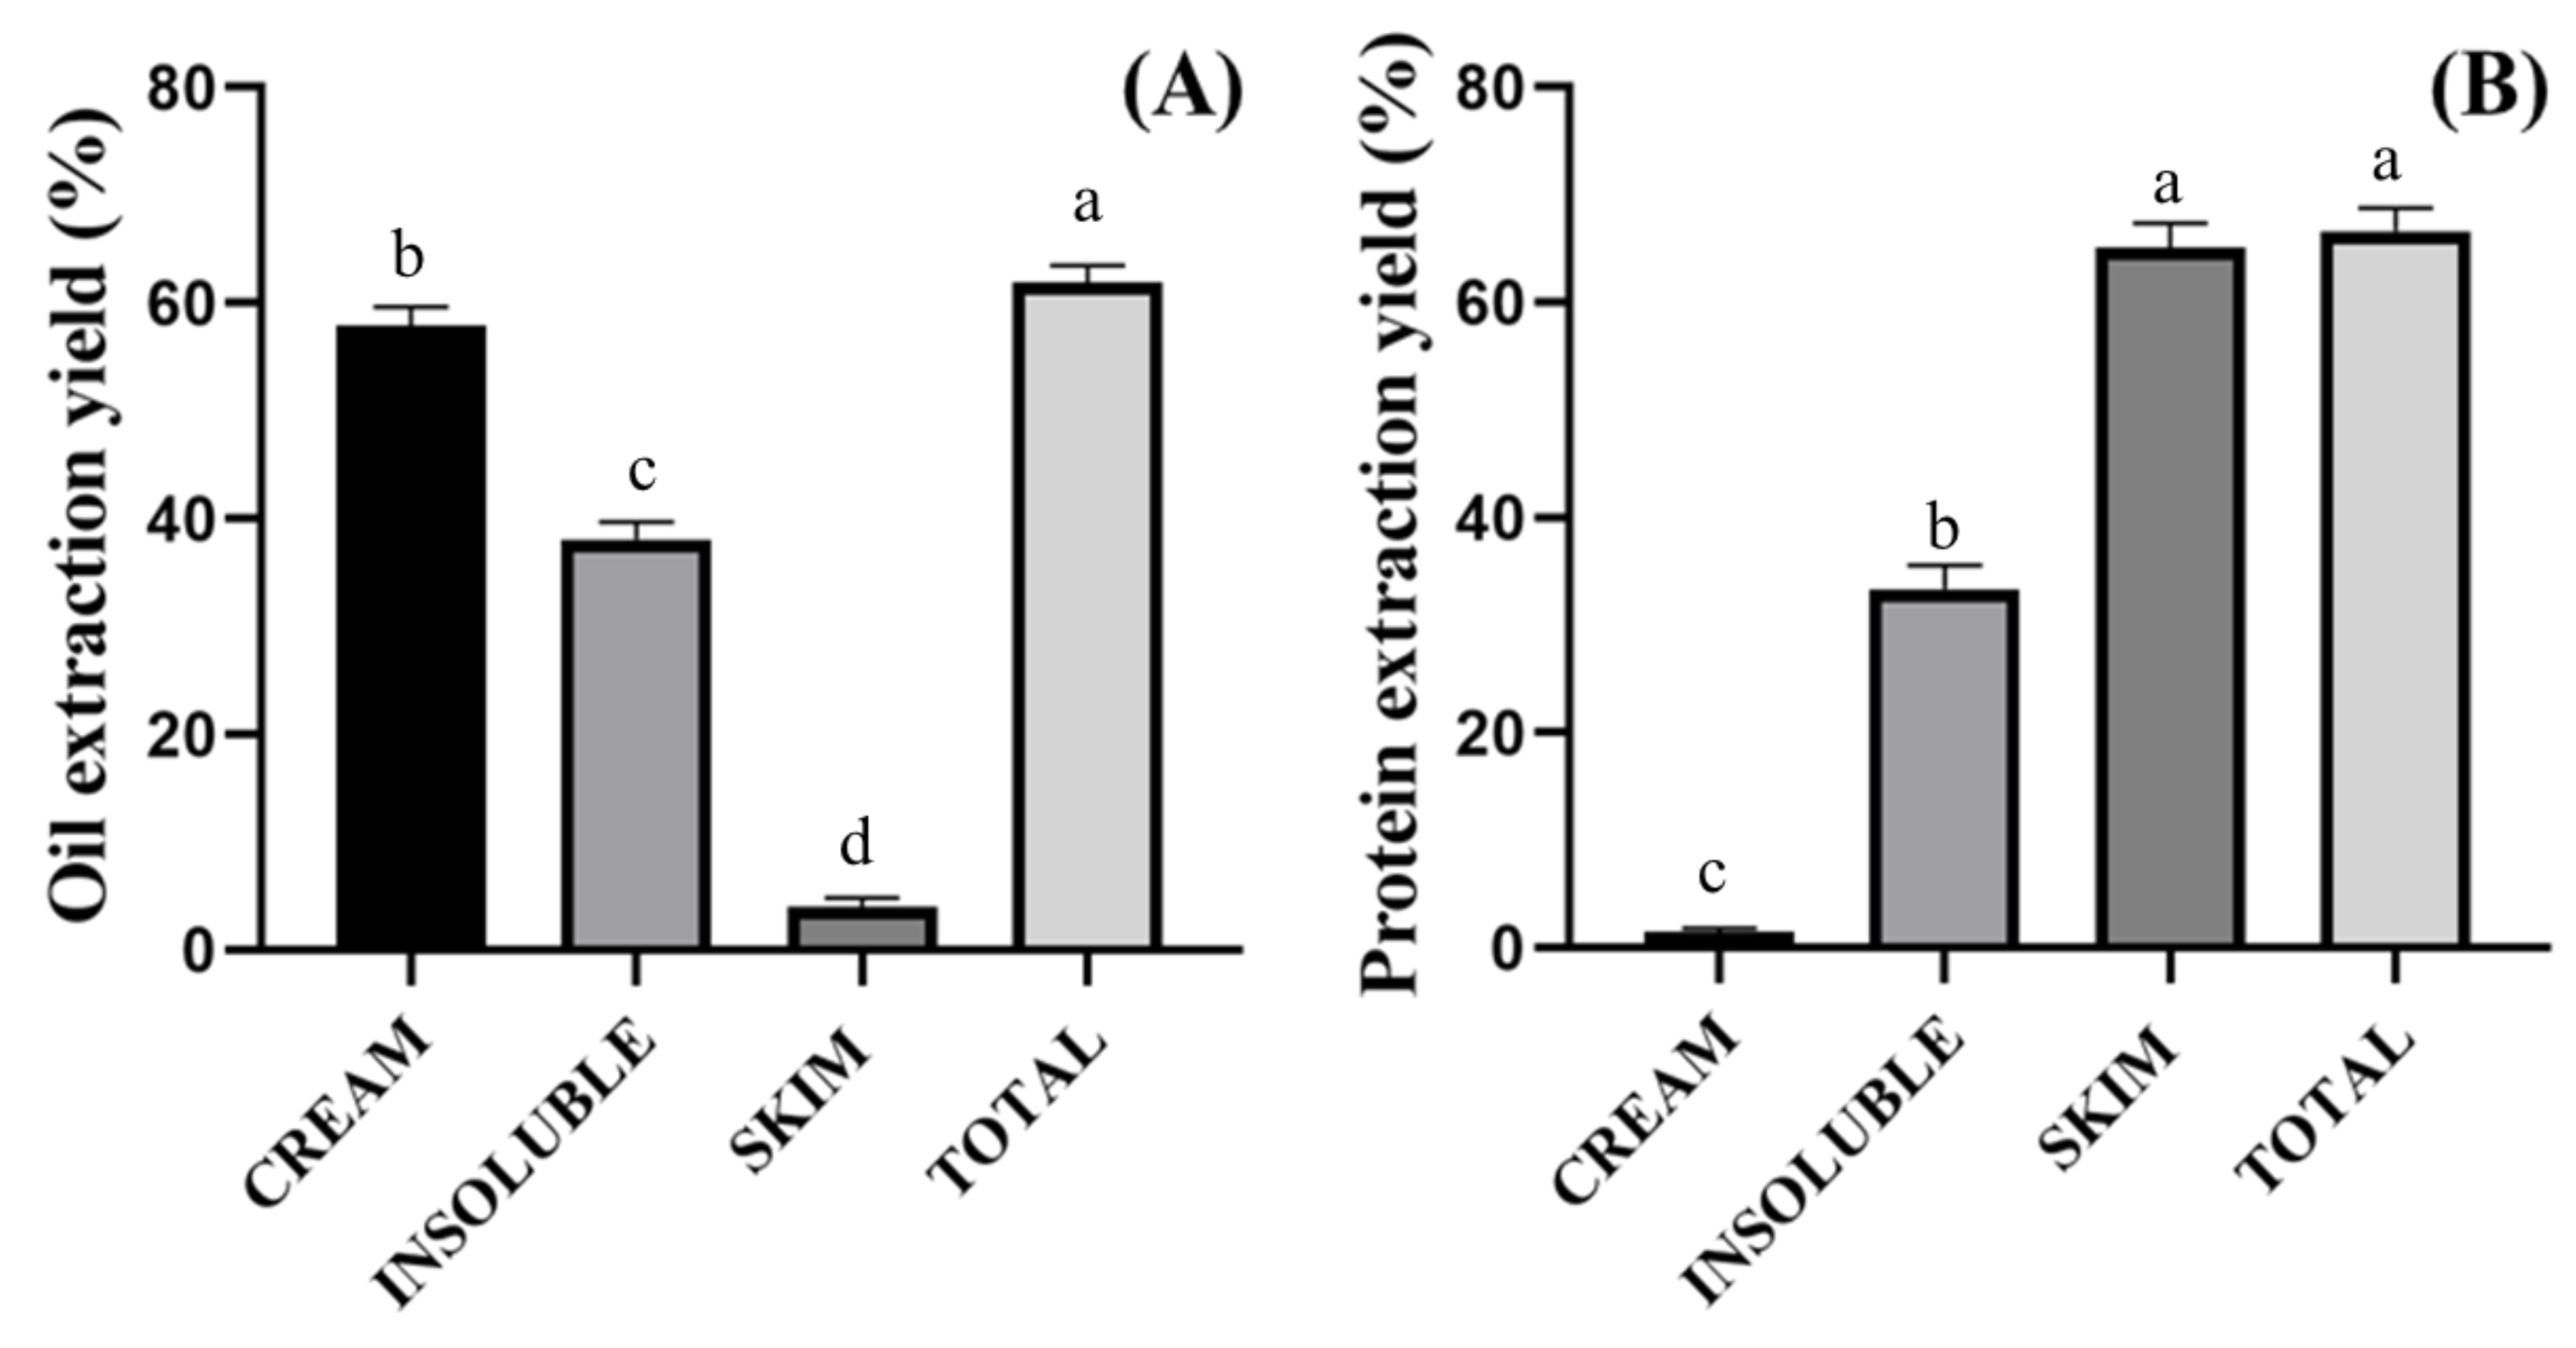
3.1. Processing Scale-Up of the Aqueous Extraction Process of Oil and Protein from Almond Flour

To ensure the production of adequate quantities of cream (oil-rich fraction) for subsequent demulsification and compositional analyses, optimum extraction conditions identified at laboratory scale for the AEP (pH 9.0, 50 °C, 1:10 SLR, 60 min of extraction time) were scaled-up from 0.07 to 0.7 kg of almond flour, producing ~7 L of slurry. Total oil and protein extraction yields and their distribution in the fractions are shown in Figure 2A,B. Total oil and protein extraction yields of 61.9 and 66.6% were achieved at pilot scale, respectively. These results are in agreement with those obtained at laboratory scale (0.07 kg of almond flour), where oil and protein extraction yields of 69.8 and 64.8% were achieved, respectively [28]. Overall, the distribution of the extracted oil and protein in the skim and cream fractions was in agreement with that observed at lab-scale experiments. Low oil yield (<5%) was observed in the skim fraction, a desirable finding because the presence of oil in the skim might reduce the skim protein solubility, and there are no feasible methods to remove the oil from the skim fraction [12]. Although 61.9% of the almond flour oil was extracted, 93.5% of extracted oil was entrapped in the cream fraction when scaling up the extraction process (Figure 2A). The cream fraction contained approximately 1.5% of the almond protein.
Because proteins can behave as potent emulsifiers [20], the cream protein content and composition might influence the resistance of the cream against subsequent demulsification (i.e., the recovery of the oil from the emulsion) [45].
Although tailoring extraction conditions to maximize overall extractability of oil and protein from almond flour is unquestionably the first step in the process development, it is important to understand the effects of extraction conditions on the recovery of the extracted oil (commonly entrapped in the cream emulsion) for subsequent applications (i.e., food, feed, and fuel).

3.2. Recovering the Extracted Oil: Enzymatic and Chemical Demulsification of the Cream Emulsion

In view of the fact that most of the extracted oil in the AEP is entrapped in the cream (oil-rich fraction), it becomes necessary to carefully consider the techniques employed to free the oil from the cream emulsion. Maximizing oil recovery and oil quality is key to process feasibility and will depend critically on the development of successful demulsification steps [18]. Because demulsification conditions (e.g., use of enzyme, pH, temperature, and incubation time) can impact the destabilization of the cream, we have employed different statistical approaches to optimize the enzymatic and chemical demulsification of the cream.

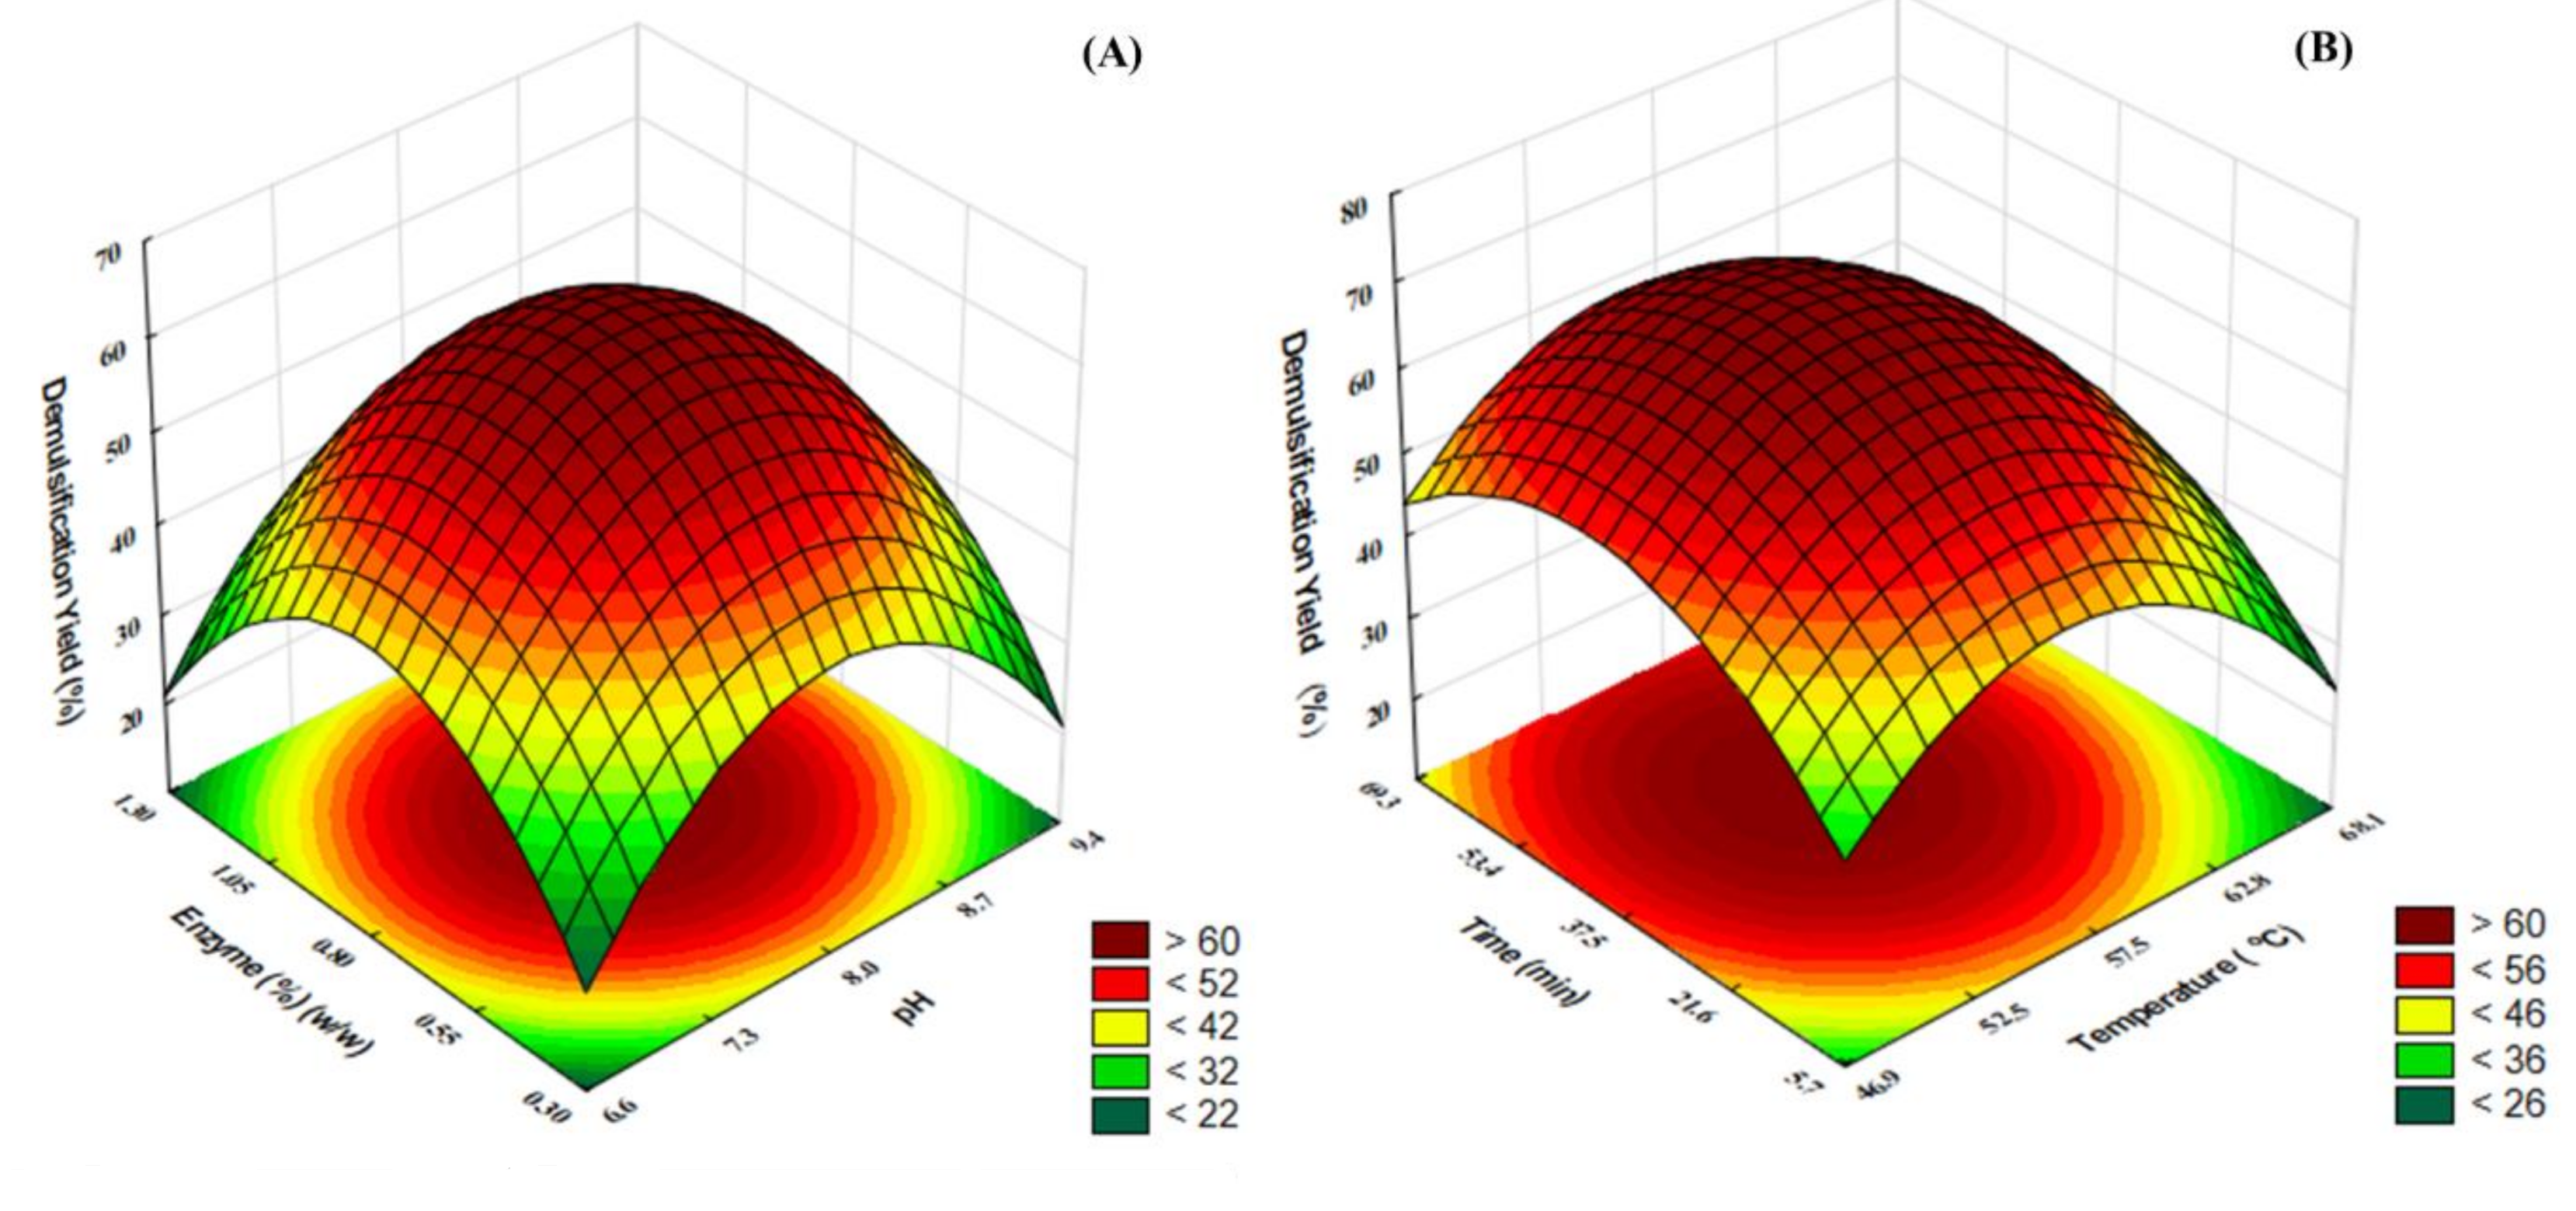
3.2.1. Enzymatic Demulsification: Tailoring Enzyme Use to Maximize Cream Demulsification Efficiency

The effects of pH, amount of enzyme, reaction time, and temperature were evaluated on the enzymatic demulsification of the cream by an FFD. Fractional factorial design matrix (24−1, with four independent variables and three repetitions in the central point) and the respective responses for each experiment are presented in Table 1. The independent variables were pH, temperature, reaction time, and amount of enzyme; the dependent variable was the cream demulsification yield. Higher free oil recoveries were observed in experiment #6 (55.6% at pH 9.0 and 50 °C), followed by experiments #4 (49.6%) and #9–10 (central points) (48.5 ± 1.2%), with free oil recovery varying from 18 to 55%. These results highlight the importance of demulsification parameters on the destabilization of the cream.
The FFD results showed that the pH had a significant and positive effect (19.96) on the demulsification yield of the cream (Table 2), indicating that higher pH values favor oil release. The observed effect is likely because enzyme activity increases when pH increases from 6 to 8, but it is slightly reduced at higher pH values such as pH 9.0. The amount of enzyme used during the demulsification had a negative effect (−15.62) on demulsification yields, indicating that increasing the amount of enzyme from 0.5 to 2.5% would reduce free oil recovery. A similar trend, where increased oil recovery was observed up to certain enzyme concentration followed by steady or decreased free oil recovery, has been reported by Jiang et al. [21]. Such behavior could be attributed to extensive hydrolysis, which might increase emulsion formation [20]. Overall, enzyme concentration depends on the composition of the cream, enzyme cost, and quality of the extracted oil [18,29,46].
Within the range evaluated, incubation time (30–90 min) and temperature (50–65 °C) did not significantly affect the cream demulsification efficiency, indicating that the temperature values and the incubation times evaluated in this study were within the optimal range for the enzyme activity. These results indicate that the destabilization of the cream could be achieved in a shorter reaction time (30 min) and at a lower temperature (50 °C), which would reduce energy costs while better preserving the quality of the extracted oil. Overall, the FFD results indicate that enzymatic destabilization of the AEP cream can be achieved by the use of a reduced amount of enzyme (<2.5%) and higher pH (>6.0).
On the basis of the significance of the effects of the variables evaluated in the FFD, a CCRD was used to optimize the reaction pH and amount of enzyme to maximize free oil recovery. Time and temperature were fixed at their lowest levels (30 min and 50 °C) as both variables did not significantly affect demulsification yields. The values of the variables with significant effects (pH and amount of enzyme) were shifted to higher (from 6.0–9.0 to 6.6–9.4 for the pH) or lower values (from 0.5–2.5% to 0.1–1.51% for the amount of enzyme) depending on the type of effect observed (i.e., positive or negative).
The CCRD showed that higher demulsification yields were obtained at the central points (experiments #5, 6, and 7: 63.1 ± 3.6%, pH 8 and 0.8% of enzyme) and the lowest yield (37.2%) was observed in experiment #8 (pH 6.6 and 0.8% of enzyme), where the lowest pH value was used (Table 3). The highest demulsification yield obtained in the CCDR was 13% higher than the maximum demulsification yield reported in the FFD, highlighting that the preliminary evaluation of the effects of the demulsification variables followed by the optimization of selected variables was a useful approach to further increase free oil recovery.
The individual and interaction effects between pH and amount of enzyme were determined by multiple regression analysis of the experimental data (Table 4). Only regression coefficients statistically significant at p < 0.05 were used in the reparameterized models. The regression model for enzymatic demulsification ( Y ED   % = 63.11 10.31 X 1 2 10.57 X 2 2 ) and the response surface (Figure 3A) indicate that free oil release is influenced by the pH (X1) and amount of enzyme (X2). The reparametrized model was able to explain 86% of the total variation between the observed and predicted values. The regression was statistically significant (Fcalculated (25.4) > Ftabulated (4.5)), whereas the F-test for lack of fit was not statistically significant (Fcalculated (1.6) < Ftablulated (19.3)) at p < 0.05 (Table S1—Supplementary Material). According to the predictive model and response surface (Figure 3A), 63% free oil recovery can be achieved by enzymatic demulsification when using pH 8.0 and 0.8% (w/w) of enzyme.

3.2.2. Chemical Demulsification: Effects of Temperature and Incubation Time on the Cream Demulsification Efficiency

A central composite rotatable design (CCRD) was used to optimize the incubation time (5.8 to 69.2 min) and the reaction temperature (46.9 to 68.1 °C) during the chemical demulsification of the cream. Table 5 shows the CCDR matrix and the respective responses to maximize chemical demulsification yields. The pH was kept at 5.0 [39] to favor protein precipitation, which could in turn minimize electrostatic repulsion between the oil droplets and increase free oil recovery. Maximum demulsification yields (67.3 ± 2.0%) were achieved in the central points (experiments #5, 6, and 7: 57.5 °C and 37.5 min), with the lowest oil recovery being observed at the axial point, experiment #10 (42.5%), where the shortest reaction time was used (5.8 min).
The individual and interaction effects between time and temperature were determined by multiple regression analysis of the experimental data (Table 4). Regression coefficients not statistically significant at p < 0.05 were disabled in the reparametrized model to a significance level of 5%. The regression model for enzymatic demulsification ( Y CD % = 67.35 3.49 X 1 9.34 X 1 2 + 3.33 X 2 7.10 X 2 2 ) and response surface (Figure 3B) show that free oil release is influenced by the linear and quadratic terms of time (X1) and temperature (X2). The reparametrized model was able to explain 94% of the total variation between the observed and predicted values. The regression was statistically significant (Fcalculated (22.1) > Ftabulated (4.3)), whereas the F-test for lack of fit was not statistically significant (Fcalculated (2.9) < Ftablulated (19.3)) at p < 0.05 (Table S2—Supplementary Material). According to the predictive model and response surface (Figure 3B), 68% free oil recovery can be achieved by chemical demulsification when using 55 °C and 46 min.
Higher temperatures can promote almond protein denaturation, leading to reduced protein solubility [47], which could help destabilize the cream emulsion. The denaturation temperature of almond proteins (globulins, albumin, and prolamins) ranges from 54 to 62 °C [20], which corresponds to the maximum demulsification yields observed in our study. Moreover, at the pH corresponding to the protein isoelectric point, electrostatic repulsion between oil droplets decreases, thus further enhancing oil droplets’ coalescence and higher free oil yield [10].

3.3. Experimental Validation of Optimum Enzymatic and Chemical Demulsification Conditions

In order to validate the optimum demulsification conditions predicted by each empirical model, optimum demulsification conditions were performed in triplicate for each demulsification strategy, and a t-test was used to evaluate if the data obtained were statistically different from the predicted value.
For the enzymatic demulsification, the experimental validation was performed at pH 8.0 and 0.8% of enzyme (optimum demulsification conditions identified by the model). Enzymatic demulsification yields of 65.77 ± 2.77% were achieved during the experimental validation, not being statistically different (p < 0.05) from the value predicted by the model (63.11%) (Table 6). These results demonstrate that the predictive model is reliable and accurate for the prediction of how pH and amount of enzyme affect the demulsification efficiency of the AEP cream. For the chemical approach, the validation was performed at optimum conditions suggested by the regression model (55 °C and 42 min), and demulsification yields of 65.53 ± 2.29% were achieved. These values were not statistically different (p < 0.05) from the predicted value (68.04%) (Table 6).
Despite the similar demulsification efficiency of chemical and enzymatic strategies (~65%), enzymatic demulsification promoted a 29% reduction in the demulsification time (from 42 into 30 min) and a reduction in the reaction temperature used (from 55 to 50 °C), which could mitigate enzyme and energy costs. Furthermore, both strategies significantly increased the demulsification yield compared with non-optimized conditions (control). The low demulsification yield achieved by the control (7.8%) (Table 6) reflects the formation of a stable cream emulsion during the AEP, which has been attributed to the presence of proteins that act as an excellent emulsifier. Our results are in agreement with those reported by Chabrand and Glatz [35], Chabrand et al. [33], Tabtabaei and Diosady [37], and Wu et al. [10], who showed that the use of enzymatic reactions leads to greater oil droplet coalescence, thus assisting with free oil release from creams produced from soybean flour, dehulled yellow mustard, and extruded soybean flakes.
Our results are also in agreement with a study by Souza et al. [29], who reported the free oil recovery from the cream produced from the aqueous extraction of almond cake. For the enzymatic strategy, the authors reported similar demulsification yields (63% in theirs vs. 65% in ours) using less enzyme during the cream demulsification (0.5% in their study vs. 0.8% in ours). However, the incubation time was three times higher than the one used in our study (90 min vs. 30 min) at the same temperature (50 °C) and slightly different pH (9.0 in theirs vs. 8.0 in ours). For the chemical approach, our results were significantly higher (65 vs. 37%), with a significant reduction in the incubation time (46 vs. 90 min) compared with those reported by the same authors using the same temperature. The observed difference could be attributed to compositional differences in both starting materials (almond cake in theirs vs. almond flour in ours) as well as to the different temperatures to which these materials were subjected to during milling and mechanical pressing. The reduced fat content in the almond cake (16 vs. 43% for the almond flour) and the reduced oil yield in the cream (10 vs. 58% for the almond flour) indicate a potential effect of matrix composition and upstream unit operations to which the material might have been subjected to on the efficiency of specific demulsification strategies. Therefore, our results highlight the importance of careful processing optimization to maximize the overall recovery of the extracted oil.

3.4. Effects of Demulsification Strategies on the Physicochemical Properties of the Cream Proteins

3.4.1. Low Molecular Weight (MW) Polypeptide Profile Characterization of the Cream Proteins by Sodium Dodecyl Sulfate-Polyacrylamide Gel Electrophoresis (SDS-PAGE)

Demulsification yields are closely related to the structure of the protein remaining in the cream. The amount and type of proteins present at the interface significantly affect the emulsion stability [20,35]. Therefore, understanding the impact of different demulsification strategies in the cream protein structure becomes necessary to better select the approach leading to higher demulsification yields.
The effects of chemical and enzymatic demulsification strategies (CD and ED) on the polypeptide profile of the cream are shown in Figure 4A. The AEP cream contains high molecular weight amandin proteins (α- and β-chain) and smaller oleosin proteins that form a multilayer interface (intact cream, Lane 2). A similar electrophoretic profile was observed for the cream proteins after chemical demulsification (Lane 3), which was expected because the chemical strategy consists of destabilizing the cream emulsion by adjusting the pH to the protein isoelectric point. Lanes 2 and 3 show that the proteins were composed of two major bands at 38–40 kDa (~22% of the lane area) and 20 kDa (~30%). The two fragments were reported as the subunits of the amandin (α- and β-subunit), which represents 70% of the almond protein [39] (Figure 4B). However, the use of enzymes to destabilize the cream resulted in complete degradation of the basic subunit of amandin (α-subunit) and a significant reduction in the acidic subunit (β-subunit) (from 30 to 12% of relative abundance) (Lane 4) (Figure 4A,B). Approximately 70% of the peptides had molecular weight smaller than 10 kDa, demonstrating that enzymatic demulsification of the cream effectively reduced the size of the interfacial proteins. The presence of short polypeptides (<10 kDa) and the reduced amount of peptides within ~15–26 kDa after enzymatic demulsification might indicate the hydrolysis of amphiphilic oleosins small proteins that prevent the oil droplets from coalescing [15,48,49]. Oleosin hydrolysis could affect the interfacial film integrity and promote the coalescence of the oil, thus explaining the reduced stability and faster oil release of the enzymatic strategy in relation to the chemical and control treatments.

3.4.2. Surface Hydrophobicity (H0) of Cream Proteins

The physicochemical properties of proteins play a key role in determining their emulsification properties [50]. Proteins from the intact cream exhibited similar surface hydrophobicity (H0) to those after chemical demulsification (1644.1 ± 79.9 vs. 1693.7 ± 122.3) (Figure 4C). However, the cream proteins after enzymatic demulsification had significantly lower surface hydrophobicity (1293.7 ± 25.3). A reduction in surface hydrophobicity after enzymatic hydrolysis has been reported for soybeans [51,52], peanuts [31,46], and lentil proteins [53], in agreement with the present study. Jung et al. [52] proposed that protein hydrolysis could promote the exposure of buried hydrophobic groups and their aggregation via hydrophobic interactions, consequently reburying them in larger aggregates, which could lead to reduced surface hydrophobicity. However, the exact mechanism of enzymatic hydrolysis on H0 remains unclear. Reduced hydrophobicity was associated with reduced emulsion stability of peanut cream protein [31]. Therefore, the reduced H0 value observed in our study after enzymatic demulsification of the cream might explain the faster destabilization of the almond cream.

3.5. Fatty Acid Composition of Almond Oil from Chemical and Enzymatic Demulsification Strategies and Solvent Extraction

The fatty acid composition of the enzymatically and chemically recovered oils and of the solvent extracted oil is reported in Table 7. Regardless of the extraction/demulsification method employed, the major fatty acids found in the almond oil were oleic (C18:1-cis, 72–74%), linoleic (C18:2, 20–22%), and palmitic acid (C16:0, 4.5–5.5%). No significant differences were observed for the fatty acid composition of the oils recovered from enzymatic and chemical demulsification and solvent extraction (Soxhlet). Stearic acid (C18:0), palmitoleic (C16:1), alpha-linolenic acid (C18:3 (n-3), and eicosanoic acid (C20:0) were detected in the lowest amounts, with no significant difference among the strategies used to recover/extract the oil. The oil composition is in accordance with that reported by Sathe et al. [54]. Our results are also in agreement with those reported by Latif and Anwar [55], where no significant difference was observed among sesame oils extracted with solvent (Soxhlet) and those obtained by the enzyme assisted aqueous extraction process. To the best of our knowledge, this is the first study to compare the fatty acid composition of almond oil obtained from different demulsification strategies.

4. Conclusions

Chemical and enzymatic demulsification strategies significantly increased the recovery of almond oil extracted by the aqueous extraction process. Although similar oil recovery (65%) was achieved by both approaches, enzymatic demulsification was accomplished in a shorter reaction time at lower temperatures, which could reduce processing costs and preserve oil quality. Enzymatic demulsification resulted in significant changes in the physicochemical properties of the cream protein. Reduced cream stability after enzymatic demulsification could be attributed to the hydrolysis of the alpha unit of amandin and reduced protein hydrophobicity. Fatty acid composition of the oils recovered by both demulsification strategies was similar to that of the hexane extracted oil. These results provide destabilization strategies for the oil-rich emulsion formed during the aqueous extraction processing of almond flour, thus contributing to the development of this environmentally friendly technology. Subsequent evaluation of the use of enzyme during the extraction is warranted to further improve the overall recovery of the extracted oil. Moreover, considering the possible effects of the enzyme on hydrolysis-induced protein unfolding provides the basis for expanding this processing approach to extract proteins from other matrices.

Supplementary Materials

The following are available online at https://0-www-mdpi-com.brum.beds.ac.uk/2227-9717/8/10/1228/s1. Table S1. Analysis of variance (ANOVA) of the estimated regression models for enzymatic cream demulsification for the AEP cream; Table S2. Analysis of variance (ANOVA) of the estimated regression models for chemical cream demulsification for the AEP cream.

Author Contributions

Conceptualization, J.M.L.N.d.M.B.; methodology, F.F.G.D., N.M.d.A., J.M.L.N.d.M.B., and A.Y.T.; software, F.F.G.D.; formal analysis, F.F.G.D. and T.S.P.d.S.; investigation F.F.G.D. and T.S.P.d.S.; resources, J.M.L.N.d.M.B.; writing—original draft preparation, F.F.G.D. and J.M.L.N.d.M.B.; writing—review and editing, F.F.G.D., A.Y.T., and J.M.L.N.d.M.B.; visualization, supervision, J.M.L.N.d.M.B.; project administration, J.M.L.N.d.M.B.; funding acquisition, J.M.L.N.d.M.B. All authors have read and agreed to the published version of the manuscript.

Funding

Funding for this project was made possible by the U.S. Department of Agriculture’s (USDA) Agricultural Marketing Service through grant AM170100XXXXG011. Its contents are solely the responsibility of the authors and do not necessarily represent the official views of the USDA.

Conflicts of Interest

The authors declare no conflict of interest.

References

  1. Almond Board of California. Economic Impact of Almond Production; Almond Board of California: Modesto, CA, USA, 2018. [Google Scholar]
  2. Mandalari, G.; Bisignano, G.; Wickham, M.S.J.; Narbad, A. Potential Prebiotic Properties of Almond (Amygdalus communis L.). Seeds 2008, 74, 4264–4270. [Google Scholar] [CrossRef] [PubMed] [Green Version]
  3. Liu, Z.; Lin, X.; Huang, G.; Zhang, W.; Rao, P.; Ni, L. Prebiotic effects of almonds and almond skins on intestinal microbiota in healthy adult humans. Anaerobe 2014, 26, 1–6. [Google Scholar] [CrossRef] [PubMed]
  4. Fasoli, E.; D’Amato, A.; Kravchuk, A.; Citterio, A.; Righetti, P.G. In-depth proteomic analysis of non-alcoholic beverages with peptide ligand libraries. I: Almond milk and orgeat syrup. J. Proteom. 2011, 74, 1080–1090. [Google Scholar] [CrossRef] [PubMed]
  5. Sathe, S.K. Solubilization, electrophoretic characterization and in vitro digestibility of almond (Prunus amygdalus) proteins. J. Food Biochem. 1993, 16, 249–264. [Google Scholar] [CrossRef]
  6. Richardson, D.P.; Astrup, A.; Cocaul, A.; Ellis, P. The nutritional and health benefits of almonds: A healthy food choice. Food Sci. Tech. Bull. Funct. Foods 2009, 6, 41–50. [Google Scholar] [CrossRef]
  7. Ahmad, Z. The uses and properties of almond oil. Complement. Ther. Clin. Pract. 2010, 16, 10–12. [Google Scholar] [CrossRef]
  8. Savoire, R.; Lanoisellé, J.-L.; Vorobiev, E. Mechanical Continuous Oil Expression from Oilseeds: A Review. Food Bioprocess Technol. 2013, 6, 1–16. [Google Scholar] [CrossRef]
  9. Johnson, L.A. Recovery of Fats and Oils from Plant and Animal Sources. In Introduction to Fats and Oils; Wan, P.J., Farr, W., Eds.; AOCS Press: Champaign, IL, USA, 2000; pp. 108–135. [Google Scholar]
  10. Wu, J.; Johnson, L.A.; Jung, S. Demulsification of oil-rich emulsion from enzyme-assisted aqueous extraction of extruded soybean flakes. Bioresour. Technol. 2009, 100, 527–533. [Google Scholar] [CrossRef]
  11. Environmental Protection Agency. 40 CFR Part 63 National Emissions Standards for Hazardous Air Pollutants: Solvent Extraction for Vegetable Oil Production, Final Rule, Federal Register; Environmental Protection Agency: Washington, DC, USA, 2001; pp. 19005–19026.
  12. de Moura, J.M.L.N.; Maurer, D.; Jung, S.; Johnson, L.A. Integrated Countercurrent Two-Stage Extraction and Cream Demulsification in Enzyme-Assisted Aqueous Extraction of Soybeans. J. Am. Oil Chem. Soc. 2011, 88, 1045–1051. [Google Scholar] [CrossRef]
  13. Jung, S.; Moura, J.M.L.N.; Campbell, K.C.; Johnson, L.A. Enzyme-assisted aqueous extraction of oilseeds. In Enhancing Extraction Processes in the Food Industry; Lebovka, N., Vorobiev, E., Chemat, F., Eds.; CRC Press: Boca Raton, FL, USA, 2011; pp. 477–518. [Google Scholar] [CrossRef]
  14. Ndlela, S.C.; Moura, J.M.L.N.; Olson, N.K.; Johnson, L.A. Aqueous Extraction of Oil and Protein from Soybeans with Subcritical Water. J. Am. Oil Chem. Soc. 2012, 89, 1145–1153. [Google Scholar] [CrossRef]
  15. Rosenthal, A.; Pyle, D.L.; Niranjan, K. Aqueous and enzymatic processes for edible oil extraction. J. Am. Oil Chem. Soc. 1996, 19, 402–420. [Google Scholar] [CrossRef]
  16. Campbell, K.A.; Glatz, C.E.; Johnson, L.A.; Jung, S.; Moura, J.M.N.; Kapchie, V.; Murphy, P. Advances in Aqueous Extraction Processing of Soybeans. J. Am. Oil Chem. Soc. 2011, 88, 449–465. [Google Scholar] [CrossRef]
  17. Balvardi, M.; Rezaei, K.; Mendiola, J.A.; Ibáñez, E. Optimization of the Aqueous Enzymatic Extraction of Oil from Iranian Wild Almond. J. Am. Oil Chem. Soc. 2015, 92, 985–992. [Google Scholar] [CrossRef]
  18. Yusoff, M.M.; Gordon, M.H.; Niranjan, K. Aqueous enzyme assisted oil extraction from oilseeds and emulsion de-emulsifying methods: A review. Trends Food Sci. Technol. 2015, 41, 60–82. [Google Scholar] [CrossRef]
  19. Almeida, N.M.; Moura Bell, J.M.L.N.; Johnson, L.A. Properties of Soy Protein Produced by Countercurrent, Two-Stage, Enzyme-Assisted Aqueous Extraction. J. Am. Oil Chem. Soc. 2014, 91, 1077–1085. [Google Scholar] [CrossRef]
  20. Li, P.; Zhang, W.; Han, X.; Liu, J.; Liu, Y.; Gasmalla, M.A.A.; Yang, R. Demulsification of oil-rich emulsion and characterization of protein hydrolysates from peanut cream emulsion of aqueous extraction processing. J. Food Eng. 2017, 204, 64–72. [Google Scholar] [CrossRef]
  21. Jiang, L.; Hua, D.; Wang, Z.; Xu, S. Aqueous enzymatic extraction of peanut oil and protein hydrolysates. Food Bioprod. Process. 2010, 88, 233–238. [Google Scholar] [CrossRef]
  22. Dev, D.K.; Quensel, E. Preparation and Functional Properties of Linseed Protein Products Containing Differing Levels of Mucilage. J. Food Sci. 1988, 53, 1834–1837. [Google Scholar] [CrossRef]
  23. Tirgar, M.; Silcock, P.; Carne, A.; Birch, E.J. Effect of extraction method on functional properties of flaxseed protein concentrates. Food Chem. 2017, 215, 417–424. [Google Scholar] [CrossRef]
  24. Aliakbarian, B.; De Faveri, D.; Converti, A.; Perego, P. Optimisation of olive oil extraction by means of enzyme processing aids using response surface methodology. Biochem. Eng. J. 2008, 42, 34–40. [Google Scholar] [CrossRef]
  25. Najafian, L.; Ghodsvali, A.; Haddad Khodaparast, M.H.; Diosady, L.L. Aqueous extraction of virgin olive oil using industrial enzymes. Food Res. Int. 2009, 42, 171–175. [Google Scholar] [CrossRef]
  26. Moreau, R.A.; Dickey, L.C.; Johnston, D.B.; Hicks, K.B. A Process for the Aqueous Enzymatic Extraction of Corn Oil from Dry Milled Corn Germ and Enzymatic Wet Milled Corn Germ (E-Germ). J. Am. Oil Chem. Soc. 2009, 86, 469–474. [Google Scholar] [CrossRef]
  27. Moreau, R.A.; Johnston, D.B.; Powell, M.J.; Hicks, K.B. A comparison of commercial enzymes for the aqueous enzymatic extraction of corn oil from corn germ. J. Am. Oil Chem. Soc. 2004, 81, 1071–1075. [Google Scholar] [CrossRef]
  28. Almeida, N.M.; Dias, F.F.G.; Rodrigues, M.I.; de Moura Bell, J.M.L.N. Effects of Processing Conditions on the Simultaneous Extraction and Distribution of Oil and Protein from Almond Flour. Processes 2019, 7, 844. [Google Scholar] [CrossRef] [Green Version]
  29. Souza, T.S.P.; Dias, F.F.G.; Koblitz, M.G.B.; de Moura Bell, J.M.L.N. Effects of enzymatic extraction of oil and protein from almond cake on the physicochemical and functional properties of protein extracts. Food Bioprod. Process. 2020, 122, 280–290. [Google Scholar] [CrossRef]
  30. Souza, T.S.P.; Dias, F.F.G.; Koblitz, M.G.B.; de Moura Bell, J.M.L.N. Aqueous and Enzymatic Extraction of Oil and Protein from Almond Cake: A Comparative Study. Processes 2019, 7, 472. [Google Scholar] [CrossRef] [Green Version]
  31. Li, P.; Gasmalla, M.A.A.; Liu, J.; Zhang, W.; Yang, R.; Aboagarib, E.A.A. Characterization and demusification of cream emulsion from aqueous extraction of peanut. J. Food Eng. 2016, 185, 62–71. [Google Scholar] [CrossRef]
  32. Moura, J.M.L.N.; Almeida, N.M.; Johnson, L.A. Scale-up of Enzyme-Assisted Aqueous Extraction Processing of Soybeans. J. Am. Oil Chem. Soc. 2009, 86, 809–815. [Google Scholar] [CrossRef]
  33. Chabrand, R.M.; Kim, H.J.; Zhang, C.; Glatz, C.E.; Jung, S. Destabilization of the emulsion formed during aqueous extraction of Soybean oil. J. Am. Oil Chem. Soc. 2008, 85, 383–390. [Google Scholar] [CrossRef]
  34. Damodaran, S.; Anand, K. Sulfhydryl−Disulfide Interchange-Induced Interparticle Protein Polymerization in Whey Protein-Stabilized Emulsions and Its Relation to Emulsion Stability. J. Agric. Food Chem. 1997, 45, 3813–3820. [Google Scholar] [CrossRef]
  35. Chabrand, R.M.; Glatz, C.E. Destabilization of the emulsion formed during the enzyme-assisted aqueous extraction of oil from soybean flour. Enzym. Microb. Technol. 2009, 45, 28–35. [Google Scholar] [CrossRef]
  36. Moura, J.M.L.N.; Campbell, K.; Mahfuz, A.; Jung, S.; Glatz, C.E.; Johnson, L. Enzyme-Assisted Aqueous Extraction of Oil and Protein from Soybeans and Cream De-emulsification. J. Am. Oil Chem. Soc. 2008, 85, 985–995. [Google Scholar] [CrossRef]
  37. Tabtabaei, S.; Diosady, L.L. Aqueous and enzymatic extraction processes for the production of food-grade proteins and industrial oil from dehulled yellow mustard flour. Food Res. Int. 2013, 52, 547–556. [Google Scholar] [CrossRef]
  38. de Aquino, D.S.; Fanhani, A.; Stevanato, N.; da Silva, C. Sunflower oil from enzymatic aqueous extraction process: Maximization of free oil yield and oil characterization. J. Food Process Eng. 2019, 42, e13169. [Google Scholar] [CrossRef]
  39. Sathe, S.K.; Wolf, W.J.; Roux, K.H.; Teuber, S.S.; Venkatachalam, M.; Sze-Tao, K.W.C. Biochemical Characterization of Amandin, the Major Storage Protein in Almond (Prunus dulcis L.). J. Agric. Food Chem. 2002, 50, 4333–4341. [Google Scholar] [CrossRef]
  40. Laemmli, U.K. Cleavage of structural proteins during the assembly of the head of bacteriophage T4. Nature 1970, 227, 680–685. [Google Scholar] [CrossRef]
  41. Zhang, Y.; Zhao, W.; Yang, R.; Ahmed, M.A.; Hua, X.; Zhang, W.; Zhang, Y. Preparation and functional properties of protein from heat-denatured soybean meal assisted by steam flash-explosion with dilute acid soaking. J. Food Process Eng. 2013, 119, 56–64. [Google Scholar] [CrossRef] [Green Version]
  42. American Oil Chemists’ Society AOCS Standard Procedure Am 5-04. Rapid Determination of Oil/Fat Utilizing High-Temperature Solvent Extraction. In Official Methods and Recommended Practices of AOCS; American Oil Chemists’ Society: Urbana, IL, USA, 2017. [Google Scholar]
  43. Association of Official Analytical Chemists. Official Method 922.06 Fat in Flour. Acid Hydrolysis Method. In Official Methods of Analysis of AOAC International; Association of Official Analytical Chemists: Rockville, MD, USA, 2012. [Google Scholar]
  44. AACC Approved Methods of Analysis, 11th Edition—AACC Method 44-40.01, Moisture—Modified Vacuum-Oven Method. Available online: http://methods.aaccnet.org/summaries/44-40-01.aspx (accessed on 6 August 2020).
  45. Jung, S. Aqueous extraction of oil and protein from soybean and lupin: A comparative study. Food Process. Preserv. 2009, 33, 547–559. [Google Scholar] [CrossRef]
  46. Zhang, S.B.; Lu, Q.Y. Characterizing the structural and surface properties of proteins isolated before and after enzymatic demulsification of the aqueous extract emulsion of peanut seeds. Food Hydrocoll. 2015, 47, 51–60. [Google Scholar] [CrossRef]
  47. Kinsella, J.E. Functional properties of soy proteins. J. Am. Oil Chem. Soc. 1979, 56, 242–258. [Google Scholar] [CrossRef]
  48. Huang, A.H.C. Oil bodies and oleosins in seeds. Annu. Rev. Plant Physiol. Plant Mol. Biol. 1992, 43, 177–200. [Google Scholar] [CrossRef]
  49. Beisson, F.; Ferté, N.; Voultoury, R.; Arondel, V. Large scale purification of an almond oleosin using an organic solvent procedure. Plant Physiol. Biochem. 2001, 39, 623–630. [Google Scholar] [CrossRef]
  50. Ghribi, A.M.; Gafsi, I.M.; Sila, A.; Blecker, C.; Danthine, S.; Attia, H.; Bougatef, A.; Besbes, S. Effects of enzymatic hydrolysis on conformational and functional properties of chickpea protein isolate. Food Chem. 2015, 187, 322–330. [Google Scholar] [CrossRef] [PubMed]
  51. Surówka, K.; Zmudziński, D.; Surówka, J. Enzymatic modification of extruded soy protein concentrates as a method of obtaining new functional food components. Trends Food Sci. Technol. 2004, 15, 153–160. [Google Scholar] [CrossRef]
  52. Jung, S.; Murphy, P.A.; Johnson, L.A. Physicochemical and Functional Properties of Soy Protein Substrates Modified by Low Levels of Protease Hydrolysis. J. Food Sci. 2005, 70, C180–C187. [Google Scholar] [CrossRef]
  53. Avramenko, N.A.; Low, N.H.; Nickerson, M.T. The effects of limited enzymatic hydrolysis on the physicochemical and emulsifying properties of a lentil protein isolate. Food Res. Int. 2013, 51, 162–169. [Google Scholar] [CrossRef]
  54. Sathe, S.K.; Seeram, N.P.; Kshirsagar, H.H.; Heber, D.; Lapsley, K.A. Fatty acid composition of California grown almonds. J. Food Sci. 2008, 73. [Google Scholar] [CrossRef]
  55. Latif, S.; Anwar, F. Aqueous enzymatic sesame oil and protein extraction. Food Chem. 2011, 125, 679–684. [Google Scholar] [CrossRef]
Figure 1. Process flow diagram for the aqueous extraction process (AEP) of almond flour and demulsification (ED: enzymatic demulsification and CD: chemical demulsification) strategies to recover the oil from the cream emulsion. SLR, solids-to-liquid ratio; SDS-PAGE, sodium dodecyl sulfate-polyacrylamide gel electrophoresis.
Processes 08 01228 g001
Figure 2. Extraction yields and distribution of oil (A) and protein (B) among the fractions generated (cream, insoluble, and skim) by the aqueous extraction process of almond flour. Different letters indicate a significant difference between extraction yields among the fractions within each compound (oil and protein) by the Tukey’s test (p < 0.05).
Processes 08 01228 g002
Figure 3. Response surface plot for the (A) enzymatic and (B) chemical demulsification of the AEP cream.
Processes 08 01228 g003
Figure 4. sodium dodecyl sulfate-polyacrylamide gel electrophoresis (SDS-PAGE) of cream proteins (A), Lane 1: molecular weight standard (10–250 kDa), Lane 2: intact cream (IC) protein, Lane 3: chemically demulsified (CD) cream protein, and Lane 4: enzymatically demulsified (ED) cream protein; molecular weight distribution and relative abundance of the cream proteins (B); protein surface hydrophobicity (H0) of the cream proteins (C). Different letters indicate a significant difference (p < 0.05) among the samples.
Processes 08 01228 g004
Table 1. Effects of pH, temperature, reaction time, and amount of enzyme on cream demulsification yield using a fractional factorial design.
ExperimentsExperimental ParametersDemulsification Yield (%)
X1 (pH)X2 (T, °C)X3 (t, min)X4 (E, %)
1−1 (6.0)−1 (50.0)−1 (30)−1 (0.5)18.6
21 (9.0)−1 (50.0)−1 (30)1 (2.5)20.4
3−1 (6.0)1 (65.0)−1 (30)1 (2.5)17.8
41 (9.0)1 (65.0)−1 (30)−1 (0.5)49.6
5−1 (6.0)−1 (50.0)1 (90)1 (2.5)19.2
61 (9.0)−1 (50.0)1 (90)−1 (0.5)55.6
7−1 (6.0)1 (65.0)1 (90)−1 (0.5)24.3
81 (9.0)1 (65.0)1 (90)1 (2.5)31.2
90 (7.5)0 (57.5)0 (60)0 (1.5)47.4
100 (7.5)0 (57.5)0 (60)0 (1.5)49.8
110 (7.5)0 (57.5)0 (60)0 (1.5)48.4
pH is the pH of the cream, T is the temperature (°C), t is incubation time (min), and E is the amount of enzyme added in the cream (%, weight of enzyme/weight of the cream emulsion). Fractional factorial design matrix (24−1, with four independent variables and three repetitions in the central point).
Table 2. Estimated effects of pH, temperature, incubation time, and amount of enzyme on the enzymatic demulsification yield of the cream emulsion.
Variables *Effectp-Value
pH (X1)19.960.02
Temperature (°C) (X2)1.520.80
Time (min) (X3)6.750.30
Enzyme (%) (w/w) (X4)−15.620.05
* R2 = 0.86.
Table 3. Effects of pH and amount of enzyme on the enzymatic demulsification of the cream.
ExperimentsExperimental ParametersDemulsification Yield (%)
X1 (pH)X2 (E, %)
1−1 (7.0)−1 (0.3)50.0
21 (9.0)−1 (0.3)40.4
3−1 (7.0)1 (1.3)39.0
41 (9.0)1 (1.3)42.6
50 (8.0)0 (0.8)60.2
60 (8.0)0 (0.8)62.1
70 (8.0)0 (0.8)67.1
8−α * (6.6)0 (0.8)37.2
9α (9.4)0 (0.8)46.2
100 (8.0)−α (0.1)42.9
110 (8.0)α (1.5)39.5
pH is the pH of the cream, and E is the enzyme amount added in the cream (%, weight of enzyme/weight of the cream emulsion). * Central composite rotatable design (22, with two independent variables, three repetitions in the central point and four axial points), α = 1.4142.
Table 4. Analysis of variance (ANOVA) including models, R2, and probability for the final reduced models for the chemical and enzymatic cream demulsification.
ResponseEquationF-TestR2p-Value
ED Y ED   % = 63.11 10.31 X 1 2 10.57 X 2 2 5.640.86390.00034
CD Y CD % = 67.35 3.49 X 1 9.34 X 1 2 + 3.33 X 2 7.10 X 2 2 5.140.93680.00096
ED: enzymatic demulsification; YED is the dependent variable, enzymatic demulsification yield (%); CD: chemical demulsification; YCD is the dependent variable, chemical demulsification yield (%); X1 and X2 are the independent variables (pH, and amount of enzyme for the ED and temperature and time for the CD).
Table 5. Effects of reaction time and temperature on chemical demulsification of the cream.
ExperimentsExperimental ParametersDemulsification Yield (%)
X1 (T, °C)X2 (t, min)
1−1 (50.0)−1 (15.0)49.9
21 (65.5)−1 (15.0)47.7
3−1 (50.0)1 (60.0)59.0
41 (65.5)1 (60.0)46.2
50 (57.5)0 (37.5)67.4
60 (57.5)0 (37.5)69.3
70 (57.5)0 (37.5)65.3
8−α* (46.96)0 (37.5)53.7
9α (68.1)0 (37.5)43.9
100 (57.5)−α (5.8)42.5
110 (57.5)α (69.2)57.9
T is the temperature and t is the incubation time. * Central composite rotatable design (22, with two independent variables, three repetitions in the central point and four axial points), α = 1.4142.
Table 6. Experimental validation of optimum enzymatic and chemical demulsification conditions.
TreatmentExperimental ConditionsDemulsification Yield (%)
Predicted *Experimental Validation **
ChemicalpH 5.0, 55 °C, 46 min, no enzyme68.14 a65.53 ± 2.29 a,A
EnzymaticpH 8.0, 50 °C, 30 min, 0.8% (w/w) of enzyme63.11 a65.77 ± 2.77 a,A
ControlpH 9.0, 50 °C, 60 min, no enzyme-7.85 ± 0.51 B
* Predicted value by the regression model. ** Result presented as the mean (n = 3) ± SD, different lower letters in the same row indicate a significant difference between the predicted vs. observed value and different capital letters within the column indicate a significant difference among the demulsification treatments (p < 0.05).
Table 7. Fatty acid composition (%) of almond oil recovered from chemical and enzymatic demulsification strategies.
Fatty Acid (%, w/w *)Enzymatic DemulsificationChemical DemulsificationSolvent Extraction
C16:05.01 ± 0.45.50 ± 0.544.58 ± 0.36
C16:10.24 ± 0.020.28 ± 0.050.20 ± 0.04
C18:00.42 ± 0.070.46 ± 0.060.45 ± 0.04
C18:1 (cis)71.73 ± 1.0372.85 ± 1.3874.37 ± 2.12
C18:2 (n-6)22.55 ± 0.6020.86 ± 1.8020.33 ± 1.75
C18:3 (n-3)0.03 ± 0.0010.02 ± 0.0010.05 ± 0.002
C20:00.03 ± 0.0020.03 ± 0.0010.02 ± 0.001
* Relative percentage of the total fatty acid groups. The absence of letters indicates no statistical difference (p < 0.05) in the row for each fatty acid analyzed.

