Article

Performance Evaluation for a Sustainable Supply Chain Management System in the Automotive Industry Using Artificial Intelligence

Industrial Machines and Equipment Department, Faculty of Engineering, “Lucian Blaga” University of Sibiu, 550025 Sibiu, Romania
*
Author to whom correspondence should be addressed.
Processes 2020, 8(11), 1384; https://doi.org/10.3390/pr8111384
Submission received: 24 September 2020 / Revised: 20 October 2020 / Accepted: 28 October 2020 / Published: 30 October 2020

Abstract

:
Increasing the sustainability of a system can be achieved by evaluating the system, identifying the issues and their root cause and solving them. Performance evaluation translates into key performance indicators (KPIs) with a high impact on increasing overall efficacy and efficiency. As the pool of KPIs has increased over time in the context of evaluating the supply chain management (SCM) system’s performance and assessing, communicating and managing its risks, a mathematical model based on neural networks has been developed. The SCM system has been structured into subsystems with the most relevant KPIs for set subsystems and their most important contributions on the increase in the overall SCM system performance and sustainability. As a result of the performed research based on the interview method, the five most relevant KPIs of each SCM subsystem and the most relevant problems are underlined. The main goal of this paper is to develop a performance evaluation model that links specific problems with the most relevant KPIs for every subsystem of the supply chain management. This paper demonstrates that by using data mining, the relationship between certain problems that appear in the supply chain management of every company and specific KPIs can be identified. The paper concludes with a graphical user interface (GUI) based on neural networks using the multilayer perceptron artificial intelligence algorithm where the most trustworthy KPIs for each selected problem can be predicted. This aspect provides a highly innovative contribution in solving supply chain management problems provided by organizations by allowing them to holistically track, communicate, analyze and improve the SCM system and ensure overall system sustainability.

1. Introduction

The subject of supply chain management has been subdued to many transformations, being in constant adjustment to changes due to globalization in the world economy and an increasing level of competition. It is no longer a secret that a sustainable and performing supply chain management system has a compelling impact in achieving a competitive edge on the market and organizations recognize this aspect. Thus, supply chains within organizations have become more fluid and corporations are looking to constantly fine-tune their adjustments in supply and demand for the products they deal with [1,2,3].
For companies to obtain a competitive advantage on the market and to ensure their sustainability both financial and growth-wise, there is a need to compensate different concepts from various domains, such as quality management, knowledge management, performance management, project management and data visualization [4,5,6].
Supply chain management is defined as the management of the organizations’ network involved in providing products and services required by end users. It covers everything concerning raw materials and ingredients until the consumption [7].
In supply chains, identifying, evaluating and monitoring risks represent key aspects that can reduce the vulnerability and increase the resilience of the supply chain, ensuring efficiency and sustainability. Risks refer to any threat of supply chains operations’ interruption and can be classified as operational, demand, supply or disruption risks [8,9,10].
Sustainability represents the key element in order to satisfy human necessities and to carry out human aims. It should fulfill the needs of the present generation without affecting the capability of upcoming generations [11]. Sustainability has become a priority in the automotive industry, with a high focus on zero-emissions vehicles (electric) and carbon-neutral manufacturing. Organizations have developed a sustainability strategy to meet global requirements [12]. The supply chain management system is also undergoing constant change. By implementing the proposed solution, organizations can better identify which key performance indicators (KPIs) should be monitored based on their identified issues. This allows organizations to better achieve their objectives and, in return, contribute to the sustainability strategy of the organization.
The supply chain management system represents the entire flow of goods from the supplier to the producer and to the end consumer, from raw material to finished product, taking into consideration all transformations [13,14]. It includes all inter-company information, product and financial flows, taking into consideration potential operational and financial risks in each supply chain, synchronizing financial flows with information and product flows within supply chains [15,16,17,18]. The supply chain management (SCM) system can be defined as an integrated, strategic coordination of the organization’s functions, processes and transactions within the supply chain, with an overall goal of improving long-term performance and gaining a competitive edge on the market [19,20,21,22].
This flow begins with the flow between several suppliers, the company being influenced also by the suppliers’ supplier, taking into consideration potential delays or quality issues [23,24,25].
In the transformation process, SCM subsystems have been identified, such as demand management, supplier management, contract management, product development, procurement/purchasing, warehouse/inventory management, production management and distribution management [26].
The undertaken research highlights the fact that the supply chain management definition should be completed by intercalating some of the above presented definitions so that supply chain management can be defined also as the management of all organizations’ functions, processes and transactions, from the flow and transformation of goods from the raw materials stage to the end user; that includes all suppliers, warehouses and customers, distribution centers and production capacities, together with raw material, stock of semi-finished and finished products, all key performance indicators and other performance evaluation methods that assure the increase of supply chain management performance and the gain of competitive edge on the market, all resources and information involved in customer satisfaction to provide products and services based on customer requirements with regard to value, cost and time.
In order to evaluate the supply chain management performance, key performance indicators can be used to monitor every SCM subsystem, identify potential risks, perform economic risk assessment and risk communication through visualizations and perform risk management by eliminating those risks, with a high impact on increasing the overall efficacy and efficiency.
Taking into consideration the specialty literature in the field concerned, it has been found that it treats, in general, subjects such as supplier performance, suppliers’ selection and evaluation, suppliers’ development, performance management or supply chain management in general and does not focus on the evaluation of performance within the supply chain management system. Certain issues, such as the lack of performance indicators in the field of supply chain, are caused by an unclearly defined performance evaluation, a lack of standardization of KPIs and a lack of competent personnel.
This leads to identifying the most important gap in the specialty literature concerned, namely a poor evaluation of the supply chain management performance that can cause main problems in the supply chain management and can lead to customer complaints and inefficient warehouses and production management that can lead to performance and productivity decreases and competitive loss in front of other companies.
Following the vast bibliographical research, the necessity, actuality, utility and importance of approaching this research field is highlighted through the existence of certain gaps concerning the specialty literature in the concerned field, such as poor development of correlation studies between KPIs and performance evaluation methods and supply chain management; the need to develop a supply chain management performance method that highlights the most relevant KPIs of each SCM subsystem and links them to certain problems; the need to link the most relevant SCM KPIs to specific problems with the purpose of preventing certain problems and to increase the overall supply chain management performance within organizations; the need to develop the specialty literature concerning complex performance evaluation methods within supply chain management; the need to increase awareness in regards to performance evaluation methods based on SCM KPIs in companies.
After an intensive analysis based on bibliographic research but also on own experience, 25 key performance indicators for each of these nine subsystems have been identified. KPIs should not be set without an organizational specific objective that impacts the organization’s main objective and long-term strategy. The implementation of certain KPIs characteristic for each SCM subsystem has a vast impact on the overall supply chain management performance, helping to prevent specific problems that can appear and provide better economic risk assessment, identify potential risks, mitigate those risks, improve risk communication, help to increase planning accuracy and ensure the sustainability of the system as a whole. Preventive risk communication has a direct economic impact on the organization as it allows for anticipatory measures which reduce future costs and the impact of not dealing with a potential risk [27,28,29,30,31].
Following the need to select the most relevant KPIs for every specified subsystem of the supply chain management, based on previous research constructed on the interview guide method, the most relevant KPIs that influence each SCM subsystem with a positive impact also in the overall supply chain management performance have been pointed out. Every respondent selected the top five significant KPIs for every supply chain management subsystem and the top reported problems in every SCM subsystem. The relationship between specific identified problems and selected KPIs is pointed out and validated through the research [32,33].
The real-life applicability proposed in this research is of high impact for organizations in the automotive industry but not limited to it, as it allows users to have direct access to a mathematically proven method based on an artificial intelligence algorithm. The proposed model takes real-life and business-like generated issues and links them to trackable key performance indicators, allowing any business to generate empowering decisions to increase the sustainability of the holistic SCM system.
Based on the input selection of the identified issues from each subsystems’ manager, the organization can identify discrepancies in the implemented global strategy and how it impacts its implementation on a departmental level. Extrapolating from the identified and reported issues from various subsystems, the organization can clearly determine whether or not the global strategy has been correctly waterfalled into feasible departmental objectives and, most importantly, if set subsystem objectives are in conflict between subsystems.
Given the above-mentioned aspects, the paper is structured in four parts. In the Materials and Methods section, the research methodology and techniques are presented. The data mining technique, the multilayer perceptron algorithm and the Python script are described. The second part of the work presents the results of the research by highlighting the top five recommended KPIs and main existing problems within every supply chain management subsystem, presenting the Python script through which input values are coded and selected for processing. The research results are presented by means of the elaborated mathematical model of the neural network using the multilayer perceptron algorithm (MLP). The third part of the paper includes the Discussion, where the novelty of the paper in relation with the specialty literature is presented. The last section is the Conclusion section, where a general synthesis is presented and the overall own contributions and future research directions are highlighted.

2. Materials and Methods

The research is designed into separate steps following a logical structure split into main steps. These start by researching the existing specialty literature on the subject based on qualitative research from primary and secondary sources. Analyzing the literature, some gaps were identified and a model of dividing the supply chain management system into subsystems is proposed to fill in these gaps.
To support and validate the proposed model, an initial top-25 most relevant KPIs have been selected based on literature review. The method of the interview guide has been used, through which 12 international automotive companies have been analyzed, with the purpose of identifying the most-reported issues the organizations face and to determine the 5 most relevant KPIs for each SCM subsystem. Based on the gathered data, the link between the reported issues and the relevant KPIs to monitor these issue were identified. A graphical user interface (GUI) was created, which converts the input data into digestible 1 s and 0 s required by the multilayer perceptron (MLP) algorithm. With the use of data mining and the MLP algorithm, a list with the most suitable KPIs to be used by an organization is generated, with a trust level learned by the MLP algorithm from the provided data. Considering all these steps, it was made possible to develop a performance evaluation model for the holistic supply chain management system encompassing the nine subsystems, which provides a clear link between the input issues provided by the user via the GUI and the output KPIs provided by the MLP algorithm via data mining and artificial learning. The materials and methods used to analyze and interpret the gathered data are data mining and the multilayer perceptron algorithm. The input values have been written using Python. The logical scheme of the research methodology has been represented in Figure 1.

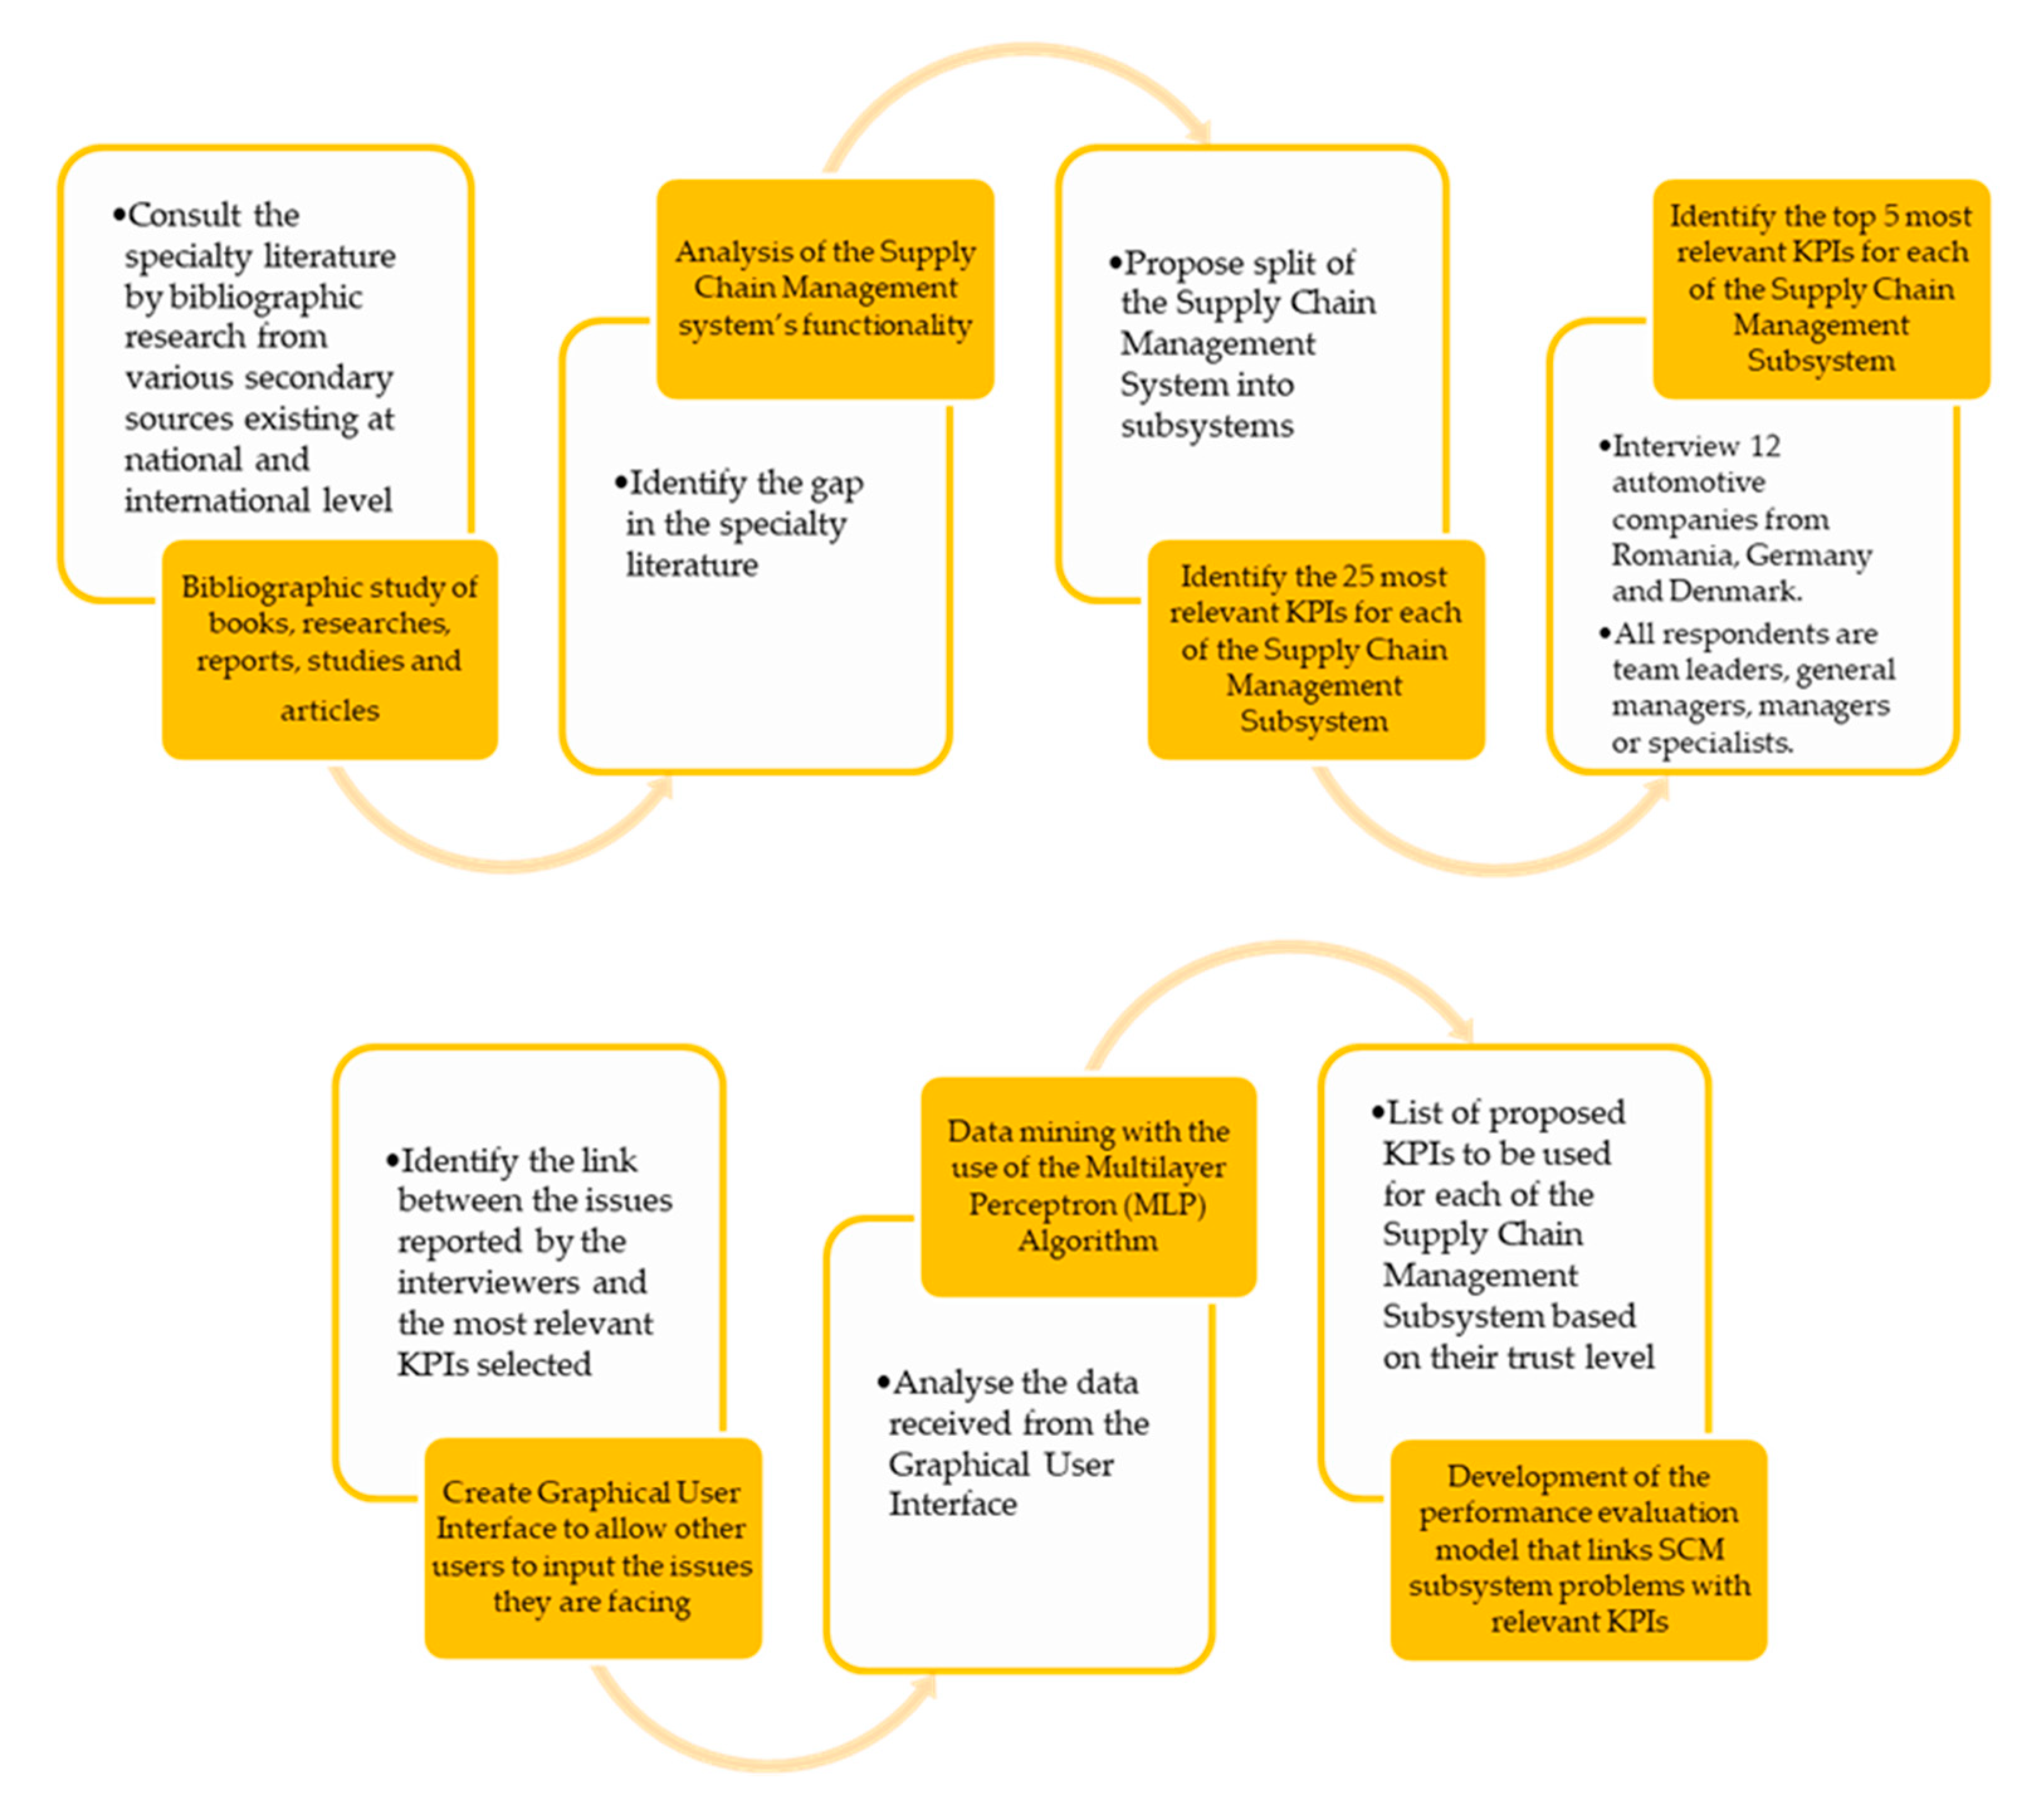
2.1. Research Methodology

The entire supply chain management process includes various functions, such as purchasing, R&D, quality, logistics, production, performance management, marketing, human resources, finance, IT, project management and ESH (Environment, Safety and Health). In order to ensure a good functioning of the production, the relationship with suppliers, the transportation conditions, payment conditions, quality of goods, packaging, delivery terms and delivery time are some of the key aspects. Human resources, technological resources (IT), physical resources and financial resources represent key roles. In order to ensure a good function of the system, a performing project management is also required. Taking into consideration the market placement and the publicity, marketing carries also an important role in the entire supply chain management system. Energy, safety and health issues also have significant importance on order to assure the sustainability of the organization [34,35].
The main goal of this paper is to develop a performance evaluation model that links certain problems that appear in each supply chain management subsystem with the most relevant KPIs for every specified subsystem of the supply chain management.
By developing a performance evaluation method and disseminating this in various studies and articles, the specialty literature of the field concerned can be improved with high contributions in filling in the observed gaps.
The performance evaluation model developed would predict which KPI should be used following the identified problems within the organization. Moreover, for a better economic risk assessment, KPIs can be linked to outside imposed issues, such as market prices, minimum wage, taxes, duty rates or material costs. Underlying the significance of supply chain management, key performance indicators on specific supply chain management subsystems point out an important impact on the overall efficiency and efficacy. The relationship between specific problems that appear in the supply chain management of every company and certain KPIs has to be validated through a mathematical model by means of a multilayer perceptron artificial intelligence algorithm. Identified specific issues, which international organizations from the automotive industry face in each SCM subsystem, can be linked to specific KPIs predicted by an artificial intelligence algorithm.
Monitoring how planning and execution are synchronized is an important fact when it comes to the implementation of the SCM performance evaluation method [36].
The paper is based on the hypothesis that every KPI is linked to a specific problem in the supply chain management system and that the main problems of the specific subsystems of the supply chain management system can be solved by implementing the right KPIs and setting the right objectives, hypotheses that are demonstrated throughout the research.
Research methodology data are gathered by means of the interview guide method and analyzed through univariate and bivariate analysis. Using data mining, specific relations have been highlighted and certain information has been extracted. By means of neural networks applying the multilayer perceptron algorithm, predicted neurons with a learning mechanism are pointed out—neurons that can be trained to a specific output based on certain input values. The input values for the neural network are provided using the programming language Python.
With the help of the multilayer perceptron algorithm, it can be predicted which KPI should be used following the identified problems within the organization, an aspect that increases the overall supply chain management performance and sustainability of a company.

2.1.1. Data Mining Description

Sets of data of large dimensions can be analyzed using data mining. Specific relations can be found or summarized by extracting information or knowledge in order to simplify them and to increase their utilization rate [37,38]. Data mining represents an extraction of useful information hidden in large sets of data, unknown, important and imaginable [39,40].
Through data mining, interesting patterns and knowledge can be discovered from large sets of data. These data can include data warehouses, specific databases or other information. Taking into consideration data mining as a general technology, it can be applied to any kind of data, considering the fact that the specific form of data is meaningful for a targeted application. Database data, data warehouse data or transactional data represent the most basic forms of data concerning data mining applications. Other data, such as graph or networked data, spatial data, text data, data streams, multimedia data or sequence data, can be analyzed by means of data mining [37,41].
Data mining represents the knowledge extraction of data or the discovery of knowledge from a large volume of data. It consists of the discovery process of interesting knowledge from a large amount of data memorized rather in data warehouses or information stores than in simple databases. The discovery process of knowledge from databases is characterized by pre-processing data, data mining, evaluation of the extracted models and knowledge representation. Pre-processing data is of high importance concerning the knowledge discovery process [42,43]. Its objective is to prepare the data for analysis following certain steps, such as data clean-up, data integration and data selection, transformation and reduction. In regards to data mining, artificial intelligence methods are applied with the purpose of rules extraction [44,45]. The rules extraction consists of finding frequent attributes crowds that should satisfy the minimum trust level. Prediction and classification represent supervised data analysis forms that can be used for the extraction of important models that describe data sets or prognose future trends of data, a very important aspect concerning the data analysis process [46,47,48].

2.1.2. Multilayer Perceptron Algorithm Description

Neural networks are learning machines based on a large number of connected neurons in a layered manner [49]. Artificial neural networks attempt to imitate the functionality of a human brain. Analogous to a human brain, an artificial neural network is made up of neurons [50,51]. A perceptron value is based on a vector, characterized by real-valued inputs. A linear combination within these inputs is calculated. The perceptron outputs a 1 value if the result is higher than the threshold value and −1 if not. Taking into consideration the given inputs x1 through xn, the output o (x1,…, xn) is generated:
o(x_1,…,x_n) = {1 if w_0 + w_1 x_1 + w_2 x_2 +…+ w_n x_n > 0
−1 otherwise
The multilayer perceptron model is also a neural network that treats the neuron functions as simple devices whose inputs are weighted. Wi represents a real-valued weight that influences and characterizes the contribution of the Xi input to the o perceptron output. The weighted input combination of w1x1 +…+ wnxn must surpass the −w0 threshold quantity in order to output the 1 value [52].
Positive weights are excitatory and negative weights are inhibitory. If the total weighted sum of inputs exceeds a threshold (excitation), then the neuron is activated and outputs an output signal. In the case that the total excitation is less than the threshold value, the neuron is not activated and its output is considered to be zero [45].
The multilayer perceptron represents the most popular neural network architecture. Every neuron is characterized by the connection to all neurons from the previous layer [53,54]. The multilayer perceptron is a predicted neuron with a learning mechanism, characterized by its synaptic weightings, depending on the desired behavior wishing to confer on it [55].
In a multilayer perceptron algorithm, hidden neurons can be represented by network nodes in which input information can be viewed as an internal format, through which maximum simplification of the neurons’ processing tasks is transposed to the output layer [56].
The formation of an internal representation of the input and output information is ensured by the hidden layout that is based on the learning or training of the neural network [55,57,58,59,60,61].
The first layer of the multilayer perceptron contains virtual neurons that do not accomplish signal processing. They perform only multiplexing, the actual processing taking place only in the intermediate layer and in the output layer [62]. A neural network must be trained, having a set of input data and target outputs. Through the training operation, the output data of the neural network are compared to the target and, considering the potential errors, the weights are changed, the process being repeated for all input variables. In the training operation, a cost-dependent function to the training error is used. This function, Ep, refers to the weighted sum of the training errors for each set of data training and can be expressed as:
E P =   i = 1 m ( y _ i   t _ i ) 2 W p
where m represents the number of data sets for network training;
Wp represents a weight that shows the quality of the data set, with values comprised within 0 < W ≤ 1 [63].

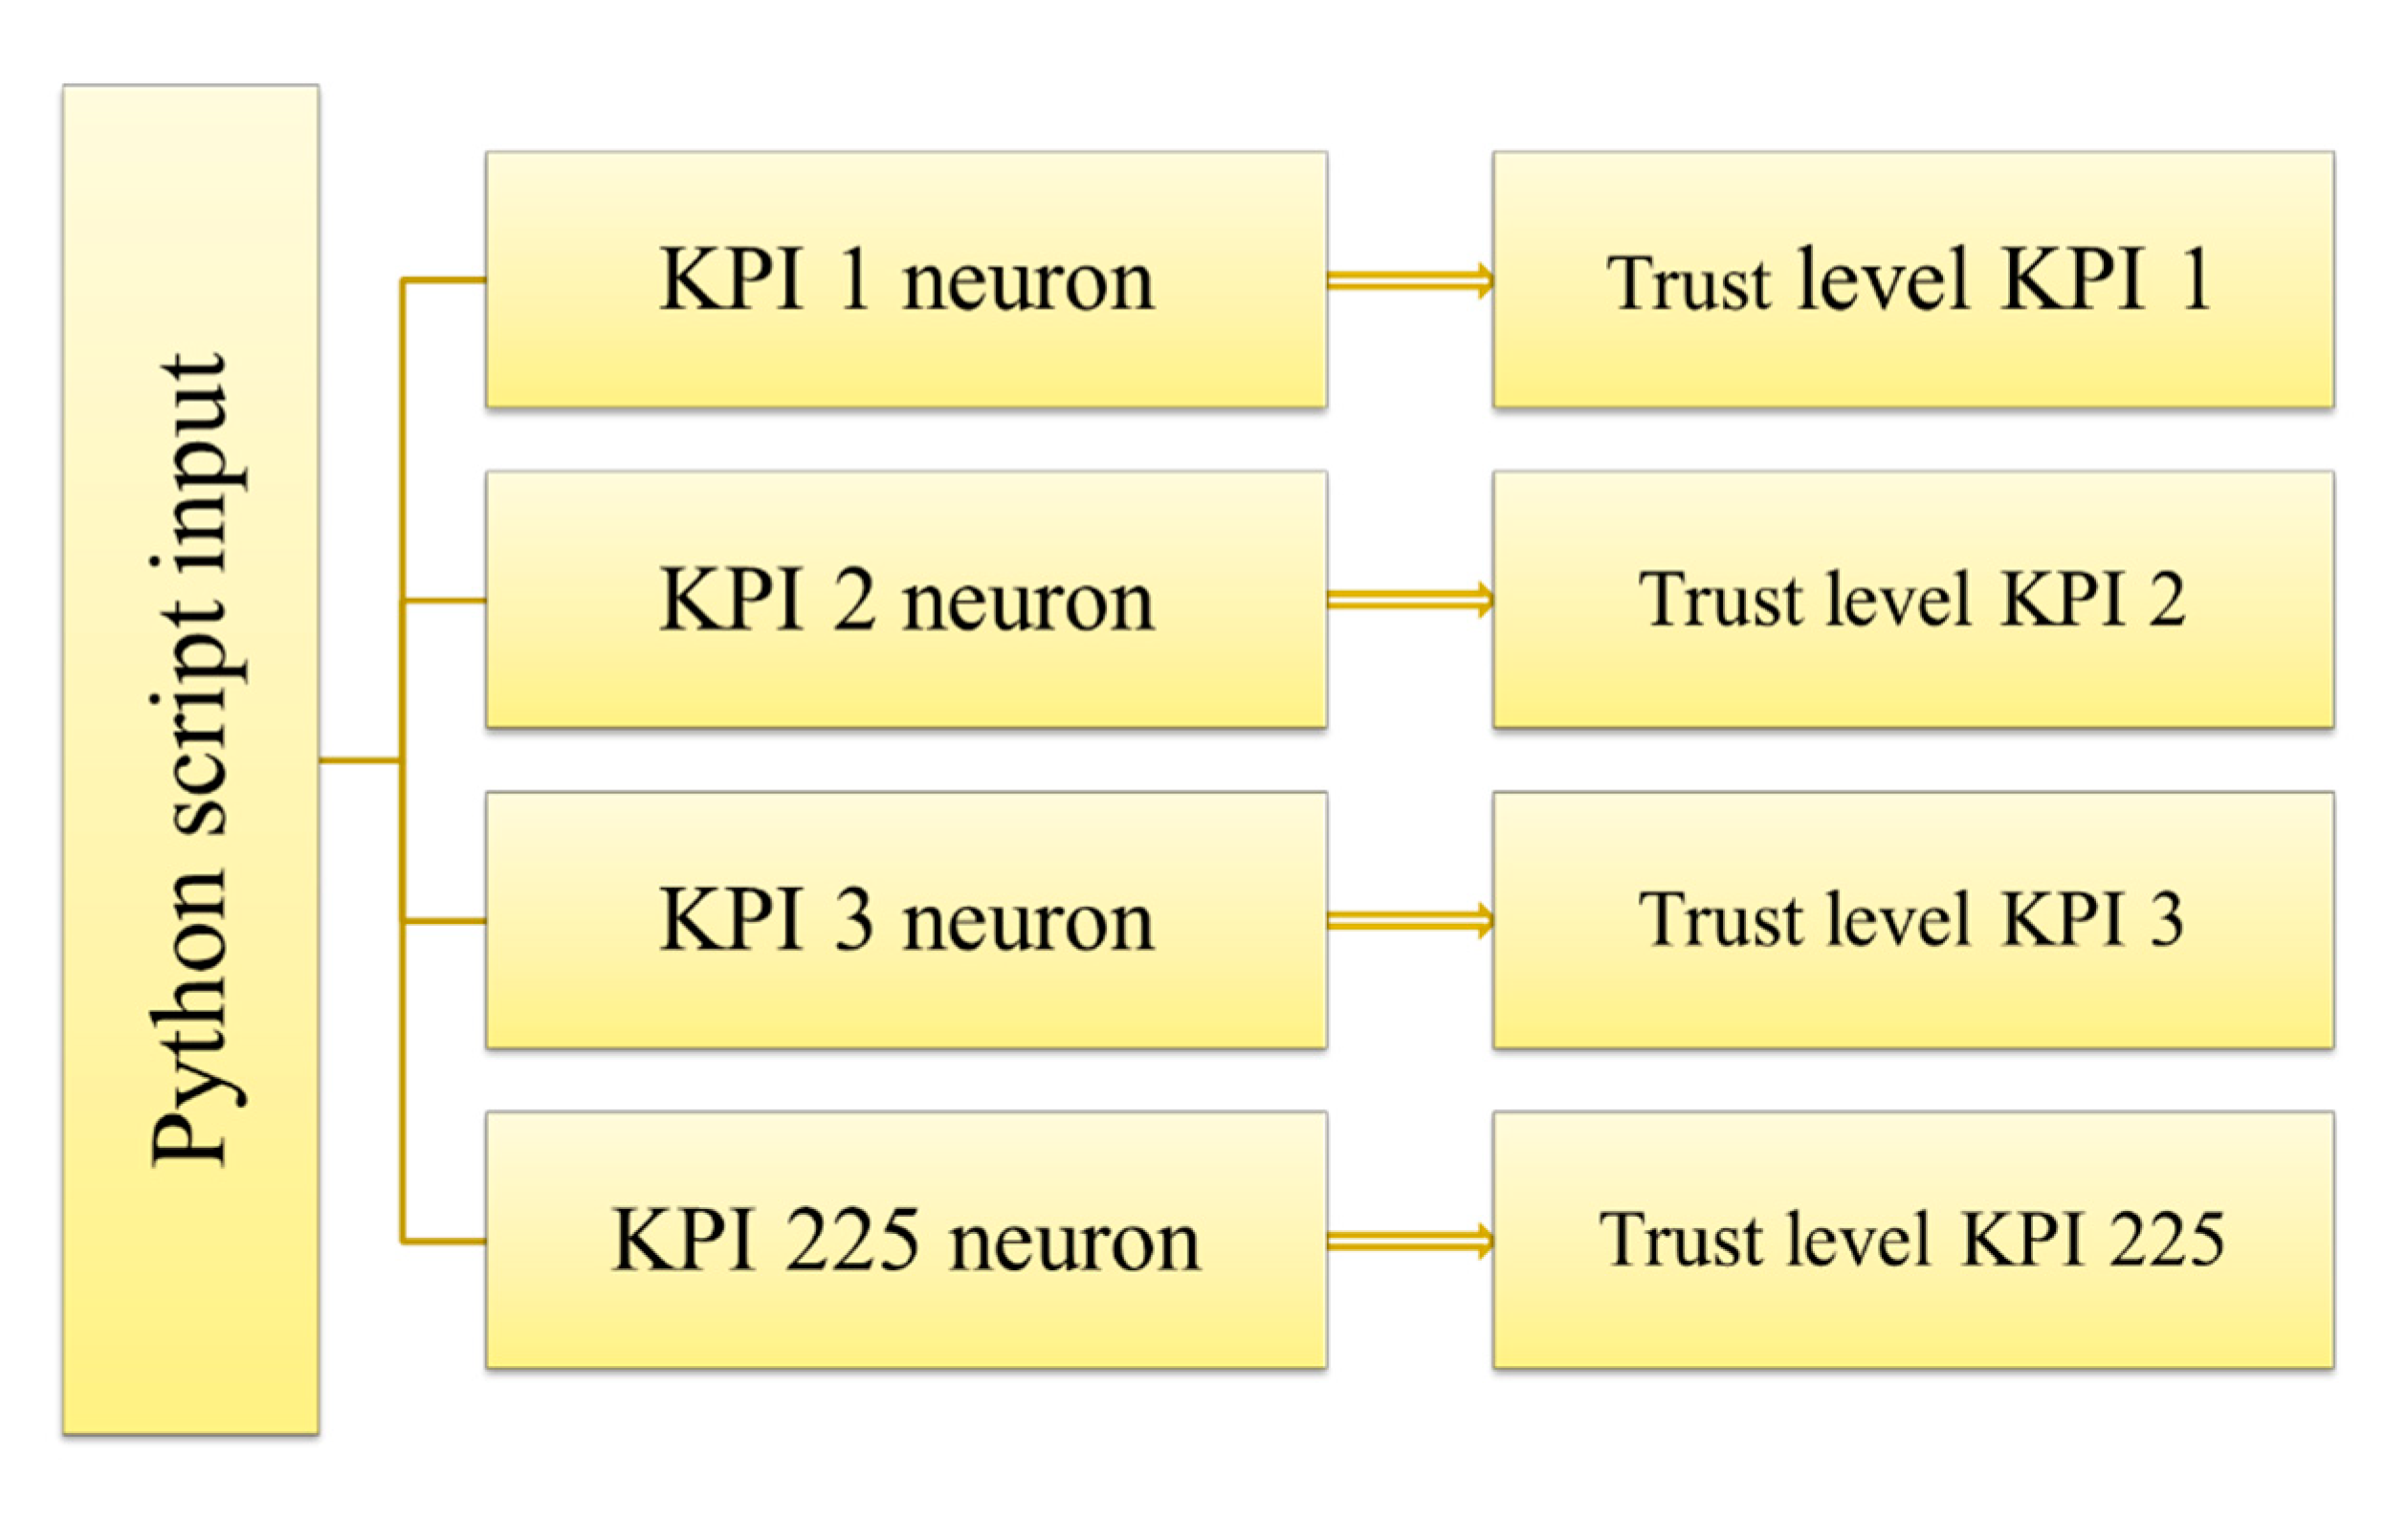
2.1.3. User Graphical Interface Using Python

In order to provide the input values for the neural network, a source code of own creation has been written in Python, a high-level programming language.
The source code was developed using the Tkinter module, which is a standard GUI (Graphic User Interface) open-source package providing a simple, robust and platform-independent windowing toolkit. When combined with Python, it offers a reliable and easy to use GUI application [64]. This simple GUI allows all future users to select the issues they face within their organizations for every SCM subsystem based on the identified problems within this research.
The GUI is an interface linking user-selected values with the MLP algorithm to provide users with a list of predicted KPIs with the level of trustworthiness. The GUI includes all the SCM subsystems as headers and the set of identified issues within this research paper as checkbox items. The GUI translates the user inputs in 1 s and 0 s as desired by the WEKA (Waikato Environment for Knowledge Analysis) software, where the algorithm is run as to provide the user with set list of the most relevant and trustworthy KPIs which should be implemented for each SCM subsystem.
Its application allows all users, from management to blue collars, to select their believed issue as an input and generate possible most relevant KPIs to solve the set issue. With this being done in the background, the user is able to view a simple and clean GUI to generate the desired information.

2.2. Top Five Recommended KPIs and Main Existing Problems within Every Supply Chain Management Subsystem

The holistic supply chain management system is derived from the interactions between all parties directly or indirectly involved in fulfilling customers’ requests and needs [5,12,65,66]. The available SCM system models in the researched literature have been found to present some gaps in regard to its subsystems and processes described or regarding its influence factors. A supply chain management system is a very complex process, influenced by several factors, that includes numerous subsystems. With a purpose of capturing all the subsystems and influence factors involved in the SCM system, a new approach has been developed by dividing the SCM system into nine subsystems. The identified nine subsystems are demand management, supplier management, contract management, product development, procurement/purchasing, sales management, warehouse management, production management and distribution management.
The KPI Institute provides a rank of the most used KPIs in supply chain management activities. The classification of the KPIs is based on the number of views each KPI has. Rather, it is suggested for companies to define the organizational strategy as precisely as possible and to derive strong objectives for which clear KPIs can be set, depending on the requirements resulting from the objectives set.
Following previous research based on bibliographic research but also on own experience, 25 KPIs of each of these categories have been selected, focusing on the objectives of all of these elements [26,67,68]. Each KPI represents the basis for solving a problem that hinders the achievement of the objective set by the organization, which in turn must support the strategy of the whole organization. By identifying each KPI that does not achieve the desired performance, specific initiatives can be made through which the KPI reaches its target value, thus eliminating the root problem and reaching the objective.
Extrapolating from the principles of graphical excellence by Tufte E. and combining them with the fact that one should be able to quickly and efficiently understand the unit of measurement of each KPI, the terminology of the KPI should be combined with one representative symbol. By doing so, we shall then have “#” for all KPI values which are represented by a number as a result, “%” for all KPIs whose result values should be expressed by percentage of and “$” (or any local currency symbol) for KPIs dealing with monetary or financial results [69].
Taking into consideration the 25 KPIs for every subsystem presented and analyzed in the previous research [70,71], based on the interview method, where 50 respondents have been interviewed, the top five most important KPIs for each of the nine supply chain management subsystem and their top reported problems has been selected. The most important KPIs influence each SCM subsystem with a positive impact also in the overall supply chain management performance.
The sample was represented by 50 respondents from 12 different automotive international companies from Romania, Germany and Denmark, all of big or medium dimensions, from nine different departments, with all respondents being team leaders, general managers, managers or department specialists. The selection criteria for the sample selection included years of experience in the automotive industry, level of knowledge with the issues the organization or their specific department is facing, level of interaction with other departments, level of decision-making power and impact they may have on the holistic SCM system by implementing the proposed model. Having the interviewed sample selected from higher and middle management and from three different countries with incremental development in the automotive industry substantiates the validity of the research results provided by the sample respondents.
The automotive industry is in a continuous state of flux and its supply chain management system is highly complex. Having the interview respondents from three different countries allows the data to be more reliable and not limited to one region. Having the data from 12 different automotive companies from three different countries eliminates the false bias of the data and allows for the proposed model to be extrapolated and applicable to any other industry. The input data provide a basis for the algorithm to learn, and with each new entry, the machine learning is enhanced, allowing for better KPI prediction with higher trust values, an aspect that stands as the main reason to focus on the automotive industry.
Following the obtained responses from the interviewed persons, the five most important KPIs have been selected for every of the above-mentioned subsystems, stating that there are certain problems that appear more often in each of these supply chain management subsystems. Specific KPIs are linked to these problems and could prevent their appearance by monitoring the KPIs in a certain timeframe. This helps organization with a more accurate risk assessment, risk communication and risk management by providing a glance at a possible future where these identified issues would escalate if left unchecked. The five most important KPIs of each subsystem and the top problems identified for each of these subsystems have been outlined in Table 1.
In order to demonstrate and validate the relationship between certain problems that appeared in each supply chain management subsystem and the most important KPIs, the multilayer perceptron algorithm was used by developing a mathematical model. The input values, namely the top 45 problems from each subsystem reported by the interviewed persons, are coded using Python script. Due to the neural network, by means of the multilayer perceptron algorithm, the specific problems are linked to their representative KPIs.

3. Results

3.1. Coding the Input Values Using Python Script

The author-defined Python script was used to provide an understandable coding of the input values for the WEKA software to allow the multilayer perceptron to make predictions for which KPI should be used within an organization.
The graphic user interface developed is a graphical representation of the top 45 problems from each subsystem, reported by the interviewed persons. The problems are classified on subsystems based on the interviewees’ answers of the reported problems.
A source code of own creation for generating the desired graphic user interface with the desired labels for each subsystem and checkboxes for each problem associated to the subsystem was written, and the resulting GUI, after running the Python code, is represented in Figure 2.
As the algorithm is given more time to learn and big data inputs are provided from a larger number of organizations, so will the number of possible issues increase, as will the the number of possible links with different KPIs with a higher degree of accuracy, and this will provide an even better picture of the risks the organization is facing.

3.2. User Selection Coding for Processing

The script allows users to select, by checking, the problems they are facing within their organization. The script also provides two buttons: one is an “Exit” button which, of course, closes the GUI. The other button is a “Result” button which prints the output of the Python script as a list of values, 1 s and 0 s, with the selected problems by the end-user being 1 s and the non-selected ones being 0 s.
The generated list of 1 s and 0 s is then used as the coded input values for the WEKA program and the learning algorithm to determine which KPIs the organization should use based on the selected problems in the above-mentioned GUI.
The script-generated output list, after the selection of the problems by the end-user, is presented below.
GUI script selection output:
[1, 1, 0, 1, 0, 1][0, 1, 1, 1, 0, 1][0, 0, 1, 1, 1, 0]
[0, 1, 1, 1, 0, 0][1, 0, 1, 1, 0, 1][0, 1, 1, 1, 1, 1]
[0, 0, 1, 1, 0, 1][0, 1, 1, 1, 1, 0][0, 1, 0, 1, 0, 1]

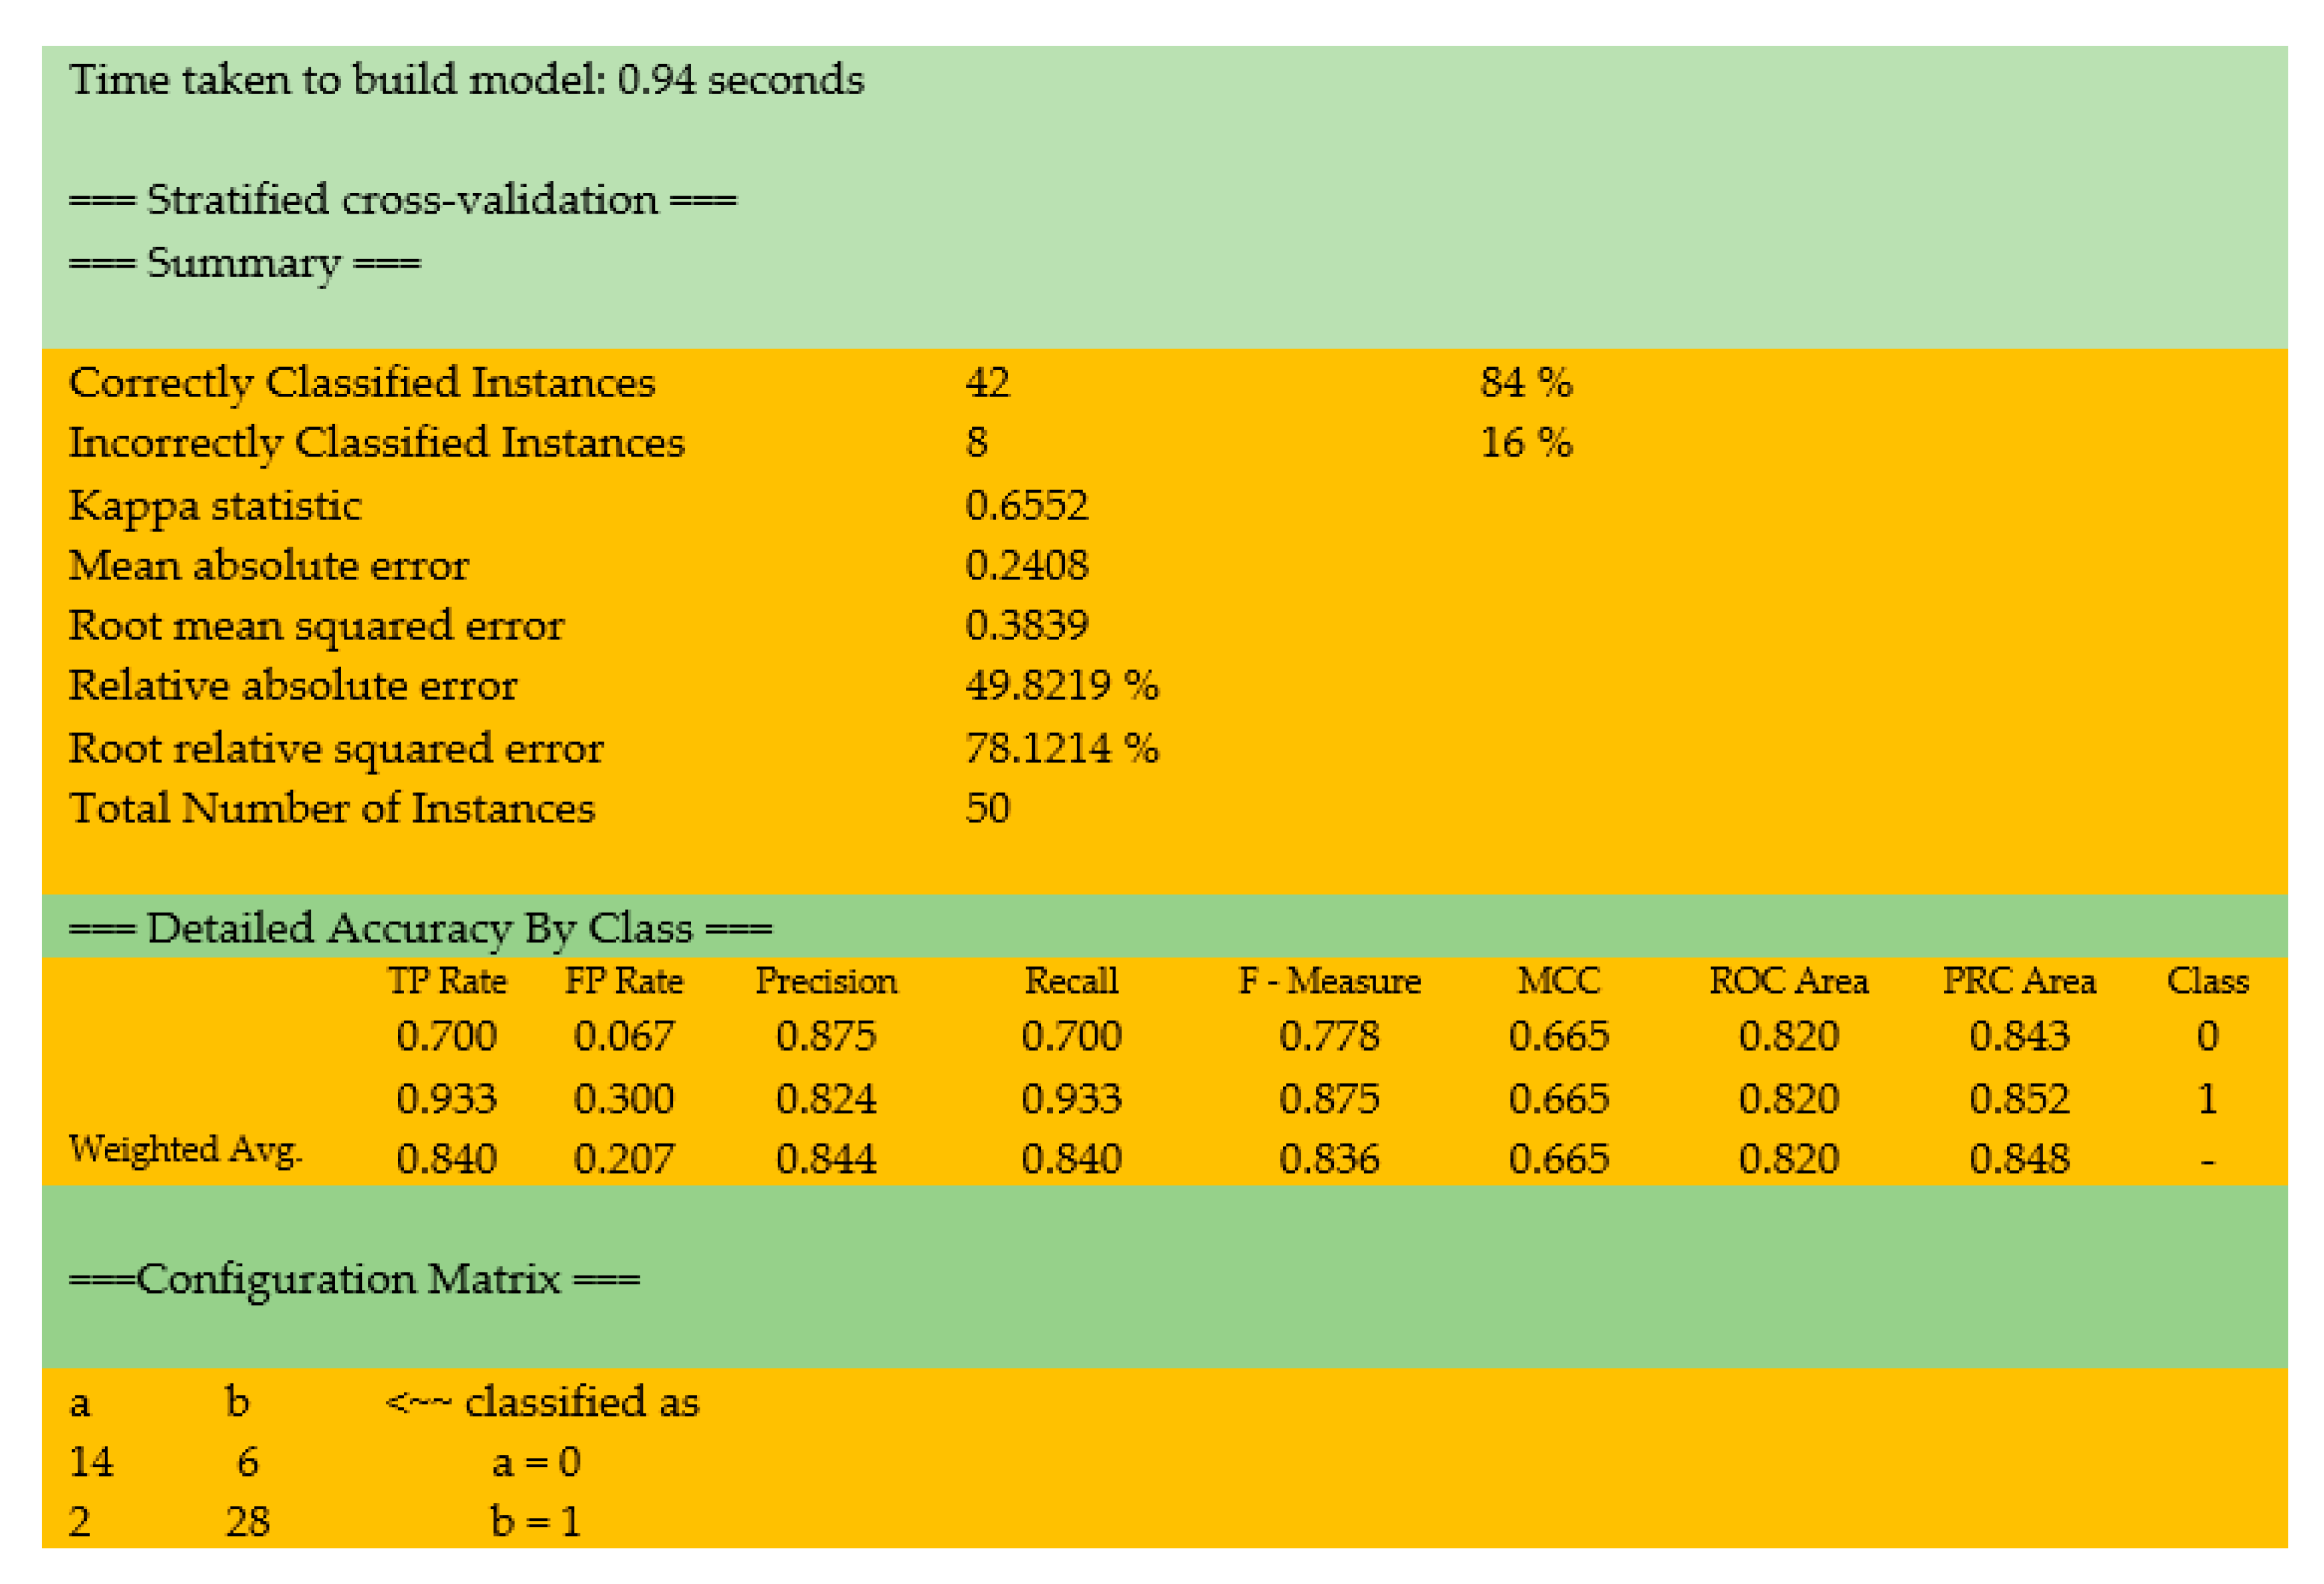
3.3. The Mathematical Model Based on the Neural Network Using the Multilayer Perceptron Algorithm (MLP)

The resulting 1 s and 0 s output of the above-described Python script containing the end-user selected problems are input in the WEKA software.
The WEKA program accepts, among other, a .arff file format. The output of the Python script is automatically added to a .arff file containing 50 interview responses from a previous research and those users’ selection of the problems they face within their organization. Furthermore, the base .arff file contains a list of 225 KPIs from which the interviewed persons selected the top five KPIs. These represent the bases of the neural network training and leading function. The .arff file should follow a specific format where the relation, attributes and data are defined.
The .arff file is then processed by the WEKA program and a trust level for each KPI output is generated for each of the input KPIs, as presented in Figure 3.
The input data in the WEKA program are then used to train the neutron for each KPI so as to output a trust level for each KPI. This trust level represents the probability that a certain KPI should be selected as an output for one of the top 45 KPIs, which will be used as the top 45 KPIs for an organization.
This output validates the proposed approach model of linking the top 45 KPIs selected by the interviewed persons with the problems they reported of having within their organization.
The WEKA program, with the use of the MLP algorithm, is thus used to validate the reported top five KPIs for each of the nine subsystems.
The first KPI, “€ Contract payments”, from the contract management subsystem, was input in the WEKA program and trained using the mathematical model based on the multilayer perceptron algorithm. The “€ Contract payments” KPI was selected by 84% of the interview respondents (n = 50). The output of the WEKA MLP is shown in Figure 4.
From this output, it can be noticed that the algorithm has correctly classified 84% of the input values and 16% were incorrectly classified out of the total input examples. This means that there is an 84% trust level or prediction accuracy of the neural network.
The Cohen’s Kappa statistic is a chance-corrected measure of compliance between the MLP classifications and the true input classes [72]. The calculation formula is presented below.
k = p o   p c 1   p c = 1 1   p o 1   p c
where p o represents the observed agreement and p c is the chance agreement.
The “Kappa statistic” is above 0, which means that the significance level of the “€ Contract payments” KPI is high for this subsystem and the classifier algorithm is doing better than chance. This implies that the “€ Contract payments” KPI is one of the most relevant KPIs for this subsystem, based on the input problems.
The “Confusion Matrix” is a summary of the MLP algorithm results or a description of the performance resulted by the classification algorithm. It gives the reader an insight into the errors of the algorithm, providing a visual classification accuracy breakdown. The “Confusion Matrix” is a visual display of the truly predicted (TP) values and the false predicted (FP) values, as displayed in Table 2 [73].
The “TP Rate”, or the “True Positive Rate”, represents the number of predicted examples by the MLP algorithm which were actually positive over all input instances which are actually classified as positive by the inputted examples [74].
The “FP Rate”, or the “False Positive Rate”, represents the number of predicted examples which were actually negative out of the total number of examples.
The “Precision” is the division of the TP over the predicted positive. This shows the percentage of predicted positives out of the total inputted positive examples.
Precision =   True   Positive True   Positive + False   Positive
The “Recall” is the division of the TP over the actual positives [75].
Recall =   True   Positive True   Positive + False   Negative
In order to validate the top 45 KPIs selected and presented in this paper, the same MLP algorithm with the same configuration was used to generate the below-presented table with the above-presented parameters.
By means of the MLP data mining algorithm, the top selected KPIs are linked to identified problems, relations and influences that are demonstrated and validated through this model, a fact that validates, also, the hypothesis of the research, through which every KPI is linked to a specific problem of the supply chain management system. By developing a performance evaluation model based on the linkage between certain problems and relevant KPIs of each SCM subsystem, the main goal of this paper has been achieved. The output of the WEKA software using the MLP algorithm for the top 45 KPIs is highlighted in Table 3.
The multilayer perceptron algorithm provided by the WEKA software was able to correctly classify the provided top 45 KPIs in all the cases with a percentage higher than 50%. This shows that the neural network created by the MLP algorithm is a valid teaching method for the cases provided in the future as input by other persons using the model.
The undertaken research has pointed out that the validated mathematical model can be used in the future and can be integrated within an organization to provide both live data gathered from an already existing enterprise resource planning software, such as SAP (Systems Applications and Products in Data Processing), or as a stand-alone solution to gather and monitor the performance management of the organization.
Thus, an integrated information flow can be achieved in order to generate the top KPIs that an organization should use based on the input data in the graphical user interface, which codes the values to allow the neural network to provide the needed KPIs into a dashboard as a KPI-monitoring system. (see Figure 5) Within the dashboard, the KPI data can be manually introduced or linked to an existing monitoring software.

4. Discussion

By means of the interview method, in a previous research the top five most relevant KPIs out of the 25 KPIs for every supply chain management subsystem are identified.
It is recommended that every company should measure the five most relevant KPIs of every subsystem. Measuring these KPIs will improve the supply chain management performance by taking actions in order to avoid future problems, improve existing processes and provide better risk assessment, quicker risk communication, improve risk management and increase the sustainability of the system.
The most important problems pointed out several times are certain communication issues, such as deficient communication, poor inter-departmental communication, deficient client communication, high focus on reduced costs, untrained workforce and lack of workforce, undefined procedures and documentation and delayed deliveries. Some of these problems are pointed out also as root causes for specific problems that appear within the supply chain management subsystems.
It can be concluded that certain problems which have been identified as most occurring can be solved or avoided by linking them to the right KPIs and setting the right objectives, validating, also, the initial hypothesis through which the main problems of the specific subsystems of the supply chain management system can be solved by implementing the right KPIs and setting the right objectives.
In order to validate and demonstrate the relations and influences between KPIs and certain problems identified in every supply chain management system, the multilayer perceptron (MLP) artificial intelligence algorithm of data mining is used, developing a mathematical model based on neural networks. By means of this algorithm, the top selected KPIs are linked to certain specified problems, a fact that validates, also, the hypothesis of the research, through which every KPI is linked to a specific problem of the supply chain management system. With the help of the MLP algorithm, it can be predicted which KPI should be used following the identified problems within the organisation.
Both in the international and national literature, various studies, scientific articles and books deal, on the one hand, with presenting the concept of supply chain management, and on the other hand, with presenting supplier performance, suppliers’ evaluation, selection and performance management or general key performance indicators. Current studies focus mainly on the process of logistics in general, taken as a whole, or on the supply management in particular and do not focus also on the evaluation of performance within the supply chain management system.
The undertaken research will bring valuable contributions to the performance evaluation of the supply chain management system, leading to increased productivity, improving specific process standardization and inter-departmental linkage to the overall strategy of an organization, an aspect that highlights its necessity in the specialty literature of the field concerned. To obtain the desired level of supply chain performance requires an organization to constantly monitor and control their operations, develop a clear strategy and objectives, ensure their processes stand and operate at the most optimal desired levels.
The novelty of the research concerns focusing on performance evaluation within supply chain management, highlighting the most important key performance indicators and the main existing problems and correlating them together. This brings an important contribution to the specialty literature and has a high impact on the overall supply chain management performance of automotive companies.

5. Conclusions

By means of the mathematical model based on the data-mining multilayer perceptron artificial intelligence algorithm, certain relations and influences of the proposed model between KPIs and diverse problems have been demonstrated and validated.
By means of data mining, the top selected KPIs are linked to certain specified problems and the MLP can predict which KPI should be used based on the identified problems within the organisation.
In order to solve existing problems and identify and communicate risks and to prevent future issues, every problem should be linked to a KPI, an aspect that is demonstrated and validated by means of the data-mining multilayer perceptron machine learning algorithm.
Implementing and monitoring certain KPIs could help to better identify possible risks and issues in the system and help reduce or eliminate these potential risks. Specific KPIs that are linked to these problems could prevent their appearance by observing the trend line of the monitored KPIs in a certain time frame. This allows for a better risk assessment of the current situation and better risk management to eliminate potential risks before they impact the organization in a negative way.
With the purpose of solving existing problems, certain objectives have to be defined. The KPIs are linked to those set objectives and are constantly monitored. Depending on the KPI’s performance, one can determine if the objective will be met or not. This is made possible with the use of the KPI dashboard where all KPIs can be monitored, risks can be identified and averted and the sustainability of the entire supply chain management system can be ensured.
With the use of the gathered data from the collaboration of more companies, this prediction can be made even more trustworthy and reliable.
By developing a performance evaluation model that links certain problems with relevant KPIs of the supply chain management subsystems, the main goal of this research has been achieved.
Synthesizing the research results and following the elements of the conclusive chapter, we can demonstrate the importance of the supply chain management performance evaluation methods within companies, underlying the significance of supply chain management key performance indicators in specific supply chain management subsystems, linking them to certain problems, with a high economic and financial impact on companies’ overall efficiency and efficacy, risk identification, risk assessment, risk communication, risk management and prevention, sustainability increase and achievement of a competitive edge on the market.
Taking all the benefits of the proposed model presented in this research into account, if the artificial intelligence algorithm mechanism would have an interconnected web-based server from various organizations from the industry, without revealing the identity and the issues each organization is facing, but solely based on gathering, data mining and machine learning, the accuracy and trustworthiness of the output KPIs generated based on the input information would increase exponentially as more users would select the same issues which would be linked to specific KPIs, thus increasing the trustworthiness of the KPI. This allows the algorithm to have access to a much higher number of input values and big data and, thus, predict with a much higher accuracy the correct and relevant KPI needed to be tracked, communicated and analyzed, and, most importantly, by implementing improvement initiatives, it allows the SCM system to develop in a holistic way, ensuring a market competitive edge and the company’s sustainability.
The multilayer perceptron artificial intelligence data mining algorithm allows for analyzing the neuronal network for only one KPI, an aspect that represents a research limitation. The need to analyze the top five most relevant KPIs for every SCM subsystem is identified as a future research direction in order to allow the learning algorithm to obtain a brief overview for the most important KPIs linked to the selected problems appearing within an organisation.
In order to develop the specialty literature in the field concerned, it is recommended that the focus should rely on the evaluation of performance within the supply chain management system and not only on general subjects, such as supplier performance, suppliers’ selection and evaluation, suppliers’ development, performance management or supply chain management.
A future research direction represents also developing a common platform between companies to which the MLP algorithm should have access. This platform, as a whole system, should allow the MLP algorithm to access the vast data provided by multiple organizations, better learn and predict certain KPIs with a much higher trust level and, in turn, truly take advantage of the big data analysis possibilities for which it was designed. The platform could include a dashboard representing the top most relevant KPIs linked to selected problems and risks identified in other companies without divulging their name.

Author Contributions

Conceptualization, O.D. and M.D.; methodology, O.D.; software, M.D.; validation, O.D. and D.D.; formal analysis, O.D.; investigation, O.D.; resources, D.D.; data curation, M.D.; writing—original draft preparation, O.D., M.D. and D.D.; writing—review and editing, O.D and M.D.; visualization, O.D. and M.D.; supervision, O.D. and M.D.; project administration O.D. and D.D.; funding acquisition, O.D. and D.D. All authors have read and agreed to the published version of the manuscript.

Funding

This research was funded by “Lucian Blaga” University of Sibiu and Hasso Plattner Foundation, research grant LBUS-IRG-2019-05.

Acknowledgments

Project financed by Lucian Blaga University of Sibiu & Hasso Plattner Foundation research grants LBUS-IRG-2019-05.

Conflicts of Interest

The authors declare no conflict of interest.

References

  1. Crișan, S. Managementul Desfacerii. 2013. Available online: https://docplayer.net/37462769-Silviu-crisan-managementul-aprovizionarii-pentru-studentii-curs-zi-si-id.html (accessed on 19 October 2020).
  2. Hila, C.M.; Dumitrașcu, O. Actual state of knowledge in the field of Supply Chain Management. MATEC Web Conf. 2017, 121, 07007. [Google Scholar]
  3. Proch, M.; Worthmann, K.; Schluchtermann, J. A negotiation-based algorithm to coordinate supplier development in decentralized supply chains. Eur. J. Oper. Res. 2017, 256, 412–413. [Google Scholar] [CrossRef] [Green Version]
  4. Dalvi, M.; Kant, R. Benefits, criteria and activities of supplier development: A categorical literature review. Asia Pac. J. Mark. Logist. 2015, 27, 653–654. [Google Scholar] [CrossRef]
  5. Felea, M.; Albăstroiu, I. Defining the concept of Supply Chain Management and its relevance to Romanian academics and practitioners. Amfiteatru Econ. 2013, 15, 74–88. [Google Scholar]
  6. Krystofik, M.; Valant, C.; Archbold, J.; Bruessow, P.; Nenadic, N. Risk Assessment Framework for Outbound Supply-Chain Management. Information 2020, 11, 417. [Google Scholar] [CrossRef]
  7. Bondrea, I.; Simion, C. Product Lifecycle Management in Stamping and Moulding Tool Manufacturing for the Automotive Industry. In Proceedings of the 10th WSEAS International Systems, Athens, Greece, 10 July 2006; pp. 687–691. Available online: http://www.wseas.us/e-library/conferences/2006cscc/papers/534-438.pdf (accessed on 15 September 2020).
  8. Baryannis, G.; Validi, S.; Dani, S.; Antoniou, G. Supply chain risk management and artificial intelligence: State of the art and future research directions. Int. J. Prod. Res. 2019, 57, 2179–2202. [Google Scholar] [CrossRef]
  9. Munir, M.; Jajja, M.S.S.; Chatha, K.A.; Farooq, S. Supply chain risk management and operational performance: The enabling role of supply chain integration. Int. J. Prod. Econ. 2020, 227, 107667. [Google Scholar] [CrossRef]
  10. Li, L. Supply Chain Management Concepts, Techniques and Practices, 1st ed.; World Scientific Pub Co: London, UK, 2007. [Google Scholar]
  11. Nicolăescu, E.; Alpopi, C.; Zaharia, C. Measuring Corporate Sustainability Performance. Sustainability 2015, 7, 851–865. Available online: https://0-www-mdpi-com.brum.beds.ac.uk/2071-1050/7/1/851/html (accessed on 19 October 2020). [CrossRef] [Green Version]
  12. Capgemini Research Institute. The Automotive Industry in the Era of Sustainability. 2020. Available online: https://www.capgemini.com/wp-content/uploads/2020/03/The-Automotive-Industry-in-the-Era-of-Sustainability.pdf (accessed on 7 September 2020).
  13. Khokhar, M.; Iqbal, W.; Hou, Y.; Abbas, M.; Fatima, A. Assessing Supply Chain Performance from the Perspective of Pakistan’s Manufacturing Industry through Social Sustainability. Processes 2020, 8, 1064. [Google Scholar] [CrossRef]
  14. Caniato, F.; Gelsomino, L.M.; Perego, A.; Ronchi, S. Does finance solve the supply chain financing problem? Supply Chain Manag. Int. J. 2016, 21, 534–549. [Google Scholar] [CrossRef]
  15. Caniato, F.; Henke, M.; Zsidisin, G.A. Supply chain finance: Historical foundations, current research, future developments. J. Purch. Supply Manag. 2019, 25, 99–104. [Google Scholar] [CrossRef]
  16. Moretto, A.; Grassi, L.; Caniato, F.; Giorgino, M.; Ronchi, S. Supply chain finance: From traditional to supply chain credit rating. J. Purch. Supply Manag. 2019, 25, 197–217. [Google Scholar] [CrossRef]
  17. Pellegrino, R.; Costantino, N.; Tauro, D. Supply Chain Finance: A supply chain-oriented perspective to mitigate commodity risk and pricing volatility. J. Purch. Supply Manag. 2019, 25, 118–133. [Google Scholar] [CrossRef]
  18. Carbonara, N.; Pellegrino, R. Real options approach to evaluate postponement as supply chain disruptions mitigation strategy. Int. J. Prod. Res. 2017, 56, 5249–5271. [Google Scholar] [CrossRef]
  19. Mentzer, J.T.; Min, S.; Zacharia, Z.G. The nature of inter-firm partnering in supply chain management. J. Retail. 2000, 76, 4. [Google Scholar] [CrossRef]
  20. Svensson, G. The theoretical foundation of supply chain management: A functionalist theory of marketing. Int. J. Phys. Distrib. Logist. Manag. 2002, 32, 9. [Google Scholar] [CrossRef]
  21. Sánchez-Flores, R.; Cruz-Sotelo, S.; Ojeda-Benitez, S.; Ramírez-Barreto, E. Sustainable Supply Chain Management—A Literature Review on Emerging Economies. Sustainability 2020, 12, 6972. [Google Scholar] [CrossRef]
  22. Neugebauer, S.; Forin, S.; Finkbeiner, M. From Life Cycle Costing to Economic Life Cycle Assessment—Introducing an Economic Impact Pathway. Sustainability 2016, 8, 428. [Google Scholar] [CrossRef] [Green Version]
  23. Chopra, S.; Meindl, P. Supply Chain Management: Strategy, Planning, and Operation, 3rd ed.; Pearson Prentice Hall: Upper Saddle River, NJ, USA, 2007. [Google Scholar]
  24. Christopher, M. Logistics & Supply Chain Management; Pearson Education Limited: Harlow, UK, 2016. [Google Scholar]
  25. Popa, V. Supply Chain Management in Consumer Goods Industry & Retail. 2009. Available online: www.virgilpopa.com (accessed on 9 September 2020).
  26. Uta, T.; Ion, I. Analiza Pieței de Furnizare și Selecția Furnizorilor. Al Trei. Simp. Ecr Acad. Partnersh. România 2009. Available online: http://www.ecr-uvt.ro (accessed on 20 October 2020).
  27. The KPI Institute. Certified Key Performance Indicators Professional—Towards the Use of a Rigorous KPI Management Framework; Training Course; The KPI Institute: Kuala Lumpur, Malaysia, 2014. [Google Scholar]
  28. Kpilibrary.com. R&D|KPI Library. 2018. Available online: http://kpilibrary.com/categories/r_and_d (accessed on 21 October 2020).
  29. Sme, S. Role of Procurement within an Organization: Procurement: A Tutorial. Supply Chain Resour. Coop. Nc State Univ. 2018. Available online: https://scm.ncsu.edu/scm-articles/article/role-of-procurement-within-an-organization-procurement-a-tutorial (accessed on 29 October 2020).
  30. Hristov, I.; Chirico, A. The Role of Sustainability Key Performance Indicators (KPIs) in Implementing Sustainable Strategies. Sustainability 2019, 11, 20. [Google Scholar] [CrossRef] [Green Version]
  31. Ferrer, B.R.; Muhammad, U.; Mohammed, W.M.; Lastra, J.L.M. Implementing and Visualizing ISO 22400 Key Performance Indicators for Monitoring Discrete Manufacturing Systems. Machines 2018, 6, 39. [Google Scholar] [CrossRef] [Green Version]
  32. The KPI Institute. The Supply Chain KPI Dictionary: 360+ Key Performance Indicator Definitions; The KPI Institute: Kuala Lumpur, Malaysia, 2015. [Google Scholar]
  33. Eagle, S. Demand-Driven Supply Chain Management: Transformational Performance Improvement; Kogan Page: London, UK, 2017. [Google Scholar]
  34. Moise, M. The importance of reverse logistics for retail activity. Amfiteatru Econ. 2008, 24, 192–209. [Google Scholar]
  35. Carvalho, H.; Azevedo, S.G.; Machado, V.C. Supply Chain Performance Management—Lean and Green Paradigms. Int. J. Bus. Perform. Supply Chain Model. 2010, 2, 3–4. [Google Scholar] [CrossRef]
  36. Chae, B.K. Developing key performance indicators for supply chain: An industry perspective. Supply Chain Manag. Int. J. 2009, 14, 422–428. [Google Scholar] [CrossRef]
  37. Han, J.; Kamber, M. Data Mining: Concepts and Techniques, 2nd ed.; Morgan Kaufmann Publishers: Burlington, MA, USA, 2012; pp. 1–17. [Google Scholar]
  38. Ramageri, B.M. Data mining techniques and applications. Indian J. Comput. Sci. Eng. 2010, 1, 4. [Google Scholar]
  39. Muscalu, E.; Dumitrașcu, O. Studies regarding the influence of extracurricular activities on the management of the university system. In The Best Romanian Management Studies 2013–2014; LAP Lambert Academic Publishing: Saarbrücken, Germany, 2015. [Google Scholar]
  40. Bhargava, N.; Bhargava, R.; Mathuria, M. Decision Tree Analysis on J48 Algorithm for Data Mining. Int. J. Adv. Res. Comput. Sci. Softw. Eng. 2013, 3, 6. [Google Scholar]
  41. Chen, M.; Han, J.; Jy, P. Data Mining: An Overview from Database Perspective. Available online: http://hanj.cs.illinois.edu/pdf/survey97.pdf (accessed on 2 September 2020).
  42. Osmar, Z. Introduction to Data Mining. In CMPUT690 Principles of Knowledge Discovery in Databases; Pearson Education India: New Delhi, India, 1999. [Google Scholar]
  43. Tipawan, S.; Kulthida, T. Data Mining and Its Applications for Knowledge Management: A Literature Review from 2007 to 2012. Int. J. Data Min. Knowl. Manag. Process (IJDKP) 2012, 2, 5. [Google Scholar]
  44. Tabbarah, H.; Abbdulah, A. Artificial Intelligence. In Advanced Analytics and Design: CNIT 380; 2017; Available online: https://www.coursehero.com/file/39103671/ArtificialIntellegencepdf/ (accessed on 29 October 2020).
  45. Chih-Wen, C.; Hau-Wei, L.; Chein-Hung, L. A Review of Artificial Intelligence Algorithms Used for Smart Machine Tools. 2018. Available online: https://0-www-mdpi-com.brum.beds.ac.uk/2411-5134/3/3/41 (accessed on 18 October 2020).
  46. Morariu, D. Contributii la Extragerea Automata de Cunostinte din Masive de Date. Ph.D. Thesis, Lucian Blaga University of Sibiu, Sibiu, Romania, 2017. [Google Scholar]
  47. Gorunescu, F. Data Mining. Concepte. Modele si Tehnici, 2006. pp. 165–191. Available online: https://www.researchgate.net/profile/Florin_Gorunescu/publication/323388145_Data_Mining_Concepte_Modele_si_Tehnici_Ed_Albastra_2006/links/5a92702d0f7e9ba4296e1943/Data-Mining-Concepte-Modele-si-Tehnici-Ed-Albastra-2006.pdf (accessed on 20 October 2020).
  48. Mutiu, C.; Brindasu, P.; Beju, L. Mathematical Model for Determination of the Abrasive Wheel Profile for Helicall Drills Manufacturing. In Proceedings of the 10th WSEAS International Conference on Mathematical and Computational Methods in Science and Engineering (MACMESE’08), Bucharest, Romania, 7–9 November 2008. [Google Scholar]
  49. Dragan, M. Retele neuronale Artificiale Pentru Recunoastere Optica. 2016. Available online: https://www.academia.edu/31460585/RETELE_NEURONALE_ARTIFICIALE_PENTRU_RECUNOASTERE_OPTICA (accessed on 18 September 2020).
  50. Neukart, F. System Applying High Order Computational Intelligence in Data Mining and Quantum Computational Considerations on the Future of Artificial Intelligence. 2013. Available online: http://old.unitbv.ro/Portals/31/Sustineri%20de%20doctorat/Rezumate/Neukart.pdf (accessed on 20 October 2020).
  51. Popescu, M.; Balas, V.; Perescu-Popescu, L.; Mastorakis, N. Multilayer Perceptron and Neural Networks, Wseas Transactions on Circuits and Systems. 2009. Available online: http://www.wseas.us/e-library/transactions/circuits/2009/29-485.pdf (accessed on 29 October 2020).
  52. Mitchell, T. Machine Learning. 1997. Available online: http://profsite.um.ac.ir/~monsefi/machine-learning/pdf/Machine-Learning-Tom-Mitchell.pdf (accessed on 19 October 2020).
  53. Dunham, M. Data Mining—Introductory and Advanced Topics. 2003. Available online: http://index-of.co.uk/Data-Mining/Dunham%20-%20Data%20Mining.pdf (accessed on 20 October 2020).
  54. Morariu, D.; Cretulescu, R.; Breazu, M. The Weka Multilayer Perceptron Classifier. Int. J. Adv. Stat. IT&C Econ. Life Sci. 2017, VII, 1. Available online: http://site.magazines.ulbsibiu.ro/ijasitels/index.php/IJASITELS/article/view/17/19 (accessed on 29 October 2020).
  55. Kain, N.K. Understanding of Multilayer Perceptron (MLP). 2018. Available online: https://medim.com/@AI_with_Kain/understanding-of-multilayer-perceptron-mlp-8f179c4a135f (accessed on 15 September 2020).
  56. Cortez, P. Multilayer Perceptron (MLP) Application Guidelines. Available online: http://www3.dsi.uminho.pt/pcortez/mg.pdf (accessed on 17 September 2020).
  57. Gavril, M. Perceptronul Multistrat. Available online: http://iota.ee.tuiasi.ro/~mgavril/Simpe/L1.htm (accessed on 20 October 2020).
  58. Mia, M.M.A.; Biswas, S.K.; Urmi, M.C.; Siddique, A. An Algorithm for Training Multilayer Perceptron (MLP) for Image Reconstruction Using Neural Network without Overfitting. 2015. Available online: https://www.semanticscholar.org/paper/An-Algorithm-For-Training-Multilayer-Perceptron-MLP-Mia-Biswas/5657a3a3f1ffa5296378bd518da009911a715820 (accessed on 11 September 2020).
  59. Riedmiller, M. Machine Learning: Multi Layer Perceptrons. 2015. Available online: http://ml.informatik.uni-freiburg.de/former/_media/teaching/ss10/05_mlps.printer.pdf (accessed on 23 September 2020).
  60. Pooja, A.; Pooja, Y.; Neelam, S.; Ruchika, U.; Swati, S. Research Paper on Artificial Intelligence. 2014. Available online: https://zenodo.org/record/3521140#.X5rXR4gzZPY (accessed on 17 September 2020).
  61. Kerstning, K. Machine Learning and Artificial Intelligence: Two Fellow Travelers on the Quest for Intellligence Behaviour in Machines, Specialty Granc Challenge. 2018. Available online: https://www.frontiersin.org/articles/10.3389/fdata.2018.00006/full (accessed on 13 September 2020).
  62. Neagoe, V. Lucrarea 4.a Reteaua neurala Perceptron Multistrat (MLP). Available online: http://www.victorneagoe.com/university/prai/lab4a.pdf (accessed on 11 September 2020).
  63. Constantinescu, D. Analiza Statistica a Ecosistemelor. 2017. Available online: https://www.researchgate.net/project/Statistical-Analysis-of-the-Ecological-Systems (accessed on 19 September 2020).
  64. Docs.python.org. Graphical User Interfaces with Tk—Python 3.7.3 Documentation. Available online: https://docs.python.org/3/library/tk.html (accessed on 15 May 2020).
  65. Chen, I.J.; Paulraj, A. Towards a theory of supply chain management: The constructs and measurements. J. Oper. Manag. 2004, 22, 119–150. [Google Scholar] [CrossRef]
  66. Simchi-Levi, D.; Kaminsky, P.; Simchi-Levi, E. Designing and Managing the Supply Chain; McGraw-Hill/Irwin: Boston, MA, USA, 2003. [Google Scholar]
  67. Nicolaescu, S.; Palade, H.; Hila, C.M.; Kifor, C. Organizational Leadership through effective KPI selection—A strategic KM approach for Automotive R&D centers. In Proceedings of the 19th QMOD ICQSS, International Conference, Rome, Italy, 21–23 September 2016. [Google Scholar]
  68. Dumitrascu, O.; Dumitrascu, M. Performance Management Evaluation Methods in the Field of Supply Chain Management. In Proceedings of the 11th ICEBE—International Conference on Engineering and Business Education, Szczecin, Poland, 15–19 October 2018; pp. 56–63. Available online: http://digitalknowledge.cput.ac.za/bitstream/11189/7234/1/Proceedings%20of%20%e2%80%9d11th%20ICEBE%20%26%207th%20ICIE%20%26%20PEESA%20III.pdf (accessed on 2 September 2020).
  69. Tufte, E. The Visual Display of Quantitative Information, 2nd ed.; Graphics Press: Cheshire, CT, USA, 2001. [Google Scholar]
  70. Dumitrascu, O. Criterial suppliers’ evaluation model aimed at SCM performance, production and engineering process’s improvement. In Proceedings of the BRCEBE-ICEBE’17 Conference, Sibiu, Romania, 19–22 October 2017; Available online: https://www.sciencegate.app/doi/abs/10.1515/cplbu-2017-0007 (accessed on 9 September 2020).
  71. Dumitrașcu, M.; Kifor, C. Knowledge transfer in the field of Supply Chain Management. In Proceedings of the 8th Balkan Region Conference on Engineering and Business Education and 10th International Conference on Engineering and Business Education, Sibiu, Romania, 19–22 October 2017; De Gruyter Open: Basel, Switzerland, 2017; Volume 3, Issue 1. pp. 151–157. [Google Scholar] [CrossRef] [Green Version]
  72. McHugh, M.L. Interrater reliability: The kappa statistic. Biochem. Med. 2012, 22, 276–282. [Google Scholar] [CrossRef]
  73. Garg, T.; Khurana, S.S. Comparison of classification techniques for intrusion detection dataset using WEKA. In Proceedings of the International Conference on Recent Advances and Innovations in Engineering (ICRAIE-2014), Jaipur, India, 9–11 May 2014. [Google Scholar] [CrossRef]
  74. Santini, M. Machine Learning for Language Technology; Lab 03: Evaluation. 2016. Available online: http://santini.se/teaching/ml/2016/Lect_04/Lab03_Evaluation.pdf (accessed on 22 September 2020).
  75. Sewaiwar, P.; Verma, K.K. Comparative study of various decision tree classification algorithm using WEKA. Int. J. Emerg. Res. Manag. Technol. 2015, 4, 10. [Google Scholar]
Figure 1. Logical scheme of the research methodology.
Processes 08 01384 g001
Figure 2. Graphical user interface generated by the Python script.
Processes 08 01384 g002
Figure 3. Tree structure of the neural network.
Processes 08 01384 g003
Figure 4. Output of the WEKA software using the multilayer perceptron (MLP) algorithm.
Processes 08 01384 g004
Figure 5. Integrated information flow.
Processes 08 01384 g005
Table 1. Top five key performance indicators (KPIs) and top problems identified for each supply chain management (SCM) subsystem.
Supply Chain Management Subsystems
Demand ManagementSupplier ManagementContract ManagementProduct DevelopmentProcurement/Purchasing
TOP 5 KPIs
# Weeks of forecasting planning% Delivery performance€ Contract payments% Products meeting cost target€ Material acquisition cost
# Supply chain cycle time€ Supplier backlog# Contract negotiation time% Research and development cost for new products% Production delivery performance
€ Order fulfilment costs# Complaints% Contract breaches due to non-compliance€ Investments in new product support and training% Supplier on time delivery
€ Cost due to unsatisfied demand# Supplier lead time# Identified contract breaches% Revenue generated by new products% Cost avoidance savings in procurement
# Cash to cash cycle time% Adherence to delivery schedule% Changes to contract specifications# Time to market new products% Delayed purchases
Specific Problems Related to Each Subsystem
Communication issuesQuality non-compliant materialsPoorly established contractual terms and conditionsHigh number of prototypesPoor interdepartmental communication problem
Forecast issuesDeficient communicationInadequate performance trackingHigh focus on reduced costsDelays due to delivery
Reduced lead-timeLate deliveriesHigh lead-time for contract negotiationsDifferent implementation deadlineNo focus on supplier development
High focus on reduced costsLong lead-timeNot involving the relevant departmentsUntrained workforceHigh focus on reduced costs
Lack of KPIsNon-compliant documentationHigh costs due to contractual terms and conditionsFrequent changes to final productUntrained workforce
Initial contractual parameters not well definedDelayed reaction to changesFrequent contractual changesInterdepartmental communicationLack of more than one supplier
Sales ManagementWarehouse ManagementProduction ManagementDistribution
TOP 5 KPIs
% Customer complaints due to poor service or product quality% Warehouse space utilization# Production capacity% Perfect order delivery rate
€ Sales potential forecast# Safety stock# Tact time€ Delivery cost per order
% Sales growth% Slow moving stock€ Production backlog€ Damaged goods per shipment
% Gross margin return on investment# Days on hand% Equipment quality rate% Empty running
€ Revenue by product indicators# Stock rotations# Production lead time# Customer shipment to delivery cycle time
Specific Problems Related to Each Subsystem
Lack of support from sales departmentLow stock accuracy followedLack of workforceTransport capacity versus daily capacity
Deficient client communicationUntrained workforceUntrained workforceHigh number of special transports
Extra in-house cost not billed to clientChaotic stockLow productivityHigh transportation lead time
Initially undefined proceduresHigh obsolete stockHigh backlogLack of workforce
Parameters initial price wrongly negotiatedNo safety stockQuality non-compliant materialsDeficient communication
Client-high order fluctuationHigh slow movingLow adherence to scheduleNon-conforming deliveries
The symbol before each KPI represent its unit of measurement.
Table 2. WEKA Confusion Matrix explained.
n = 50Predicted
Negative
Predicted PositiveClassification
Actual negativeTrue positiveFalse negativea = 0 (no)
Actual positiveFalse negativeTrue positiveb = 1 (yes)
Table 3. Output of the WEKA software using the MLP algorithm for the top 45 KPIs.
SubsystemKPI Name% Respondent Selection% Correctly Classified% Incorrectly ClassifiedPrecisionRecall
Contract Management€ Contract payments84%84%16%84.4%84.0%
Contract Management# Contract negotiation time68%76%24%73.7%64.7%
Contract Management% Contract breaches due to non-compliance64%80%20%85.0%81.0%
Contract Management# Identified contract breaches64%64%36%68.4%81.3%
Contract Management% Changes to contract specifications56%68%32%70.6%80.0%
Demand Management# Weeks of forecast planning76%84%16%76.2%84.2%
Demand Management# Supply chain cycle time68%76%24%66.7%70.6%
Demand Management€ Order fulfilment costs60%84%16%82.4%93.3%
Demand Management€ Cost due to unsatisfied demand60%72%28%66.7%75.0%
Demand Management# Cash to cash cycle time60%72%28%61.1%68.8%
Distribution Management% Perfect order delivery rate68%80%20%75.0%70.6%
Distribution Management€ Delivery cost per order68%72%28%80.0%75.0%
Distribution Management€ Damaged goods per shipment64%76%24%68.4%68.4%
Distribution Management% Empty running64%72%28%76.5%81.3%
Distribution Management# Customer shipment to delivery cycle time64%64%36%66.7%68.8%
Procurement/Purchasing% Supplier on-time delivery96%92%8%92.0%92.0%
Procurement/Purchasing% Production delivery performance84%76%24%76.0%76.0%
Procurement/Purchasing% Cost avoidance savings in procurement72%64%36%69.2%62.9%
Procurement/Purchasing% Delayed purchases68%72%28%66.7%70.6%
Procurement/Purchasing€ Material acquisition cost64%68%32%62.5%62.5%
Product Development% Products meeting cost target84%72%28%73.0%72.0%
Product Development% R&D cost for new products72%76%24%69.4%76.0%
Product Development€ Investment in new product support and training68%72%28%73.0%72.0%
Product Development% Revenue generated by new products64%76%24%76.0%76.0%
Product Development# Time to market new products/services56%72%28%73.0%72.0%
Production Management# Production capacity80%84%16%77.8%66.7%
Production Management# Tact time80%80%20%78.9%71.4%
Production Management€ Production backlog72%72%28%73.0%72.0%
Production Management% Equipment quality rate56%68%32%75.0%75.0%
Production Management# Production lead time56%72%28%65.4%61.8%
Sales Management% Customer complaints due to poor service or product quality84%88%12%89.5%88.0%
Sales Management€ Sales potential forecast84%76%24%69.4%76.0%
Sales Management% Sales growth80%76%24%72.1%76.0%
Sales Management% Gross margin return on investment64%76%24%75.5%76.0%
Sales Management€ Revenue by product64%72%28%66.7%72.0%
Supplier Management% Delivery performance100%100%0%100.0%100.0%
Supplier Management€ Supplier backlog80%80%20%70.6%64.9%
Supplier Management# Complaints68%76%24%78.3%76.0%
Supplier Management# Supplier lead time64%72%28%72.8%72.0%
Supplier Management% Adherence to delivery schedule60%76%24%76.0%76.0%
Warehouse Management% Warehouse space utilization84%68%32%74.8%68.0%
Warehouse Management# Safety stock80%68%32%68.0%68.0%
Warehouse Management% Slow moving stock68%64%36%72.2%76.5%
Warehouse Management# Days on hand60%64%36%68.8%73.3%
Warehouse Management# Stock rotations56%76%24%61.5%66.2%
The symbol before each KPI represent its unit of measurement.
Publisher’s Note: MDPI stays neutral with regard to jurisdictional claims in published maps and institutional affiliations.

