Article

Dielectric Spectroscopy to Improve the Production of rAAV Used in Gene Therapy

1
iBET—Instituto de Biologia Experimental e Tecnológica, Apartado 12, 2781-901 Oeiras, Portugal
2
ITQB-NOVA, Instituto de Tecnologia Química e Biológica António Xavier, Universidade Nova de Lisboa, Av. da República, 2780-157 Oeiras, Portugal
3
Voyager Therapeutics, 75 Sidney St, Cambridge, MA 02139, USA
*
Author to whom correspondence should be addressed.
Submission received: 2 October 2020 / Revised: 7 November 2020 / Accepted: 10 November 2020 / Published: 13 November 2020
(This article belongs to the Special Issue Measurement Technologies for up- and Downstream Bioprocessing)

Abstract

:
The insect cell-baculovirus expression vector system is an established method for large scale recombinant adeno-associated virus (rAAV) production, largely due to its scalability and high volumetric productivities. During rAAV production it is critical to monitor process parameters such as Spodoptera frugiperda (Sf9) cell concentration, infection timing, and cell harvest viabilities since they can have a significant influence on rAAV productivity and product quality. Herein we developed the use of dielectric spectroscopy as a process analytical technology (PAT) tool used to continuously monitor the production of rAAV in 2 L stirred tank bioreactors, achieving enhanced control over the production process. This study resulted in improved manufacturing robustness through continuous monitoring of cell culture parameters, eliminating sampling needs, increasing the accuracy of infection timing, and reliably estimating the time of harvest. To increase the accuracy of baculovirus infection timing, the cell growth/permittivity model was coupled to a feedback loop with real-time monitoring. This system was able to predict baculovirus infection timing up to 24 h in advance for greatly improved accuracy of infection and ensuring consistent high rAAV productivities. Furthermore, predictive models were developed based on the dielectric measurements of the culture. These multiple linear regression-based models resulted in correlation coefficients (Q2) of 0.89 for viable cell concentration, 0.97 for viability, and 0.92 for cell diameter. Finally, models were developed to predict rAAV titer providing the capability to distinguish in real time between high and low titer production batches.

1. Introduction

Recombinant adeno-associated viruses (rAAV) are an ideal candidate gene therapy vector for many diseases, due to their ability to transduce nondividing cells from several tissues maintaining a long-term gene expression. rAAV also possess low immunogenicity compared to other viral vectors and are resilient to industry manufacturing methodologies, long-time storage, and in vivo administration [1,2].
While several biological systems have been adapted for rAAV production, the insect cell-baculovirus expression vector system (IC-BEVS) is very amenable for large scale rAAV production. Insect cells possess scalable and GMP-compatible characteristics, since they can grow in suspension to high cell densities in serum-free conditions [3]. As for the baculovirus, its use as a vector relies on the high recombinant protein production yields achieved and the absence of mammalian-derived products [4]. This combination resulted in several approved products, targeting Influenza (Flublok®), cancer (Cervarix® and Provenge®), and at least one rAAV-based gene therapy (Glybera) [5,6]. Production of rAAV in the IC-BEVS requires two baculovirus: one coding for the AAV rep and cap functions and the other one providing the transgene flanked by the AAV Inverted Terminal Repeats (ITRs) [7].
Since 2004, with the introduction of the Process Analytical Technology (PAT) initiative by the USA Food and Drug administration (FDA) [8], regulatory entities have become increasingly more stringent regarding the end product quality attributes of biopharmaceutical products [9]. By encouraging the pharmaceutical industry to develop tools to characterize the pharmaceutical product and manufacturing process, in the end yielding biological products with consistent quality, the PAT initiative facilitates regulatory approval of new drugs. With that aim, the use of real-time monitoring tools for process characterization and product monitoring is strongly encouraged [9,10].
The ability to monitor in real-time the insect cell-baculovirus system would be greatly beneficial for manufacturing robustness particularly around the time of infection and the time of harvest. Infection timing and cell density have been shown to be critical parameters to maintain cell specific productivities (number of rAAV particles produced per cell and per unit time) [11,12]. Harvest timing also remains critical giving the lytic nature of the baculovirus and consequential release of proteases, which can compromise product quality [11,13,14,15]. Finally, the ability to estimate the rAAV titer in real-time is also highly desirable to harvest rAAV when its concentration is higher and as a means to monitor production batches.
Several types of sensors have been applied for monitoring of cell culture processes, based on imaging techniques [16,17,18] and spectroscopy such as infrared (mid and near), Raman, and fluorescence [15,19,20,21,22].
Another spectroscopy tool with proven applications for monitoring cell size and biovolume is dielectric spectroscopy, as demonstrated for bacteria, yeast, plant, and mammalian cells [22,23,24,25,26,27], with several authors reporting its application for monitoring insect cells in suspension [28,29,30,31,32,33]. This technique is based on the detection of the cell dielectric potential: when an electric field is applied to viable cells, they behave like small capacitors and polarize with a frequency-dependent response. This is due to the dielectric proprieties of the lipid based-cell membrane and the presence of conductive solutes in the extracellular medium and in the cytoplasm [34]. This charge can be detected and quantified, being reported as permittivity (capacitance per membrane area). As such, dielectric spectroscopy is ideal for monitoring infection-based processes, because of the effect that virus formation and release have on the cell membrane as well as in the intracellular composition of the cells [33,35].
The application of dielectric spectroscopy to monitor viral vector production processes is reported in several other works: Zeiser and coworkers correlated permittivity measurements with cell swelling due to intracellular baculovirus production [28]; Ansorge et al. followed the lentivirus budding process by monitoring physiological changes in infected producer cells [36]; Petiot et al. identified critical infection phases in enveloped and nonenveloped viruses, produced using transfection and infection methods [33]; Grein and coworkers used the culture permittivity measurements to detect the optimal harvest time in a oncolytic virus production process [13]; Negrete et al. correlated Spodoptera frugiperda (Sf9) cell diameter with rAAV production yield, decreasing the optimal harvest time by 24 h [31]. However, so far there is a lack solutions to monitor the accumulation of viral vectors in real-time [33], which was not addressed in the cited works.
Herein, we explored the capabilities of dielectric spectroscopy for use with the insect cell-baculovirus system during manufacturing of rAAV for gene therapy. To accurately predict baculovirus infection timing a feedback control strategy was developed using on-line permittivity values which greatly improved manufacturing robustness. Additionally, the ability of dielectric spectroscopy to monitor the cell physiological state was explored and prediction models were built for viable cell concentration, viability, and diameter. Finally, by combining the permittivity readings at 18 different frequencies with the beta-dispersion parameters determined for the system, we built a permittivity-based soft sensor for the estimation of intracellular rAAV titers in real-time.

2. Materials and Methods

2.1. Cell line and Culture Medium

Spodoptera frugiperda (Sf9) cells were routinely cultivated in 5 L Corning shake flasks with 3 L working volume of ESF-AF medium (Expression SystemsTM, Davis, CA, USA), at 27 °C with an agitation rate of 80 rpm in an Innova 44R incubator (orbital motion diameter = 2.54 cm, Eppendorf, Enfield, CT, USA). Cell concentration and viability were determined using a Vi-Cell XR Cell Counter (Beckman Coulter, Indianapolis, IN, USA).

2.2. Generation of Transgene-Bacmid and Rep/Cap-Bacmid

A transgene-bacmid and Rep/Cap-bacmid were generated according to a standard Tn7 transposition-based protocol, described as follows. A bacmid artificial chromosome (BAC) was used to generate the transgene-bacmid and Rep/Cap-bacmid, which includes the genome of Autographa californica multicapsid nucleopolyhedrosis virus along with an origin of replication that allows low-copy replication in Escherichia coli (E. coli). Briefly, donor plasmids including either the transgene or AAV rep/cap genes were delivered into DH10Bac E. coli by a standard heat-shock transformation. These E. coli cells contain the bacmid shuttle vector bMON14272 and helper plasmid pMON7124 that encodes the Tn7 transposase complex. Expression of the Tn7 transposase catalyzes excision of the nucleotides spanning (and including) the element Tn7L to the element Tn7R and insertion of these excised nucleotides into the mini-attTn7 site present in the bacmid shuttle vector bMON14272.

2.3. Generation of Transgene-BEV and Rep/Cap-BEV

The resulting transgene-bacmid and Rep/Cap-bacmid were purified. Sf9 cells were then transfected with either the transgene-bacmid or Rep/Cap-bacmid resulting in the expression of the baculovirus genes and the production of the infectious baculovirus expression vectors (BEVs): transgene-BEV or Rep/Cap-BEV, respectively. Briefly, a vial of Sf9 cells was thawed and suspended in protein free SFX Insect cell culture media and serially passaged at 26–28 °C until the viability was ≥80% and the diameter was 13–15 μm. This culture was used to prepare a cell suspension of approximately 1 × 10⁶ cells/mL, which was seeded onto culture plates. Once the cells were attached to the plates, media was removed and replaced with a solution of Grace’s medium (ThermoFisher Scientific, Waltham, MA, USA) and Cellfectin transfection reagent (ThermoFisher Scientific, Waltham, MA, USA) containing either the purified transgene-bacmid or Rep/Cap-bacmid. The transfected plates were incubated initially for 4–5 h. After removal of the transfection solution, fresh SFX Insect™ cell culture media was added, and the plate was incubated for an additional 3–4 days at 27 °C. The resulting BEVs were harvested, dispensed into a tube, and stored at 2–8 °C. Baculovirus titer was determined by using a BacPAK Baculovirus Rapid Titer Kit (Clontech Laboratories Inc. Mountain View, CA, USA or equivalent).

2.4. Generation of Rep/Cap- and Transgene-Baculovirus Infected Insect Cells (BIIC) Banks

Sf9 cells were expanded in shake flasks. Upon reaching the desired viable cell density and viability, the cells were infected with either the transgene-BEV or Rep/Cap-BEV at a multiplicity of infection of 0.01 and incubated for 48 ± 6 h, based on the protocol developed by Wasilko et al. [37]. The resulting Rep/Cap-BIICs and transgene-BIICs were pelleted by centrifugation, resuspended in 1× Cryopreservation medium which consists 1:1 (v:v) of SFX Insect cell culture media and 2× Cryopreservation medium (14% v/v DMSO, 11% m/v trehalose in SFX Insect cell culture media) and transferred into cryovials. The BIIC banks were frozen and stored at ≤−65 °C. The baculovirus titer was determined as described above.

2.5. Production of rAAV Using Rep/Cap-BIIC and Transgene-BIIC Coinfection

To produce rAAV in these experiments, the typical process would include a Sf9 growth phase of 3 days to a desired cell density, a baculovirus infection at a predetermined MOI, a baculovirus/rAAV expansion phase for 6 additional days and a harvest on day 9. Sf9 host cells were grown as a batch culture and coinfected with the two BIIC banks: Rep/Cap-BIIC and transgene-BIIC. Rep/Cap-BIIC provided the AAV2 Rep (replicase) and AAV1 Cap (capsid) genes to form capsids into which transgenes are packaged. The transgene-BIIC provided the transgene expression cassette containing a promoter region, the gene of interest, and the 5′ and 3′ ITRs. The transgene used in these experiments cannot be disclosed for confidentially reasons, but its identity was not relevant to these studies. Coinfection of Sf9 cultures with both BIIC banks was done either at a low cell density (3 × 10⁶ cells/mL) or high cell density (5 × 10⁶ cells/mL) depending on the experiments. To maintain a consistent multiplicity of infection (MOI), BIIC infection amounts were controlled by using a previously determined ratio of Sf9 cell culture volume to BIIC bank volume.

2.6. Infection of Sf9 Cells with Empty-BIIC Control

Sf9 cells were also infected with the empty-BIIC which was used as a control for model development. The empty-BIIC did not encode for any recombinant AAV or baculovirus transgene, while still allowing infectious baculovirus replication and consequent cytopathic effects. Infection conditions using the empty-BIIC were identical to the transgene or Rep/Cap-BIIC infection conditions, as described above.

2.7. Estimation of rAAV Titer by qPCR

Recombinant adeno-associated virus (rAAV) intracellular titer was measured using an in-house developed absolute quantification real-time PCR assay. Briefly, independent duplicates of each sample are incubated with DNAse (TekNova, Hollister, CA, USA) at 37 °C, in order to degrade extracellular DNA. Subsequently DNAse I is inactivated by addition of EDTA and followed by incubation with proteinase K (TekNova, Hollister, CA, USA) at 55 °C to degrade the rAAV capsids and release the encapsidated DNA. Proteinase K was deactivated by heating to 95 °C for 10 min. Digested material was subsequently diluted 40-fold in 10 mM Tris, pH 7.5. A 7-point, 10-fold serially diluted plasmid standard (in duplicate), containing the target sequence, was included on the 96-well dilution plate (VWR, Radnor, PA, USA) to allow for absolute quantification. On a separate 96-well lightcycler plate (Roche, Pleasanton, CA, USA) final 5-fold dilutions of both samples and plasmid standards were prepared in PCR mix (primer probes (IDT, Coralville, IA, USA) + mastermix (ThermoFisher Scientific, Waltham, MA, USA) each and the resulting final plate(s) were analyzed on a LightCycler 480 II Real-time PCR Thermocycler (Roche, Pleasanton, CA, USA). The PCR cycle profile consists of an initial polymerase activation step at 95 °C for 10 m, followed by 45 cycles consisting of a denaturation step at 95 °C for 10 s, an annealing step at 60 °C for 10 s, at the end of the 45 cycles a final extension step at 72 °C for 10 s was performed. Amplification results were analyzed using Roche Lightcycler 480 Software, samples and standards were indicated as appropriate and previously established plasmid standard values (copy numbers determined by orthogonal means) were entered. The software establishes a calibration curve and calculates reaction efficiency and standard curve error. If the curve passes preset acceptance criteria the samples are interpolated on the standard curve and the copy number for each sample is back-calculated using the total dilution factor.

2.8. Bioreactor Cultures and Sample Processing

Bioreactor cultures were performed in benchtop Finesse 3 L bioreactors (Finesse Solutions Inc, Santa Clara, CA, USA) with 1.6 L culture volume, equipped with one turbine with three blades tilted at 45° angle (“elephant ear” turbine). Temperature control (27 °C) was achieved using a heating jacket. Dissolved oxygen (DO) concentration was kept at 40% by continuous flow of air over the headspace and on-demand supply of air and O2 mixtures using a L-shaped sparger in the bottom of the vessel. The stirring rate was kept at 200 rpm. All controller action was ensured by Finesse Controllers and DeltaV software (St. Louis, MO, USA). Bioreactors were seeded at 1.1 × 10⁶ Sf9 cells/mL. Infection was performed at different cell densities: 3 × 10⁶ cells/mL for “standard”, “empty” and “blend” batches and 5 × 10⁶ cells/mL for “cell density effect” batches (see 
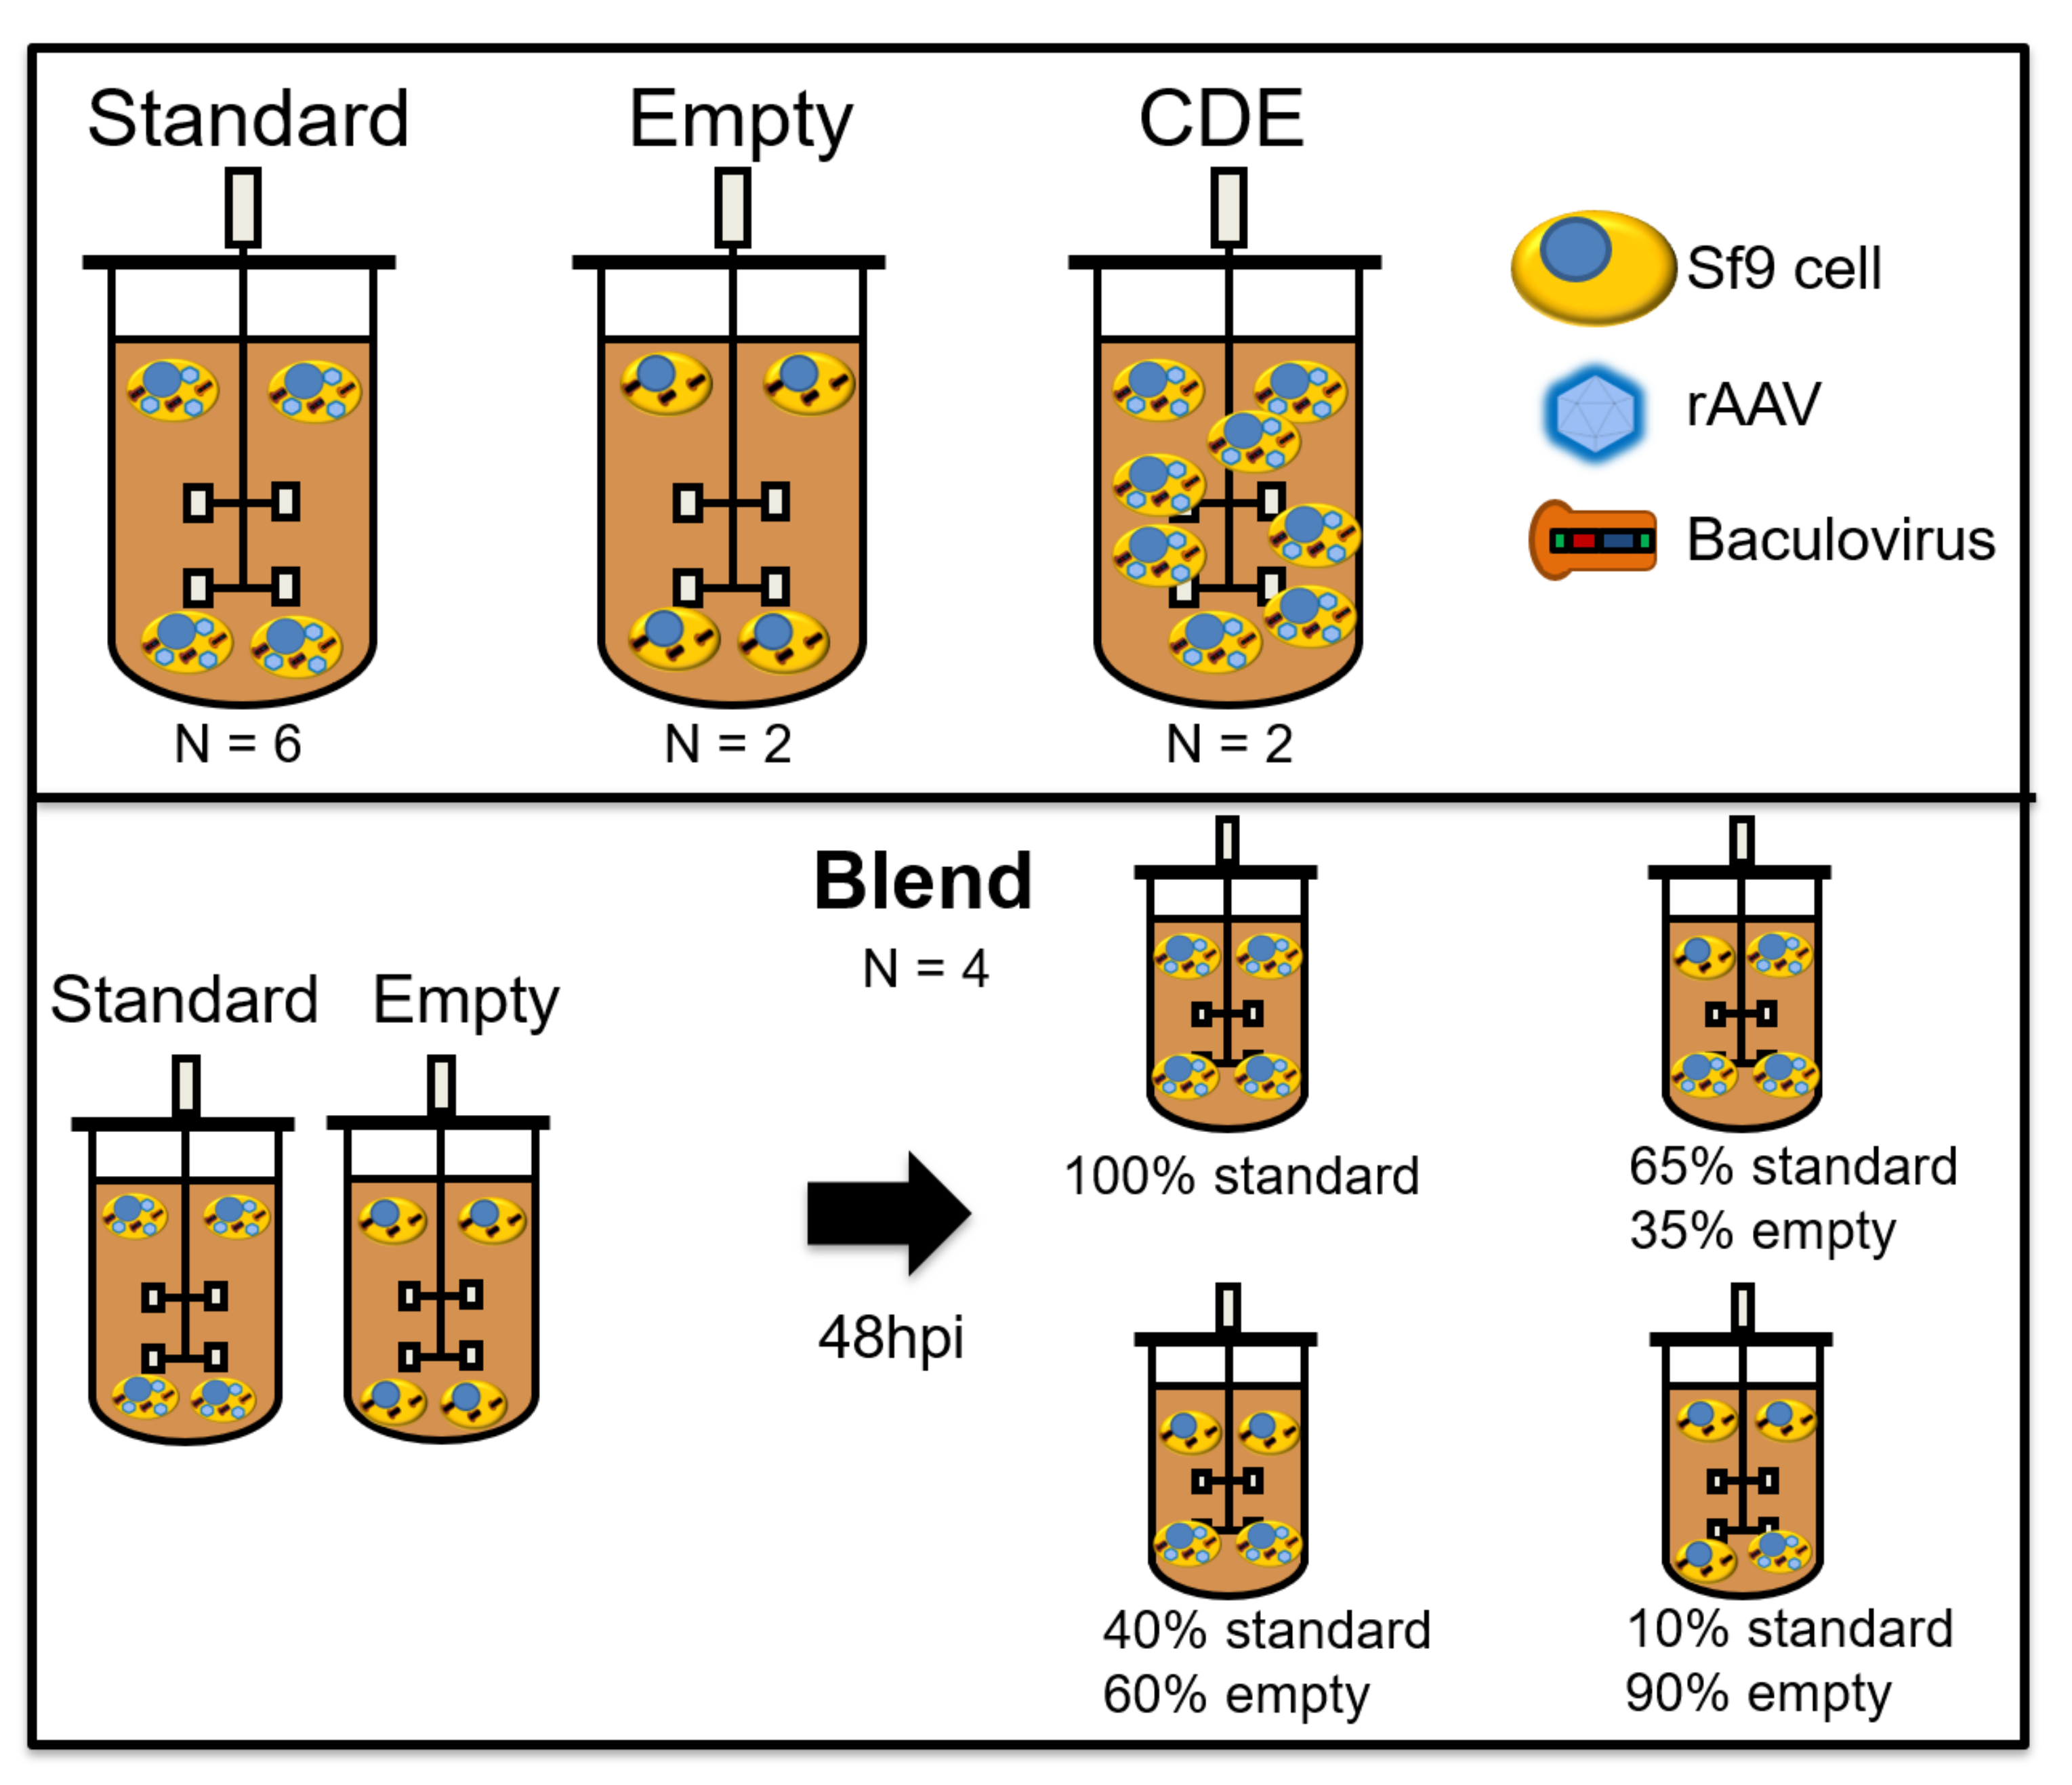
Figure 1), at the volume of culture to BIIC volume ratios indicated above. “Empty” and “blend” batches were added to increase model robustness and decouple permittivity signals associated to rAAV production from permittivity signals induced by Sf9 cell growth and baculovirus replication. For empty runs, empty-BIICs were added to the Sf9 cultures at a total volume to volume ratio as both the Rep/Cap and transgene-BIICs. For “blend” batches, both “standard” and “empty” infections were performed in separate bioreactors. On day 2 post-infection, cells from both reactors were transferred to another bioreactor, with the following ratios of “standard” to “empty” (100:0; 65:35; 40:60; 10:90), in a total of 1.3 L working volume. The multiplicity of infection (MOI) was kept constant for every batch.
The Incyte sensor (Hamilton, Reno, NV, USA) was inserted in a standard 19 mm bioreactor top port, to perform in situ permittivity and conductivity measurements. After sterilization, sensor readings were zeroed with culture medium, after allowing enough time for the permittivity and conductivity signals to stabilize at 27 °C. Permittivity and conductivity measurements were performed every 6 min, with permittivity measurements obtained in a range of 18 frequencies between 300 and 10,000 kHz. Measurements were recorded using the ArcView instrument (Hamilton, Reno, NV, USA). In the “blend” experiments, only the “blend” bioreactors were monitored with Incyte, this being the reason why there are no permittivity measurements before day 2 post-infection.
Sampling for determination of reference variables was done three times per day before infection and four times per day after infection. At each sampling point, cell concentration and viability were measured using Vi-cell Counter. For rAAV determination, 10 mL of culture supernatant were subjected to a clarification step (1000 g, 10 min) to separate intra and extracellular rAAV. Supernatant was discarded, and the pellet resuspended in an equal volume of fresh medium, to which a 1.3 mL of lysis solution was added. Samples were left agitating at 27 °C, 200 rpm, for approximately 24 h, centrifuged (4000× g, 5 min), filtered through a 0.2 µm syringe filter and stored at 4 °C until analysis.

2.9. Process-to-Target Script to Predict Time of Infection

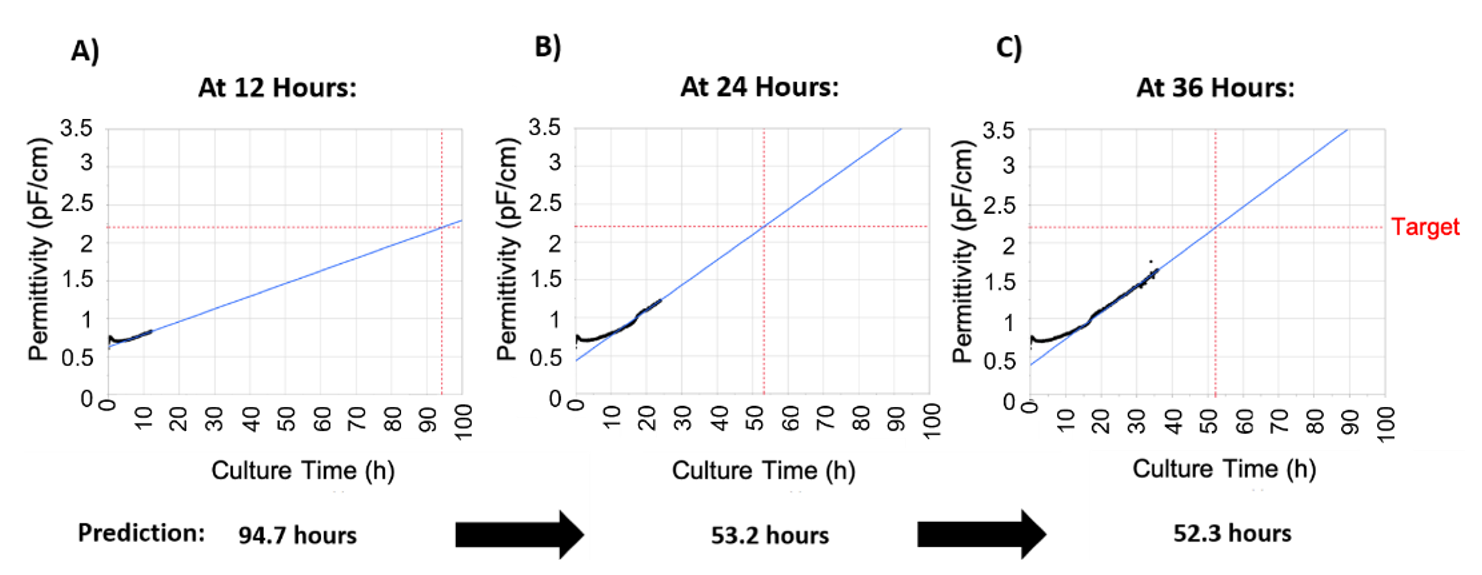
The process-to-target is an in-house script which runs in the JMP (SAS Institute, Cary, NC, USA) programming language. The process-to-target script predicts the infection timing based on all the measured permittivity values for the 1000 kHz frequency, considering timepoints from cell seeding to the moment the script is run. It is based in a time-weighted linear model of permittivity. Briefly, the script plots the permittivity values from the Incyte probe and the corresponding time in hours since the beginning of the run. Each data point is given a weight (Time7), with later timepoints having a significantly higher weight when compared to earlier time points, avoiding the inherent nonlinearity of the initial portion of the permittivity curve (corresponding to the lag phase). A weighted linear model is then fit to the data and the model values are saved. Using the target permittivity, the model values are used to calculate the time in hours at which the culture will reach infection density. The time remaining to infection is also calculated using the current time. The script outputs the graphical results as demonstrated in Section 3.

2.10. Modeling Strategy and Software

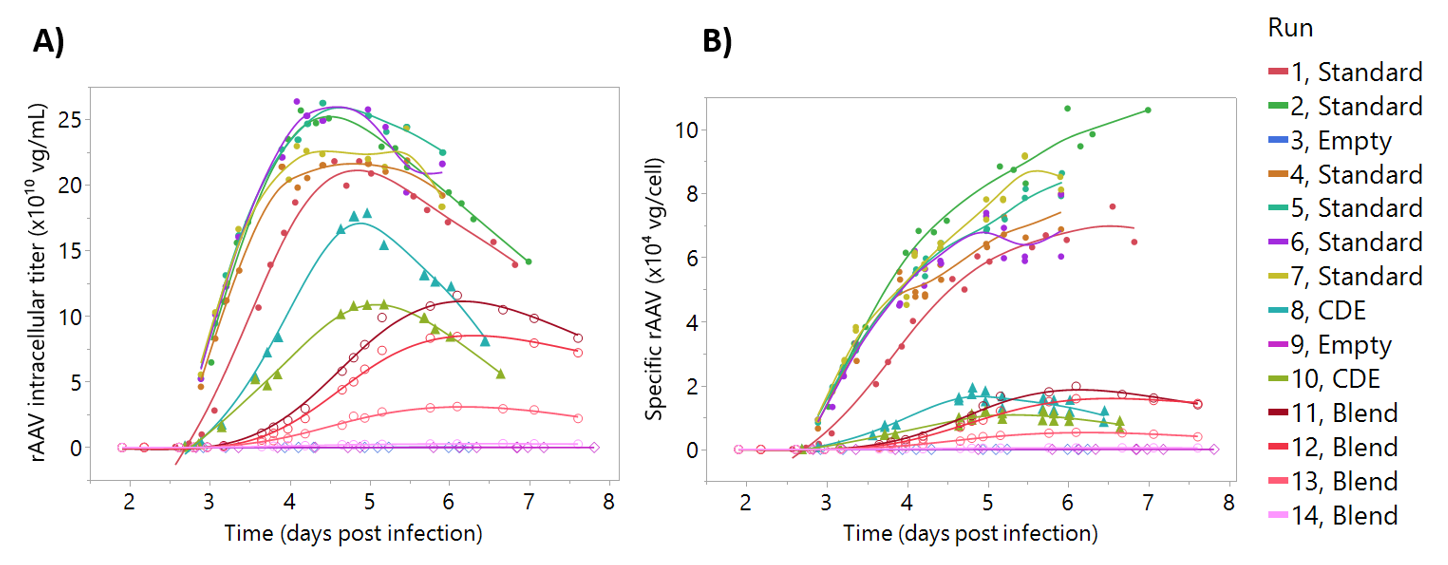
A total of 14 bioreactors were run in different conditions: six “standard” runs, two “cell density effect” runs, two “empty” runs, and four “blend” runs (Figure 1). All analysis and modeling were performed in JMP v14 (SAS institute, Cary, NC, USA). The Incyte data consisted of 22 variables: permittivity measured at 18 different frequencies, medium conductivity and three beta-dispersion curve parameters (alpha, characteristic frequency, and Δε). All these variables were automatically calculated by the Incyte sensor. After run completion, the Incyte data was smoothed using a 30-min (five datapoints) moving average filter. This data was time-aligned with the corresponding sampling points (reference data). Biovolume was calculated based on the viable cell concentration and the cell diameter measurements, considering cells as perfect spheres (Equation (1)).
B i o v o l u m e = Viable   cell   concentration   × 4 3 π c e l l   r a d i u s 3
For calibrating the models, the offline reference data obtained from Vi-cell measurements and corresponding online averages for permittivity measurements were used. The dataset was divided into calibration and testing set, with two “standard” batches (numbered 5 and 7) as the testing set and the remaining belonging to the calibration set.
Models were developed using JMP “Fit model” platform. Briefly the 22 parameters were subjected to forward and backwards stepwise regression to find the most significant parameters to each of the reference variables. In the forward stepwise regression method, the most significant attribute was identified and added to the model, followed by identification and inclusion in the model of the second most significant attribute and so on. In a backwards stepwise regression method, all parameters were added to the model in the beginning and were stepwise removed according to their lack of significance to the model. The significance level considered was p-value = 0.05. For the most significant attributes, their two-level interactions and quadratics were also considered, using the same combination of forward and backwards stepwise regression.
RMSEs for calibration (RMSEC) and testing (RMSET) were calculated for all models (Equation (2)). The correlation coefficients of calibration and testing were calculated according to Equation (3) using calibration (R2) or testing (Q2) data.
In Equations (2) and (3), y ^ represents a vector of model-predicted values and y represents the corresponding reference data; ncal and ntest represent the number of samples in the calibration or testing set, respectively. σ2 represents sample variance.
R M S E C = i = 1 n c a l y ^ y 2 n c a l . R M S E T = i = 1 n v a l y ^ y 2 n t e s t .
R 2 = 1 R M S E C 2 σ 2 . Q 2 = 1 R M S E T 2 σ 2 .

3. Results

3.1. Accurate Prediction of Infection Timing Using Continuous Permittivity Monitoring

Accurate targeting of cell concentration at the time of baculovirus infection is critical to maintain rAAV titers due to the so called “cell density effect” [12]. To understand this critical parameter, Sf9 cells were infected with baculovirus expressing rAAV at different cell concentrations from 2 × 10⁶ to 6 × 10⁶ cell/mL. Figure 2A shows 3 × 10⁶ cells/mL to be the ideal cell concentration at infection to reach a maximum titer value (≈6 × 10¹¹ vg/mL). Infections above 3.5 × 10⁶ cells/mL demonstrated a dramatic decrease in rAAV titer and cell specific productivity. At 5–6 × 10⁶ cell/mL rAAV titers were below the limit of detection. Figure 2B shows the linear relationship between specific rAAV productivity and Sf9 concentration at infection.
To better understand cell concentration variability at time of infection, growth data from multiple 2 L bioreactor production runs were analyzed. Figure 2C shows significant batch to batch variability in cell growth, most likely due to small changes in inoculation density. For example, if the target cell concentration at infection to reach maximum rAAV titer was 3 × 10⁶ cells/mL, the timing of infection would vary anywhere from 45 to 65 h post inoculation, which necessitates constant sampling close to the time of infection in order to achieve an accurate cell concentration.
To make infection timing robust and operator-independent, a strategy of predicting the time of infection was developed called process-to-target. This strategy was based on the real-time availability of permittivity measurements provided by the Incyte sensor. The first step was to determine the correlation between permittivity and viable cell concentration, which is linear during the exponential growth stage, as shown in Figure 2D. As such, the permittivity corresponding to the target cell concentration was determined to be 2.2 pF/cm (95% confidence intervals (CI) of 2.18–2.34 pF/cm). The process-to-target script was then developed to continuously predict the timing of infection in real-time after each permittivity measurement, where the model inputs were permittivity, acquisition time, and the target permittivity value. To obtain a linear model from a nonlinear dataset, the process to target model used a weighted fit where a weighted time was calculated by giving more weight to later time points. As expected, this linear model demonstrated poor prediction accuracy at early time points but as the cell growth progressed these model predictions would converge on a time at which the permittivity would reach the target of 2.2 pF/cm with an accurate prediction occurring 24–48 h in advance. This is demonstrated in Figure 3, where an accurate prediction for baculovirus infection was achieved at 24 h post inoculation, providing >24 h in advance warning of the infection time.
To validate “process to target” predictions, the algorithm was tested on 10 2-L bioreactor runs. Table 1 shows the actual vs. the predicted infection timings at 6, 12, 24, and 48 h post-inoculation. As stated, prediction accuracy improved at later time points as the availability of more data allowed the model to converge on the actual time. Accurate predictions were obtained as early as 24 h post-inoculation in all runs and the process-to-target strategy clearly demonstrated a robust method to ensure accuracy of a critical process parameter were the manufacturing operator can be informed well in advance the precise time of baculovirus infection.

3.2. Dielectric Spectroscopy for Monitoring the Progress of Baculovirus Infection In Situ

Correlation of the dielectric spectroscopy parameters conductivity, permittivity, beta-dispersion, and characteristic frequency to critical process parameters such as cell concentration, cell viability, and virus production allows for the development of on-line models to monitor critical process parameters. As shown in Figure 4A, culture conductivity increases simultaneously with the onset of baculovirus-induced cell lysis, suggesting that conductivity can be used to build predictive models of cell death post viral infection (Figure S1). The beta-dispersion curve and curve parameters (Δε, α, and characteristic frequency) can be derived from measurements of permittivity over a wide range (Figure 4B). This curve is indicative of changes in the cell state during the production process [33] and can be used to understand changes in cell size and viability (Figure S2). Permittivity has been shown to correspond to cell concentration [32,33] and can be used to calculate a biomass or cell density (Figure 4C). The characteristic frequency signal has been used to monitor baculovirus budding from infected cells, through a “v-shape” profile in the characteristic frequency of the culture [33]. In Figure 4D we also demonstrate this “v-shaped” profile in the infected cells. This way, dielectric spectroscopy is ideally suited to follow in real-time a complete insect cell baculovirus infection process: cell seeding, cell growth, infection density, baculovirus-induced cell diameter increase, cell growth arrest, and finally cell death.
Prediction models for viable cell concentration, percent viability, and average cell diameter were built using the above dielectric spectroscopy parameters and the calibration/testing sets described in Section 2. Figure 5A shows the observed vs. predicted values for the viable cell concentration model, giving an R2 value of 0.96. To validate the model, time-course profiles of viable cell concentration measured by Vi-Cell for two batches were compared with the corresponding model predictions (Figure 5B). The models demonstrated high accuracy with a Q2 of 0.89 and only a slight underestimation of the viable cell concentration.
For percent viability models the observed vs. predicted profile can be seen in Figure 5C, giving an R2 of 0.98 with a large dynamic range. The prediction profiles (Figure 5D) are also remarkably accurate with Q2 of 0.98. This prediction accuracy held throughout growth phase, stationary phase, and death phase, demonstrating the prediction model can be used throughout culture. Finally, since measuring changes in cell diameter is often a useful indicator of the progress of baculovirus infection, models for cell diameter were developed giving an R2 of 0.94 and a high validation accuracy with Q2 of 0.92 (Figure 5E,F). Similar to the viability models, cell diameter models were accurate during all phases of the cell growth and infection.

3.3. Detection of rAAV-Induced Signals Using Multiple Linear Regression

A prediction model to measure in real-time intracellular rAAV production was developed using similar modeling strategies to the process parameter models. Supernatant rAAV concentrations were not considered since dielectric spectroscopy measures variations in the intracellular composition of the cell. The model was trained using a bioreactor dataset shown in Figure 6 where both the intracellular rAAV titer (rAAV quantified in the lysed pellet solution) and the specific rAAV titer are shown (intracellular titer normalized by viable cell concentration). As described in Section 2, rAAV production was decoupled from cell growth and baculovirus replication by adjusting infection cell densities and using a “blend batch” strategy (Figure 1). This resulted in a dataset giving a wide range of rAAV titers at both low and high cell concentrations. In particular, specific rAAV production titer was greatly reduced by infecting cells at high cell density (Figure 6B, blue and green triangles), where infection at a low cell density gave much higher titers (filled circles). The “blend batch” strategy also had the desired effect of providing rAAV concentration profiles at different ranges and is shown as the open circles in Figure 6.
Using this dataset, a multiple linear regression model to predict rAAV by dielectric spectroscopy was developed. The observed vs. predicted dataset used for the model calibration gave an R2 of 0.71 (Figure 7A). Good predictions were obtained for blend batches, which confirmed the model ability to predict rAAV production batches. The model was validated using two independent bioreactor runs as a testing set, resulting in acceptable predictions with a Q2 of 0.77 (Figure 7B).

4. Discussion

In this work we employed dielectric spectroscopy for accurate prediction of infection timing in the insect cell-baculovirus system. Moreover, we developed predictive models for cell concentration, viability, diameter, and rAAV production, which can be used to follow the progress of baculovirus infection and recombinant AAV production in real-time.
The time of infection is one of the most important process parameters in the insect cell system, with direct implications on rAAV production [11,34]. Current methods for infection timing require frequent offline cell-counting and are prone to error due to equipment variability and operator dependency. Additionally, frequent sampling increases the chance for contamination. Real-time, continuous monitoring of viable cell concentration can alleviate this issue. One of the real-time monitoring tools extensively applied to monitor cell concentration in cell culture processes is dielectric spectroscopy [14,22,38], which has also been demonstrated in the insect-cell system [28,29,30,31,32,
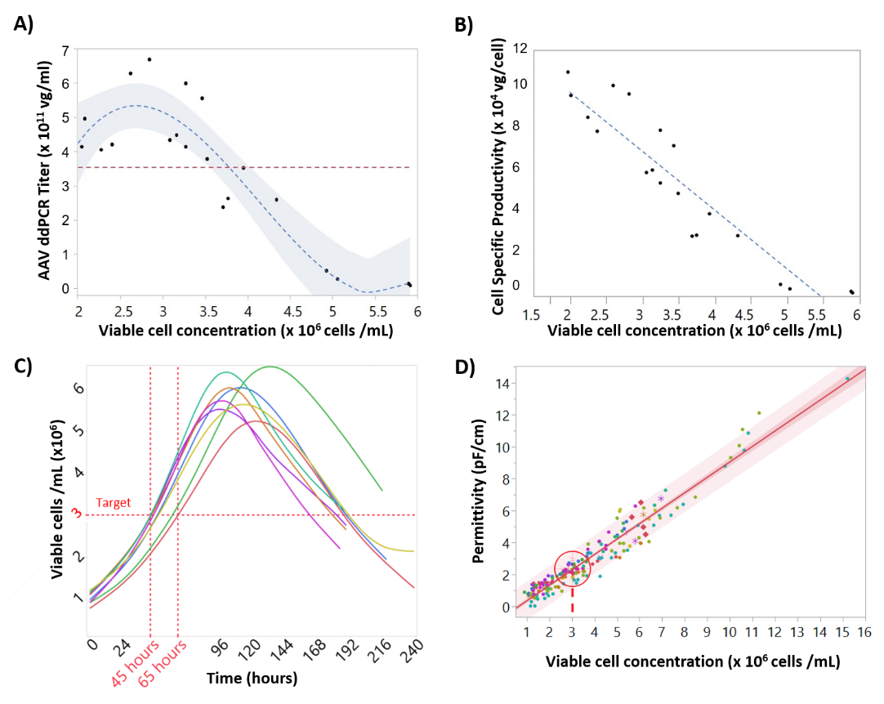
33]. Taking advantage of the frequent Incyte permittivity measurements and the high correlation between permittivity and cell concentration (Figure 2D), we applied dielectric spectroscopy to predict infection timing (Figure 3). An in-house JMP script (process-to-target) was developed, which used real-time permittivity data to accurately predict infection timing. The prediction model was designed to converge on an accurate prediction of infection timing as more data became available (Table 1). This tool was able to predict infection timing within 10% of the actual infection time as early as 24 h post-inoculation and at least 24 h pre-infection. This amount of prior notice would allow for more robust manufacturing and batch to batch consistency. Importantly, the process-to-target script was operator independent, reducing dependence on sampling and any potential operator error at one of the most critical stages of the rAAV production process.
The process-to-target relies on the linear correlations between permittivity and cell concentration and viability and conductivity (
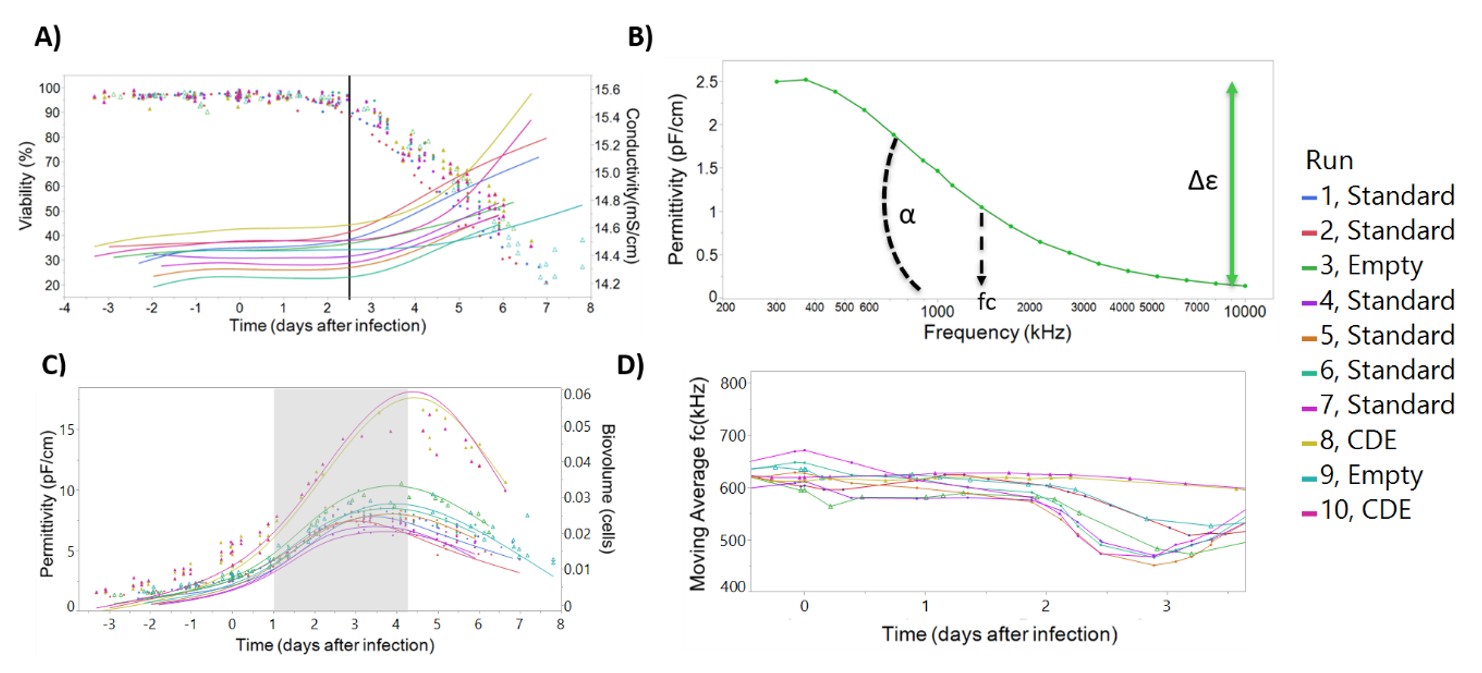
Figure S3). However, the correlations obtained for one batch cannot be used directly in another batch. We even detected a significant difference in the obtained linear regression slope for permittivity and cell concentration in different cell banks (results not shown). Moreover, even though the same medium was used in parallel bioreactors and the Incyte probe was zeroed in the medium, the conductivity measurements had a baseline reading which is different between batches (Figure 4A). Therefore, the process-to-target was developed as a feedback loop that continually adjusted its prediction in real-time making it sufficiently robust for batch to batch manufacturing purposes.
Further development of the process-to-target script is ongoing. Taking into account the inverse linear correlation between the onset of viability decrease and the onset of conductivity increase (Figure 4A and Figure S1), experiments are continuing to switch from a “by day” -based harvest into a viability-based harvest and adapting the process-to-target to the conductivity measurements to accurately predict harvest time. The choice of the best viability to harvest is dependent not only on the final rAAV titer but also the vector potency and the overall downstream yield [11,13,14].
Due to the batch to batch variability, robust prediction models for viable cell density, viability, cell diameter, and rAAV titer based on conductivity and/or permittivity-only measurements could not be used. Consequently, the beta-dispersion curve was included in modeling these critical process variables which reduced any variability seen in the datasets and improved model robustness. These changes can be quantified by calculating the beta-dispersion curve parameters over time: the difference between the low and high frequency plateaus (Δε), the Cole-Cole α (α), and the curve inflexion point (characteristic frequency, fc). These parameters have been shown to be useful for characterizing the culture and building accurate models. For instance, α is related with the distribution of the dielectric properties in the population and the cell shape and size [32,39]; Δε is proportional to cell concentration and biovolume [33], and fc has been demonstrated to be correlated with the cell death phase and virus budding [33,36]. A more in-depth review of the biological meaning of each parameter can be seen in Dabros et al. [39].
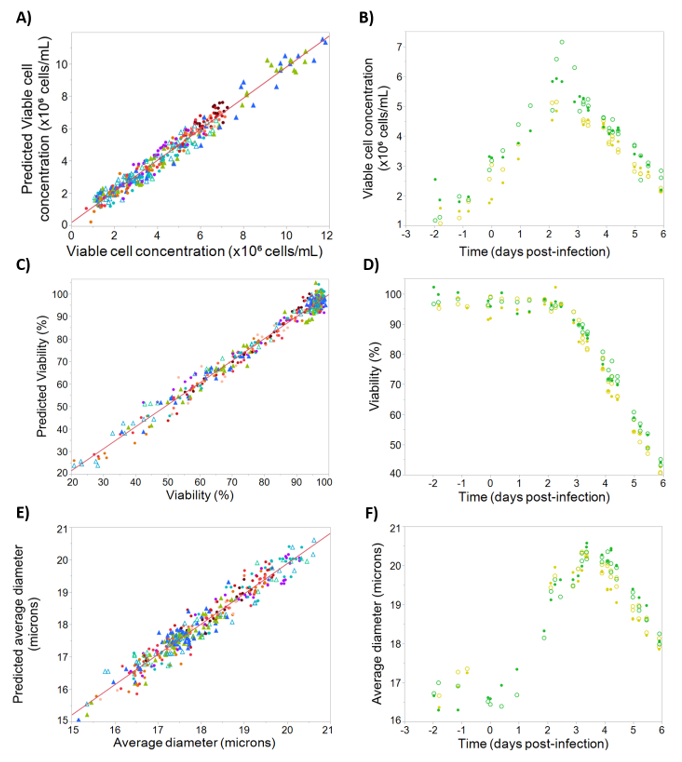
The models for viable cell concentration, viability, cell diameter, and rAAV titer are shown in Figure 5 and Figure 7. They were built using the previously described calibration datasets and the above-mentioned beta-dispersion parameters and frequency measurements. Besides multiple linear regression, we also tested partial least squares (PLS) regression and artificial neural networks. Multiple linear regression models combined simplicity with accurate predictions, and thus it was the strategy followed for developing predictive models. The high Q2 obtained for each model demonstrated that dielectric spectroscopy signals can be used to predict these critical process parameters.
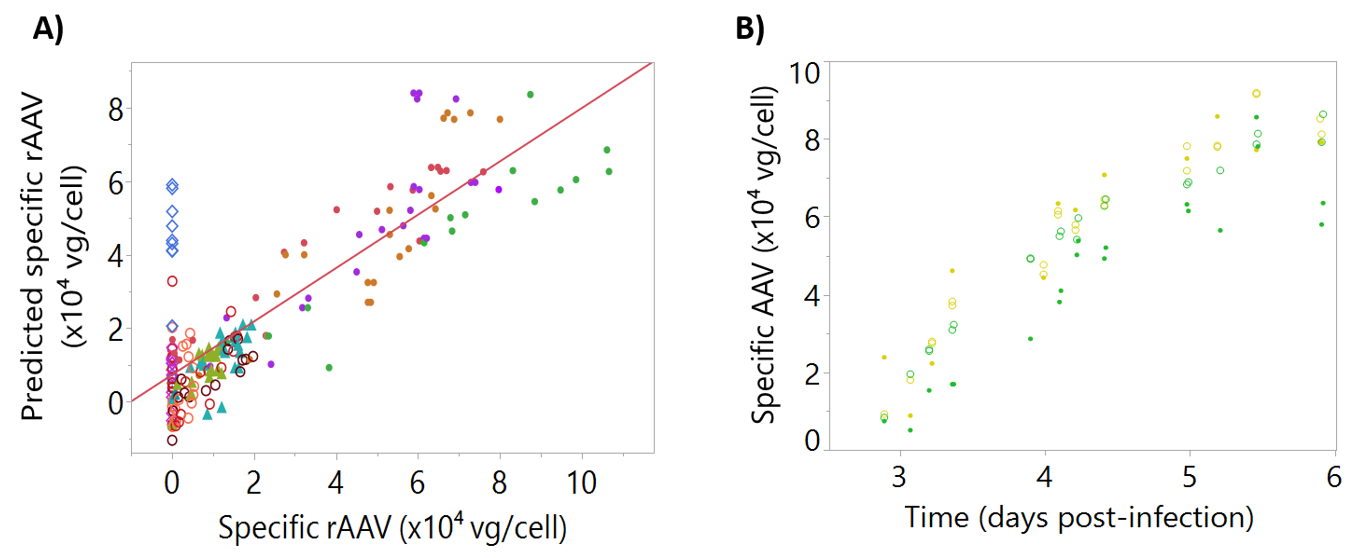
For the development of rAAV titer models (Figure 7) extracellular rAAV titer was excluded from the models because our hypothesis was that most rAAV-induced alterations to the cell state would be detected through variations in the intracellular composition of the cell. Moreover, measuring intracellular rAAV data contributed to an increased understanding of our production process (Figure 6). For instance, as culture progresses and cell lysis starts to occur, the number of viable cells producing rAAV decreases (Figure 6). Due to this decreasing number of viable cells, the rAAV production tends to plateau around day 5. As such, we may be able to harvest our process one day earlier, depending on rAAV product quality profiles. The addition of cultures infected at higher cell density was intended to introduce variability in the model, based on the known drop in cell specific productivities when infecting high cell density cultures [40,41,42]. Similarly, the “blend” batch strategy was intended to decouple rAAV permittivity signals from cell and baculovirus-induced permittivity changes. This strategy was successful in generating batches with decreasing rAAV concentration, keeping the cell concentration and baculovirus infection at similar levels (Figure 6). However, even though infection was performed at 3 × 10⁶ cells/mL, these runs have a rAAV production profile similar to the “cell density effect” batches (Figure S4). This was likely associated to the stressful condition of transferring the cells from the first bioreactor to the “blend” bioreactor. Although the “blend” strategy produced titers lower than expected, the resulting calibration set was more than sufficient to develop an accurate model and did not impact model predictions.
Dielectric spectroscopy has previously been used to monitor baculovirus release from infected cells. Petiot and coworkers found a characteristic “V-shape” profile in the characteristic frequency time-course profile, and associated that signal with viral budding from the infected cells [33]. In Figure 4D, we also observed a significant drop in the permittivity around day 2 post-infection. Given that our infection process takes place at a very low MOI, it takes 2 days to infect a significant proportion of the Sf9 population for the baculovirus release from the cells be detectable. As a control group, the two “cell density effect” batches do not show the decrease in the characteristic frequency value on day 2, but instead on day 4, since the higher cell concentration at infection is able to delay detection of the cell growth arrest induced by baculovirus. Moreover, we were able to develop good prediction models for the cell diameter, an indicator of the progress of baculovirus infection [43,44]. This knowledge coupled to “V-shape” in characteristic frequency may be useful for characterizing the baculovirus release kinetics and prediction of baculovirus release from infected cells.

5. Conclusions

The work developed clearly shows dielectric spectroscopy can be used as a PAT tool for this system, not only by allowing accurate infection time determination, but also for rAAV production monitoring. The ability to estimate the time of infection more than 24 h before is invaluable for GMP settings, proving the usefulness of the process-to-target approach. The predictive models developed for critical process parameters demonstrate accurate predictions for viable cell concentration, viability, and diameter in an independent testing set, validating the chosen strategy, and can be used for developing viability-based harvest methods. The determined intracellular rAAV production profiles, together with the developed rAAV prediction models, allow to increase process knowledge regarding this process, and to possibly unveil new factors influencing rAAV production by conducting process alterations and supplements administration and assess their impact on rAAV production in real-time. Future studies will address the possibility of applying this tool for determination of rAAV quality characteristics, such as potency or ratio of empty to full particles.

Supplementary Materials

The following are available online at https://0-www-mdpi-com.brum.beds.ac.uk/2227-9717/8/11/1456/s1, Figure S1: Viability reference data and corresponding predictions using only the conductivity data, Figure S2: Representative beta dispersion curve evolution profiles for different culture phases, Figure S3: Linear correlation between permittivity and viable cell concentration and conductivity and viability, Figure S4: Scores for the two first principal components for all runs.

Author Contributions

Conceptualization, D.A.M.P. and P.G.S.; methodology, D.A.M.P., C.B., A.N., K.M., P.G.S.; software, C.B.; formal analysis, D.A.M.P., C.B., A.N., K.M., P.G.S.; investigation, D.A.M.P., A.N.; resources, P.G.S.; data curation, C.B.; writing—original draft preparation, D.A.M.P.; writing—review and editing, D.A.M.P., C.B., A.N., K.M., I.A.I., P.M.A., P.G.S.; visualization, D.A.M.P., I.A.I., P.M.A., P.G.S.; supervision, K.M., I.A.I., P.M.A., P.G.S.; project administration, P.G.S.; funding acquisition, P.G.S. All authors have read and agreed to the published version of the manuscript.

Funding

This research received no external funding.

Acknowledgments

The authors would like to thank Luís Maranga for his continual support of this research as well as the process development analytical team at Voyager for processing so many titer samples and the Cell Culture Development group for their support and help in setting up, running, and sampling reactors. Jacob Crowe from Hamilton is acknowledged for the initial set up of the system and exploratory data analysis. Finally, we would like to thank Tom Little of Thomas Little Consulting for his advice building JMP models and help in developing the process-to-target script.

Conflicts of Interest

Krishanu Mathur and Peter Slade are employees of Voyager Therapeutics, Inc. Chris Brown is employee of Vedere Bio. The remaining authors declare no conflict of interest. The founding sponsors had no role in the design of the study; in the collection, analyses, or interpretation of data; in the writing of the manuscript, and in the decision to publish the results.

Abbreviations

AAVAdeno-associated virus
BEVBaculovirus expression vector
BIICBaculovirus-infected insect cell
FDAFood and Drug administration
ITRInverted Terminal Repeat
PATProcess analytical technology
Sf9Spodoptera frugiperda cell line

References

  1. Xu, Z.; Shi, C.; Qian, Q. Scalable manufacturing methodologies for improving adeno-associated virus-based pharmaprojects. Chin. Sci. Bull. 2014, 59, 1845–1855. [Google Scholar] [CrossRef]
  2. Galibert, L.; Merten, O.W. Latest developments in the large-scale production of adeno-associated virus vectors in insect cells toward the treatment of neuromuscular diseases. J. Invertebr. Pathol. 2011, 107, S80–S93. [Google Scholar] [CrossRef] [PubMed]
  3. Penaud-Budloo, M.; LeComte, E.; Guy-Duché, A.; Saleun, S.; Roulet, A.; Lopez-Roques, C.; Tournaire, B.; Cogné, B.; Léger, A.; Blouin, V.; et al. Accurate Identification and Quantification of DNA Species by Next-Generation Sequencing in Adeno-Associated Viral Vectors Produced in Insect Cells. Hum. Gene Ther. Methods 2017, 28, 148–162. [Google Scholar] [CrossRef] [Green Version]
  4. Yee, C.M.; Zak, A.J.; Hill, B.D.; Wen, F. The Coming Age of Insect Cells for Manufacturing and Development of Protein Therapeutics. Ind. Eng. Chem. Res. 2018, 57, 10061–10070. [Google Scholar] [CrossRef] [PubMed]
  5. Monteiro, F. Rational Design of Insect Cell-based Vaccine Production—Bridging Metabolomics with Mathematical Tools to Study Virus-Host Interactions. Ph.D. Thesis, Instituto de Tecnologia Química e Biológica António Xavier, Universidade Nova de Lisboa, Oeiras, Portugal, September 2015. [Google Scholar]
  6. Shahryari, A.; Jazi, M.S.; Mohammadi, S.; Nikoo, H.R.; Nazari, Z.; Hosseini, E.S.; Burtscher, I.; Mowla, S.J.; Lickert, H. Development and Clinical Translation of Approved Gene Therapy Products for Genetic Disorders. Front. Genet. 2019, 10, 868. [Google Scholar] [CrossRef] [PubMed] [Green Version]
  7. Smith, R.H.; Levy, J.R.; Kotin, R.M. A Simplified Baculovirus-AAV Expression Vector System Coupled With One-step Affinity Purification Yields High-titer rAAV Stocks From Insect Cells. Mol. Ther. 2009, 17, 1888–1896. [Google Scholar] [CrossRef]
  8. US Department of Health and Human Services; Food and Drug Administration (FDA); Center for Drug Evaluation and Research (CDER); Center for Veterinary Medicine (CVM); Office of Regulatory Affairs (ORA). Guidance for Industry PAT—A Framework for Innovative Pharmaceutical Development, Manufacturing and Quality Assurance Pharmaceutical CGMPs. 2004. Available online: https://www.fda.gov/media/71012/download (accessed on 20 March 2020).
  9. Pais, D.A.; Carrondo, M.J.T.; Alves, P.M.; Teixeira, A.P. Towards real-time monitoring of therapeutic protein quality in mammalian cell processes. Curr. Opin. Biotechnol. 2014, 30, 161–167. [Google Scholar] [CrossRef]
  10. Guerra, A.; Von Stosch, M.; Glassey, J. Toward biotherapeutic product real-time quality monitoring. Crit. Rev. Biotechnol. 2019, 39, 289–305. [Google Scholar] [CrossRef]
  11. Lecina, M.; Soley, A.; Gracia, J.; Espunya, E.; Lazaro, B.; Cairó, J.; Gòdia, F. Application of on-line OUR measurements to detect actions points to improve baculovirus-insect cell cultures in bioreactors. J. Biotechnol. 2006, 125, 385–394. [Google Scholar] [CrossRef]
  12. Estrada-Mondaca, S.; Ramirez, O.; Palomares, L. Principles and Applications of the Insect Cell-Baculovirus Expression Vector System. Isol. Purif. Proteins 2005, 18, 627–692. [Google Scholar]
  13. Grein, T.A.; Loewe, D.; Dieken, H.; Salzig, D.; Weidner, T.; Czermak, P. High titer oncolytic measles virus production process by integration of dielectric spectroscopy as online monitoring system. Biotechnol. Bioeng. 2018, 115, 1186–1194. [Google Scholar] [CrossRef] [PubMed]
  14. Nikolay, A.; Léon, A.; Schwamborn, K.; Genzel, Y.; Reichl, U. Process intensification of EB66® cell cultivations leads to high-yield yellow fever and Zika virus production. Appl. Microbiol. Biotechnol. 2018, 102, 8725–8737. [Google Scholar] [CrossRef] [PubMed] [Green Version]
  15. Pais, D.A.M.; Portela, R.M.C.; Carrondo, M.J.T.; Isidro, I.A.; Alves, P.M. Enabling PAT in insect cell bioprocesses: In situ monitoring of recombinant adeno-associated virus production by fluorescence spectroscopy. Biotechnol. Bioeng. 2019, 116, 2803–2814. [Google Scholar] [CrossRef] [PubMed]
  16. Loutfi, H.; Pellen, F.; Le Jeune, B.; Lteif, R.; Kallassy, M.; Le Brun, G.; Abboud, M. Real-time monitoring of bacterial growth kinetics in suspensions using laser speckle imaging. Sci. Rep. 2020, 10, 1–10. [Google Scholar] [CrossRef] [Green Version]
  17. Janicke, B.; Kårsnäs, A.; Egelberg, P.; Alm, K. Label-free high temporal resolution assessment of cell proliferation using digital holographic microscopy. Cytom. Part A 2017, 91, 460–469. [Google Scholar] [CrossRef]
  18. Pais, D.A.M.; Galrão, P.R.S.; Kryzhanska, A.; Barbau, J.; Isidro, I.A.; Alves, P.M. Holographic Imaging of Insect Cell Cultures: Online Non-Invasive Monitoring of Adeno-Associated Virus Production and Cell Concentration. Processes 2020, 8, 487. [Google Scholar] [CrossRef]
  19. Qiu, J.; Arnold, M.A.; Murhammer, D.W. On-line near infrared bioreactor monitoring of cell density and concentrations of glucose and lactate during insect cell cultivation. J. Biotechnol. 2014, 173, 106–111. [Google Scholar] [CrossRef]
  20. Riley, M.R.; Rhiel, M.; Zhou, X.; Arnold, M.A.; Murhammer, D.W. Simultaneous measurement of glucose and glutamine in insect cell culture media by near infrared spectroscopy. Biotechnol. Bioeng. 1997, 55, 11–15. [Google Scholar] [CrossRef]
  21. Marison, I.W.; Hennessy, S.; Foley, R.; Schuler, M.; Sivaprakasam, S.; Freeland, B. The Choice of Suitable Online Analytical Techniques and Data Processing for Monitoring of Bioprocesses. Process Integr. Biochem. Eng. 2012, 132, 249–280. [Google Scholar] [CrossRef]
  22. Mercier, S.M.; Rouel, P.M.; Lebrun, P.; Diepenbroek, B.; Wijffels, R.H.; Streefland, M. Process analytical technology tools for perfusion cell culture. Eng. Life Sci. 2015, 16, 25–35. [Google Scholar] [CrossRef]
  23. Moore, B.; Sanford, R.; Zhang, A. Case study: The characterization and implementation of dielectric spectroscopy (biocapacitance) for process control in a commercial GMP CHO manufacturing process. Biotechnol. Prog. 2019, 35, e2782. [Google Scholar] [CrossRef] [PubMed]
  24. Opel, C.; Li, J.; Amanullah, A. Quantitative modeling of viable cell density, cell size, intracellular conductivity, and membrane capacitance in batch and fed-batch CHO processes using dielectric spectroscopy. Biotechnol. Prog. 2010, 26, 1187–1199. [Google Scholar] [CrossRef] [PubMed]
  25. Justice, C.; Brix, A.; Freimark, D.; Kraume, M.; Pfromm, P.; Eichenmueller, B.; Czermak, P. Process control in cell culture technology using dielectric spectroscopy. Biotechnol. Adv. 2011, 29, 391–401. [Google Scholar] [CrossRef] [PubMed] [Green Version]
  26. Tibayrenc, P.; Preziosi-Belloy, L.; Ghommidh, C. On-line monitoring of dielectrical properties of yeast cells during a stress-model alcoholic fermentation. Process. Biochem. 2011, 46, 193–201. [Google Scholar] [CrossRef]
  27. Liu, Y.; Wang, Z.; Li, L.; Cui, X.; Chu, J.; Zhang, S.; Zhuang, Y. On-line monitoring of the aggregate size distribution of Carthamus tinctorius L. cells with multi-frequency capacitance measurements. RSC Adv. 2016, 6, 89764–89769. [Google Scholar] [CrossRef]
  28. Zeiser, A.; Voyer, R.; Jardin, B.; Tom, R.; Kamen, A. On-line monitoring of the progress of infection in Sf-9 insect cell cultures using relative permittivity measurements. Biotechnol. Bioeng. 1999, 63, 122–126. [Google Scholar] [CrossRef]
  29. Zeiser, A.; Elias, C.; Voyer, R.; Jardin, B.; Kamen, A. On-Line Monitoring of Physiological Parameters of Insect Cell Cultures during the Growth and Infection Process. Biotechnol. Prog. 2000, 16, 803–808. [Google Scholar] [CrossRef]
  30. Elias, C.B.; Zeiser, A.; Bedard, C.; Kamen, A.A. Enhanced growth of Sf-9 cells to a maximum density of 5.2 × 10⁷ cells per mL and production of β-galactosidase at high cell density by fed batch culture. Biotechnol. Bioeng. 2000, 68, 381–388. [Google Scholar] [CrossRef]
  31. Negrete, A.; Esteban, G.; Kotin, R.M. Process optimization of large-scale production of recombinant adeno-associated vectors using dielectric spectroscopy. Appl. Microbiol. Biotechnol. 2007, 76, 761–772. [Google Scholar] [CrossRef]
  32. Ansorge, S.; Esteban, G.; Schmid, G. On-line monitoring of infected Sf-9 insect cell cultures by scanning permittivity measurements and comparison with off-line biovolume measurements. Cytotechnology 2007, 55, 115–124. [Google Scholar] [CrossRef] [Green Version]
  33. Petiot, E.; Ansorge, S.; Rosa-Calatrava, M.; Kamen, A. Critical phases of viral production processes monitored by capacitance. J. Biotechnol. 2017, 242, 19–29. [Google Scholar] [CrossRef] [PubMed]
  34. Druzinec, D.; Salzig, D.; Brix, A.; Kraume, M.; Vilcinskas, A.; Kollewe, C.; Czermak, P. Optimization of Insect Cell Based Protein Production Processes—Online Monitoring, Expression Systems, Scale Up. Process Integr. Biochem. Eng. 2013, 136, 65–100. [Google Scholar] [CrossRef] [Green Version]
  35. Emma, P.; Kamen, A. Real-time monitoring of influenza virus production kinetics in HEK293 cell cultures. Biotechnol. Prog. 2012, 29, 275–284. [Google Scholar] [CrossRef] [PubMed]
  36. Ansorge, S.; Lanthier, S.; Transfiguracion, J.; Henry, O.; Kamen, A. Monitoring lentiviral vector production kinetics using online permittivity measurements. Biochem. Eng. J. 2011, 54, 16–25. [Google Scholar] [CrossRef] [Green Version]
  37. Wasilko, D.J.; Lee, S.E.; Stutzman-Engwall, K.J.; Reitz, B.A.; Emmons, T.L.; Mathis, K.J.; Bienkowski, M.J.; Tomasselli, A.G.; Fischer, H.D. The titerless infected-cells preservation and scale-up (TIPS) method for large-scale production of NO-sensitive human soluble guanylate cyclase (sGC) from insect cells infected with recombinant baculovirus. Protein Expr. Purif. 2009, 65, 122–132. [Google Scholar] [CrossRef]
  38. Kroll, P.; Stelzer, I.V.; Herwig, C. Soft sensor for monitoring biomass subpopulations in mammalian cell culture processes. Biotechnol. Lett. 2017, 39, 1667–1673. [Google Scholar] [CrossRef] [Green Version]
  39. Dabros, M.; Dennewald, D.; Currie, D.J.; Lee, M.H.; Todd, R.W.; Marison, I.W.; Von Stockar, U. Cole-Cole, linear and multivariate modeling of capacitance data for on-line monitoring of biomass. Bioprocess Biosyst. Eng. 2008, 32, 161–173. [Google Scholar] [CrossRef] [Green Version]
  40. Bernal, V.; Carinhas, N.; Yokomizo, A.Y.; Carrondo, M.J.; Alves, P.C. Cell density effect in the baculovirus-insect cells system: A quantitative analysis of energetic metabolism. Biotechnol. Bioeng. 2009, 104, 162–180. [Google Scholar] [CrossRef]
  41. Ferreira, T.B.; Perdigão, R.; Silva, A.C.; Zhang, C.; Auniņš, J.G.; Carrondo, M.J.; Alves, P.C. 293 cell cycle synchronisation adenovirus vector production. Biotechnol. Prog. 2009, 25, 235–243. [Google Scholar] [CrossRef]
  42. Merten, O.W. AAV vector production: State of the art developments and remaining challenges. Cell Gene Ther. Insights 2016, 2, 521–551. [Google Scholar] [CrossRef]
  43. Laasfeld, T.; Kopanchuk, S.; Rinken, A. Image-based cell-size estimation for baculovirus quantification. Biotechniques 2017, 63, 161–168. [Google Scholar] [CrossRef] [PubMed] [Green Version]
  44. Janakiraman, V.; Forrest, W.F.; Chow, B.; Seshagiri, S. A rapid method for estimation of baculovirus titer based on viable cell size. J. Virol. Methods 2006, 132, 48–58. [Google Scholar] [CrossRef] [PubMed]
Figure 1. Overview of the different batches used for model calibration. “Standard” runs represent a normal infection process, with coinfection with Rep/Cap and transgene-BIICs (baculovirus-infected insect cells). “Empty” runs were infected with an empty-BIIC, a BIIC which was infected with a baculovirus vector devoid of any transgene, but still able to replicate and induce cytopathic effects in infected cells. Cell density effect (CDE) runs are like “standard” runs, except that infection was performed at 5 × 10⁶ cells/mL instead of 3 × 10⁶. “Blend” runs started with separate “standard” and “empty” batches. Two days after infection, cells from both reactors were transferred to new bioreactors, with the indicated proportions of each batch. Hpi—hours post-infection.
Processes 08 01456 g001
Figure 2. Impact of cell concentration on recombinant adeno-associated virus (rAAV) titers and correlations between cell concentration, cell specific productivity, and permittivity. (A) Model (dashed line) and 95% confidence intervals (shaded area) for the relationship between rAAV titer at day 6 and cell concentration at infection. (B) Linear correlation between cell concentration at infection and rAAV specific productivity. (C) Viable cell concentration time-course profiles for the “standard” batches, with coinfection with Rep/Cap and transgene-BIICs (baculovirus-infected insect cells). The time when the cells reached the target cell concentration at infection can vary up to 24 h. (D) Correlation between viable cell concentration measured by Vi-cell and permittivity values measured by the Incyte sensor. The target value of viable cell concentration of 3 × 10⁶ cells/mL is represented by a target, corresponding to a permittivity value of 2.2 pF/cm (95% confidence interval = 2.18–2.34 pF/cm). R2adjs = 0.94.
Processes 08 01456 g002
Figure 3. Outputs of the process-to-target. The script was run at different times after inoculation, and the infection timing predictions are indicated below each image. For this figure, batch 5 was used, in which the target was reached at 50.8 h. Permittivity data is represented in black, the blue line represents model predictions, and the red lines are the target (vertical axis) and the predicted time the target will be reached (horizontal axis). (A) Process-to-target script run 12 h after seeding. (B) Process-to-target script run 24 h after seeding. (C) Process-to-target script run 36 h after seeding.
Processes 08 01456 g003
Figure 4. Incyte measurements can be correlated with the progress of baculovirus infection in insect cells. (A) The onset of baculovirus-induced cell lysis (viability, represented with circles) can be detected by the simultaneous onset of conductivity increase (smooth lines, measured by Incyte). (B) Beta-dispersion curve 24 h after seeding, for batch number 1. The beta-dispersion allows calculation of variables such as Δε, α, and characteristic frequency, which are indicative of the cell state during the infection process. (C) Visual inspection of the permittivity profile allows to follow the three phases of the production process (separated by the shaded area): cell growth, cell diameter increase due to baculovirus infection, and baculovirus-induced cell lysis. Circles represent biovolume calculations based on the measured diameter and considering cells as perfect spheres, and smooth lines the Incyte permittivity measurements at 1000 kHz. (D) The characteristic frequency (frequency corresponding to the beta-dispersion curve inflection point) time profile is shown. The “v-shaped” profile after 2 days post infection has been postulated to be correlated with baculovirus release from cells elsewhere [33].
Processes 08 01456 g004
Figure 5. Calibration and testing data for viable cell concentration, viability, and average cell diameter. On the left, observed and predicted values for the calibration dataset, for (A) viable cell concentration, R2 = 0.96; (C) viability, R2 = 0.98; (E) diameter, R2 = 0.94. Batches are represented by different colors, with filled triangles representing “cell density effect” batches, empty triangles representing “empty” batches, and filled circles representing “standard” and “blend” batches. On the right, time-course profiles for the testing set, for (B) viable cell concentration, Q2 = 0.89; (D) viability (Q2 = 0.97); (F) diameter (Q2 = 0.92). Batches are represented by different colors, with reference data shown as open circles and corresponding model-predicted values shown as filled circles.
Processes 08 01456 g005
Figure 6. Recombinant adeno-associated virus (rAAV) intracellular production profiles. The datapoints represent vector genome quantification. Filled circles represent “standard” batches, triangles represent “cell density effect” batches, empty diamonds represent “empty batches”, and the empty circles represent “blend batches”. For the details on batch nomenclature, the reader is referred to Figure 1. Lines represent a smooth of the reference data, unrelated with model predictions. (A) rAAV intracellular titer, the rAAV concentration after lysing pellet from 10 mL of culture. (B) Specific rAAV titer. Same data as (A) normalized by the number of viable cells at the corresponding sampling time.
Processes 08 01456 g006
Figure 7. Calibration and testing data for intracellular specific recombinant adeno-associated virus (rAAV). Batches are represented by different colors. (A) Observed and predicted values for the dataset used for model calibration, R2 = 0.71. Batches are represented by different colors, with filled triangles representing “cell density effect” batches, empty diamonds representing “empty” batches, filled circles representing “standard” batches, and empty circles representing “blend” batches. (B) Intracellular specific rAAV time-course profiles for the testing set, Q2 = 0.77. Reference data is represented by open circles and corresponding model-predicted values are shown as filled circles.
Processes 08 01456 g007
Table 1. Application of the process-to-target script to each of 10 batches monitored using the Incyte probe at several process timepoints after seeding. The numbers in the prediction columns represent the predicted infection time (in hours post-seeding). Actual time indicates the time in hours that the permittivity equaled the nominal target of 2.2 pF/cm. “N/A” indicates a timepoint that was past the point where the target was reached. For the details on batch nomenclature, the reader is referred to Figure 1. CDE = cell density effect. The data presented in this table was calculated after batch completion.
Batch NumberBatch TypePredictionActual Time (h)
6 h12 h24 h48 h
1Standard−648129535455
2Standard−29973595959
3Empty45895645352
4Standard196114595655
5Standard21395535051
6Standard1365637N/A36
7Standard−92108535752
8CDE−120156656561
9Empty−74611250N/A48
10CDE553107565554
Publisher’s Note: MDPI stays neutral with regard to jurisdictional claims in published maps and institutional affiliations.

