Quality of Watermelon Juice Concentrated by Forward Osmosis and Conventional Processes


1
Healthy Processed Foods Research Unit, Western Regional Research Center, United States Department of Agriculture–Agricultural Research Service, 800 Buchanan Street, Albany, CA 94710, USA
2
Porifera Incorporated, 1575 Alvarado Street, San Leandro, CA 94577, USA
*
Author to whom correspondence should be addressed.
Processes 2020, 8(12), 1568; https://0-doi-org.brum.beds.ac.uk/10.3390/pr8121568
Submission received: 6 November 2020
/
Revised: 25 November 2020
/
Accepted: 26 November 2020
/
Published: 28 November 2020
(This article belongs to the Collection Sustainable Food Processing Processes)
Abstract
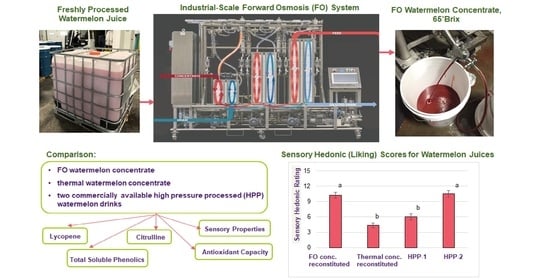
:Watermelon (Citrullus lanatus) juice is known for its refreshing flavor, but its high perishability limits its availability throughout the year. Watermelon juice concentrate has extended shelf-life and lower transportation and storage costs, but the conventional thermal evaporation process for concentrating juice degrades the nutritional components and sensory quality of the product. Thus, in this work, a large-scale, non-thermal forward osmosis (FO) process was used to concentrate fresh watermelon juice up to 65°Brix. The FO concentrate was compared to thermal concentrate and fresh juices, and to commercially available refrigerated watermelon juices, in terms of lycopene and citrulline content, total soluble phenolics, antioxidant activity, and sensory properties. The FO concentrate had statistically similar (p < 0.05) levels of all the nutrients of interest except antioxidant activity, when compared to the thermal concentrate. The reconstituted FO concentrate maintained the same antioxidant activity as the raw source juice, which was 45% higher than that of the reconstituted thermal concentrate. Sensory results showed that reconstituted FO concentrate resulted in highly liked juice, and it outperformed the reconstituted thermal concentrate in the sensory hedonic rating. This work demonstrates the possibility to produce a high-quality watermelon juice concentrate by forward osmosis.
1. Introduction
Watermelon (Citrullus lanatus) is a popular fruit known for its refreshing flavor. Watermelon has long been identified as a good source of lycopene, an antioxidant that studies have suggested could reduce the risk of cardiovascular disease and cancer [1]. Recently, watermelon juice has also gained attention as a functional beverage for exercise, since it contains electrolytes and a significant amount of the amino acid citrulline, which has been found to have ergogenic (athletic performance-enhancing) effects in both humans and animal models [2,3,4].
Despite the appealing flavor and health benefits of watermelon juice, its high perishability limits its distribution. Thermal pasteurization of watermelon juice has been attempted, but the treatment temperatures involved in this process degrade the nutritional components and color of the beverage [5]. In addition, consumers are increasingly seeking out minimally processed single-strength juices [6]. Thus, alternative non-thermal pasteurization technologies such as pulsed electric field and high pressure processing (HPP) have been explored by various research groups [5,7,8], and HPP watermelon juice products are commercially available in the U.S. [9]. HPP results in a desirable product, but the juice must still be refrigerated and has a limited shelf-life, so high-quality watermelon juice concentrates with extended shelf-life are still needed. Juices are typically concentrated by thermal evaporation under vacuum, which is an energy-intensive operation that also causes undesirable sensory and nutritional changes in the concentrated products [10,11,12]. For this reason, nonthermal concentration processes have been explored in recent years [13]. Membrane separation technology has emerged as an option for concentrating juices and maintaining the flavor, aroma, appearance, and mouthfeel of freshly-squeezed juices in the concentrate [10].
Forward osmosis (FO) is a membrane process that is capable of concentrating liquid foods without product deterioration [12]. FO uses a highly concentrated osmotic agent (draw solution) to draw water from the feed through a semipermeable membrane, based on the difference in osmotic pressure between the two liquids. FO can obtain high concentrations, beyond 60°Brix, because it is not limited by an operational pressure ceiling. FO can be performed at ambient pressure and temperature leading to the higher retention of thermo-labile components [14]. Furthermore, FO enables a concentration to high solid levels, without prefiltration or significant membrane fouling [15,16]. While fouling affects FO, it is less pronounced in FO than other membrane separation methods, which allows this process to reach higher concentrations (beyond 60°Brix) [12,15]. Due to the very low hydraulic pressure required, FO offers low energy consumption, thereby reducing the operating cost of the concentration process [16,17].
Successful FO concentration on laboratory-scale units has been previously reported for grape, beetroot, pineapple, orange, grapefruit, and tomato juices [18,19,20,21]. The increasing number of research publications on FO are largely based on bench-scale studies where outputs rarely apply to full-scale installations and real-life applications [22]. Comparisons of forward osmosis concentration to other technologies as a whole process for industrialized foods are still scarce [12].
Thus, the objectives of the present study were to produce FO watermelon concentrate on a large-scale unit and compare its physicochemical, nutritional, and sensory properties to thermal watermelon juice concentrate and fresh juices, and to commercially available refrigerated watermelon juices.
2. Materials and Methods
2.1. Materials
Fresh watermelon juice was obtained from watermelon producers Van Groningen and Sons (Manteca, CA, USA). Watermelon juice was frozen in 1 L sample bottles immediately after processing. The watermelon variety used in juice processing was 7197. The final screen size used in juicing was 50 µm. There was no heat treatment of watermelon juice prior to concentration. The same juice processing was used prior to both thermal and forward osmosis concentrates. The pH of the watermelon juice was adjusted to below 4.3 with citric acid prior to sending to the copacker for thermal concentration. Forward osmosis concentration was done at the Van Groningen’s facility using a continuous FO system (Porifera Inc., San Leandro, CA, USA), which is described in detail in a later section. Samples of the raw watermelon juice and the 2 concentrates were frozen at −20 °C immediately after processing and kept in frozen storage for 4 weeks until needed for analysis. The day before analysis commenced, a small batch (6 L) of fresh-made watermelon juice was produced in the lab from Van Groningen watermelons (purchased from a local grocery store) using a Waring 6001C (Waring Commercial, Torrington, CT) juice extractor. Commercial high pressure processed watermelon juices (hereafter referred to as HPP-1 and HPP-2) were purchased in a local grocery store and stored at refrigeration temperature (2 °C), per the manufacturers’ instructions. For the sensory panel, it was desired to test both the reconstituted FO concentrate at its native pH of 5.6 and the reconstituted FO concentrate acidified to match the pH of the reconstituted thermal concentrate (pH 3.9). Hence, for the relevant sensory sample, food-grade citric acid (The Science Company, Lakewood, CO, USA) was added to the reconstituted FO concentrate and the pH checked until the target pH of 3.9 was reached.
Folin–Ciocalteu’s reagent, 1,1-diphenyl-2-picrylhydrazyl (DPPH), 6-hydroxy-2,5,7,8-tetramethylchroman-2-carboxylic acid (Trolox), gallic acid, L-citrulline, and diacetyl monoxime were obtained from Sigma-Aldrich (St. Louis, MO, USA), while HPLC grade methanol and chemicals of analytical grade were purchased from Fisher Scientific (Pittsburgh, PA, USA).
2.2. Forward Osmosis System
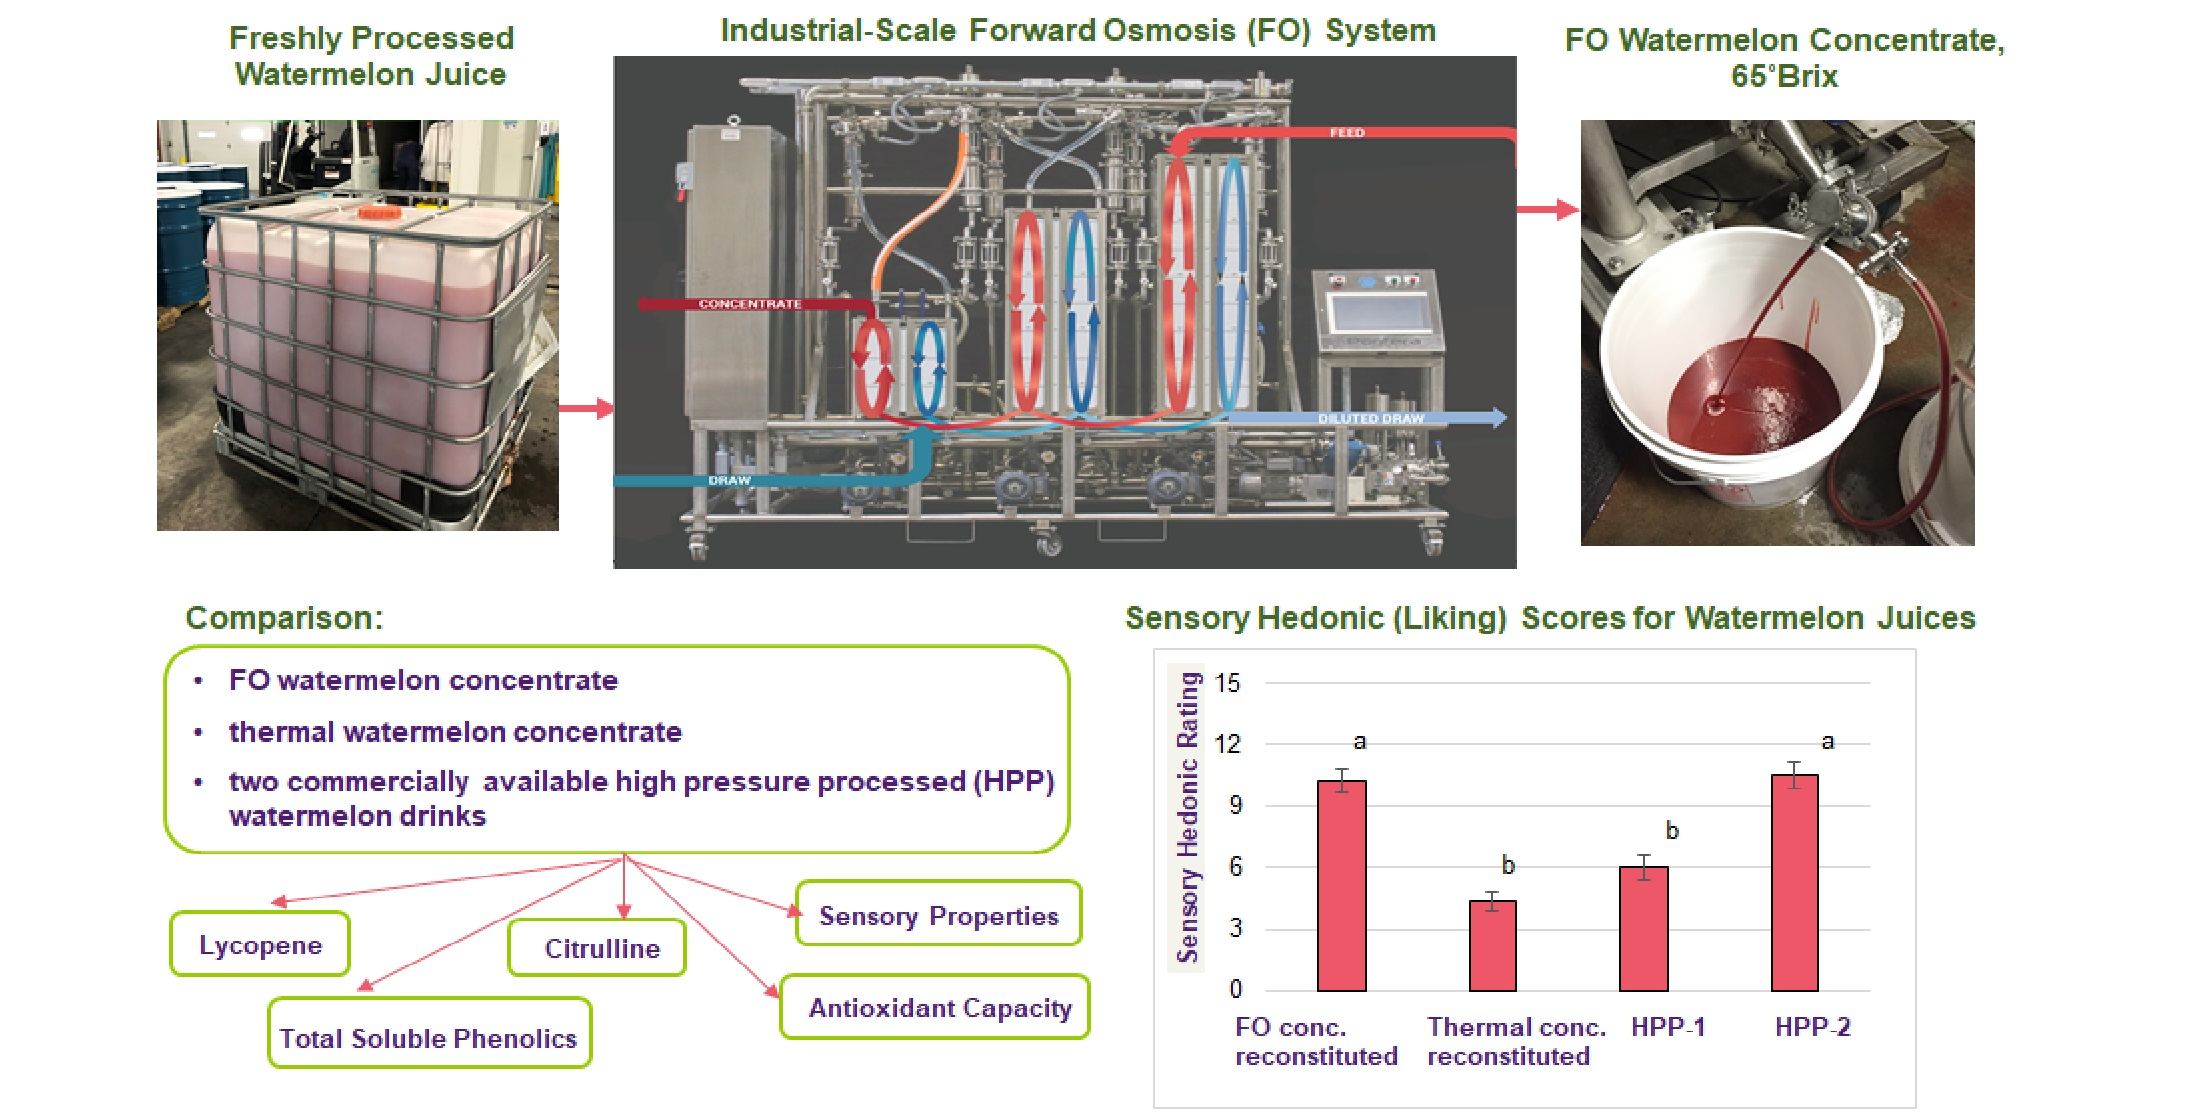
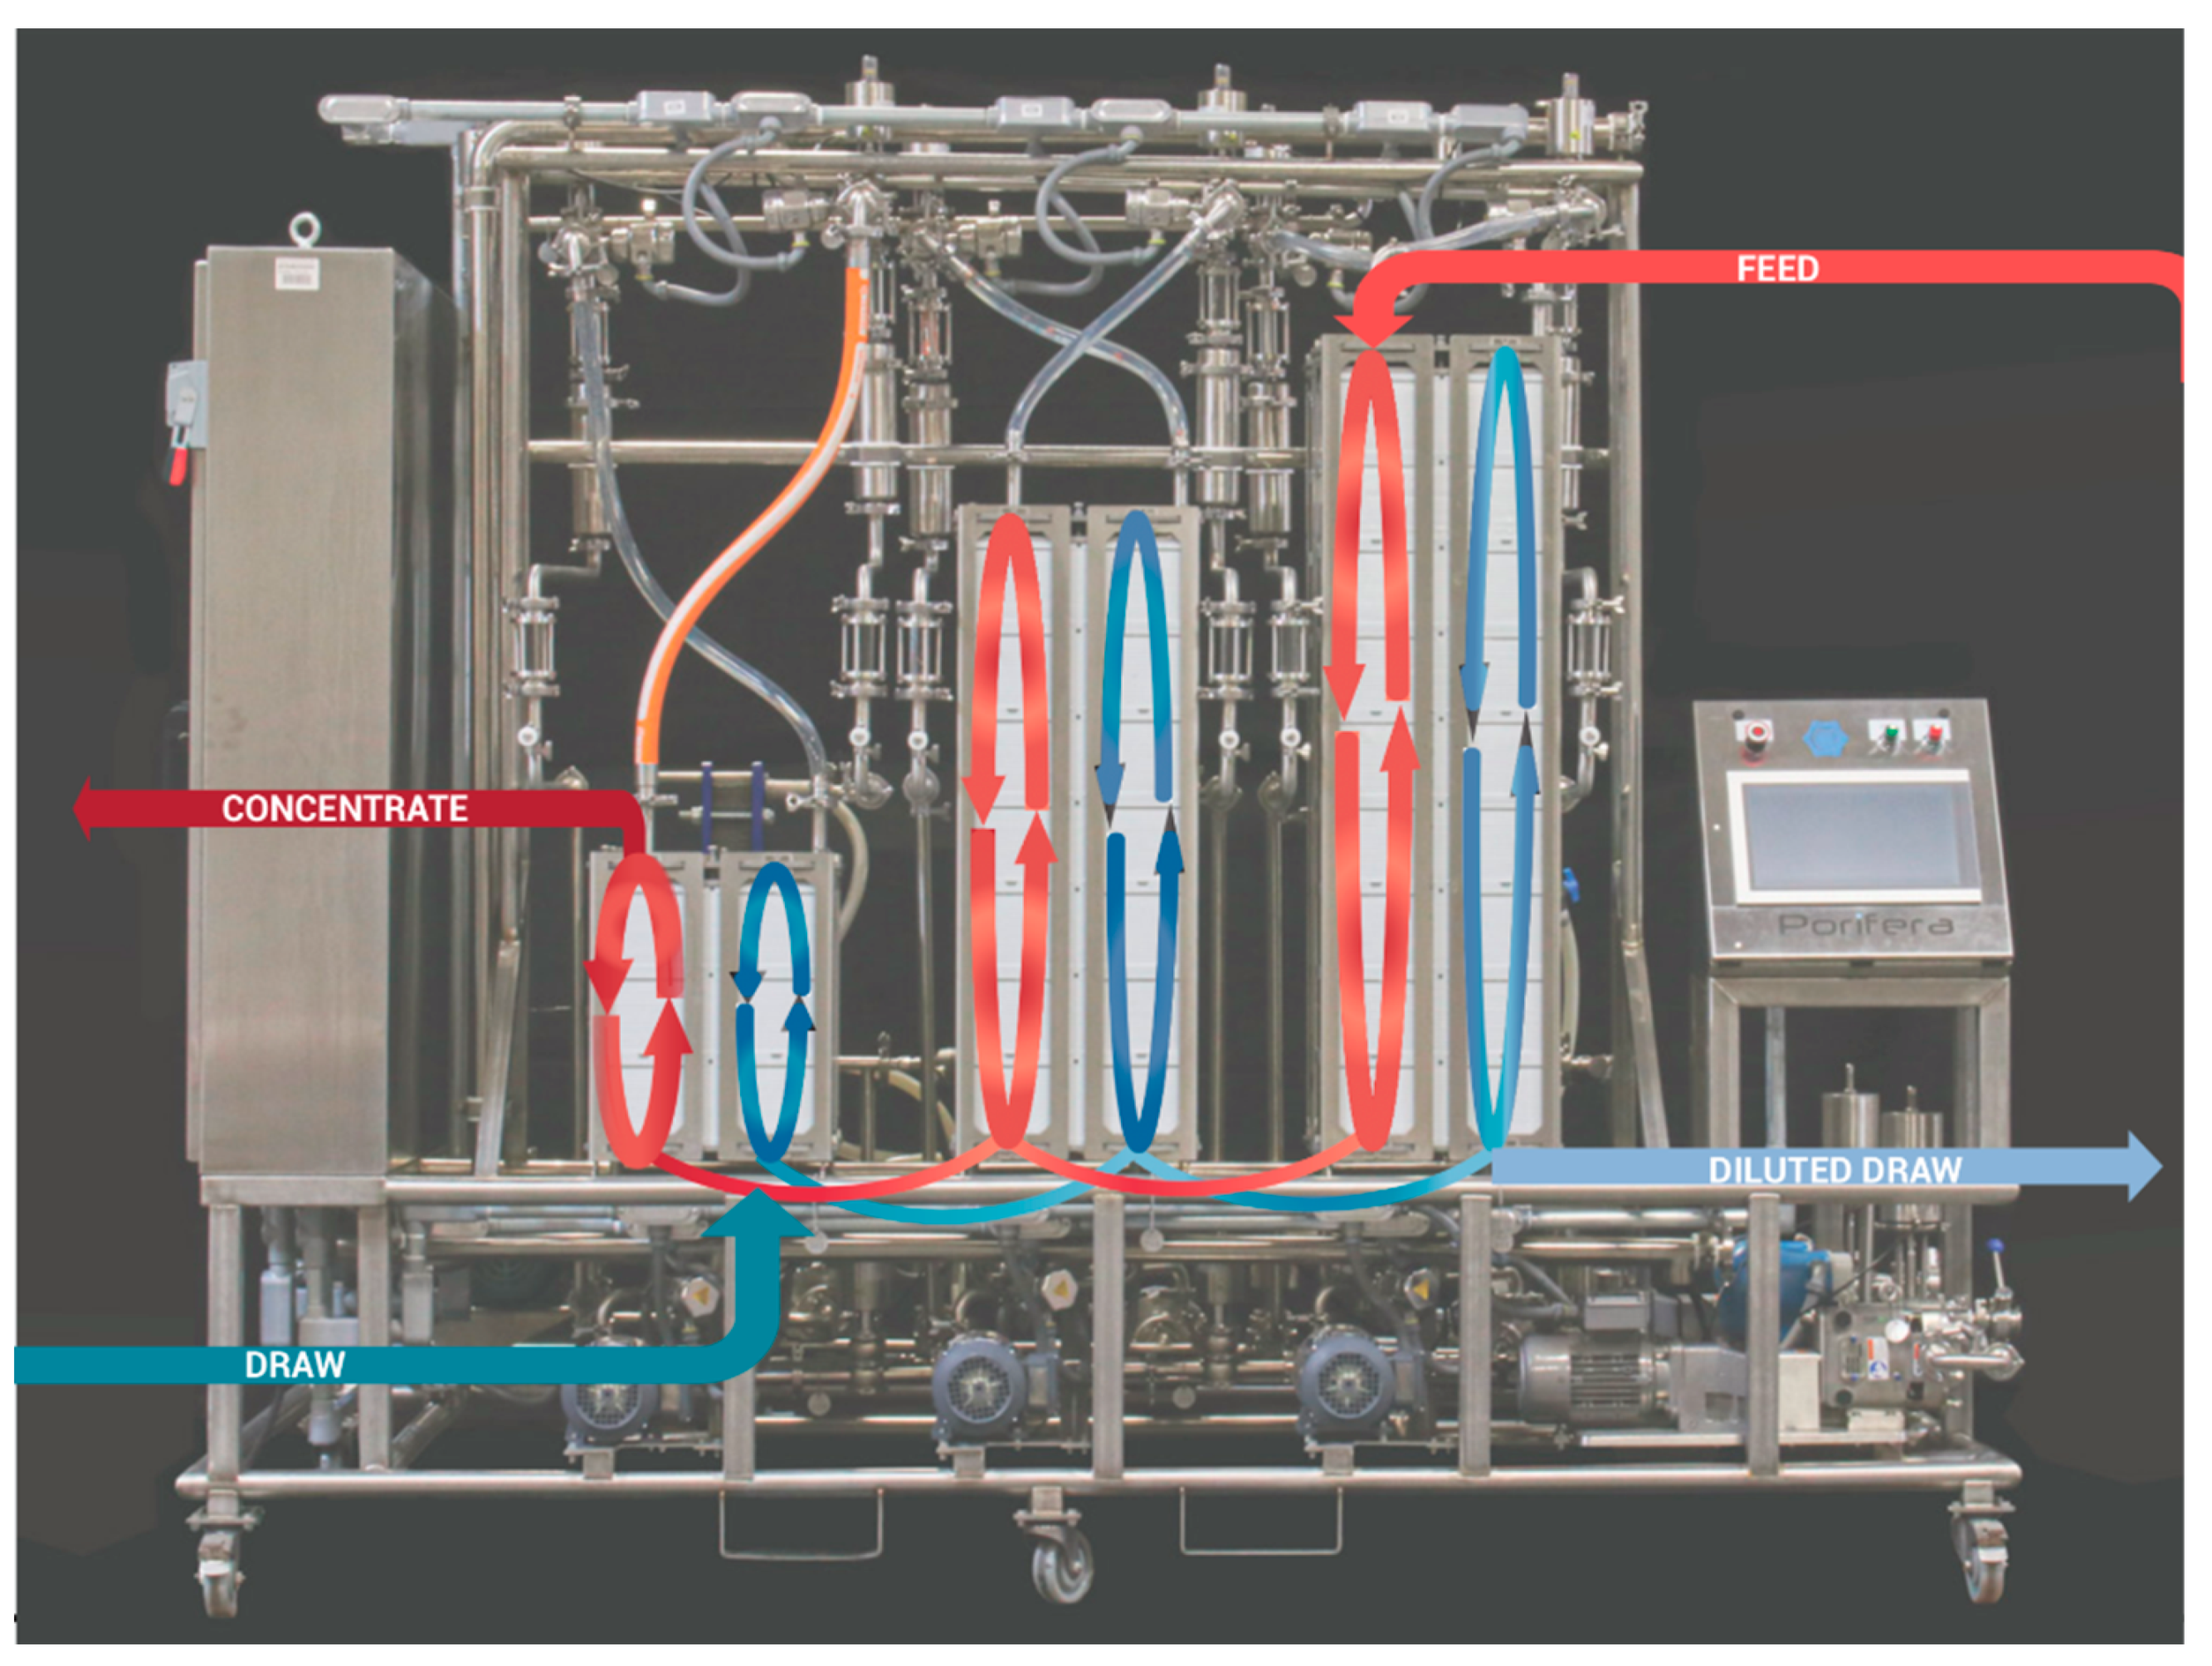
The continuous FO RC3 system (Porifera Inc., San Leandro, CA. USA) was equipped with proprietary PFO-100 elements plumbed in series, feed and draw tanks, and circumferential and centrifugal pumps. A schematic diagram of the forward osmosis RC3 system is shown in Figure 1.
The three-stage system included seven PFO-100 elements (7 m2 each) for a total membrane area of 49 m2. The feed solution was fresh watermelon juice, and the draw solution was 70% glycerol. The membrane was oriented in the FO mode (with the feed solution against the membrane selective layer and the draw solution against the membrane support layer). Two circumferential pumps (Model U2-006 SPX/Waukesha, SPX FLOW, Inc., Delavan, WI, USA) were used to pump both solutions. Six centrifugal pumps (Model C-100, CPE Systems Inc., Burnaby, BC, Canada) were used to recirculate feed and draw solutions in stages. A single peristaltic pump (Perimax Pump Series PM600, Simply Pumps, Westmoreland City, PA, USA) was used to meter concentrate from the final stage.
The system was operated at 7 °C temperature (processing facility ambient temperature) and temperature of the feed tank was controlled to 6.7 °C using a chiller. Water flux crossing the membrane to the draw solution was calculated (Equation (1)) based on the weight change (Totalcomp, Fair Lawn, NJ, USA) of the feed tank and the concentrate tank, which was taken every 30 min.
Water flux was calculated as:
where F is the flux (L/m2h), V is the volume of FO permeate (L), VF is the volume of feed entering FO system over time (L), VC is the volume of concentrate exiting system over time (L), M is the membrane area (7 × PFO 100 7 m2 = 49 m2), H is the processing time (h), ρF is the initial density (1.033 kg/L), ρC is the final density (1.316 kg/L), ΔWF is the feed tank weight loss over time (kg), and ΔWC is the concentrate tank weight increase over time (kg). The targeted concentration of watermelon juice was 65°Brix, and it was measured with a digital refractometer (Model PAL-α, Atago, Tokyo, Japan). The amount of watermelon concentrate produced per day was 85 L. The sample amount taken for laboratory testing for this study was 4 L of watermelon concentrate (4 × 1 L bottle).
2.3. Physicochemical Properties
Moisture content was determined using the vacuum oven method, according to the AOAC Method 40.1.04 [23]. Water activity (aw) was measured at 25 °C via dew-point with an AquaLab 4TE water activity meter (Decagon Devices, Pullman, WA, USA). pH was measured with a Seven Compact pH/Ion Meter S220 (Mettler Toledo, Columbus, OH, USA). Degrees Brix (°Brix) was measured with a digital laboratory refractometer (Model LR-01, Maselli Measurements Inc., Stockton, CA, USA). CIELAB L*, a*, and b* color values were measured with a portable spectrophotometer (Model CM-508c, Konica Minolta Sensing Americas, Inc., Ramsey, NJ, USA).
2.4. Lycopene
Lycopene determination was done according to the spectrophotometric method described by Davis et al. [24]. Approximately 0.6 g of sample was added into a 50 mL centrifuge tube that contained 5 mL of 0.05% (w/v) butylated hydroxytoluene (BHT) in acetone, 5 mL of 95% USP grade ethanol, and 10 mL of hexane. Samples were extracted on an orbital shaker at 180 RPM for 15 min on ice. After shaking, 3 mL of deionized water were added to each tube and the samples were shaken for an additional 5 min on ice. The tubes were then left at room temperature for 5 min to allow for phase separation. Absorbance readings of the supernatant were performed at 503 nm in a Shimadzu UV-1280 spectrophotometer (Shimadzu Scientific Instruments, Inc., Columbia, MD, USA) using hexane as a blank. The total lycopene content was calculated using Equation (2), as proposed by Fish et al. [25].
Lycopene was calculated as:
where A503 is the absorbance of the hexane phase at 503 nm, MW is the molecular weight of lycopene (536.9 g/mol), DF is the dilution factor (mL/g), ε is the molar extinction coefficient for lycopene in hexane (17.2 × 10⁴ M/cm), and L is the light path (1 cm).
2.5. Citrulline
The citrulline content was determined by the spectrophotometric method described by Liu et al. [26]. Three grams of sample were extracted with 15 mL of methanol:6 M HCl (9:1) at 55 °C in the water bath for 20 min. The extract solution was decolorized with activated carbon, and then 1 mL of the filtered solution was diluted with 7 mL distilled water. One milliliter of the diluted solution was added to 4 mL distilled water, 2 mL of sulphuric acid:phosphoric acid (3:1 in volume), 0.25 mL 30 g/L diacetyl monoxime in order, and the solution was shaken in the dark in a closed hood. The solution was then heated in a 100 °C water bath for 30 min and allowed to cool to room temperature. Absorbance readings were performed at 490 nm in a Shimadzu UV-1280 spectrophotometer (Shimadzu Scientific Instruments, Inc., Columbia, MD, USA). The calibration curve (y = 0.012 × + 0.0084; R2 = 0.99) was constructed using L-citrulline.
2.6. Total Soluble Phenolics and DPPH Radical Scavenging Activity
The procedure for analysis of total soluble phenolics (TSP) was adapted from Swain and Hillis [27] and Du et al. [28] with some modifications. One gram of sample and 10 mL of HPLC grade methanol were added to a 50 mL centrifuge tube. The tube was then capped, vortexed for 15 s, and stored at 4 °C overnight. The resulting homogenate was vortexed for 15 s and clarified by centrifugation in a SORVALL RC 5C Plus centrifuge (Kendro Laboratory Products, Newtown, CT., USA) for 15 min at 29,000× g and 4 °C. A 150 µL aliquot of methanol extract was taken from the supernatant and diluted with 2400 µL of nanopure water. One hundred fifty microliters of the 0.25 N Folin–Ciocalteu reagent was then added, and the mixture was incubated for 3 min at ambient temperature. The reaction was stopped with the addition of 300 µL of 0.5 mol/L Na2CO3. After 25 min of incubation, absorbance readings at 765 nm were taken using a Shimadzu UV-1280 spectrophotometer (Shimadzu Scientific Instruments, Inc., Columbia, MD, USA). The level of TSP for each sample was determined by using a standard curve developed with gallic acid (GA) at concentrations of 0–0.125 mg GA/mL. The equation of the standard curve was [absorbance at 765 nm] = 4.1354*[mg GA/mL] – 0.0102, with R² = 0.9988. TSP was expressed as g gallic acid equivalents (GAE) per 100 g of juice.
The 2,2-Diphenyl-1-picrylhydrazyl radical (DPPH•) scavenging activity assay was based on the methods of Brand-Williams et al. [29] and Du et al. [28] with slight modifications. An aliquot of 50 µL of methanol extract was added to 4 mL clear vials. A concentration of 103.2 µM DPPH was prepared in methanol and 2.950 mL was added to each vial. The samples were protected from the light and shaken overnight at room temperature on an orbital shaker at 180 RPM. After 20–22 h, the absorbance was read at 515 nm on a Shimadzu UV-1280 spectrophotometer. DPPH• scavenging activities were determined using a standard curve prepared with 6-hydroxy-2,5,7,8 tetramethylchroman-2-carboxylic acid (Trolox) from 0 to 750 µg/mL. The equation of the standard curve was [reduction in absorbance at 515 nm] = 0.0013*[µg Trolox/mL] − 0.0604, with R² = 0.9898. The results were expressed as g of Trolox equivalents (TE) per 100 g of juice.
2.7. Sensory Analysis
For the hedonic sensory panel, forty-one panelists were recruited from the employees and volunteers at the USDA-ARS Western Regional Research Center (Albany, CA, USA). All panelists were naïve to the nature of the samples and intent of the study. Evaluations were done in controlled-temperature booths under red lighting (to mask subtle color differences among the samples). The watermelon juice samples were presented in 1 oz. plastic cups labeled with randomly-assigned 3-digit codes; panelists were instructed to cleanse their palate with a sip of water and a bite of saltine cracker before tasting each sample. Each panelist evaluated 2 sets of juice samples—a nonacidified (unsupplemented) set and an acidified set. The nonacidified set contained 3 samples: the raw source juice (source of FO concentrate and thermal concentrate), the reconstituted FO concentrate, and the fresh-made juice. The acidified set contained 4 samples: the reconstituted thermal concentrate, the reconstituted FO concentrate with citric acid added, and the 2 commercial HPP juices. The presentation order of the 2 sets and order of samples within each set were randomized among the panelists. For each set, panelists were instructed to first taste the samples in the order in which they were presented; retasting was allowed after all samples in a set had been tasted once. Panelists then performed a rank-rating evaluation on the samples in the set using a structured 15-point hedonic scale, which ranged from “Dislike” to “Like”, with an anchor of “Neither Dislike Nor Like” at the center of the scale. Ties were not allowed. In this way, panelists expressed their preference for the samples through both a ranking of samples within a set and a numeric score for each sample. A higher score indicated greater liking of a sample. Information on panelist demographics was collected at the end of the session.
2.8. Statistical Approach
One-way analysis of variance (ANOVA) was performed in order to determine the significance of the effect of juice type on the nutritional and sensory response variables (lycopene content, sensory hedonic rating, etc.). The effect was considered significant at p < 0.05. When a significant effect of juice type was identified by an ANOVA and Tukey’s HSD (honest significant difference) test was then applied to determine which juice types were significantly different from each other. All statistical analyses were performed in JMP (v14.0.0, SAS Institute, Inc., Cary, NC, USA).
3. Results and Discussion
3.1. Physicochemical Properties of Concentrates and Juices
The solids content, degrees Brix, pH, and color L*/a*/b* values of the watermelon juice concentrates and watermelon juices are given in Table 1.
It should be noted that the thermal concentrate, HPP-1, and HPP-2 samples were known to be acidified–the concentrate by addition of citric acid and the two commercial products by addition of lemon juice (included in the ingredient list). Hence, the pH of these samples (and that of the reconstituted thermal concentrate) is ~1.5 units lower than that of the FO concentrate, reconstituted FO concentrate, raw source juice, and fresh-made juice.
The fresh-made juice notably differed from the raw source juice in terms of °Brix and a* (red/green) color value. Although the fresh-made juice was made from Van Groningen watermelons, these were store-bought watermelons of unknown variety (vs. the well-characterized variety used for commercial juicing) and presumably harvested at a different point in the season from the melons used for the raw source juice. Although both juicing procedures utilized the whole melon (rind and flesh), the juicing procedures were still quite different: the raw source juice was produced on a commercial line, while the fresh-made juice was made with a household juicer in a small batch. Hence, it is not surprising that these 2 juices differ in some physicochemical properties.
It is also not surprising that the commercial HPP juices differed somewhat from the other single-strength juices in terms of solids content, °Brix, and color. The commercial juices contained lemon juice as an acidulant, but it was not known how much lemon juice was added to the watermelon juice; the proportions of the 2 ingredients would affect the physicochemical properties of a given beverage. The variety/location/etc. of fruit used for the commercial juices were not known; this would also affect the physicochemical properties. The intention for the measurement of physicochemical properties of the various juices was not to critically compare them on these metrics but rather to establish that all the single-strength juices and the reconstituted versions of the concentrates were actually quite similar in terms of basic properties, with the exception that pH was intentionally lower for the thermal concentrate and commercial juices.
3.2. Nutritional Quality of Reconstituted Concentrates and Juices
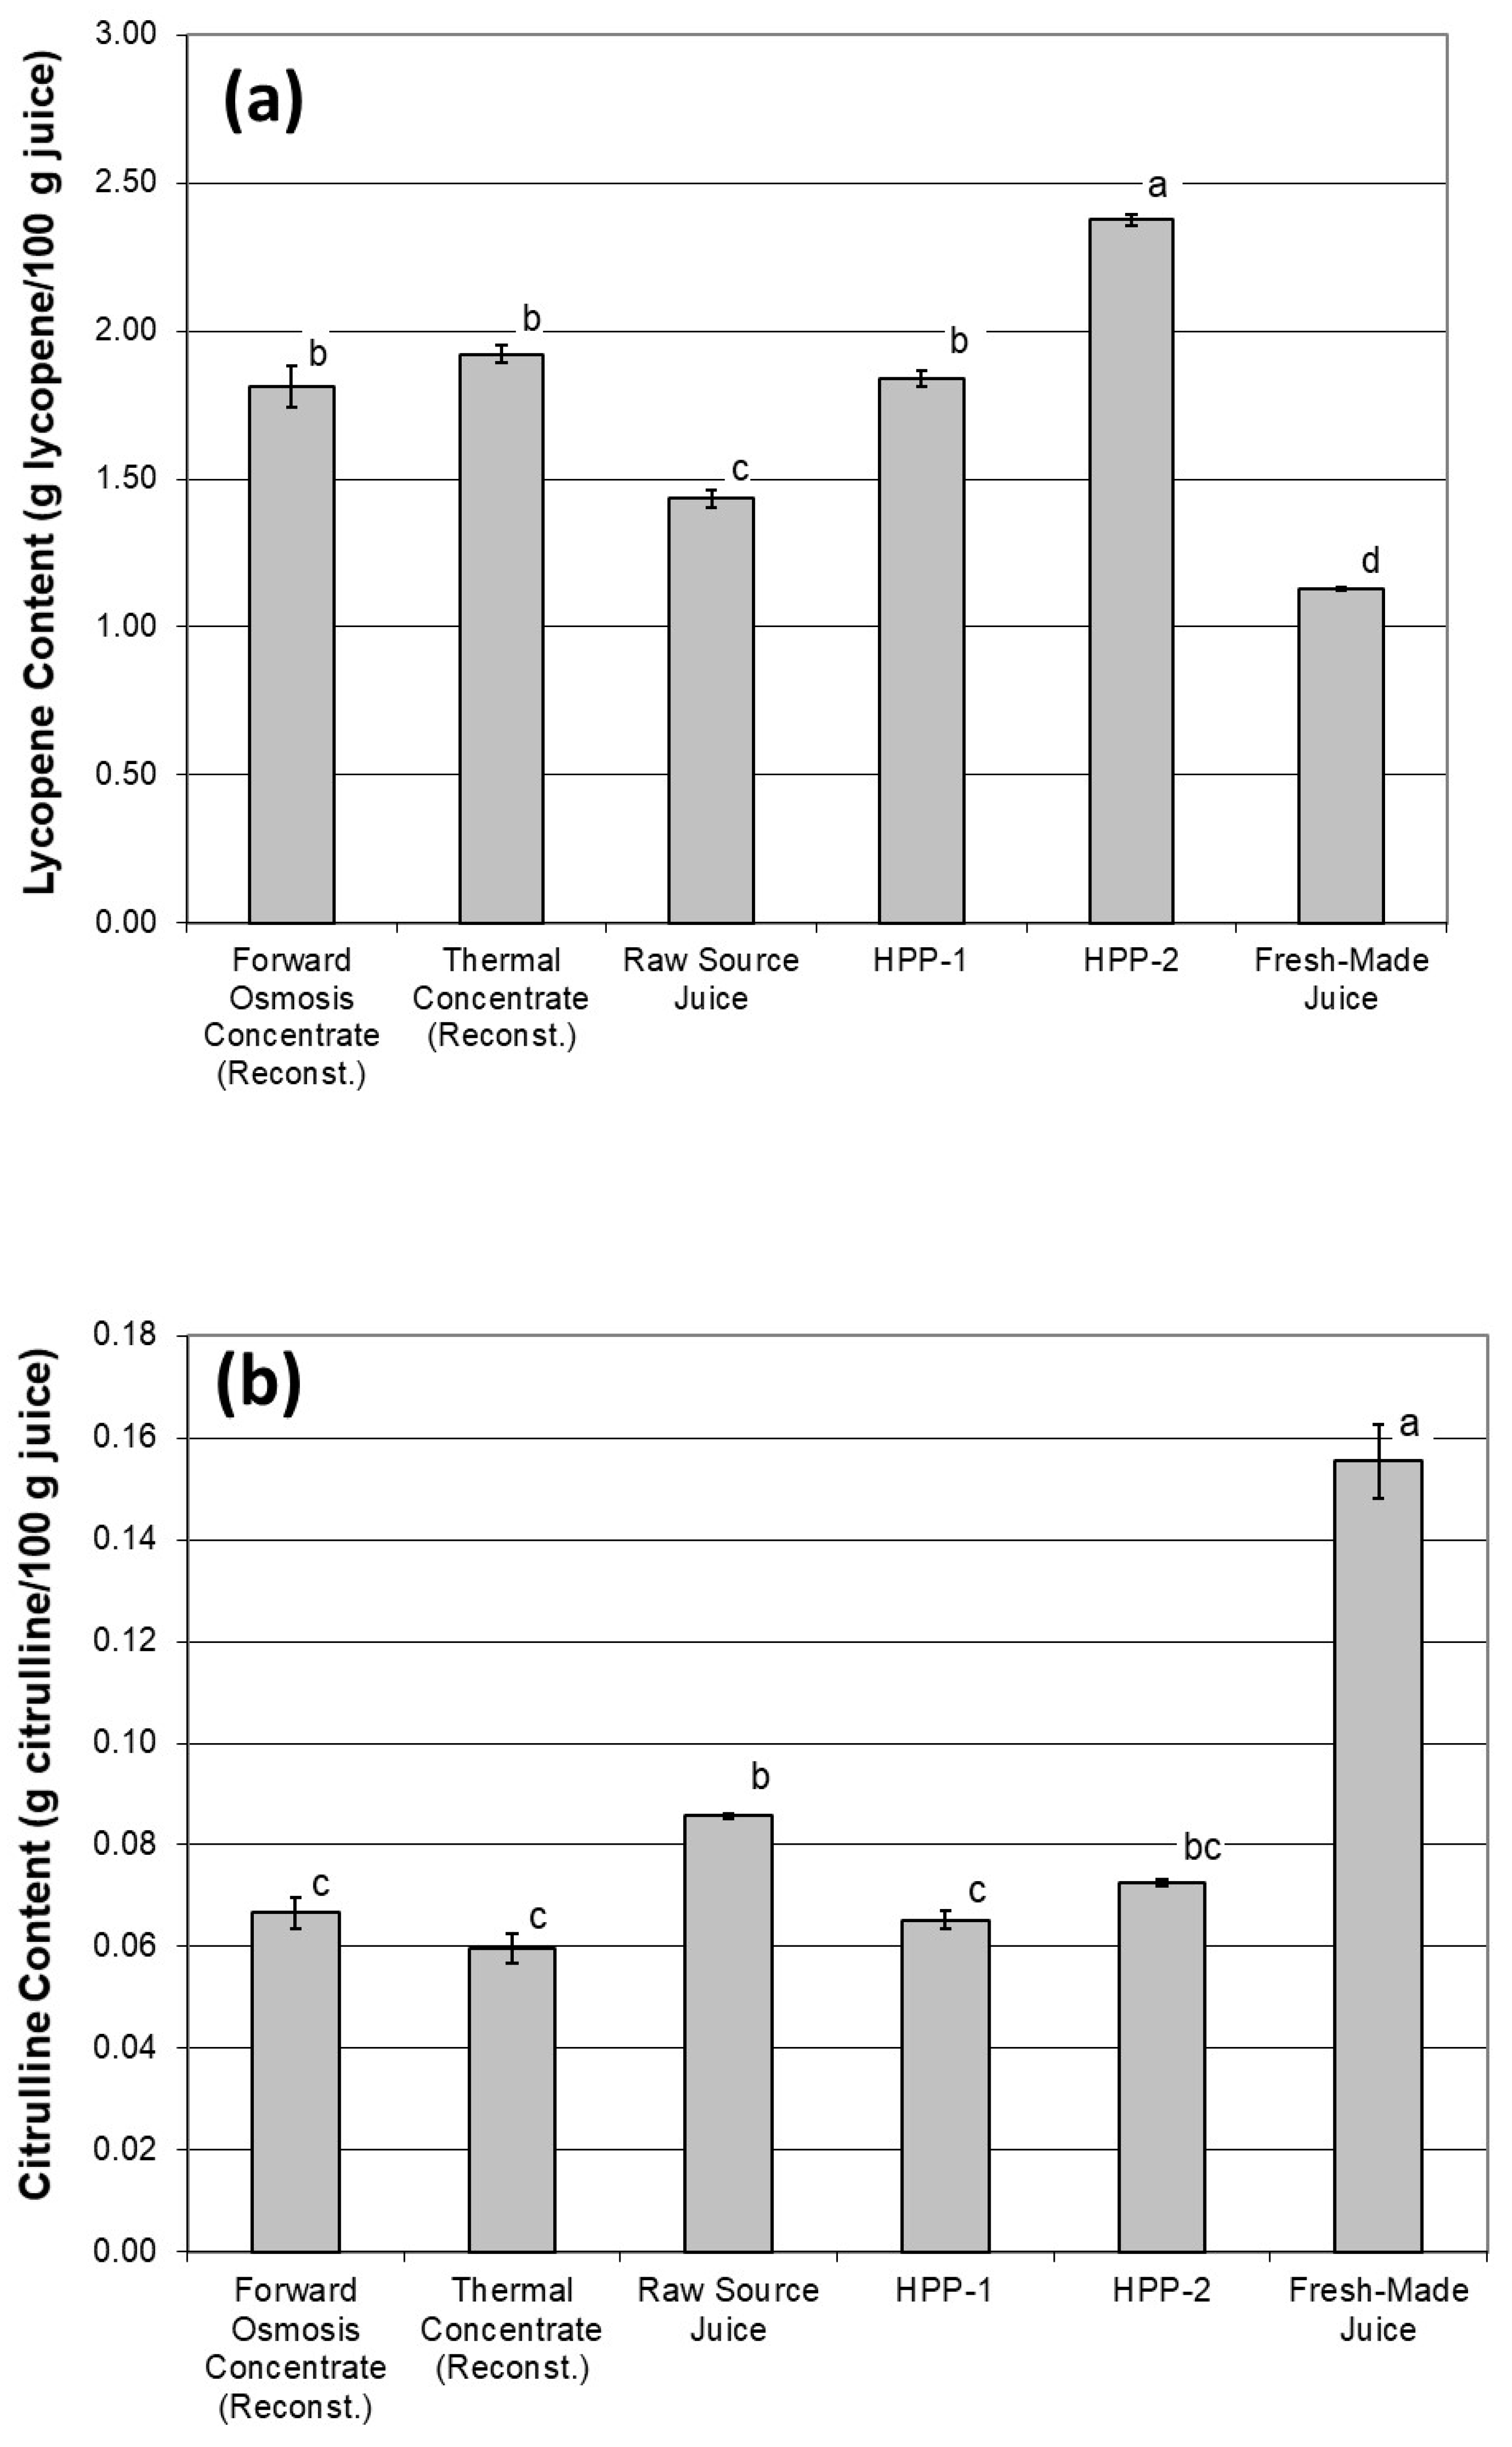
Figure 2 shows the differences among the concentrates (data shown for the reconstituted—i.e., 8× diluted–version of the concentrates) and juices in terms of several nutrients of interest.
Compared to the thermal concentrate, the FO concentrate had statistically similar (p < 0.05) levels of all the nutrients of interest except antioxidant activity. The reconstituted FO concentrate maintained the same antioxidant activity as the raw source juice, which was 45% higher than that of the reconstituted thermal concentrate. This result supports the notion that FO concentration is a milder process than thermal concentration, in that FO concentration is able to maintain the original antioxidant activity of the source material.
At first glance, it is surprising that the lycopene content of both reconstituted concentrates was greater than that of the raw source juice (Figure 2a), indicating that lycopene was somehow synthesized during both the FO and thermal concentration processes. This finding is most likely not an indication of formation of new lycopene during concentration but rather evidence that the concentration process (either FO or thermal) increased the extractability of lycopene from the plant cell matrix. A similar phenomenon has been observed for lycopene in tomatoes, with van het Hof et al. [30] finding that the intactness of the cellular matrix of tomatoes determines the bioavailability of carotenoids (such as lycopene), with matrix disruption by thermal treatment and/or mechanical homogenization enhancing the bioavailability. Indeed, in this study, both of the commercial HPP samples exhibited higher lycopene content than did the raw source juice. This may be an indication that HPP is another process that encourages the release of lycopene from the watermelon cellular matrix. This result should be taken with caution, since the source material for the commercial HPP juices was not known or characterized in this study, so the difference in lycopene content between these juices and the others in this study may solely be a result of different source fruit. The fresh-made juice notably had the lowest lycopene content. We hypothesized that this was likely due to this product’s undergoing the mildest processing of the set and/or the fresh-made juice’s source fruit (purchased whole at a grocery store) having a lower flesh-to-rind ratio than the source fruit for all the other samples (watermelon varieties presumably selected specifically for juicing). The hypothesized lower flesh-to-rind ratio of the source fruit for the fresh-made juice is also a strong explanation for the fact that this sample had nearly twice the citrulline of the next-closest sample (Figure 2b). This is because lycopene is found primarily in the watermelon flesh, while citrulline is found primarily in the rind [31].
The absolute values of TSP measured in the juices in this study (Figure 2c) were reasonable in light of similar measurements from other studies. Kim et al. [32] measured 0.0160 g GAE/100 g and 0.0253 g GAE/100 g for the TSP of watermelon rind (white portion) and flesh, respectively. Our overall mean measured value of 0.0131 g GAE/100 g is slightly below but quite close to this range. Compared to the juices evaluated in this study, Koca et al. [33] found about 10 times higher TSP (0.1208 g GAE/100 g) in watermelon juice. This difference could be explained by the different watermelon cultivars and juice preparation methods that were used in each study.
A final interesting result of the nutritional analyses is that the TSP content (Figure 2c) of all 6 samples was statistically similar, but there were significant differences among the samples in antioxidant activity (Figure 2d). TSP and antioxidant activity are very closely correlated in fruits and vegetables that derive most of their antioxidant activity from phenolic compounds, but this correlation will not be as strong if there are non-phenolic antioxidant compounds in the plant material. Indeed, citrulline has antioxidant activity [34] and thus is likely contributing to the disparity between the TSP and antioxidant activity results.
3.3. Sensory Quality of Reconstituted Concentrates and Juices
While the differences observed in the nutritional characteristics of the concentrates and juices were mostly subtle, the results of the sensory hedonic study were quite clear-cut. These results are shown for the unsupplemented (no acid added) juice samples and acidified juice samples in Figure 3a,b, respectively.
As can be observed from Figure 3a, the reconstituted FO concentrate was statistically indistinguishable from the raw source juice, in terms of consumer liking of the product. Further, both juices scored well above the mid-point “neither like nor dislike” rating. The fresh-made juice, however, scored less than this mid-point value. It should be emphasized at this point that the fresh-made juice came from an entirely different source material (watermelon purchased at a grocery store) than did the other two nonacidified samples.
When citric acid was added to the reconstituted FO concentrate, the overall sensory hedonic score decreased slightly (from 11.6 to 10.2), but the resulting juice was still highly liked by the panelists. Commercial product HPP-2 was similarly well liked. The reconstituted thermal concentrate and commercial product HPP-1, however, both scored below the mid-point value, with panelists generally disliking these samples. Thus, when reconstituted, the FO concentrate resulted in highly liked juices whether or not citric acid was added, and it clearly outperformed the thermal concentrate in this respect.
4. Conclusions
This study demonstrated that high-quality watermelon concentrate could be obtained using FO. On the large-scale FO system, freshly produced watermelon juice can be concentrated to 65°Brix, without deterioration of the desirable nutritional and sensory properties of the juice. The reconstituted FO concentrate was statistically indistinguishable from the fresh watermelon juice, in terms of consumer liking of the product. In contrast, the reconstituted thermally produced concentrate had a low sensory hedonic score, with panelists generally disliking the sample. When compared to the thermal concentrate, the FO concentrate had statistically similar (p < 0.05) levels of lycopene and citrulline. Reconstituted FO concentrate maintained the same antioxidant activity as the raw source juice, which was 45% higher than that of the reconstituted thermal concentrate. This result was expected, as FO concentration does not involve any thermal treatment. With most antioxidants being thermo-labile compounds, FO concentration is able to maintain the original antioxidant activity of the source material. This study also revealed that the overall sensory hedonic scores for two commercial HPP watermelon products were very different, with HPP-2 being well liked by panelists, and HPP-1 scoring below the mid-point value, with panelists generally disliking it.
Due to the relatively short watermelon season and high perishability of watermelon juice, there are a limited variety of watermelon drinks and other food products on the market. This could be improved by having a high-quality watermelon concentrate available year-round, but preserving the refreshing flavor of watermelons is hard to achieve with thermal concentration. Furthermore, energy requirements for production of large amounts of concentrates should be considered from both environmental and cost perspectives. This work is part of a larger effort to minimize energy consumption through innovative processing technologies that have minimal environmental impact. The (likely substantial) energy savings that could result from processors’ switching from thermal to FO concentration have not been estimated yet but should be something to also consider when assessing the costs and environmental sustainability of implementing FO.
The results of this study suggest that FO technology could be well suited for concentrating fruit and vegetable juices at an industrial scale. This stands in particular for heat-labile juices. A downside of FO concentrate could be its stability. Since no heat was applied during the concentration process, and the watermelon juice was not pasteurized prior to concentration, some microbial growth is expected during prolonged storage, though this growth would probably be low due to the low aw of the concentrate. While the shelf-life has not yet been determined for the FO watermelon concentrate, it is assumed to be shorter than for the thermal one. Studying the shelf life stability of FO concentrate is an area that needs more work. The possibility of applying a pasteurization treatment after FO concentration is also something to be explored. Thermal pasteurization could, in theory, be applied to the concentrate, but the effects of the thermal pasteurization treatment on the nutrition and sensory quality of the concentrate would need to be considered. A non-thermal pasteurization process such as HPP would probably be more suitable for this purpose. Even with a pasteurization process applied to the concentrate, reduced-temperature storage would still be needed; in this study, concentrates were stored frozen at −20 °C, and this is the current industry standard practice for juice concentrates. If a sterilization process was used, the concentrate could potentially be rendered shelf-stable at ambient temperature, but as with pasteurization, the quality of the product would need to be evaluated to make sure the sterilization process does not degrade the color, flavor, or nutrition. In short, this work showcased a successful industrial application of FO technology for concentrating watermelon juice. Utilization of the FO concentration system in various fruit and vegetable industries immediately after juice is produced is something to be addressed in the future.
Author Contributions
Conceptualization, R.R.M. and I.S.; methodology, R.R.M., C.W.O., and I.S.; formal analysis, R.R.M. and I.S.; investigation, C.W.O., and I.S.; data curation, R.R.M., C.W.O., and I.S.; writing—original draft preparation, R.R.M., C.W.O., and I.S.; writing—review and editing, R.R.M. and I.S.; visualization, R.R.M.; funding acquisition, R.R.M. and I.S. All authors have read and agreed to the published version of the manuscript.
Funding
This research was funded by the California Energy Commission EPIC project EPC-018-009: “Energy Savings Through Osmotic Concentration for the Food and Beverage Processing Industry”. Additional support was provided by the USDA—Agricultural Research Service appropriated project 2030-41000-064-00D: “New Sustainable Processing Technologies to Produce Healthy, Value-Added Foods from Specialty Crops”.
Acknowledgments
The authors gratefully acknowledge Van Groningen and Sons (Manteca, CA) for providing raw source juice, thermal concentrate, and facilities for FO concentration. We thank Gary Takeoka and Yuzhu Zhang for editorial review of the manuscript.
Conflicts of Interest
The authors declare that author I. Sedej is an employee of Porifera Incorporated, the manufacturer of the forward osmosis system used in this study. The funders had no role in the design of the study; in the collection, analyses, or interpretation of data; in the writing of the manuscript, or in the decision to publish the results.
Disclaimers
Mention of trade names or commercial products in this article is solely for the purpose of providing specific information and does not imply recommendation or endorsement by the U.S. Department of Agriculture. USDA is an equal opportunity employer.
References
- Omoni, A.O.; Aluko, R.E. The anti-carcinogenic and anti-atherogenic effects of lycopene: A review. Trends Food Sci. Technol. 2005, 16, 344–350. [Google Scholar] [CrossRef]
- Ridwan, R.; Abdul Razak, H.R.; Adenan, M.I.; Md Saad, W.M. Supplementation of 100% flesh watermelon [Citrullus lanatus (Thunb.) matsum. and nakai] juice improves swimming performance in rats. Prev. Nutr. Food Sci. 2019, 24, 41–48. [Google Scholar] [CrossRef] [PubMed]
- Rizal, M.; Segalita, C.; Mahmudiono, T. The effect of watermelon beverage ingestion on fatigue index in young-male, recreational football players. Asian J. Sports Med. 2019, 10. [Google Scholar] [CrossRef] [Green Version]
- Tarazona-Díaz, M.P.; Alacid, F.; Carrasco, M.; Martínez, I.; Aguayo, E. Watermelon juice: Potential functional drink for dore muscle relief in athletes. J. Agric. Food Chem. 2013, 61, 7522–7528. [Google Scholar] [CrossRef]
- Liu, Q.; Wang, R.F.; Zhang, B.B.; Zhao, X.Y.; Wang, D.; Zhang, C. Protein secondary structure changes of watermelon juice treated with high hydrostatic pressure by FTIR spectroscopy. J. Food Process Eng. 2014, 37, 543–549. [Google Scholar] [CrossRef]
- Nachay, K. Raise a glass to innovative fruit and vegetable beverages. Food Technol. 2017, 71, 101–112. [Google Scholar]
- Aganovic, K.; Smetana, S.; Grauwet, T.; Toepfl, S.; Mathys, A.; Van Loey, A.; Heinz, V. Pilot scale thermal and alternative pasteurization of tomato and watermelon juice: An energy comparison and life cycle assessment. J. Clean. Prod. 2017, 141, 514–525. [Google Scholar] [CrossRef]
- Aganovic, K.; Grauwet, T.; Siemer, C.; Toepfl, S.; Heinz, V.; Hendrickx, M.; Van Loey, A. Headspace fingerprinting and sensory evaluation to discriminate between traditional and alternative pasteurization of watermelon juice. Eur. Food Res. Technol. 2016, 242, 787–803. [Google Scholar] [CrossRef]
- Cold Pressure Council. “Verified Products”. Available online: https://highpressurecertified.org/verified-products/ (accessed on 10 September 2020).
- Bhattacharjee, C.; Saxena, V.K.; Dutta, S. Fruit juice processing using membrane technology: A review. Innov. Food Sci. Emerg. Technol. 2017, 43, 136–153. [Google Scholar] [CrossRef]
- Chemat, F.; Rombaut, N.; Meullemiestre, A.; Turk, M.; Perino, S.; Fabiano-Tixier, A.S.; Abert-Vian, M. Review of green food processing techniques. Preservation, transformation, and extraction. Innov. Food Sci. Emerg. Technol. 2017, 41, 357–377. [Google Scholar] [CrossRef]
- Sant’Anna, V.; Marczak, L.D.F.; Tessaro, I.C. Membrane concentration of liquid foods by forward osmosis: Process and quality view. J. Food Eng. 2012, 111, 483–489. [Google Scholar] [CrossRef]
- Menchik, P.; Moraru, C.I. Nonthermal concentration of liquid foods by a combination of reverse osmosis and forward osmosis. Acid whey: A case study. J. Food Eng. 2019, 253, 40–48. [Google Scholar] [CrossRef]
- Nicoll, P.G. Forward Osmosis—A brief introduction. In Proceedings of the International Desalination Association World Congress on Desalination and Water Reuse 2013, Tianjin, China, 20–25 October 2013. Abstract Number IDAWC/TIAN13-445. [Google Scholar]
- Babu, B.R.; Rastogi, N.K.; Raghavarao, K.S.M.S. Effect of process parameters on transmembrane flux during direct osmosis. J. Memb. Sci. 2006, 280, 185–194. [Google Scholar] [CrossRef]
- Zhao, S.; Zou, L.; Tang, C.Y.; Mulcahy, D. Recent developments in forward osmosis: Opportunities and challenges. J. Memb. Sci. 2012, 396, 1–21. [Google Scholar] [CrossRef]
- Chanukya, B.S.; Rastogi, N.K. Ultrasound assisted forward osmosis concentration of fruit juice and natural colorant. Ultrason. Sonochem. 2017, 34, 426–435. [Google Scholar] [CrossRef]
- Garcia-Castello, E.M.; McCutcheon, J.R. Dewatering press liquor derived from orange production by forward osmosis. J. Memb. Sci. 2011, 372, 97–101. [Google Scholar] [CrossRef]
- Kim, D.I.; Gwak, G.; Zhan, M.; Hong, S. Sustainable dewatering of grapefruit juice through forward osmosis: Improving membrane performance, fouling control, and product quality. J. Memb. Sci. 2019, 578, 53–60. [Google Scholar] [CrossRef]
- Nayak, C.A.; Valluri, S.S.; Rastogi, N.K. Effect of high or low molecular weight of components of feed on transmembrane flux during forward osmosis. J. Food Eng. 2011, 106, 48–52. [Google Scholar] [CrossRef]
- Petrotos, K.B.; Tsiadi, A.V.; Poirazis, E.; Papadopoulos, D.; Petropakis, H.; Gkoutsidis, P. A description of a flat geometry direct osmotic concentrator to concentrate tomato juice at ambient temperature and low pressure. J. Food Eng. 2010, 97, 235–242. [Google Scholar] [CrossRef]
- Awad, A.M.; Jalab, R.; Minier-Matar, J.; Adham, S.; Nasser, M.S.; Judd, S.J. The status of forward osmosis technology implementation. Desalination 2019, 10–21. [Google Scholar] [CrossRef]
- AOAC. Official Methods of Analysis, 18th ed.; Method 40.1.04; Association of Official Analytical Chemists International: Washington, DC, USA, 2006. [Google Scholar]
- Davis, A.R.; Fish, W.W.; Perkins-Veazie, P. A rapid spectrophotometric method for analyzing lycopene content in tomato and tomato products. Postharvest Biol. Technol. 2003, 28, 425–430. [Google Scholar] [CrossRef]
- Fish, W.W.; Perkins-Veazie, P.; Collins, J.K. A quantitative assay for lycopene that utilizes reduced volumes of organic solvents. J. Food Compos. Anal. 2002, 15, 309–317. [Google Scholar] [CrossRef] [Green Version]
- Liu, W.; Zhao, S.; Cheng, Z.; Wan, X.; Yan, Z.; King, S.R. Lycopene and citrulline contents in watermelon (Citrullus lanatus) fruit with different ploidy and changes during fruit development. Acta Hortic. 2015, 543–550. [Google Scholar] [CrossRef] [Green Version]
- Swain, T.; Hillis, W.E. The phenolic constituents of Prunus domestica. I.—The quantitative analysis of phenolic constituents. J. Sci. Food Agric. 1959, 10, 63–68. [Google Scholar] [CrossRef]
- Du, W.-X.; Avena-Bustillos, R.J.; Breksa, A.P.; McHugh, T.H. Effect of UV-B light and different cutting styles on antioxidant enhancement of commercial fresh-cut carrot products. Food Chem. 2012, 134, 1862–1869. [Google Scholar] [CrossRef]
- Brand-Williams, W.; Cuvelier, M.E.; Berset, C. Use of a free radical method to evaluate antioxidant activity. LWT Food Sci. Technol. 1995, 28, 25–30. [Google Scholar] [CrossRef]
- van het Hof, K.H.; de Boer, B.C.J.; Tijburg, L.B.M.; Lucius, B.R.H.M.; Zijp, I.; West, C.E.; Hautvast, J.G.A.J.; Weststrate, J.A. Carotenoid bioavailability in humans from tomatoes processed in different ways determined from the carotenoid response in the triglyceride-rich lipoprotein fraction of plasma after a single consumption and in plasma after four days of consumption. J. Nutr. 2000, 130, 1189–1196. [Google Scholar] [CrossRef]
- Rimando, A.M.; Perkins-Veazie, P.M. Determination of citrulline in watermelon rind. J. Chromatogr. A 2005, 1078, 196–200. [Google Scholar] [CrossRef]
- Kim, S.J.; Matsushita, Y.; Fukushima, K.; Aoki, D.; Yagami, S.; Yuk, H.G.; Lee, S.C. Antioxidant activity of a hydrothermal extract from watermelons. LWT Food Sci. Technol. 2014, 59, 361–368. [Google Scholar] [CrossRef]
- Koca, I.; Hasbay, I.; Karadeniz, B.; Koca, A.F. Changes in the physicochemical and antioxidant characteristics of watermelon during pekmez production. Qual. Assur. Saf. Crop. Foods 2014, 6, 411–418. [Google Scholar] [CrossRef]
- Al-Sayed, H.M.A.; Ahmed, A.R. Utilization of watermelon rinds and sharlyn melon peels as a natural source of dietary fiber and antioxidants in cake. Ann. Agric. Sci. 2013, 58, 83–95. [Google Scholar] [CrossRef] [Green Version]
Figure 1.
Schematic diagram of industrial-scale forward osmosis (FO) system used in this study.

Figure 2.
Effect of juice type on lycopene content (a), citrulline content (b), total soluble phenolics (TSP) content (c), and antioxidant activity (d) of watermelon juice. For concentrates, values shown are for the reconstituted (8× diluted) samples to enable comparison with single-strength juice. Error bars indicate ±1 standard error of the mean. HPP = high pressure processed, GAE = gallic acid equivalents, and TE = Trolox equivalents.


Figure 3.
Sensory hedonic (liking) scores for watermelon juices without any acid added (a) and with acid added (b). Higher scores indicate better liking. Error bars indicate ±1 standard error of the mean.
Figure 3.
Sensory hedonic (liking) scores for watermelon juices without any acid added (a) and with acid added (b). Higher scores indicate better liking. Error bars indicate ±1 standard error of the mean.


Table 1.
Physicochemical properties of watermelon juice concentrates and watermelon juices.
| Solids Content (g Solids/ 100 g Solution) | Brix (°) | pH | L* | a* | b* | |
|---|---|---|---|---|---|---|
| FO Concentrate | 65.08 (0.41) | 64.83 (0.07) | 5.30 (0.01) | 32.75 (0.14) | 11.07 (0.38) | 4.62 (0.26) |
| Thermal Concentrate | 66.32 (0.42) | 65.53 (0.03) | 3.93 (0.01) | 31.59 (0.24) | 12.24 (0.43) | 5.17 (0.17) |
| Reconstituted FO Concentrate | n.m. | 8.07 (0.06) | 5.67 (0.02) | 37.00 (0.05) | 9.48 (0.02) | 6.34 (0.02) |
| Reconstituted Thermal Concentrate | n.m. | 8.10 (0.10) | 4.24 (0.01) | 37.18 (0.12) | 6.80 (0.36) | 6.41 (0.03) |
| Raw Source Juice | 7.94 (0.13) | 8.07 (0.03) | 5.61 (0.01) | 38.95 (0.60) | 7.42 (0.36) | 8.10 (0.10) |
| HPP-1 | 6.65 (0.03) | 6.83 (0.03) | 4.33 (0.01) | 38.60 (0.39) | 7.10 (0.15) | 6.32 (0.14) |
| HPP-2 | 9.54 (0.08) | 9.73 (0.03) | 4.33 (0.01) | 37.08 (0.27) | 8.55 (0.08) | 6.32 (0.07) |
| Fresh-Made Juice | 7.03 (0.14) | 6.80 (0.06) | 5.45 (0.01) | 38.98 (0.31) | 4.42 (0.17) | 7.22 (0.18) |
Values listed are means of triplicate measurements; standard errors of the mean are in parentheses. n.m. = not measured.
Publisher’s Note: MDPI stays neutral with regard to jurisdictional claims in published maps and institutional affiliations. |
© 2020 by the authors. Licensee MDPI, Basel, Switzerland. This article is an open access article distributed under the terms and conditions of the Creative Commons Attribution (CC BY) license (http://creativecommons.org/licenses/by/4.0/).
Share and Cite
MDPI and ACS Style
Milczarek, R.R.; Olsen, C.W.; Sedej, I. Quality of Watermelon Juice Concentrated by Forward Osmosis and Conventional Processes. Processes 2020, 8, 1568. https://0-doi-org.brum.beds.ac.uk/10.3390/pr8121568
AMA Style
Milczarek RR, Olsen CW, Sedej I. Quality of Watermelon Juice Concentrated by Forward Osmosis and Conventional Processes. Processes. 2020; 8(12):1568. https://0-doi-org.brum.beds.ac.uk/10.3390/pr8121568
Chicago/Turabian StyleMilczarek, Rebecca R., Carl W. Olsen, and Ivana Sedej. 2020. "Quality of Watermelon Juice Concentrated by Forward Osmosis and Conventional Processes" Processes 8, no. 12: 1568. https://0-doi-org.brum.beds.ac.uk/10.3390/pr8121568
Note that from the first issue of 2016, this journal uses article numbers instead of page numbers. See further details here.