Article

Investigation of Virulence Genes Detected in Antimicrobial-Resistance Pathogens Isolates for Five Countries across the World

Department of Chemical and Biological Engineering, Villanova University, Villanova, PA 19805, USA
*
Author to whom correspondence should be addressed.
Submission received: 4 October 2020 / Revised: 15 November 2020 / Accepted: 18 November 2020 / Published: 2 December 2020
(This article belongs to the Special Issue Microbial Communities in Health and Disease)

Abstract

:
A large portion of annual deaths worldwide are due to infections caused by disease-causing pathogens. These pathogens contain virulence genes, which encode mechanisms that facilitate infection and microbial survival in hosts. More recently, antimicrobial resistance (AMR) genes, also found in these pathogens, have become an increasingly large issue. While the National Center for Biotechnology Information (NCBI) Pathogen Detection Isolates Browser (NPDIB) database has been compiling genes involved in microbial virulence and antimicrobial resistance through isolate samples, few studies have identified the genes primarily responsible for virulence and compared them to those responsible for AMR. This study performed the first multivariate statistical analysis of the multidimensional NPDIB data to identify the major virulence genes from historical pathogen isolates for Australia, China, South Africa, UK, and US—the largely populated countries from five of the six major continents. The important virulence genes were then compared with the AMR genes to study whether there is correlation between their occurrences. Among the significant genes and pathogens associated with virulence, it was found that the genes fdeC, iha, iss, iutA, lpfA, sslE, ybtP, and ybtQ are shared amongst all five countries. The pathogens E. coli and Shigella, Salmonella enterica, and Klebsiella pneumoniae mostly contained these genes and were common among four of the five studied countries. Additionally, the trend of virulence was investigated by plotting historical occurrences of gene and pathogen frequency in the annual samples. These plots showed that the trends of E. coli and Shigella and Salmonella enterica were similar to the trends of certain virulence genes, confirming the two pathogens do indeed carry important virulence genes. While the virulence genes in the five countries are not significantly different, the US and the UK share the largest amount of important virulence genes. The plots from principal component analysis and hierarchical clustering show that the important virulence and AMR genes were not significantly correlated, with only few genes from both types of genes clustered into the same groups.

1. Introduction

Every year, 25% of total deaths worldwide are attributed to microbial pathogens [1]. The emergence of a relatively new threat called antimicrobial resistance, or “AMR”, is largely responsible for this high percentage in recent decades. Despite the initial success of antibiotics, overuse and misuse of the drugs have led to targeted bacteria developing resistance and mutations, and the emergence of superbugs. For example, the rate of global antibiotic consumption increased by 39% from 2000 to 2015 [2]. The high rate of consumption is due to misconceptions about when the drugs are necessary [3], and is centered mainly in developing countries, such as China and South Africa [2]. As a result of the overuse of antibiotics, super bugs (the bacteria resistant to most known antibiotics) have been a challenging threat to public health [4]. Accordingly, the World Health Organization declared AMR a global public health concern in 2014 [5]. Clinicians are currently seeking additional treatments to combat the growing AMR problem, and identifying the virulence genes from the historical pathogen samples may provide directions for establishing vital strategies to combat pathogen-causing diseases. Fortunately, the NCBI Pathogen Detection Isolates Browser (NPDIB) database contains the AMR genes for pathogen isolates sampled all over the world. On the basis of the NPDIB database, several studies have been conducted to investigate: (1) the correlation between geographic locations and AMR genes in foodborne pathogens [6]; (2) the occurrences and trends of AMR genes sampled in foodborne [7] or clinical pathogen isolates [8]; and (3) the comparison of AMR genes sampled from foodborne pathogens with those from clinical pathogens [9]. These studies have identified important AMR genes that are of clinical value. They have also indicated that antimicrobial resistance is still a global challenge. Compared to AMR genes, few studies have been conducted on virulence genes. This may be because the data on virulence genes have just been released in the NPDIB database.
Virulence stands for the harmfulness of a disease, or pathogenicity. Certain strains of bacteria contain virulence factors that allow them to cause disease and evade host defenses. The study of virulence reveals crucial insights into how pathogens survive and colonize inside a host and how they escape the host’s immune response. This information can be actively used to develop antivirulence drugs as alternatives to antibiotics. An example of an existing antivirulence drug is virstatin, which inhibits Vibrio cholerae by constraining its production of cholera toxin [4]. Different from antibiotics, which eliminate their target bacteria but often harm beneficial host microbiota and healthy colon bacteria as well, antivirulence drugs only subdue their specific pathogens [4]. The damage on host microbiota and healthy colon bacteria by certain antibiotics may lead to a common infection called colitis. For scale, the number of Clostridium difficile cases in the US was around 462,100 in 2017 [10]. Another hypothesized advantage of antivirulence drugs is a reduced risk of resistance against antivirulence therapy. Unlike the functions of antibiotics, the subdual of virulence factors does not exert any selective pressure [11]. Fortunately, the NPDIB database recently published historical data on virulence genes sampled from pathogen isolates. This motivated us to study these newly-published data to identify the common and important virulence genes from pathogen isolates that may be potential targets for antivirulence drug development.
This work presents the first study regarding virulence genes and associated pathogens, utilizing the NPDIB database. Five countries, including Australia, China, South Africa, UK, and US, were chosen to be the countries studied as they each represent a highly populated region from a different major continent. Since both data of virulence genes and AMR genes are sampled from thousands of pathogen isolates for each country, multivariate statistical analysis approaches were implemented to visualize and identify the genes and pathogens involved in microbial virulence. In particular, principal component analysis (PCA), which is known for its effectiveness in dealing with high-dimensional data [12,13], was used to project hundreds of genes from thousands of samples into a more interpretable two-dimensional space. On the basis of the projection provided by PCA, the hierarchical clustering approach [14,15,16] was further implemented to group the virulence genes so that the important virulence genes can be identified. In addition, the AMR genes were then analyzed along with the virulence genes for studying the relationship between these two types of genes. The trend of virulence through historical profiles was also studied. The programming language R [17] was chosen for this study, as R’s extensive data analysis methods, such as principal component analysis (PCA) and hierarchical clustering, have been proven effective in dealing with high-dimensional data. The results from this work on genes and pathogens related to virulence and on the relationship between AMR genes and virulence genes can enhance scientists’ understanding of gene targets for combating disease-causing pathogens.

2. Materials and Methods

This study’s data originate from the NPDIB database. The hundreds of thousands of data samples were exported into individual spreadsheets organized by country (Australia, China, South Africa, the UK, and the US, specifically). To virtualize the multidimensional data into two dimensions, PCA was used. Combined with hierarchical clustering, the virulence genes and pathogens that differed the most from the rest (i.e., outliers) were identified as “important”, as they represented the genes/pathogens that show different pattens from the bulk genes/pathogens. They are thus significantly associated with virulence. Furthermore, profiles of the historical occurrences of these important genes and pathogens in each country were used to study the virulence trends in each country. Finally, more clustering statistical analyses, as well as time profiles and frequency scatterplots, were used to study the correlation in the occurrence frequencies of important virulence genes and AMR genes.

2.1. The Historical Data on Virulence Genes from the NCBI Pathogen Detection Isolates Browser

Data from the NPDIB database contain the following information for each sample: the location of collection, the date of collection, the name of pathogen found, the detected virulence genes, the detected AMR genes, and the type of isolate (i.e., clinical or environmental). To translate the data into a usable format, each individual country’s dataset of samples was saved and preprocessed as a comma-separated value (.csv) file in Excel. In each file, the row refers to an individual sample, and a specific column refers to an information label mentioned above (e.g., the location of collection, the name of the pathogen, the collection date). In particular, one column is designated for each gene to indicate whether the gene is detected in each sample (i.e., each row), with 1′s indicating a gene was found in a sample, and 0′s indicating it was not found. These data matrices typically had several thousand rows and a few hundred columns.

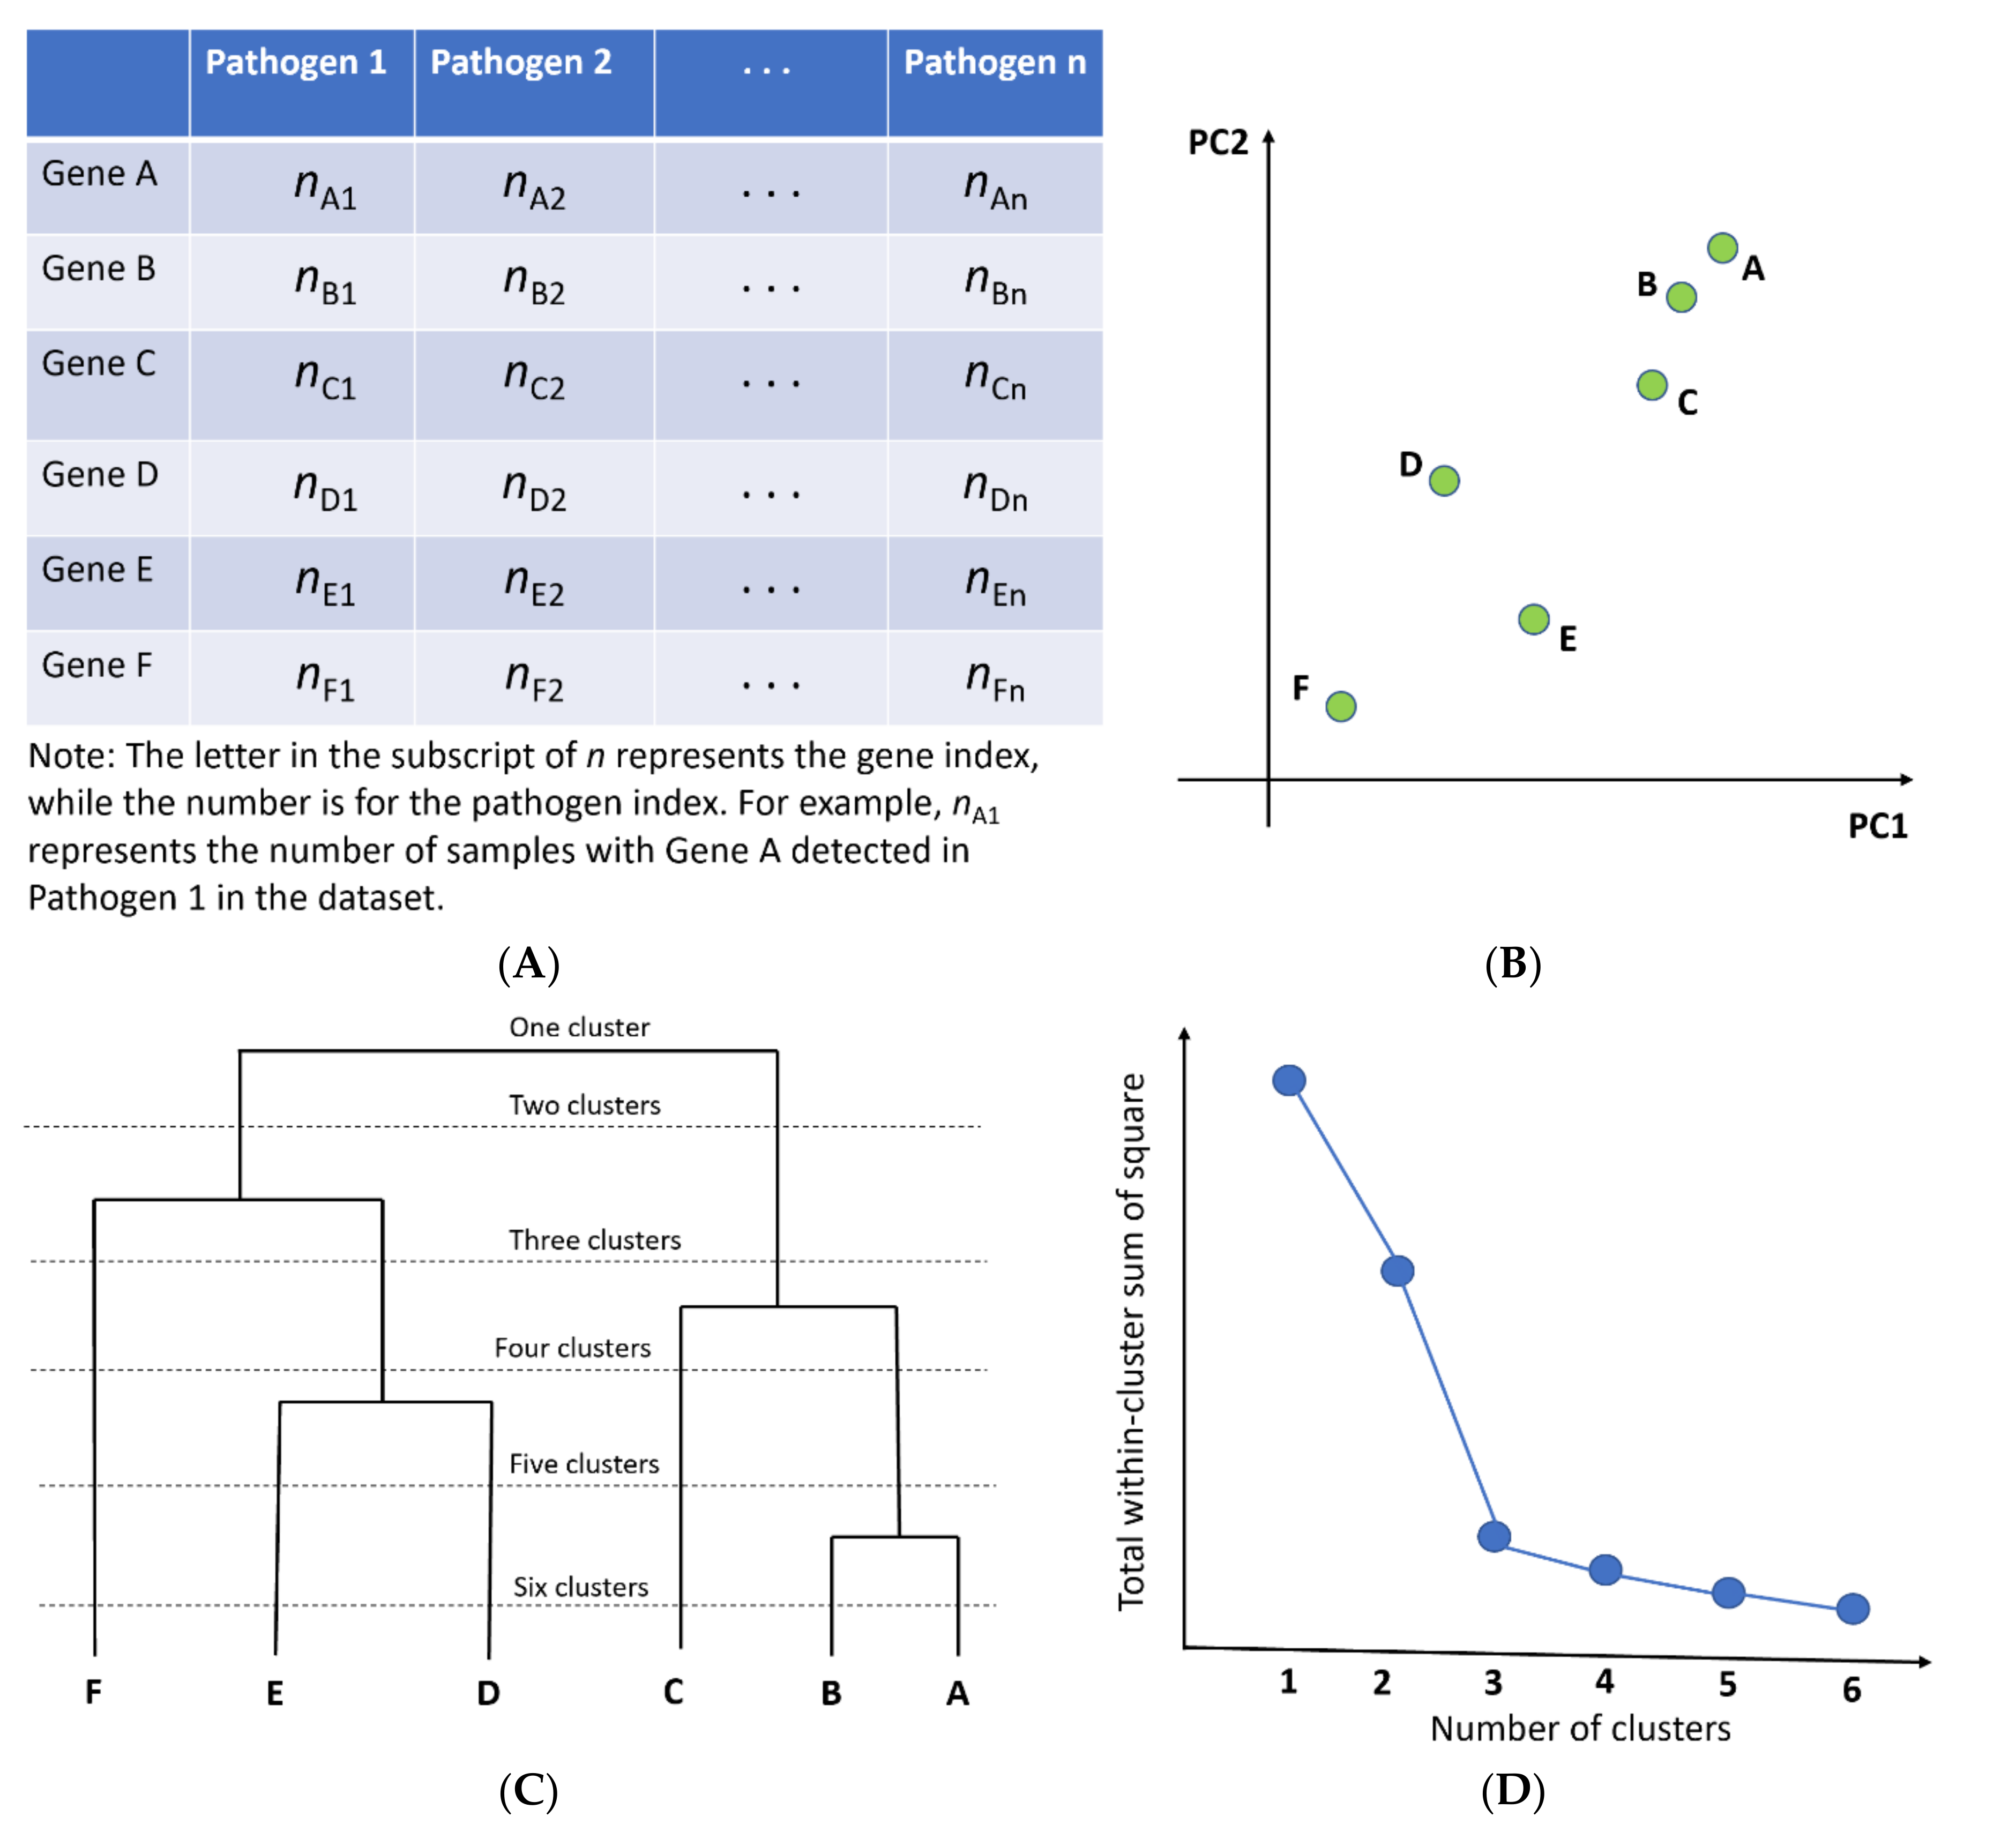
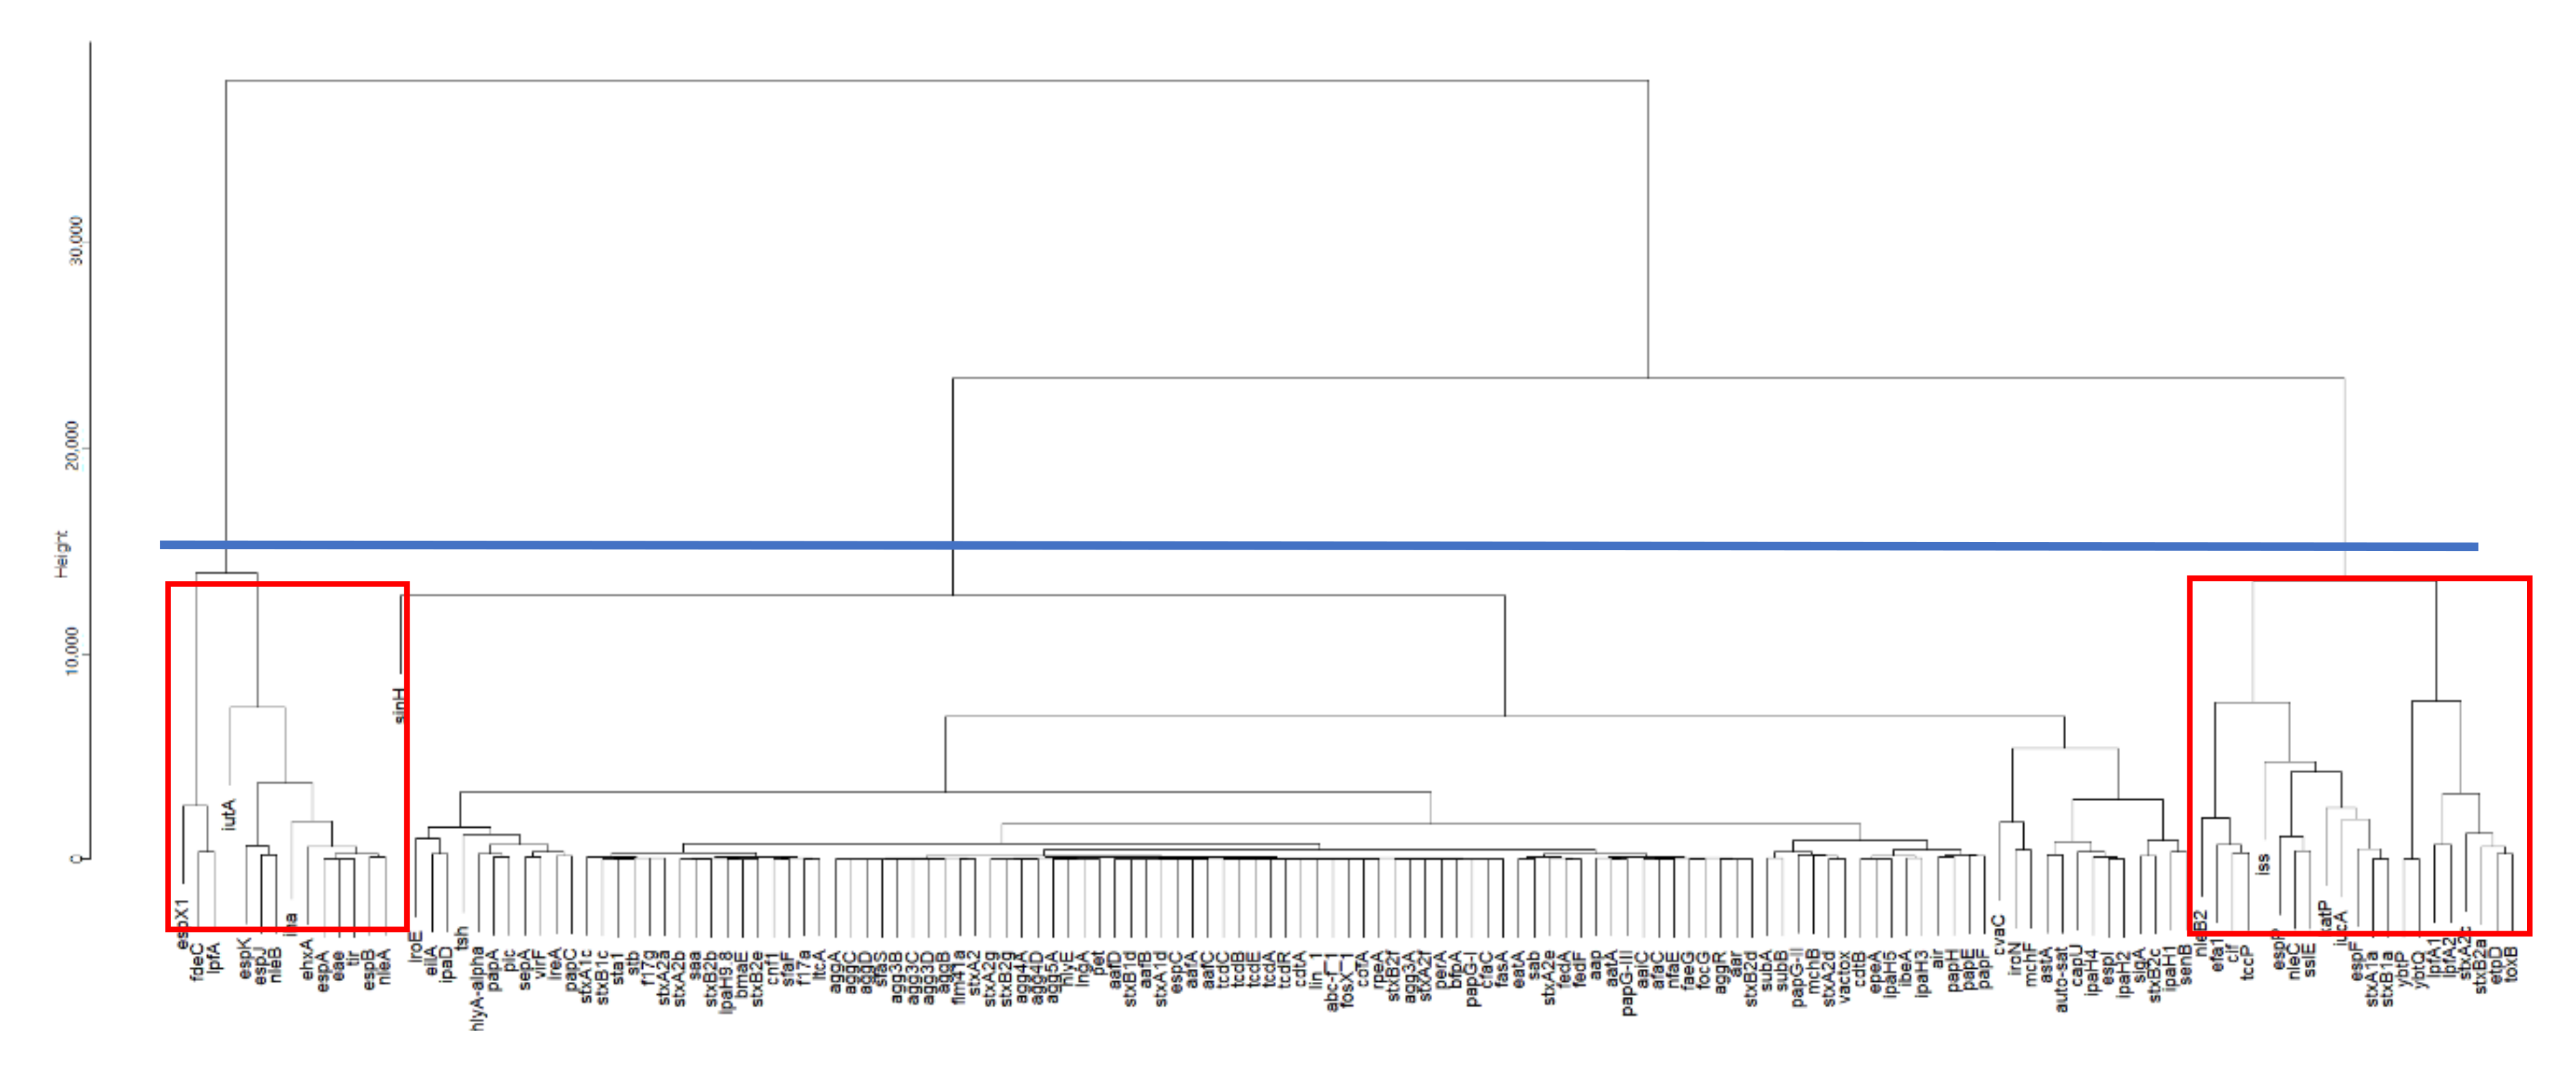
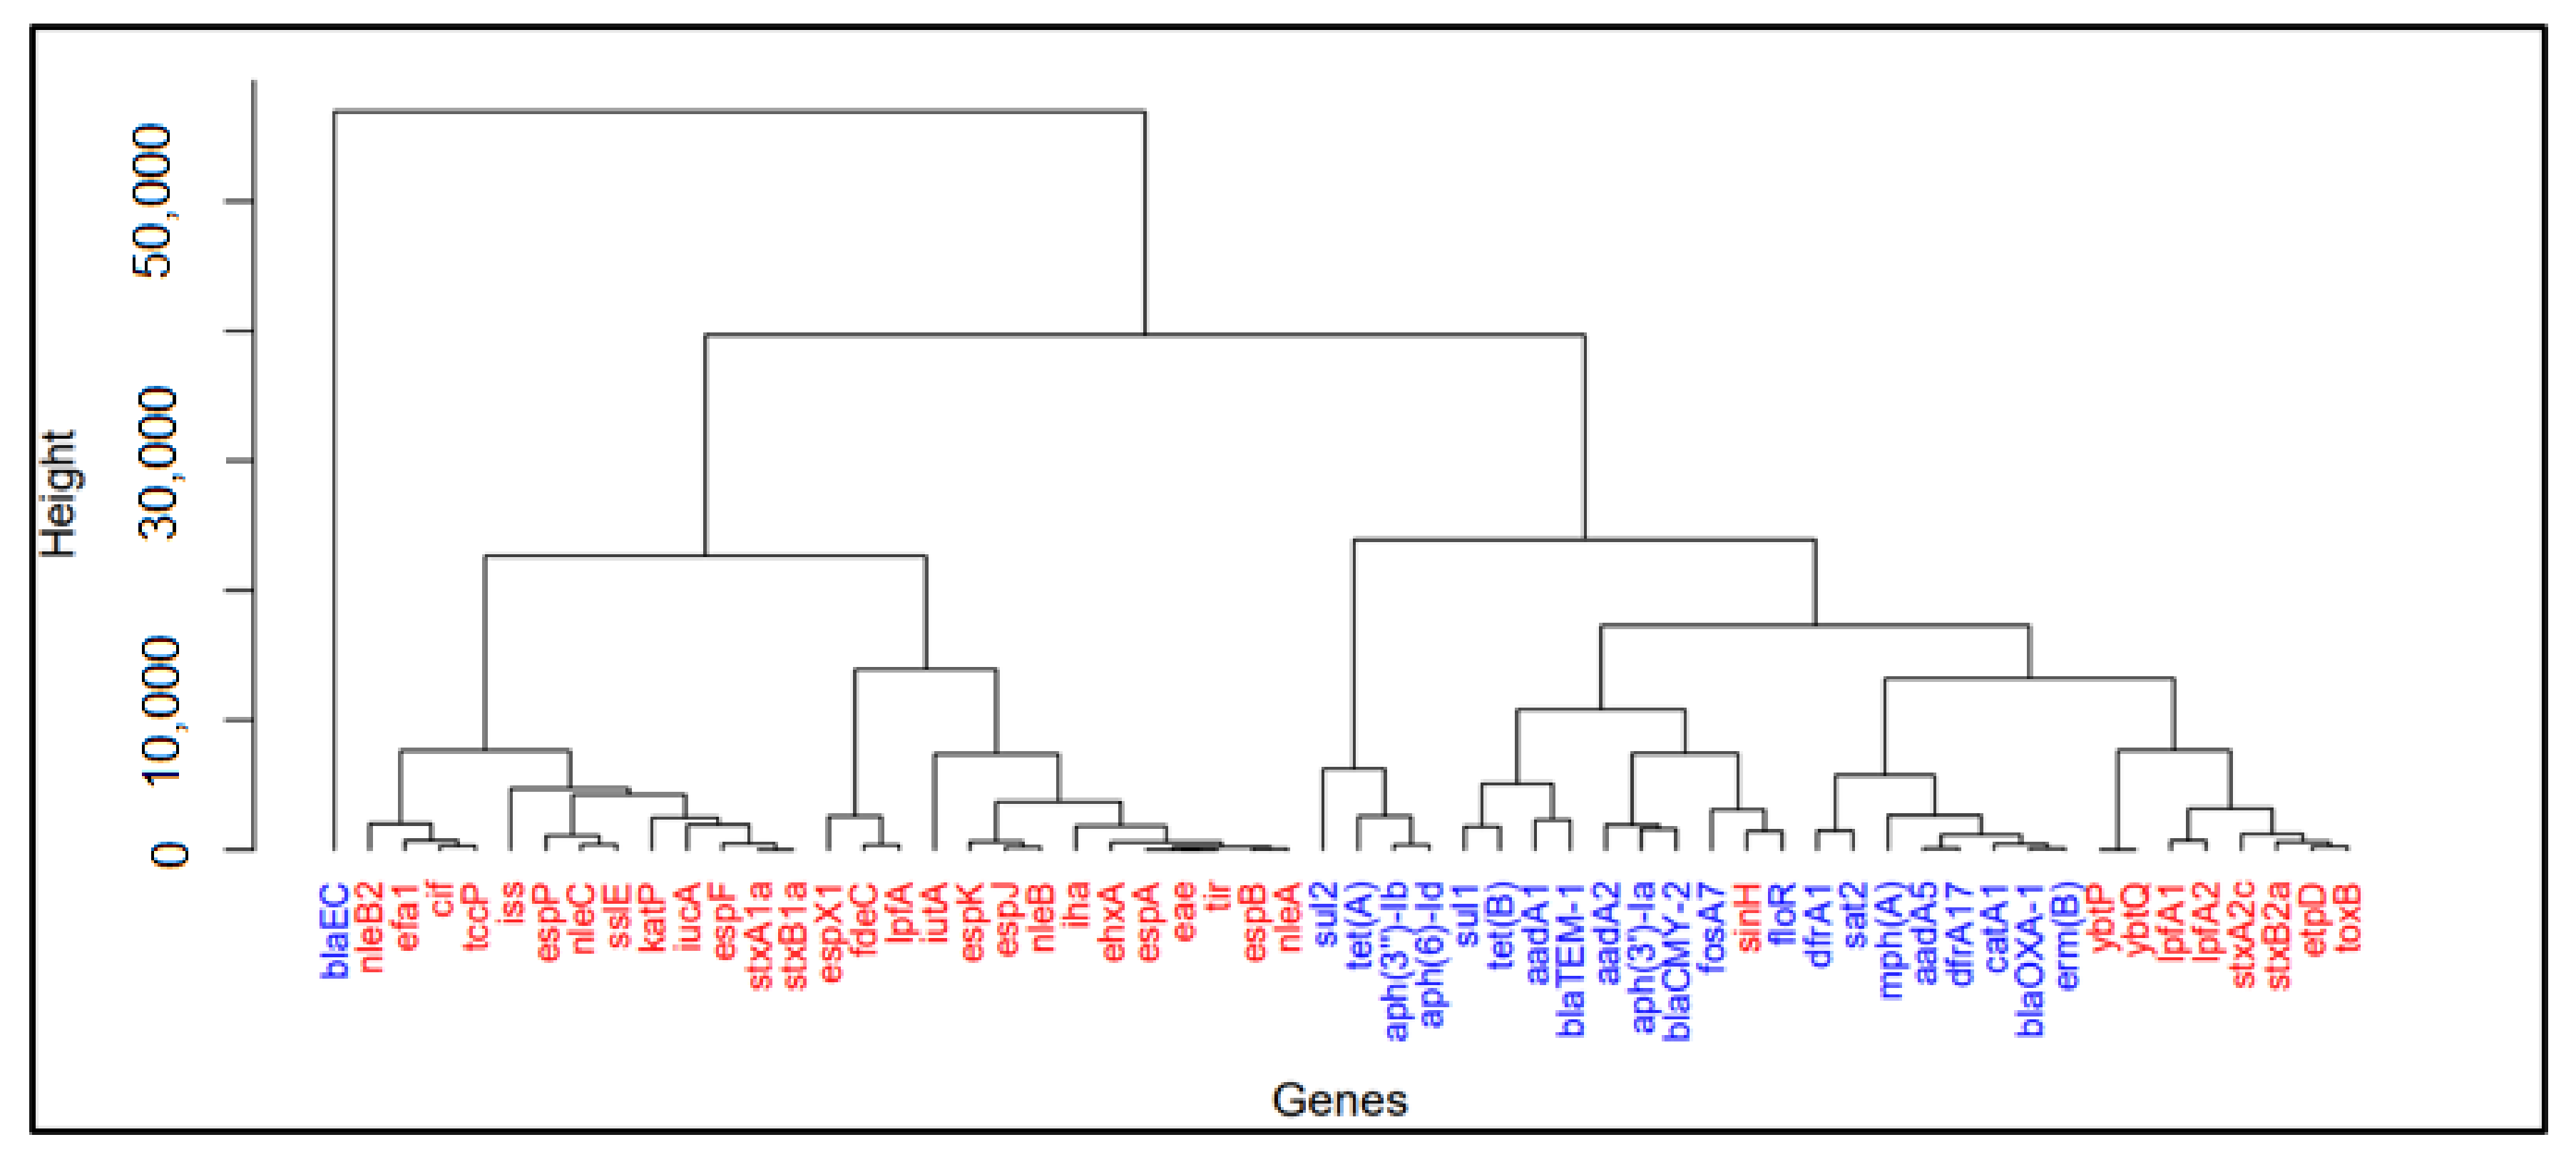
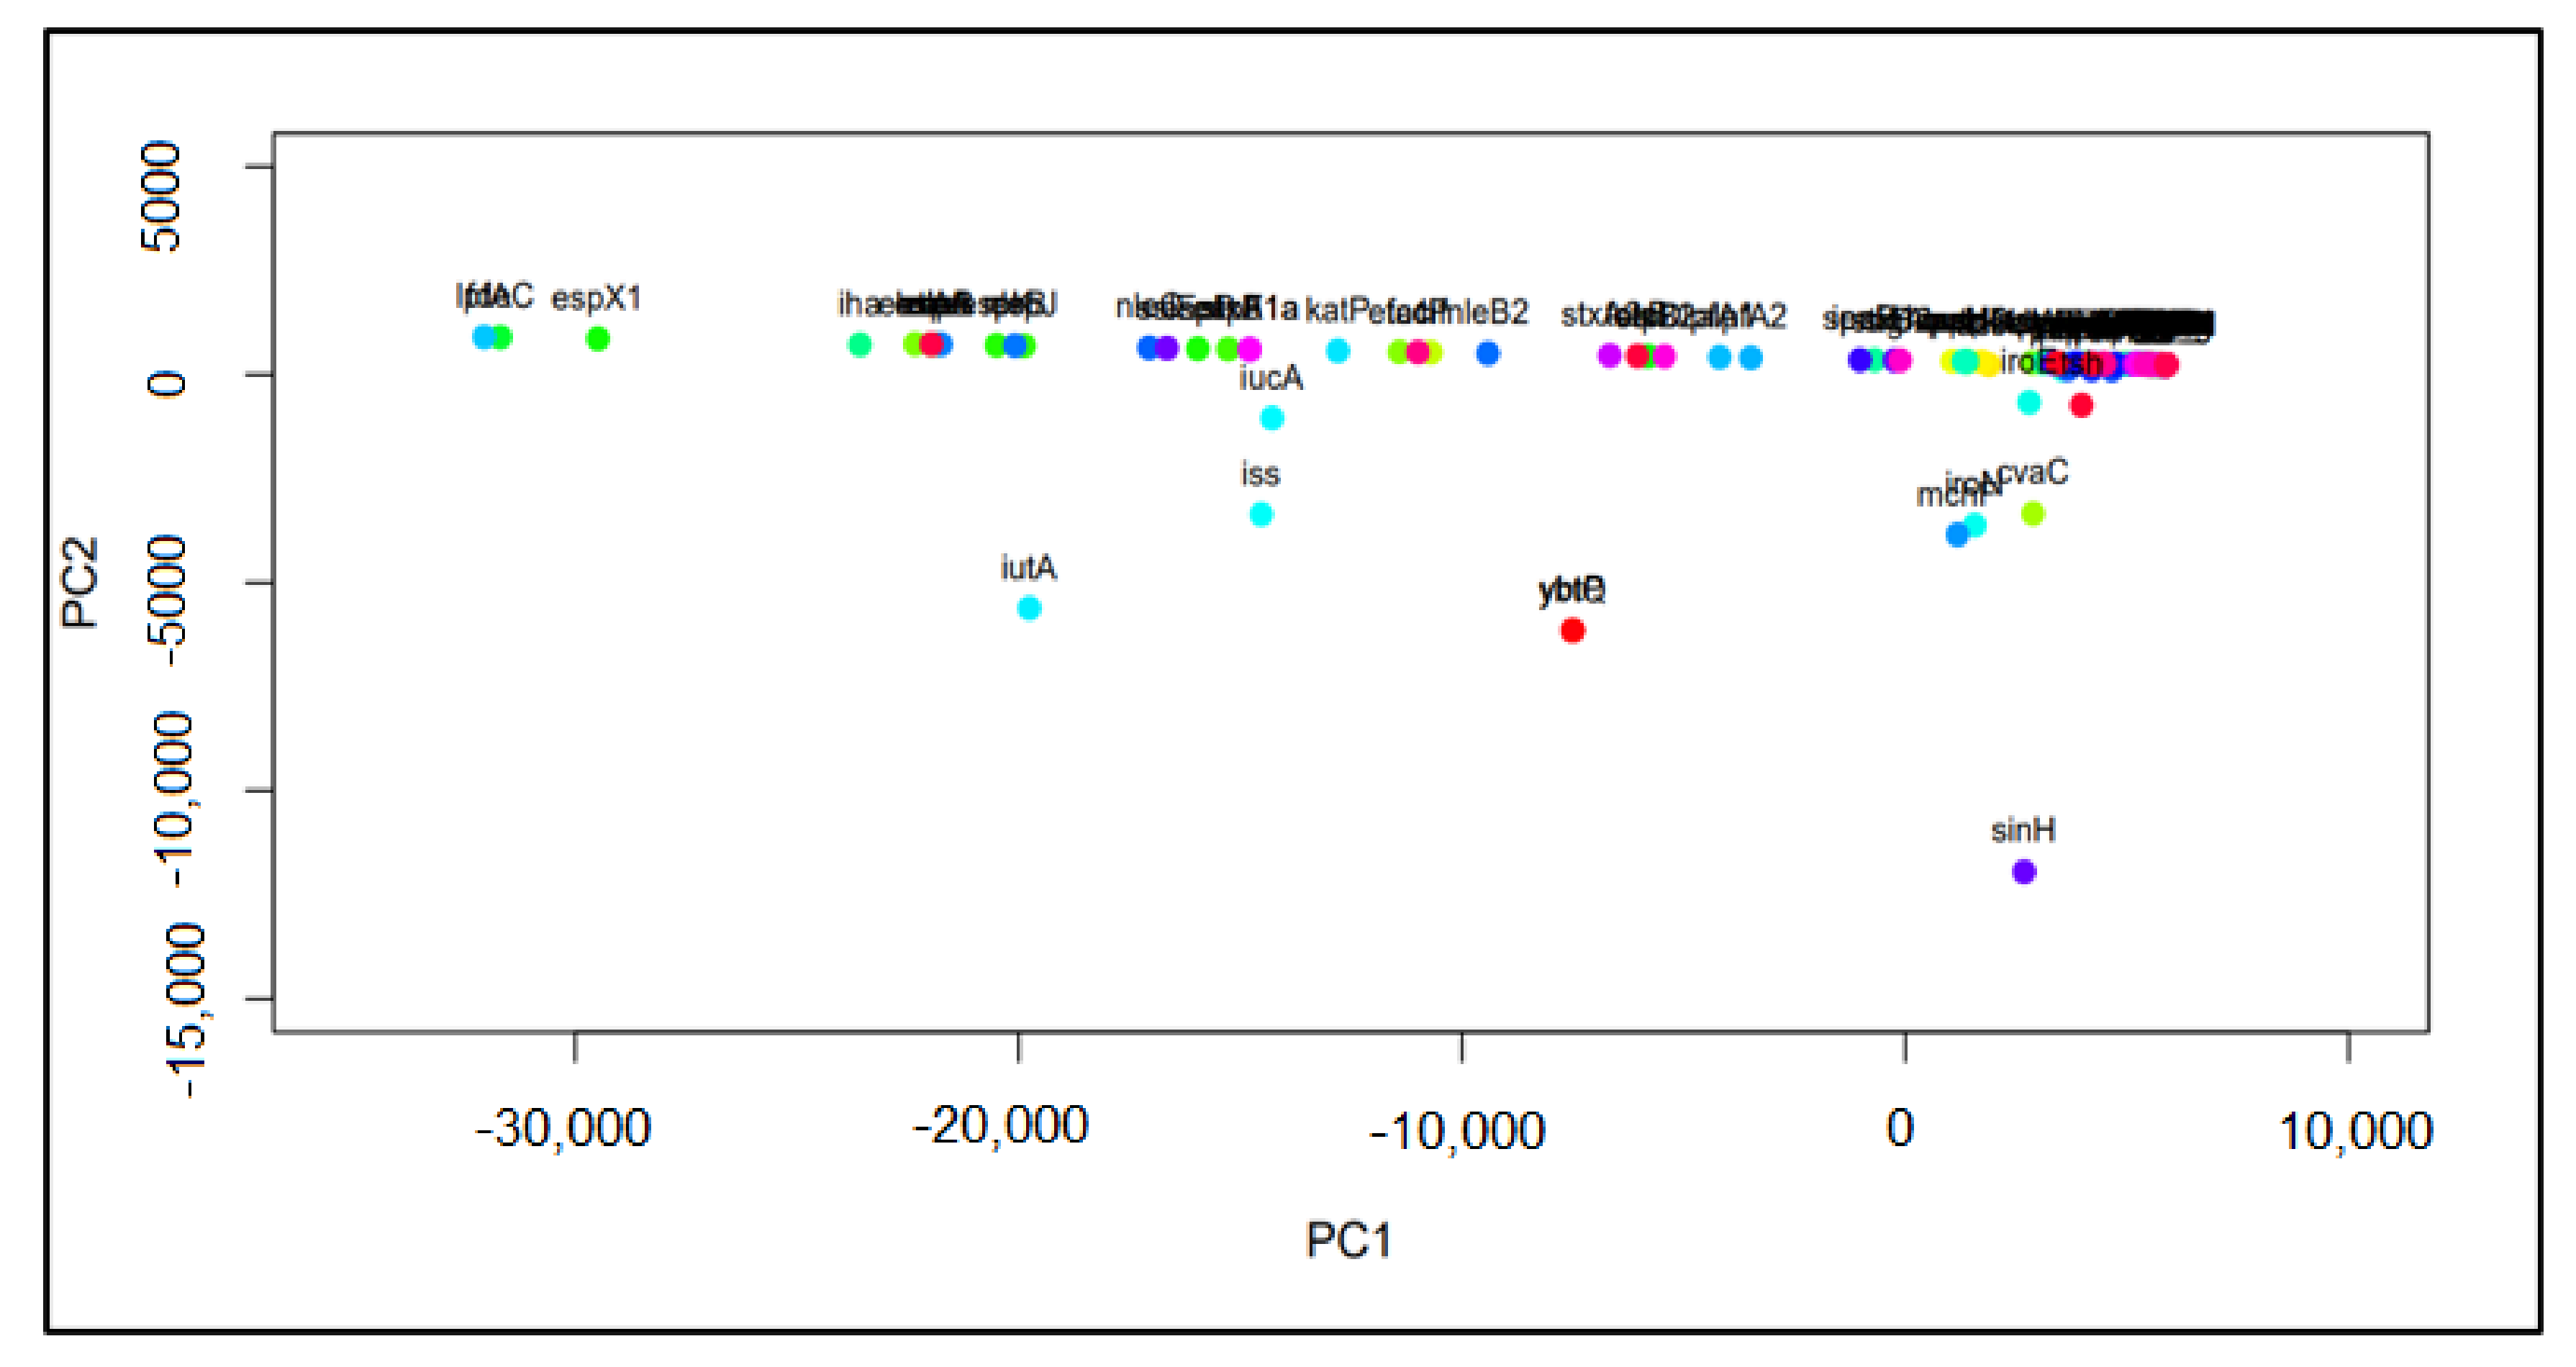
2.2. Principal Component Analysis (PCA) and Hierarchical Clustering

PCA is extremely useful in analyzing high-dimensional data. As the data extracted from the NPDIB database contain hundreds of dimensions (i.e., variables) to plot normally, PCA reduces the dimensions and projects the data into a two-dimensional space. The new data points are based on new coordinate dimensions, called principal components. A principal component is a linear combination of the initial coordinate variables. The first principal component (i.e., PC1) is always in the direction where projections have the largest variance. The second principal component (i.e., PC2) is the one with the greatest variance among all directions orthogonal (perpendicular) to PC1. The maximum amount of initial information is compressed into the first component, with the subsequent components containing less and less information. Once the data points are projected into a plot based on these principal components, the data are much easier to analyze since the data can be projected into only few dimensions. Identification of any correlations or outliers is now much simpler; in this study, the outliers were especially important. For example, the outlier genes show significantly different distribution patterns in how they are carried by pathogens from the bulk genes that are lumped together in the PC1~PC2 space. They typically show significantly larger occurrences than the bulk genes. Since there are more than one hundred virulence genes, these outlier genes can serve as better indicators of pathogenic virulence and thus better targets for virulence inhibition. Similarly, the outlier pathogens are regarded important, as they typically carry more virulence genes and have higher occurrence frequencies in the data.
In order to identify these important virulence genes in PCA, a new data matrix was created in R so that: (1) each row represents one gene; (2) each column stands for one pathogen; and (3) each element in the matrix represents the number of historical samples in which the gene in the row was detected in the pathogen in the column (Figure 1A). The PCA was then implemented on the matrix to plot the genes in a two-dimensional space characterized by PC1 and PC2 (Figure 1B). The outlier genes typically show more involvement in virulence than those bulk genes that typically lump together in the PCA plot. The R function prcomp was performed for PCA. A second PCA analysis for the transposed version of the same data matrix (now pathogens in the rows and virulence genes in the columns) allowed us to also identify important pathogens carrying virulence genes.
While PCA plots visualize the genes in a two-dimensional space, these plots were not able to quantify the relationship between individual genes. In particular, most genes lump together so that they are not distinguishable in the PCA plots. In order to quantify the relationship between individual genes, hierarchical clustering was used in conjunction with PCA. The pairwise distance between the genes is defined as the Euclidean distance from the genes’ projections on the PC1~PC2 space. The distance between different branches in the hierarchical clustering tree is calculated by the complete linkage approach. After calculating the Euclidean distance between points on a PCA plot, the closest or most similar points are then graphed as a cluster on a dendrogram, or a tree diagram (Figure 1C). Points are identified to be in the same cluster because they are connected by a line; points with the shortest distance, and thus shortest line between them, are the most similar. Each cluster is on a different level of the tree, with similarities in height reflecting similarities between clusters. The Elbow method [18] was used to determine the optimal number of clusters from the dendrogram. In particular, the number of clusters from the hierarchical clustering tree was gradually increased, with all data points regarded as one cluster from the beginning (Figure 1D). After increasing the cluster number one by one, the total within-cluster sum of square (i.e., TWSS_i, i for individual clusters) was calculated and then summarized together over all clusters (i.e., TWSS_all). TWSS_all was then plotted over the number of clusters. The number of clusters was determined by the location of the bend in the plot. While Figure 1 shows an illustrative example with three clusters, the genes in this work were generally separated into six clusters to identify the outliers. The genes showing few occurrences or patterns were generally lumped together in a single cluster, while the outliers were distributed in other clusters. The outliers are thus regarded important genes/pathogens.

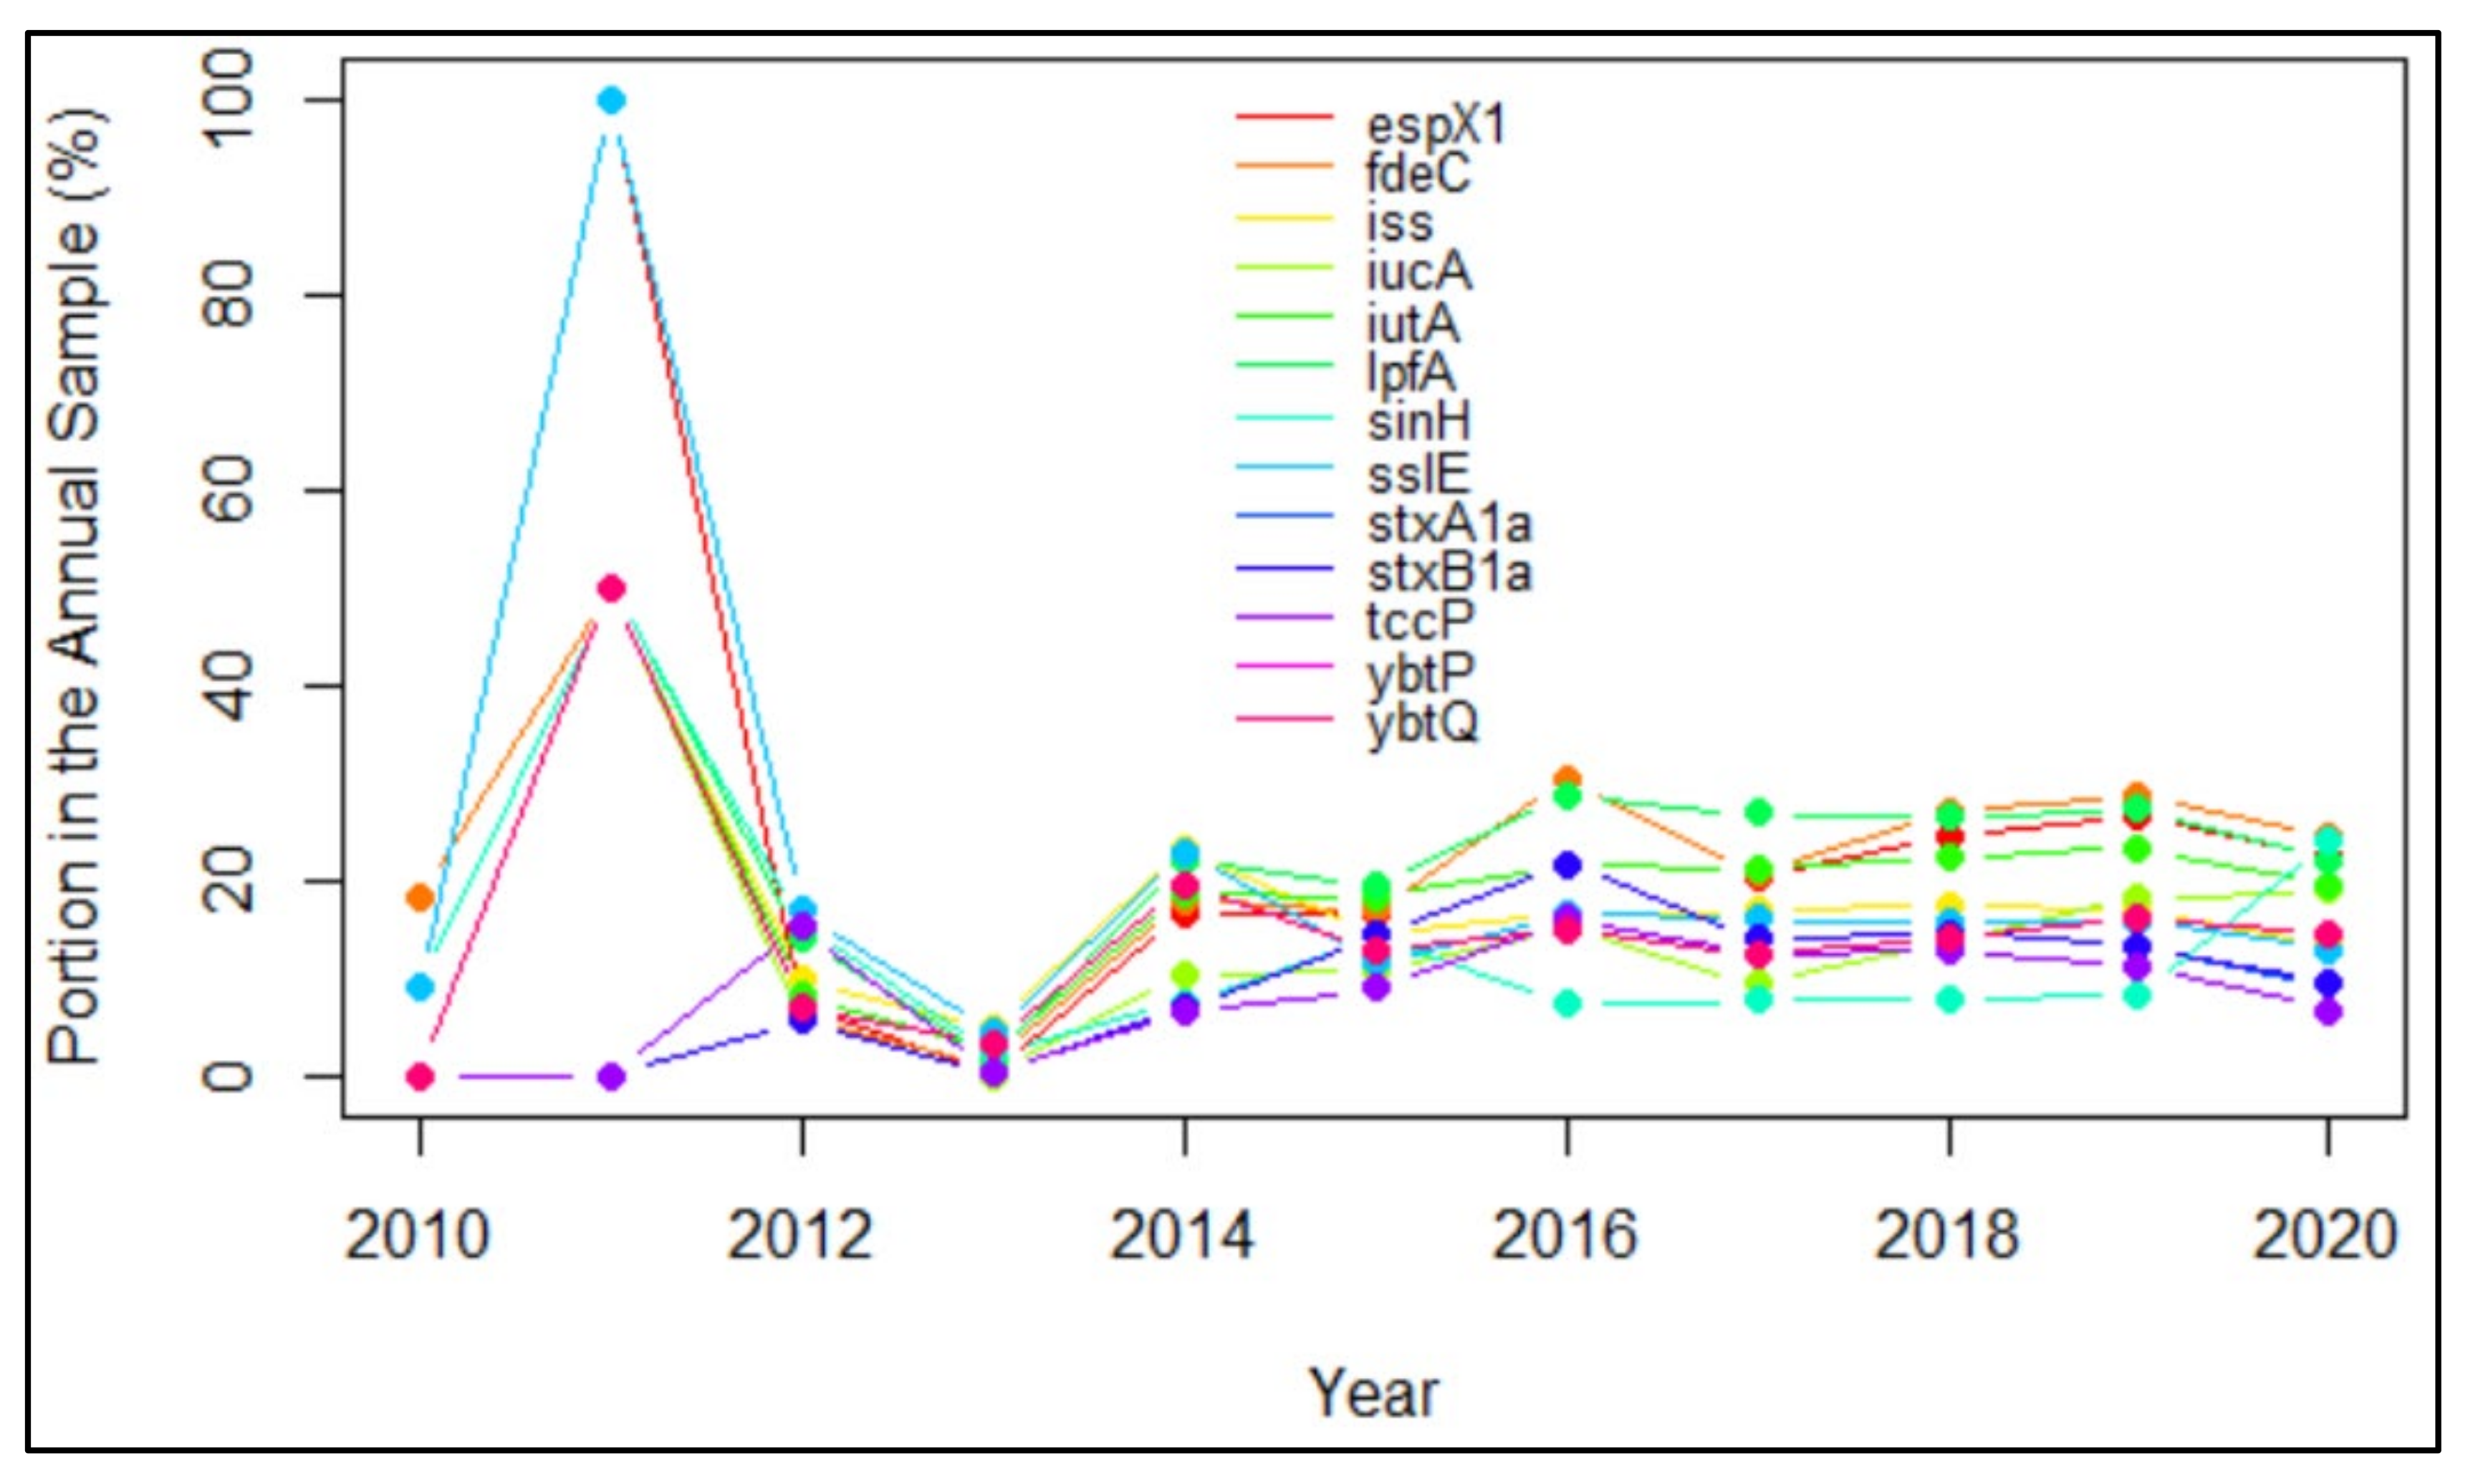
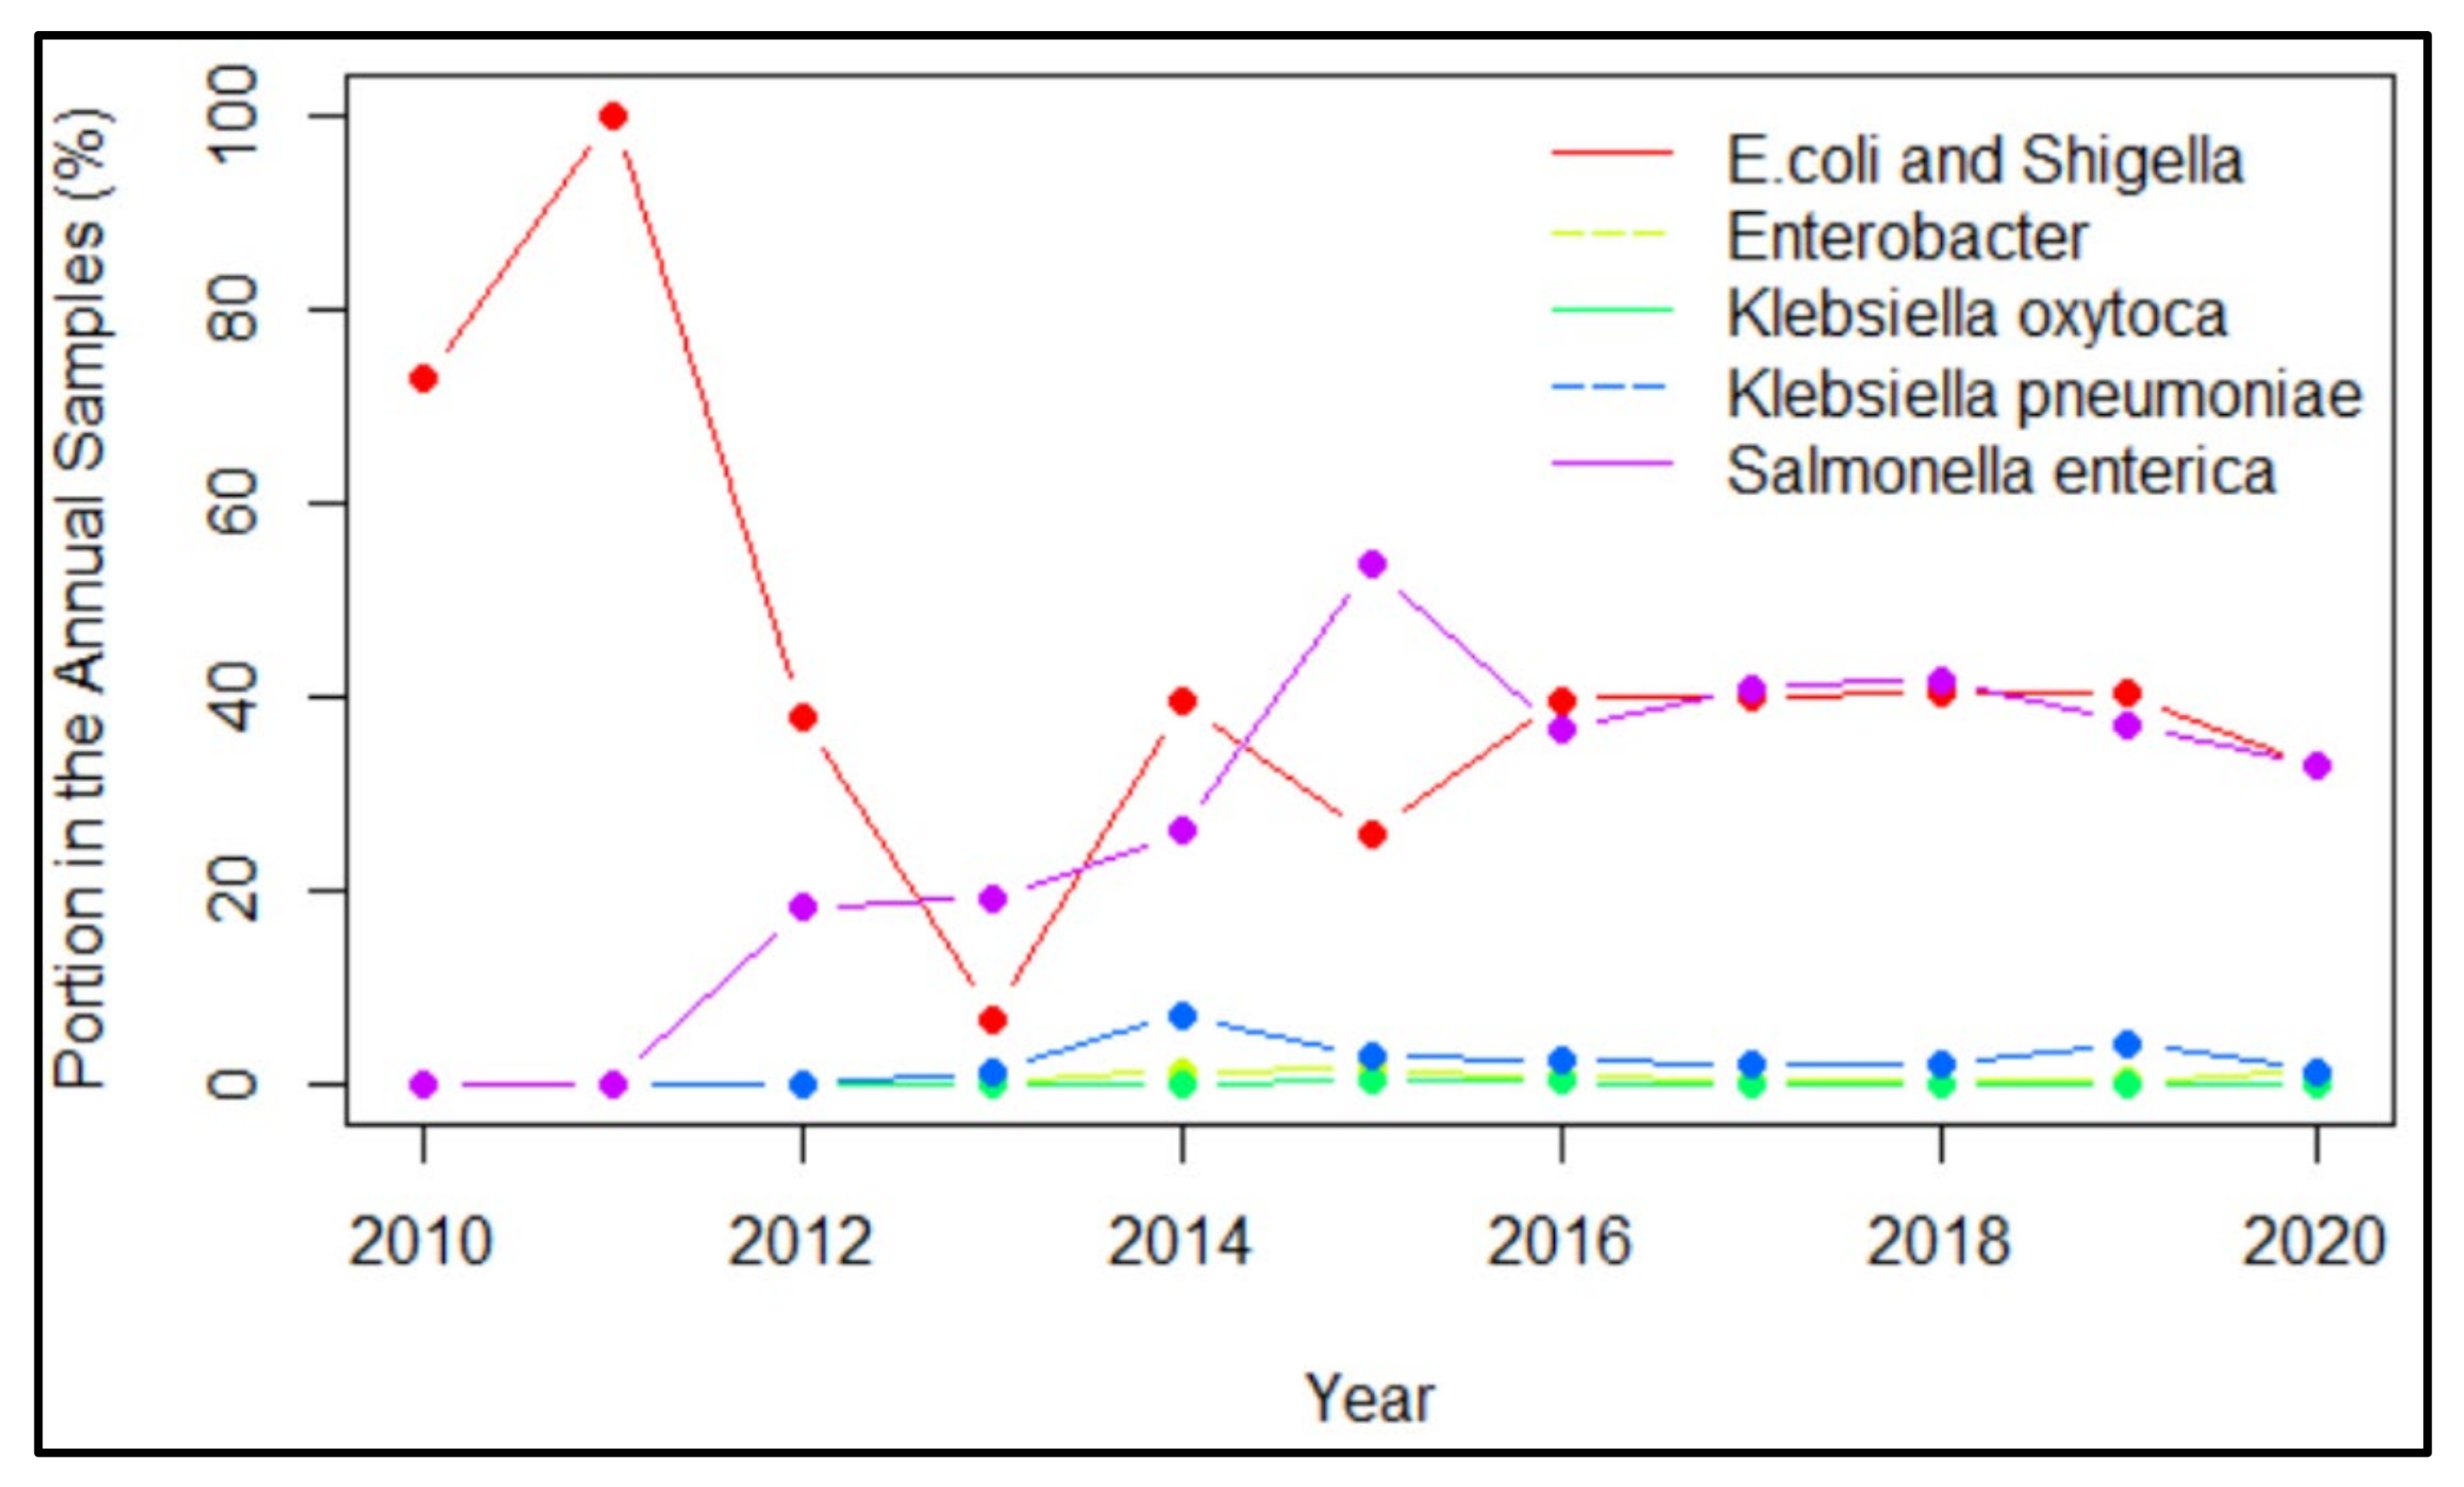
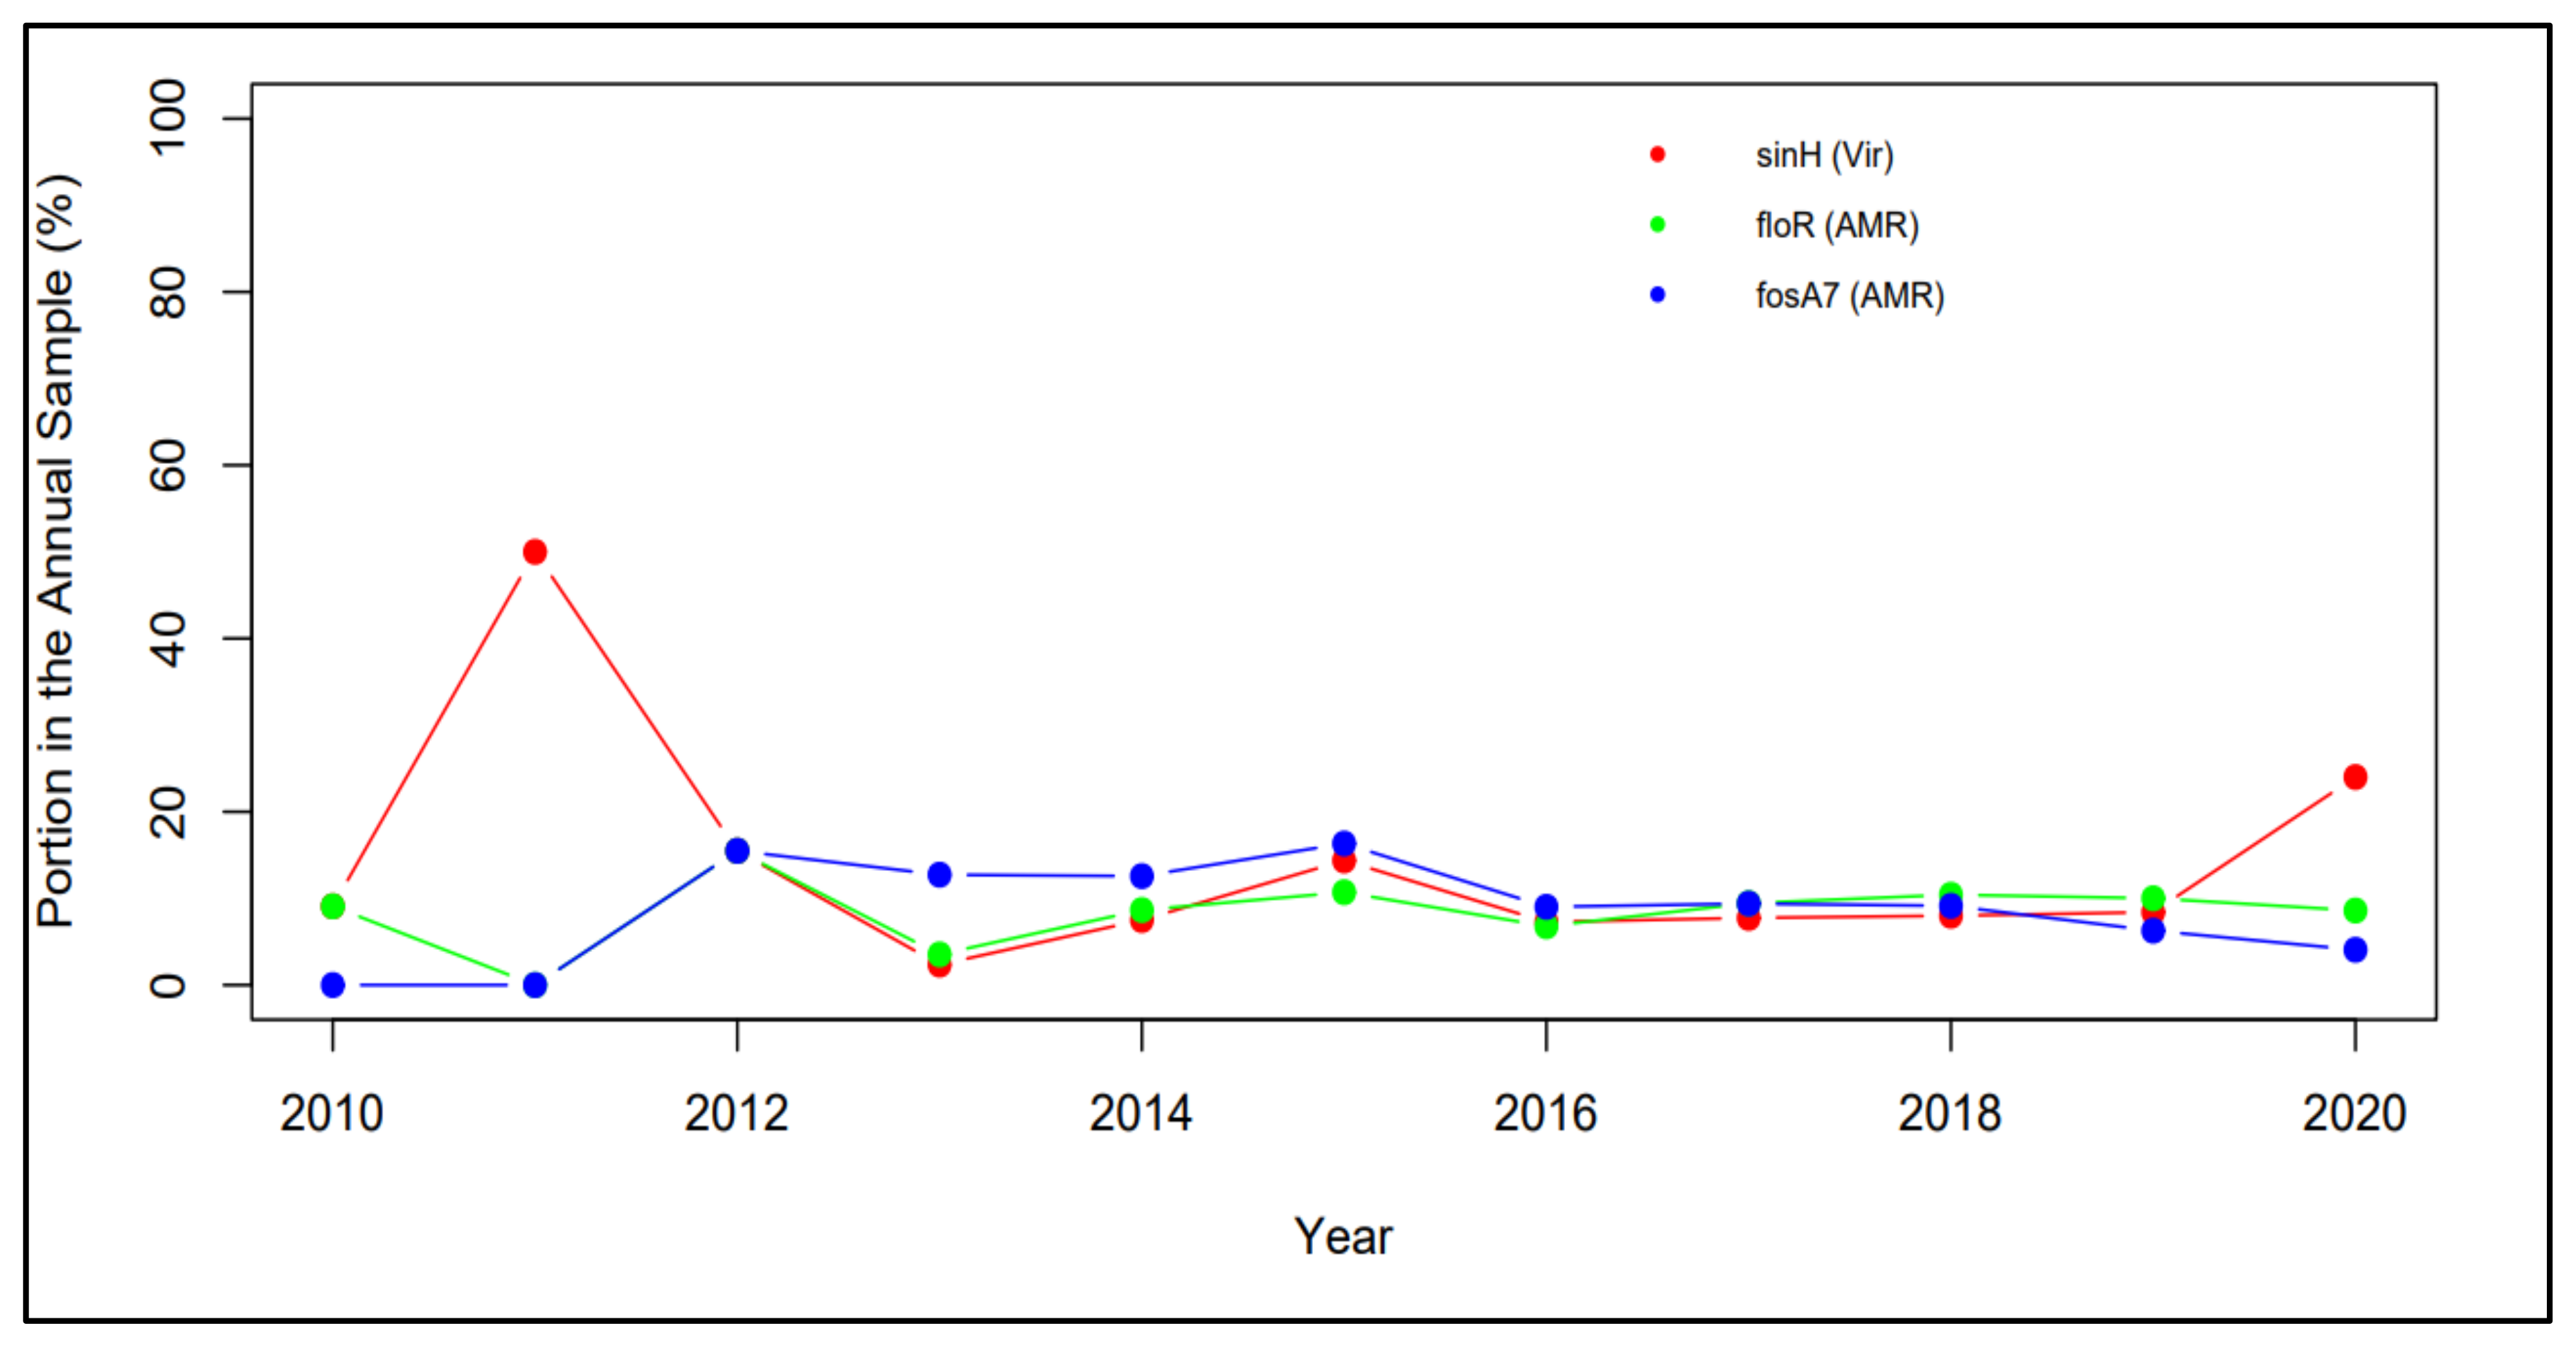
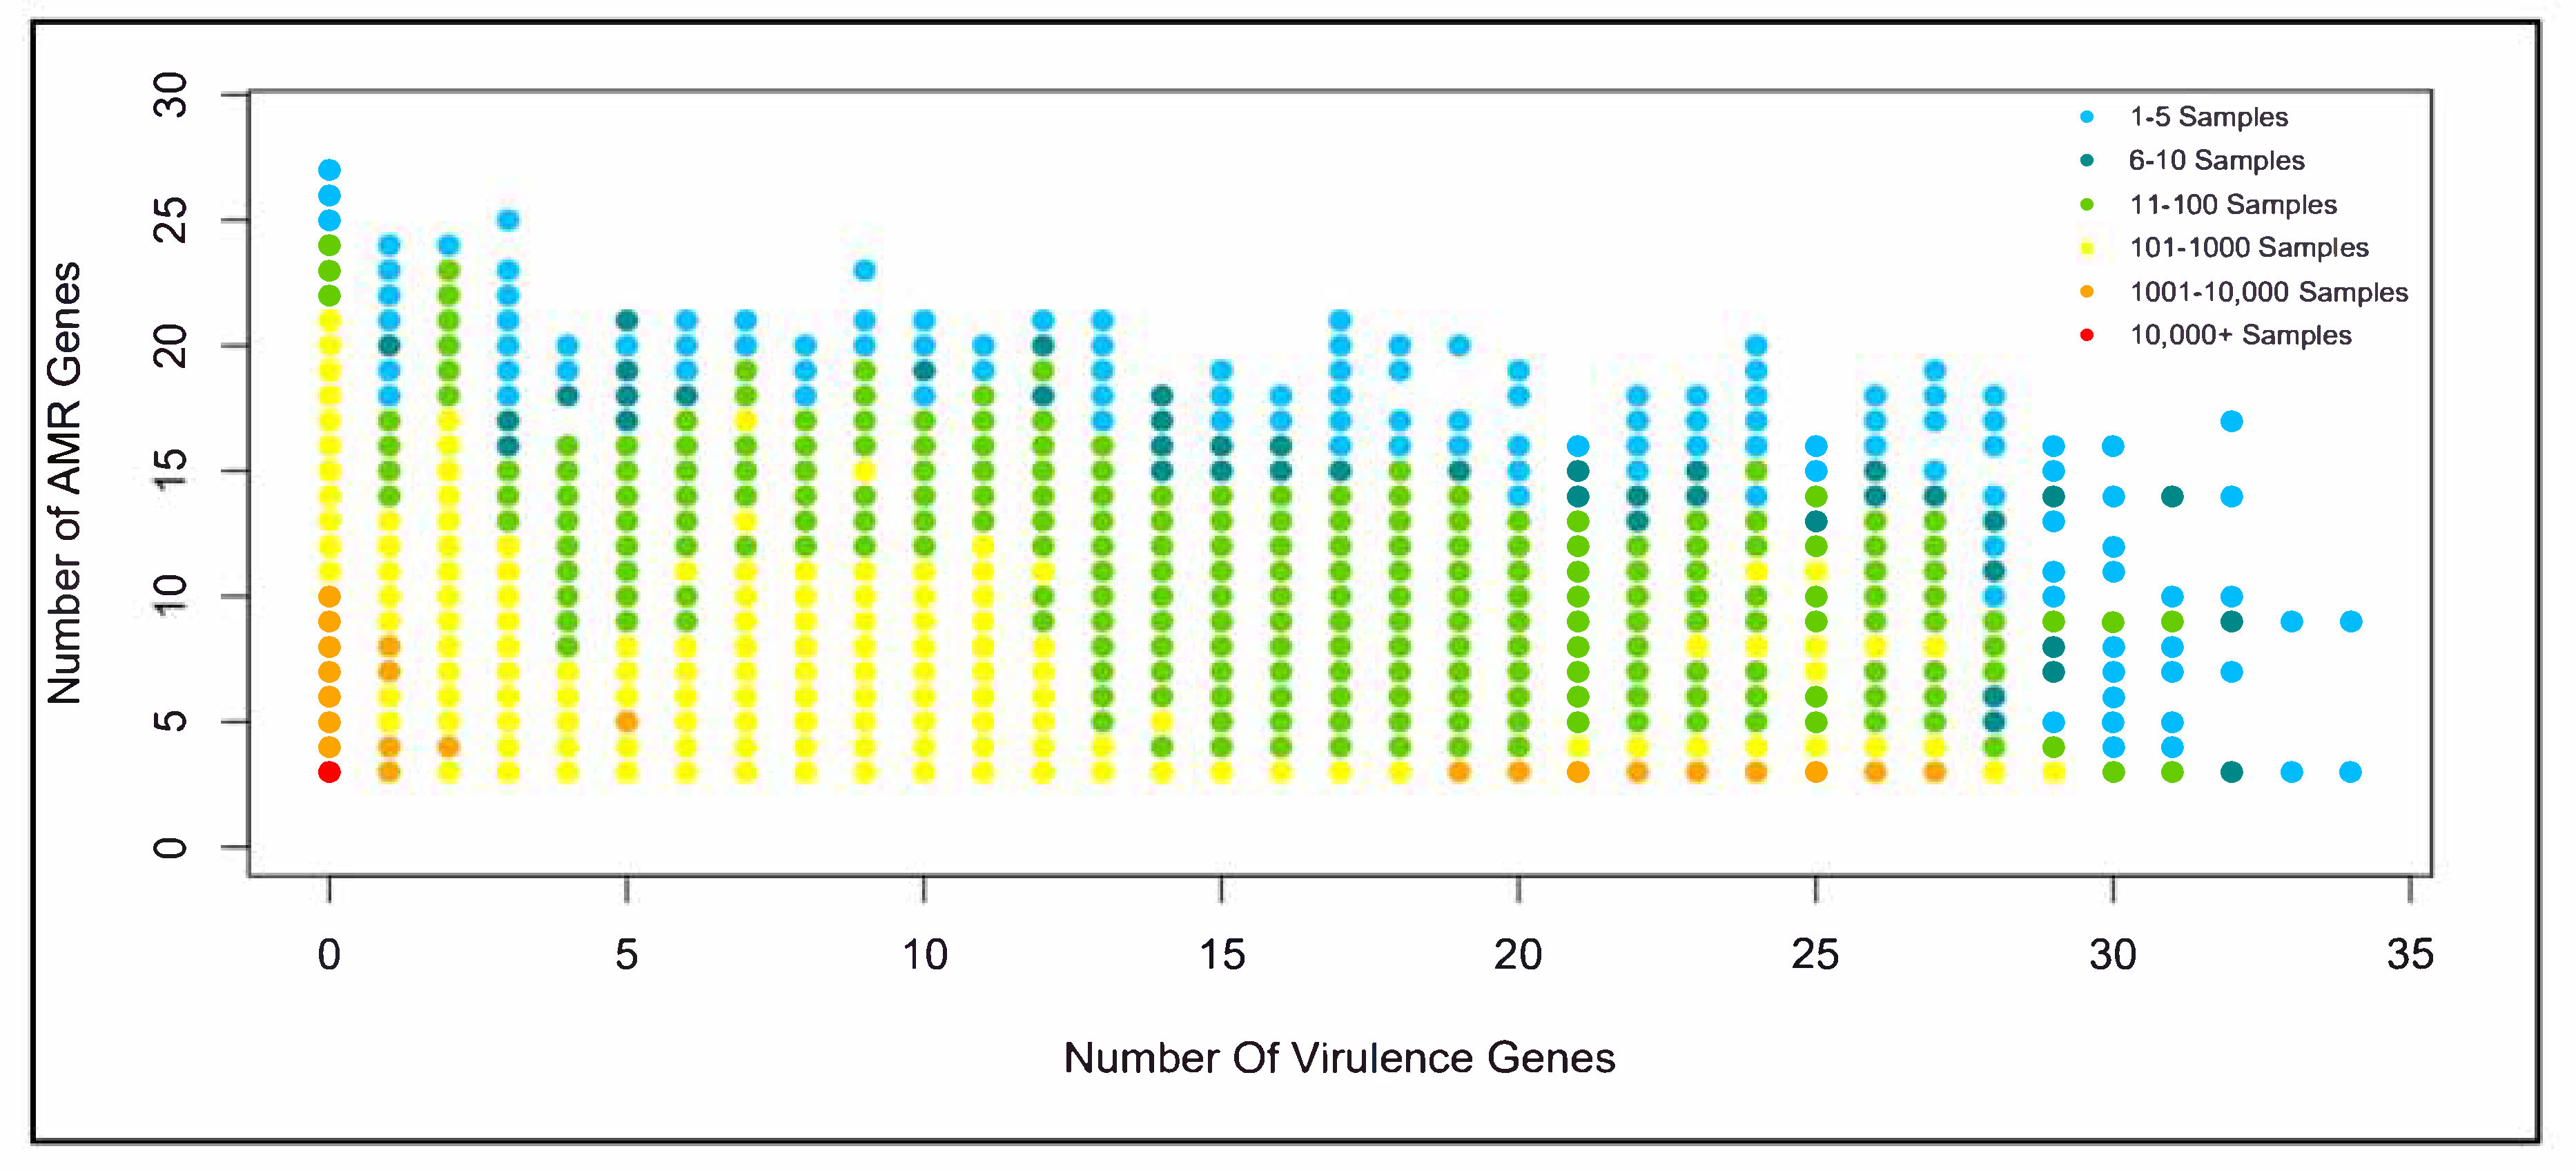
2.3. Time Profiles and Frequency Scatterplots

To study the trend of virulence over time, the historical profiles of the important virulence genes and pathogens were plotted. To reduce the bias of some years having more collected samples, the profiles were normalized by dividing the annual occurrences of genes or pathogens with the total number of samples collected in that year.
Additionally, plotting the number of AMR genes versus the number of virulence genes for each sample in each country, scatterplots of the different combinations of gene numbers were produced. For example, a combination of zero AMR genes and three virulence genes would be represented as a point; a combination of two AMR genes and one virulence gene would be another point. Additionally, with different colors, the frequencies of each combination were represented. Points with warmer colors, such as red or orange, had a high frequency of samples of that specific combination. Conversely, points represented as cooler colors, such as green or blue, had a lower frequency. In this way, combinations that were common in individual countries as well as across the five different countries were identified from the scatterplots. With this information, the relationship between the two types of genes could be qualitatively determined, if the correlation between the number of AMR genes and number of virulence genes was positive and clustered across a line, then it would suggest the two types of genes are more closely related. If the combinations of the number of AMR genes and number of virulence genes were more scattered or followed a negative trend, then there would be a much weaker general connection between virulence genes and AMR genes.

3. Results

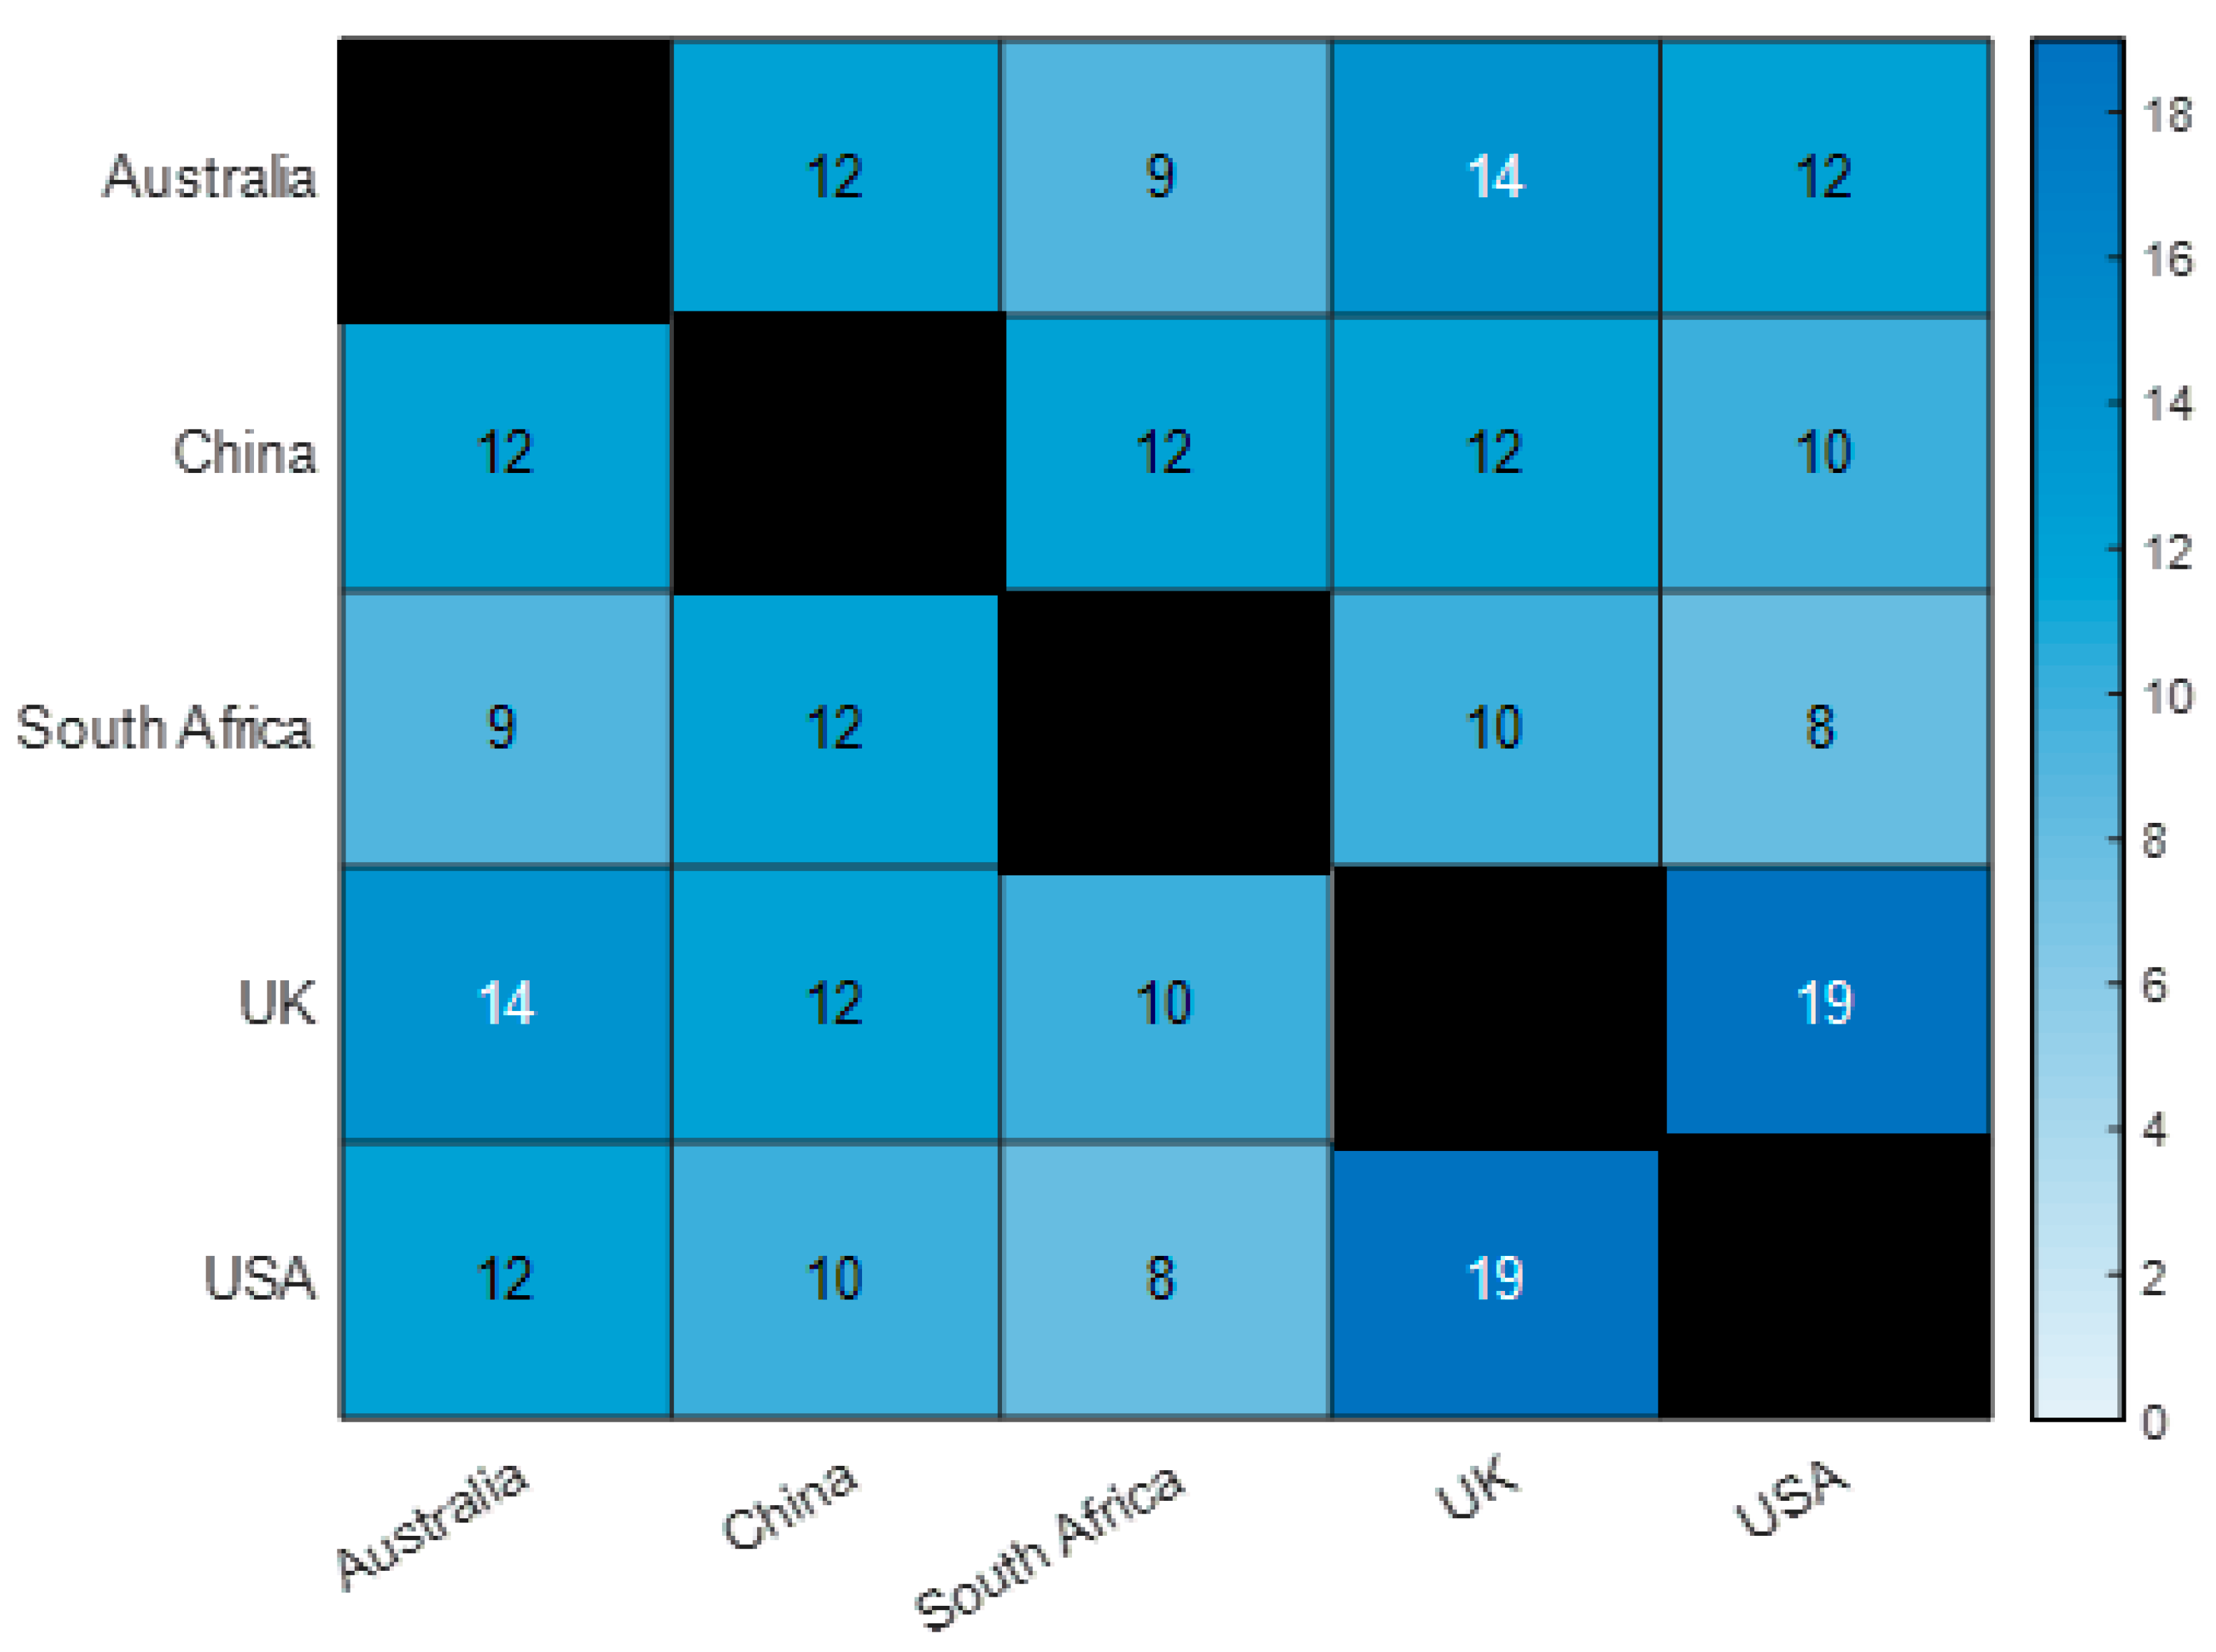
3.1. Important Virulence Genes in Samples from Australia, China, South Africa, the UK, and the US

Visualized by principal component analysis and hierarchical clustering, as described in the Materials and Methods section, important virulence genes were identified for each of the five countries. In summary, the genes clustered away from the other ones, represented as outliers in the PC1–PC2 space and as more separated in the results from hierarchical clustering, are the important genes of a country. As an example, the results from hierarchical clustering of the US are shown in Figure 2. The PCA representation is not shown here, instead it can be found in the Appendix A. Since the US has over 150 different virulence genes, it is rather difficult to discern important genes in the PCA graph (with lumping genes). The two red rectangles in Figure 2 show the genes in the US that are important. Similar methods were used to identify the significant virulence genes in Australia, China, South Africa, and the UK as well. Table 1 summarizes the important virulence genes across each country. There is quite a bit of variation in the number of virulence genes identified as important in each country. For example, South Africa has only 15 genes while the US has 36. Despite this disparity, eight genes were shared among all of the five countries (fdeC, iha, iss, iutA, lpfA, sslE, ybtP, and ybtQ), and several more were common between three or more countries. These important shared genes are highlighted in red and blue in Table 1.
More detailed descriptions of these shared genes are shown in Table 2, with red again representing the eight genes common among all countries, and blue representing the genes shared between at least three countries. Expectedly, many of these genes have common functions such as pathogenic infectivity through adhesin-like proteins (fdeC [19], iha [20], lpfA [21], and sinH [22]), increased iron reception and uptake (iutA [23], ybtP [24], ybtQ [24], and iucA [25]), and also toxin synthesis for host inhibition (auto-sat [26], espX1 [27], and mchF [28]). The iss and sslE genes are most unlike the others in terms of function as they work to promote extraintestinal infectivity [29] and biofilm production [30], respectively. Additionally, the common genes between all countries were found in E. coli; however, a trend was noticed in genes shared among at least three countries as well. Generally, it seems that virulence genes with a role in infectivity that are found in E. coli are important.
To further study the important virulence genes, normalized historical occurrences of individual genes in annual samples from 2010–2020 were plotted separately for each country. The genes with generally increasing trends after 2011 were identified and they are underlined in Table 1. For each country, these important genes were then plotted together in a summarizing historical time profile to identify any trends. Figure 3 shows the important increasing genes found in the US. There is a large increase in gene portion in 2011, and there are smaller subsequent spikes in 2014 and 2016; generally, the behavior seems to stabilize after then. Similar graphs were produced for other countries to compare their trends as well.

3.2. Important Pathogens Carrying Virulence Genes in Samples from Five Countries

In addition to identifying the important genes in each country, principal component analysis and hierarchical clustering were used to identify the key pathogens that carried these genes. In Table 3, the important pathogens found in each country are shown. Highlighted in red are the three pathogens that were common among at least four countries (no pathogen was shared among all countries). These pathogens were E. coli and Shigella, Klebsiella pneumoniae, and Salmonella enterica. As previously stated, many of the important virulence genes identified in Table 1 were found in E. coli and Shigella samples. Furthermore, as shown in Table 2, a few common virulence genes were also found in Klebsiella pneumoniae or Salmonella enterica, so it makes sense that these three pathogens were found to be common among all countries except Australia.
Normalized time profiles of the pathogens were also produced to compare the historic trends in each country. Figure 4 shows such a graph of the important pathogens in the US. There does not seem to be any distinct pattern before 2015, but after that year, the percentage of the pathogens found in the total annual sample seemed to stabilize. The line representing E. coli and Shigella also seems to have a similar trend to that of important increasing virulence genes as seen in Figure 3, with a spike in 2011 as well as small increases in 2014 and 2016. These results align with the fact that many of the important virulence genes were found in E. coli and Shigella.

3.3. Comparisons between AMR Genes and Virulence Genes

In addition to identifying the important virulence genes across the five countries, principal component analysis and hierarchical clustering were performed to compare the similarity between virulence genes and previously studied AMR genes [7,8]. Previously identified important AMR genes were combined with the genes found in Table 1, and through hierarchical clustering, the virulence genes and AMR genes in each country that connected in the clustering branches were found. For example, the hierarchical clusters of important genes in the United States are shown in Figure 5. As before, it is hard to identify the overlap or connecting genes with the PCA representation, so only the hierarchical clustering is shown here, and the principal component analysis graph can be found in the Appendix A. From the clustering, it can be seen that sinH is the only virulence gene clustered with AMR genes, and it is closely related to other antimicrobial resistance genes such as floR and fosA7. Table 4 shows virulence genes and AMR genes that are connected in the clustering tree. As shown in the table, there were far fewer “overlap” genes than either important virulence genes or AMR genes. In South Africa, there was also minimal overlap between virulence genes and AMR genes, but in Australia, China, and the UK, there were several important genes of both types clustered near each other. The specific virulence genes and AMR genes clustered together were different in each country, but some genes were consistently related to each other across the five geographies. For example, the yersiniabactin virulence genes ybtP and ybtQ were correlated with beta-lactamase AMR genes in several countries. Connections between these genes likely relate to a common pathogen of E. coli. The general delineation between virulence genes and AMR genes, however, suggests that there is little similarity in the number of pathogens carrying the two types of genes.
To further compare virulence genes and AMR genes, normalized time profiles of the historical occurrences of these connecting genes were plotted to identify any trends or patterns. These profiles looked different for each country. As an example, Figure 6 shows the time profile of important virulence genes and AMR genes in the US. The behaviors of the virulence genes and AMR genes have some similarities as they all share a gene portion spike in 2015 and relatively flat behavior after that, but there are also differences, as the sinH gene has a large increase in 2011 while the two AMR genes do not. In Australia, China, South Africa, and the UK, fluctuations in gene portions cause spikes in uniquely different years, but generally the overlap genes that link virulence and AMR share similar behaviors in each country.
While Figure 5 and Table 4 show the connected important AMR genes and virulence genes in hierarchical clustering, we further studied the total number of AMR genes and virulence genes in each sample for each country. In other words, the number of genes, instead of the gene ID, was studied to quantify the correlation between the number of the two types of genes in individual pathogen isolates. We plotted the number of virulence genes against the number of AMR genes found in samples from each individual country. Figure 7 shows such a scatterplot of the gene amounts in the US, and similar graphs were produced for the other countries as well. In the US, there were no instances in which a sample had less than three AMR genes (as those pathogens are antimicrobial resistant). Additionally, almost no samples had a high amount of virulence genes as well as a high amount of antimicrobial resistance genes; most samples had less than 25 virulence genes and 15 AMR genes. In other countries, it was also unlikely that samples had a lot of virulence genes and AMR genes, and it was also rare to have many virulence genes without at least one AMR gene. Generally, all countries had scattered points and no apparently positive correlation between virulence genes and AMR genes were found. These results support the idea that while a few AMR genes may be linked with virulence genes, the two types of genes are mostly not correlated.

4. Discussion

4.1. Similarities of Virulence Genes across Five Selected Countries

Table 1 lists the important virulence genes for the five selected countries. The number of important virulence genes that are shared by each pair of countries is shown in Figure 8. The diagonal elements in the table are for individual countries, while the non-diagonal elements illustrate the similarities of virulence genes between countries. While South Africa shares less than 10 important virulence genes with either Australia or the US, most countries share 10 or more important virulence genes with others. In particular, the US and the UK share the largest amount of important virulence genes (i.e., 19 genes), followed by the UK–Austria pair, which contains 14 shared virulence genes.
Pathogens and their genes can spread to other countries through trade and travel through contamination of goods or an unknowingly infected person, for example. Once the pathogen reaches an unfamiliar country, it would spread from host to host using its virulence mechanisms, allowing these new virulence genes to integrate with existing ones so that the countries share similar virulence genes. The greater amount of similarities in certain countries could be explained by trade or travel, both of which provide pathogens, and therefore genes, access to other countries. For example, the US–UK and UK–Australia pairs have the largest amounts of shared important genes due to their close trading and traveling relationships. In addition to these three countries, China shares more than 10 important virulence genes with any one of the other countries. This may be explained by the trading relationship between China and the other countries. For example, China is Australia’s largest trading partner for both imports and exports; Australia is China’s sixth largest trading partner overall [31]. In addition, China has provided more travelers to Australia than any other country, with over a million Chinese tourists visiting in 2019 [32]. This number accounted for about 15% of Australia’s short-term visitors that year [32]. Immigrants from China also make up the second highest foreign-born population in Australia, at about 2.7% of Australia’s population [33]. While South Africa shares relatively less important virulence genes with other countries, its pairs with China and the UK may be implied by its trading relationship with these two countries. For example, the UK is South Africa’s fourth largest trading partner, receiving 5.1% of total South African exports [34]. Although South Africa is not a main trading partner of the UK, South Africa is the UK’s largest export and import market in Africa [35]. The most common destination for South African emigrants is the UK [36], where South Africans make up the seventh largest group of immigrants [37].

4.2. The Trend of Virulence Genes Indicated from Time Profiles

The time profiles of the pathogens are associated with the corresponding virulence genes. As shown in Figure 3, many genes in the US spike in 2011, fall from 2011–2013, then increase and stay relatively constant onwards. One example of this correlation is in the espX1 and sslE gene spike in 2011, as seen in Figure 3. This corresponded with an increase in the E. coli pathogen, shown in Figure 4, as both of the above genes are associated with virulence in E. coli. sslE is a zinc-metalloprotease involved in the degradation of mucin substrates, and an important colonization factor favoring E. coli access to both metabolic substrates and target cells [38]. espx1 is an effector protein injected into host cells, contributing to virulence of E. Coli [39].

4.3. Correlation between Virulence Genes and AMR Genes

Generally, virulence and AMR genes are distinctly separated in PCA and clustering for each country. The few overlap genes (both virulence and resistance) are mostly found in E. coli and Shigella. Firstly, these results suggest that these important pathogens (as identified in Table 3) are the main hosts for genes. It also implies that virulence genes and AMR genes evolved on their own time scales and therefore do not share many links with each other. Indeed, virulence genes have been around in pathogenic bacteria for millions of years, but antimicrobial resistance has only recently evolved (i.e., last 50 years) after the first usage of antibiotics [40]. On the other hand, certain interplays between virulence genes and AMR genes have also been found from the clustering branches containing both types of genes (listed in Table 4). Some of these interplays have been reported [40,41]. For example, AMR genes tet(A), sul1, sul2, mph(A), blaTEMp-1 were found in plasmid pRSB107 that also contains a virulence-associated system (e.g., an aerobactin iron acquisition siderophore system iucA) [40]. While certain interplays between virulence genes and AMR genes have been validated, the other overlapping genes (such as iss, sslE, and ybtP/Q) may have led, either as a direct precursor or potentially as a mutation point, to modern AMR genes. It is also possible that this correlation is coincidental, but because of the commonality of select shared genes in the five countries, it is more likely that there is an association between the virulence genes and resistance genes that were clustered into the same group.

4.4. Limitations and Future Work

In this study, a couple of limitations are related to uncontrollable factors in the NCBI Pathogen Detection Isolates Browser database. First, there is a large difference in samples isolated from each country. In particular, countries such as South Africa with a smaller number of samples from NPDIB may be less representative of their country’s actual trends of virulence genes or AMR genes. In addition, some countries do not have data from before 2012. Therefore, general conclusions cannot be extrapolated to years before this decade. Another limitation that cannot be overstated is the impact of SARS-CoV-2. Some data collection was likely cancelled or not made possible because of COVID-19 restrictions, so even with a normalized time profile, pathogen and gene prevalence from the year 2020 likely does not follow the historic ten-year trend from 2010.
There are several opportunities for further study. Since this work aims to identify the important virulence genes carried by pathogens, the matrix for PCA analysis was built by setting the genes in rows and the pathogens in columns. Thus, the hierarchical clustering mainly considers the genes’ presence. In addition to studying how genes were similar from how pathogens carried the genes, the impact of time was evaluated by plotting the time profiles of the important virulence genes. The genes were further compared across different countries to investigate the impact of the regions. All the genes studied in this work have been identified from genomic sequences in the NCBI Pathogen Detection Isolates Browser database. Analysis of the sequence data may reveal the correlation from other genes with these important virulence genes. This is an interesting research direction for further investigation. Moreover, analyzing other countries covering all six major land masses may provide a more complete picture of genes and pathogens globally. All these potential ideas for future work would benefit scientists in finding novel and particularized methods of treating pathogens.

5. Conclusions

Research on virulence genes is important as it is a potential avenue to develop new treatments for pathogens. In this work, statistical analysis methods such as PCA (principal component analysis) and hierarchical clustering were used to study the extensive data on virulence genes from the NCBI Pathogen Detection Isolates Browser. These methods, implemented through R, were able to identify important genes and pathogens mainly involved in virulence for Australia, China, South Africa, UK, and US. Significant genes that were common for all five countries included fdeC, iha, iss, IpfA, sslE, ybtP, ybtQ, and iutA; important pathogens that were common for every country except Australia included E. coli and Shigella, Salmonella enterica, and Klebsiella pneumoniae. These results were further studied through normalized time profiles, which plotted the portion of the above genes and pathogens in annual samples. Both the gene and pathogen profiles showed a generally increasing yet highly fluctuating trend for each studied country. Additionally, in each country’s pathogen profile, E. coli and Shigella and Salmonella enterica were consistently at high percentages, indicating they have a strong presence in virulence. The similarity analysis of the important virulence genes indicated that the US and the UK share the largest amount of important virulence genes and South Africa shares the least number of genes with the other countries. The correlation between virulence genes and AMR genes was studied by the PCA and clustering approach, along with the comparison of their time profiles. It turned out that the two gene types are mostly distinctly separated in the plot returned by PCA and hierarchical clustering. This may be due to vastly different evolution timescales. Occasionally, there are virulence genes that are strongly related to AMR genes possibly because both types are associated with survival in harmful conditions, so it is possible that certain virulence genes and AMR genes paired with each other in certain pathogens for the purpose of survival.

Author Contributions

The data was extracted and cleaned by Z.H. for analysis. Data analysis was performed by K.C., I.G., A.D., J.Y., M.W. under the guidance of Z.H. All authors contributed to the drafting and editing of the manuscript. All authors have read and agreed to the published version of the manuscript.

Funding

This research received no external funding.

Conflicts of Interest

The authors declare no conflict of interest.

Appendix A

Table A1. Important virulence genes (red) and AMR genes (blue) identified in each country. Both types of genes were determined using independent hierarchical clustering analyses.
AustraliaChinaSouth AfricaUKUS
airastAauto-satauto-satcif
astAauto-satcvaCespFeae
espX1capUfdeCespX1efa1
fdeCcvaCihaetpDehxA
hlyA-alphaeilAiroNfdeCespA
ibeAespX1issihaespB
ihafdeCiutAireAespF
ipaDihalpfAissespJ
ipaH1iroEmchFiutAespK
issiroNpapAlpfAespP
iucAisssenBlpfA1espX1
iutAiucAsslElpfA2etpD
lpfAiutAvactoxmchFfdeC
mchBlpfAybtPnleB2Iha
papEmchFybtQpiciss
papFpicaac(2′)-IcsepAiucA
papHsslEblaAsinHiutA
picybtPerm(37)sslEkatP
senBybtQfosXstxA1alpfA
sepAaadA2linstxA2clpfA1
sigAant(3″)-IIaaph(3″)-IbstxB1alpfA2
sinHaph(3″)-Ibaph(6)-IdstxB2anleA
sslEaph(3′)-IablaCTX-M-15stxB2cnleB
stxB2caph(6)-IdblaTEM-1virFnleB2
toxBarmAsul1ybtPnleC
tshblaECsul2ybtQsinH
virFblaKPC-2 aadA1sslE
ybtPblaOXA-23 aph(3″)-IbstxA1a
ybtQblaOXA-66 aph(6)-IdstxA2c
aadA1blaSHV-11 blaECstxB1a
aadA5blaTEM-1 blaOXA-1stxB2a
ant(3″)-IIadfrA12 blaTEM-1tccP
aph(3″)-IbfloR catA1tir
aph(3′)-IafosA dfrA1toxB
aph(6)-Idmcr-1.1 mph(A)ybtP
blaADC-30mph(A) sat2ybtQ
blaECmph(E) sul1aadA1
blaOXA-23msr(E) sul2aadA2
blaOXA-66oqxA tet(A)aadA5
blaTEM-1oqxB tet(B)aph(3″)-Ib
dfrA1 aph(3′)-Ia
dfrA17 aph(6)-Id
erm(B) blaCMY-2
mph(A) blaEC
sat2 blaOXA-1
sul1 blaTEM-1
sul2 catA1
tet(A) dfrA1
tet(B) dfrA17
erm(B)
floR
fosA7
mph(A)
sat2
sul1
sul2
tet(A)
tet(B)
Figure A1. The result from principal component analysis of virulence genes found in samples in the US from 2010–2020. The genes are shown in a PC1~PC2 space, with important genes clustered away from main groupings. While the genes are lumped together here, they can be distinguished, as shown in Figure 2.
Processes 08 01589 g0a1
Figure A2. A principal component analysis representation of the important virulence genes and AMR genes from historic samples of the US.
Processes 08 01589 g0a2

References

  1. Welch, M.D. Why should cell biologists study microbial pathogens? Mol. Biol. Cell 2015, 26, 4295–4301. [Google Scholar] [CrossRef]
  2. Malik, B.; Bhattacharyya, S. Antibiotic Drug-Resistance as a Complex System Driven by Socio-Economic Growth and Antibiotic Misuse. Sci. Rep. 2019, 9, 9788. [Google Scholar] [CrossRef]
  3. Pechere, J.C. Patients’ Interviews and Misuse of Antibiotics. Clin. Infect. Dis. 2001, 33, S170–S173. [Google Scholar] [CrossRef] [Green Version]
  4. Anthouard, R.; DiRita, V. Chemical Biology Applied to the Study of Bacterial Pathogens. Infect. Immun. 2014, 83, 456–469. [Google Scholar] [CrossRef] [Green Version]
  5. Totsika, M. Benefits and Challenges of Antivirulence Antimicrobials at the Dawn of the Post-Antibiotic Era. Drug Deliv. Lett. 2016, 6, 30–37. [Google Scholar] [CrossRef] [Green Version]
  6. Zhang, N.; Liu, E.; Tang, A.; Ye, M.C.; Wang, K.; Jia, Q.; Huang, Z.J. Data-Driven Analysis of Antimicrobial Resistance in Foodborne Pathogens from Six States within the US. Int. J. Environ. Res. Public Health 2019, 16, 1811. [Google Scholar] [CrossRef] [Green Version]
  7. Yang, K.; Wang, A.; Fu, M.; Wang, A.; Chen, K.; Jia, Q.; Huang, Z.J. Investigation of Incidents and Trends of Antimicrobial Resistance in Foodborne Pathogens in Eight Countries from Historical Sample Data. Int. J. Environ. Res. Public Health 2020, 17, 472. [Google Scholar] [CrossRef] [Green Version]
  8. Li, K.; Zheng, J.; Deng, T.; Peng, J.; Daniel, D.; Jia, Q.; Huang, Z.J. An Analysis of Antimicrobial Resistance of Clinical Pathogens from Historical Samples for Six Countries. Processes 2019, 7, 964. [Google Scholar] [CrossRef] [Green Version]
  9. Hua, M.; Huang, W.; Chen, A.; Rehmet, M.; Jin, C.; Huang, Z.J. Comparison of Antimicrobial Resistance Detected in Environmental and Clinical Isolates from Historical Data for the US. BioMed Res. Int. 2020, 2020, 1–11. [Google Scholar] [CrossRef]
  10. Lessa, F.; Mu, Y.; Bamberg, W.M.; Beldavs, Z.G.; Dumyati, G.; Dunn, J.R.; Farley, M.M.; Holzbauer, S.M.; Meek, J.I.; Phipps, E.C.; et al. Burden ofClostridium difficileInfection in the United States. N. Engl. J. Med. 2015, 372, 825–834. [Google Scholar] [CrossRef] [Green Version]
  11. Buroni, S.; Chiarelli, L.R. Antivirulence compounds: A future direction to overcome antibiotic resistance? Future Microbiol. 2020, 15, 299–301. [Google Scholar] [CrossRef] [PubMed]
  12. Qin, S.J. Statistical process monitoring: Basics and beyond. J. Chemom. 2003, 17, 480–502. [Google Scholar] [CrossRef]
  13. Kourti, T. Application of latent variable methods to process control and multivariate statistical process control in industry. Int. J. Adapt. Control Signal Process. 2005, 19, 213–246. [Google Scholar] [CrossRef]
  14. Arnau, V.; Mars, S.; Marín, I. Iterative Cluster Analysis of Protein Interaction Data. Bioinformatics 2004, 21, 364–378. [Google Scholar] [CrossRef] [Green Version]
  15. Wang, X.; Smith, K.; Hyndman, R. Characteristic-Based Clustering for Time Series Data. Data Min. Knowl. Discov. 2006, 13, 335–364. [Google Scholar] [CrossRef]
  16. Bar-Joseph, Z.; Demaine, E.D.; Gifford, D.K.; Srebro, N.; Foley, A.M.; Jaakkola, T.S. K-ary clustering with optimal leaf ordering for gene expression data. Bioinformatics 2003, 19, 1070–1078. [Google Scholar] [CrossRef] [Green Version]
  17. Ihaka, R.; Gentleman, R. R: A Language for data analysis and graphics. J. Comput. Graph. Stat. 1996, 5, 299–314. [Google Scholar]
  18. Thorndike, R.L. Who belongs in the family? Psychometrika 1953, 18, 267–276. [Google Scholar] [CrossRef]
  19. Easton, D.M.; Allsopp, L.P.; Phan, M.-D.; Moriel, D.G.; Goh, G.K.; Beatson, S.A.; Mahony, T.J.; Cobbold, R.N.; Schembri, M.A. The Intimin-Like Protein FdeC Is Regulated by H-NS and Temperature in Enterohemorrhagic Escherichia coli. Appl. Environ. Microbiol. 2014, 80, 7337–7347. [Google Scholar] [CrossRef] [Green Version]
  20. Léveillé, S.; Caza, M.; Johnson, J.R.; Clabots, C.; Sabri, M.; Dozois, C.M. Iha from an Escherichia coli Urinary Tract Infection Outbreak Clonal Group A Strain Is Expressed In Vivo in the Mouse Urinary Tract and Functions as a Catecholate Siderophore Receptor. Infect. Immun. 2006, 74, 3427–3436. [Google Scholar] [CrossRef] [Green Version]
  21. Torres, A.G.; Blanco, M.; Valenzuela, P.; Slater, T.M.; Patel, S.D.; Dahbi, G.; López, C.; Barriga, X.F.; Blanco, J.E.; Gomes, T.A.T.; et al. Genes Related to Long Polar Fimbriae of Pathogenic Escherichia coli Strains as Reliable Markers To Identify Virulent Isolates. J. Clin. Microbiol. 2009, 47, 2442–2451. [Google Scholar] [CrossRef] [Green Version]
  22. Suez, J.; Porwollik, S.; Dagan, A.; Marzel, A.; Schorr, Y.I.; Desai, P.T.; Agmon, V.; McClelland, M.; Rahav, G.; Gal-Mor, O. Virulence Gene Profiling and Pathogenicity Characterization of Non-Typhoidal Salmonella Accounted for Invasive Disease in Humans. PLoS ONE 2013, 8, e58449. [Google Scholar] [CrossRef] [Green Version]
  23. Landgraf, T.N.; Berlese, A.; Fernandes, F.F.; Milanezi, M.L.; Martinez, R.; Panunto-Castelo, A. The ferric aerobactin receptor IutA, a protein isolated on agarose column, is not essential for uropathogenic Escherichia coli infection. Revista Latino-Americana de Enfermagem 2012, 20, 340–345. [Google Scholar] [CrossRef]
  24. Koh, E.-I.; Hung, C.S.; Henderson, J.P. The Yersiniabactin-Associated ATP Binding Cassette Proteins YbtP and YbtQ Enhance Escherichia coli Fitness during High-Titer Cystitis. Infect. Immun. 2016, 84, 1312–1319. [Google Scholar] [CrossRef] [Green Version]
  25. Ling, J.; Pan, H.; Gao, Q.; Xiong, L.; Zhou, Y.; Zhang, D.; Gao, S.; Liu, X. Aerobactin Synthesis Genes iucA and iucC Contribute to the Pathogenicity of Avian Pathogenic Escherichia coli O2 Strain E058. PLoS ONE 2013, 8, e57794. [Google Scholar] [CrossRef]
  26. Guyer, D.M.; Radulovic, S.; Jones, F.-E.; Mobley, H.L.T. Sat, the Secreted Autotransporter Toxin of Uropathogenic Escherichia coli, Is a Vacuolating Cytotoxin for Bladder and Kidney Epithelial Cells. Infect. Immun. 2002, 70, 4539–4546. [Google Scholar] [CrossRef] [Green Version]
  27. Tobe, T.; Beatson, S.A.; Taniguchi, H.; Abe, H.; Bailey, C.M.; Fivian, A.; Younis, R.; Matthews, S.; Marches, O.; Frankel, G.; et al. An extensive repertoire of type III secretion effectors in Escherichia coli O157 and the role of lambdoid phages in their dissemination. Proc. Natl. Acad. Sci. USA 2006, 103, 14941–14946. [Google Scholar] [CrossRef] [Green Version]
  28. Azpiroz, M.F.; Rodrı́guez, E.; Laviña, M. The Structure, Function, and Origin of the Microcin H47 ATP-Binding Cassette Exporter Indicate Its Relatedness to That of Colicin V. Antimicrob. Agents Chemother. 2001, 45, 969–972. [Google Scholar] [CrossRef] [Green Version]
  29. Johnson, T.J.; Wannemuehler, Y.M.; Nolan, L.K. Evolution of the iss Gene in Escherichia coli. Appl. Environ. Microbiol. 2008, 74, 2360–2369. [Google Scholar] [CrossRef] [Green Version]
  30. DeCanio, M.S.; Landick, R.; Haft, R.J.F. The non-pathogenic Escherichia coli strain W secretes SslE via the virulence-associated type II secretion system beta. BMC Microbiol. 2013, 13, 1–9. [Google Scholar] [CrossRef] [Green Version]
  31. Australia’s Economic Relationships with China. Available online: https://www.aph.gov.au/about_parliament/parliamentary_departments/parliamentary_library/pubs/briefingbook44p/china (accessed on 23 August 2020).
  32. Cheng, M. We Depend So Much More on Chinese Travellers Now. That Makes the Impact of This Coronavirus Novel. Available online: https://theconversation.com/we-depend-so-much-more-on-chinese-travellers-now-that-makes-the-impact-of-this-coronavirus-novel-130798 (accessed on 23 August 2020).
  33. Migration, Australia, 2018–2019. Available online: https://www.abs.gov.au/ausstats/[email protected]/Latestproducts/3412.0Main%20Features32018-19?opendocument&tabname=Summary&prodno=3412.0&issue=2018-19&num=&view= (accessed on 23 August 2020).
  34. South African Foreign Trade in Figures. Available online: https://santandertrade.com/en/portal/analyse-markets/south-africa/foreign-trade-in-figures#:~:text=South%20Africa%27s%20top%20trading%20partners,largest%20trading%20partner%20in%20Africa (accessed on 23 August 2020).
  35. The Uk’s Trade and Investment Relationship with Africa: 2016. Available online: https://www.ons.gov.uk/economy/nationalaccounts/balanceofpayments/articles/theukstradeandinvestmentrelationshipwithafrica/2016 (accessed on 23 August 2020).
  36. Weimer, M.; Vines, A. Uk-South Africa Relations and the Bilateral Forum. Available online: https://www.chathamhouse.org/publications/papers/view/175839/19481_sa-uk_links.pdf (accessed on 23 August 2020).
  37. How Many South Africans Have Left the Country. Available online: https://www.politicsweb.co.za/news-and-analysis/how-many-south-africans-have-left-the-country (accessed on 23 August 2020).
  38. Valeri, M.; Paccani, S.R.; Kasendra, M.; Nesta, B.; Serino, L.; Pizza, M.; Soriani, M. Pathogenic E. coli Exploits SslE Mucinase Activity to Translocate through the Mucosal Barrier and Get Access to Host Cells. PLoS ONE 2015, 10, e0117486. [Google Scholar] [CrossRef] [Green Version]
  39. Reiland, H.A.; Omolo, M.A.; Johnson, T.J.; Baumler, D.J. A Survey of Escherichia coli O157:H7 Virulence Factors: The First 25 Years and 13 Genomes. Adv. Microbiol. 2014, 4, 390–423. [Google Scholar] [CrossRef] [Green Version]
  40. Beceiro, A.; Tomás, M.; Bou, G. Antimicrobial Resistance and Virulence: A Successful or Deleterious Association in the Bacterial World? Clin. Microbiol. Rev. 2013, 26, 185–230. [Google Scholar] [CrossRef] [PubMed] [Green Version]
  41. Geisinger, E.; Isberg, R.R. Interplay between Antibiotic Resistance and Virulence During Disease Promoted by Multidrug-Resistant Bacteria. J. Infect. Dis. 2017, 215, S9–S17. [Google Scholar] [CrossRef] [Green Version]
Figure 1. An illustrative example of using principal component analysis (PCA) and hierarchical clustering to identify important virulence genes: (A) a matrix was constructed with elements representing the number of the samples in which the gene in each row was detected in the pathogens in the columns; (B) genes from the high-dimensional matrix were projected onto the PC1~PC2 two-dimensional space; (C) the hierarchical clustering was used to group the data points on the basis of their projection onto the reduced dimensional space shown in (B); (D) the total within-cluster sum of square was calculated when the genes were grouped into one to six clusters (indicated by the dashed line in (C) in the dendrogram). A bend was observed when the genes were separated into three clusters, with F, ED, and ABC forming individual clusters, respectively. The clustering result was further confirmed by the genes’ projection on the PC1~PC2 space. While only six genes were used here for the purpose of illustration, a large number of genes with low occurrence patterns were typically lumped together such as genes A, B, and C in this work. The outlier genes such as genes F, E, and D were thus considered important genes.
Processes 08 01589 g001
Figure 2. The result of hierarchical clusters of virulence genes in the US. The blue line indicates how the six clusters were obtained. The two red rectangles highlight the clusters containing the outlier genes, which are typically the highest branches in the dendrogram and regarded as important virulence genes identified in the US.
Processes 08 01589 g002
Figure 3. Normalized time profile of important virulence genes in the US with generally increasing prevalence in historic samples from 2010–2020.
Processes 08 01589 g003
Figure 4. The normalized time profile of important pathogens in the US. Each colored line represents a different pathogen; generally, their trends flatline after 2016.
Processes 08 01589 g004
Figure 5. The result of hierarchical clustering of important virulence genes and antimicrobial resistance (AMR) genes in the US from samples between 2010 and 2020.
Processes 08 01589 g005
Figure 6. The historical profile of the important virulence and AMR overlap genes in the US in all samples collected from 2010–2020.
Processes 08 01589 g006
Figure 7. A comparison of the number of virulence genes and AMR genes found in individual samples from 2010–2020 in the US. Warmer colors represent higher frequencies of virulence/AMR occurrences, cooler colors represent lower frequencies.
Processes 08 01589 g007
Figure 8. The number of important virulence genes shared by different countries.
Processes 08 01589 g008
Table 1. The important virulence genes identified in the five countries. In red are the genes shared across each country, and in blue are the important genes identified in at least three different countries (note: underlined genes show generally increasing trend in their occurrence from 2010–2020).
AustraliaChinaSouth AfricaUKUS
airastAauto-satauto-satcif
astAauto-satcvaCespFeae
espX1capUfdeCespX1efa1
fdeCcvaCihaetpDehxA
hlyA-alphaeilAiroNfdeCespA
ibeAespX1issihaespB
ihafdeCiutAireAespF
ipaDihalpfAissespJ
ipaH1iroEmchFiutAespK
issiroNpapAlpfAespP
iucAisssenBlpfA1espX1
iutAiucAsslElpfA2etpD
lpfAiutAvactoxmchFfdeC
mchBlpfAybtPnleB2iha
papEmchFybtQpiciss
papFpic sepAiucA
papHsslE sinHiutA
picybtP sslEkatP
senBybtQ stxA1alpfA
sepA stxA2clpfA1
sigA stxB1alpfA2
sinH stxB2anleA
sslE stxB2cnleB
stxB2c virFnleB2
toxB ybtPnleC
tsh ybtQsinH
virF sslE
ybtP stxA1a
ybtQ stxA2c
stxB1a
stxB2a
tccP
tir
toxB
ybtP
ybtQ
Table 2. A summary of the important virulence genes shared among the five countries with information on gene function, and species of which the gene is found. Highlighted in red are the virulence genes identified in all countries, and in blue are the genes belonging to at least three different countries.
GeneFunctionSpecies
fdeCIntimin-like adhesin protein used to increase infectivity [19]E. coli
ihaAdhesin protein used to increase infectivity [20]E. coli
issIncreased serum survival used for extraintestinal infection [29]E. coli
iutAFerric (iron) aerobacter receptor used in colonization [23]E. coli
lpfALong polar fimbriae adhesive protein used to increase infectivity [21] E. coli, Salmonella enterica
sslEType II secretion system subunit used for biofilm promotion [30]E. coli
ybtPATP binding cassette (ABC) proteins used in iron(III)-yersiniabactin import and for survival [24]E. coli, Yersinia pestis
ybtQATP binding cassette (ABC) proteins used in iron(III)-yersiniabactin import and for survival [24]E. coli, Yersinia pestis
auto-satAutotransporter adenyltransferase cytotoxin in urinary tract infections [26]E. coli
espX1Type III secretion system subunit used for effector protein injection [27]E. coli
iucAAerobactin/siderophore synthesis used for iron uptake and colonization [25]E. coli, Klebsiella pneumoniae
mchFMicrocin H47 ABC exporter used for inhibitory activity [28]E. coli
sinHIntimin-type protein used for colonization and infectivity [22]Select Salmonella enterica serovars
Table 3. The important pathogens identified from PCA and hierarchical clustering in five countries. Identified in red are the important pathogens found in all countries but Australia.
AustraliaChinaSouth AfricaUKUS
Clostridium difficileCitrobacter freundiiE. coli & ShigellaClostridium difficileE. coli & Shigella
EnterobacterE. coli & ShigellaEnterobacterE. coli & ShigellaKlebsiella pneumoniae
Mycobacterium tuberculosisEnterobacterKlebsiella pneumoniaeKlebsiella oxytocaSalmonella enterica
Klebsiella oxytocaMycobacterium tuberculosisKlebsiella pneumoniae
Klebsiella pneumoniaeSalmonella entericaSalmonella enterica
Kluyvera intermedia
Salmonella enterica
Table 4. Virulence genes and AMR genes clustered in similar groups for each country, identified by hierarchical clustering (red—virulence genes; blue—AMR genes).
AustraliaChinaSouth AfricaUKUS
ihaespX1ybtPauto-satsinH
issfdeCybtQespFfloR
iucAissbla-TEM1ireAfosA7
senBlpfA mchF
sslEsslE pic
ybtPaph(3″)-Ib sepA
ybtQaph(6)-Id sslE
aph(3″)-IbdfrA12 stxA1a
aph(6)-IdfloR stxB1a
blaTEM-1mcr-1.1 stxB2a
sul1mph(A) stxB2c
sul2 ybtP
tet(A) ybtQ
blaOXA-1
catA1
mph(A)
Publisher’s Note: MDPI stays neutral with regard to jurisdictional claims in published maps and institutional affiliations.

