Community-Based Link-Addition Strategies for Mitigating Cascading Failures in Modern Power Systems


School of Electrical Engineering and Automation, Wuhan University, Wuhan 430072, China
*
Authors to whom correspondence should be addressed.
Processes 2020, 8(2), 126; https://0-doi-org.brum.beds.ac.uk/10.3390/pr8020126
Submission received: 9 December 2019
/
Revised: 16 January 2020
/
Accepted: 18 January 2020
/
Published: 21 January 2020
(This article belongs to the Special Issue Advances in Condition Monitoring, Optimization and Control for Complex Industrial Processes)
Abstract
:The propagation of cascading failures of modern power systems is mainly constrained by the network topology and system parameter. In order to alleviate the cascading failure impacts, it is necessary to adjust the original network topology considering the geographical factors, construction costs and requirements of engineering practice. Based on the complex network theory, the power system is modeled as a directed graph. The graph is divided into communities based on the Fast–Newman algorithm, where each community contains at least one generator node. Combined with the islanding characteristics and the node vulnerability, three low-degree-node-based link-addition strategies are proposed to optimize the original topology. A new evaluation index combining with the attack difficulty and the island ratio is proposed to measure the impacts on the network under sequential attacks. From the analysis of the experimental results of three attack scenarios, this study adopts the proposed strategies to enhance the network connectivity and improve the robustness to some extent. It is therefore helpful to guide the power system cascading failure mitigation strategies and network optimization planning.
1. Introduction
For smart grids, the advanced communication and information technology are employed to enhance the intelligence and automation of the power systems. Meanwhile, cyber threats are introduced to the physical systems triggering the self-organized criticality of the power system, leading to cascading failure propagation between networks even blackouts occurred [1,2,3]. As the scale of the smart grid expands, how to optimize the power system structure and effectively alleviate cascading failures has aroused public concern.
Modern power systems are dynamical systems featured by complexity and nonlinearity. For simplifying the model complexity, the complex network theory and the graph theory are introduced to demonstrate the network dynamics [4]. Besides, the characteristics of complex networks can be used to analyze the impacts on cascading propagation [5]. The larger the cluster coefficient (CC) of the network is, the wider the cascading failure propagation is. Moreover, the smaller the average path length (APL) of the network is, the deeper the cascading failure propagation is [6]. Statistics indicate that the power system is a typical sparse network owing to geographical location constraints and inadequate investment budgets [7]. As the power system expands, regional and long-distance power transmission lines are constructed to balance the regional generation capacity. With the increase in transmission lines, the APL increases slowly, while the regional CC is relatively large. Therefore, cascading failures can be easily propagated in large regions of the power system.
Previous studies have put forward the load-capacity model to analyze the cascading failure propagation. Cascading failure model of the power system based on the complex network theory combines with the characteristics of power flows [8]. System capacity and network connectivity affect the propagation of cascading failures [9]. An electrical path efficiency matrix is assisted with the assessment of power system influences and losses [10]. Based on the percolation theory [11], the remaining giant component indicates the robustness of the network. However, evaluation indexes of the existing studies are used to assess the connected component performance, which cannot be implemented for isolated islands. The power system can maintain islanding operations after attacks. Thus, the robustness index of the power system should contain all survival islands.
Additionally, relevant research focused on the mechanism of cascading failures. In the power system, cascading failure can be triggered by means of physical equipment malfunction or misoperation owing to weather or man-made, and intentional cyber-attacks. Power node or link failure caused by system hidden failures as well as large area blackouts caused by natural disasters exhibit random attacks (RA) to the power system. Adversaries can also attack specific targets. For example, high degree node attacks (HDNA) disconnect the highly connected substation to destroy the network connectivity. Moreover, cyber-attacks compromise communication data to control the power system operations, which can construct not only simultaneous attacks but also sequential attacks [12]. For example, a large area of new energy resources simultaneously disconnects from the backbone network, or some special targets are sequentially compromised by coordinated strategies. The current research indicates that vulnerability sequence attack (VSA) damages the network more seriously than simultaneous attacks [13], because VSA can collapse the whole network by attacking fewer nodes. The evolution of both logical and real values of system parameters can be analyzed by a hybrid attack graph under attack and recovery actions scenarios [14]. As simultaneous attacks and sequential attacks have diverse impacts on power systems, it is necessary to investigate the cascading failure propagation of multiple attack scenarios by using proper evaluation indexes.
However, vulnerability of topology is affected by the transmission efficiency, connectivity, and connected components [15], particularly the power flow distribution of power systems [16]. The topology of the power system is relatively inflexible and vulnerable to intentional attacks [17]. Diverse fault diagnosis technologies have applied to monitor, locate, and identify the faults, which need to handle a large amount of data and operate system resources [2,3]. The effective control chart technique could substantially decrease the loss caused by the diagnosis and correction [18]. Optimal nonlinear adaptive control reduced uncertainties and improved the robustness under different operation scenarios [19]. In order to decrease the network vulnerability, the network structure can be optimized by link-addition strategies to mitigate cascading failures [20]. Existing research proposes interlink addition strategy to increase connectivity density, in order to reduce cascade-safe region and improve the network connectivity [21]. For improving the network robustness, connectivity links and interlinks could be added simultaneously [22], while the construction costs are too high to realize [23]. Ji et al. [24] compared with various connectivity link addition strategies, for the purpose of verifying the feasibility of low-degree node link-addition strategy and improving the power network robustness. However, these link-addition strategies have focused on the pure topology evolution evaluating by using degree or betweenness indexes, without considering special characteristics of power systems.
Since the power system is managed in regions, isolated islands can maintain in operation. The Fast–Newman algorithm is introduced to divide the network topology into communities, thereby ensuring that the network can be effectively partitioned [25]. In power systems, the location of generators is the key factor for a valid community [8]. Besides, the load distribution has influences on the power generation dispatch and control strategy [26]. For providing sufficient power supply, the power system can be partitioned into communities following the power flow directions. Moreover, critical regions greatly affect the topology evolution, and the community partition of these regions seriously influences on the network vulnerability [27]. To achieve the reliability and preventive maintenance is another optimization goal [28]. Therefore, the community-based link-addition strategy is proposed to optimize the existing power network topology, in order to reduce investment budgets and alleviate the burden of load centers.
In summary, present researches have confirmed that the power system is affected by the community structure, but less attention is paid to the optimal community structure on mitigating cascading failure propagation. In order to address this issue, we propose an improved load-capacity model based on the islanding power flow distribution, in terms of the complex system and percolation theory. The island ratio is a measure of the robustness of power networks. For further demonstrating the difficulty of attacks, an evaluation indicator is introduced to assess the influence of the sequential attack. In order to optimize the original power system, three community-based link-addition strategies between low-degree nodes are therefore proposed to meet the requirements of engineering practice. This paper is of practical significance in how to optimize network topology and improve the network robustness of the power system.
The reminder of the paper is organized as follows. Section 2 presents the fundamental theoretical background on constructing a load-capacity model. Section 3 discusses the evaluation index. Section 4 describes the process of constructing link-addition strategy. Section 5 provides the simulation results and the corresponding analysis. Section 6 summarizes several concluding remarks and discusses the challenging issue. Lack of the period.
2. System Model
Based on the complex network theory, the power system is modeled as a directed graph , with nodes and without multiple edges or loops, where and are power nodes and lines, respectively. The power nodes are categorized as three types: generator nodes that generate electricity, load nodes that consume electricity, and substation nodes that transfer electricity. Particularly, one generator node carrying loads can be classified into the load node. The power lines are directed by the power flow changes over time. In order to decrease calculation complexity, this study ignores the differences in transmission lines, the transient voltage instability and phase angle mismatch. In this graph, the nodes and lines can be removed as a result of failures or attacks. It is assumed that the adversaries can manipulate the systematic information to construct malicious attacks of any target of the system.
In the power system, the real and reactive power injections are balanced at every node, as indicated in Equations (1) and (2). Moreover, the real and reactive power flows in transmission lines by following Kirchhoff’s law, as expressed in Equations (3) and (4) [29].
Real and reactive power injection at node :
Real and reactive power flows from node to node are:
where is the real power injection at the power node , the reactive injection at the power nod , the real power flow from node to node , the reactive power flow from node to node , the voltage magnitude, the difference in the phase angle between power nodes and node , the admittance, the susceptance, and the initial number of nodes, .
According to the power flow distribution, the power system capacity is assumed to be proportional to its initial states [30]. It is assumed that the power system is provided with moderately reactive power to compensate losses and avoid out-of-limit at the same voltage grade. The initial power flow capacity is the maximum power flow in transmission lines of Equation (5). The initial generation capacity is the maximum output of generators of Equation (6). The initial node capacity is the maximum sum of out flows and local loads of node of Equation (7).
So, the system capacity is times the initial states.
where is the tolerance parameter, . In the model, the tolerance parameter is a consistent one. It is assumed that the power system adopts the overcurrent protection mechanism. For simplicity, if the power flow exceeds the system capacity, the transmission lines trip off instantly without further automatic reclose.
3. Evaluation Index
(1) Cluster coefficient
CC indicates the network connectivity level between nodes and their neighboring nodes [31]. Assume that node has a number of links and neighbors, while the maximum number links of these neighboring nodes is . The CC of node is shown as follows.
Then, global CC of the network equals to the mean value of the local CC of all nodes
(2) Average path length
APL is a measure of network efficiency. Dijkstra algorithm [32] is used to find the shortest path from the source node to the destination node , then the average distance between two nodes is shown as follows.
In this study, is assumed to be the distance cost of one new connectivity link, which indicates the difficulty of adding one new link from one source node to the other destination node.
(3) Node vulnerability
Based on the percolation theory, nodes are functional only in a giant component, which is a maximal connected component of the graph. The number of nodes that belong to giant components owing to one node removal indicates the node vulnerability. In one network, although a number of nodes have the same vulnerability, node removal contributes various influences on the remained components. In literature [4], the node types and their locations are combined to further distinguish the most vulnerable node. If the nodes are in separate single loops, the node in the bigger single loop is more important than that of the smaller one. Since a line-shaped branch is generated after unlocking the single loop, the longer the branch, the more the loss of nodes. If the nodes are in the same single loop or in different single loops of the same size, further investigation is required until the most critical node is located.
where is the node number of the remaining giant component, the set of nodes with the same vulnerability, the single loop where node locates, and stands for the length of the single loop, .
After part of nodes are removed from the network in a random or targeted manner, the remaining giant component ratio is used to estimate the network robustness [33]. However, the power system can maintain in islanding operations. Thus, the island ratio is the proportion of all survival isolated components of the power system.
where is the node number of one survival island, and is the number of islands.
For assessing the influence of the network under sequential attacks, an evaluation indicator is introduced to combine with the difficulty of attacks and the survivability of the network.
where is the number of sequential attacks, and is a scalar without units.
4. Link-Addition Strategy
4.1. Fast–Newman Algorithm for Community Partition
According to the power system management, each community has at least one generator node to supply sufficient electricity, or it will fail to partition. The directed power system graph detects the valid community modularity by using the Fast–Newman algorithm [25].
where is the link number, the sum of degrees of the network, the adjacent matrix, the degree of a node, and the function for judging the community of two nodes. If they are in the same community, it is 1, otherwise 0. The modularity ranges from , the greater the modularity, the better the effect of community partition. Statistics show that when is between 0.3 and 0.7, communities will cluster effectively [34].
4.2. Low-Degree-Node-Based Link-Addition Strategy
One-degree node (leaf node) of the power system is easily removed, owing to its overloaded transmission line or neighboring node removal that suffers from disturbances or attacks. Through the addition of new links to the leaf nodes, the connectivity level of the network can be increased. This is because the removal of tree-shaped root nodes can cause a large area to be disconnected from the core component, and the leaf nodes of the most vulnerable nodes are critical for optimizing the power system topology. However, some leaf nodes are generator nodes, so it is unreasonable to connect two generators except one generator node carrying a heavy load. The newly added links cannot overlap the original links. Moreover, the new network has to ensure that each community has at least one generator node. In conclusion, three link-addition strategies are proposed to enhance the original network connectivity and decrease the vulnerability.
(1) Low-degree-node link-addition strategy (LDNLAS)
The strategy aims to optimize long-distance transmission line construction for solving the long-distance electricity transmission of the large scale power systems. Based on the community partition and node vulnerability of the original power system, the new links from one community to other communities satisfy the average shortest path. If the most vulnerable node has leaf nodes, new links are first added from them.
where is an additional link, the low-degree nodes, the leaf nodes, and the set of low-degree nodes that satisfy the average shortest path .
(2) Nearest-neighboring-node link-addition strategy (NNNLAS)
The strategy aims to connect the nearest nodes to enhance the local network connectivity and density. Based on breadth-first search algorithm, the new links find the shortest distance between neighboring nodes. If new links have the same shortest distance, those who have the average shortest path will satisfy the requirement.
where is an additional link, the leaf nodes, the neighbor of leaf nodes that satisfy the shortest path , and the set of neighboring nodes.
(3) Max-load-node link-addition strategy (MLNLAS)
The strategy aims to alleviate the heavy burden of load centers and balance electricity supply capacity. Combined with the community partition, the load centers get new electricity supply with other generator by new links. Moreover, the new links satisfy the average shortest path. If the leaf nodes are not generators, the new links will follow the LDNLAS.
where is an additional link, the leaf nodes, the heavy load node, and the set of heavy load nodes in order.
5. Simulation Results and Data Analysis
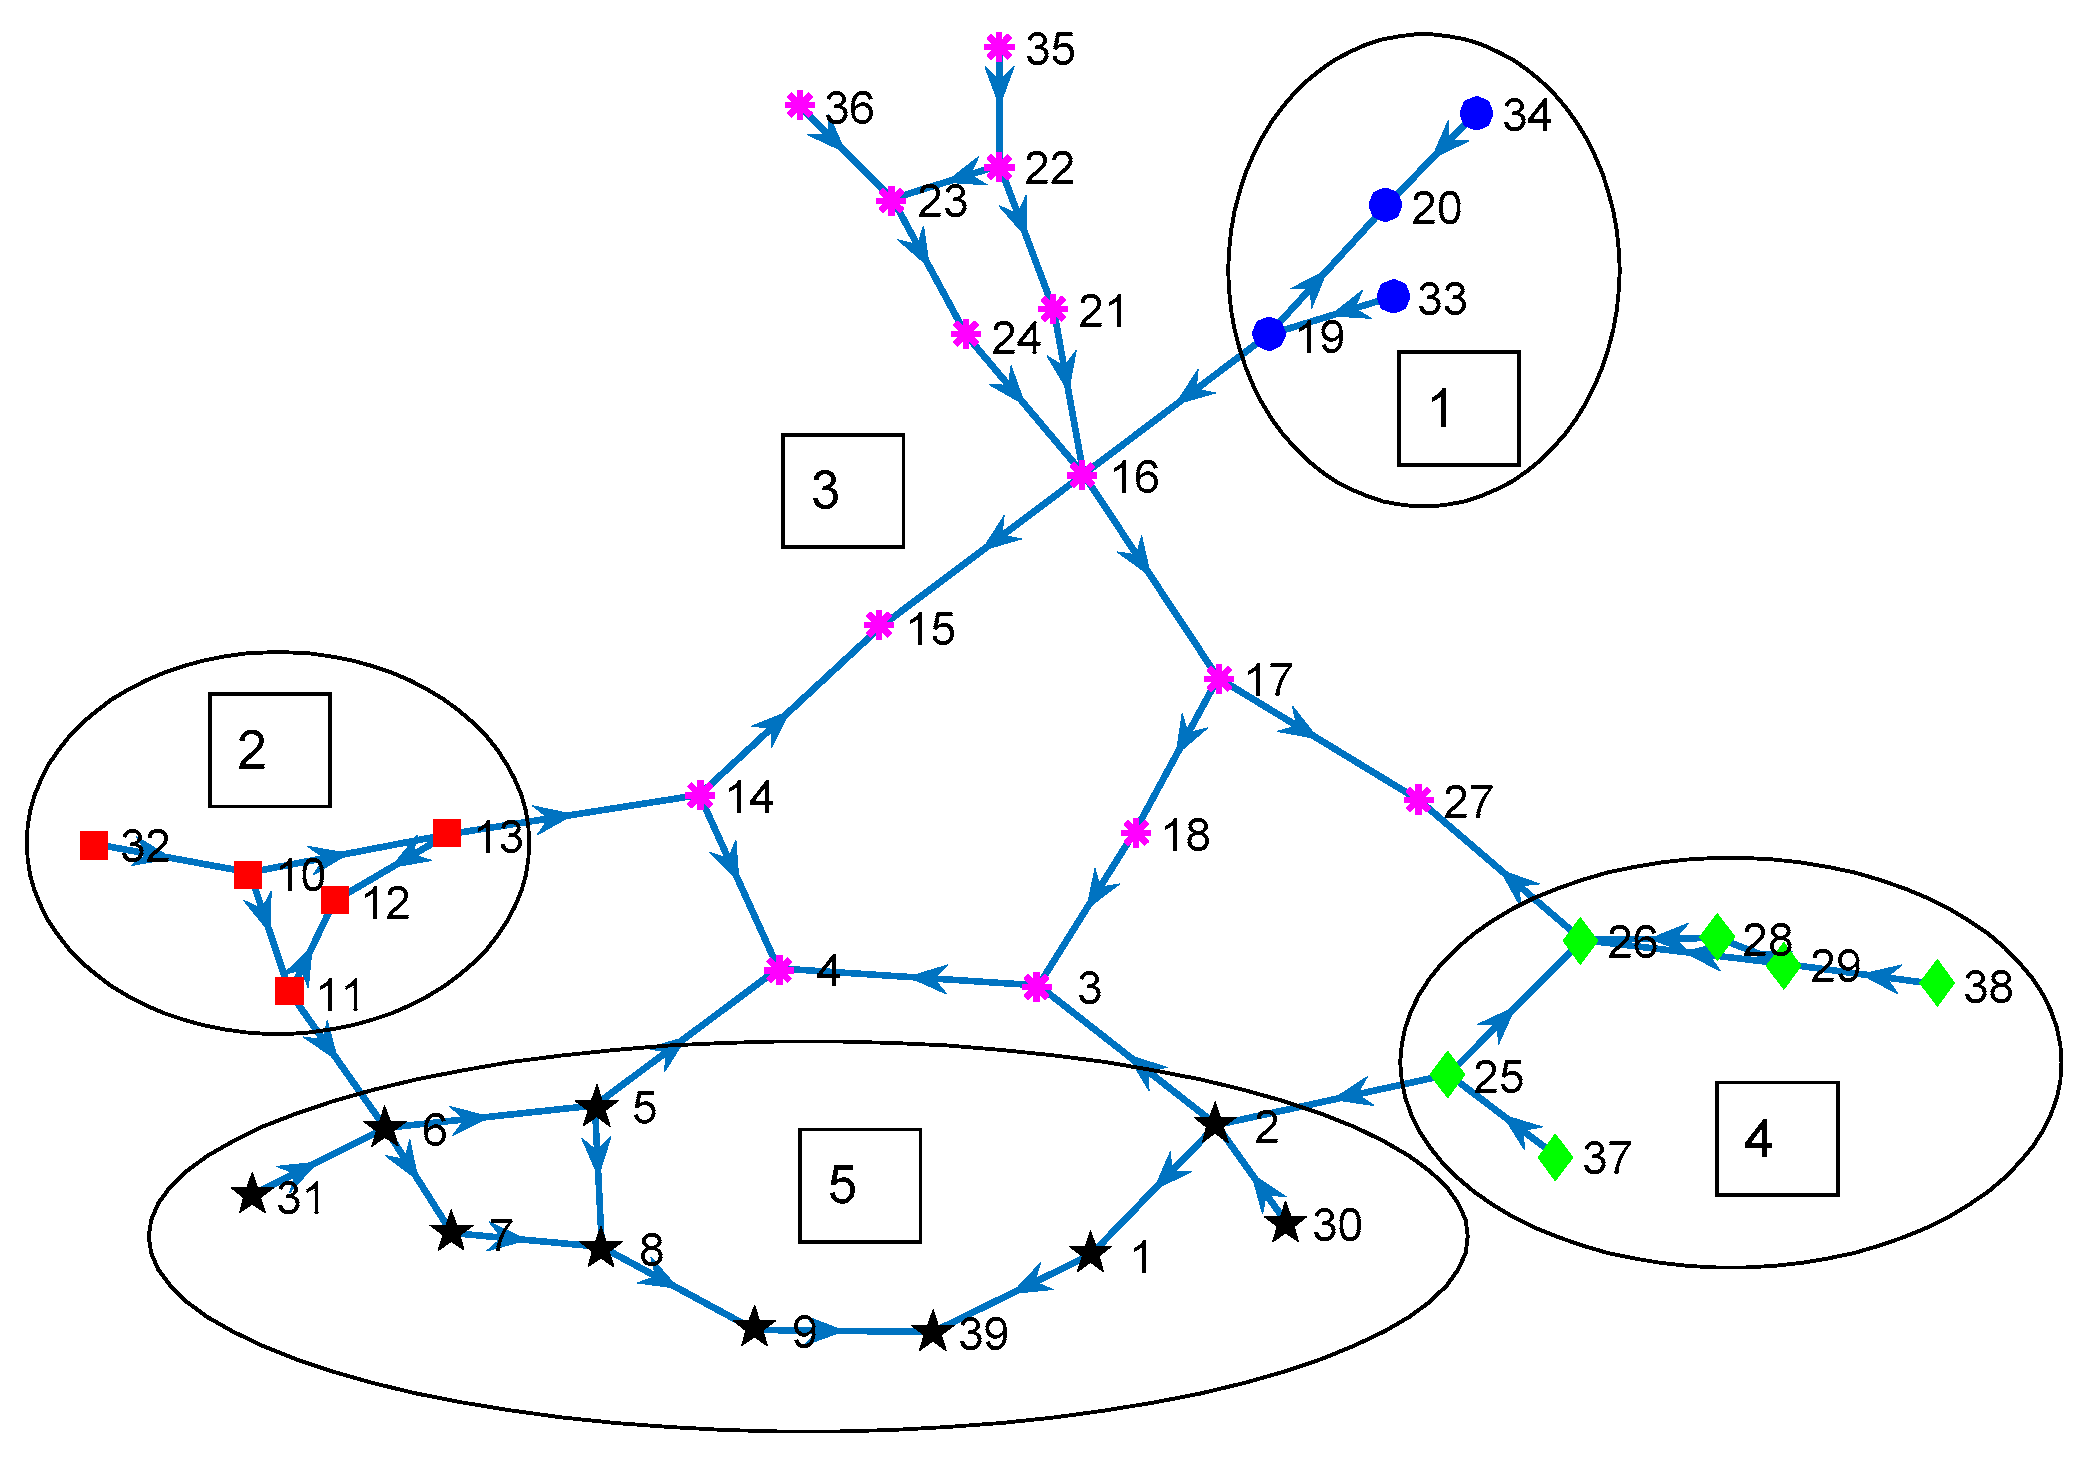
In this section, the present study experiments with the data of IEEE 39-bus power system and establishes the simulation results in detail. The power flow calculation and the isolated island problems are solved using the MATPOWER 6.0 toolkit in MATLAB R2016a [35]. Based on the graph theory, the directed graph gets the average degree , cluster coefficient , and average path length , while the random network with the same , and . The graph includes generator nodes ranging from 30 to 39, and it is partitioned into 5 communities according to the Fast–Newman algorithm. The modularity is , which indicates good community partition of this graph. Each community contains at least one generator node, which is shown as follows.
In Figure 1, communities are labelled by numbers and surrounded by an ellipse. Community 1 is the area of blue solid circles, community 2 the area of red squares, community 3 the area of magenta snowflakes, community 4 the area of green rhombuses, and community 5 the area of black stars.
5.1. Generating Network
According to the principle of link-addition strategies, IEEE 39-bus system has 9 one-degree nodes ranging from node 30 to node 38. These leaf nodes without heavy loads are unnecessary to connect to each other, because they are all generator nodes. Therefore, the network has to add 9 additional links to get .
(1) LDNLAS Network
From Figure 1, the node importance of the original network is obtained to find the most vulnerable node 16 and 2 leaf nodes based on the Equation (9) in the same community. The low-degree nodes are randomly chosen to connect with these leaf nodes to find the average shortest path length. Following the rule, 9 links are added to the original network. In each step, the network can be partitioned into valid communities. The total cost of additional links is 53. See Table 1 for details.
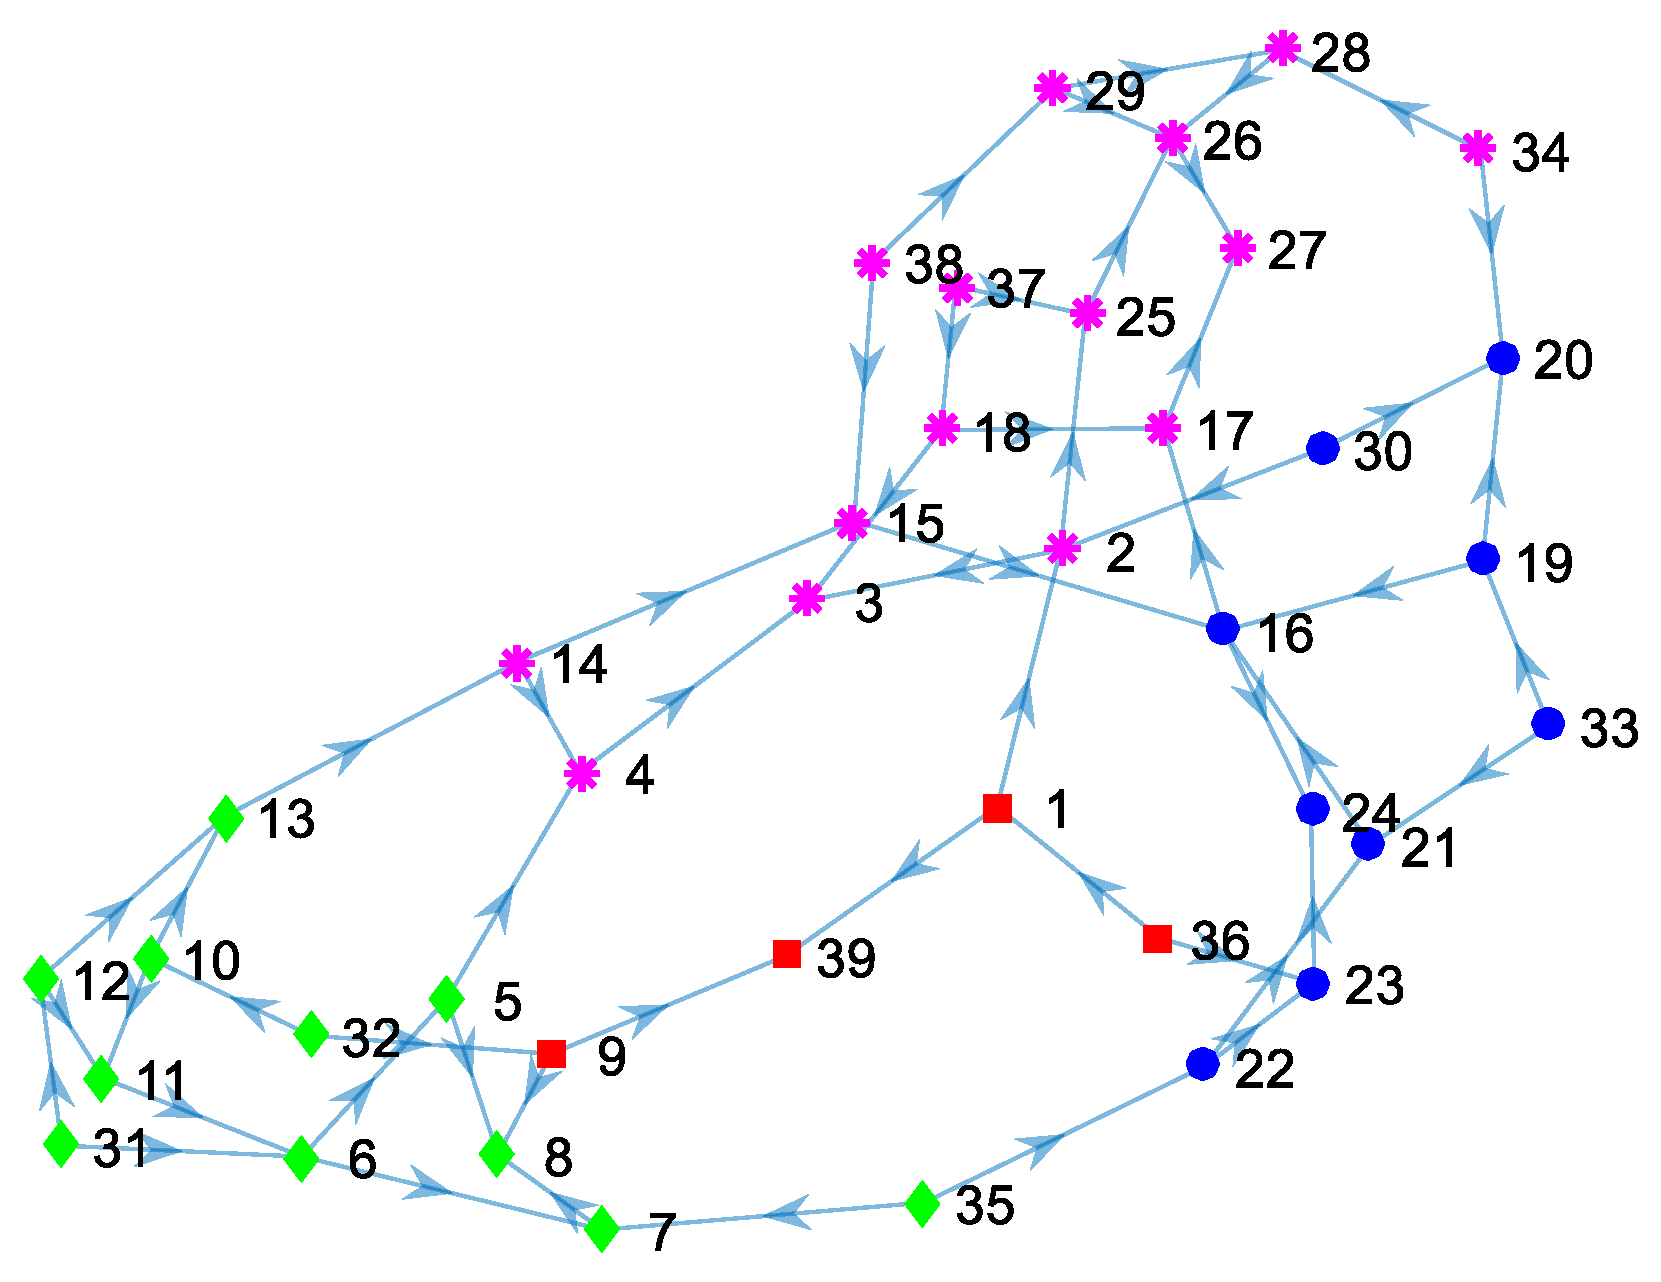
The LDNLAS network detects 4 communities in Figure 2. Community 1 with 9 nodes is the area of blue solid circles, community 2 with 4 nodes is the area of red squares, community 3 with 15 nodes is the area of magenta snowflakes, and community 4 with 11 nodes is the area of green rhombuses.
The modularity of the LDNLAS network is , which indicates the community partition is effective. is less than that of the original network, and is reduced to about 19%. Although the LDNLAS network reduces the aggregation degree than that of the original network, it improves the connectivity obviously.
(2) NNNLAS Network
Firstly, the neighbors of the leaf nodes are found. Owing to the symmetrical structure, several leaf nodes have the same shortest distance to their neighbors. The total cost of additional links is 22. See Table 2 for details.
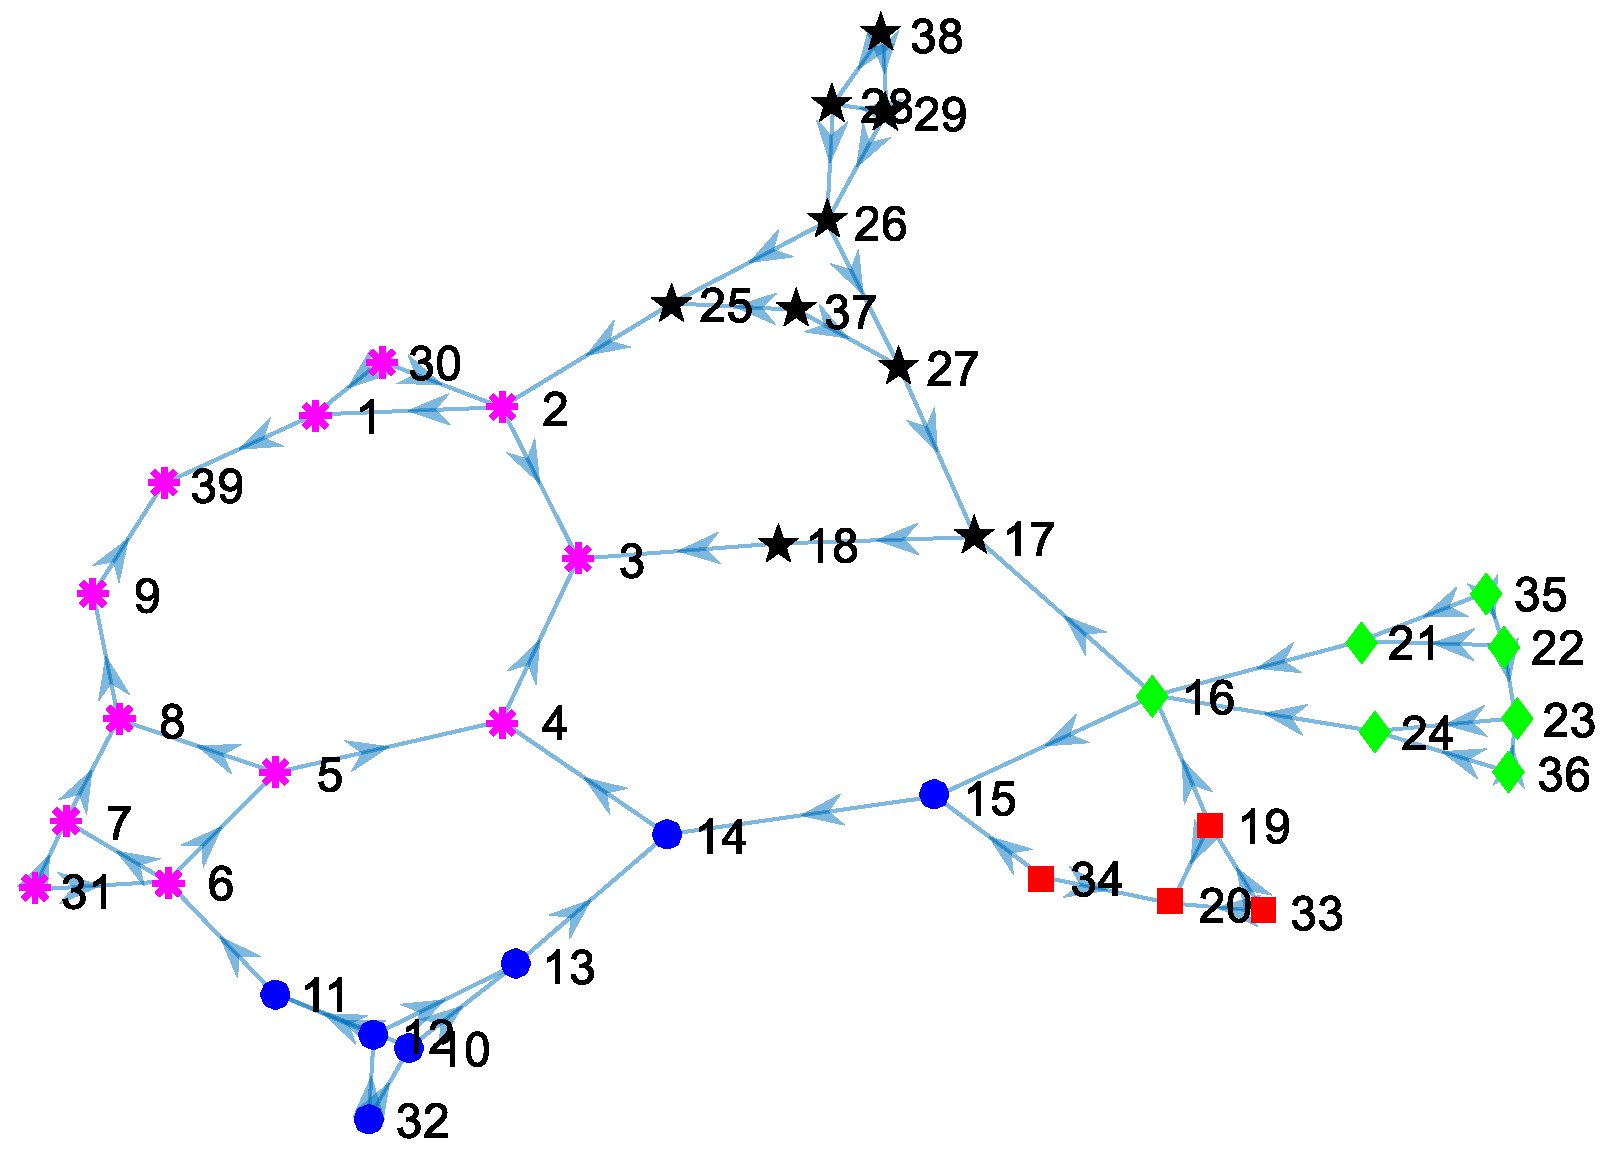
In Figure 3, the NNNLAS network detects 5 communities. Community 1 with 7 nodes is the area of blue solid circles, community 2 with 4 nodes is the area of red squares, community 3 with 12 nodes is the area of magenta snowflakes, community 4 with 7 nodes is the area of green rhombuses, and community 5 with 9 nodes is the area of black stars.
The modularity of the NNNLAS network is , which indicates the community partition is highly effective. is 7 times the original network, and is reduced to about 5%. Although the NNNLAS network enhances the aggregation degree enormously than that of the original network, it increases the connectivity level slightly.
(3) MLNLAS Network
First, the loads of the original network are ordered to select the first 9 load nodes. Then, new links are randomly added to the leaf nodes to satisfy the community partition principle and the average shortest path length. The total cost of additional links is 58. See Table 3 for details.
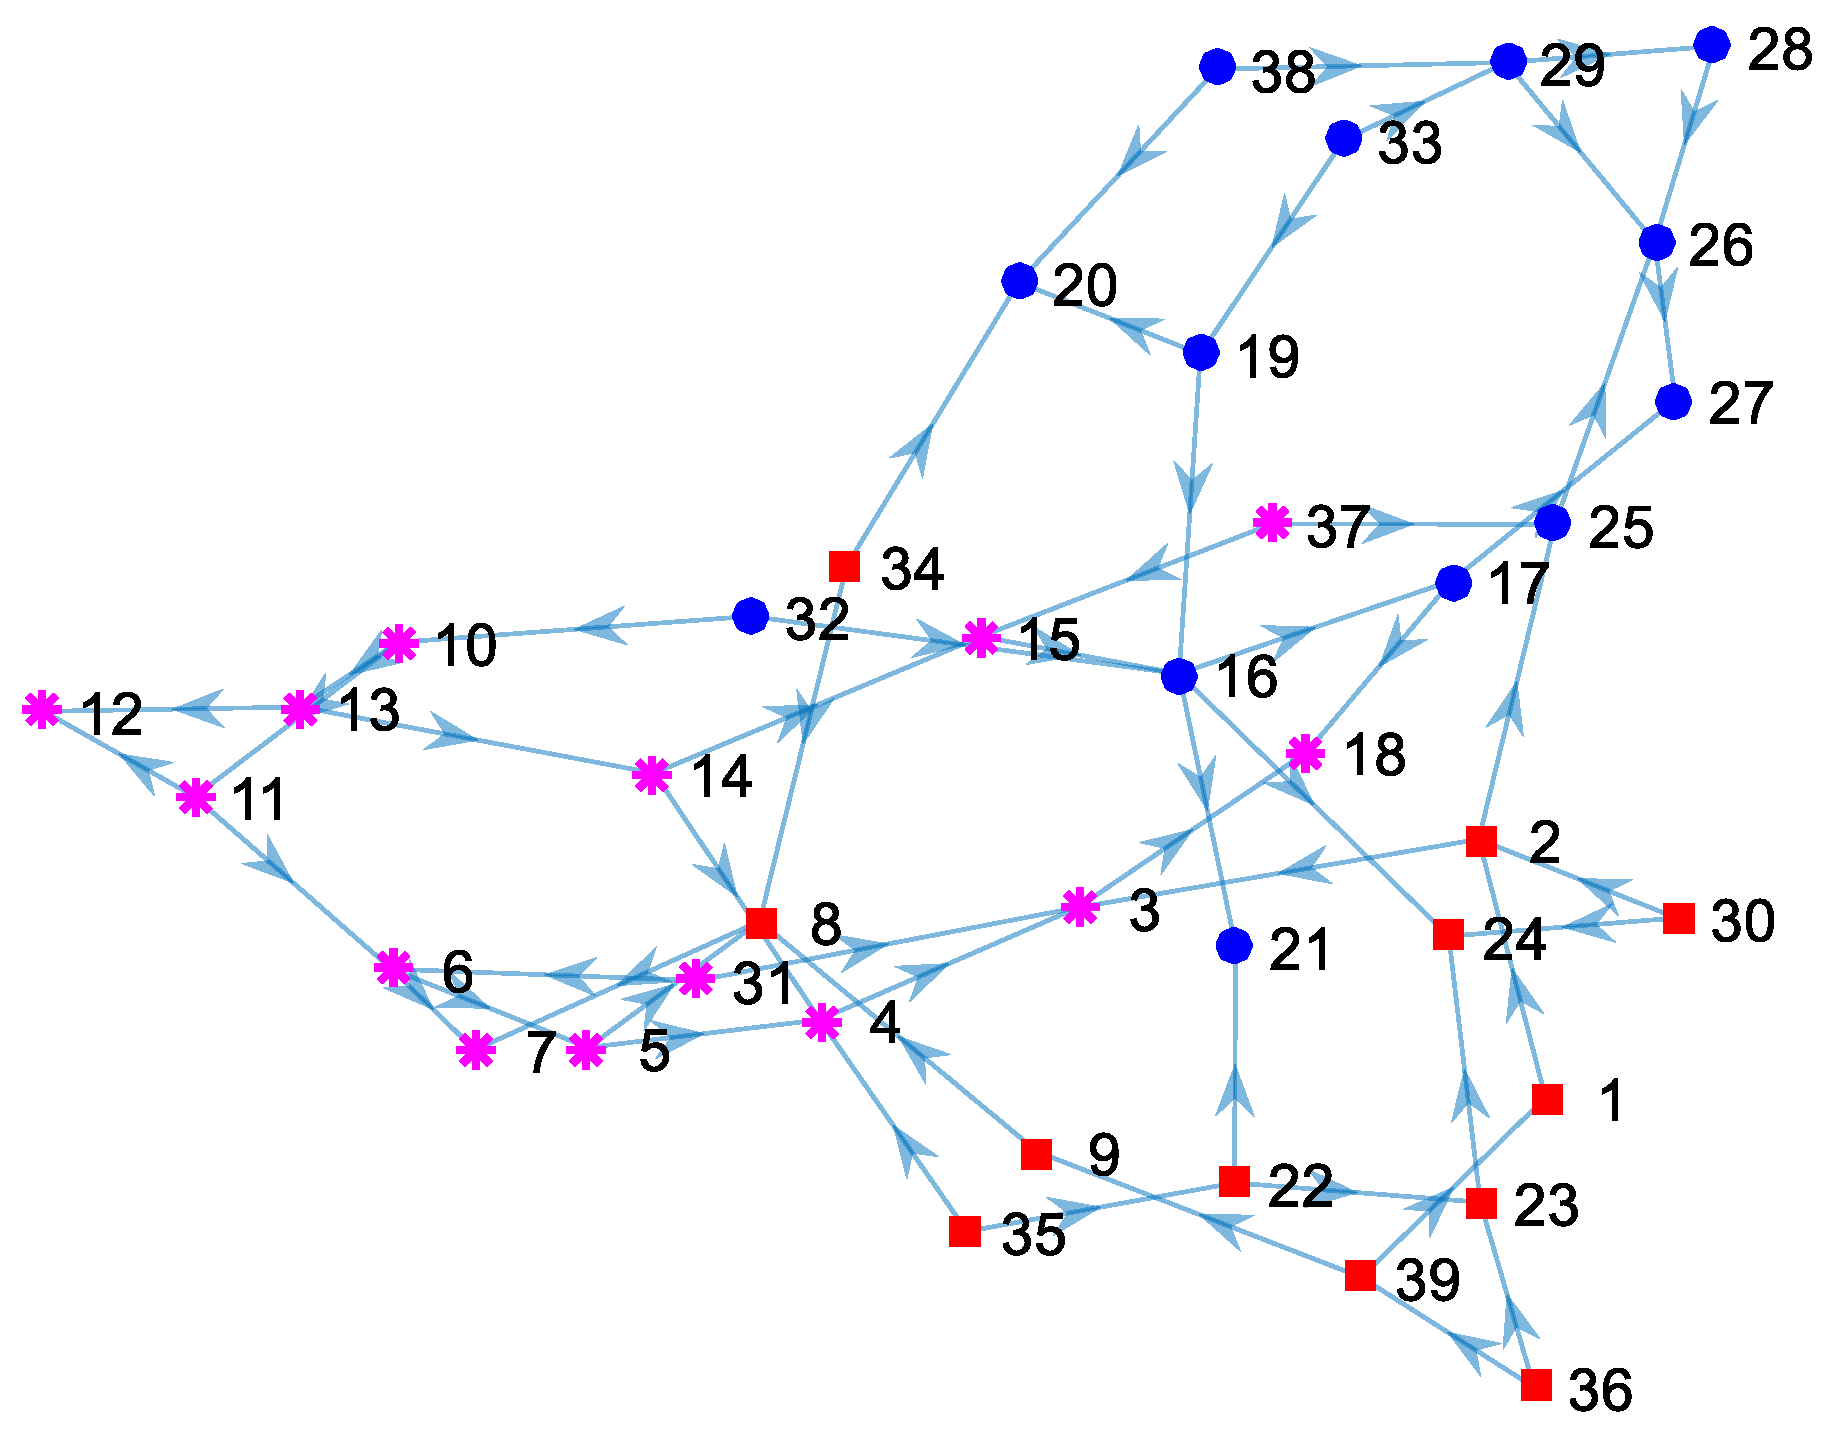
The MLNLAS network detects 3 communities in Figure 4. Community 1 with 13 nodes is the area of blue solid circles, community 2 with 12 nodes is the area of red squares, and community 3 with 14 nodes is the area of magenta snowflakes.
The modularity of the MLNLAS network is , which indicates the community partition is reasonable. is close to that of the original network, and is reduced to about 25%. Although the MLNLAS network decreases the aggregation degree than that of the original network, it increases effectively the connectivity level.
Three networks of the same additional links decrease the APL and increase the connectivity than that of the original network. NNNLAS network significantly improves the aggregation degree at the lowest cost; LDNLAS network effectively increases the connectivity with a higher cost than that of NNNLAS network; MLNLAS network dramatically improves the connectivity and alleviates the burdens of load centers, while the cost is the highest one of three strategies, and the community partition and aggregation degree are relatively weak.
5.2. Network Robustness Analysis
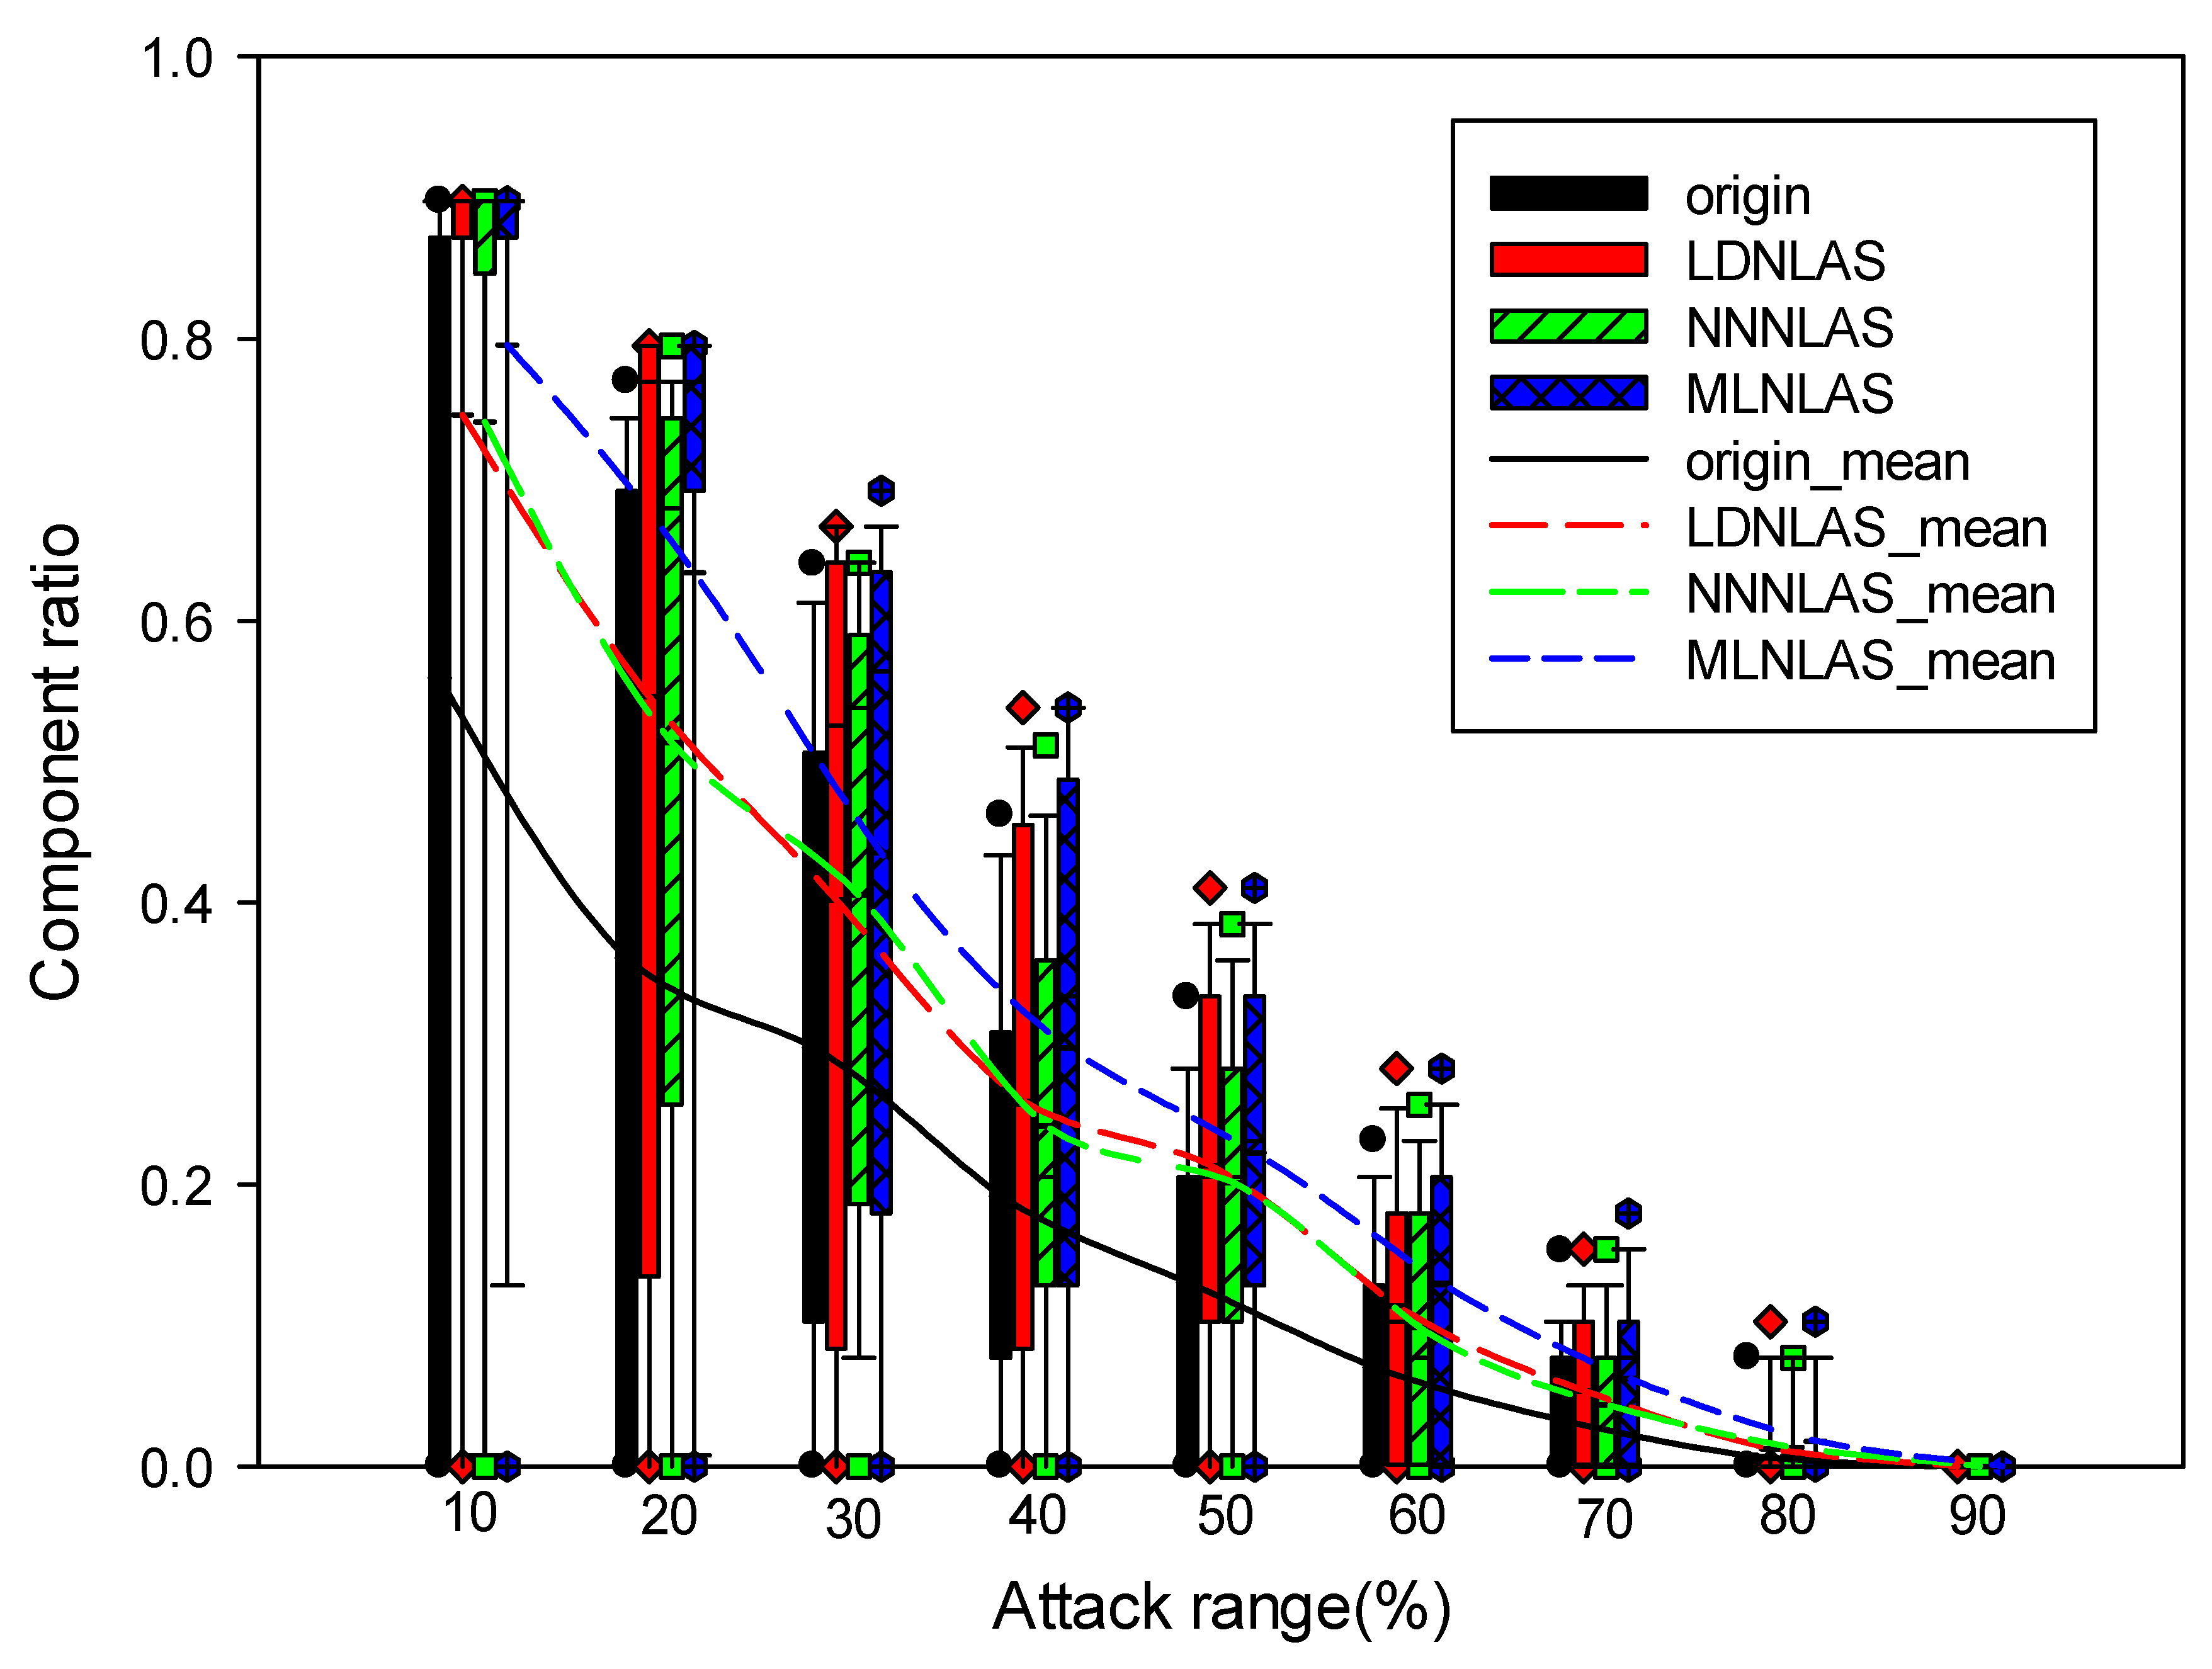
The robustness of networks is analyzed under three attack scenarios. Random node attacks and high-degree-node-based attacks are regarded as simultaneous attacks, while vulnerability-based attacks are sequential attacks. For reducing the influence of network capacity, this study assumes the universal system tolerance parameter . Under the simultaneous attack scenarios, the component ratios are graphed with the distribution interval, median, 5%–95% position and mean at various attack ranges. Under the sequential attack scenarios, the component ratio curves are plotted by the number of attacks, and all remaining survival islands are demonstrated as directed graphs.
(1) RA Scenario
Random attack groups are , according to the attack ranges respectively. In one attack range, 1000 groups of data are selected to attack 4 networks, which is executed for 50 times to obtain the corresponding results.
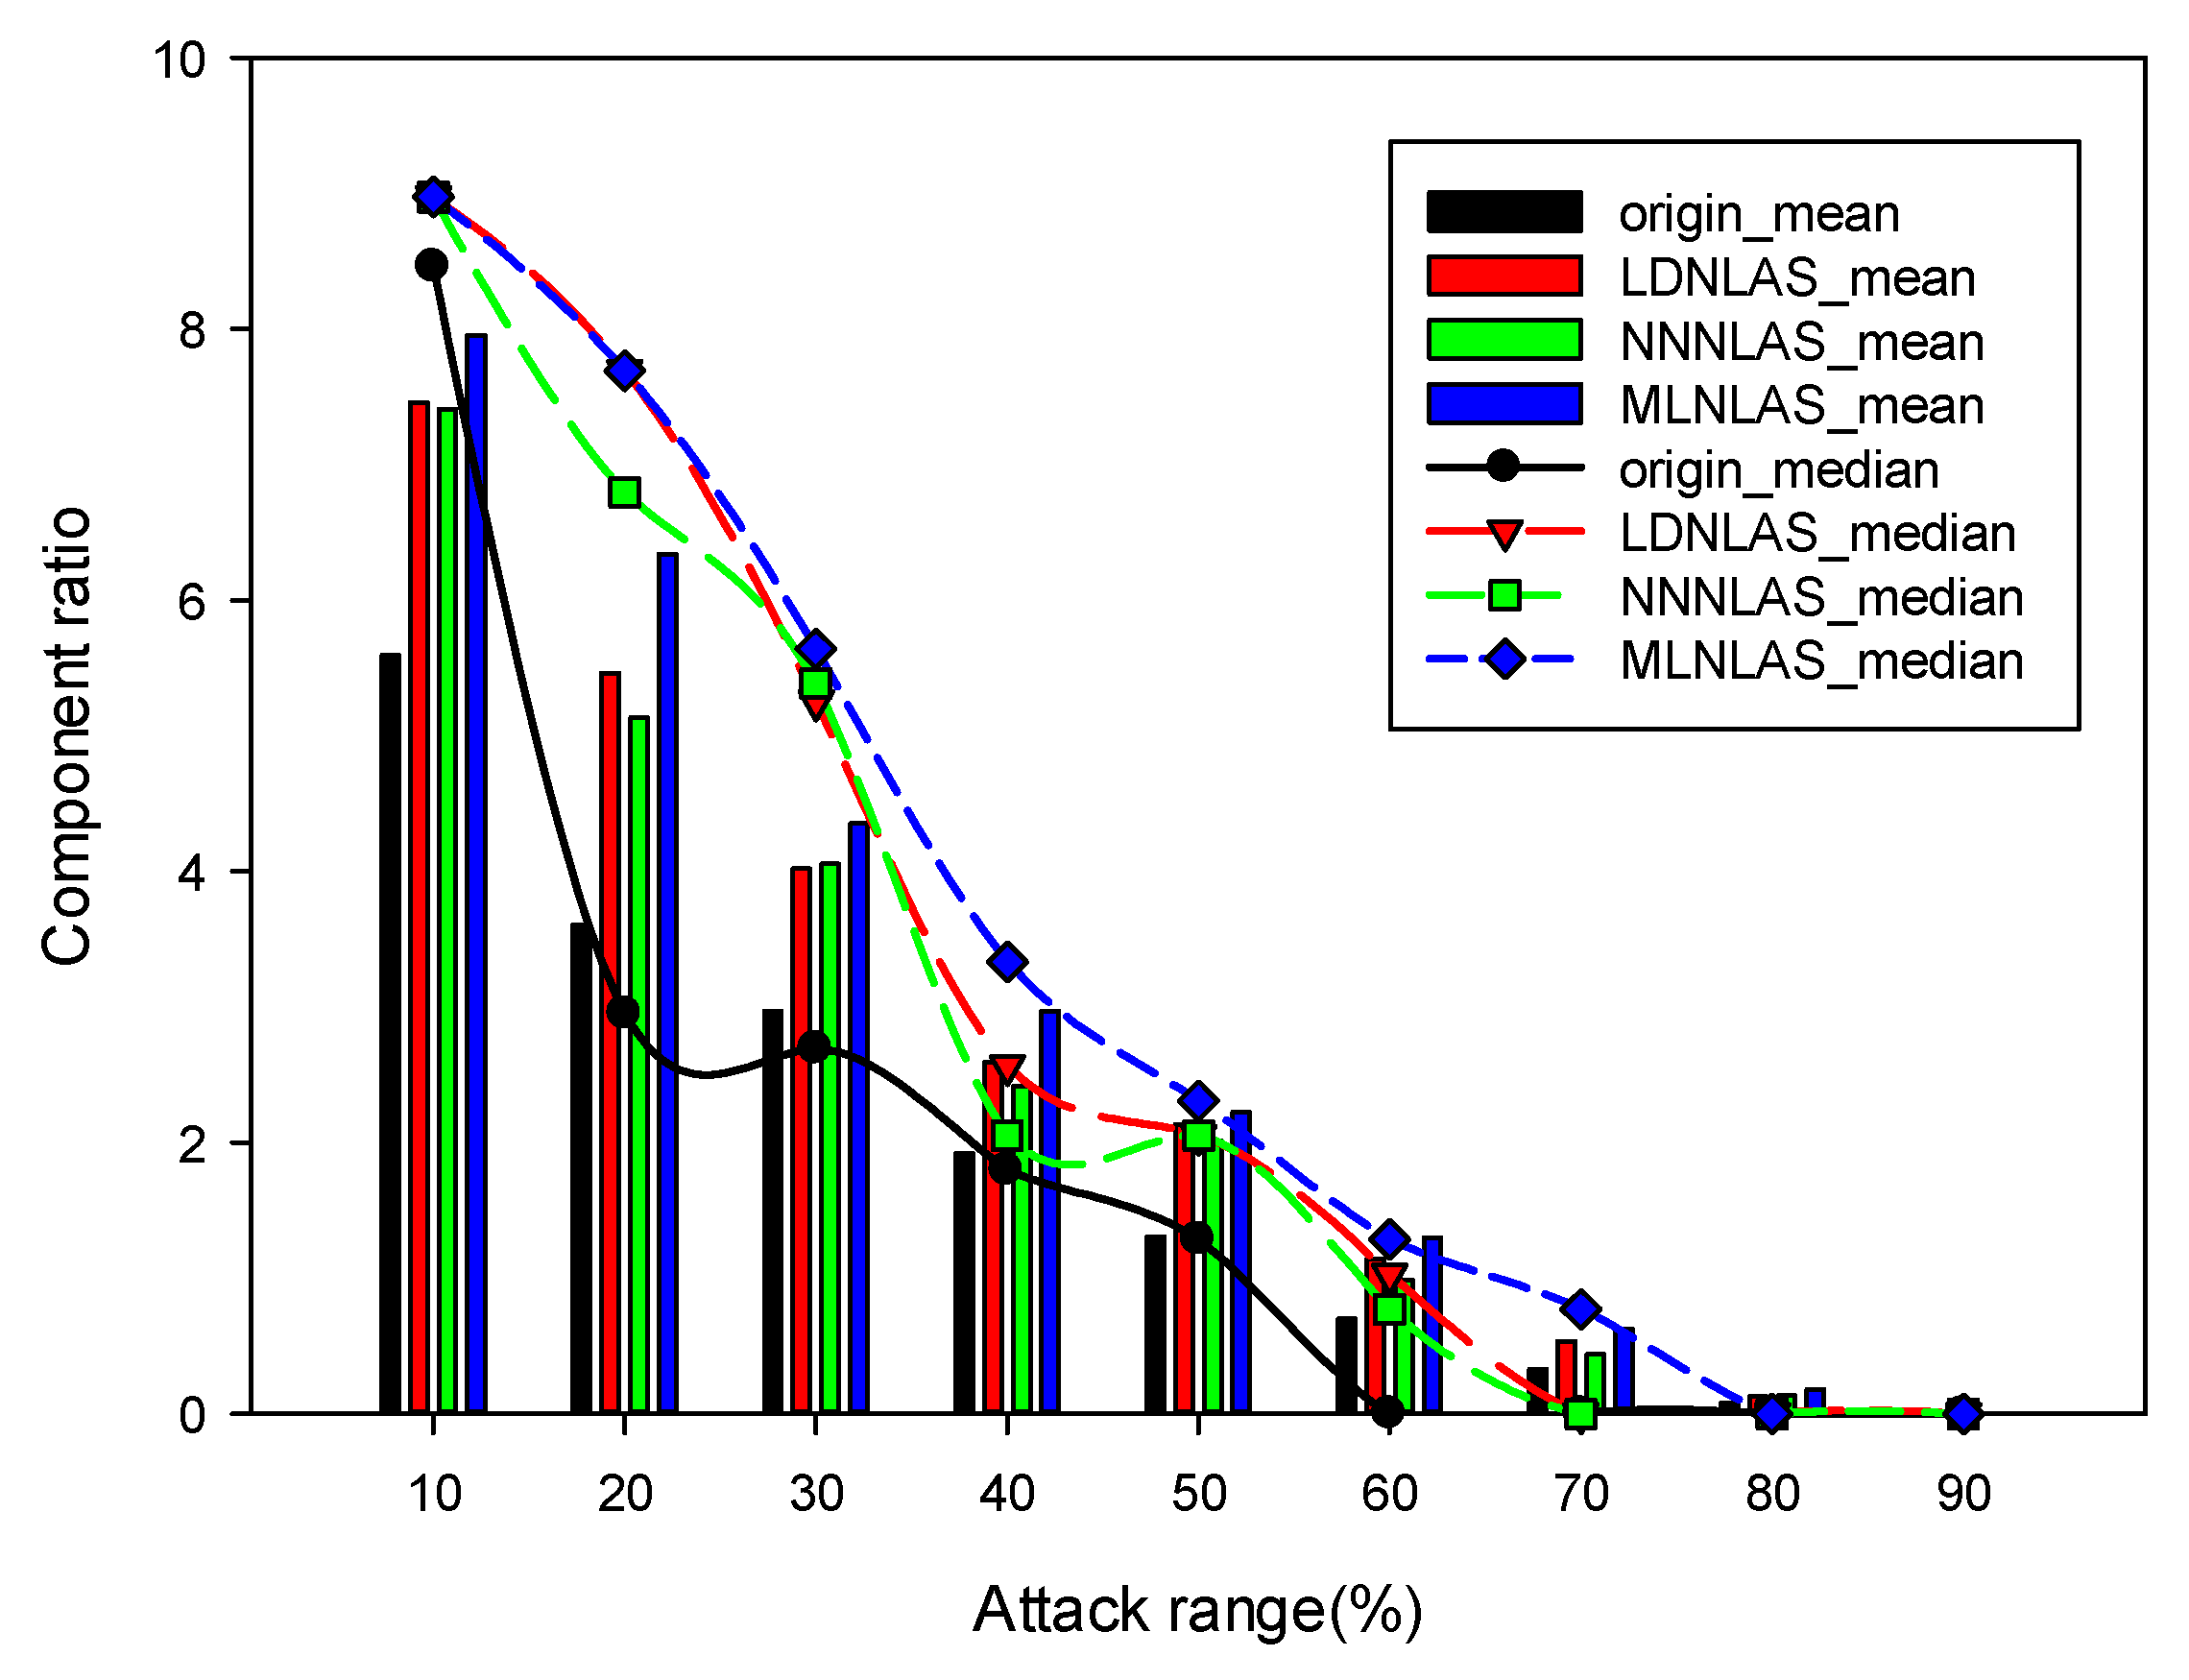
From the distribution intervals of Figure 5, the maximum component ratios of the original network are all less than or equal to three new networks of any attack range. The less the range of distribution intervals, the more stable the cascading propagation; the greater the mean value, the better the network robustness. For further comparison, the mean and median values are shown in Figure 6.
Observing the mean histogram and the median curve of Figure 6, the original network lefts fewer nodes when the attack range is up to 60%. The LDNLAS and NNNLAS networks survive up to 70% attack range, while the MLNLAS network can preserve in 80% attack range. Combined with the distribution intervals of Figure 5, the robustness of 4 networks orders is as follows: MLNLAS > LDNLAS > NNNLAS > original.
(2) HDNA
The nodes of networks are ordered in degrees. The attack range selects the nodes from the high degrees to the low ones. As the nodes with the same degree have a number of attack groups, the results can be obtained by traversing all attack groups of each attack range.
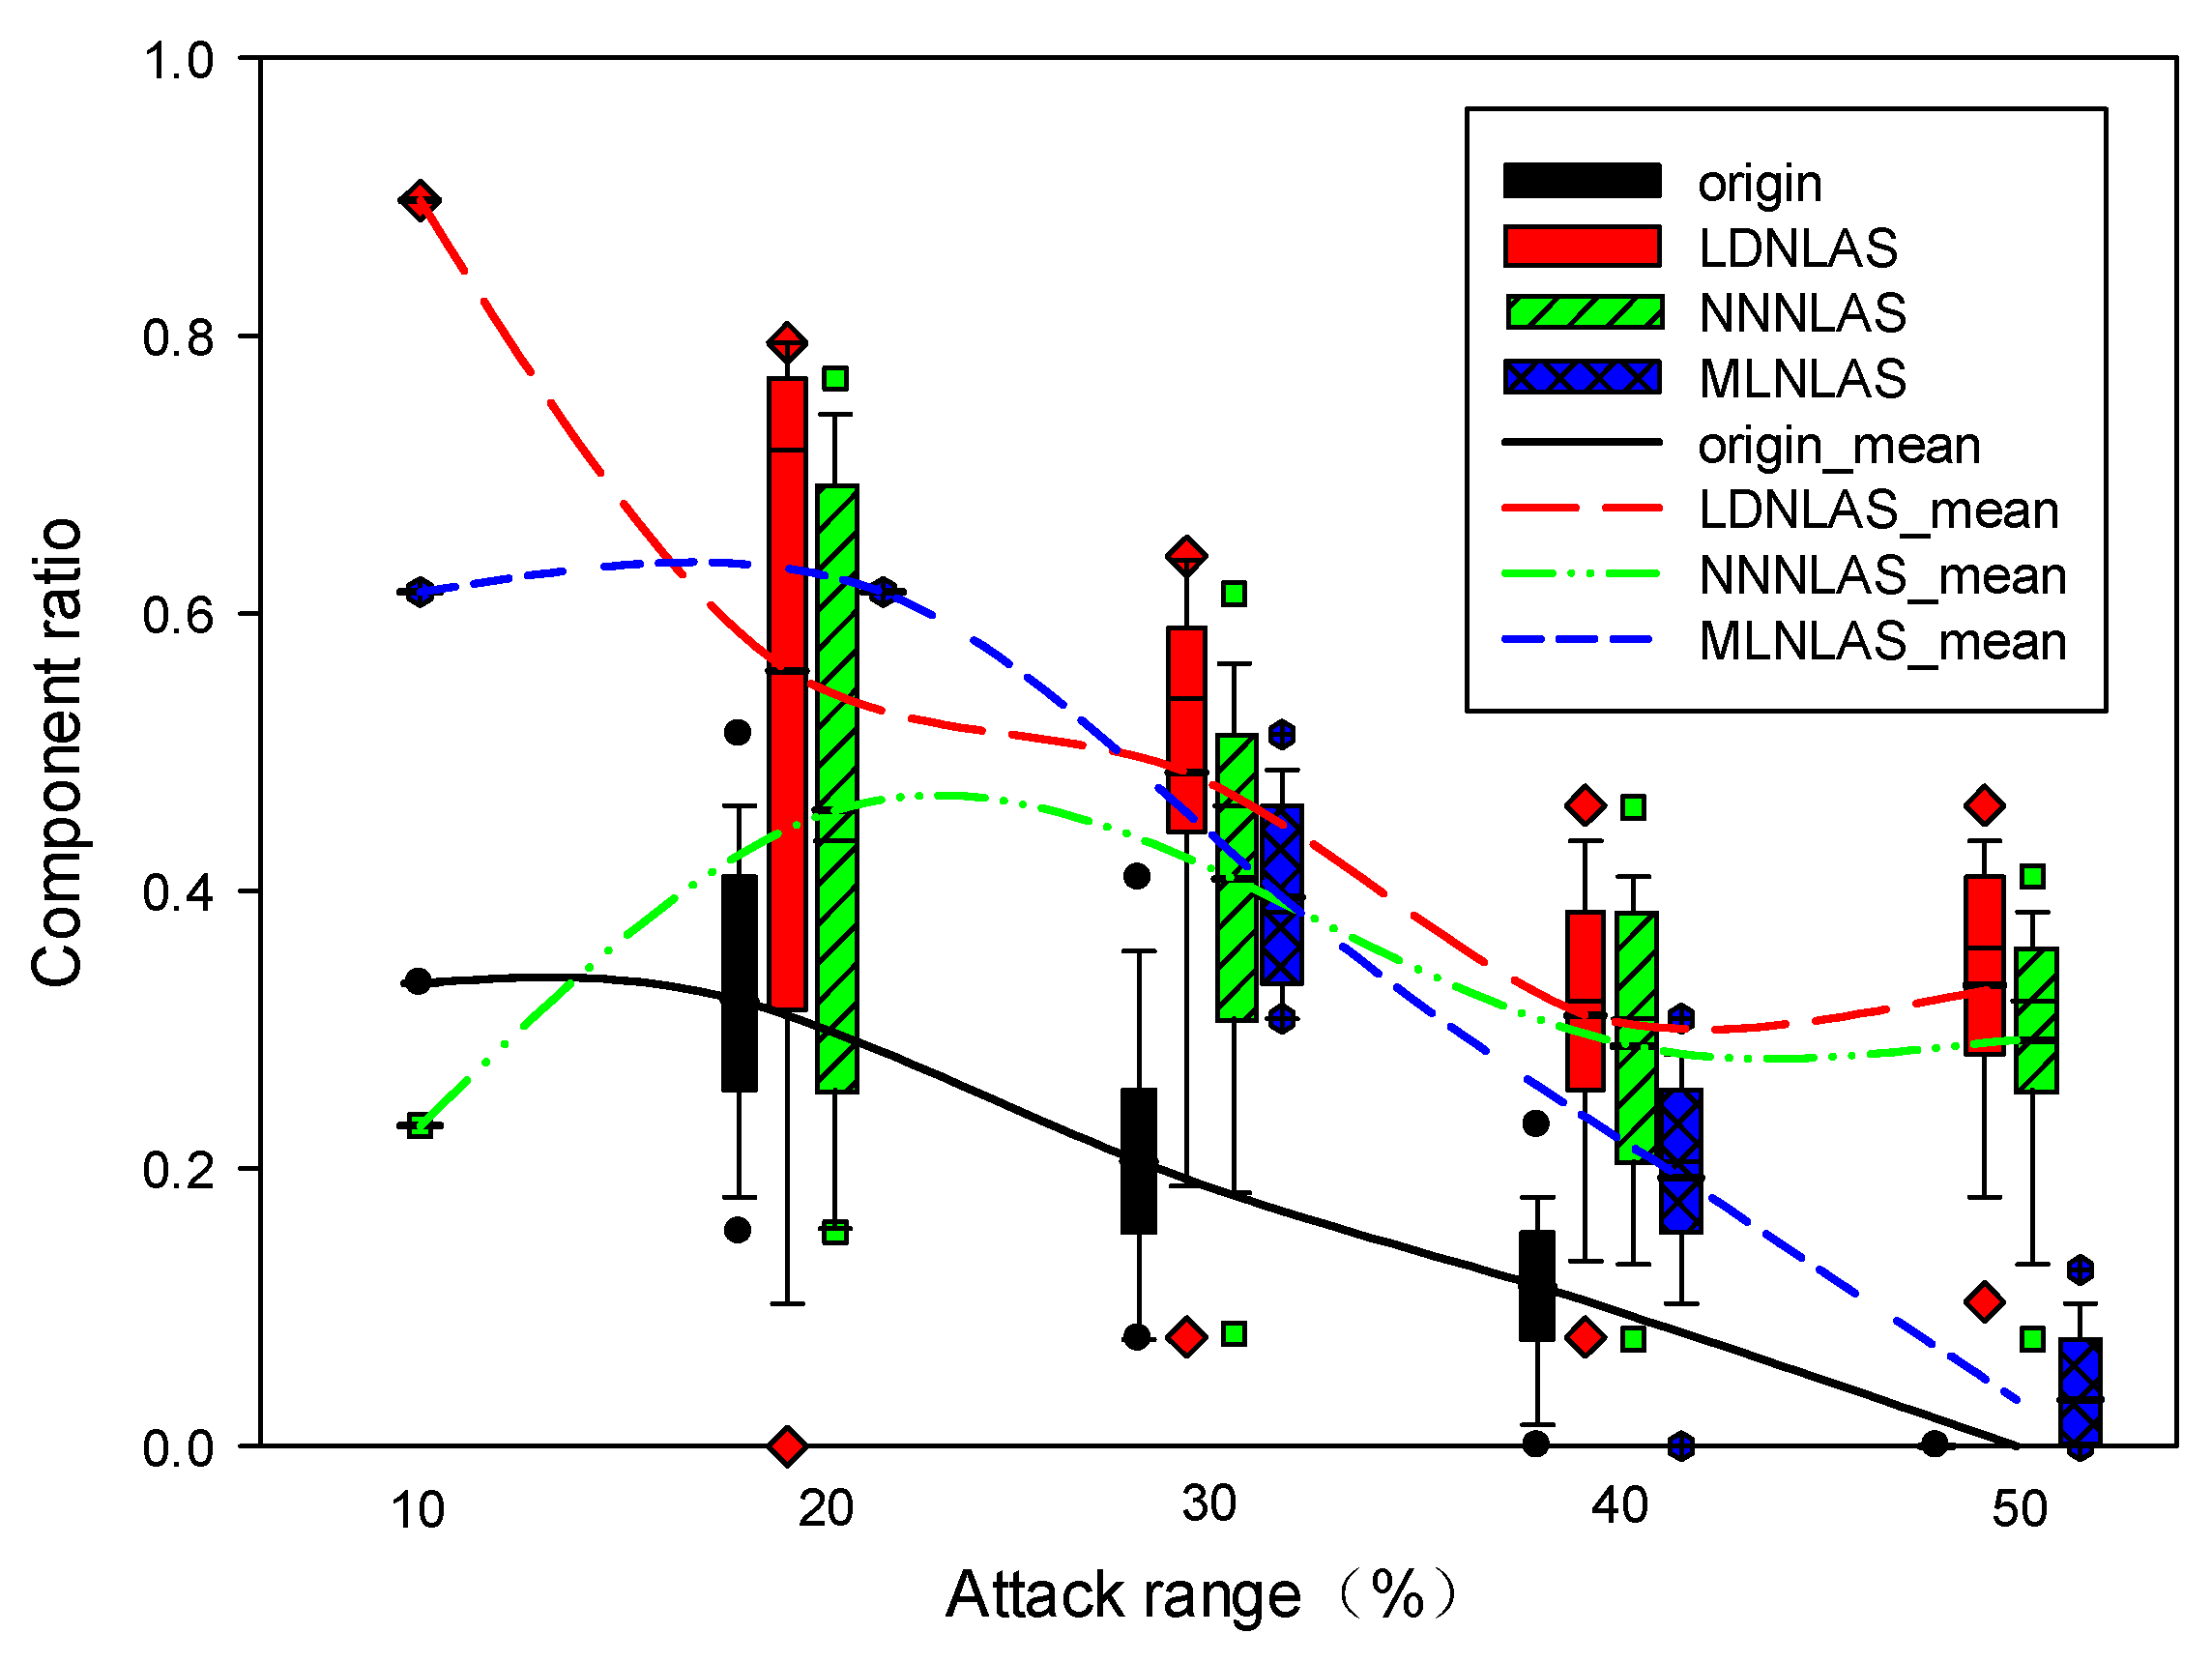
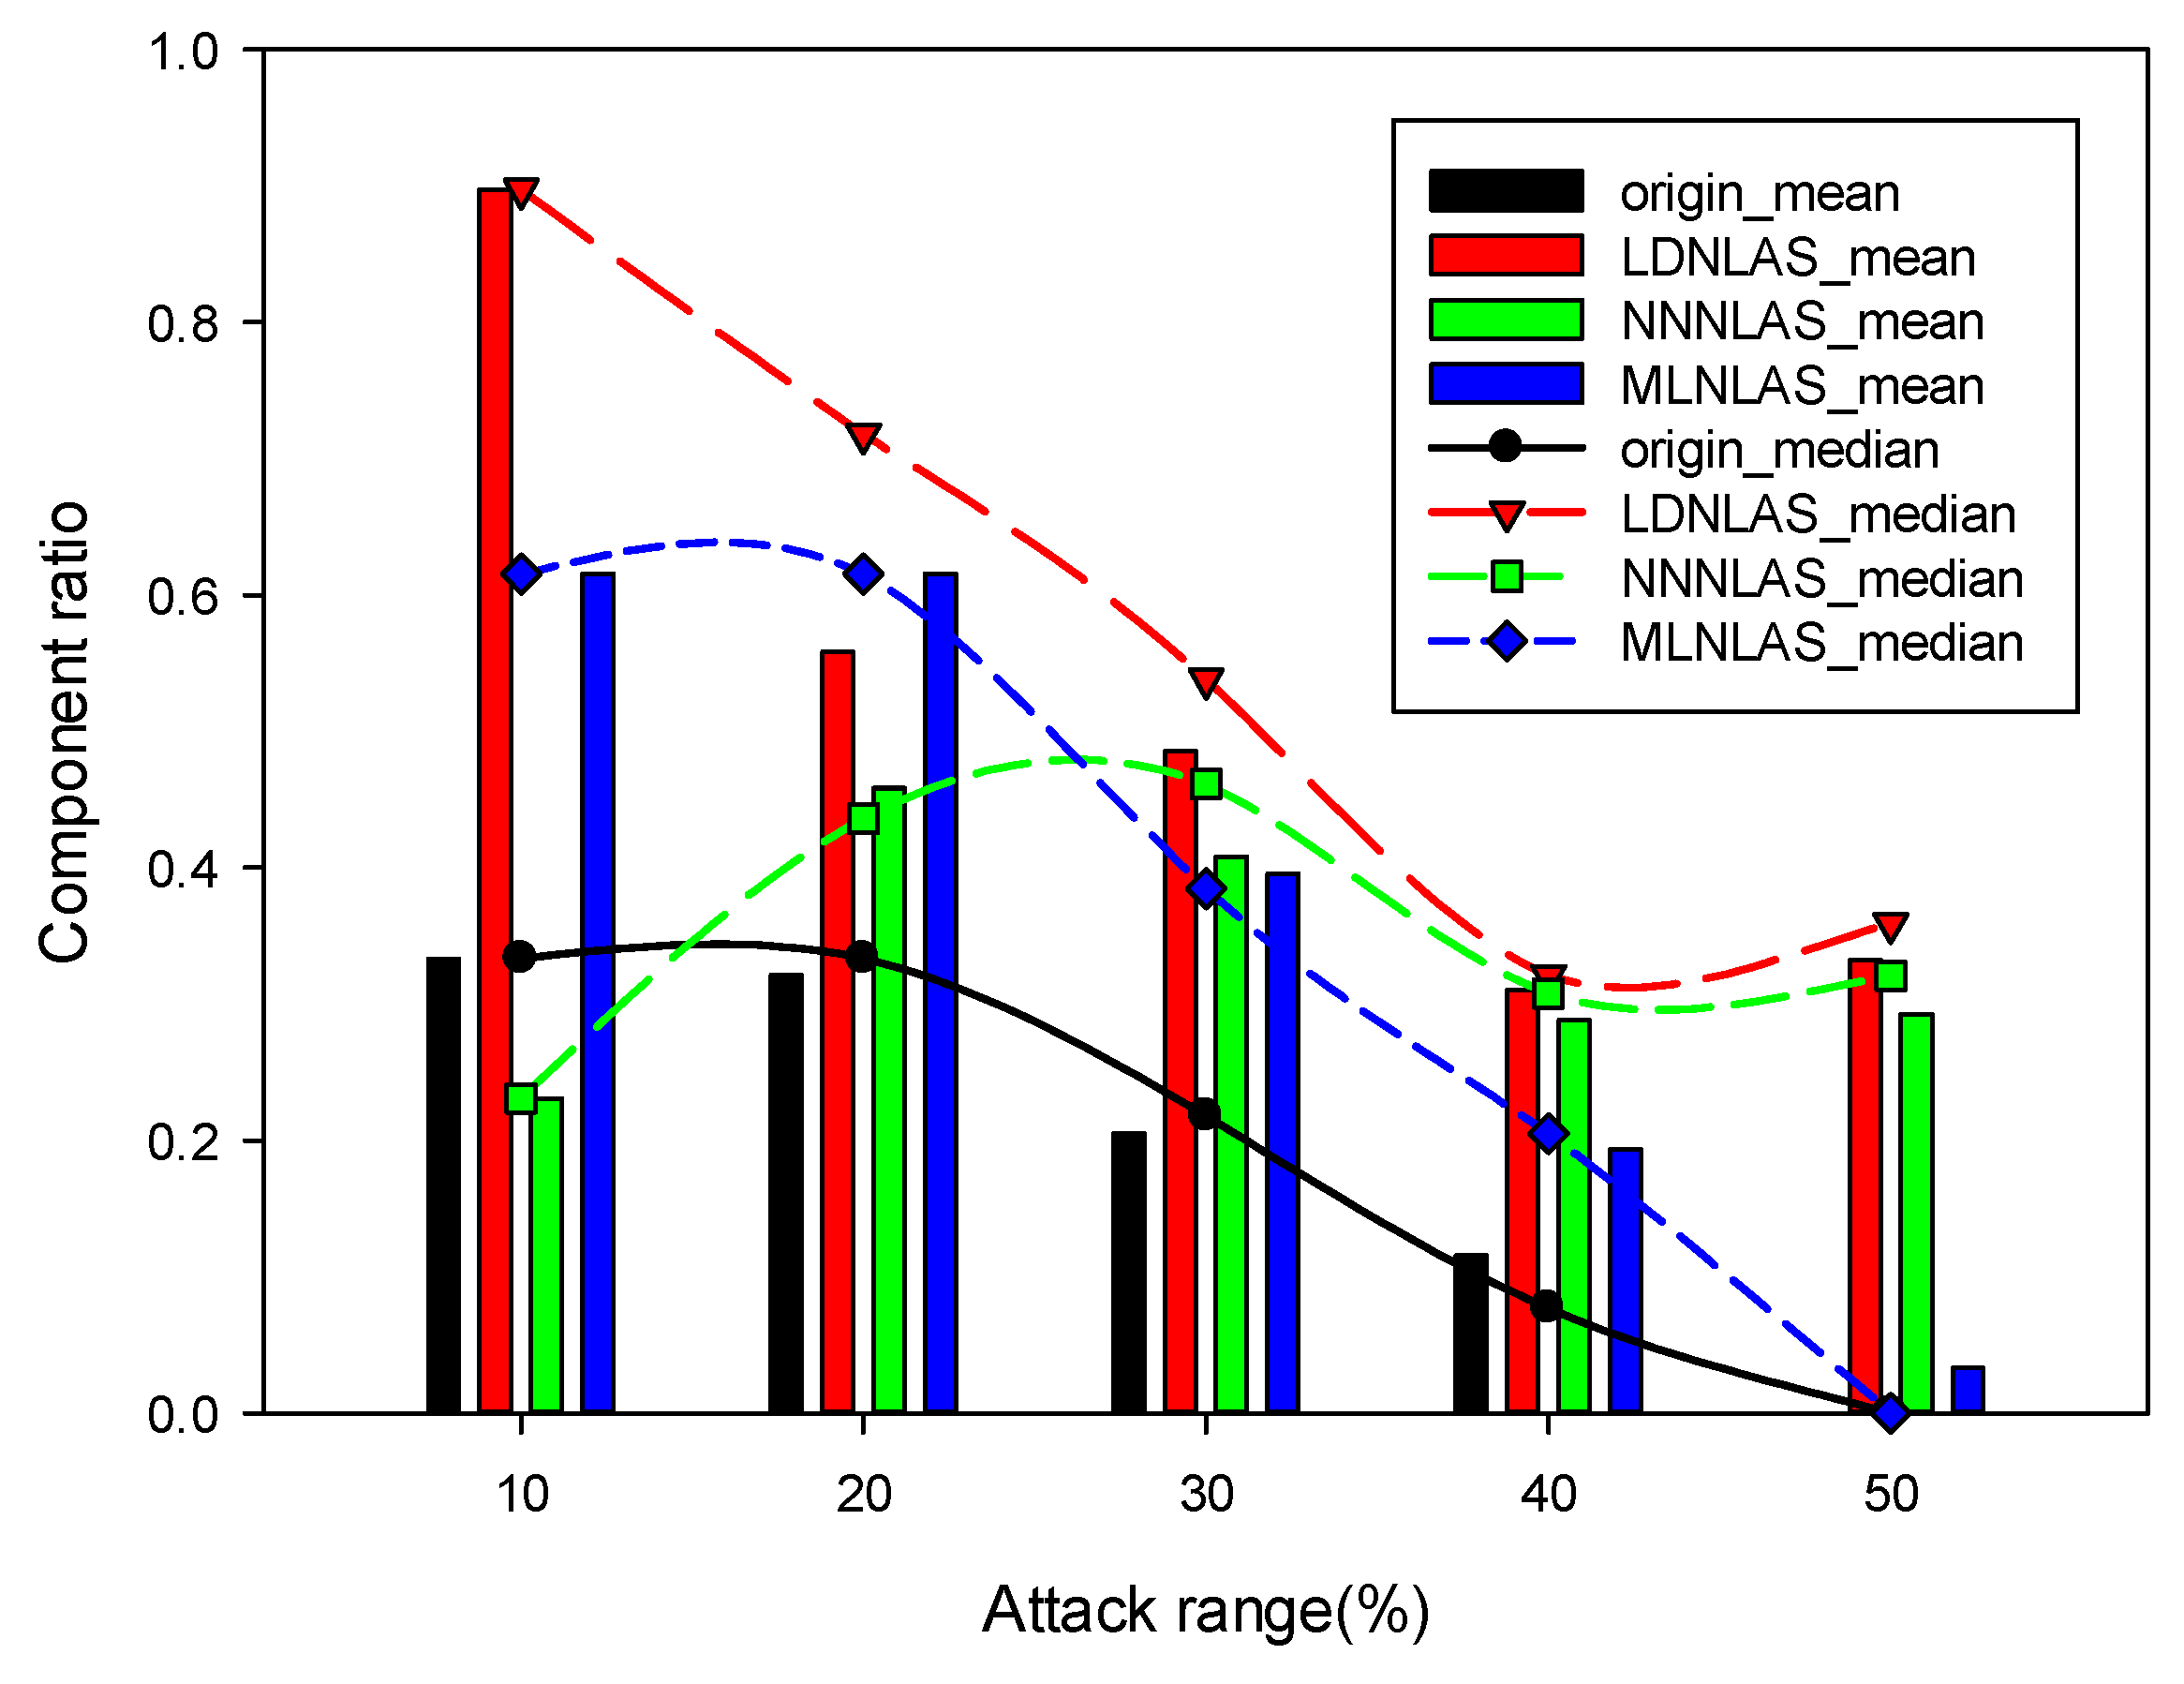
In Figure 7, when the attack range is up to 50%, the original network totally collapses, and the MLNLAS network lefts a few nodes. In contrast, the LDNLAS and NNNLAS networks remain a large number of nodes. Owing to the impacts of the highest degree nodes on the connectivity, the NNNLAS network losses the maximum nodes at 10% attack range of 4 networks. For further analysis, the mean and median values are shown in Figure 8.
Combined with Figure 7 and Figure 8, when the attack range reaches 20%, although the mean value of the LDNLAS network is smaller than that of the NNNLAS network, both the maximum value and the median value of the former are larger than the latter, which indicates that the mean value is smaller due to the influence of extreme value. Thus, the overall data should be larger than the latter. Attacking more than 20%, the robustness of the LDNLAS network is obviously superior to other 3 networks. Influenced by the community partition, when the attack range is more than 10%, the robustness of 4 networks orders as follows: LDNLAS > NNNLAS>MLNLAS > original.
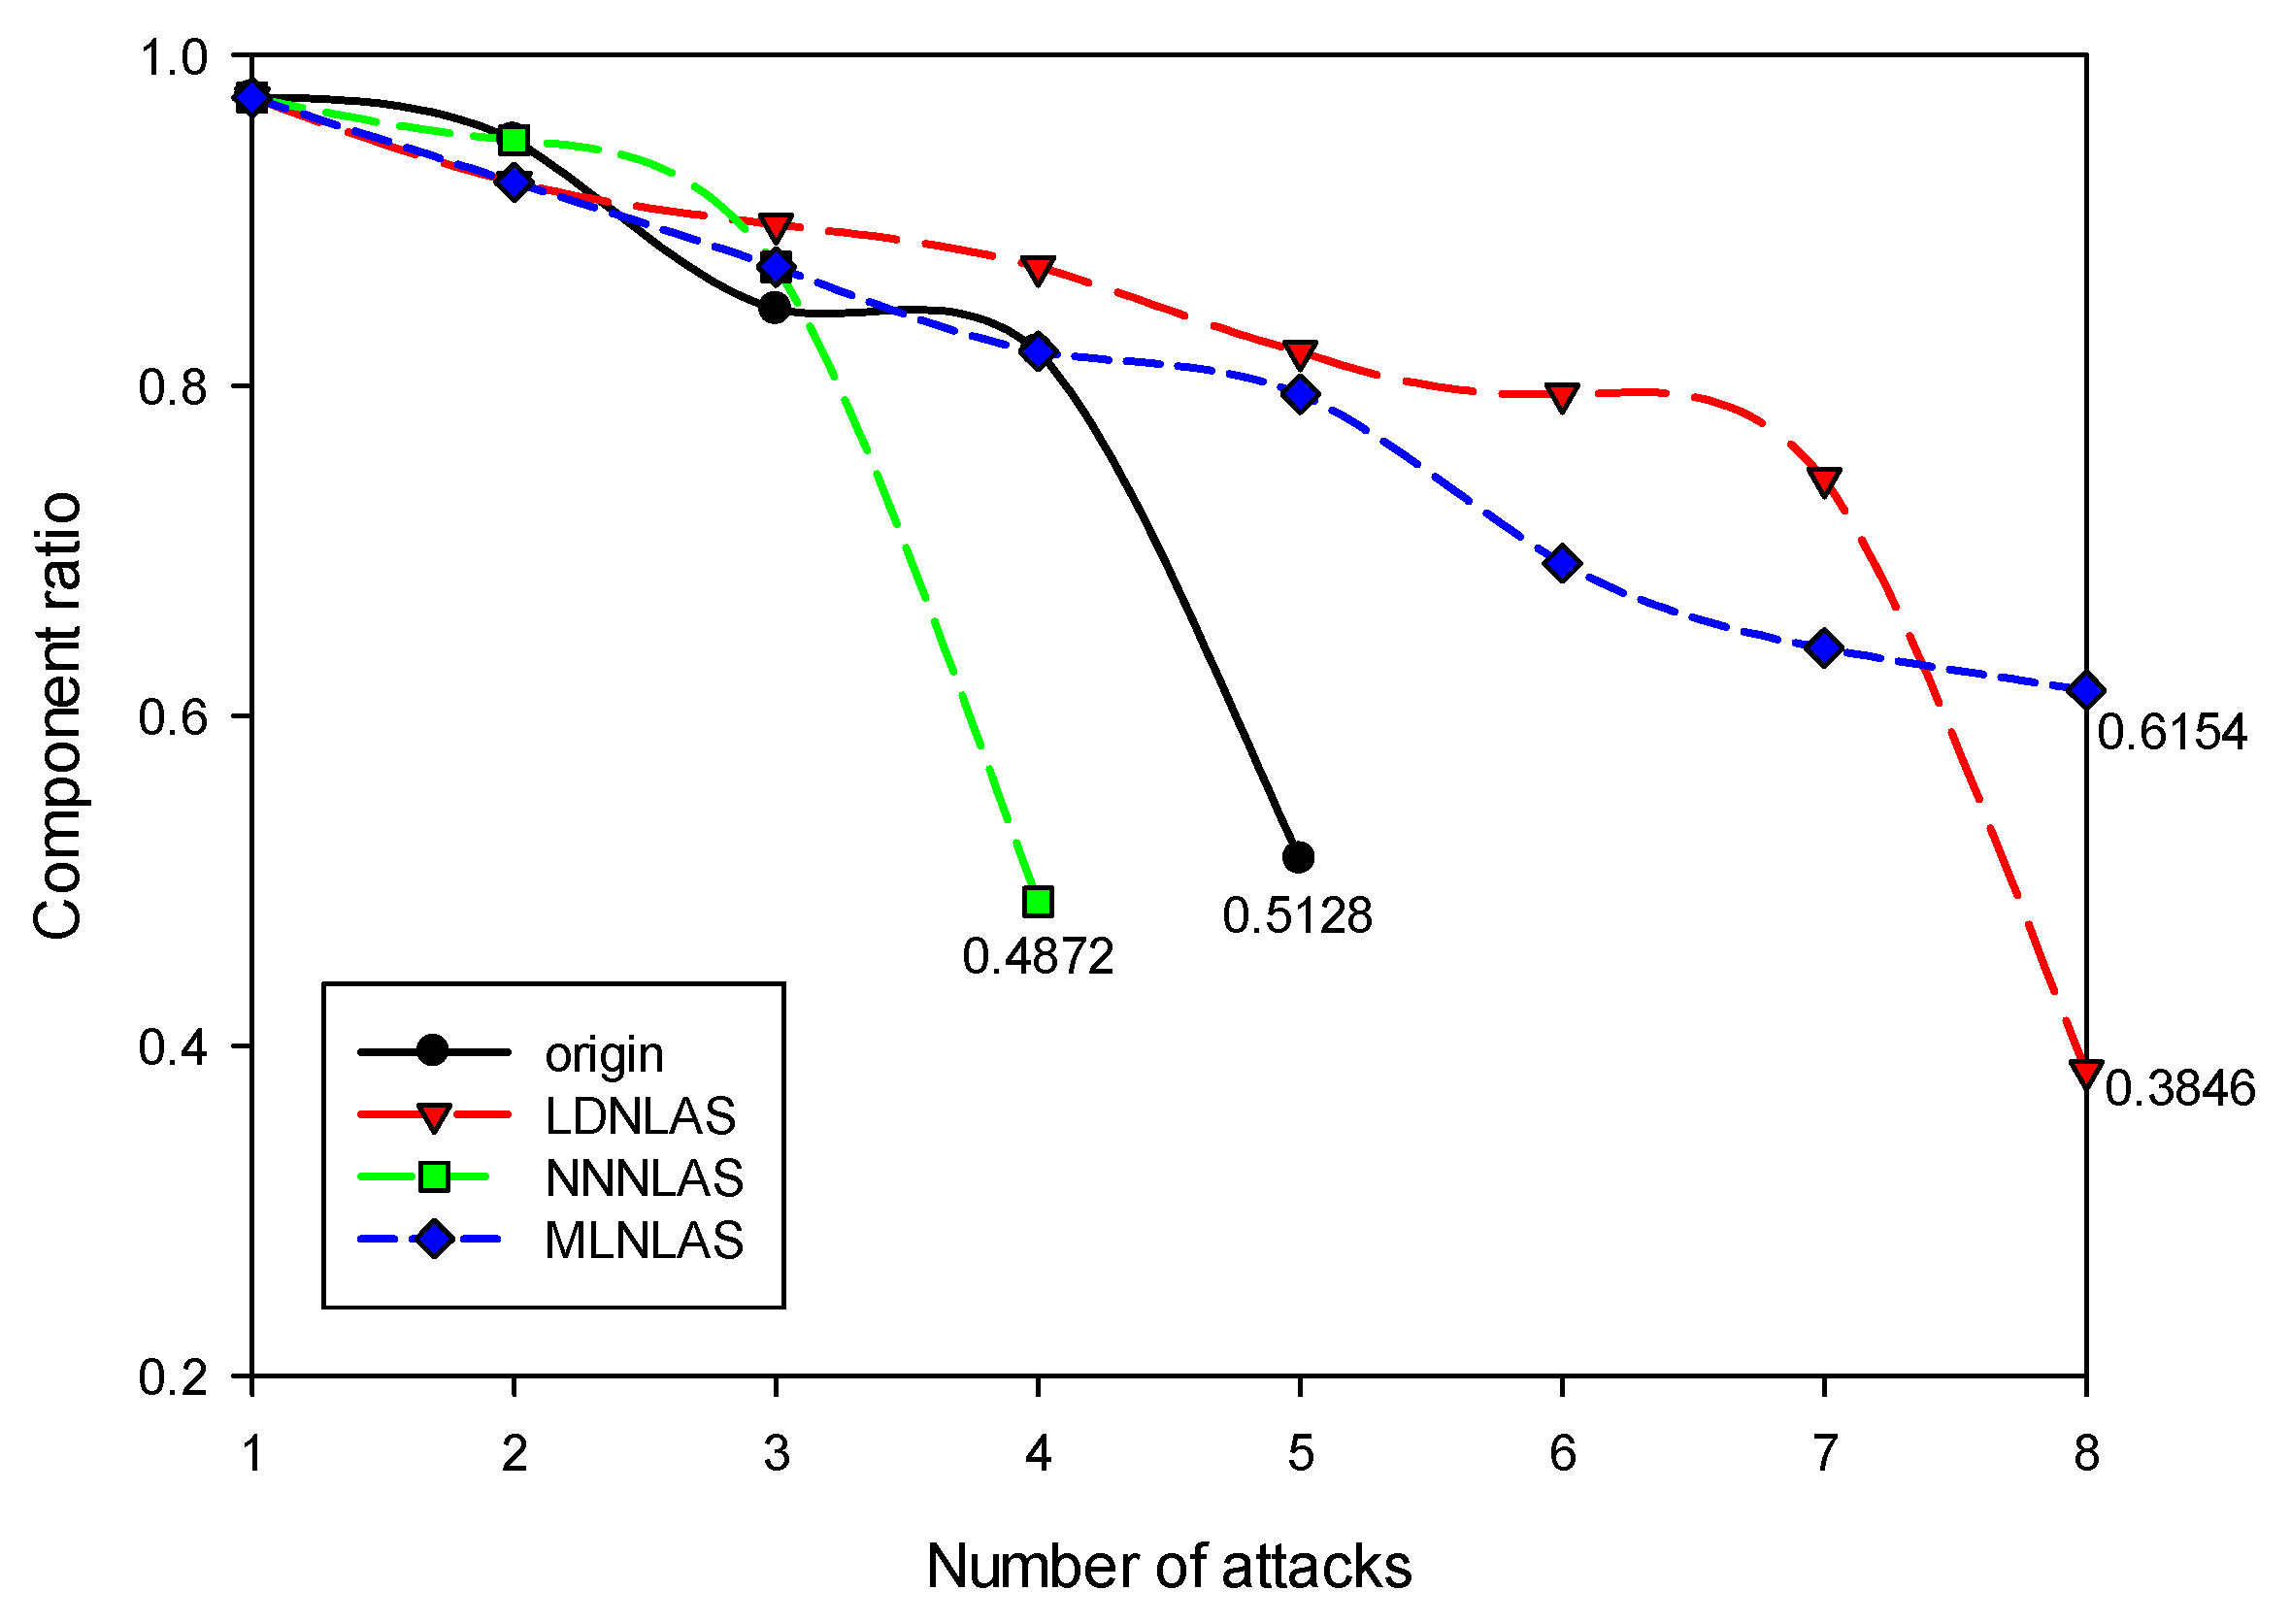
(3) VSA
Based on the node vulnerability, one node is attacked each time. For comparing with the original, the attack originates from the most vulnerable node 16. The attack sequence of the original network is: 16–26–3–8–6; the attack sequence of the LDNLAS network is: 16–23–7–20–2–9–5–14; the attack sequence of the NNNLAS network is: 16–14–6–26; and the attack sequence of the MLNLAS network is: 16–13–6–8–26–3–22–2.
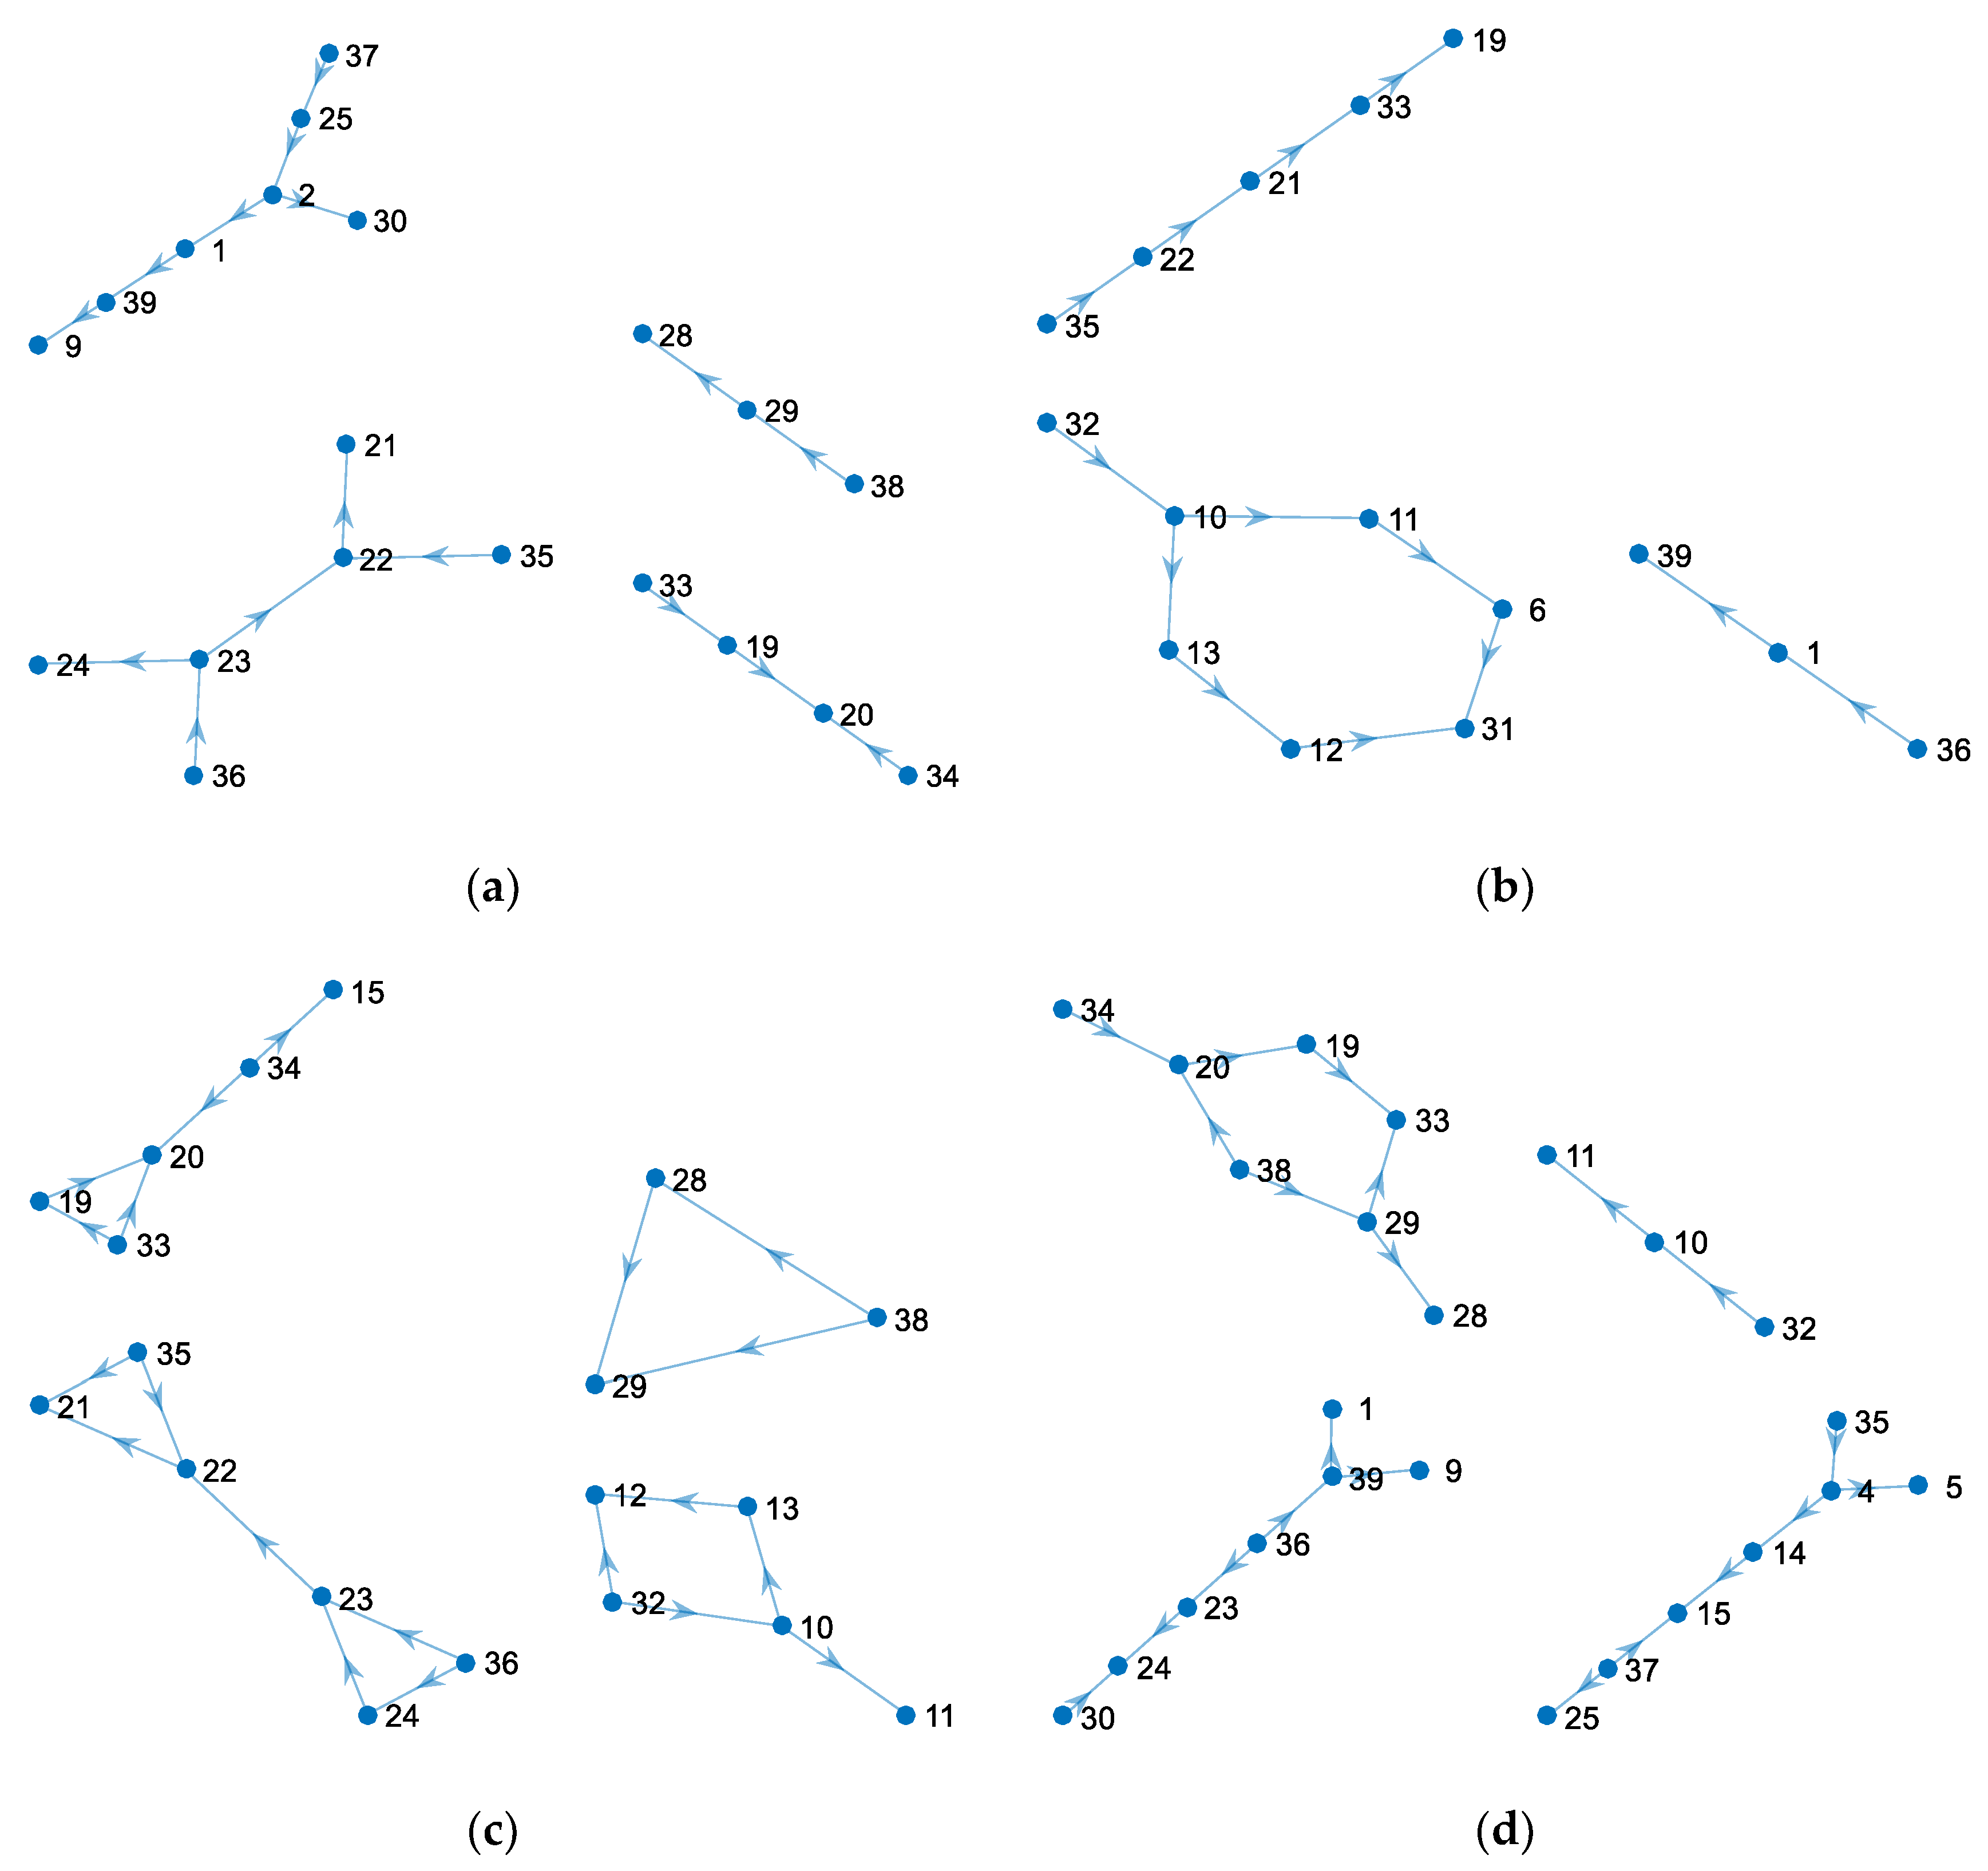
In Figure 9, the original network sequentially attacks 5 nodes (about 10%) splitting into 4 islands, and . The LDNLAS network sequentially attacks 8 nodes (about 20%) splitting into 3 islands, and . The NNNLAS network sequentially attacks 4 nodes (about 10%) splitting into 3 islands, and . The MLNLAS network sequentially attacks 8 nodes (about 20%) splitting into 4 islands, and .
The remaining islands of sequential attacks are shown as follows.
From Figure 9 and Figure 10, it is observed that the MLNLAS network is the most robust one of 4 networks. The LDNLAS network exhibits the difficulty of sequential attacks, while it is weak in islanding operations. The NNNLAS has the worst survivability under sequential attacks. In the sequential attack process, the more the attacks, the more difficult the implementation, and the more robust the network. Moreover, the network with few communities, a small CC and a short APL can resist the sequential attack more efficiently. Therefore, the robustness of 4 networks orders as follows: MLNLAS > LDNLAS > original > NNNLAS.
From the above analysis, LDNLAS gets the second largest link-addition cost of the three proposed strategies. The LDNLAS network obtains a shorter APL and smaller CC than the original network, which alleviates the depth of the cascading failure propagation. In fact, this network exhibits the best robustness against HDNAs, and the second best robustness against RAs and VSAs. Although this strategy requires slightly larger investments, it can resist both simultaneous attacks and sequential attacks, and enhance the connectivity of the long-distance transmission structure power system.
MLNLAS obtains the largest link-addition cost of the three proposed strategies. The MLNLAS network with the shortest APL enormously enhances the connectivity than that of the original network. Moreover, this network presents the best performance against RAs and VSAs. Although this strategy requires more investments, it optimizes the electricity supply to greatly alleviate the burdens of load centers. As Ref [36] says, it is difficult to gain the high robustness with the minimal cost simultaneously.
NNNLAS has the smallest link-addition cost of the three proposed strategies. The NNNLAS network with the largest CC improves the centralization of local area management and is robust to the simultaneous attacks. However, it cannot effectively decrease the network vulnerability against VSAs.
6. Conclusions
Cascading failure propagation can be alleviated by optimizing the network topology. Based on the community partition of the original network, three link-addition strategies are proposed to meet the requirements of engineering practices. It is thus useful to guide the power system planning to improve the network robustness.
From the analysis of simulation results, the three proposed strategies can improve the network connectivity by adding the same number of links. The MLNLAS network exhibits good robustness under RAs; the LDNLAS shows better performances than other networks under HDNAs; the MLNLAS network reveals highly survivability under sequential attacks.
In this study, the proposed strategies are beneficial for improving the robustness of the original network. The focus is on the influence on the power system. In the future work, the authors will continue to study optimal strategies to mitigate cascading failures and improve the robustness of smart grids.
Author Contributions
Conceptualization, L.L.; methodology, L.L.; software, L.L.; validation, L.L.; formal analysis, L.L.; investigation, L.L..; resources, L.L. and P.H.; data curation, L.L.; writing—original draft preparation, L.L.; writing—review and editing, L.L., P.H.; visualization, L.L.; supervision, P.H.; project administration, P.H.; funding acquisition, L.L. and P.H. All authors have read and agreed to the published version of the manuscript.
Funding
This research received no external funding.
Conflicts of Interest
The authors declare no conflict of interest.
Nomenclature
| Indices | |
| Index for node numbering. | |
| Number of islands. | |
| Number of sequential attacks. | |
| Number of links. | |
| Constants | |
| Numbers of system nodes. | |
| System tolerance parameter. | |
| Variables | |
| Real power injection at the power node . | |
| Reactive injection at the power node . | |
| Real power flow from node to node . | |
| Reactive power flow from node to node . | |
| Voltage magnitude. | |
| Difference in the phase angle between power nodes and node . | |
| Admittance matrix. | |
| Susceptance matrix. | |
| Out flows of node . | |
| Local loads of node . | |
| Links of node . | |
| Neighbors of node . | |
| Cluster coefficient of node . | |
| Shortest path from the source node to the destination node . | |
| Numbers of nodes of the remaining components. | |
| Single loop location of node . | |
| Node importance of node . | |
| Degrees of node . | |
| Adjacent matrix. | |
| Vertex . | |
| Additional link from the node to the destination node . | |
| Sets and Functions | |
| Directed graph of power system. | |
| Power node set. | |
| Power line set. | |
| Power flow capacity function. | |
| Generation capacity function. | |
| Node capacity function. | |
| System capacity function. | |
| Cluster coefficient function. | |
| Average path length function. | |
| Length function of a single loop. | |
| Nodes with the same vulnerability set. | |
| Island ratio function. | |
| Survival islands set. | |
| Evaluation indicator. | |
| Community modularity function. | |
| Judging community function for two nodes. | |
| Low-degree-node link-addition strategy function. | |
| Set of low-degree nodes that satisfy the average shortest path . | |
| Nearest-neighboring-node link-addition strategy function. | |
| Set of neighboring nodes | |
| Max-load-node link-addition strategy function. | |
| Set of heavy load nodes in order. | |
References
- Bretãs, A.S.; Bretas, N.G.; Carvalho, B.E. Further contributions to smart grids cyber-physical security as a malicious data attack: Proof and properties of the parameter error spreading out to the measurements and a relaxed correction model. Int. J. Electr. Power Energy Syst. 2019, 104, 43–51. [Google Scholar] [CrossRef]
- Gao, Z.; Cecati, C.; Ding, S.X. A Survey of Fault Diagnosis and Fault-Tolerant Techniques—Part I: Fault Diagnosis with Model-Based and Signal-Based Approaches. IEEE Trans. Ind. Electron. 2015, 62, 3757–3767. [Google Scholar] [CrossRef] [Green Version]
- Gao, Z.; Cecati, C.; Ding, S.X. A Survey of Fault Diagnosis and Fault-Tolerant Techniques Part II: Fault Diagnosis with Knowledge-Based and Hybrid/Active Approaches. IEEE Trans. Ind. Electron. 2015, 62, 1. [Google Scholar] [CrossRef] [Green Version]
- Wang, Z.; Hill, D.J.; Chen, G.; Dong, Z.Y. Power system cascading risk assessment based on complex network theory. Phys. A Stat. Mech. Its Appl. 2017, 482, 532–543. [Google Scholar] [CrossRef]
- Albert, R.; Barabasi, A.-L. Statistical mechanics of complex networks. Rev. Mod. Phys. 2001, 26, 1–7. [Google Scholar] [CrossRef] [Green Version]
- Wang, S.; Liu, J. Robustness of single and interdependent scale-free interaction networks with various parameters. Phys. A Stat. Mech. Its Appl. 2016, 460, 139–151. [Google Scholar] [CrossRef]
- Pagani, G.A.; Aiello, M. The Power Grid as a complex network: A survey. Phys. A Stat. Mech. Its Appl. 2013, 392, 2688–2700. [Google Scholar] [CrossRef] [Green Version]
- Guo, W.; Wang, H.; Wu, Z. Robustness analysis of complex networks with power decentralization strategy via flow-sensitive centrality against cascading failures. Phys. A Stat. Mech. its Appl. 2018, 494, 186–199. [Google Scholar] [CrossRef]
- Kinney, R.; Crucitti, P.; Albert, R.; Latora, V. Modeling cascading failures in the North American power grid. Eur. Phys. J. B 2005, 46, 101–107. [Google Scholar] [CrossRef]
- Ren, H.-P.; Song, J.; Yang, R.; Baptista, M.S.; Grebogi, C. Cascade failure analysis of power grid using new load distribution law and node removal rule. Phys. A Stat. Mech. Its Appl. 2016, 442, 239–251. [Google Scholar] [CrossRef] [Green Version]
- Motter, A.E.; Lai, Y.-C. Cascade-based attacks on complex networks. Phys. Rev. E 2002, 66. [Google Scholar] [CrossRef] [PubMed] [Green Version]
- Liang, G.; Weller, S.R.; Zhao, J.; Luo, F.; Dong, Z.Y. The 2015 Ukraine Blackout: Implications for False Data Injection Attacks. IEEE Trans. Power Syst. 2017, 32, 3317–3318. [Google Scholar] [CrossRef]
- Lee, L.; Hu, P. Vulnerability analysis of cascading dynamics in smart grids under load redistribution attacks. Int. J. Electr. Power Energy Syst. 2019, 111, 182–190. [Google Scholar] [CrossRef]
- Ibrahim, M.; Alsheikh, A. Automatic Hybrid Attack Graph (AHAG) Generation for Complex Engineering Systems. Processes 2019, 7, 787. [Google Scholar] [CrossRef] [Green Version]
- Wang, S.; Zhang, J.; Na, D. Multiple perspective vulnerability analysis of the power network. Phys. A Stat. Mech. Its Appl. 2017, 492. [Google Scholar] [CrossRef]
- Wang, Z.; Chen, G.; Hill, D.J.; Dong, Z.Y. A power flow based model for the analysis of vulnerability in power networks. Phys. A Stat. Mech. its Appl. 2016, 460, 105–115. [Google Scholar] [CrossRef]
- Zhao, S.; Maxim, A.; Liu, S.; De Keyser, R.; Ionescu, C.M. Distributed Model Predictive Control of Steam/Water Loop in Large Scale Ships. Processes 2019, 7, 442. [Google Scholar] [CrossRef] [Green Version]
- Aslam, M.; Bantan, R.A.R.; Khan, N. Monitoring the Process Based on Belief Statistic for Neutrosophic Gamma Distributed Product. Processes 2019, 7, 209. [Google Scholar] [CrossRef] [Green Version]
- Jiang, Y.; Jin, X.; Wang, H.; Fu, Y.; Ge, W.; Yang, B.; Yu, T. Optimal Nonlinear Adaptive Control for Voltage Source Converters via Memetic Salp Swarm Algorithm: Design and Hardware Implementation. Processes 2019, 7, 490. [Google Scholar] [CrossRef] [Green Version]
- Peng, H.; Liu, C.; Zhao, D.; Han, J. Reliability analysis of CPS systems under different edge repairing strategies. Phys. A Stat. Mech. Its Appl. 2019, 532, 121865. [Google Scholar] [CrossRef]
- Zio, E.; Sansavini, G. Modeling Interdependent Network Systems for Identifying Cascade-Safe Operating Margins. IEEE Trans. Reliab. 2011, 60, 94–101. [Google Scholar] [CrossRef] [Green Version]
- Cui, P.; Zhu, P.; Wang, K.; Xun, P.; Xia, Z. Enhancing robustness of interdependent network by adding connectivity and dependence links. Phys. A Stat. Mech. Its Appl. 2018, 497, 185–197. [Google Scholar] [CrossRef]
- Dong, G.; Gao, J.; Tian, L.; Du, R.; He, Y. Percolation of partially interdependent networks under targeted attack. Phys. Rev. E 2012, 85, 16112. [Google Scholar] [CrossRef] [PubMed] [Green Version]
- Ji, X.; Wang, B.; Liu, D.; Chen, G.; Tang, F.; Wei, D.; Tu, L. Improving interdependent networks robustness by adding connectivity links. Phys. A Stat. Mech. Its Appl. 2016, 444, 9–19. [Google Scholar] [CrossRef]
- Newman, M.E.J. Fast algorithm for detecting community structure in networks. Phys. Rev. E 2004, 69, 066133. [Google Scholar] [CrossRef] [Green Version]
- Xue, S.; Che, Y.; He, W.; Zhao, Y.; Zhang, R. Control Strategy of Electric Heating Loads for Reducing Power Shortage in Power Grid. Processes 2019, 7, 273. [Google Scholar] [CrossRef] [Green Version]
- Wang, S.; Zhang, J.; Zhao, M.; Min, X. Vulnerability analysis and critical areas identification of the power systems under terrorist attacks. Phys. A Stat. Mech. Its Appl. 2017, 473, 156–165. [Google Scholar] [CrossRef]
- Bai, S.; Cheng, Z.; Guo, B. Maintenance Optimization Model with Sequential Inspection Based on Real-Time Reliability Evaluation for Long-Term Storage Systems. Processes 2019, 7, 481. [Google Scholar] [CrossRef] [Green Version]
- Klempner, G.; Kerszenbaum, I. Operation and Control. In Operation and Maintenance of Large Turbo-Generators; John Wiley & Sons, Inc.: Hoboken, NJ, USA, 2005. [Google Scholar]
- Motter, A.E. Cascade Control and Defense in Complex Networks. Phys. Rev. Lett. 2004, 93. [Google Scholar] [CrossRef] [Green Version]
- Watts, D.J.; Strogatz, S.H. Collective dynamics of ‘small-world’ networks. Nature 1998, 393, 440–442. [Google Scholar] [CrossRef]
- Knuth, D.E. A Generalization of Dijkstra’s Algorithm. Inf. Process. Lett. 1977, 6, 1–5. [Google Scholar] [CrossRef]
- Buldyrev, S.V.; Parshani, R.; Paul, G.; Stanley, H.E.; Havlin, S. Catastrophic cascade of failures in interdependent networks. Nature 2010, 464, 1025–1028. [Google Scholar] [CrossRef] [PubMed] [Green Version]
- Newman, M.E.J. Modularity and community structure in networks. Proc. Natl. Acad. Sci. USA 2006, 103, 8577–8582. [Google Scholar] [CrossRef] [PubMed] [Green Version]
- Zimmerman, R.D.; Murllo-Sanchez, C.E.; Thomas, R.J. MATPOWER: Steady-State Operations, Planning, and Analysis Tools for Power Systems Research and Education. IEEE Trans. Power Syst. 2011, 26, 12–19. [Google Scholar] [CrossRef] [Green Version]
- Fan, W.-L.; Liu, Z.-G.; Hu, P. A High Robustness and Low Cost Cascading Failure Model Based On Node Importance In Complex Networks. Mod. Phys. Lett. B 2014, 28. [Google Scholar] [CrossRef]
Figure 1.
Communities of IEEE 39-bus system.

Figure 2.
Communities of LDNLAS network.

Figure 3.
Communities of NNNLAS network.

Figure 4.
Communities of MLNLAS network.

Figure 5.
Component ratio under RAs.

Figure 6.
Mean and median values under RAs.

Figure 7.
Component ratio under HDNAs.

Figure 8.
Mean and median values under HDNAs.

Figure 9.
Component ratio under VSAs.

Figure 10.
Remaining islands under VSAs (a) IEEE 39 system, (b) LDNLAS network, (c) NNNLAS network, and (d) MLNLAS network.
Figure 10.
Remaining islands under VSAs (a) IEEE 39 system, (b) LDNLAS network, (c) NNNLAS network, and (d) MLNLAS network.


Table 1.
Connectivity link addition of LDNLAS.
| New Link | Community | ||||
|---|---|---|---|---|---|
| 35–7 | 0.6098 | 6 | 0.0385 | 4.5128 | 9 |
| 34–28 | 0.5920 | 5 | 0.0214 | 4.4143 | 7 |
| 32–9 | 0.5537 | 4 | 0.0214 | 4.3374 | 6 |
| 36–1 | 0.5176 | 4 | 0.0214 | 4.1916 | 8 |
| 38–15 | 0.4998 | 3 | 0.0214 | 4.0229 | 6 |
| 31–12 | 0.5229 | 4 | 0.0214 | 4.004 | 3 |
| 30–20 | 0.4664 | 3 | 0.0214 | 3.9096 | 7 |
| 33–21 | 0.4911 | 4 | 0.0214 | 3.8866 | 3 |
| 37–18 | 0.5127 | 4 | 0.0214 | 3.8475 | 4 |
Table 2.
Connectivity link addition of NNNLAS.
| New Link | Community | ||||
|---|---|---|---|---|---|
| 35–21/36–24 | 0.6137 | 6 | 0.1239 | 4.6572 | 4 |
| 34–15 | 0.6122 | 5 | 0.1239 | 4.5466 | 4 |
| 30–1/31–7 | 0.6216 | 5 | 0.2692 | 4.529 | 8 |
| 33–20/38–28 | |||||
| 32–12/37–27 | 0.6393 | 5 | 0.2692 | 4.4872 | 6 |
Table 3.
Connectivity link addition of MLNLAS.
| New Link | Community | ||||
|---|---|---|---|---|---|
| 36–39 | 0.5776 | 4 | 0.0385 | 4.5304 | 9 |
| 34–8 | 0.5816 | 5 | 0.0385 | 4.363 | 9 |
| 38–20 | 0.5352 | 4 | 0.0385 | 4.1997 | 7 |
| 35–4 | 0.5272 | 4 | 0.0385 | 4.0513 | 6 |
| 32–16 | 0.5121 | 4 | 0.0385 | 3.8785 | 5 |
| 31–3 | 0.5274 | 4 | 0.0385 | 3.7787 | 4 |
| 37–15 | 0.4532 | 4 | 0.0385 | 3.6775 | 6 |
| 30–24 | 0.4458 | 3 | 0.0385 | 3.6086 | 6 |
| 33–29 | 0.4483 | 3 | 0.0342 | 3.5735 | 6 |
© 2020 by the authors. Licensee MDPI, Basel, Switzerland. This article is an open access article distributed under the terms and conditions of the Creative Commons Attribution (CC BY) license (http://creativecommons.org/licenses/by/4.0/).
Share and Cite
MDPI and ACS Style
Hu, P.; Lee, L. Community-Based Link-Addition Strategies for Mitigating Cascading Failures in Modern Power Systems. Processes 2020, 8, 126. https://0-doi-org.brum.beds.ac.uk/10.3390/pr8020126
AMA Style
Hu P, Lee L. Community-Based Link-Addition Strategies for Mitigating Cascading Failures in Modern Power Systems. Processes. 2020; 8(2):126. https://0-doi-org.brum.beds.ac.uk/10.3390/pr8020126
Chicago/Turabian StyleHu, Po, and Lily Lee. 2020. "Community-Based Link-Addition Strategies for Mitigating Cascading Failures in Modern Power Systems" Processes 8, no. 2: 126. https://0-doi-org.brum.beds.ac.uk/10.3390/pr8020126
Note that from the first issue of 2016, this journal uses article numbers instead of page numbers. See further details here.