Self-Synchronized Oscillatory Metabolism of Clostridium pasteurianum in Continuous Culture


Department of Chemical & Biochemical Engineering, The University of Western Ontario, 1151 Richmond St., London, ON N6A 5B9, Canada
*
Author to whom correspondence should be addressed.
Processes 2020, 8(2), 137; https://0-doi-org.brum.beds.ac.uk/10.3390/pr8020137
Submission received: 23 December 2019
/
Revised: 14 January 2020
/
Accepted: 16 January 2020
/
Published: 21 January 2020
(This article belongs to the Special Issue Bioreactor System: Design, Modeling and Continuous Production Process)
Abstract
:By monitoring the real-time gas production (CO2 and H2) and redox potential at high sampling frequency in continuous culture of Clostridium pasteurianum on glycerol as sole carbohydrate, the self-synchronized oscillatory metabolism was revealed and studied. The oscillations in CO2 and H2 production were in sync with each other and with both redox potential and glycerol in the continuous stirred tank reactor (CSTR). There is strong evidence that the mechanism for this is in the regulation of the oxidative pathway of glycerol metabolism, including glycolysis, and points toward complex, concerted cycles of enzyme inhibition and activation by pathway intermediates and/or redox equivalents. The importance of understanding such an “oscillatory metabolism” is for developing a stable and highly productive industrial fermentation process for butanol production, as unstable oscillations are unproductive. It is shown that the oscillatory metabolism can be eradicated and reinstated and that the period of oscillations can be altered by modification of the operating parameters. Synchronized oscillatory metabolism impacted the product profile such that it lowered the selectivity for butanol and increased the selectivity for ethanol. This elucidates a possible cause for the variability in the product profile of C. pasteurianum that has been reported in many previous studies.
Keywords:
butanol; glycerol; Clostridium; pasteurianum; synchronized; oscillatory; metabolism; redox; CSTR1. Introduction
Clostridium pasteurianum is a bacterium that can metabolize glycerol anaerobically as sole carbon and energy source, producing a unique product profile containing 1,3-propanediol (PDO), butanol and ethanol (PBE) [1,2,3]. Due to commercial interest in the conversion of biodiesel-derived glycerol to butanol in a continuous process, the anaerobic metabolism of glycerol by C. pasteurianum requires characterization and optimization for increased butanol yield and volumetric productivity.
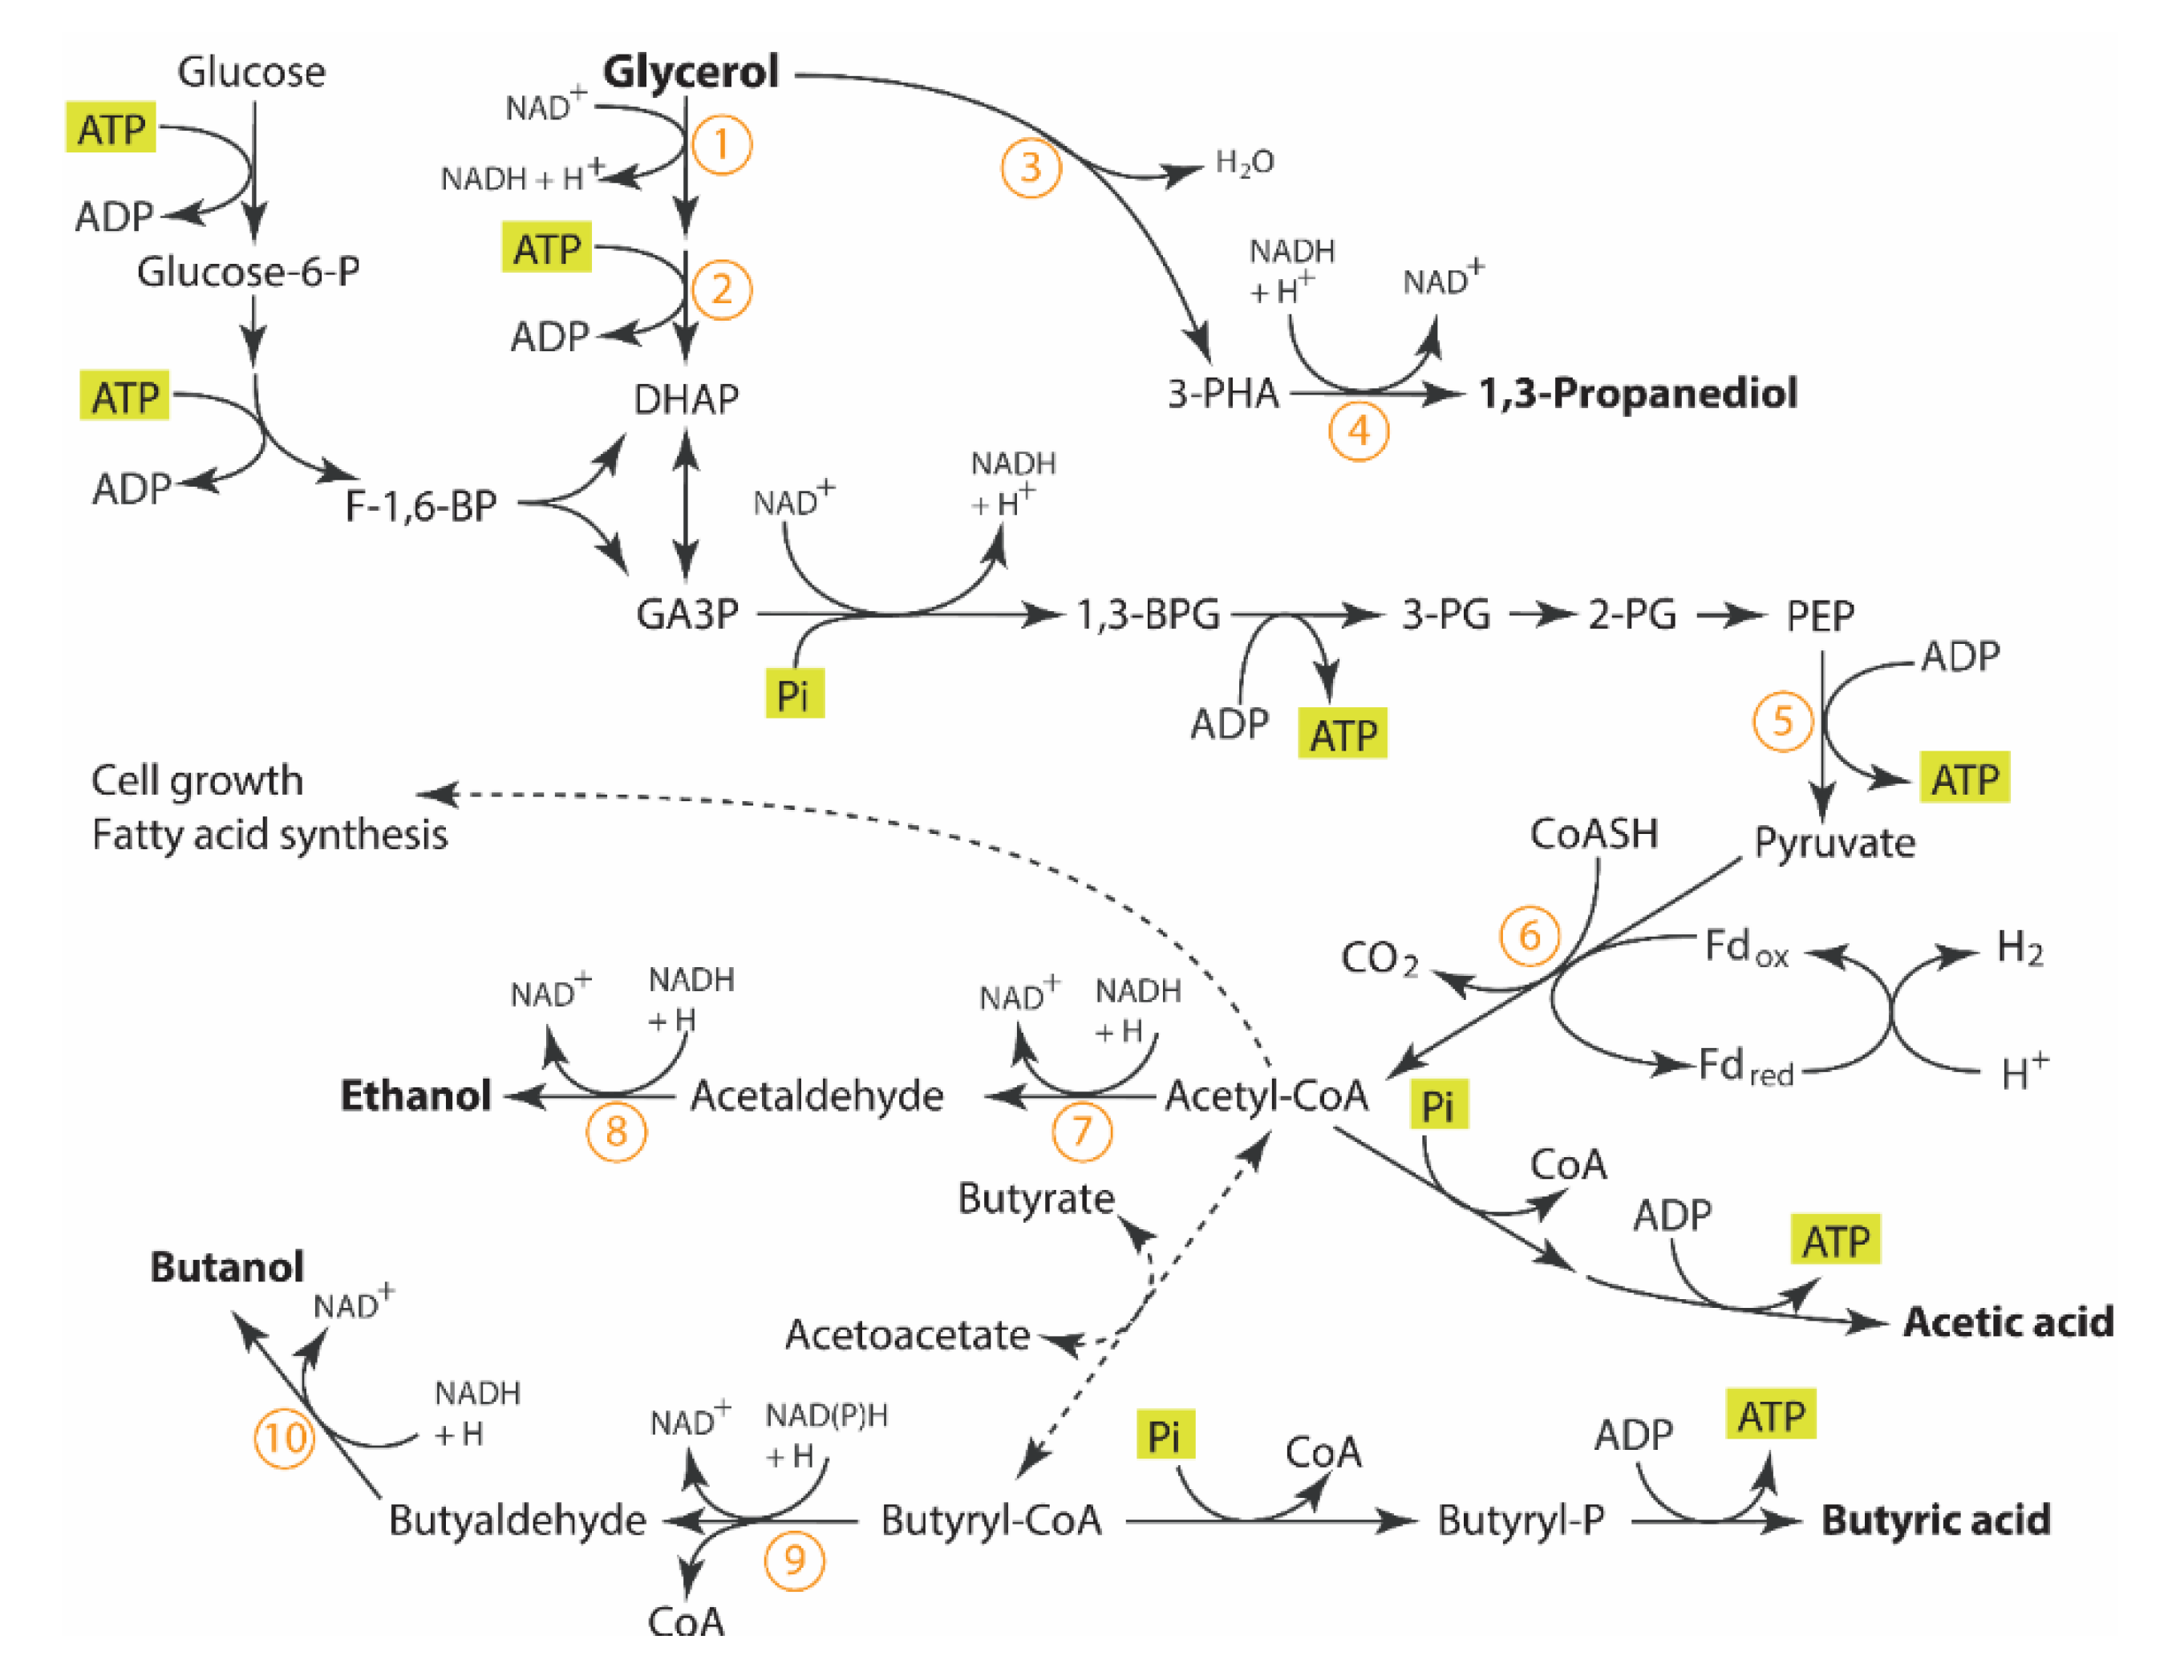
The existence of multiple competitive reductive pathways of C. pasteurianum appears to complicate the understanding of the regulation of glycerol metabolism. Despite recent publications on glycerol utilization by C. pasteurianum for solvent production [4,5], its metabolic regulation for product selectivity from glycerol is still not well characterized [2,6,7]. Biebl et al. (2001) reported that small variations in culture or inoculum conditions could change the product profile considerably [7]. Since that study, there has still not been any clear understanding of how to control the product selectivity. Figure 1 shows the biochemical pathways for glycerol utilization of C. pasteurianum based on recent publications [4,5]. More information on the details of the enzymes involved in these pathways can be reviewed elsewhere [8,9,10].
Metabolically, glycerol undergoes oxidative reactions to form dihydroxyacetone phosphate where it enters into glycolysis and is converted to the central metabolite, pyruvate, with further metabolism of pyruvate to acetyl-CoA [4]. Simultaneously, glycerol can also enter into a “glycolysis-independent” reductive pathway and be converted into PDO in a two-step reaction. It is important to mention that the highly reductive state of glycerol results in twice the amount of reducing equivalents produced in the glycolytic oxidative pathway, compared to fermentation with glucose. Under anaerobic conditions, the ‘competing’ reductive pathways function to regenerate oxidative equivalents for glycolysis. The most active reductive pathways observed in C. pasteurianum are: (1) the production of solvents (ethanol and butanol) in the “glycolysis-dependent” pathway from the central intermediate, acetyl-CoA and (2) the production of PDO through the “glycolysis-independent” pathway. The final electron acceptor is H+, allowing electrons to be removed from the system, when in excess, in the production of hydrogen gas via the hydrogenase enzyme. Thus, the redox balance drives the flux of carbon in the oxidative and reductive pathways and the result is the selective product profile.
The regulation of the oxidative pathway, including glycolysis, involving the level of NAD+ and NADH in the cell (redox balance), has been well studied and this regulation is achieved largely by the enzyme NADH-ferredoxin oxidoreductase which can produce or oxidize NADH, bi-directionally, depending on cellular conditions [11,12]. Jungermann et al. (1973) confirmed that the NADH-ferredoxin oxidoreductase functions reversibly in C. pasteurianum [13]. Furthermore, NADH is itself a competitive inhibitor of ferredoxin-NAD+ reductase activity. In turn, acetyl-CoA is an obligate activator of the NADH-ferredoxin reductase activity. The production of hydrogen gas (H2), with hydrogen protons being the final electron acceptor is facilitated by the hydrogenase enzyme [11,12,13]. Ferredoxin is thus re-oxidized to be available for the next cycle of pyruvate oxidation. The presence of hydrogen gas indicates that glycolysis is active. This regulation of NAD+/NADH by ferredoxin oxidoreductase allows the glycolysis enzymes to function in concert. It is believed to be due to this regulation that C. pasteurianum has been shown to maintain constant intracellular levels of NAD+ and NADH during different growth phases [1,12]. Furthermore, the properties of these enzymes seem to be perfectly adaptive to the nature of the carbon source and its electronegativity.
There has been recent genetic evidence of NADH-sensing proteins in relationship to the regulation of solventogenesis in Clostridia spp. [14,15]. The Rex-family repressors sense redox levels in response to environmental changes by occupying the relevant cognitive operator regions of DNA and through alternative binding to NADH or NAD+, they undergo structural transformations which facilitate the control of DNA expression at the level of transcription. These Rex repressors have been found to be present in aerobic and anaerobic bacteria.
Most of the genes of C. pasteurianum associated with the enzymes in the glycerol oxidative and reduction pathways have been recently identified [4,16,17], however the regulation of glycerol metabolism is still not well understood. Genetic tools have been developed for engineering C. pasteurianum [15,18,19,20]. Schwarz et al. (2017) were able to increase butanol yields by producing mutants with the knockout genes for encoding the iron-coupled hydrogenase (hydA) and the redox response regulator (rex) [15]. The same researchers were able to eliminate PDO production using genetic tools and deletion of the gene responsible for glycerol dehydratase. They postulated that this pathway was essential for growth on glycerol as a carbon source.
To the authors’ knowledge this is the first report of the real-time measurement of off-gas CO2 and H2 production along with redox potential in the continuous fermentation of C. pasteurianum. In this study, high frequency measurement, will be used to study the self-synchronized oscillating metabolic activity that has been revealed, to achieve a better understanding of the regulation.
It is typical for many biological systems to respond to environmental triggers of a physical or chemical perturbation in unison, thus synchronized their oscillatory behavior of network components in response to an environmental stimulus [21]. For example, yeast spontaneously synchronize their cellular respiration in cycles between periods of increased oxygen consumption (oxidative phase) and decreased oxygen consumption (reductive phase) [21].
There have only been a few reports of oscillating metabolic activity in C. pasteurianum. Gallazzi et al. (2015) reported that they could not achieve a steady state with suspended cells of C. pasteurianum in continuous culture, but instead, periodic, quite regular oscillations were observed with a peak to peak period of roughly 50 hours [22]. It was speculated to be caused by butanol toxicity. Similar oscillations, with a period of roughly 25 h, were reported by Clarke et al. (1988) in continuous culture of suspended C. acetobutylicum [23]. In this study, the oscillations were believed to be associated with alternating growth and sporulation phases and the related shift from primary to secondary metabolism. Oscillations for C. acetobutylicum ATCC 824 with a period of roughly 20–40 h were reported and believed to be caused by product toxicity [24]. In this case, it was suggested that a plausible cause was a periodic accumulation and washing-out of n-butanol, which perhaps was inducing a periodical decrease and increase in culture growth.
Many reports have documented steady self-synchronized oscillatory phenomenon in the yeast Saccharomyces cerevisiae under certain conditions [25,26,27]. Glycolysis is an ancient pathway common to yeast and bacteria. In yeast, these oscillations are manifested through the oxygen uptake rate, CO2 evolution rate, dissolved oxygen tension and the concentrations of the carbon source, the product (ethanol), acetate and the glycolytic metabolites, NADH and ATP. In particular, the concentration of glycolytic metabolites, NADH and ATP, oscillated and could be synchronized by the addition of various substances which they claimed to act as intracellular “signalers”, such as acetaldehyde [27].
Rather than maximizing butanol productivity, the goal of this study was to investigate this phenomenon of self-synchronized oscillatory metabolism in continuous culture of C. pasteurianum and its implications on industrial bio-processing.
2. Materials and Methods
2.1. Chemicals
All chemicals were purchased from Sigma Aldrich (St. Louis, MO, USA) unless otherwise noted. Peptone and beef extract were purchased from BD-Becton, Dickinson and Company (Baltimore, MD, USA). Soluble starch, sodium acetate, nickel chloride, zinc chloride and copper chloride were purchased from Alfa Aesar (Ward Hills, MA, USA). Dextrose and glycerol was purchased from Fisher Chemicals (Ottawa, ON, Canada). Ammonium sulfate, calcium chloride, magnesium sulfate, ferrous chloride, hydrochloric acid, sodium molybdate and cobalt chloride were purchased from EMD Millipore (Gibbstown, NJ, USA). Potassium phosphate mono- and di-basic, were purchased from Caledon Laboratory Chemicals (Georgetown, ON, Canada).. Boric acid, yeast extract, ferrous sulfate and sodium chloride were purchased from Amresco (Solon, OH, USA). Manganese chloride was purchased from JT Baker (Phillipsburg, NJ, USA). All gases were purchased from Praxair, London, ON, Canada.
2.2. Microorganisms and Media
C. pasteurianum DSM 525 was purchased from DSMZ (Braunschweig, Germany). The following reinforced clostridium media (RCM) was used for all seed cultures (amounts per litre of deionized water): peptone, 10.0 g; beef extract, 10.0 g; yeast extract, 3.0 g; glucose, 25.0 g; NaCl, 5.0 g; soluble starch, 1.0 g; sodium acetate, 3.0 g; pH adjusted to pH 6.8. The following production media was used for all continuous bioreactor fermentations (amounts per litre of deionized water): KH2PO4, 0.5 g; K2HPO4, 0.5 g; (NH4)2SO4, 5 g; MgSO4·7H2O, 0.2 g; CaCl2·2H2O, 0.02 g; FeSO4, 0.10 g; yeast extract, 1.0 g; glycerol, 20–40 g, as specified; trace element solution (SL7), 2 mL; Antifoam 204 (Sigma A6426), 0.2 mL. The following trace element solution (SL7) was used for all bioreactor trials (amounts per litre of deionized water): FeCl2·4H2O, 1.5 g, dissolved in 10 mL HCl solution (25% solution); CoCl2·6H2O, 0.19 g; MnCl2·4H2O, 0.1 g; ZnCl2, 0.07 g; H3BO3, 0.062 g; Na2MoO4·2H2O, 0.036 g; NiCl2·6H2O, 0.024 g; CuCl2·2H2O, 0.017 g. It should be noted that CaCO3 (buffer) which releases CO2 and interferes with the measurement of metabolic CO2 production rate was not used in any bioreactor trials.
2.3. Fermentation Parameters
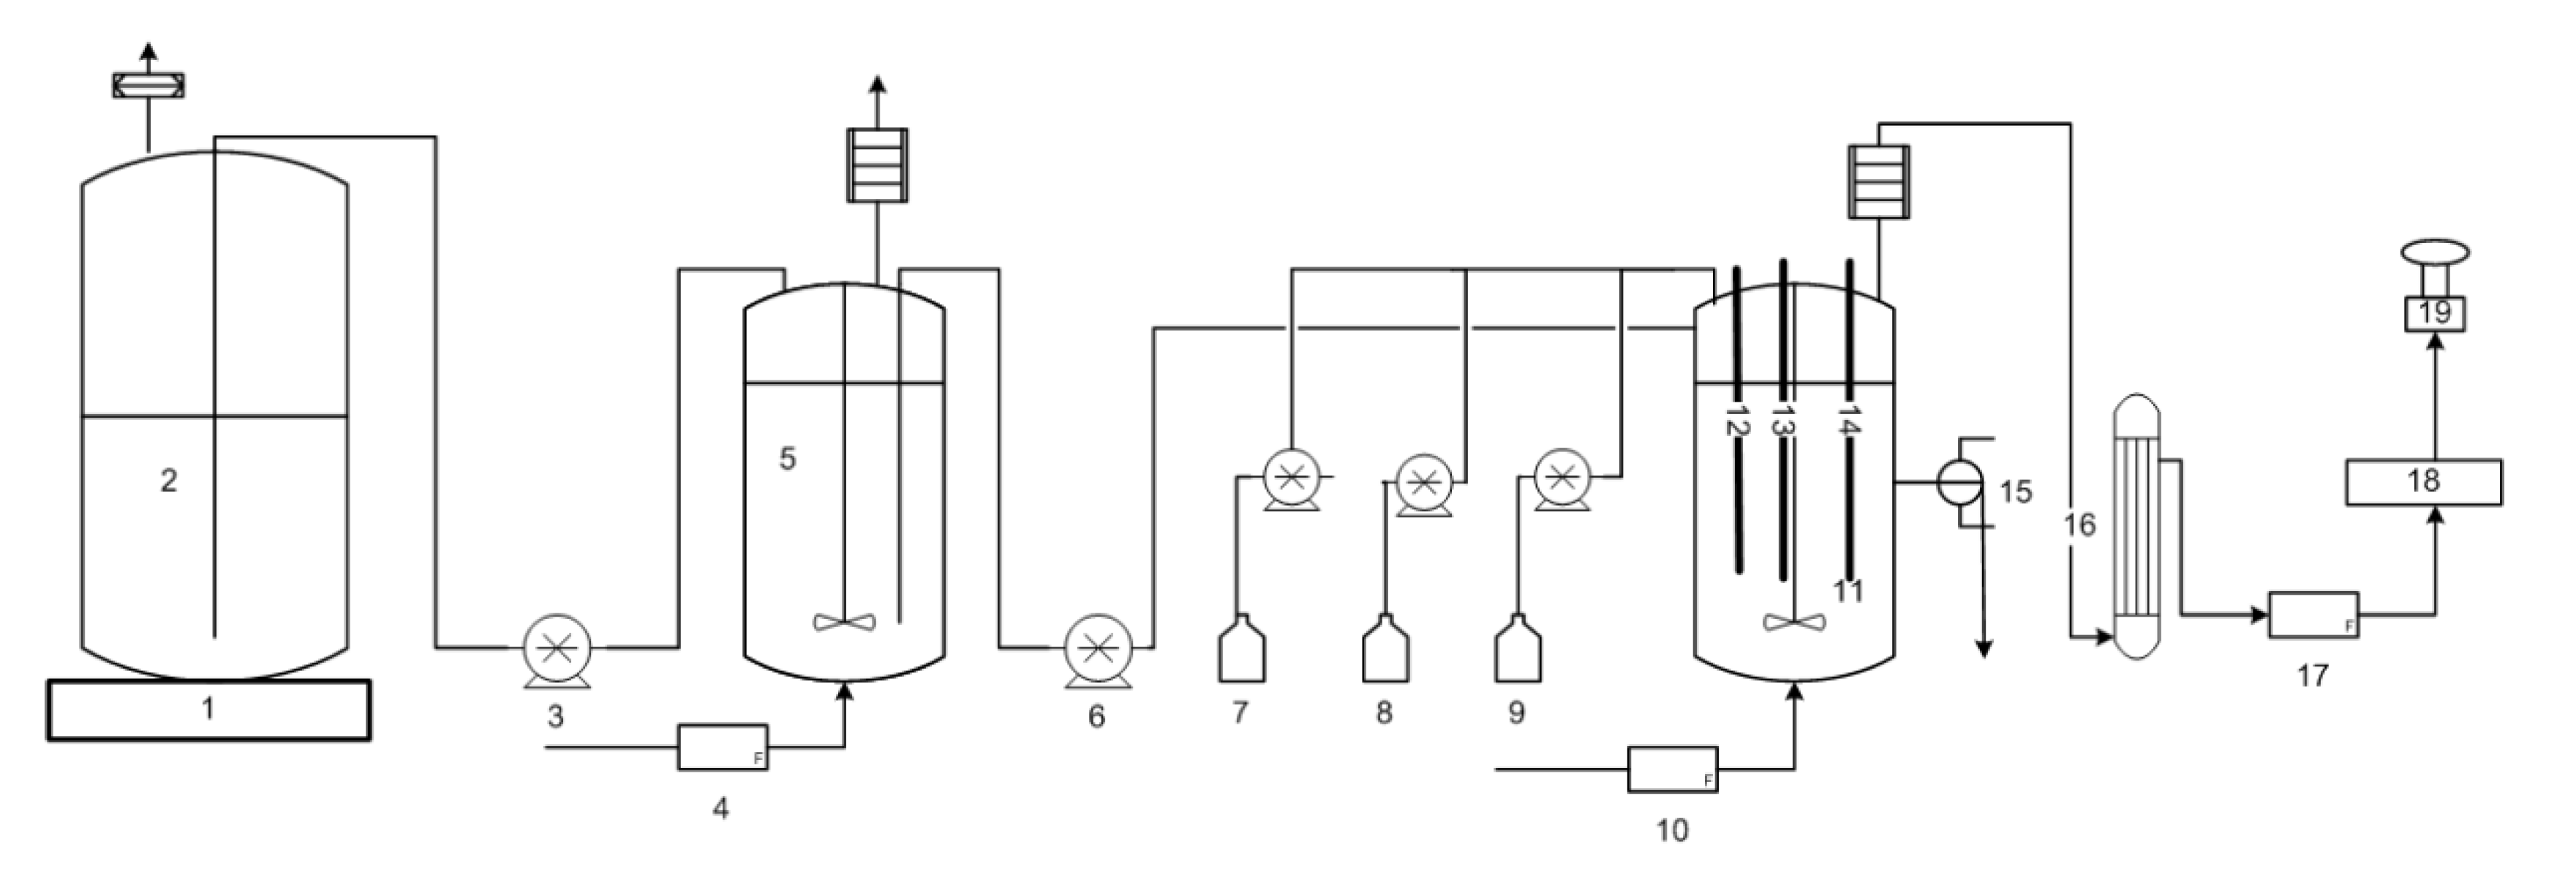
The main continuous bioreactor was a New Brunswick Scientific, Microferm® Fermenter (14 L) purchased from Pegasus Scientific Inc. (Rockville, MD, USA) with a working volume of approximately 5 L. The exact volume was measured in each trial and may vary slightly from one trial to the next. The continuous fermenter was equipped to control the temperature and agitation. The controller of an Infor HT bioreactor (Infor HT, Bottmingen/Basel, Switzerland, model: LabFors 4), used as the feed vessel, was also used to control the pH, gas sparging, and data logging of the continuous bioreactor. The volume in the bioreactor was controlled and remained constant in all trials using a passive outlet port with a pressure control device, sustaining a dynamic liquid seal to prevent both backflow of liquid and off-gas entrainment while maintaining sterility and an anaerobic environment. The pH of the main continuous bioreactor was controlled using 3M KOH/1.5M H2SO4 to the desired pH value (5.0, 5.3, 5.6 or 5.9 as specified) ± 0.02 using a PID controller. The temperature was always controlled to 35 °C unless otherwise specified with agitation at 150 rpm. Pure nitrogen was used as sparging gas at a rate of 0.60 L min−1 to promote the anaerobic environment and to ensure a minimum flow rate required for off-gas analysis. The inlet gas flow was controlled using a Red-y series flow controller (Vögtlin Instruments AG, Aesch BL, Switzerland, model: GSC-C3SA-BB12, 0–10 L/min). The off-gas passed through a condenser to remove moisture before entering the off-gas mass gas flow meter and analyzers for carbon dioxide (CO2) and hydrogen (H2) (see details in analytical section). An Aalborg thermal mass gas controller (Aalborg, model GFC171S, 0-5 LPM) and an Aalborg totalizer input/output (model TIOS-010008) were used to measure and log the total off-gas volumetric flow in real time (Aalborg, Orangeburg, NY, USA). Figure 2 is the CSTR apparatus.
Start-up consisted of a batch mode using 4.5 L of production medium which was autoclaved directly in the continuous fermenter, followed by sparging the liquid medium with nitrogen for a minimum of 30 min at 1.0 L·min−1, 400 rpm, 35 °C, prior to inoculation. The bioreactor pH was adjusted to the desired value prior to and immediately after inoculation of seed culture (500 mL) into the batch mode. The continuous fermentation portion commenced with feeding when the off-gas CO2 production reached its maximum peak in the batch phase, approximately 8–10 h after inoculation of the batch mode. Unless otherwise noted, the production medium was fed using a peristaltic pump (Cole-Parmer, Vernon Hills, IL, USA, model: Masterflex 7523-70) to achieve a dilution rate of 0.06–0.10 h−1 as specified.
The feed vessel was a 7 L bioreactor (Infor HT, Bottmingen/Basel, Switzerland, model: LabFors 4) which was constantly stirred at 200 rpm, cooled to 15 °C and sparged with nitrogen at 0.2 L min−1. It was used as a holding tank to supply feed to the continuous bioreactor. Media was prepared in 20 L carboys, autoclaved and transferred while stirring to the feed vessel using a peristaltic transfer pump (Cole-Parmer, Vernon Hills, IL, USA, model: 7553-10). Feed was prepared daily to replenish the feed tank. When changes were made to the feed, the feed vessel could be depleted to a level of 100–200 mL before replenishing. The carboys and bioreactors were equipped with two-way sterile vent filters.
Seed cultures were prepared in an anaerobic chamber (Plas-Labs, Lansing, MI, USA, model: 855-ACB-EXP). The chamber gas mixture was 10% H2, 5% CO2 balance N2. The bioreactor was inoculated with seed culture of 10% v/v, prepared using a three-step scale-up protocol initiated from 500 µL glycerol stocks of C. pasteurianum (DSMZ 525) stored at −80 °C and transferred at a rate of 10% v/v in exponential growth phase, having an optical density at 600 nm of 1.2-1.4 AU at each transfer stage.
2.4. Analytical Methods
The off-gas was analyzed for CO2 concentration (% v/v) using a continuous emissions analyzer (Servomex, MD, USA, model: 4900C1) with an infrared CO2 transducer (1520-IR, 0–25%). A Veriteq data logger (Veriteq Instruments, Inc., British Columbia, Canada) with software (Spectrum) was used to log every minute the data on-line in real time. The off-gas was analyzed for H2 concentration (% v/v) using a continuous emissions analyzer (BlueSens, Herten, Germany, model: BCP PA Sensor, 0–10% v/v, 4–20 mA). The pH was controlled using a Hamilton EasyFerm Plus K8 325 probe and transmitter with PID (Hamilton, NV, USA). The redox was monitored using a Mettler Toledo Ingold probe (model: PT4805-DPAS-SC-K8S/325) and transmitter (Mettler Toledo, ON, Canada). The dry cell weight (DCW) was performed gravimetrically in duplicate at the same time and on the same liquid samples that were removed from the bioreactor for HPLC analysis.
The inlet gas flow, off-gas H2 concentration, redox potential, pH, temperature, rpm, gas mix were all measured every minute and logged to a PC in real time using the multi fermenter control system and software (Iris V5 PRO for LabFors, 65605, Infor HT, Bottmingen/Basel, Switzerland).
Samples were taken from the CSTR and analyzed after 5 residence times (54 h) from each variable perturbation. During times of synchronized oscillatory metabolism, samples were taken at the maxima and minima in gas production, equally weighted and averages and standard deviations calculated. Liquid samples were taken directly from the bioreactor for analysis by HPLC of the soluble components: glycerol, acetic acid, 1,3-propanediol, ethanol, butyric acid and butanol as well as for dry cell weight (DCW). For HPLC, samples were filtered using 0.2 μm cellulose acetate filters and diluted to have a concentration within the range of the individual calibration curves of the individual components. For this, the Breeze 2TM HPLC System from Waters was used (Waters Corp. Mississauga, ON, Canada), including an autosampler (Waters model 2707), a refractive index detector RID (Waters model 2414) and an isocratic pump (Waters model 1515). The column used was an Agilent HiPlex-H column (Agilent Technologies, Mississauga, ON, Canada), 7.7 × 300 mm (8 µm) operated at 35 °C. The injection volume was 20 μL. The refractive index detector (RID) was controlled at 40 °C. The liquid flow rate was 0.8 mL min−1 using 5.0 mM H2SO4 as mobile phase.
3. Results
3.1. Effect of Feed Glycerol Concentration on Self-Synchronized Oscillatory Metabolism
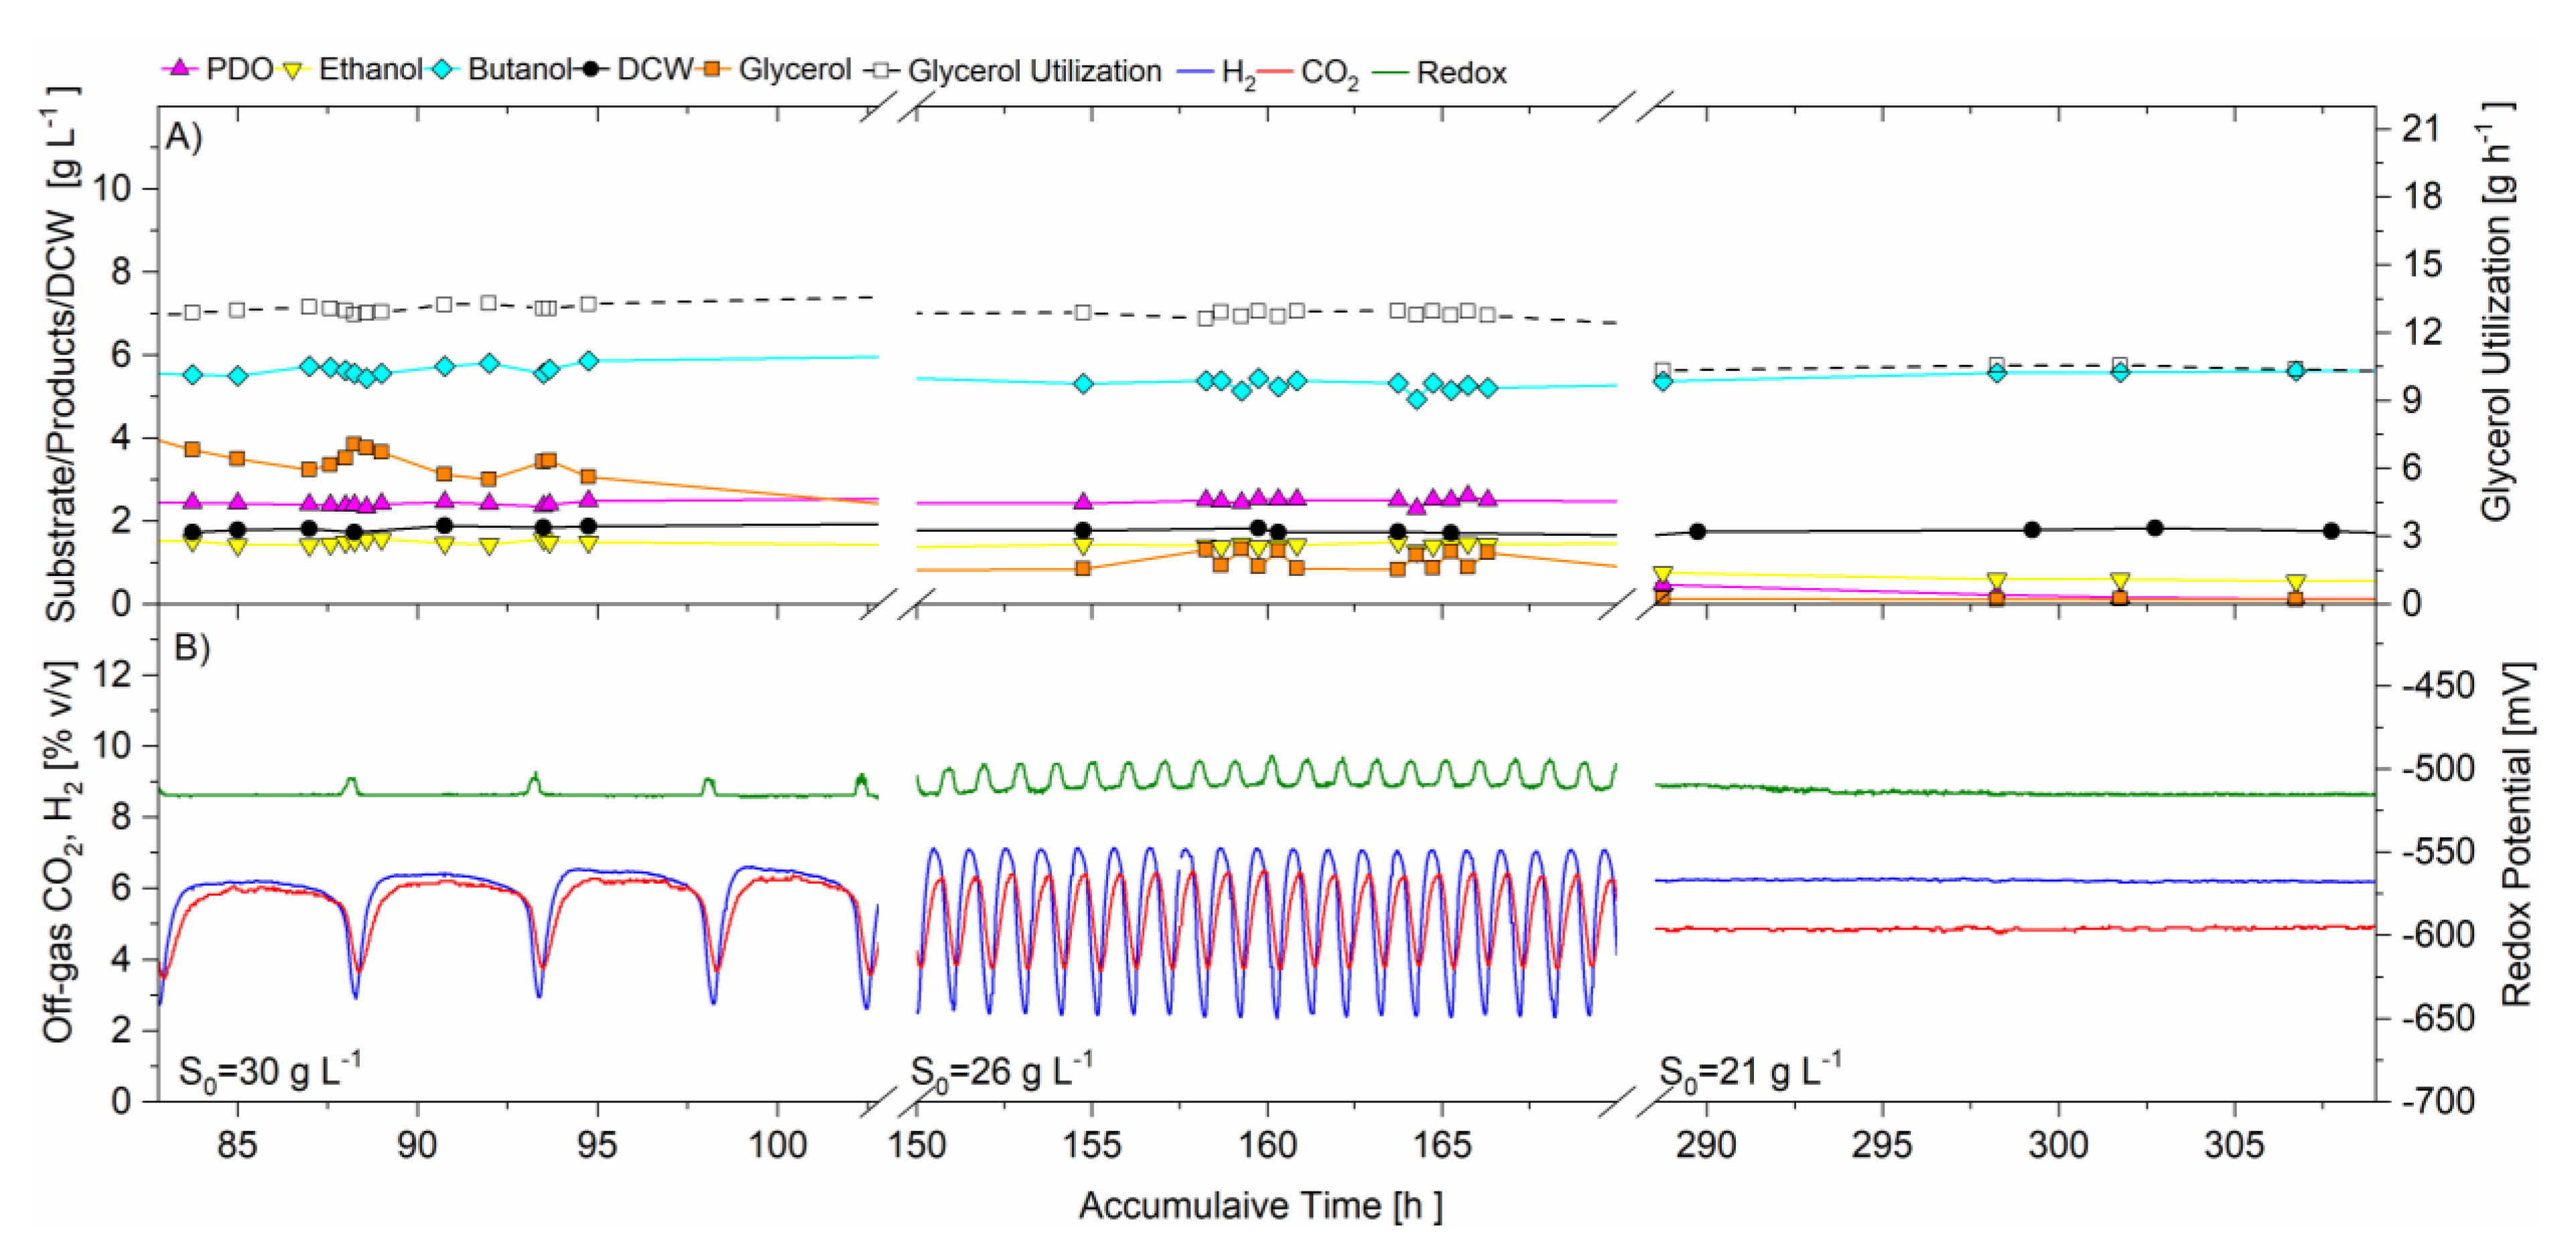
A continuous fermentation trial was performed, operating for a total of 528 h at constant operating conditions, to investigate the effect of feed glycerol concentration on the self-synchronized oscillatory metabolism. The CSTR was operated as described in the materials and methods section, with a pH of 5.0, the total bioreactor volume was 5.335 L, the feed flow rate was 8.21 mL·min−1 (0.493 L h−1), resulting in a dilution rate of 0.092 h−1. The feed glycerol concentration was initially 29.92 ± 0.07 g·L−1 over the first 114 h, followed by 26.4 ± 0.7 g·L−1 from 114 to 206 h, followed by 21.0 ± 0.8 g·L−1 from 206 to 470 h.
Figure 3 is the graph showing portions of the data with time breaks, to illustrate the oscillations at the three operating conditions with feed glycerol concentration as single variable, where Figure 3A is the off-line HPLC average data of samples taken directly from the CSTR and analyzed (PDO, butanol, ethanol, glycerol) as well as dry cell weight (DCW) and the glycerol utilization rate. Figure 3B is the graph of the real-time redox potential and off-gas (H2 and CO2) concentrations.
In this trial, all three on-line signals (CO2, H2, redox) resulted in a self-synchronized oscillating pattern with regular frequency shortly after 57 h from inoculation of the batch phase and continued for the two highest glycerol concentrations (29.92 to 26.4 g·L−1) from 60 to 114 and 114 to 206 h., respectively. For the feeding of the 29.92 g·L−1 glycerol substrate from 60 to 114 h, the peak to peak period in gas production was approximately 5.1 h, whereas for the glycerol feed concentration of 26.4 g·L−1, the period was reduced to 1.0 h. When the feed glycerol was changed from 26.4 to 21.0 g·L−1, at 206 h, there was a short transition period, after which CO2, H2 and redox oscillations stabilized, and the three signals became flat lines without oscillating pattern. The average redox potential was maintained and unchanged for the entire trial, ranging between −509 ± 7 to −515.8 ± 0.5. Table 1 summarizes the average data collected during the sampling times at each operating condition. The glycerol concentration in the CSTR was also found to oscillate, such that a glycerol concentration minima (indicating depletion) coincided with CO2 and H2 concentration maxima and the most electronegative values for redox potential.
The average cell concentration did not change significantly during these three feed concentrations at constant dilution rate, even when oscillatory metabolism prevailed. When oscillatory metabolism resulted at the higher two feed concentrations (29.92 and 26.4 g·L−1), the specific glycerol utilization rate was the same, 1.35 ± 0.03 and 1.41 ± 0.04 g·g−1 h−1, respectively, indicating that substrate was not limiting. For the lower concentration of glycerol feed (21.0 g·L−1), the specific glycerol utilization rate decreased to 1.09 ± 0.03 g·g−1 h−1, coincidental with the cessation of the oscillatory metabolism, indicating that there may have been substrate limitation. There was no significant change in product selectivity, or total solvent production for the two highest feed concentrations when oscillatory metabolism prevailed, despite the fact that for the transition from 29.92 to 26.4 g·L−1, the oscillatory CO2, H2 and redox signals increased their frequency. However, when the metabolic oscillations ceased (240–340 h), coincidental with the lower specific glycerol utilization rate, the total solvent production decreased from 9.1 ± 0.2 to 6.3 ± 0.1 g·L−1, and the butanol selectivity increased from 0.58 ± 0.02 to 0.89 ± 0.04 g·g−1. At the same time, the ethanol and PDO selectivities decreased from 0.158 ± 0.006 to 0.09 ± 0.02 and 0.26 ± 0.02 to 0.02 ± 0.02 g·g−1 respectively. In fact, PDO production ceased when the system no longer oscillated in its metabolism under these operating conditions.
Three independent signals responded to the perturbations in feed glycerol concentration at the same time, remaining in unison. The unison of the CO2 and H2 concentration data signals indicates that their production was coupled, meaning the pathways to their production are interdependent, and their activity was coordinated. Throughout the trial, when gas production was at maxima (highest concentrations), redox potential was at minima (most electronegative), indicating that glycolysis was most active with maximum levels of NADH concentration, and vice versa. Further, glycerol concentration in the CSTR also oscillated in unison with redox potential, H2 and CO2 production, indicating that the flux of carbon in the oxidative metabolism of glycerol, including glycolysis, was also oscillating in unison, likely in response to fluctuating enzyme activity through inhibition and activation perhaps due to pathway intermediates and/or redox equivalents, however this has not been proven. It can be stated that the change from “oscillatory” to “steady state” metabolism at 240 h, when feed glycerol concentration was reduced to 21.0 g·L−1, resulted in a dramatic change to the product selectivity. The average redox potential did not change significantly over the course of operations for 528 h, suggesting that the homeostasis of redox potential may be highly regulated.
To the authors’ knowledge, there has only been a few reports of oscillatory metabolism in Clostridia spp. Gallazzi et al. (2015) reported periodic, quite regular oscillations with a peak to peak period of roughly 50 h using free cells of C. pasteurianum [22], whereas Clarke et al. (1988) reported oscillatory metabolism with a peak to peak period of roughly 25 h in continuous culture of suspended C. acetobutylicum [23]. Neither research study applied monitors for measuring redox potential or CO2 and H2 gas production. In comparison, in this current study, the oscillatory peak to peak periods were much shorter, ranging from 20 min to 5 h.
In summary, for this trial investigating the effect of feed glycerol concentration, the self-synchronized oscillatory metabolism coincided with higher specific glycerol utilization rates, higher PDO and ethanol selectivities and lower butanol selectivity. This “non-steady state” oscillation could be a problem for an industrial fermentation process, where high glycerol feed concentrations would be desirable for high butanol productivity.
3.2. Effect of Butanol Addition on Self-Synchronized Oscillatory Metabolism
The CSTR was maintained at the same operating conditions for a further 126 h, with the feed glycerol concentration of 20–21g·L−1, to test the hypothesis that butanol toxicity was causal for the self-synchronized metabolic oscillations associated with the higher feed glycerol concentrations. For this purpose, the feed to the CSTR was spiked with butanol, at 0.5 g·L−1, from 348 to 409 h and at 1.5 g·L−1 from 409 to 470 h.
With butanol supplementation, the butanol concentration in the bioreactor increased to levels exceeding those which resulted with the higher feed glycerol concentration, when synchronized metabolic oscillations were present. Table 1 shows the butanol concentration produced only. No oscillations were observed with butanol addition at either level. Therefore, the butanol concentration in the bioreactor was deemed to not be causal for the self-synchronized metabolic oscillations at higher feed glycerol concentrations.
It should be noted from Table 1 that for the same feed glycerol concentration of 20–21 g·L−1, between 206 to 470 h, both solvent production and cell concentration decreased from 6.3 ± 0.1 to 5.5 ± 0.2 g·L−1 and from 1.8 ± 0.1 to 1.49 ± 0.09 g·L−1, respectively, coincidental with the cessation of PDO production. The decrease in solvent production could be due to the decrease in cell concentration. Since Schwarz et al. (2017) postulated that this pathway was essential for growth on glycerol as a carbon source [15], the decrease in cell concentration may have been due to the lack of activity of the PDO pathway. Since butanol was added at 0.5 g·L−1 from 348 to 409 h and at 1.5 g·L−1 from 409 to 470 h, the decrease in cell concentrations could have also been due to butanol toxicity. This is speculated to be unlikely due to the fact that the higher butanol concentrations at the higher glycerol feed rate did not have the same effect on cell concentration. This could be further investigated.
3.3. The Effect of pH on Self-Synchronized Oscillatory Metabolism
The CSTR was operated for 314 h at constant operating conditions, with inducing a high specific glycerol utilization rate, allowing for the study of the effect of pH on the self-synchronized oscillatory metabolism. The average feed glycerol concentration was 40–41 g·L−1, the bioreactor volume was 5.042 L, the feed flow rate was 7.95 mL·min−1 (0.477 L h−1) and the resulting dilution rate was 0.095 h−1. In this trial, the single variable change was the operating pH which was initially controlled at 5.3 from 0 to 177 h, at 5.6 between 177 to 240 h and at 5.9 from 240 to 314 h.
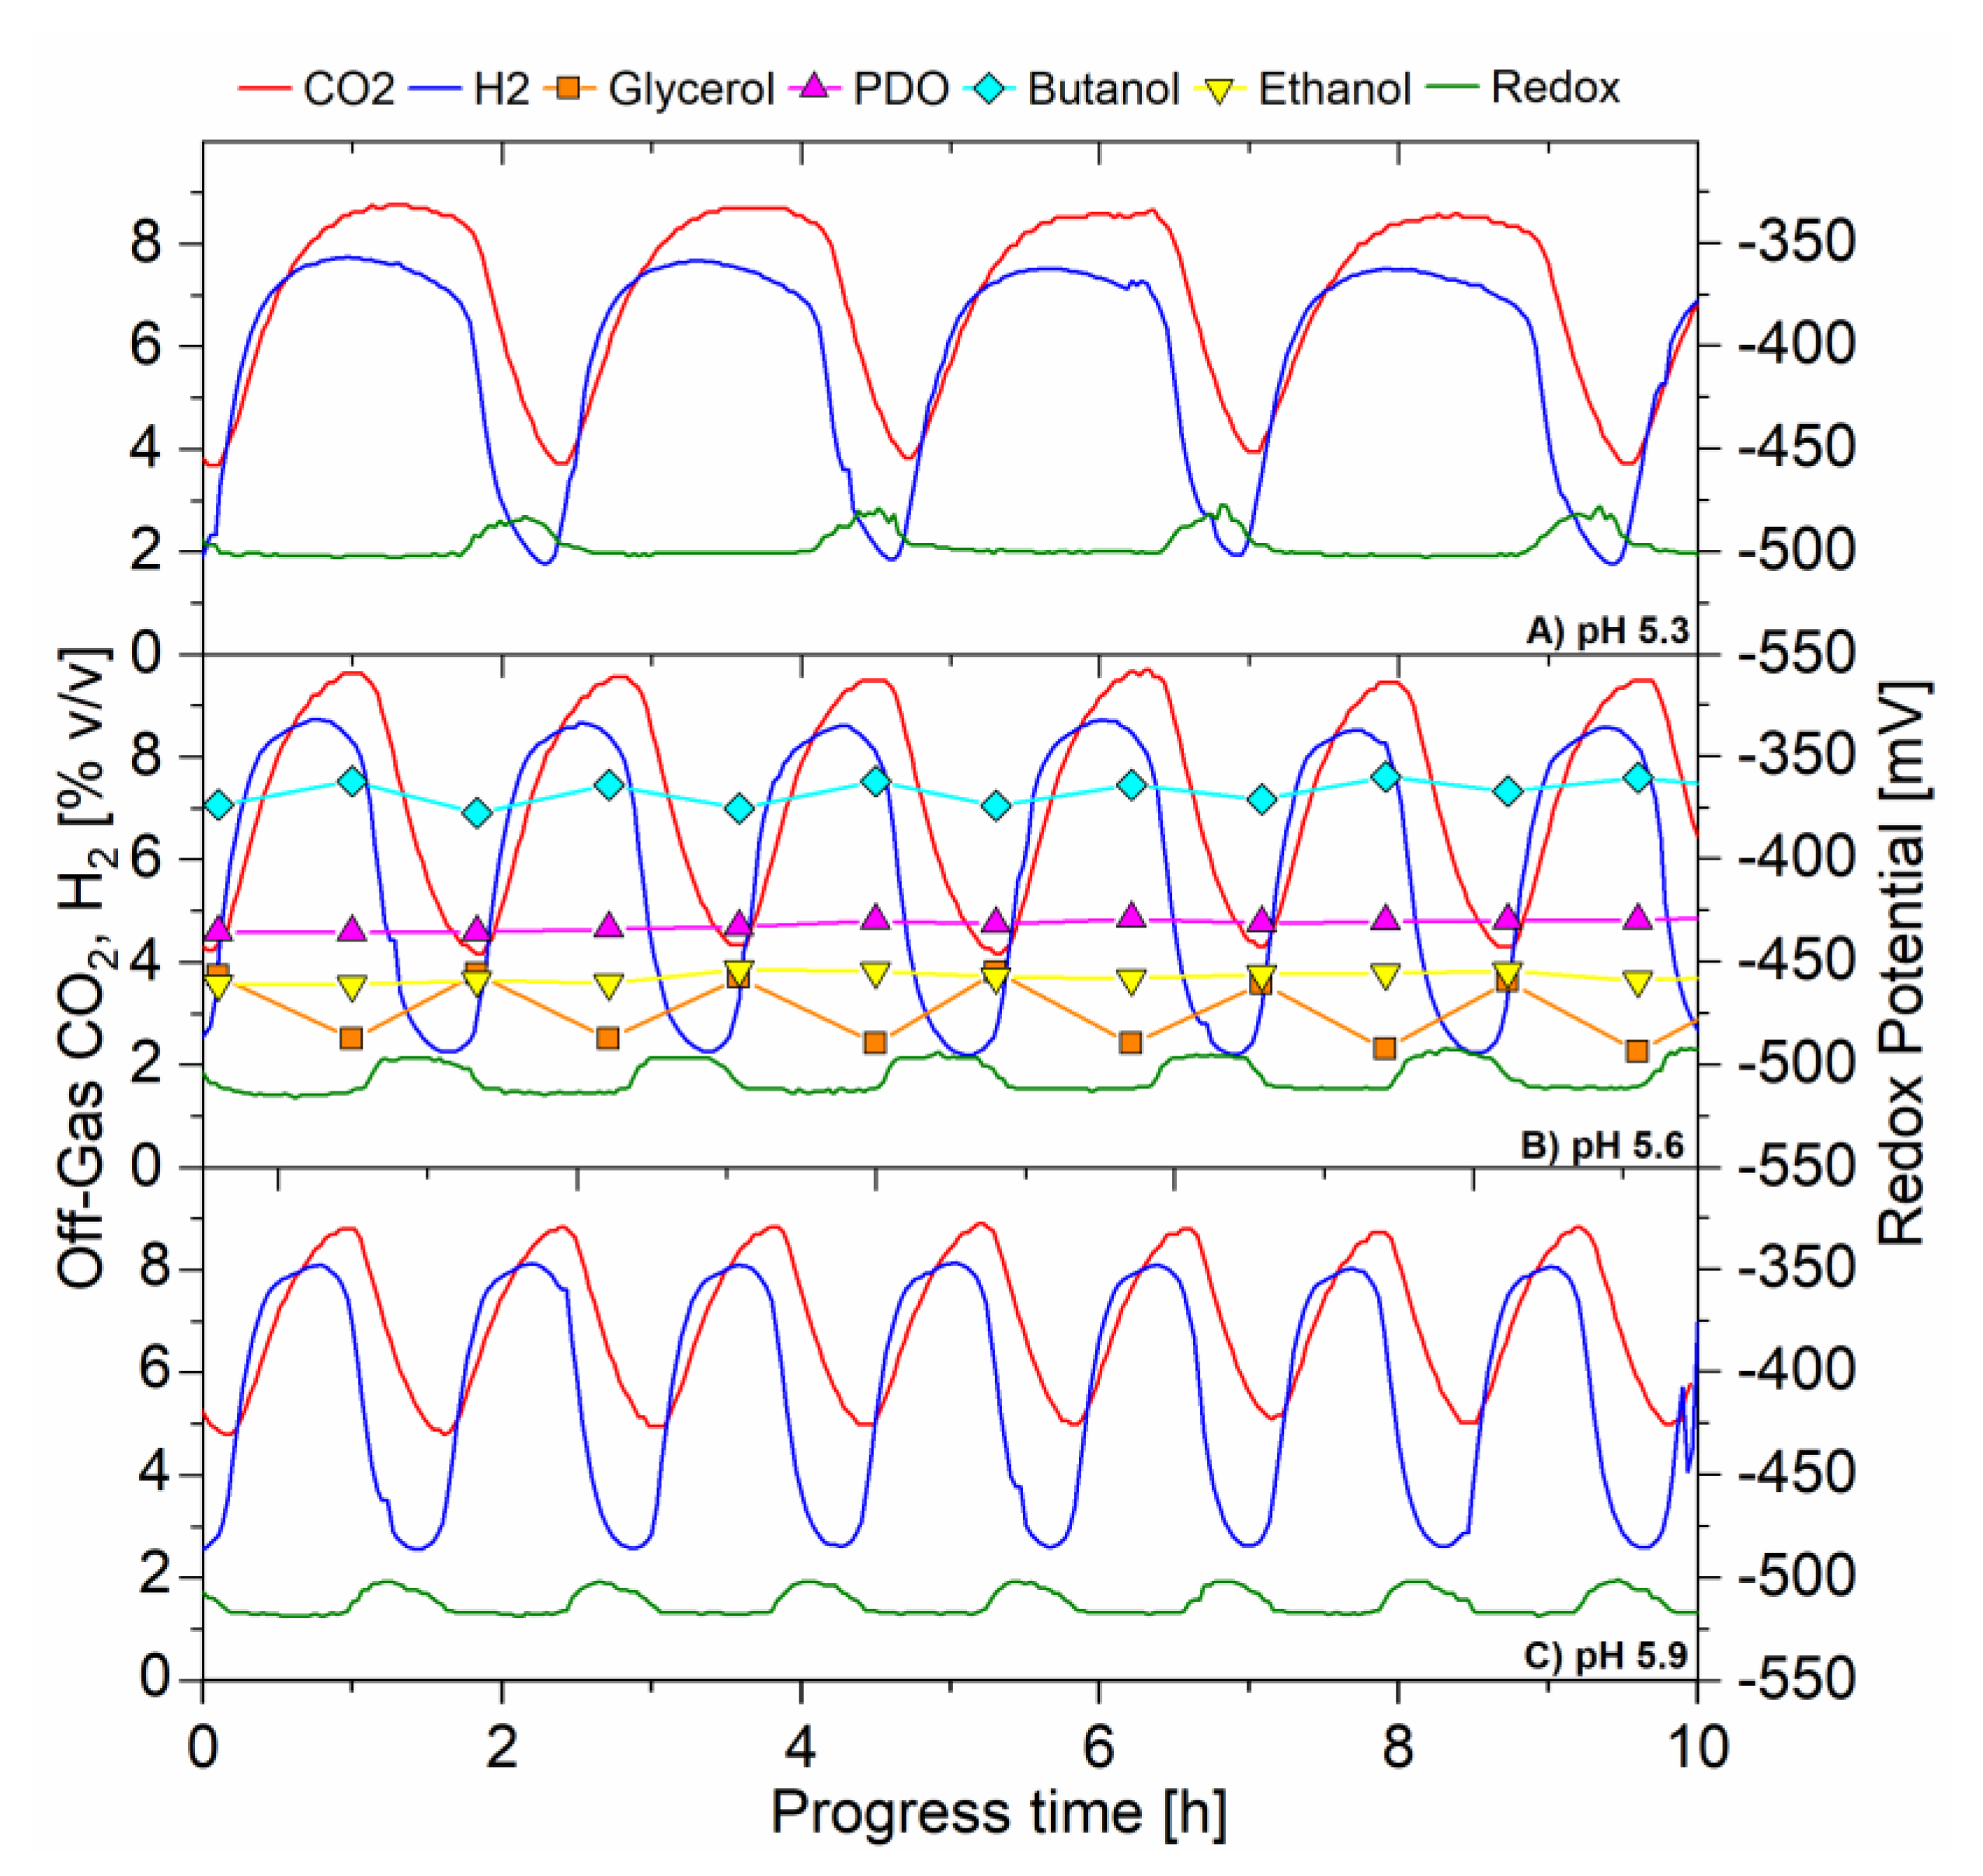
The real-time signal of off-gas CO2 and H2 concentration as well as the redox potential resulted in self-synchronized oscillations, sinusoidal-like in appearance and remained continuous and uninterrupted from 57–314 h. During the oscillations, the CO2 concentration ranged between 3.0 to 9.5% v/v, H2 concentration ranged between 1.8 to 8.8% v/v and redox potential ranged between −542 to −470 mV with an average that was unchanged. For the pH trial, the average glycerol utilization rate ranged between 17.3 ± 0.5 to 18.0 ± 0.04 g·h−1, (specific glycerol utilization 1.42 ± 0.02 to 1.53 ± 0.03 g·g−1·h−1). The total solvent production ranged between 15.4 ± 0.4 to 15.8 ± 0.8 g·L−1. The product selectivities for PDO, ethanol and butanol ranged between 0.29 ± 0.01 to 0.301 ± 0.004; 0.17 ± 0.01 to 0.24 ± 0.01; and 0.46 ± 0.01 to 0.54 ± 0.01, respectively. This study showed that, under these conditions with high specific glycerol utilization and oscillatory metabolism, there were high selectivities for PDO and ethanol and lower selectivity for butanol.
Figure 4A–C illustrates the change in period of the oscillations in off-gas concentrations (CO2 and H2) and redox potential, with increasing the controlled operating pH (5.3, 5.6 and 5.9 respectively) in the CSTR. The three signals, generated from independent analyzers, always oscillated in unison. The off-gas CO2 and H2 concentrations peaked (maxima) when the redox signal was at its most electronegative point. The unison of the CO2 and H2 concentration data signals indicates their production was coupled. From this Figure, it is also shown that the peak to peak period shortened when the operating pH increased. The average peak to peak period during pH 5.3, 5.6, and 5.9 was 150, 100, and 78 min respectively.
The time scale is amplified in Figure 4 to show the relationships between fermentation products, CO2 and H2 gas production, redox potential and CSTR glycerol concentration. It is shown that the glycerol concentration was highest (accumulating in the bioreactor) when off-gas CO2 and H2 concentrations were at minima and redox potential was most electropositive (low NADH) and vice versa. Glycerol was lowest (being consumed) when off-gas concentrations were at maxima (glycolysis very active) and redox potential most electronegative (high NADH).
The unison of CO2 and H2 gas production and redox potential, in unison with glycerol accumulation and consumption indicates that the flux of carbon in the oxidative pathway for the break-down of glycerol including glycolysis, was oscillating, perhaps due to inhibition and activation of enzymes, yet to be confirmed. Johnson and Rehmann, (2016) investigated the effect of pH in batch fermentation of C. pasteurianum with glycerol as sole carbohydrate. The authors found that as the pH increased from 4.7 to 5.9, there was an increase in the rate of glycerol utilization, CO2 production, cell growth and the rate of butanol and PDO production [1]. Therefore, it is suggested that in this current study, the increase in pH in the CSTR, which resulted in the increase in frequency of the oscillations, was likely due to a faster metabolic rate. This may indicate that the higher frequency oscillating metabolism represented a faster response to inhibiting and activating compounds (e.g., reducing equivalents and/or pathway intermediates) accumulating in the CSTR during active glycolysis, and washing out during inactive glycolysis, however this needs further investigation to be proven.
3.4. Effect of Dilution Rate on Synchronized Oscillatory Metabolism of C. pasteurianum
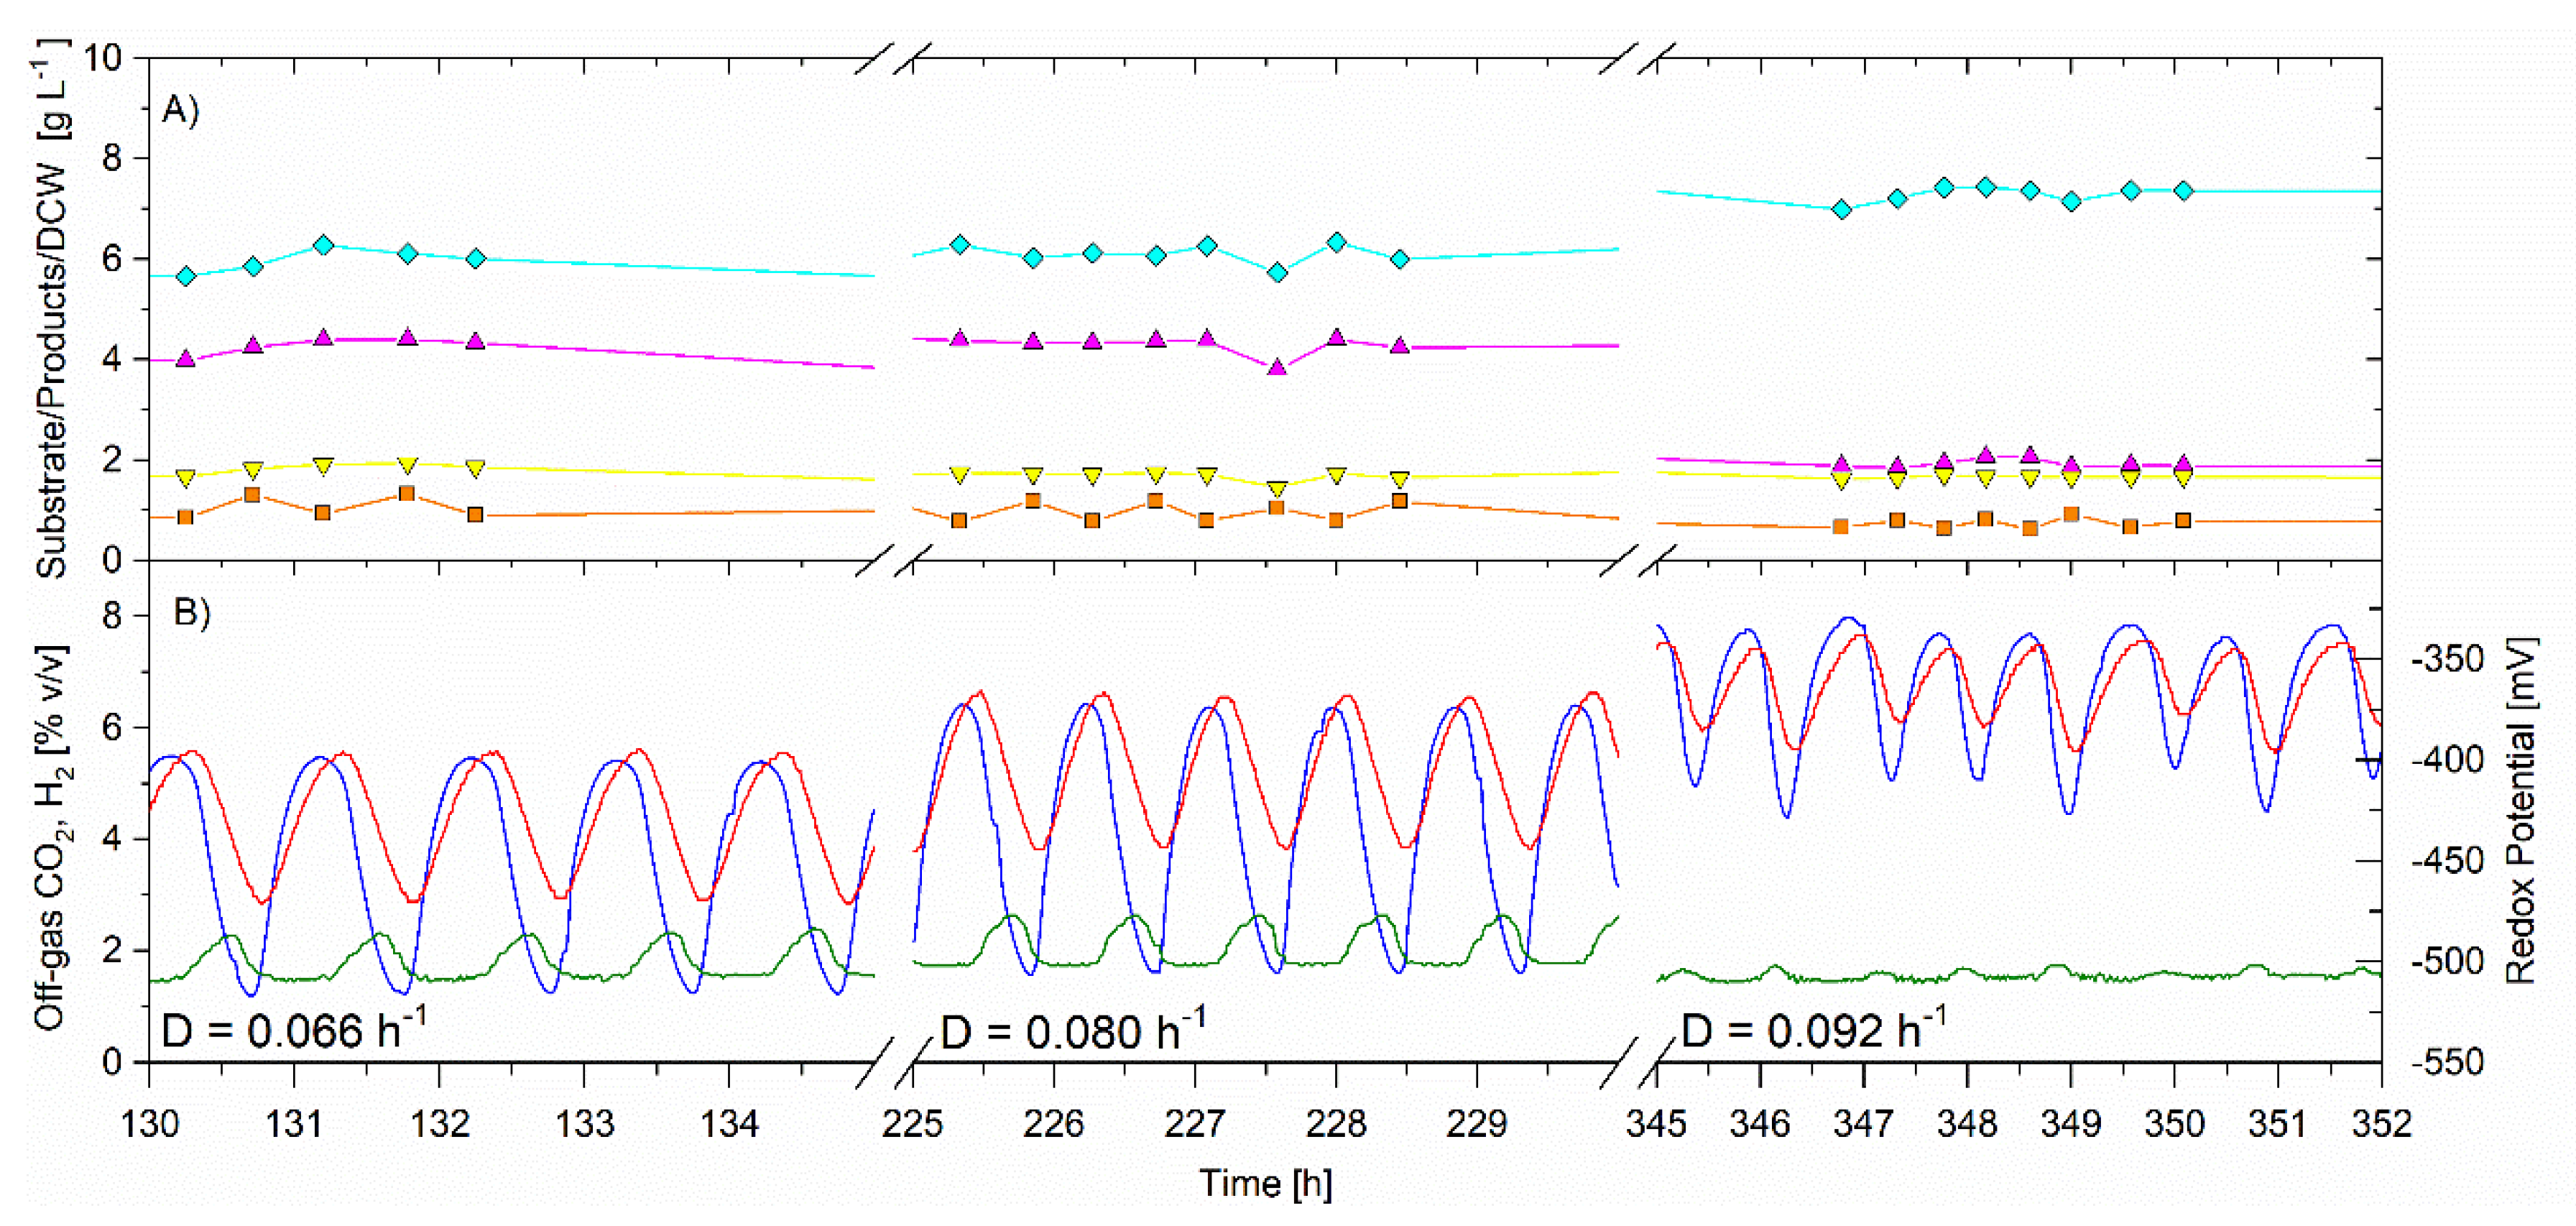
The CSTR was operated for a total of 1331 h in this trial to facilitate an investigation of dilution rate and temperature on the self-synchronized oscillatory metabolism. For the dilution rate trial (80–372 h), the average feed glycerol concentration was 31.1 ± 0.5 g·L−1, the bioreactor volume was 5.22 L and the temperature was 35.5 ± 0.3 °C. In this trial, the single variable change was the dilution rate which was set at 0.066 h−1 from 10 to 156 h, at 0.080 h−1 from 156 to 252 h and 0.092 h−1 from 252 to 372 h. The average data is summarized in Table 2.
For this trial the single variable change was the dilution rate, chosen based on previous experiments also performed with free cells. The limitation on the upper dilution rate used here was previously determined through experimentation, where at 0.14 h−1, the glycerol utilization dropped to 91% and at 0.17 h−1, wash out would occur (data not shown here).
From 90 to 372 h the CSTR was in a self-synchronized oscillatory metabolism. As the dilution rate increased, the period of oscillations remained very similar at approximately 60–75 min. Figure 5 shows the data operating at the three dilution rates, with the x-axis zoomed-in to show the relationships between CO2, H2, redox potential, and CSTR glycerol concentration. Both CO2 and H2 gas production increased as the dilution rate increased, and the amplitude of the oscillations was reduced at the higher dilution rate (0.92 h−1).
The residual glycerol in the CSTR was low and unchanged ranging from 0.8 to 1.0, indicating that the substrate was not limiting. The specific glycerol utilization rate increased with increasing dilution rate and was 1.04 ± 0.01, 1.29 ± 0.03 and 1.37 ± 0.04 g·g−1·h−1 for the dilution rates of 0.066, 0.080 and 0.092 h−1 respectively (Table 2). The cell concentration remained unchanged at 1.90 ± 0.02, 1.9 ± 0.1 and 2.0 ± 0.1 g·L−1 during the operating dilution rate of 0.066, 0.080, and 0.092 h−1, respectively. There was no change in PDO or butanol selectivities for the dilution rates of 0.066 and 0.080 h−1. However, for the higher dilution rate (0.092 h−1), butanol selectivity increased from 0.505 ± 0.006 to 0.67 ± 0.01 g·g−1, while the PDO selectivity decreased from 0.355 ± 0.008 to 0.180 ± 0.009 g·g−1. Ethanol selectivity remained the same for all three dilution rates at 0.140 ± 0.005 to 0.149 ± 0.009 g·g−1 h−1. The results indicate that there was a switch in glycerol flux from the reductive pathway for PDO production towards the reductive pathway for butanol production. The gas production (both CO2 and H2) increased for this higher dilution rate. It is suggested that the increase in specific glycerol utilization rate triggered the redirection of carbon towards the reductive pathway for butanol production and increased the removal of electrons in hydrogen gas production.
In summary, at 35.5 °C, for free cells, the dilution rate was not a good tool for eradicating the synchronized oscillatory metabolism, within the range tested, however higher dilution rate did improve the butanol selectivity and the butanol volumetric productivity. In this trial, the relationship between the CO2 and H2 gas production, redox potential, and glycerol remained as previously stated and was reconfirmed.
3.5. Effect of Temperature on Synchronized Oscillatory Metabolism of C. pasteurianum
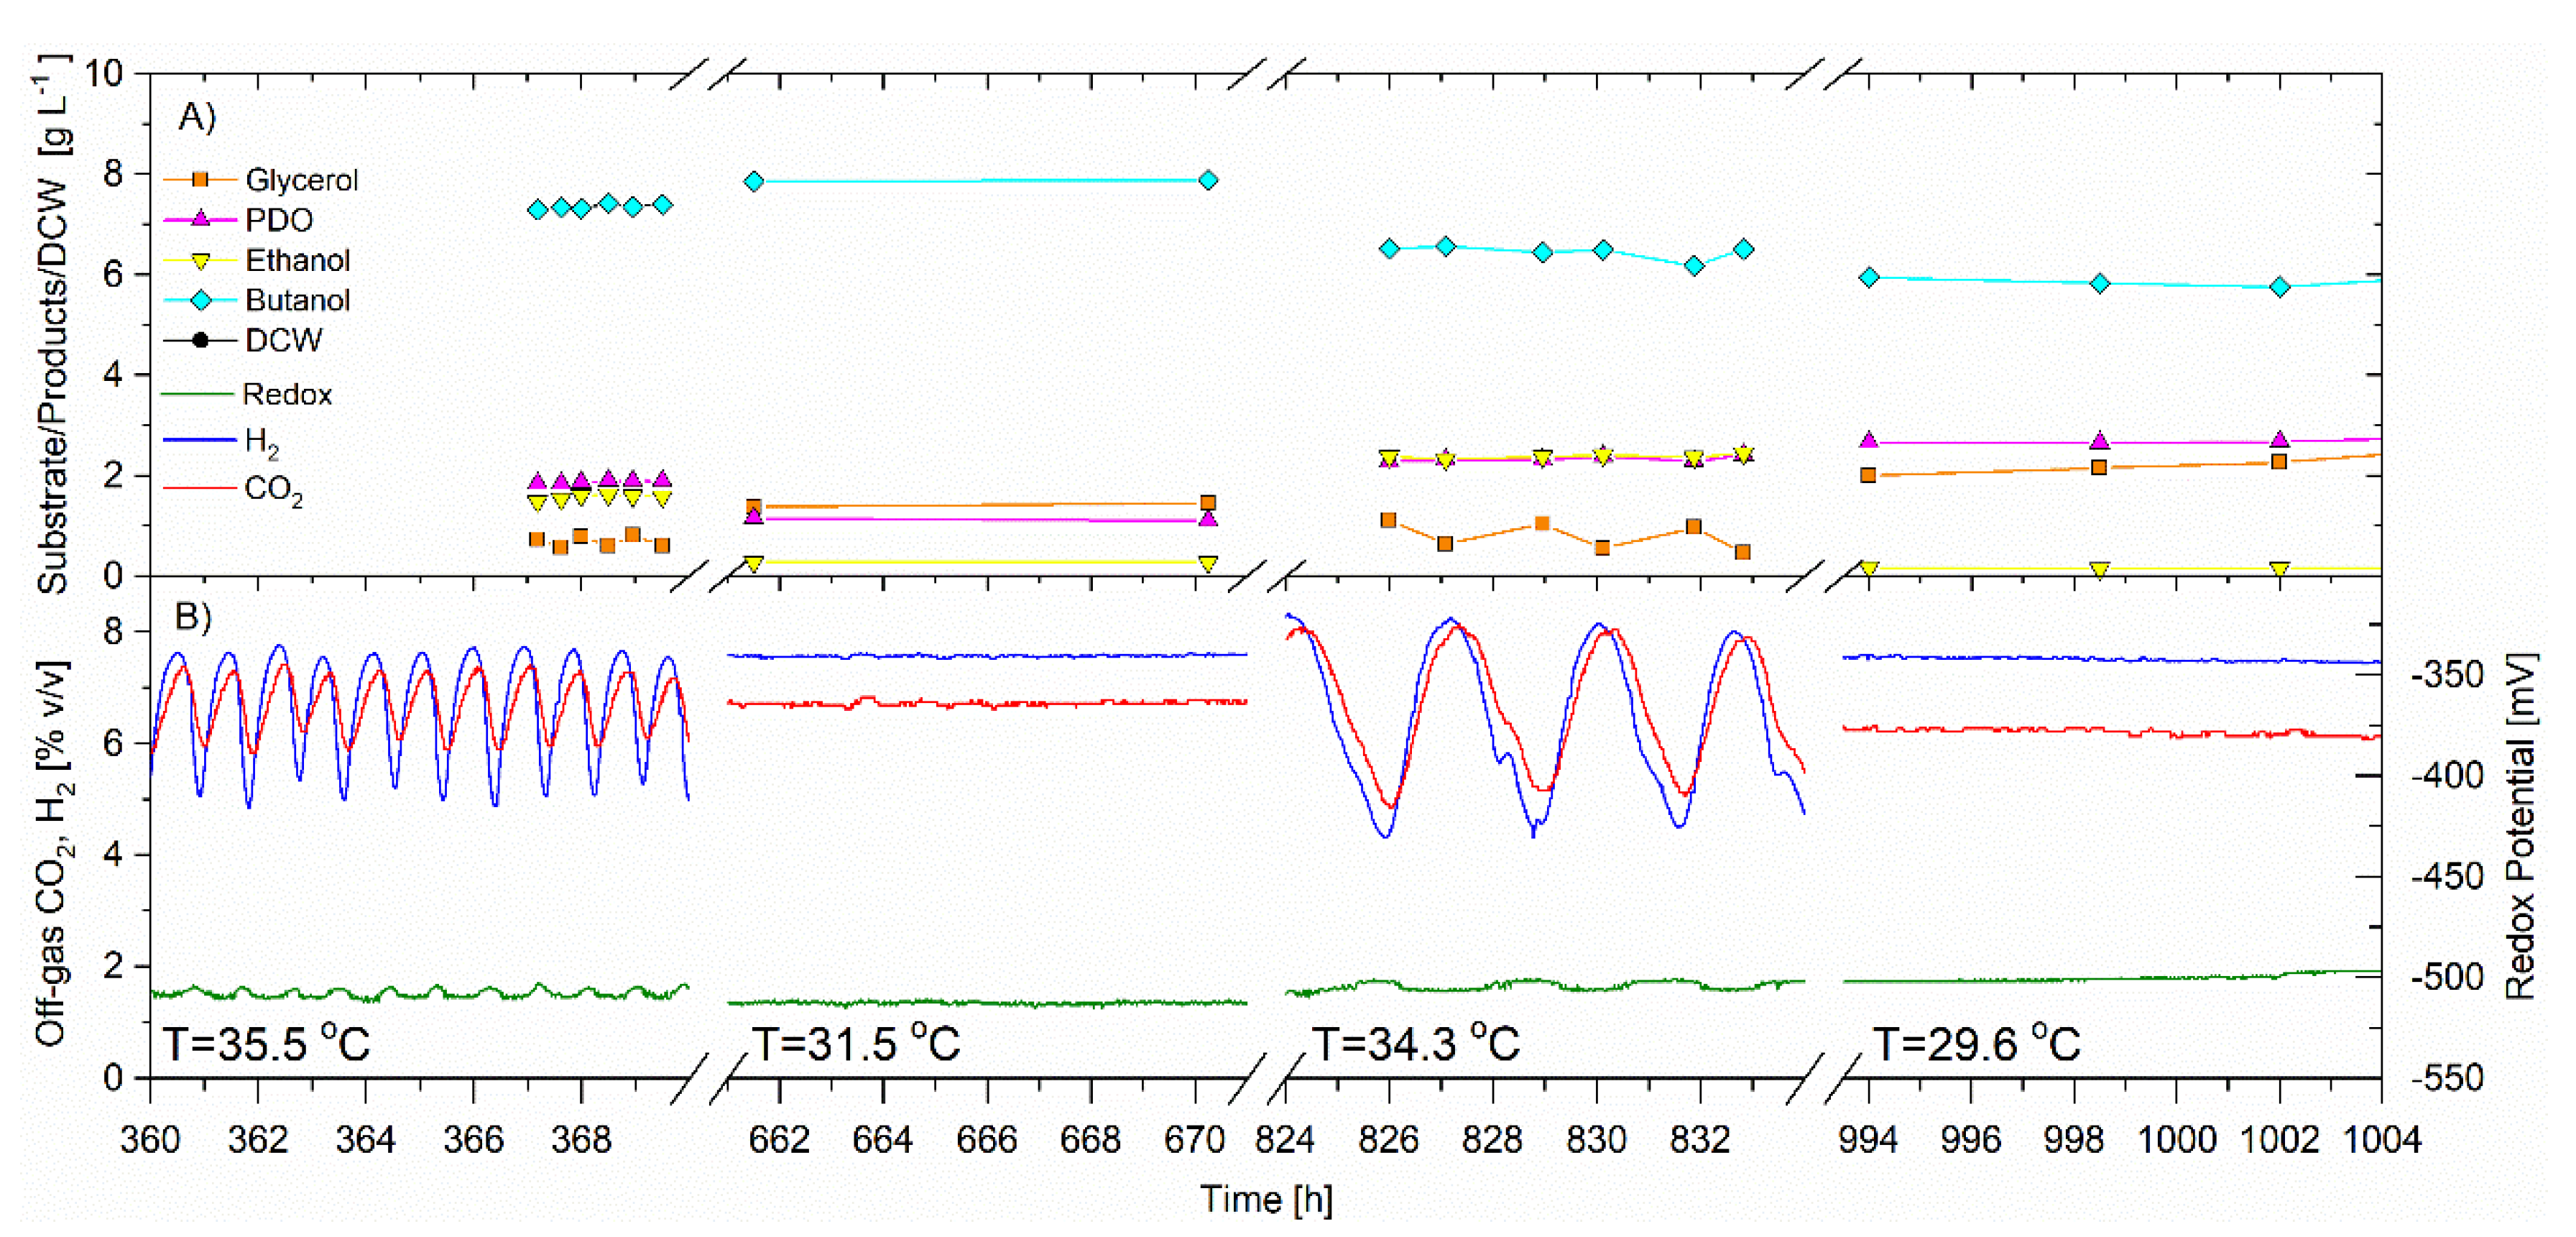
The CSTR was operated for a total of 1331 h, 648 h of which was to facilitate the investigation of the effect of temperature on the self-synchronized oscillatory metabolism. For this portion of the trial, the average feed glycerol concentration was 31.1 ± 0.05 g·L−1, the bioreactor volume was 5.22 L and the dilution rate was 0.092 h−1. In this trial, the single variable change was the temperature which was set initially at 35.5 ± 0.3 °C from 252–537 h. The temperature was then decreased to 31.5 °C from 537 to 687 h; followed by an increase to 34.3 ± 0.2 °C from 687 to 906 h and a final decrease to 29.6 ± 0.2 °C from 906 to 1020 h. Table 3 is a summary of the average data.
The CO2 and H2 gas concentrations and redox potential signals oscillated and remained synchronized at the two higher temperatures (35.5 and 34.3 °C). When the temperature was reduced to either 31.5 or 29.6 °C, the synchronized oscillatory metabolism ceased, resulting in flat signal responses in CO2 and H2 gas concentration and redox potential (Figure 6). While oscillating, the frequency increased for the temperature of 35.5 °C versus 34.3 °C. For the entire trial, the average redox potential remained unchanged. The average cell concentration was unchanged for all four temperature trials and ranged between 1.9 to 2.10 g·L−1. Contrary to previous trials, there was no apparent relationship between the specific glycerol utilization rate and synchronized oscillatory metabolism. However, synchronized oscillatory metabolism always coincided with higher temperature, lower butanol and higher ethanol selectivity. The selectivity of PDO was not found to be correlated to oscillatory metabolism or temperature in this trial.
In summary, lowering the temperature to 29.5 and 31.5 °C, eliminated the self-synchronized oscillatory metabolism of C. pasteurianum under the conditions of this trial and the response was immediate. The opposite can be said, by increasing the temperature to 35.5 and 34.3 °C, the synchronized oscillatory metabolism was reinstated. Self-synchronized oscillatory metabolism was always coincidental with lower butanol and higher ethanol selectivities (Table 3).
The regulation of this oscillatory metabolism is deemed to be complex and there may not be any one parameter that can measure and can predict if the synchronized oscillations will occur. If it is in fact, a manifestation of enzyme inhibition and activation in the oxidative pathway of glycerol metabolism, then it seems plausible that there could be various parameters singly and/or in combination that could trigger this phenomenon.
C. pasteurianum does not demonstrate biphasic behavior in batch fermentation of glycerol since solvents are produced from the beginning of fermentation [1]. The biphasic nature of some clostridial species, where acetogenesis and is followed by solventogenesis, demonstrates the complex regulation involved [28]. For this reason, it is difficult to model Closridial fermentations, owing to the importance of the correct mathematical assumptions and verifying models with experimental data [28]. The experimental data presented here has value for further work in modelling C. pasteurianum fermentation.
4. Conclusions
The self-synchronized oscillatory metabolism of C. pasteurianum in continuous fermentation was revealed due to real time monitoring of CO2 and H2 production and redox potential. This phenomenon is important both metabolically and for process applications as it impedes a “true steady state”, where bioengineering theory can be applied. One consequence of this phenomenon is a large variability in product selectivity. The exact mechanism is unknown, but a possible explanation is that the oscillatory metabolism is a manifestation of the regulation of enzyme activity through inhibition and activation by pathway intermediates and/or redox equivalents, in the oxidative metabolism of glycerol, however this requires further investigation. It is shown that the oscillatory metabolism can be eradicated and reinstated and that the period of oscillations can be altered by modification of the operating parameters. Further work will involve the addition of “signalling” compounds and high cell density on the self-synchronized oscillatory metabolism of C. pasteurianum.
Author Contributions
The concept behind this research was conceived jointly be E.E.J. and L.R. The experimental work was conducted by E.E.J., data analysis and interpretation was completed jointly. The initial draft of the manuscript prepared by E.E.J. and revised by L.R. All authors have read and agreed to the published version of the manuscript.
Funding
This research was funded by BioFuelNet Canada [grant number BFN2016_KT-10], the Natural Science and Engineering Research Council of Canada (NSERC), [grant number RGPIN-2015-04531], the Alexander von Humboldt Foundation [grant number KAN 1161662 STP], and the Canada Foundation for Innovation (CFI) [grant number 27300].
Conflicts of Interest
The authors declare no conflict of interest.
References
- Johnson, E.E.; Rehmann, L. The role of 1,3-propanediol production in fermentation of glycerol by Clostridium pasteurianum. Bioresour. Technol. 2016, 209, 1–7. [Google Scholar] [CrossRef] [PubMed]
- Dabrock, B.; Bahl, H.; Gottschalk, G. Parameters affecting solvent production by Clostridium pasteurianum. Appl. Environ. Microbiol. 1992, 58, 1233–1239. [Google Scholar] [CrossRef] [PubMed] [Green Version]
- Da Silva, G.P.; Mack, M.; Contiero, J. Glycerol: A promising and abundant carbon source for industrial microbiology. Biotechnol. Adv. 2009, 27, 30–39. [Google Scholar] [CrossRef] [PubMed]
- Sandoval, N.R.; Venkataramanan, K.P.; Groth, T.S.; Papoutsakis, E.T. Whole-genome sequence of an evolved Clostridium pasteurianum strain reveals Spo0A deficiency responsible for increased butanol production and superior growth. Biotechnol. Biofuels 2015, 8, 227. [Google Scholar] [CrossRef]
- Groeger, C.; Wang, W.; Sabra, W.; Utesch, T.; Zeng, A.-P. Metabolic and proteomic analyses of product selectivity and redox regulation in Clostridium pasteurianum grown on glycerol under varied iron availability. Microb. Cell Fact. 2017, 16, 64. [Google Scholar] [CrossRef]
- Gallardo, R.; Alves, M.; Rodrigues, L.R. Modulation of crude glycerol fermentation by Clostridium pasteurianum DSM 525 towards the production of butanol. Biomass Bioenergy 2014, 71, 134–143. [Google Scholar] [CrossRef] [Green Version]
- Biebl, H. Fermentation of glycerol by Clostridium pasteurianum--batch and continuous culture studies. J. Ind. Microbiol. Biotechnol. 2001, 27, 18–26. [Google Scholar] [CrossRef]
- Daniel, R.; Stuertz, K.; Gottschalk, G. Biochemical and molecular characterization of the oxidative branch of glycerol utilization by Citrobacter freundii. J. Bacteriol. 1995, 177, 4392–4401. [Google Scholar] [CrossRef] [Green Version]
- Macis, L.; Daniel, R.; Gottschalk, G. Properties and sequence of the coenzyme B12-dependent glycerol dehydratase of Clostridium pasteurianum. FEMS Microbiol. Lett. 1998, 164, 21–28. [Google Scholar] [CrossRef]
- Luers, F.; Seyfried, M.; Daniel, R.; Gottschalk, G. Glycerol conversion to 1,3-propanediol by Clostridium pasteurianum: Cloning and expression of the gene encoding 1,3-propanediol dehydrogenase. FEMS Microbiol. Lett. 1997, 154, 337–345. [Google Scholar] [CrossRef]
- Jungermann, K.; Leimenstoll, G.; Rupprecht, E.; Thauer, R.K. Demonstration of NADH-ferredoxin reductase in two saccharolytic clostridia. Arch. Mikrobiol. 1971, 80, 370–372. [Google Scholar] [CrossRef]
- Petitdemange, H.; Cherrier, C.; Raval, R.; Gay, R. Regulation of the NADH and NADPH-ferredoxin oxidoreductases in clostridia of the butyric group. Biochim. Biophys. Acta 1976, 421, 334–347. [Google Scholar] [CrossRef]
- Jungermann, K.; Thauer, R.K.; Leimenstoll, G.; Decker, K. Function of reduced pyridine nucleotide-ferredoxin oxidoreductases in saccharolytic Clostridia. Biochem. Biophys. Acta 1973, 305, 268–280. [Google Scholar] [CrossRef]
- Zheng, Y.; Ko, T.P.; Sun, H.; Huang, C.H.; Pei, J.; Qiu, R.; Wang, A.H.J.; Wiegel, J.; Shao, W.; Guo, R.T. Distinct structural features of Rex-family repressors to sense redox levels in anaerobes and aerobes. J. Struct. Biol. 2014, 188, 195–204. [Google Scholar] [CrossRef] [PubMed] [Green Version]
- Schwarz, K.M.; Grosse-Honebrink, A.; Derecka, K.; Rotta, C.; Zhang, Y.; Minton, N.P. Towards improved butanol production through targeted genetic modification of Clostridium pasteurianum. Metab. Eng. 2017, 40, 124–137. [Google Scholar] [CrossRef] [PubMed]
- Poehlein, A.; Solano, J.D.M.; Flitsch, S.K.; Krabben, P.; Winzer, K.; Reid, S.J.; Jones, D.T.; Green, E.; Minton, N.P.; Daniel, R.; et al. Microbial solvent formation revisited by comparative genome analysis. Biotechnol. Biofuels 2017, 10, 1–15. [Google Scholar] [CrossRef]
- Poehlein, A.; Grosse-Honebrink, A.; Zhang, Y.; Minton, N.P.; Daniel, R. Complete Genome Sequence of the Nitrogen-Fixing and Solvent-Producing Clostridium pasteurianum DSM 525. Genome Announc. 2015, 3. [Google Scholar] [CrossRef] [Green Version]
- Pyne, M.E.; Sokolenko, S.; Liu, X.; Srirangan, K.; Bruder, M.R.; Aucoin, M.G.; Moo-Young, M.; Chung, D.A.; Chou, C.P. Disruption of the reductive 1,3-propanediol pathway triggers production of 1,2-propanediol for sustained glycerol fermentation by Clostridium pasteurianum. Appl. Environ. Microbiol. 2016, 82, 5375–5388. [Google Scholar] [CrossRef] [Green Version]
- Pyne, M.E.; Moo-Young, M.; Chung, D.A.; Chou, C.P. Development of an electrotransformation protocol for genetic manipulation of Clostridium pasteurianum. Biotechnol. Biofuels 2013, 6, 50. [Google Scholar] [CrossRef] [Green Version]
- Lütke-Eversloh, T. Application of new metabolic engineering tools for Clostridium acetobutylicum. Appl. Microbiol. Biotechnol. 2014, 98, 5823–5837. [Google Scholar] [CrossRef]
- Lloyd, D.; Murray, D.B.; Aon, M.A.; Cortassa, S.; Roussel, M.R.; Beckmann, M.; Poole, R.K. Temporal metabolic partitioning of the yeast and protist cellular networks: The cell is a global scale-invariant (fractal or self-similar) multioscillator. J. Biomed. Opt. 2019, 24, 1–18. [Google Scholar] [CrossRef] [PubMed]
- Gallazzi, A.; Branska, B.; Marinelli, F.; Patakova, P. Continuous production of n -butanol by Clostridium pasteurianum DSM 525 using suspended and surface-immobilized cells. J. Biotechnol. 2015, 216, 29–35. [Google Scholar] [CrossRef] [PubMed]
- Clarke, K.G.; Hansford, G.S.; Jones, D.T. Nature and Significance of Oscillatory Behavior during Solvent Production by Clostridium acetobutylicum in Continuous Culture. Biotechnol. Bioeng. 1988, 32, 538–544. [Google Scholar] [CrossRef] [PubMed]
- Mulchandani, A.; Volesky, B. Production of acetone-butanol-ethanol by Clostridium acetobutylicum using a spin filter perfusion bioreactorClostridium acetobutylicum. J. Biotechnol. 1994, 34, 51–60. [Google Scholar] [CrossRef]
- Patnaik, P.R. Oscillatory metabolism of Saccharomyces cerevisiae: An overview of mechanisms and models. Biotechnol. Adv. 2003, 21, 183–192. [Google Scholar] [CrossRef]
- Sohn, H.Y.; Murray, D.B.; Kuriyama, H. Ultradian oscillation of Saccharomyces cerevisiae during aerobic continuous culture: Hydrogen sulphide mediates population synchrony. Yeast 2000, 16, 1185–1190. [Google Scholar] [CrossRef]
- Richard, P.; Bakker, B.M.; Teusink, B.; Van Dam, K.; Westerhoff, H.V. Acetaldehyde mediates the synchronization of sustained glycolytic oscillations in populations of yeast cells. Eur. J. Biochem. 1996, 235, 238–241. [Google Scholar] [CrossRef] [Green Version]
- Millat, T.; Winzer, K. Mathematical modelling of clostridial acetone-butanol-ethanol fermentation. Appl. Microbiol. Biotechnol. 2017, 101, 2251–2271. [Google Scholar] [CrossRef]
Figure 1.
The possible metabolic route involved in glycerol metabolism in C. pasteurianum based on [4,5]. Key enzymes involving glycerol to butanol: 1, glycerol dehydrogenase; 2, dihydroxyacetone kinase; 3, glycerol dehydratase; 4, 1,3-propanediol dehydrogenase; 5, pyruvate kinase; 6, pyruvate-ferredoxin oxidoreductase; 7, acetaldehyde dehydrogenase; 8, ethanol dehydrogenase; 9, butyraldehyde dehydrogenase; 10, butanol dehydrogenase. Abbreviation for chemical: DHAP, Dihydroxyacetone phosphate; 3-HPA, 3-Hydroxypropionaldehyde; GA3P, Glyceraldehyde 3-phosphate; 1,3 BPG, 1,3-bisphosphoglycerate, 3PG 3-phosphoglycerate; 2PG, 2-phosphoglycerate; PEP, Phosphoenolpyruvate.

Figure 2.
Continuous fermentation equipment. 1, stir plate; 2, Feed Carboy; 3, feed transfer pump; 4, inlet gas flow meter; 5, feed vessel; 6, feed pump; 7, inoculum bottle and pump; 8, acid bottle and pump; 9, base bottle and pump; 10, inlet mas gas flow controller; 11, continuous bioreactor; 12, redox probe; 13, pH probe; 14, optical density probe; 15, product outlet with level controller; 16, off-gas drierite column; 17, mass gas flow meter; 18, off-gas CO2/O2 analyzer; 19, off-gas H2 analyzer.

Figure 3.
Data for continuous operation at three different feed glycerol concentrations, pH 5.0, D = 0.092 h−1. Feed glycerol: 29.92 g·L−1 from 0 to114 h; 26.4 g·L−1 from 114 to 206 h; and 21.0 g·L−1 from 206 to 348 h. (A) Off-line analysis of bioreactor in g·L−1 of: PDO (magenta solid triangle); ethanol (yellow solid inverted triangle); butanol (cyan solid diamond); dry cell weight, DCW (black solid circle); glycerol (orange solid square); glycerol utilization (open black square). (B) On-line analysis of off-gas (sample frequency 1 min) of: CO2 (red) and H2 (blue), % v/v; redox potential, mV (green). Lines joining data points are for visual purposes only.

Figure 4.
Continuous fermentation showing the effect of pH on the self-synchronized oscillatory metabolism, D = 0.095 h −1, feed glycerol 40 g·L−1 (A) 10 h, pH 5.3 (B) 10 h, pH 5.6 (C) 10 h, pH 5.9. On-line analysis of off-gas (sample frequency 1 min) of: CO2 (red) and H2 (blue), % v/v; redox potential, mV (green). Off-line analysis via HPLC of bioreactor in g·L−1 of: glycerol (solid orange square); PDO (solid magenta triangle); butanol (solid cyan diamond); ethanol (solid yellow inverted triangle).

Figure 5.
Continuous fermentation showing the effect of dilution rate on the self-synchronized oscillatory metabolism, dilution rate, Temperature 35.5 °C, D = 0.066 h−1 (10 to 156 h); D = 0.080 h−1 (156 to 252 h); D = 0.092 h−1 (252 to 372 h), feed glycerol 31.1 ± 0.5 g·L−1. On-line analysis of off-gas (sample frequency 1 min) of: CO2 (red) and H2 (blue), % v/v; redox potential, mV (green). Off-line analysis via HPLC of bioreactor in g·L−1 of: glycerol (solid orange square); PDO (solid magenta triangle); butanol (solid cyan diamond); ethanol (solid inverted yellow triangle).

Figure 6.
Continuous fermentation showing the effect of temperature on the self-synchronized oscillatory metabolism. Operating pH 5.0, D = 0.092 h−1. Feed glycerol: 31.1 ± 0.05 g·L−1 Temperature 35.5 °C (252–537 h); 31.5 °C (537–687 h); 34.3 °C (687–906 h); 29.6 °C (906–1020 h) (A) Off-line analysis of bioreactor in g·L−1 of: glycerol (solid orange square); PDO (solid magenta triangle); ethanol (solid inverted yellow triangle); butanol (solid cyan diamond) (B) On-line analysis of off-gas (sample frequency 1 min) of: CO2 (red) and H2 (blue), % v/v; redox potential, mV (green). Lines joining data points are for visual purposes only.


Table 1.
Summary of average data for the investigation of feed glycerol concentration and supplemental butanol on self-synchronized oscillatory metabolism.
Table 1.
Summary of average data for the investigation of feed glycerol concentration and supplemental butanol on self-synchronized oscillatory metabolism.
| Feed Glycerol [g·L−1] | Butanol Added [g·L−1] | Synchronized | Redox Potential [mV] | Specific Glycerol Utilization b [gg−1·h−1] | Concentration in Bioreactor [g·L−1] | Selectivity c [g·g−1] | |||||||
|---|---|---|---|---|---|---|---|---|---|---|---|---|---|
| Glycerol | DCW | Butanol | PDO | Ethanol | Total Solvent | Butanol | PDO | Ethanol | |||||
| 29.92 ± 0.07 | 0 | yes | −515 ± 2 a | 1.35 ± 0.03 | 3.4 ± 0.4 | 1.8 ± 0.1 | 5.7 ± 0.1 | 2.41 ± 0.06 | 1.49 ± 0.05 | 9.5 ± 0.2 | 0.592 ± 0.007 | 0.252 ± 0.003 | 0.156 ± 0.007 |
| 26.4 ± 0.6 | 0 | yes | −509 ± 7 | 1.41 ± 0.04 | 1.1 ± 0.2 | 1.7 ± 0.1 | 5.3 ± 0.1 | 2.4 ± 0.2 | 1.44 ± 0.08 | 9.1 ± 0.2 | 0.58 ± 0.02 | 0.26 ± 0.02 | 0.158 ± 0.006 |
| 21.0 ± 0.8 | 0 | no | −514 ± 4 | 1.09 ± 0.03 | 0.11 ± 0.01 | 1.8 ± 0.1 | 5.7 ± 0.2 | 0.1 ± 0.1 | 0.5 ± 0.1 | 6.3 ± 0.1 | 0.89 ± 0.04 | 0.02 ± 0.02 | 0.09 ± 0.02 |
| 20.5 ± 0.4 | 0.5 | no | −515.8 ± 0.5 | 1.14 ± 0.03 | 0.13 ± 0.02 | 1.65 ± 0.03 | 5.76 ± 0.07 | 0.00 | 0.28 ± 0.02 | 6.03 ± 0.06 | 0.954 ± 0.003 | 0.00 | 0.046 ± 0.003 |
| 20.4 ± 0.1 | 1.5 | no | −515.5 ± 0.7 | 1.25 ± 0.08 | 0.30 ± 0.09 | 1.49 ± 0.09 | 5.3 ± 0.2 | 0.00 | 0.19 ± 0.02 | 5.5 ± 0.2 | 0.965 ± 0.004 | 0.00 | 0.035 ± 0.004 |
a ± Standard deviation. b Average specific glycerol utilization (g glycerol g cell−1·h −1). c Selectivity with respect to total solvent (butanol, ethanol, 1,3-propanediol).
Table 2.
Summary of average data for the investigation of the effect of dilution rate on synchronized oscillatory metabolism at 35.5 °C.
Table 2.
Summary of average data for the investigation of the effect of dilution rate on synchronized oscillatory metabolism at 35.5 °C.
| Dilution Rate [h−1] | Feed Glycerol [g·L−1] | Synchronized | Redox Potential [mV] | Specific Glycerol Utilization b [g g−1·h−1] | Concentration in Bioreactor [g·L−1] | Selectivity c [g·g−1] | |||||||
|---|---|---|---|---|---|---|---|---|---|---|---|---|---|
| Glycerol | DCW | Butanol | PDO | Ethanol | Total Solvent | Butanol | PDO | Ethanol | |||||
| 0.066 | 31.1 ± 0.3 | yes | −502 ± 8 a | 1.04 ± 0.01 | 1.0 ± 0.2 | 1.90 ± 0.02 | 6.0 ± 0.2 | 4.4 ± 0.3 | 1.8 ± 0.1 | 12.2 ± 0.5 | 0.492 ± 0.008 | 0.36 ± 0.01 | 0.149 ± 0.004 |
| 0.080 | 31.1 ± 0.6 | yes | −495 ± 9 | 1.29 ± 0.03 | 1.0 ± 0.2 | 1.9 ± 0.1 | 6.1 ± 0.2 | 4.3 ± 0.2 | 1.7 ± 0.1 | 12.1 ± 0.4 | 0.505 ± 0.006 | 0.355 ± 0.008 | 0.140 ± 0.005 |
| 0.092 | 31.1 ± 0.5 | yes | −506 ± 2 | 1.37 ± 0.04 | 0.8 ± 0.1 | 2.0 ± 0.1 | 7.2 ± 0.3 | 1.93 ± 0.09 | 1.6 ± 0.1 | 10.7 ± 0.5 | 0.67 ± 0.01 | 0.180 ± 0.009 | 0.149 ± 0.009 |
a ± Standard deviation. b Average specific glycerol utilization (g·glycerol g cell−1·h −1). c Selectivity with respect to total solvent (butanol, ethanol, 1,3-propanediol).
Table 3.
Summary of average data for the investigation of the effect of temperature on synchronized oscillatory metabolism at a dilution rate 0.092 h −1.
Table 3.
Summary of average data for the investigation of the effect of temperature on synchronized oscillatory metabolism at a dilution rate 0.092 h −1.
| Temperature [°C] | Feed Glycerol [g·L−1] | Synchronized | Redox Potential [mV] | Specific Glycerol Utilization b [g h−1] | Concentration in Bioreactor [g·L−1] | Selectivity c [g·g−1] | |||||||
|---|---|---|---|---|---|---|---|---|---|---|---|---|---|
| Glycerol | DCW | Butanol | PDO | Ethanol | Total Solvent | Butanol | PDO | Ethanol | |||||
| 35.5 ± 0.3 | 31.1 ± 0.5 | yes | −506 ± 2 a | 1.37 ± 0.04 | 0.8 ± 0.1 | 2.0 ± 0.1 | 7.2 ± 0.3 | 1.93 ± 0.09 | 1.6 ± 0.1 | 10.7 ± 0.5 | 0.67 ± 0.01 | 0.180 ± 0.009 | 0.149 ± 0.009 |
| 31.5 ± 0.3 | 31.4 ± 0.4 | no | −510 ± 3 | 1.32 ± 0.04 | 1.4 ± 0.2 | 2.1 ± 0.1 | 8.0 ± 0.1 | 1.17 ± 0.09 | 0.29 ± 0.03 | 9.4 ± 0.1 | 0.845 ± 0.009 | 0.124 ± 0.008 | 0.031 ± 0.003 |
| 34.3 ± 0.3 | 30.88 ± 0.08 | yes | −505 ± 2 | 1.40 ± 0.02 | 0.8 ± 0.3 | 2.0 ± 0.01 | 6.3 ± 0.2 | 2.37 ± 0.09 | 2.5 ± 0.1 | 11.1 ± 0.2 | 0.57 ± 0.02 | 0.213 ± 0.007 | 0.22 ± 0.01 |
| 29.6 ± 0.3 | 30.4 ± 0.4 | no | −505 ± 6 | 1.4 ± 0.1 | 1.8 ± 0.7 | 1.9 ± 0.2 | 6.3 ± 0.7 | 2.4 ± 0.5 | 0.19 ± 0.04 | 8.9 ± 0.3 | 0.71 ± 0.05 | 0.27 ± 0.06 | 0.021 ± 0.004 |
a ± Standard deviation. b Average specific glycerol utilization (g glycerol g cell-1·h−1). c Selectivity with respect to total solvent (butanol, ethanol, 1,3-propanediol).
© 2020 by the authors. Licensee MDPI, Basel, Switzerland. This article is an open access article distributed under the terms and conditions of the Creative Commons Attribution (CC BY) license (http://creativecommons.org/licenses/by/4.0/).
Share and Cite
MDPI and ACS Style
Johnson, E.E.; Rehmann, L. Self-Synchronized Oscillatory Metabolism of Clostridium pasteurianum in Continuous Culture. Processes 2020, 8, 137. https://0-doi-org.brum.beds.ac.uk/10.3390/pr8020137
AMA Style
Johnson EE, Rehmann L. Self-Synchronized Oscillatory Metabolism of Clostridium pasteurianum in Continuous Culture. Processes. 2020; 8(2):137. https://0-doi-org.brum.beds.ac.uk/10.3390/pr8020137
Chicago/Turabian StyleJohnson, Erin E, and Lars Rehmann. 2020. "Self-Synchronized Oscillatory Metabolism of Clostridium pasteurianum in Continuous Culture" Processes 8, no. 2: 137. https://0-doi-org.brum.beds.ac.uk/10.3390/pr8020137
Note that from the first issue of 2016, this journal uses article numbers instead of page numbers. See further details here.