Alkaline Water Electrolysis Powered by Renewable Energy: A Review


Institute of Chemical and Electrochemical Process Engineering, Clausthal University of Technology, Leibnizstr. 17, 38678 Clausthal-Zellerfeld, Germany
*
Author to whom correspondence should be addressed.
Processes 2020, 8(2), 248; https://0-doi-org.brum.beds.ac.uk/10.3390/pr8020248
Submission received: 23 January 2020
/
Revised: 14 February 2020
/
Accepted: 18 February 2020
/
Published: 21 February 2020
(This article belongs to the Special Issue Electrolysis Processes)
Abstract
:Alkaline water electrolysis is a key technology for large-scale hydrogen production powered by renewable energy. As conventional electrolyzers are designed for operation at fixed process conditions, the implementation of fluctuating and highly intermittent renewable energy is challenging. This contribution shows the recent state of system descriptions for alkaline water electrolysis and renewable energies, such as solar and wind power. Each component of a hydrogen energy system needs to be optimized to increase the operation time and system efficiency. Only in this way can hydrogen produced by electrolysis processes be competitive with the conventional path based on fossil energy sources. Conventional alkaline water electrolyzers show a limited part-load range due to an increased gas impurity at low power availability. As explosive mixtures of hydrogen and oxygen must be prevented, a safety shutdown is performed when reaching specific gas contamination. Furthermore, the cell voltage should be optimized to maintain a high efficiency. While photovoltaic panels can be directly coupled to alkaline water electrolyzers, wind turbines require suitable converters with additional losses. By combining alkaline water electrolysis with hydrogen storage tanks and fuel cells, power grid stabilization can be performed. As a consequence, the conventional spinning reserve can be reduced, which additionally lowers the carbon dioxide emissions.
1. Introduction
Hydrogen is considered a promising energy carrier for a sustainable future when it is produced by utilizing renewable energy [1]. Today, less than 4% of hydrogen production is based on electrolysis processes, of which the main part is hydrogen as a by-product of chlorine production. Hence, the major share of the needed hydrogen depends on the fossil path through the steam reforming of natural gas [2]. This situation is caused by the higher production costs of electrolysis processes compared to the conventional fossil sources, due to high electricity costs and interfering laws [3]. To reduce emissions and to become independent of fossil energy carriers, the share of hydrogen produced using renewable power sources needs to be increased significantly in the next few decades. Therefore, water electrolysis is a key technology for splitting water into hydrogen and oxygen by using renewable energy. After drying and removing oxygen impurities, the hydrogen purity is higher than 99.9%, and the hydrogen can be directly used in the following processes or in the transport sector [4]. Solar and wind energy are the preferred renewable power sources for hydrogen production, as their distribution is the most widespread [5,6]. Hydropower, biomass, and geothermal energy are alternatives, and are often utilized for the base load [7]. The main problem with using renewable energy is the unevenly distributed and intermittent local availability [6]. With a higher share of renewable energy from wind turbines or solar photovoltaic panels and fair emission costs, hydrogen production by water electrolysis will become more attractive. The combination of water electrolysis with renewable energy is particularly advantageous, as excess electrical energy can be chemically stored in hydrogen to balance the discrepancy between energy demand and production [6]. For large-scale applications, the hydrogen can be stored in salt caverns, storage tanks, or the gas grid [8,9,10,11,12]. Smaller hydrogen quantities can also be stored in metal hydrides [13,14].
For water electrolysis, there are three technologies available: Alkaline water electrolysis (AEL), proton exchange membrane (or polymer electrolyte membrane) electrolysis (PEMEL), and solid oxide electrolysis (SOEL) [15,16,17,18]. While the low-temperature technologies, AEL and PEMEL, both provide high technology readiness levels, the high-temperature SOEL technology is still in the development stage [19]. Alkaline water electrolysis uses concentrated lye as an electrolyte and requires a gas-impermeable separator to prevent the product gases from mixing. The electrodes consist of non-noble metals like nickel with an electrocatalytic coating. PEMEL uses a humidified polymer membrane as the electrolyte and noble metals like platinum and iridium oxide as the electrocatalysts. Both technologies are operated at temperatures from 50 to 80 °C and allow operation pressures of up to 30 bar. The nominal stack efficiency of both technologies is around 70% [18,20]. SOEL is also known as high-temperature (HTEL) or steam electrolysis, as gaseous water is converted into hydrogen and oxygen at temperatures between 700 and 900 °C. Theoretically, stack efficiencies near 100% are possible due to positive thermodynamic effects on power consumption at higher temperatures. However, the increased thermal demand requires a suitable waste heat source from the chemical, metallurgical, or thermal power generation industry for economical operation. Moreover, the corrosive environment demands further material development [6,20,21]. As a consequence, SOEL provides only small stack capacities below 10 kW, compared to 6MW for AEL and 2MW for PEMEL [20]. Hence, the investment costs and the lifetime determine whether AEL or PEMEL is the most favorable system design for a large-scale application. Today, the investment costs for AEL are from 800 to 1500 €KW−1 and for PEMEL from 1400 to 2100 €KW−1. Furthermore, the lifetime of alkaline water electrolyzers is higher and the annual maintenance costs are lower compared to a PEMEL system [15,20,22,23]. Often, PEMEL systems are preferred for dynamic operation due to the short start-up time and a broad load flexibility range. The shortcomings of AEL are gradually being overcome by further development [24]. Therefore, this review focuses on alkaline water electrolysis powered by renewable energy. To ensure safety and high efficiency, alkaline water electrolyzers must be optimized for dynamic operation. Hence, the process needs to be analyzed for how the dynamics will affect the system performance and what aspects should be considered when fluctuating renewable energy is used instead of a constant load [25]. Thus, this contribution shows model descriptions for alkaline water electrolysis, photovoltaic panels, and wind turbines to identify the limitations when combining all components into a hydrogen energy system. Furthermore, theoretical models can help to solve the existing problems using intelligent system design and suitable operation strategies.
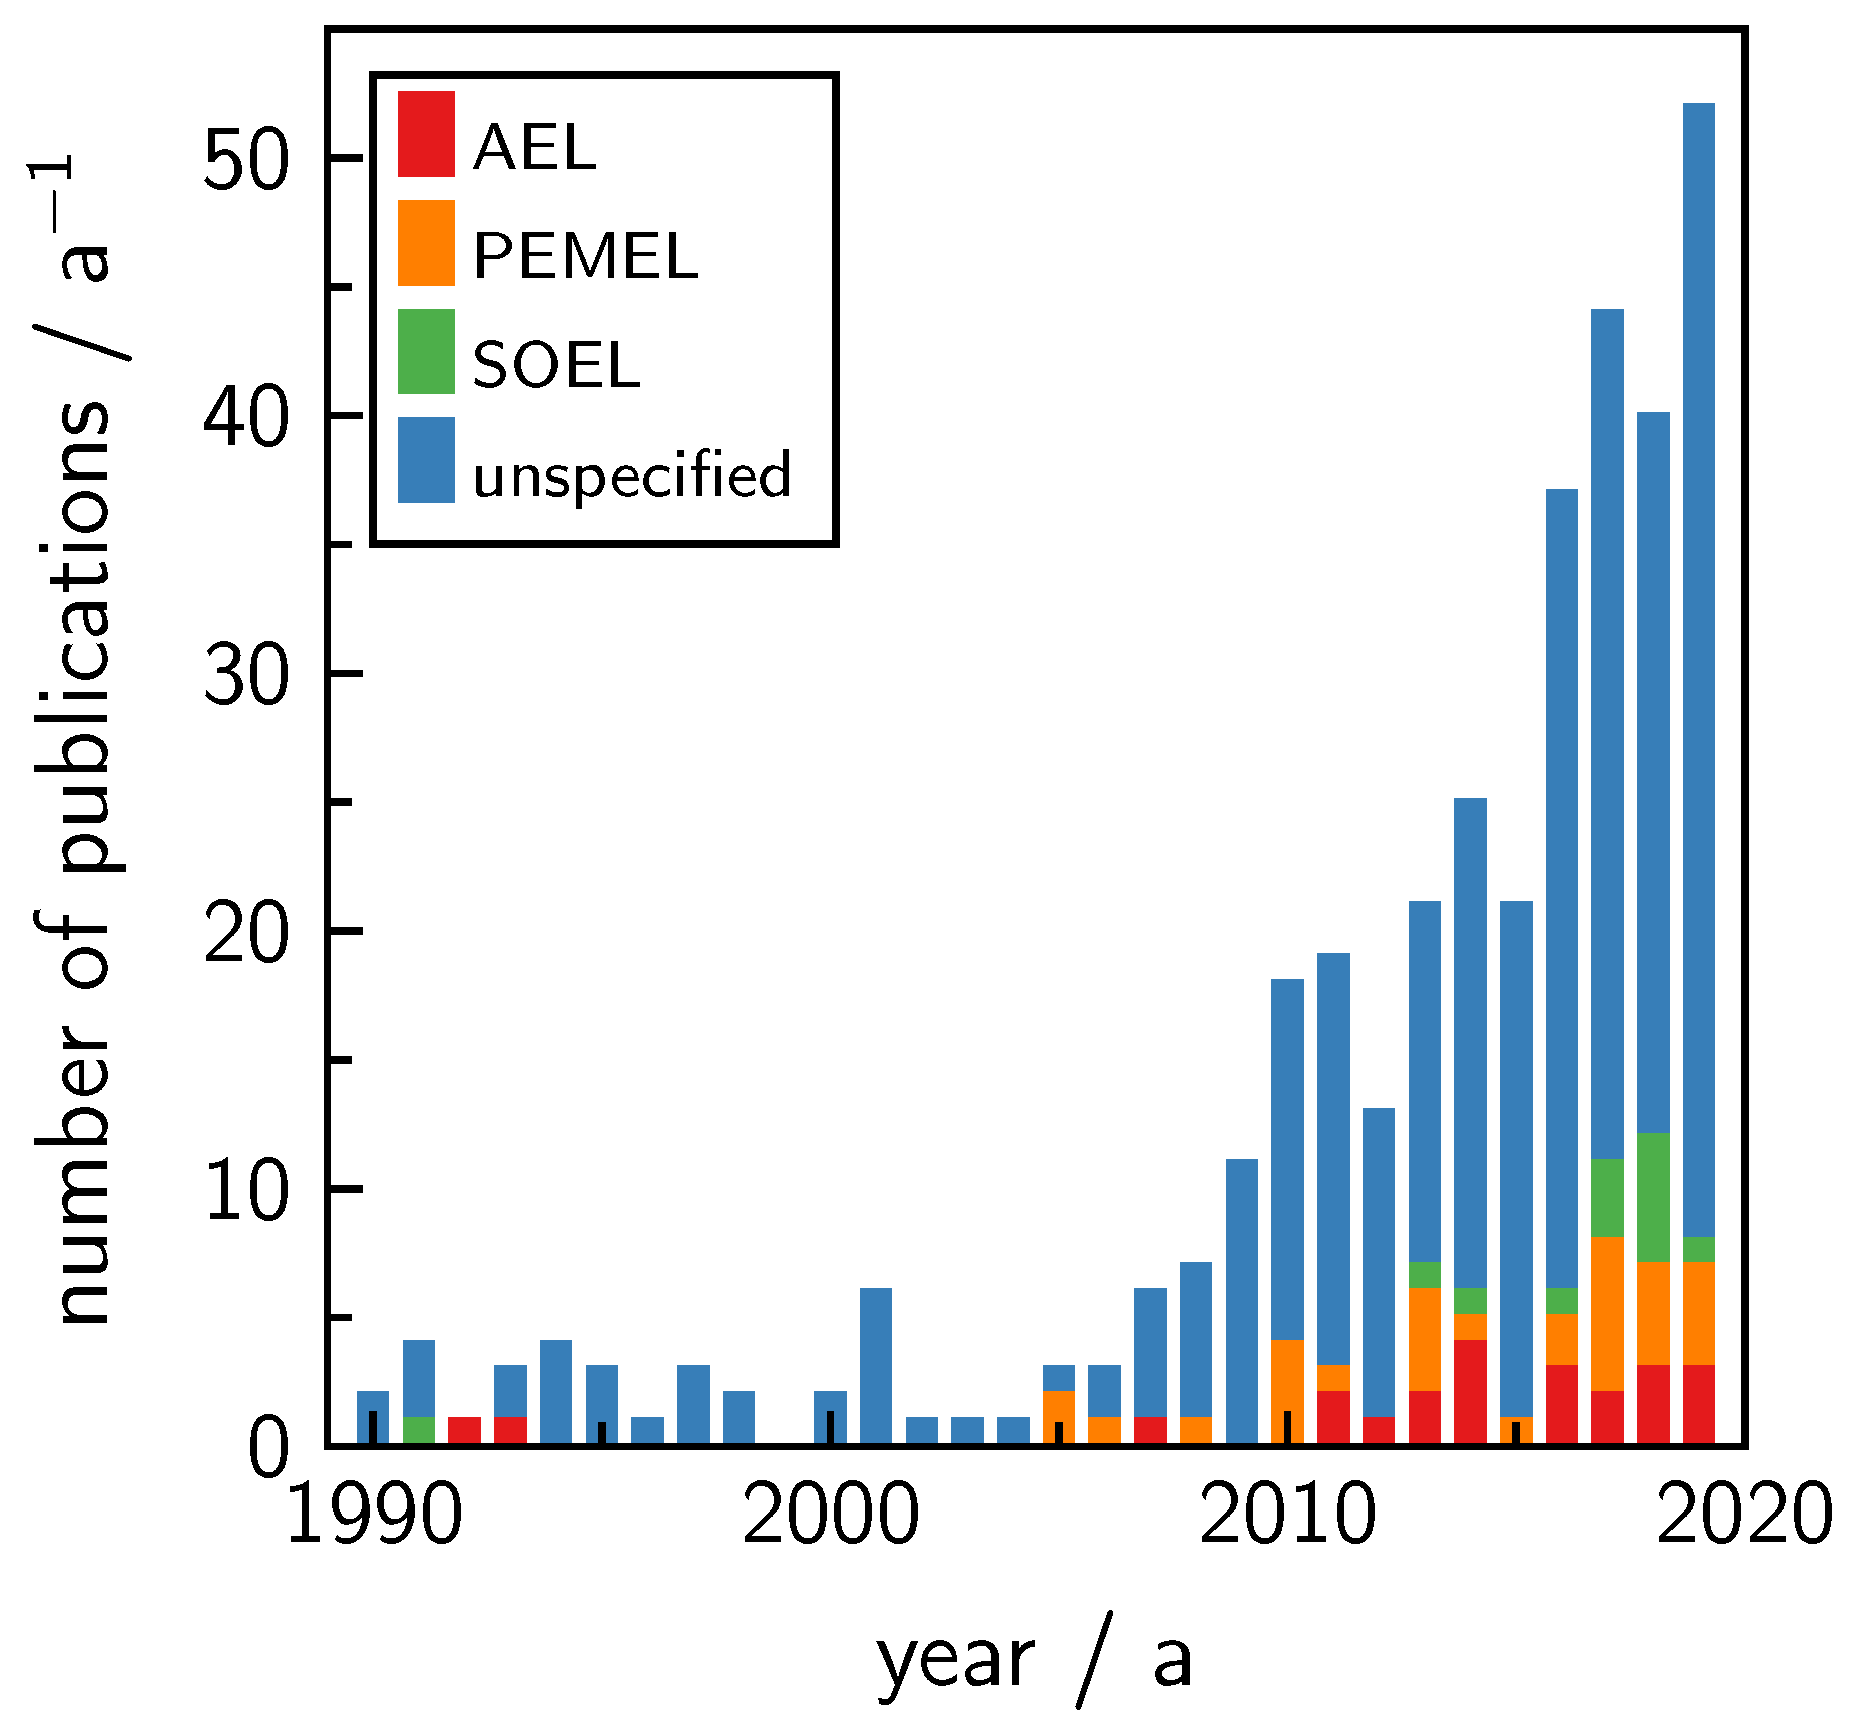
This study mainly contains literature that was obtained with the keywords alkaline electrolyzer (or electrolyser or electrolysis) in combination with one of the following words: Renewable, sustainable, green, dynamic, fluctuation, intermittent, solar, photovoltaic, wind, and power to gas. For a broader overview, additional literature is also included. Figure 1 shows the number of annual publications that are listed in the Web of Science Database for the given keywords from 1990 to 2019. Additionally, the keyword alkaline is replaced by other water electrolysis technologies to show the share of technology-specific publications [26]. Around 2010, the number of annual publications started to increase persistently due to the discussion about the energy turnaround, especially in Germany and other European countries [9,27]. Furthermore, the topic is often discussed technology-independently, as the number of technology-specific publications is small compared to publications with unspecified water electrolysis technologies. While the low-temperature technologies, AEL and PEMEL, show an equal share of technology-specific publications, the high-temperature technology SOEL is mentioned less. This distribution reflects the recent considerations of which technology may be favored for sustainable hydrogen production. Particularly, alkaline water electrolysis is considered as the most reliable method for large-scale hydrogen production [5,21].
2. Alkaline Water Electrolysis
Alkaline water electrolysis is used to split water into the gases hydrogen and oxygen using electric energy. The chemical reactions are given in the Equations (1)–(3). At the cathode, water molecules are reduced by electrons to hydrogen and negatively charged hydroxide ions. At the anode, hydroxide ions are oxidized to oxygen and water while releasing electrons. Overall, a water molecule reacts to hydrogen and oxygen in the ratio of 2:1.
The required cell voltage for this electrochemical reaction can be determined by thermodynamics. The free reaction enthalpy in (4) can be calculated with the reaction enthalpy , the temperature T, and the reaction entropy .
The reversible cell voltage in (5) is determined by the ratio of the free reaction enthalpy to the product of the number of exchanged electrons and the Faraday constant F (96,485 Cmol−1) [28].
At a temperature of 25 °C and an ambient pressure of 1 bar (standard conditions), the free reaction enthalpy for the water splitting reaction is , which leads to a reversible cell voltage of . As the free reaction enthalpy is positive at standard conditions, the water splitting is a non-spontaneous reaction [28]. Due to irreversibilities, the actual cell voltage needs to be higher than the reversible cell voltage for the water splitting reaction. The thermoneutral voltage in Equation (6) depends on the reaction enthalpy , which is composed of the free reaction enthalpy and irreversible thermal losses .
At standard conditions, the reaction enthalpy for water electrolysis is . Hence, the thermoneutral voltage is [28].
3. System
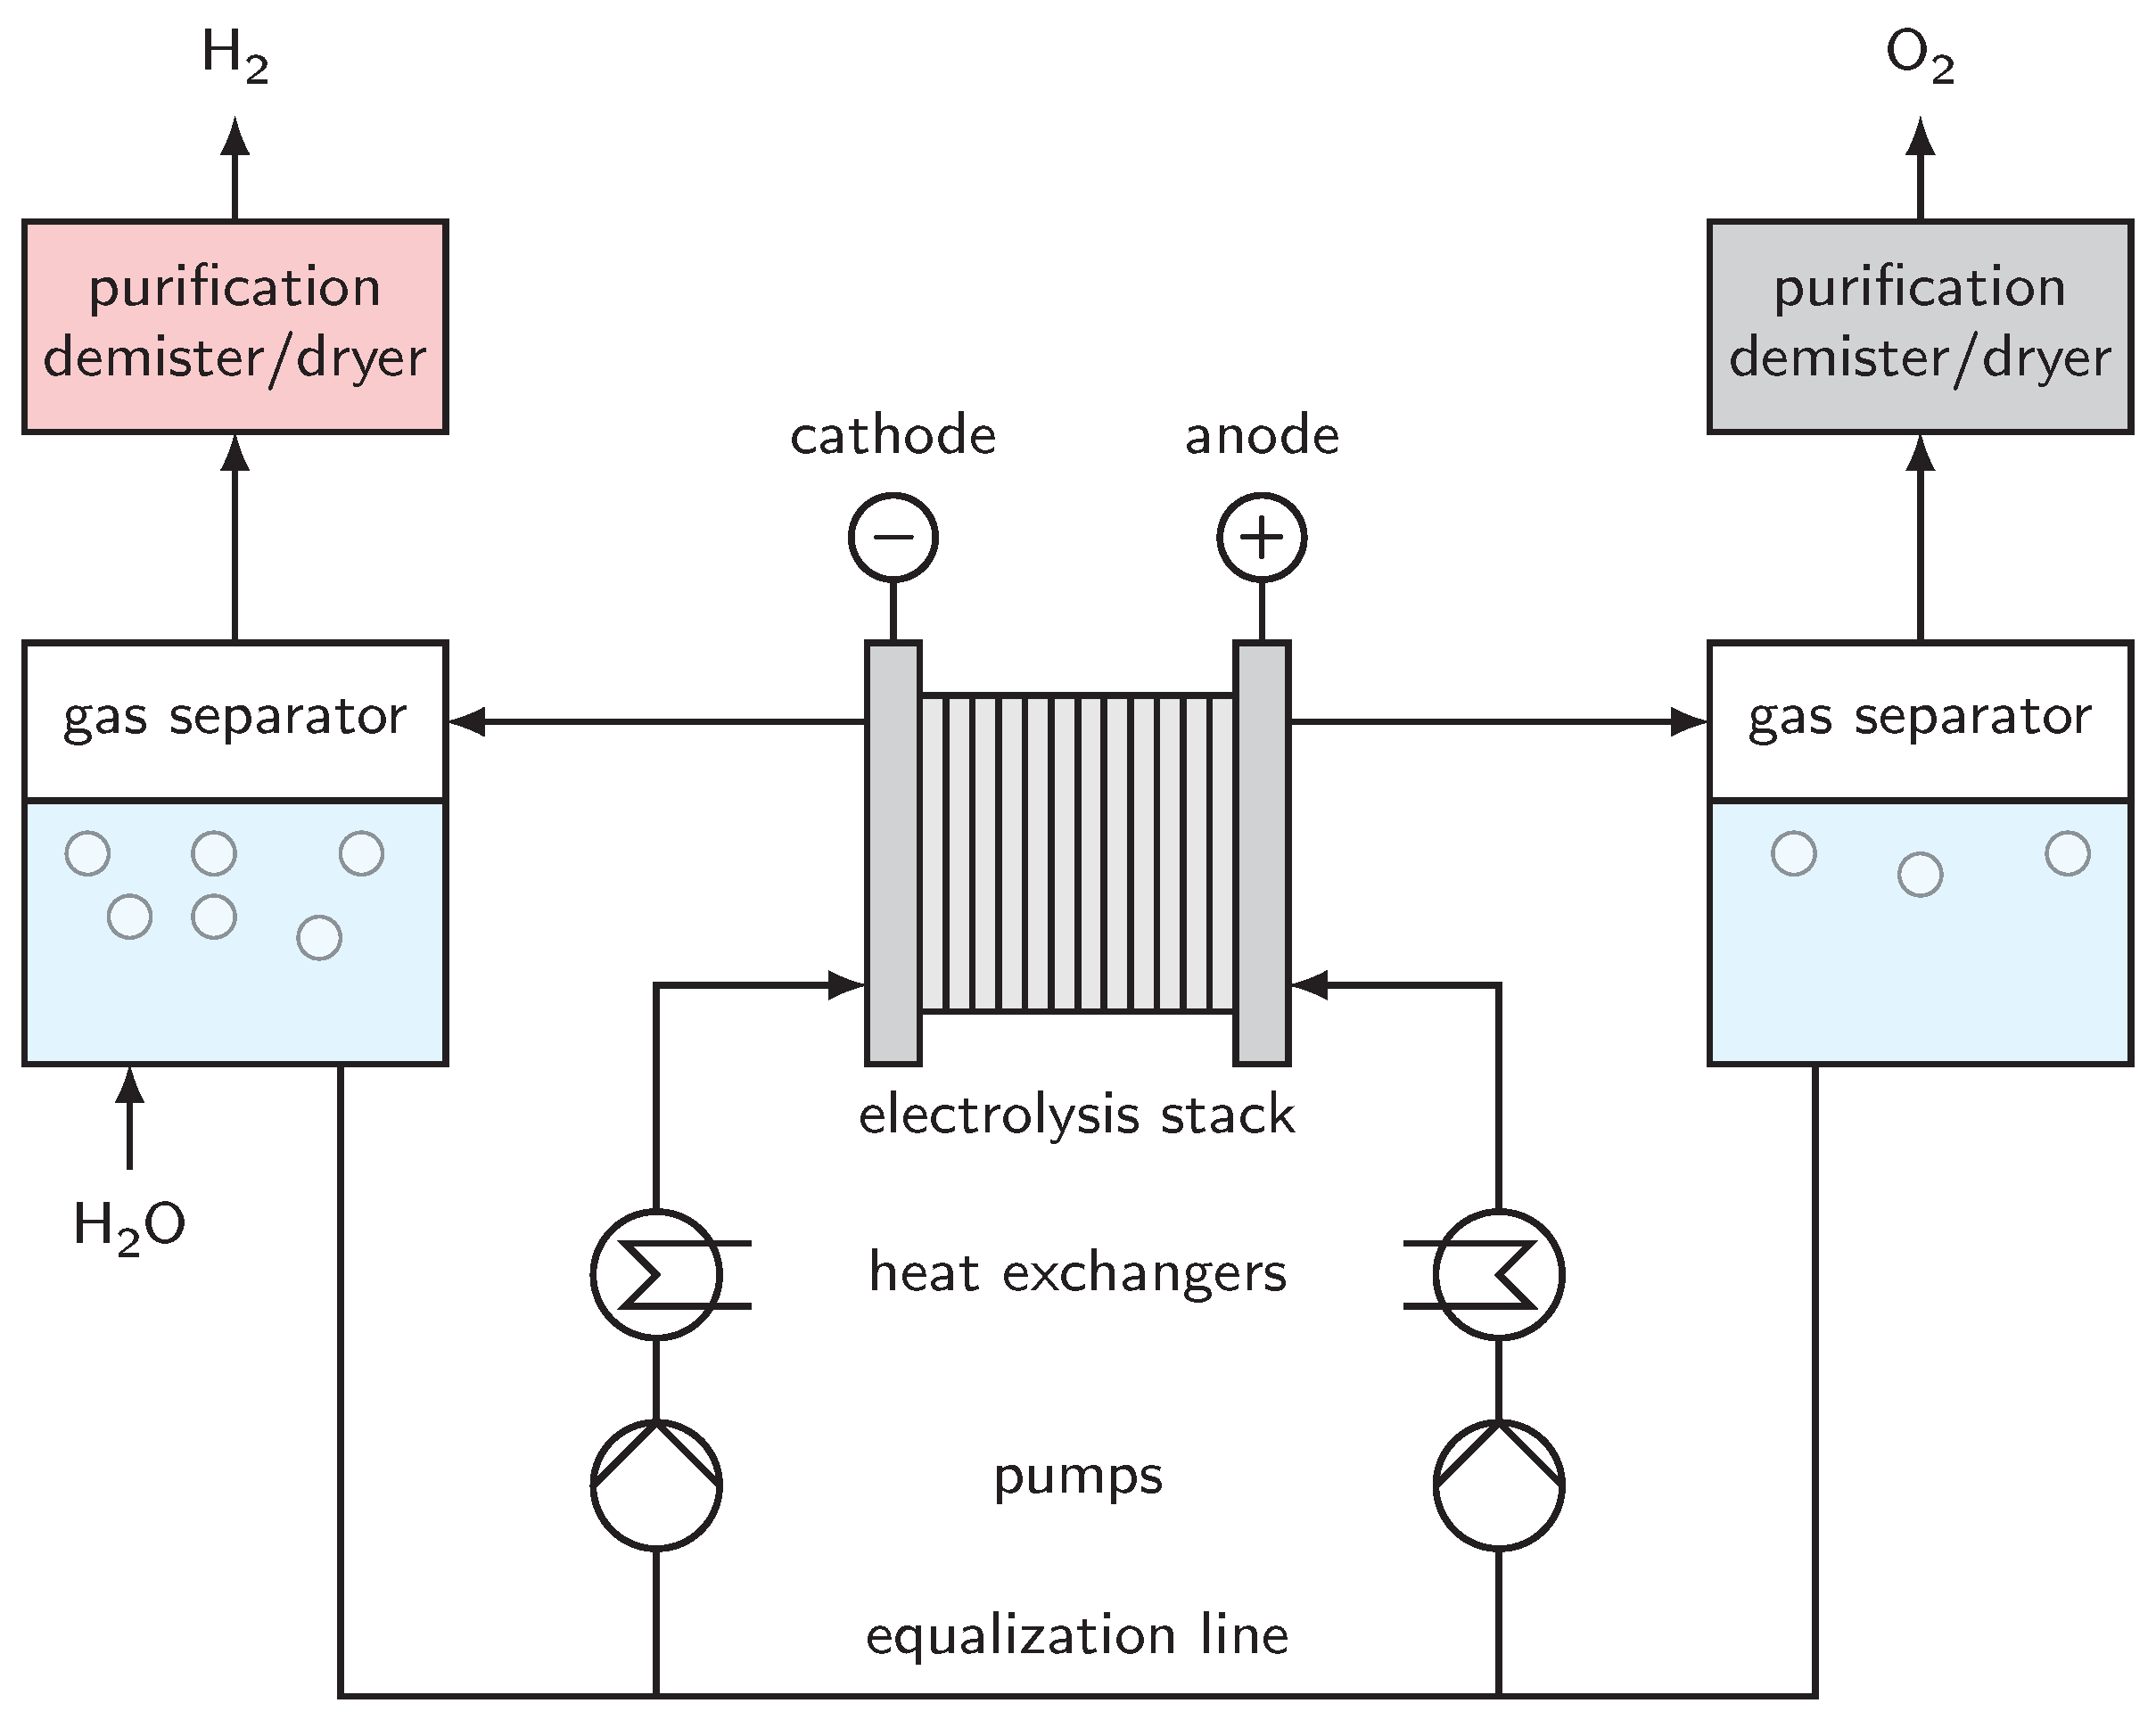
A schematic flow diagram of alkaline water electrolysis is shown in Figure 2. The electrolyte is pumped through the electrolysis stack, where the product gases are formed. While natural convection can be a cost-efficient alternative, gas coverage of the electrode surface can raise the required cell voltage and therefore increase the operational costs [29]. Additionally, most alkaline water electrolyzer systems provide a temperature control for the electrolyte to maintain an optimal temperature range.
The two-phase mixtures of liquid electrolyte and product gas leave the electrolysis cell and enter subsequent gas separators. Mostly, the phase separation is realized with a high residence time in large tanks. The product gas is demisted and dried before it is purified to the desired level [30]. The liquid electrolyte leaves the gas separator and is pumped back to the electrolysis stack. As the product gases are soluble in the electrolyte solution, the mixing of both electrolyte cycles causes losses and higher gas impurities. An alternative can be to use partly separated electrolyte cycles with an equalization line for liquid level balancing of both vessels [31,32]. With separated electrolyte cycles, the electrolyte concentration will increase on the cathodic side due to water consumption and decrease on the anodic side due to water production. Therefore, the electrolyte requires mixing, on occasion, to maintain an optimal electrolyte conductivity.
4. Cell Design and Cell Voltage
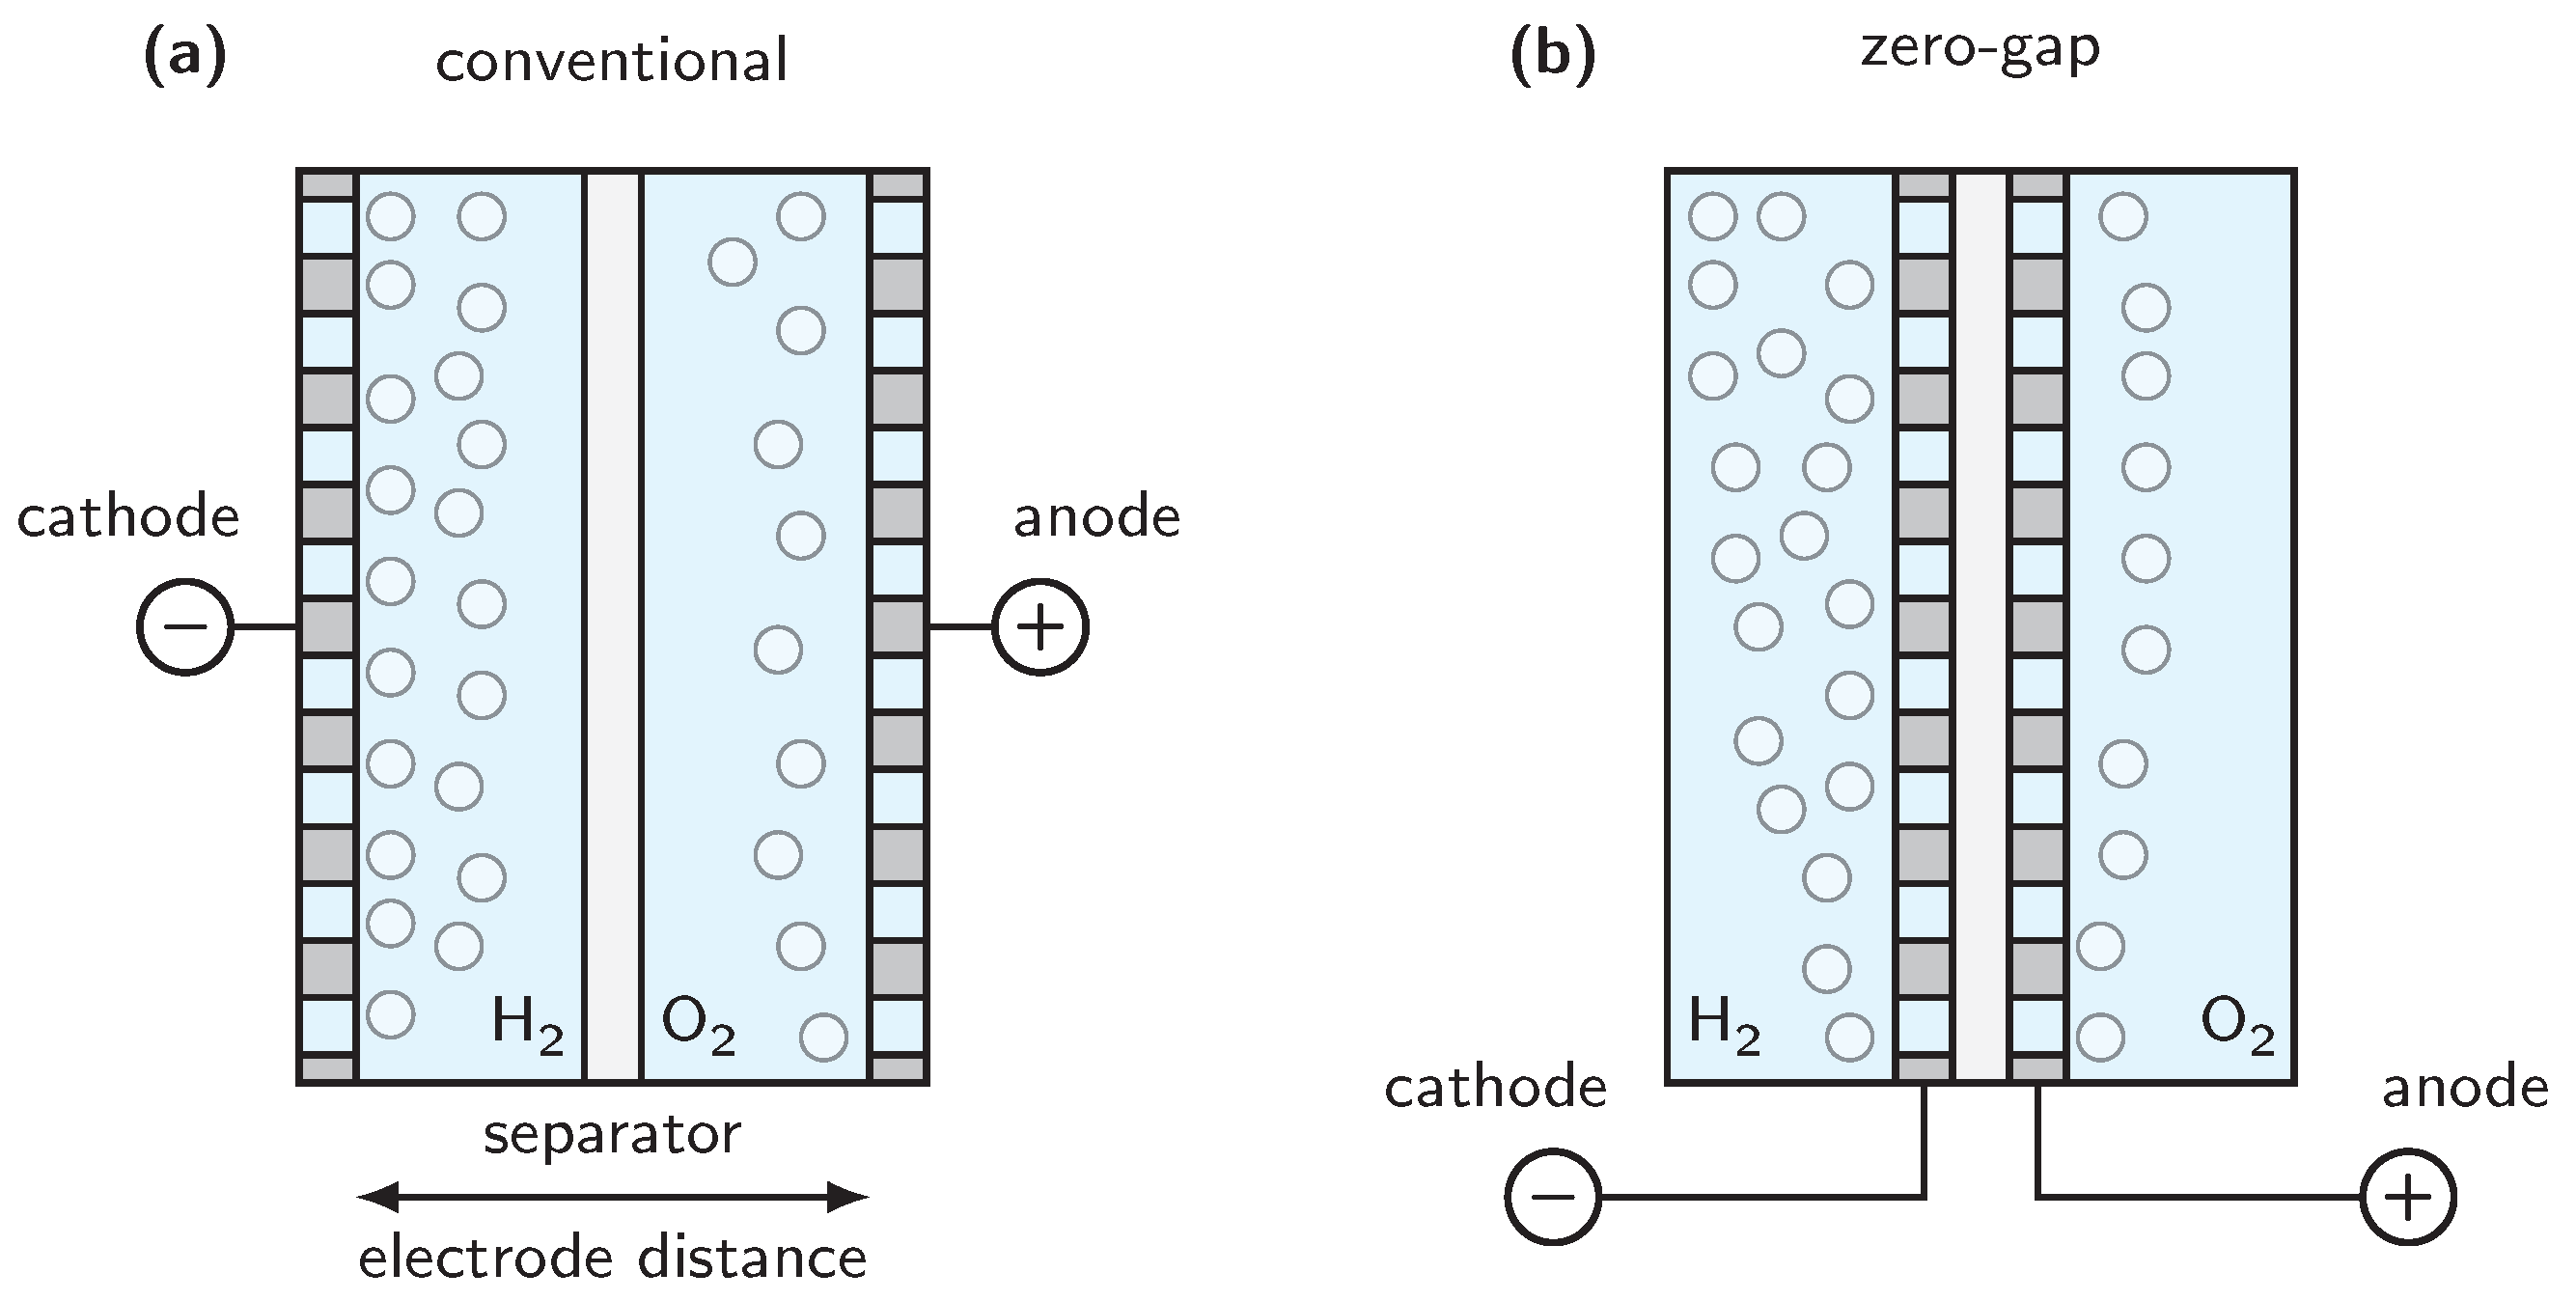
The design of the electrolysis stack depends on the manufacturer; however, some general similarities can be observed. Two variants of cell designs are shown in Figure 3. Earlier alkaline water electrolyzers used a conventional assembly with a defined distance between both electrodes. Later, this concept was replaced by the zero-gap assembly, where the electrodes are directly pressed onto the separator to minimize ohmic losses due to the electrolyte. Porous materials like Zirfon™ Perl UTP 500 (AGFA) or dense anion exchange membranes can be used as the separator [33,34,35,36,37].
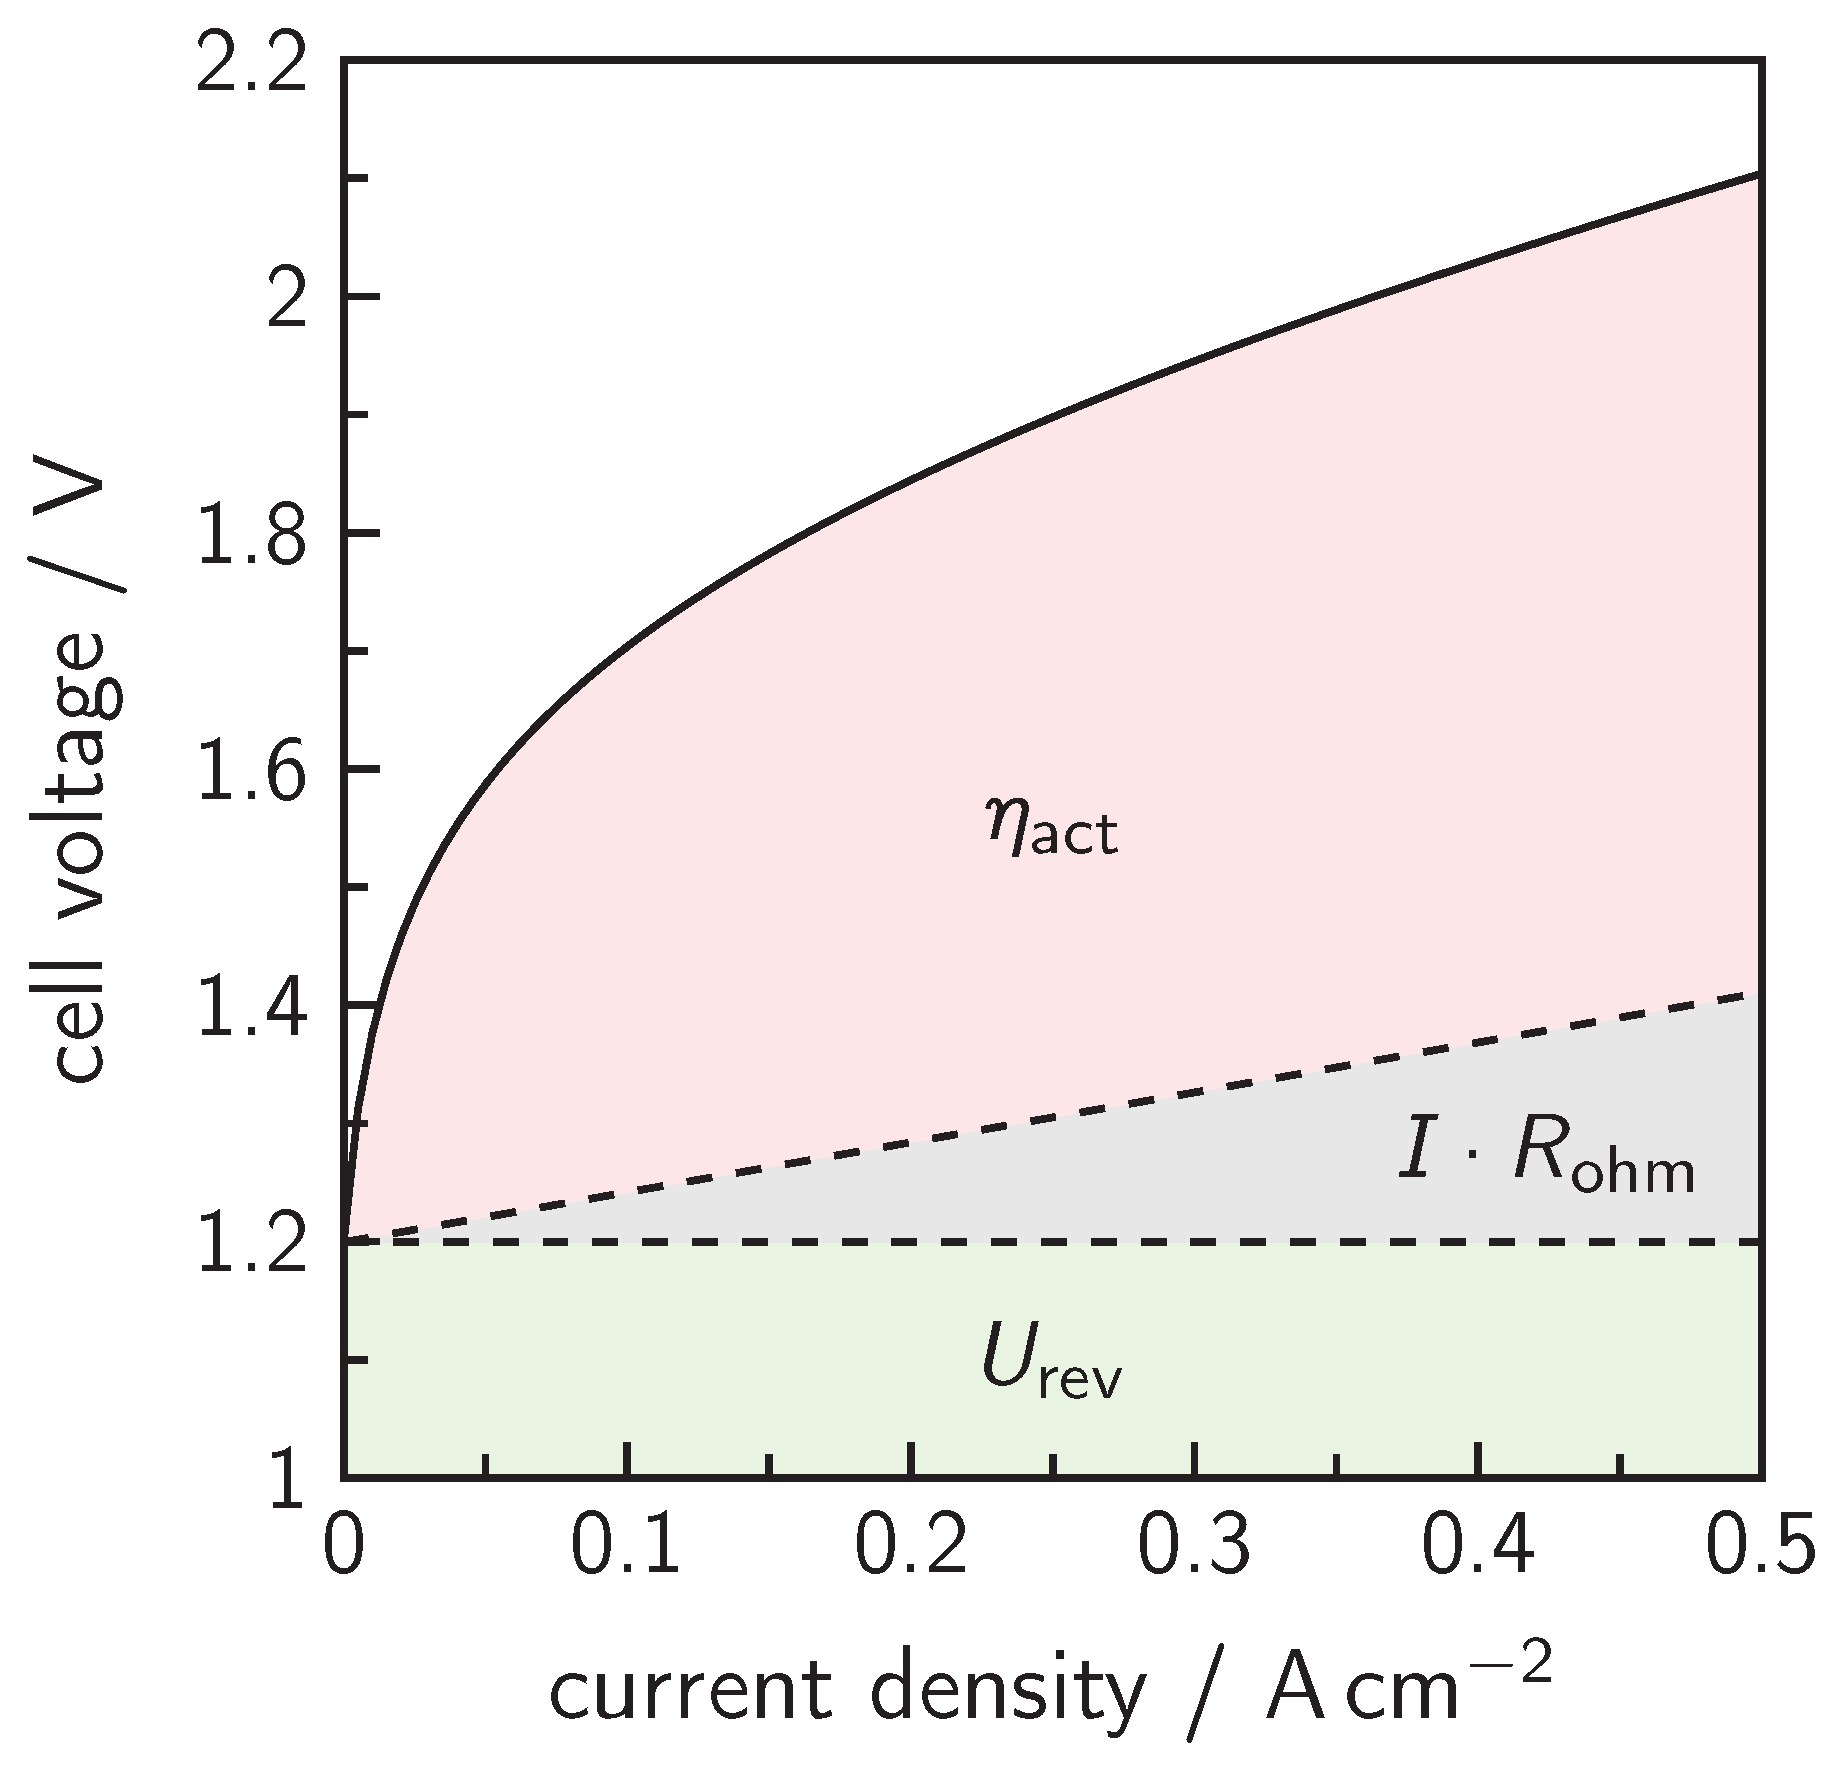
During operation, the required cell voltage is always higher than the reversible cell voltage due to different effects. A calculated cell voltage profile is displayed in Figure 4. In addition to the ohmic losses, , there are activation overvoltages of the electrodes, . The ohmic resistance of the cell design is affected by the electronic conductivity of the electrode material, the specific conductivity of the electrolyte, the ionic conductivity of the separator material, and gas bubble effects.
The zero-gap design tries to eliminate the electrolyte losses by minimizing the electrode distance. There is still a minimal gap between both electrodes, which can increase the cell voltage. The activation overvoltages are defined by the electrode materials. Whereas nickel is the most-used electrode material, it provides very high overvoltages for the oxygen and hydrogen evolution reactions [41,42,43,44]. Hence, electrocatalytic materials are added to the electrodes. Iron is a cost-efficient catalyst for the oxygen evolution reaction [41,42,45]. Molybdenum decreases the overvoltage for the evolution of hydrogen at the cathode [44,46,47].
Several authors have proposed correlations for the modeling of cell voltage. Equation (7) considers the operation temperature and the current density j by describing the dependencies with empirical parameters. While the parameters reflect ohmic losses, s and stand for the activation overvoltages of the hydrogen and oxygen evolution reactions [28].
This correlation can be extended with the effects of the operation pressure p in (8) by adding the empirical parameters , which specify the additional losses owing to pressurized operation [39]. In general, the reversible cell voltage increases with the pressure; however, the ohmic resistance caused by the gas bubbles decreases as the bubble diameter becomes smaller. Hence, both effects equalize each other and only small differences can be observed [48].
The correlations (7) and (8) are empirical and therefore only valid for the actual system to which they are adjusted. The correlation parameters and a suitable equation for the reversible cell voltage under atmospheric conditions can be found in the Appendix A in Table A1 and Equation (A1). Other authors have proposed physically reasonable models based on actual dimensions and properties of the system rather than on empirical correlations.
An example for such an approach is Equation (9), in which the terms are split into experimentally determinable parts [49].
The cell voltage is calculated with the reversible voltage , the activation overvoltages , and the ohmic resistances. Whereas and represent the reciprocal electronic conductivity of the electrode materials, stands for the ohmic loss caused by the electrolyte conductivity. Additionally, the ohmic resistance of the separator material is taken into account. The activation overvoltages can be calculated with the Butler–Volmer equation. In most cases, the simplified Tafel equation is sufficient to describe the resulting overpotentials [40]. The required Tafel slope and exchange current density can be extracted from experimental data. Hence, those parameters are only valid for the actual system design; however, they can be easily replaced by other data when needed. As the ohmic resistances of the electrodes ( and ) only depend on the electronic conductivity and electrode dimensions, both values are known. In most cases, the ohmic resistance of the electrode is comparably small and can be neglected. The electrolyte resistance is determined by the specific electrolyte conductivity and the cell design. Whereas the electrolyte gap is minimal in zero-gap designs, conventional setups maintain a defined distance between both electrodes. As the specific conductivity of the electrolyte gap is affected by gas bubbles, there is an optimal electrode distance for conventional designs [50]. If the electrode distance is too small, the gas bubbles accumulate in the gap and lower the conductivity. With increasing distance, the bubble detachment is enhanced and the specific conductivity increases. It is a trade-off between a small electrolyte gap—as the ohmic resistance increases linearly with this parameter—and a better conductivity of the space between both electrodes. In addition to the decreasing electrolyte conductivity with higher amounts of gas bubbles, the active electrode surface can be blocked by gaseous compounds, which leads to additional losses [49]. As this phenomenon depends on the cell design and operation concept, there are difficulties in describing it properly. Therefore, it is often neglected, or empirical correlations referring to the gas hold-up are utilized [49].
Furthermore, the installed separator material also has significant ohmic losses. While the porous separator Zirfon™ Perl UTP 500 is often used, anion exchange membranes are promising alternatives. For Zirfon™-based materials, experimental data of the resistance at a fixed electrolyte concentration for different temperatures are available [51].
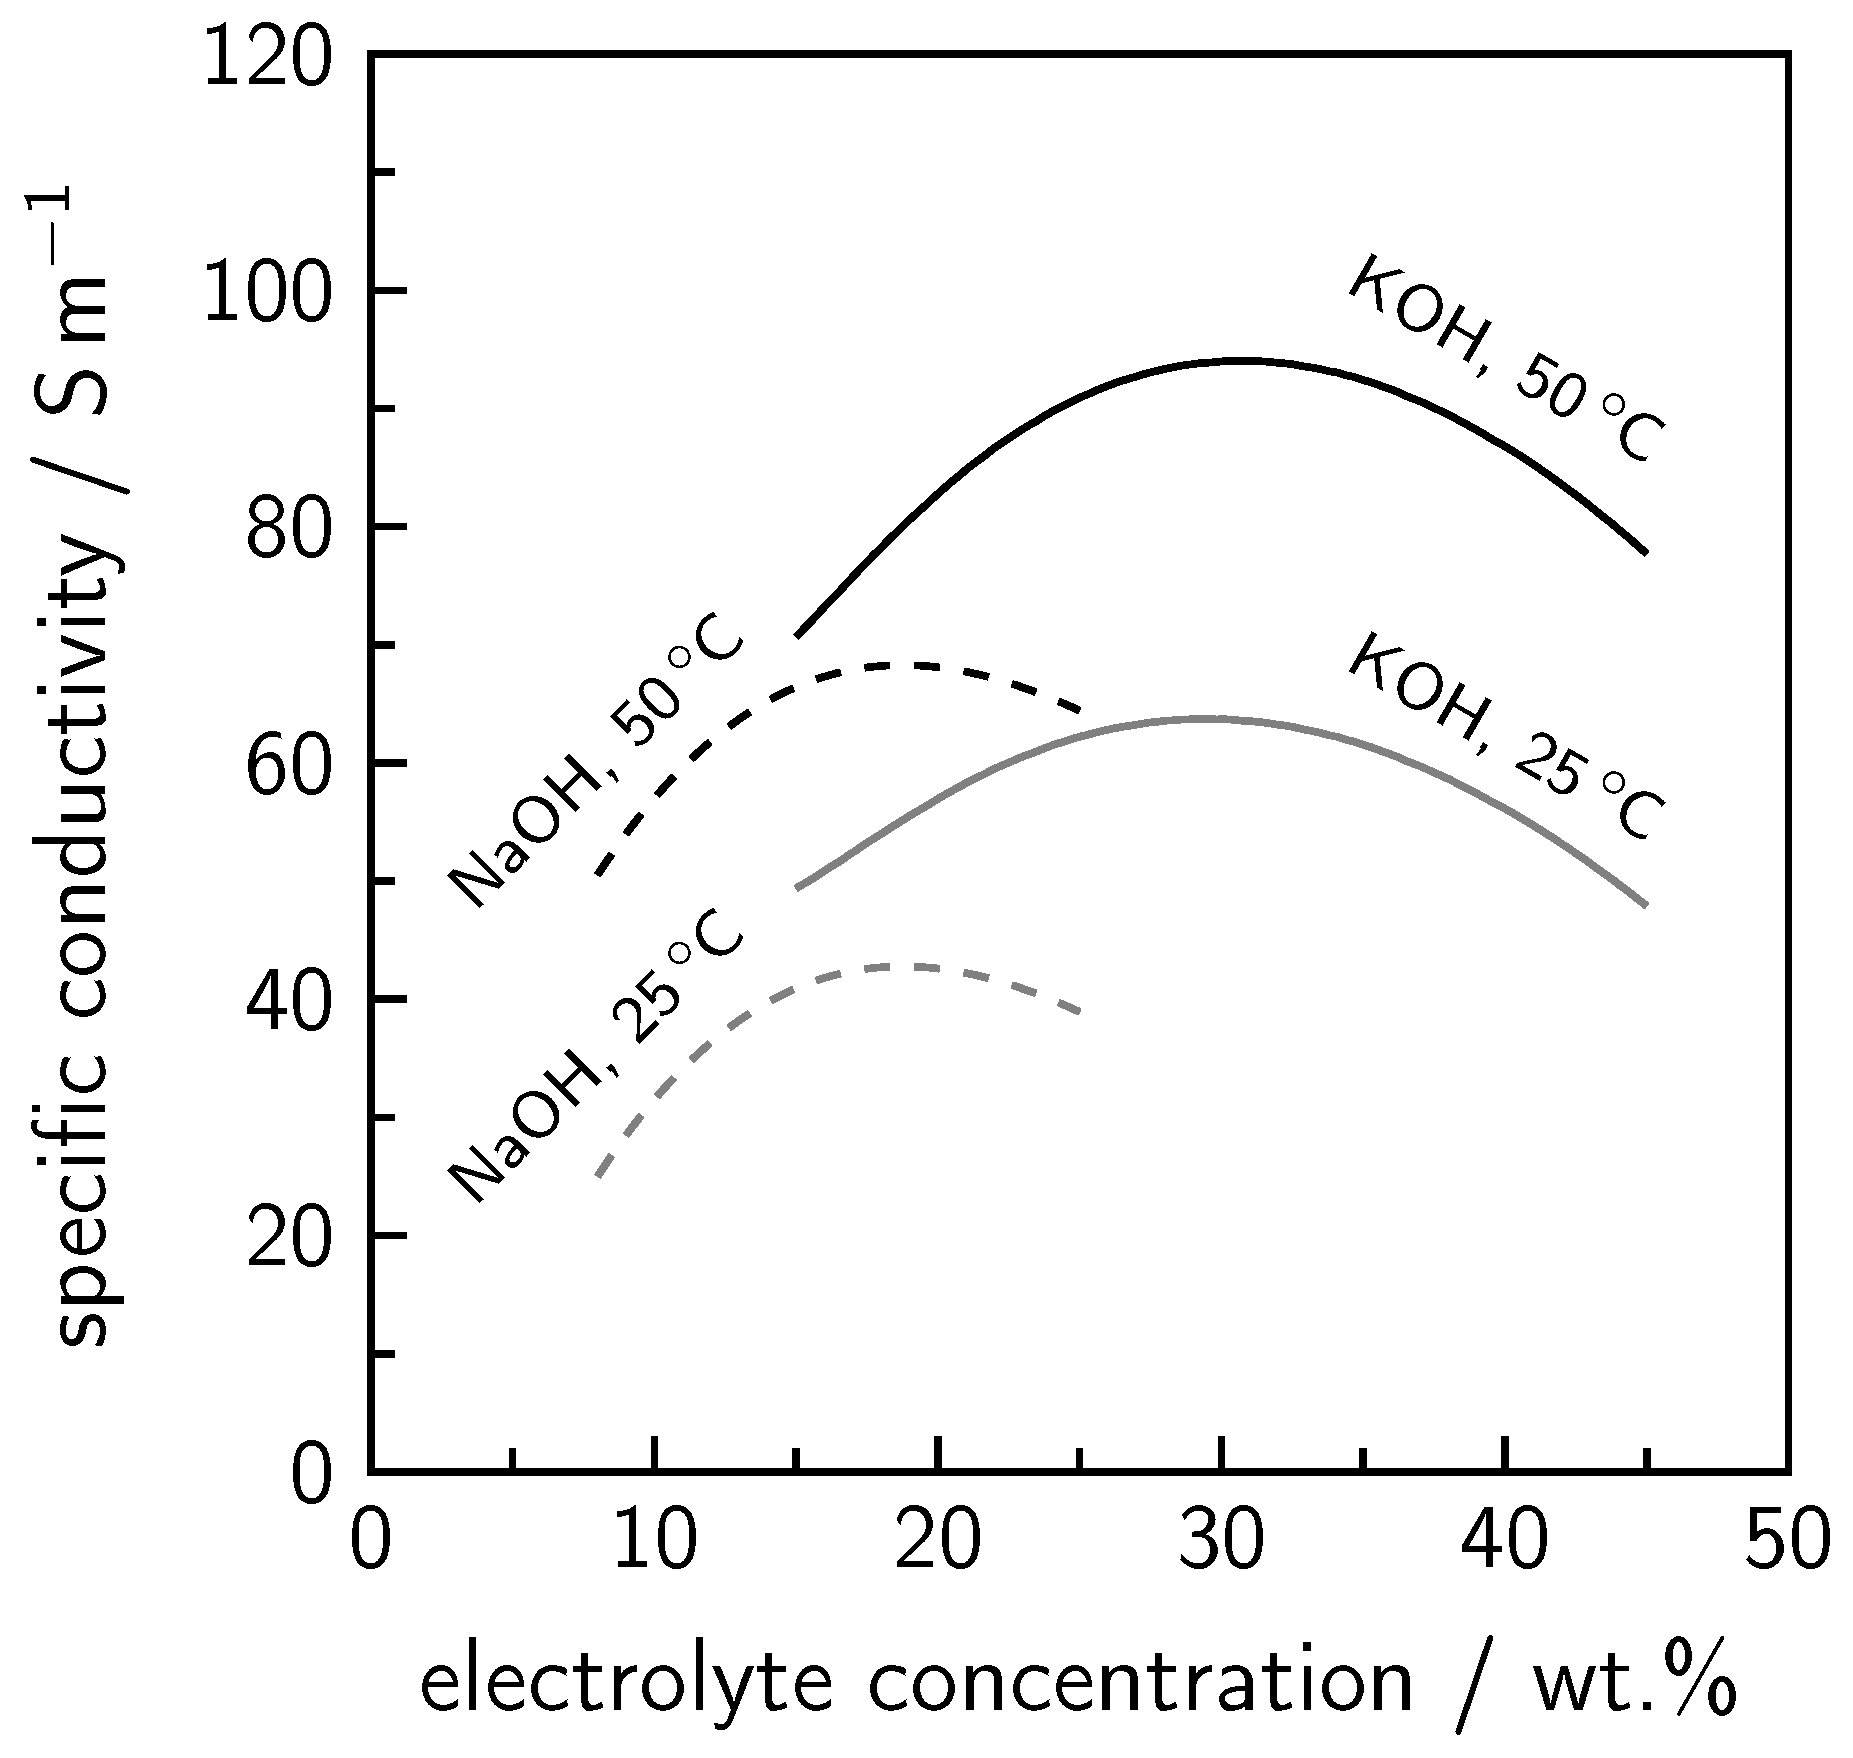
The most-used electrolyte for alkaline water electrolysis is an aqueous solution of potassium hydroxide (KOH) with 20 to 30 wt.% KOH, as the specific conductivity is optimal at the typical temperature range from 50 to 80 °C [25]. A cheaper alternative would be a diluted sodium hydroxide solution (NaOH), which has a lower conductivity [52]. Calculated specific electrolyte conductivities for both electrolyte solutions at different temperatures are shown in Figure 5. While KOH provides a specific conductivity around 95 Sm−1 at 50 °C, NaOH reaches a value around 65 Sm−1. At a temperature of 25 °C, a similar effect can be seen. The conductivity of KOH is around 40 to 50% higher than the conductivity of a NaOH solution at the optimal weight percentage. Another aspect is the solubility of the product gases inside the electrolyte, as this influences the resulting product gas purity. In general, the gas solubility decreases with an increasing electrolyte concentration due to the salting-out behavior [53]. NaOH also shows a slightly higher salting-out effect than that of KOH. Hence, the product gas solubility is higher in a KOH solution [54,55,56].
Another approach is to use ionic liquids (ILs) as the electrolyte or as an additive, owing to their remarkable properties [5,6,21]. Ionic liquids are organic substances which are liquid at room temperature and are electrically conductive [58]. A negligible vapor pressure, non-inflammability, and thermal stability are promising arguments for their utilization in water electrolysis. Furthermore, ILs can be used over a wide electrochemical window [59]. The absorption and separation of gases is an additional area of application [60,61]. However, the toxicity of ILs is a current field of research, and the viscosity is comparably high, which should be taken into account before any large-scale implementation [6,58,59]. In addition to providing high-efficiency water electrolysis at low temperatures, ILs are chemically inert and therefore do not require expensive electrode materials [62].
5. Gas Purity
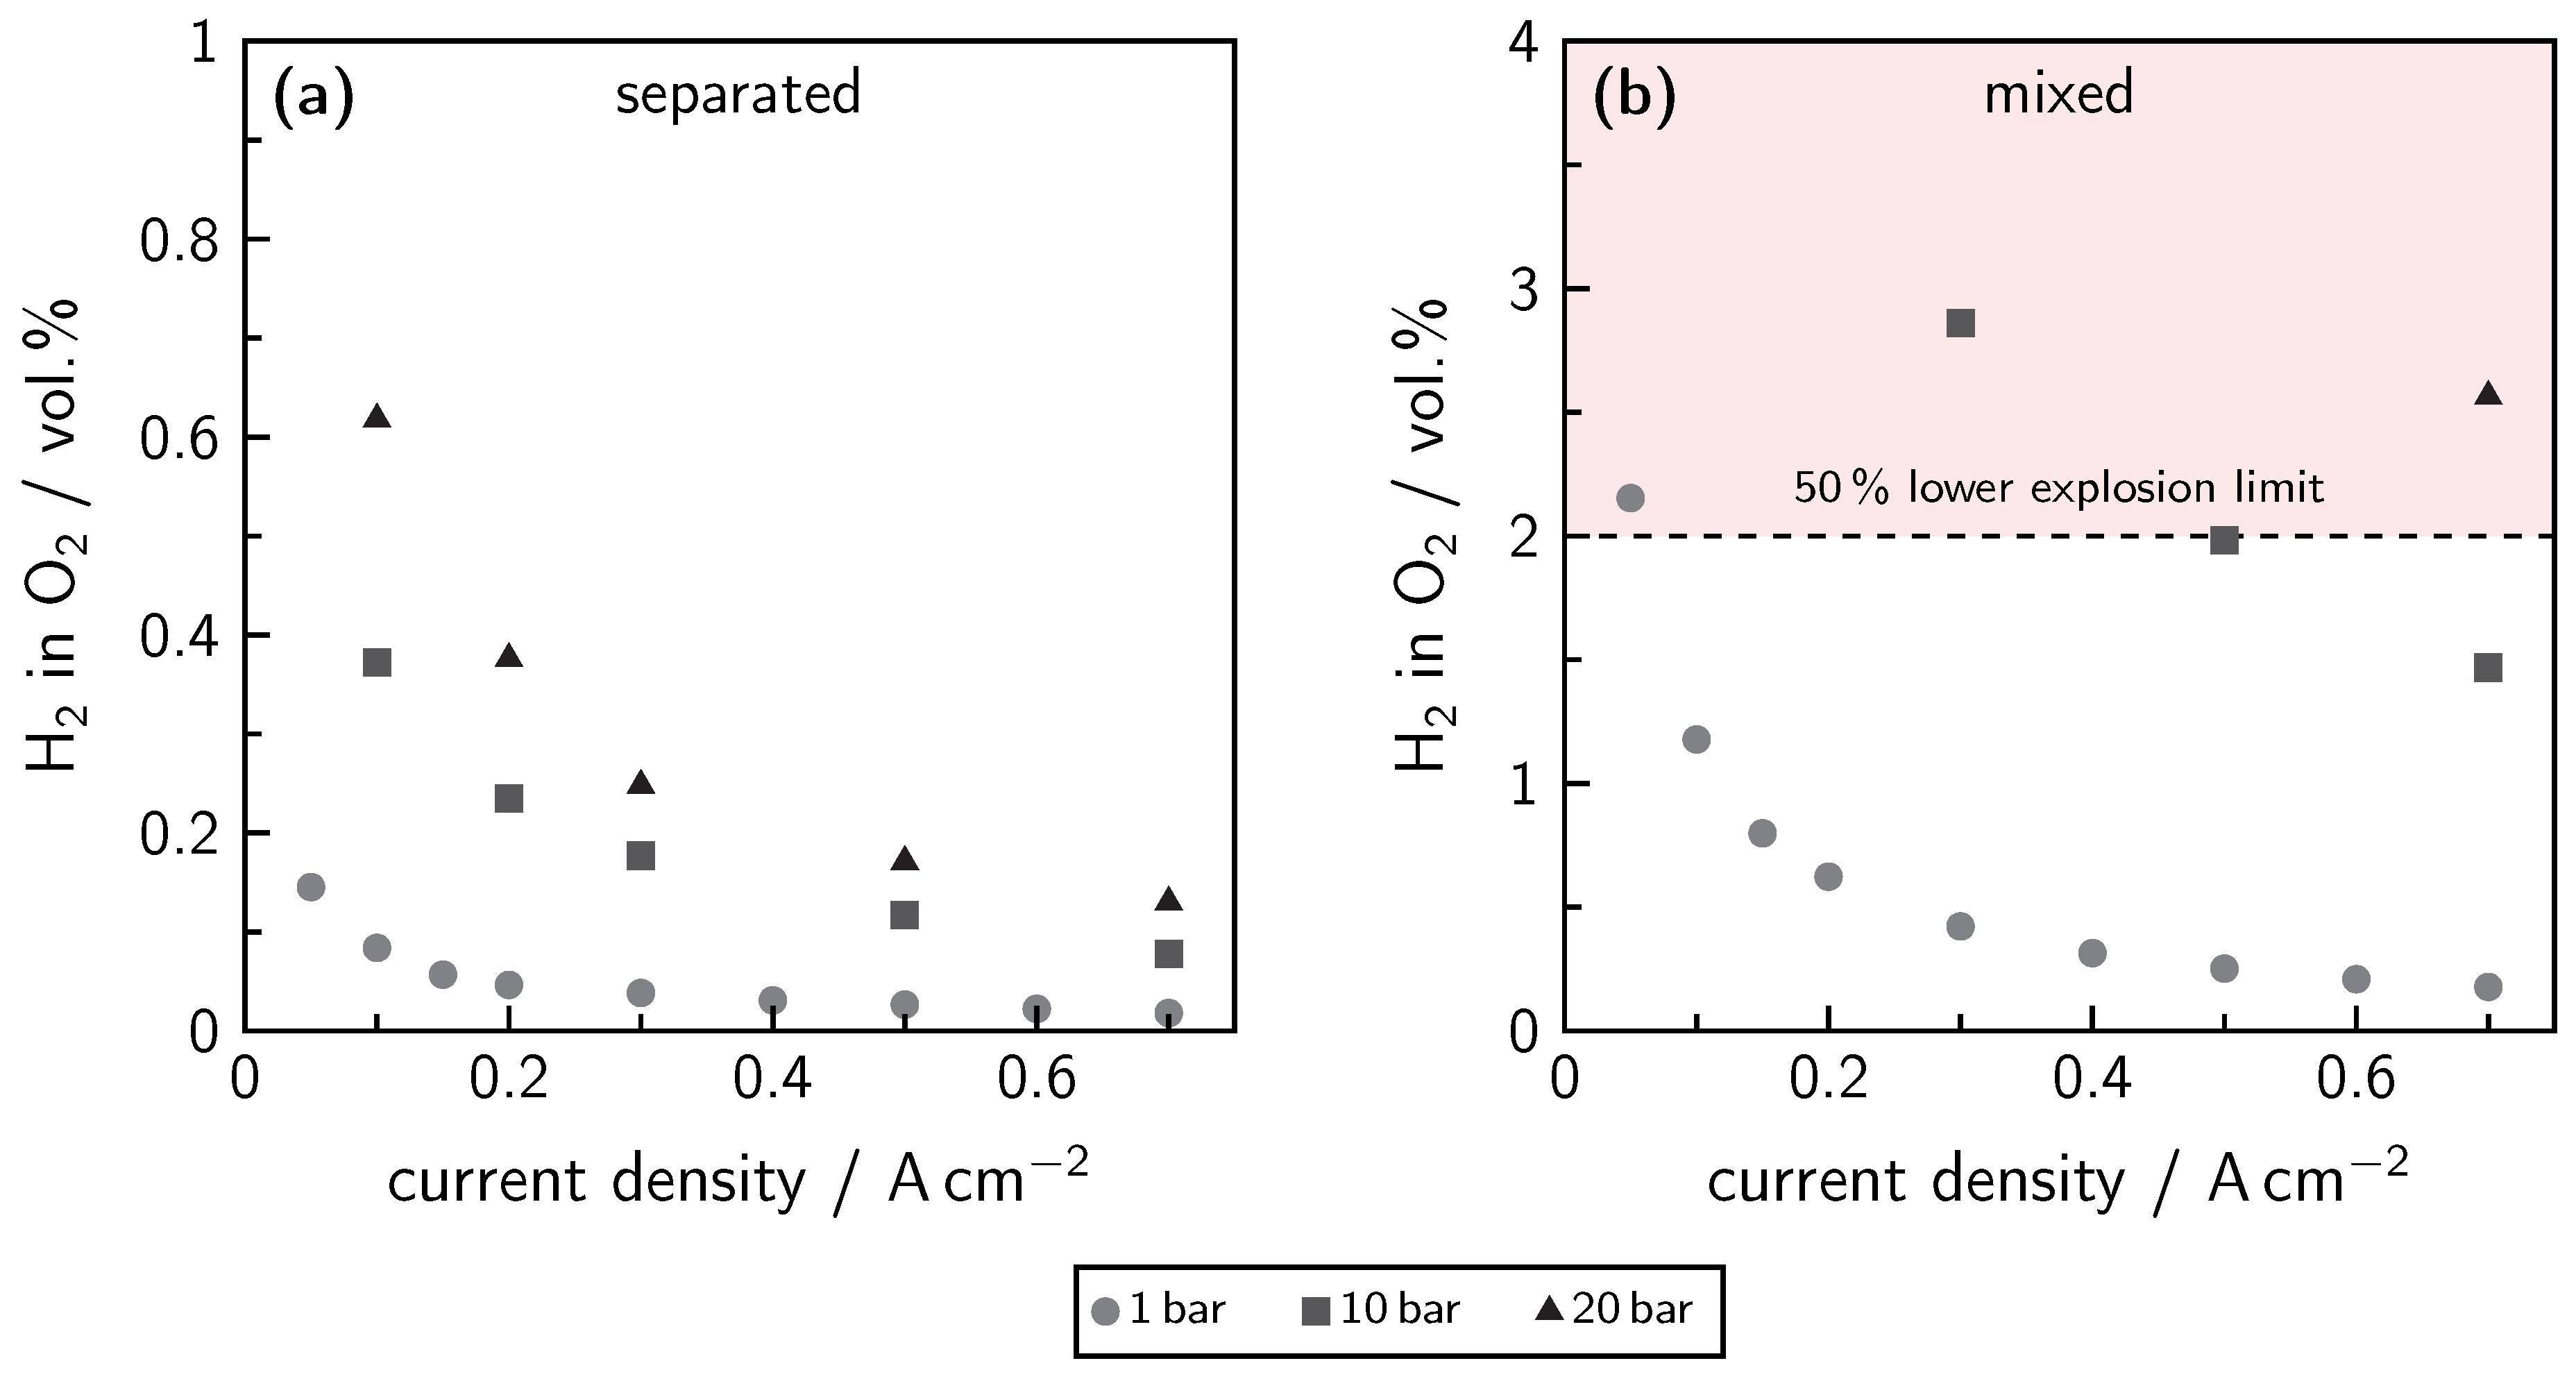
Gas purity is an important criterion of alkaline water electrolysis. While the produced hydrogen typically has a purity higher than 99.9 vol.% (without additional purification), the gas purity of oxygen is in the range of 99.0 to 99.5 vol.% [48]. As both product gases can form explosive mixtures in the range of approximately 4 to 96 vol.% of foreign gas contamination, technical safety limits for an emergency shutdown of the whole electrolyzer system are at a level of 2 vol.% [31,63]. Therefore, the product gas impurity needs to be below this limit during operation to ensure continuous production. Experimentally determined anodic gas impurities for alkaline water electrolysis are presented in Figure 6 for different operation modes. The current densities are in the range from 0.05 to 0.7 A cm−2 and the system pressures range from 1 to 20 bar [64].
While the gas impurities with separated electrolyte cycles are below 0.7 vol.% for all tested current densities and pressure levels, mixing of the electrolyte cycles increases the gas impurity significantly. Furthermore, two similarities can be seen. The gas impurity lowers with increasing current density and increases at higher pressure levels. Both effects are physically explainable. While the contamination flux stays constant with varying current densities, the amount of produced gas becomes lower in a linear relationship. Hence, at a higher current density, the contamination is more diluted than at a lower current density [32,64]. As a consequence, the operation in the part-load range is more critical due to the higher gas impurity. The amount of dissolved product gas increases with pressure; thus, high concentration gradients for the diffusion through the separator material are available, and more dissolved foreign gas reaches the other half-cell when mixing [64]. However, operation at slightly elevated pressures is favorable, as the costly first mechanical compression level can be avoided by the direct compression inside the electrolyzer system [65]. With mixed electrolyte cycles, the gas impurity reaches critical values even at higher current densities during pressurized operation. While at atmospheric pressure, the gas impurity is only at a current density of 0.05 A cm−2, slightly above the safety limit of 2 vol.% H2 in O2, this limit is already reached at 0.5 A cm−2 for a system pressure of 10 bar. At 20 bar, no sufficient gas purity could be measured, as even a current density of 0.7 A cm−2 results in a gas impurity of 2.5 vol.%.
6. Periphery
The operation of alkaline water electrolyzers is also affected by the installed periphery, including power supplies. The output signal may contain a specific number of ripples, which directly influences the process performance [66]. Power supplies with a high ripple propensity lower the overall efficiency and, therefore, signal smoothing is necessary. The ripple formation is avoidable, but the component costs will be higher [67]. In general, thyristor-based power supplies tend to deliver a higher degree of fluctuation, and transistor-based systems output a smoother signal. Additionally, a higher ripple frequency does not affect the system performance as much as the occurrence of low-frequency ripples [68]. Furthermore, a coherence between the ripple behavior of a power supply and the product gas quality of alkaline water electrolysis can be observed [69].
7. Renewable Energy
The combination of alkaline water electrolysis with renewable energy is essential for sustainable hydrogen production without significant carbon dioxide emissions. While solar and wind energy are often favored due to their wide availability, other renewable energies, such as hydropower, biomass, and geothermal energy, are frequently utilized for the base load [7]. The direct usage of renewable energy in the power grid is difficult due to the mismatch between energy demand and production and the limited storage possibilities for electricity. Hence, excess electric energy should be chemically stored in hydrogen for later usage [6]. Due to the fluctuating and intermittent behavior of solar and wind power, alkaline water electrolyzers must be adapted to a dynamic operation. To evaluate the requirements, local weather data can be used to extract the amplitudes and frequencies of fluctuations.
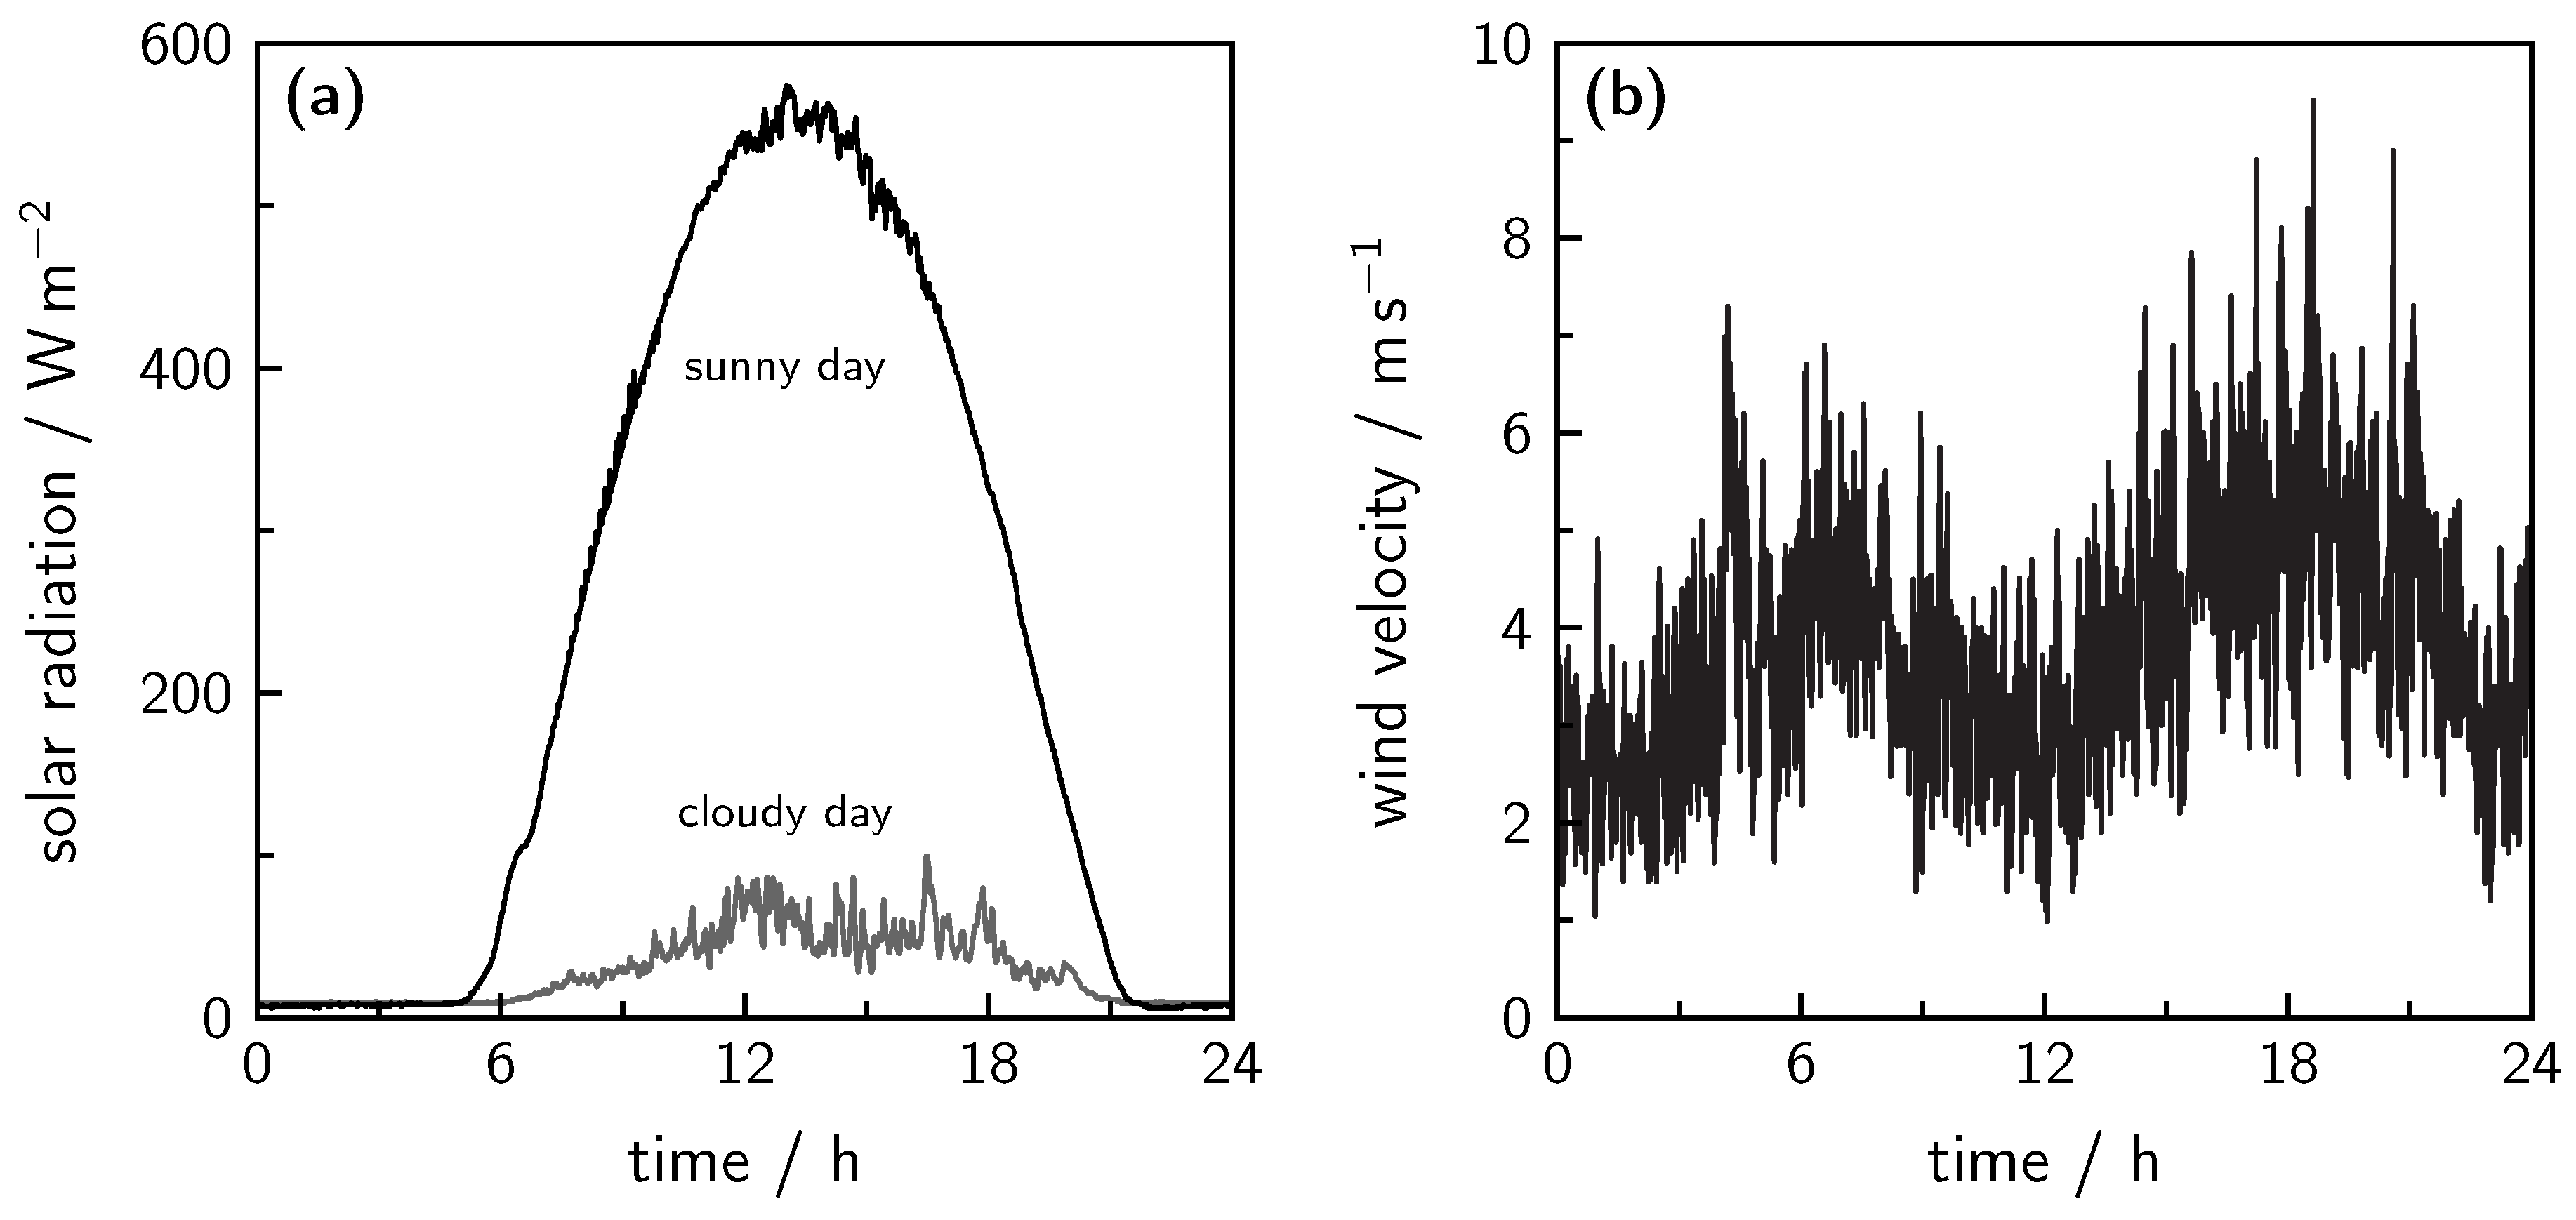
Typical time-related profiles for solar radiation and wind velocity are shown in Figure 7. The data were measured by the weather station of the Clausthal University of Technology on the rooftop of a university building. Whereas the wind velocity shows a mean value of around 3.8 m s−1, the significant solar radiation is only available during the daytime. Hence, the averaged value over the whole day is 233 W m−2 for a sunny day and only 29 W m−2 for a cloudy day.
The volume flow of the produced hydrogen directly follows the renewable energy profile used for operation [70]. Only a short delay is noticeable for the gas purity, which is defined by the system volume [71]. Due to the possibility of direct coupling of water electrolysis and photovoltaic panels, this technology is highly appropriate for renewable hydrogen production [29,72,73]. As photovoltaic panels require high investment costs, wind power is often favored for large-scale hydrogen production. In comparison with photovoltaic power, wind power shows a higher degree of fluctuation and is very intermittent. Therefore, the dynamic operation of alkaline water electrolyzers is more challenging [4].
Hence, the dynamic behavior of an alkaline water electrolyzer can be used to develop suitable system designs and to operate existing systems safely and efficiently. As measurements of solar radiation and wind velocity are often available for a given location, the theoretically available renewable energy can be calculated and used as an input during the system design. Different approaches exist for the calculation of solar photovoltaic power and wind turbine power. While the current–voltage characteristics of photovoltaic panels can be expressed as a function of manufacturer data and solar radiation, the power of wind turbines is a fraction of the maximum available wind power, which is defined by the wind speed and a performance coefficient [72,74].
7.1. Solar Photovoltaic Power
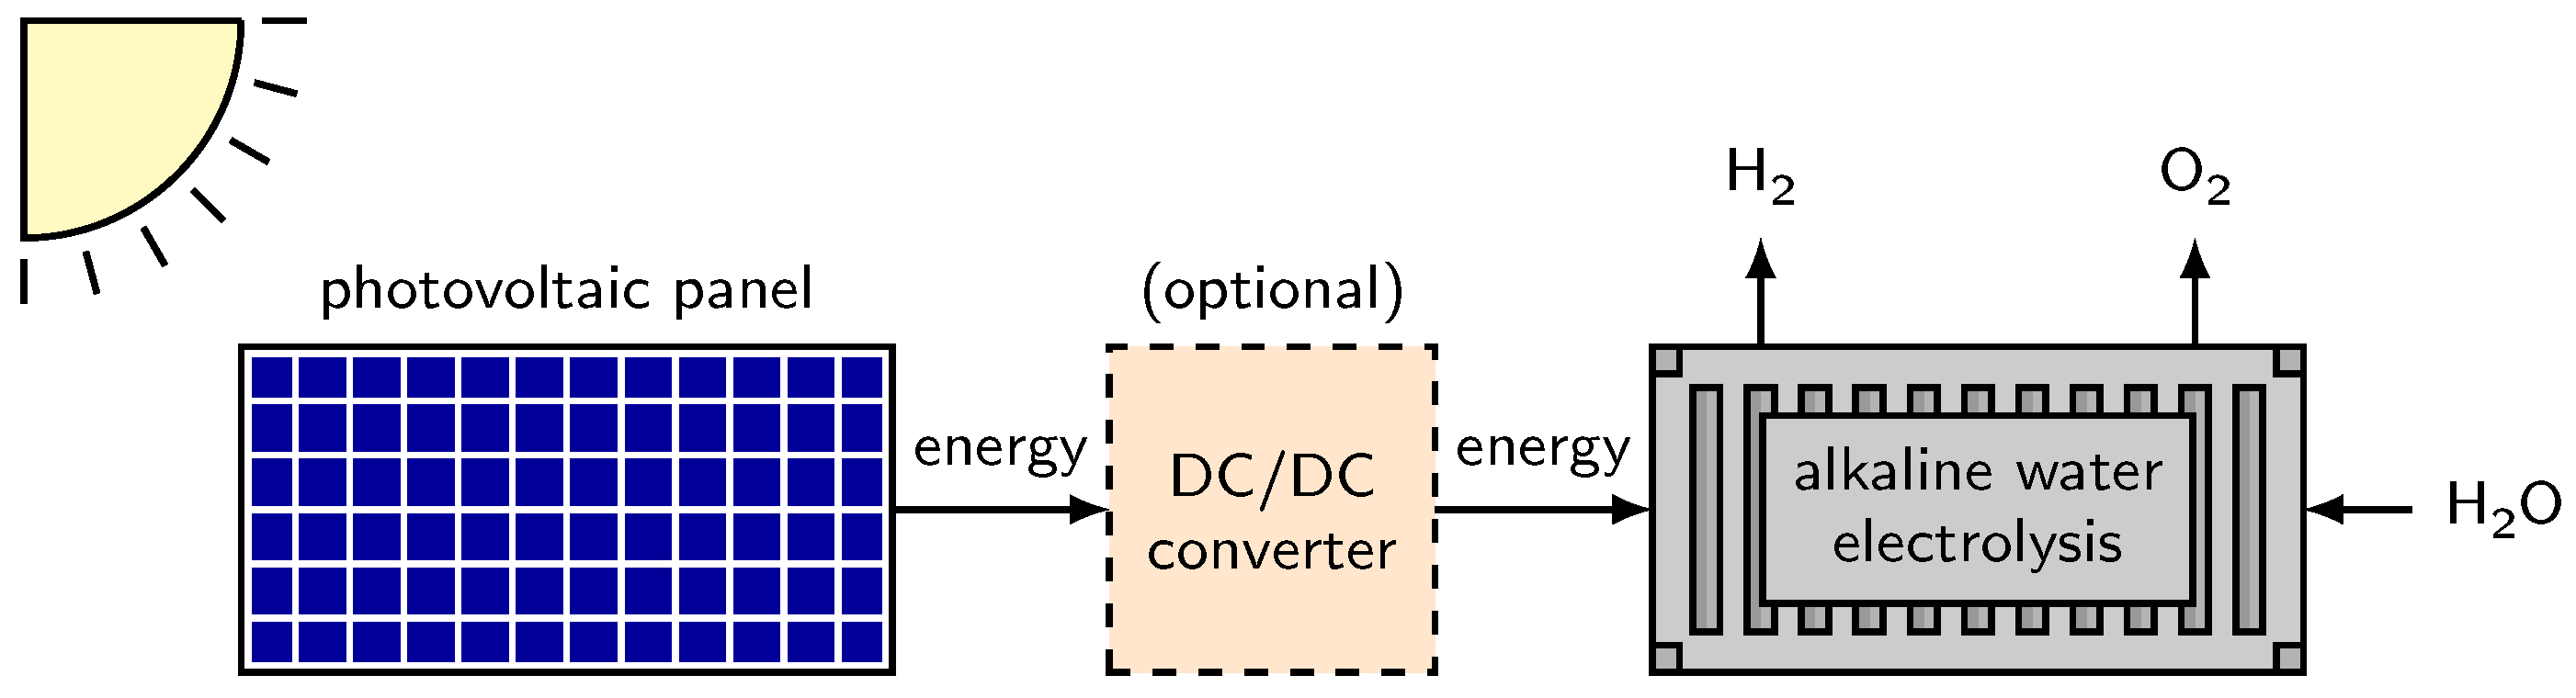
The behavior of photovoltaic panels can be described by single-diode and two-diode models with varying degrees of complexity. Often, the solution must be obtained iteratively or with numerical methods when very detailed models are utilized [75,76]. Simple models with analytical solutions are a recent research topic, as a short processing time can be needed for online characterization and the optimization of existing systems [75]. In Figure 8, the coupling possibilities of an alkaline water electrolyzer and solar photovoltaic panels are shown. Additional losses of a DC/DC transformer can be avoided when a direct coupling of the systems can be realized. Otherwise, the transformation ensures a fit of both systems by an indirect coupling [73,77,78].
When a direct coupling of both systems is to be realized, the possible operation points can be determined by the intersection of the current–voltage curves. A typical current–voltage characteristic of an alkaline water electrolyzer is given by (8). The resulting current of a photovoltaic cell at different solar radiation levels can be described by (10) with a suitable single-diode model as a function of the voltage [29,72,73]. Therefore, specific data from the photovoltaic (PV) panel and the ambient conditions are required in order to calculate the photocurrent , the reverse saturation current , and the thermal voltage . Furthermore, the serial and parallel resistance of the photovoltaic panel must be available.
The photocurrent is defined in (11), which shows a linear relationship with the solar radiation absorbed by the photovoltaic cell. A higher cell temperature increases the photocurrent.
The reverse saturation current can be calculated by (12) with the short-circuit current , the open-cell voltage , and the thermal voltage . Whereas the short-circuit current and the open-cell voltage are provided by the manufacturer, the thermal voltage depends on the physical properties.
An equation for the thermal voltage is given in (13), which is based on the Boltzmann constant ( ) and the electron charge e ( C) [72]. Additionally, the number of serially connected cells, , and the cell temperature are required. Furthermore, the non-ideality factor m contains any deviations from the theoretical behavior.
In addition to these equations, the calculation of the resulting current of a photovoltaic cell requires knowledge of the serial () and parallel () resistance of the system. By adding parallel photovoltaic cells, the current multiplies by the amount of parallel paths . Suitable parameters of an existing photovoltaic cell setup are given in Table 1. For this exemplary calculation, a constant temperature of the photovoltaic cell is assumed. Otherwise, the cell temperature increases with the absorbed solar radiation. While simple linear approaches already result in a good agreement with experimental data, a complete energy balance is the best way to determine the temperature exactly [29,72].
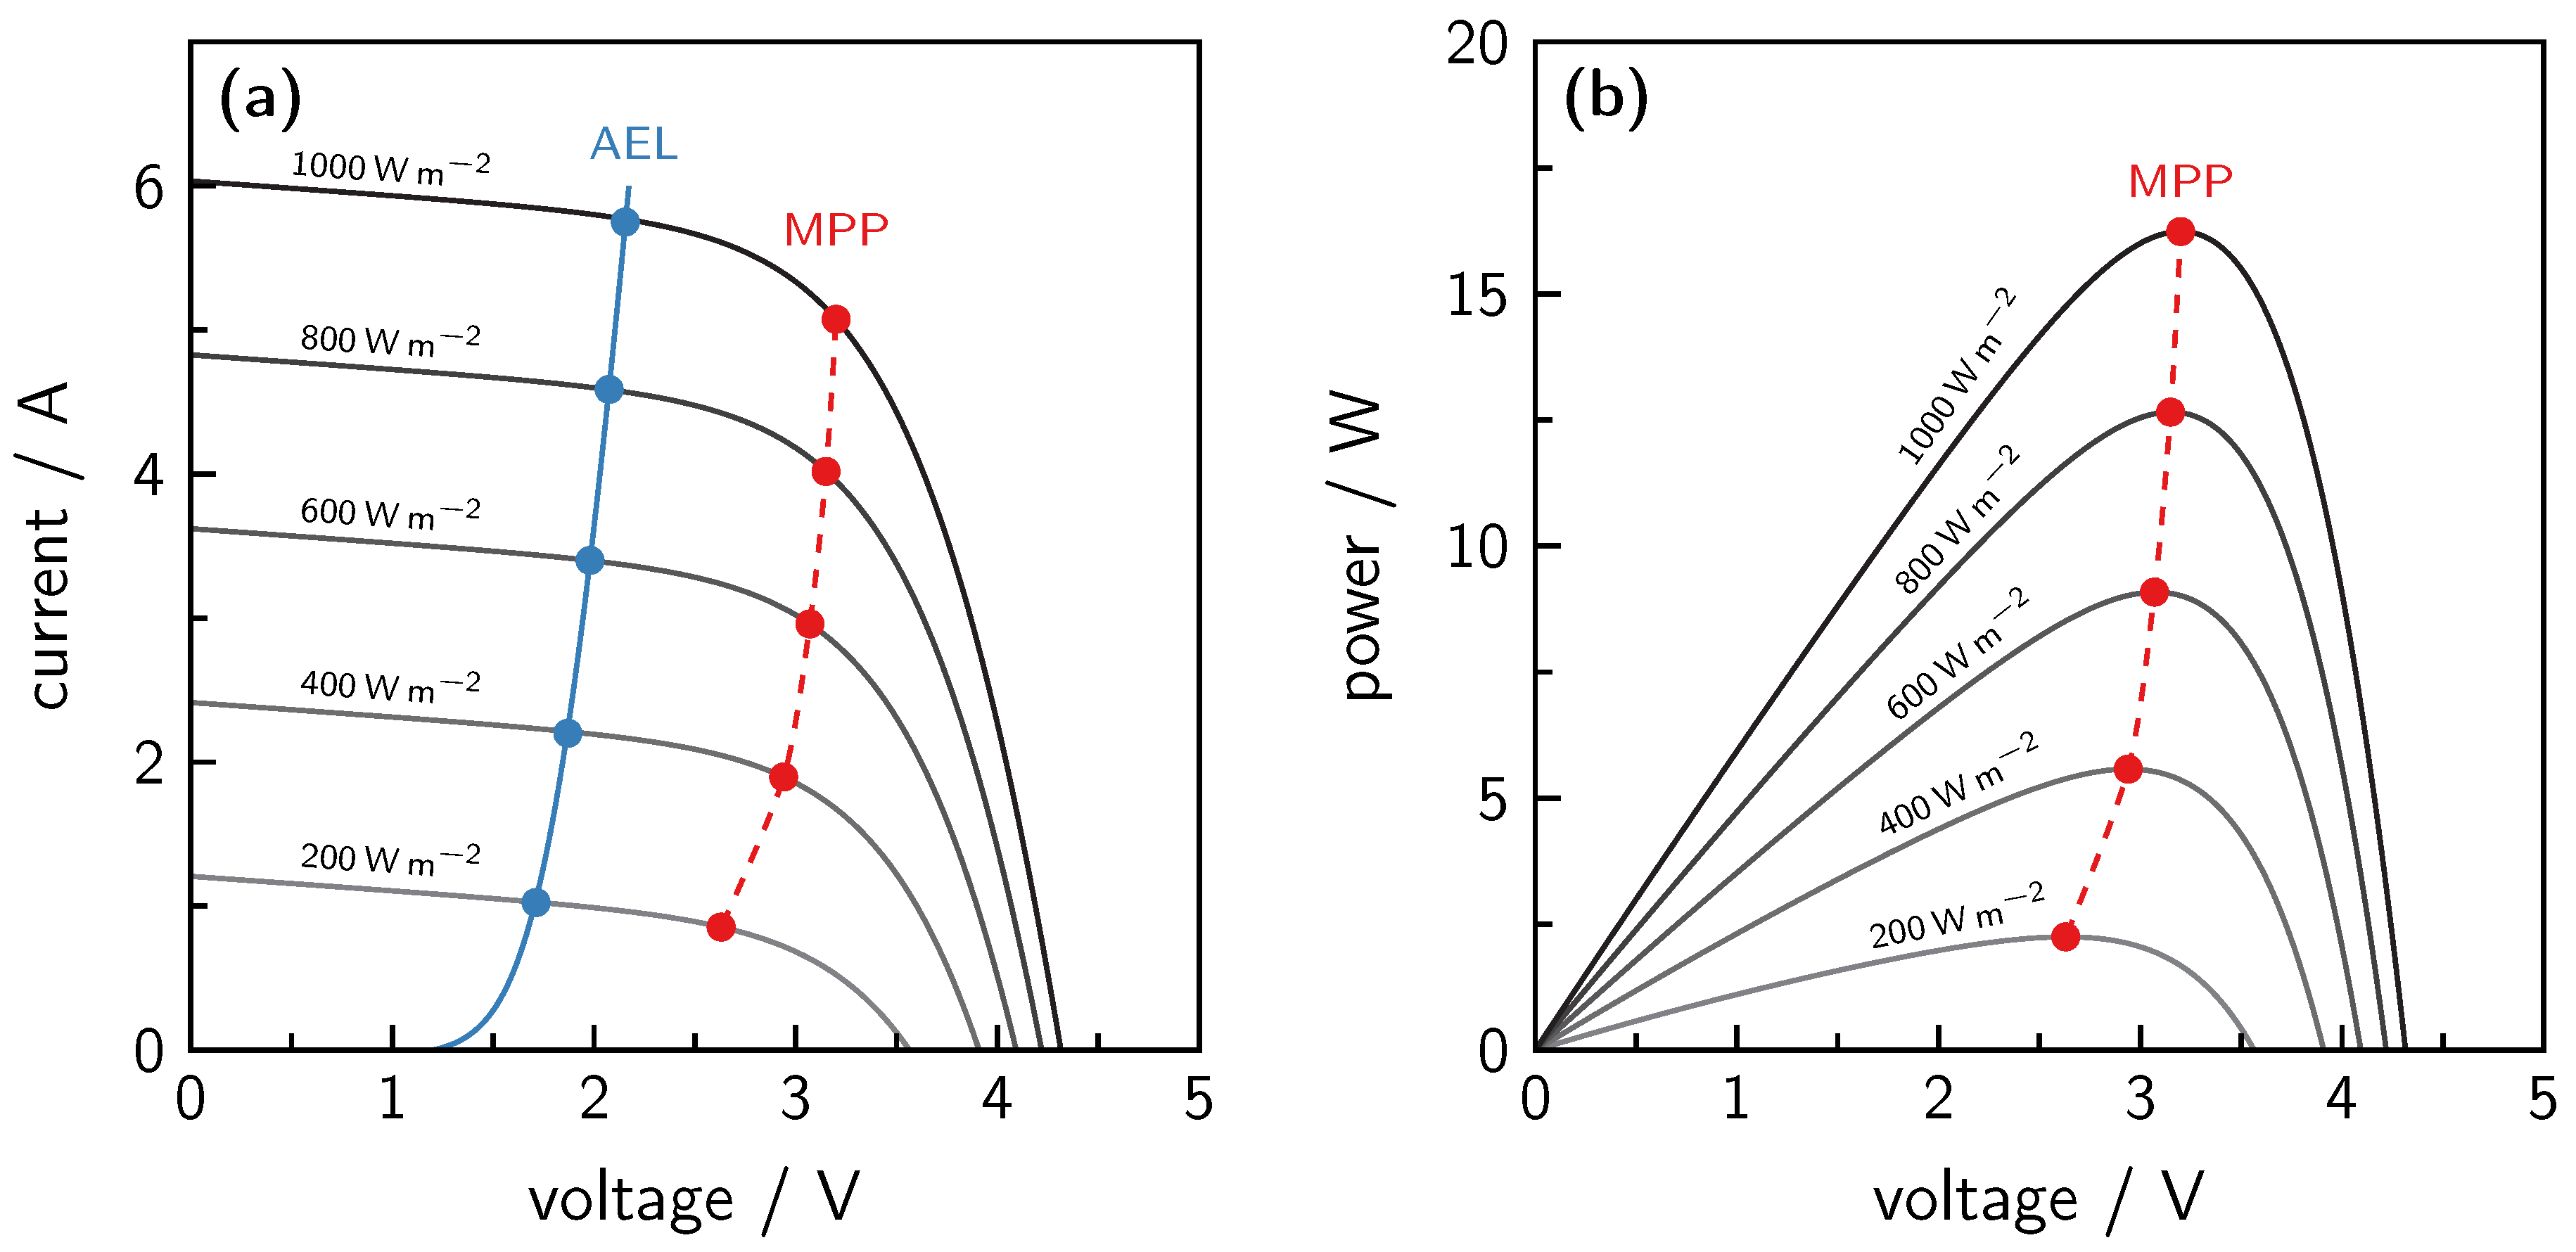
The results of the example calculation are shown in Figure 9. The current–voltage characteristics are given for different solar radiation levels from 200 to 1000 W m−2, in combination with a typical polarization curve of an alkaline water electrolyzer (10 cm2 electrode area) from (8) in Figure 9a. The power–voltage curves for the photovoltaic cell are shown in Figure 9b. The maximal power point (MPP) for each radiation level is marked with a dot in both diagrams.
In Figure 9a, the characteristics of the alkaline water electrolyzer deviate from the MPP curve. Therefore, the photovoltaic cell cannot deliver the maximal power, and the overall efficiency decreases. Hence, both systems should be optimized until the alkaline water electrolyzer performs close to the maximal power output [73,80]. The alternative would be an indirect coupling of both systems with the integration of a DC/DC converter, which also implies losses, with an efficiency of around 90% [81,82].
7.2. Wind Power
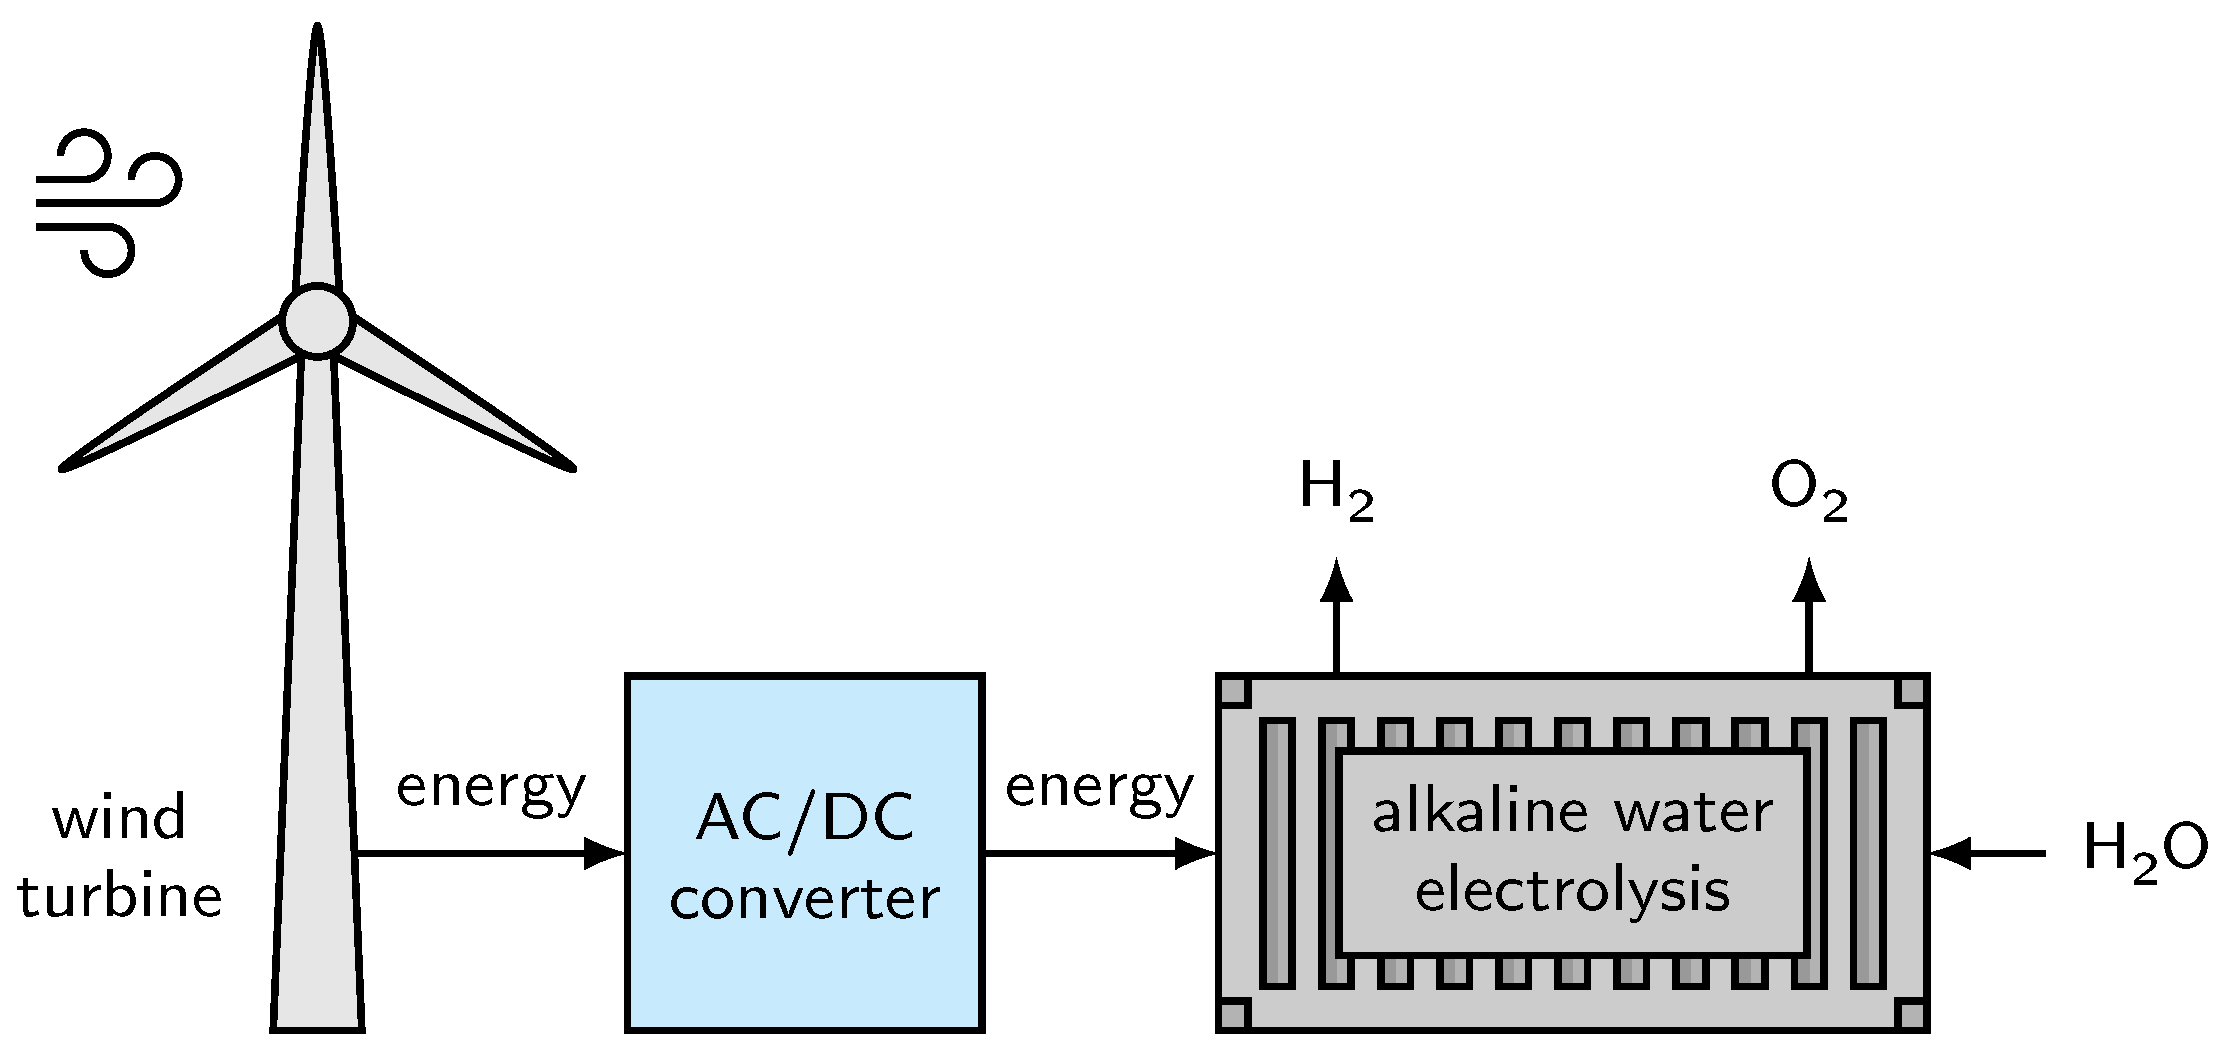
As the power from photovoltaic cells is only available during the daytime, wind power is another important energy source for the renewable production of hydrogen. The schematic concept is shown in Figure 10. For the implementation of conventional wind turbines, an AC/DC converter is essential. The efficiency of an AC/DC conversion is also approximately 90% [82,83].
For the calculation of the wind turbine power, the exact wind velocity at the height of the turbine rotor should be known. Often, the wind velocity is measured at rooftops or special measurement facilities with a defined height of approximately 10 m, which is significantly lower than the height of a wind turbine, around 100 m [84]. Therefore, the measured data should be corrected to the desired height by (14).
The wind velocity at the height can be determined from the measured wind velocity at the height in combination with the roughness of the terrain [48]. To obtain the output power of a wind turbine , first, the theoretical wind power needs to be calculated using (15). Therefore, the air density (from 1.22 to 1.3 kg m−3), the area spanned by the rotor blades A, and the wind velocity are needed [74,85].
The maximal wind power cannot be completely converted into wind turbine power. This circumstance is considered by the implementation of the performance coefficient , which lowers the maximal reachable power output. The actual wind turbine power results from the product of the wind power and the performance coefficient in (16).
The determination of the correct performance coefficient is a complete research topic in itself, which consists of empirical correlations and computational fluid dynamics (CFD) simulation studies. Often, experimental data are used to fit the correlations to the measurements [74]. An example equation for the performance coefficient is shown in (17) [74,79].
Therefore, the pitch angle of the turbine blades has to be defined and the tip speed ratio needs to be calculated in (18) from the turbine blade radius R, the rotational speed , and the wind speed [74].
The calculation of the performance coefficient also requires the parameter , which is described by (19) based on the tip speed ratio and the blade pitch angle [74].
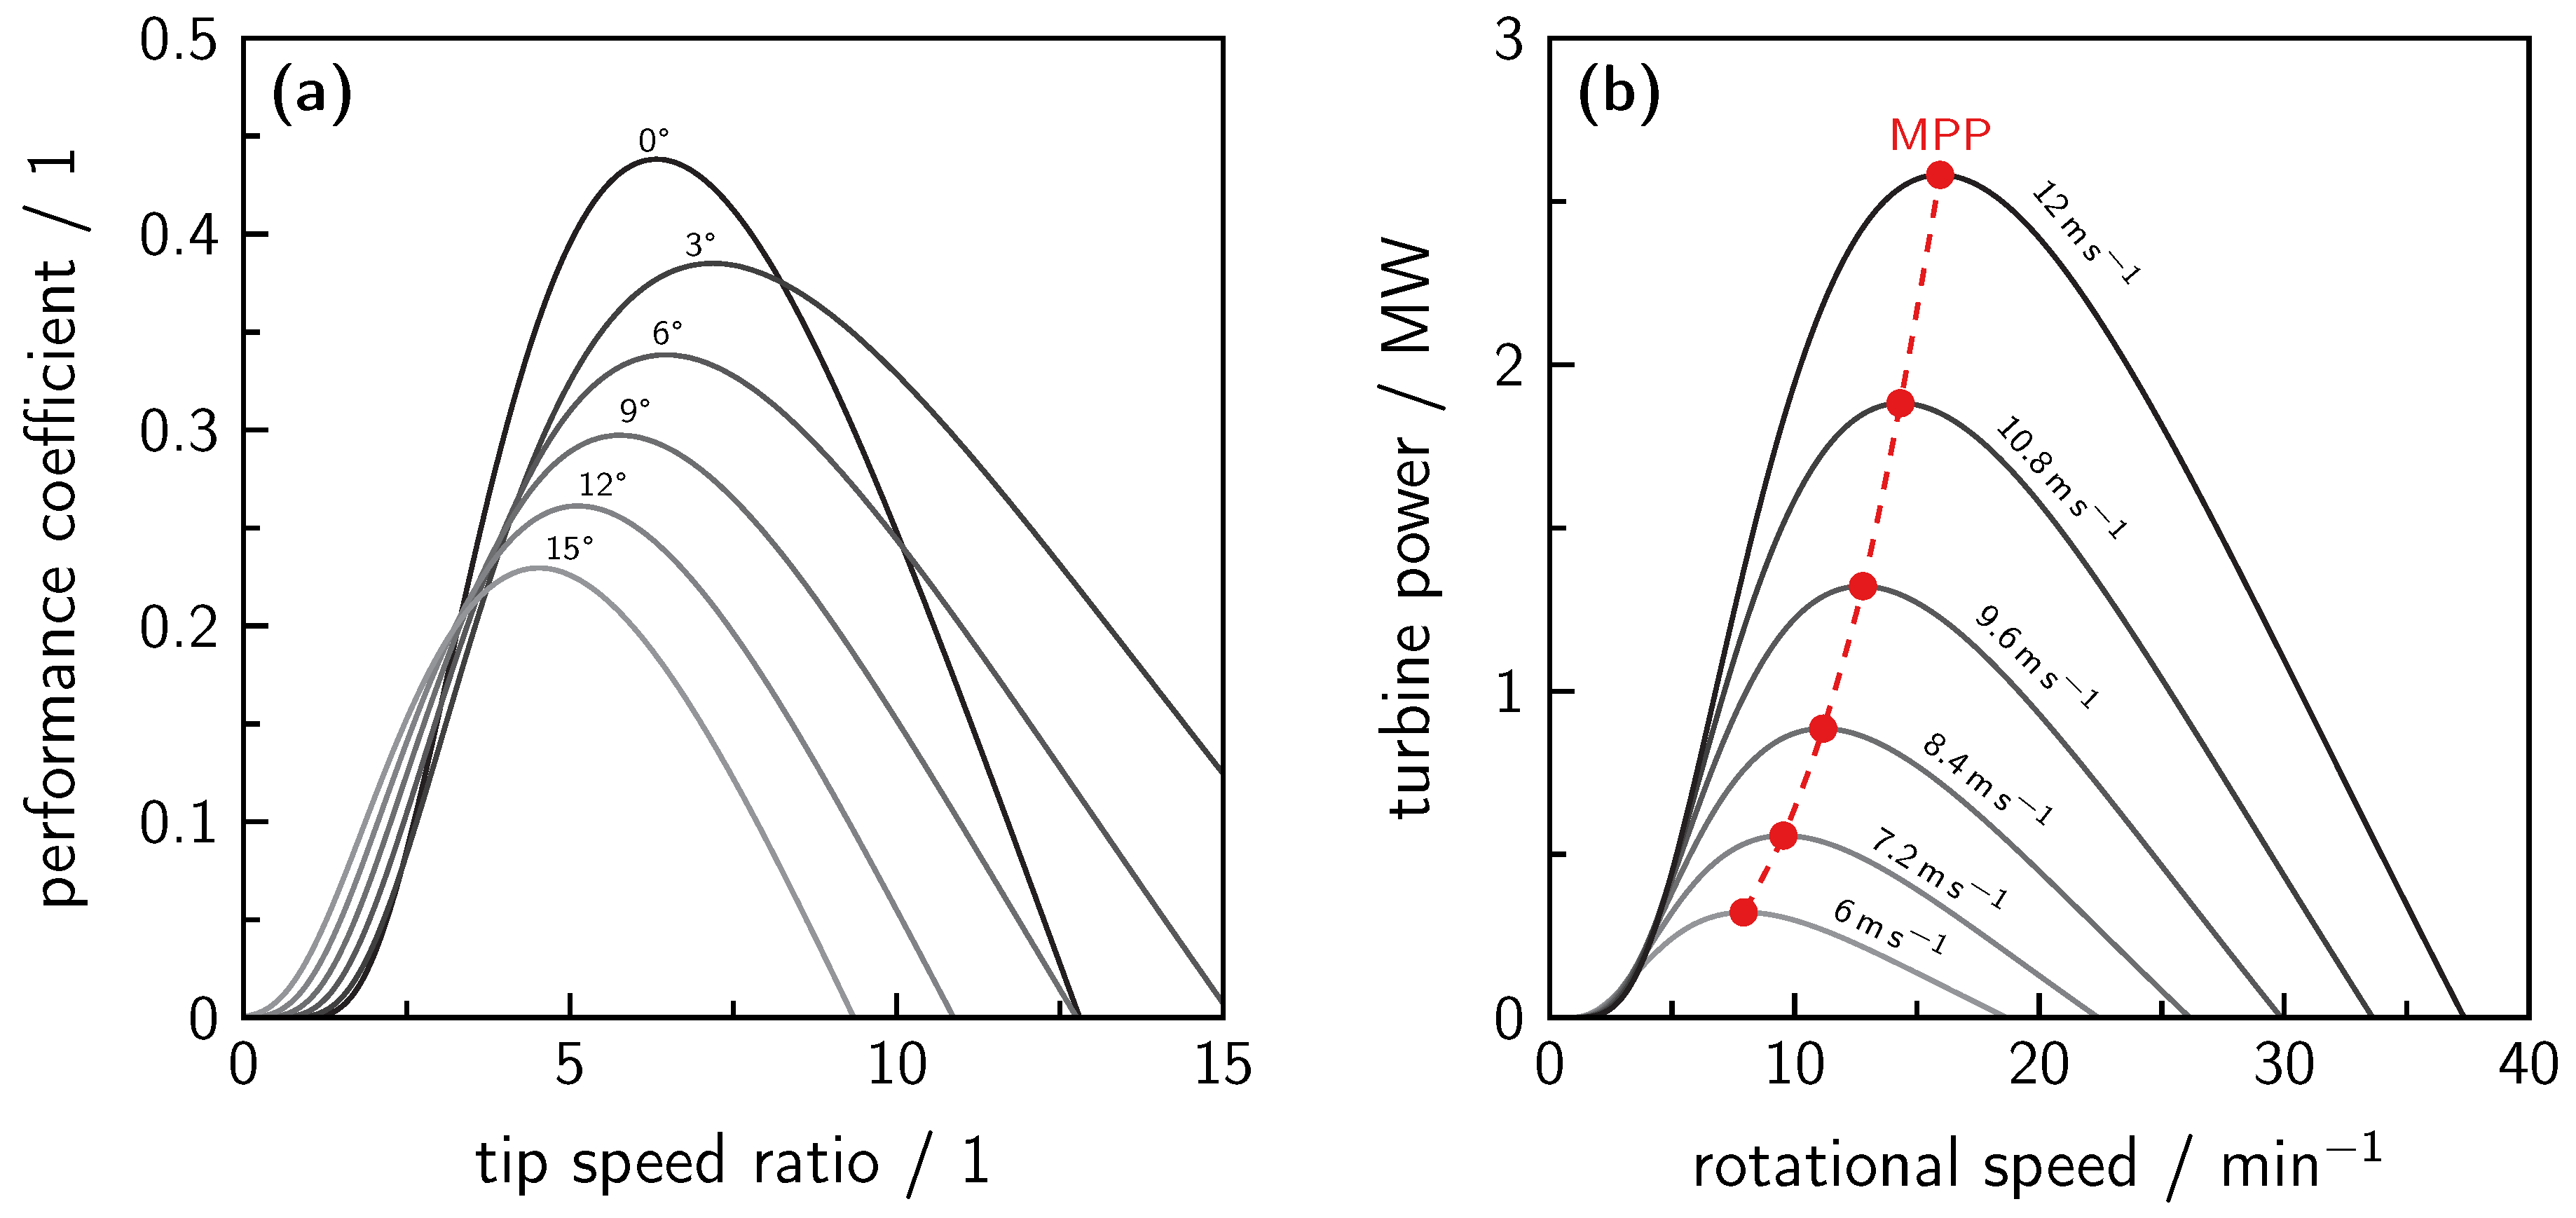
For the blade radius, a value of 46.5m is assumed, which is a typical blade length for a wind turbine with a rated power of 2 MW [74]. In Figure 11, the calculation results for the performance coefficient, depending on the tip speed ratio and the turbine power at different wind velocities, are shown. The performance coefficient of conventional wind turbines is limited at [74]. In this example, a maximal performance coefficient of approximately is reached for a blade pitch angle of β = 0°. With an increasing pitch angle, the maximum of the performance coefficient decreases and shifts towards smaller tip speed ratios.
For the calculation of the turbine power in Figure 11b, a pitch angle of β = 6° is assumed. With increasing wind velocity, the value of the maximal power point (MPP) becomes higher and shifts towards faster rotational speeds. The rated wind speed of this exemplary wind turbine is at 11 m s−1 with rotational speeds from 6 to 17 min−1. The cut-in wind speed is 3 m s−1 and the cut-out wind speed is 22 m s−1 [74]. In comparison with the power characteristics of photovoltaic panels, the polarization curve of alkaline water electrolyzers can not be directly optimized towards the MPP trajectory, as the optimal operation point highly depends on the wind turbine design and weather conditions. Therefore, an efficient AC/DC converter is the best option for maintaining an efficient operation of an alkaline water electrolyzer [82].
8. Hydrogen Energy System and Power Grid Stabilization
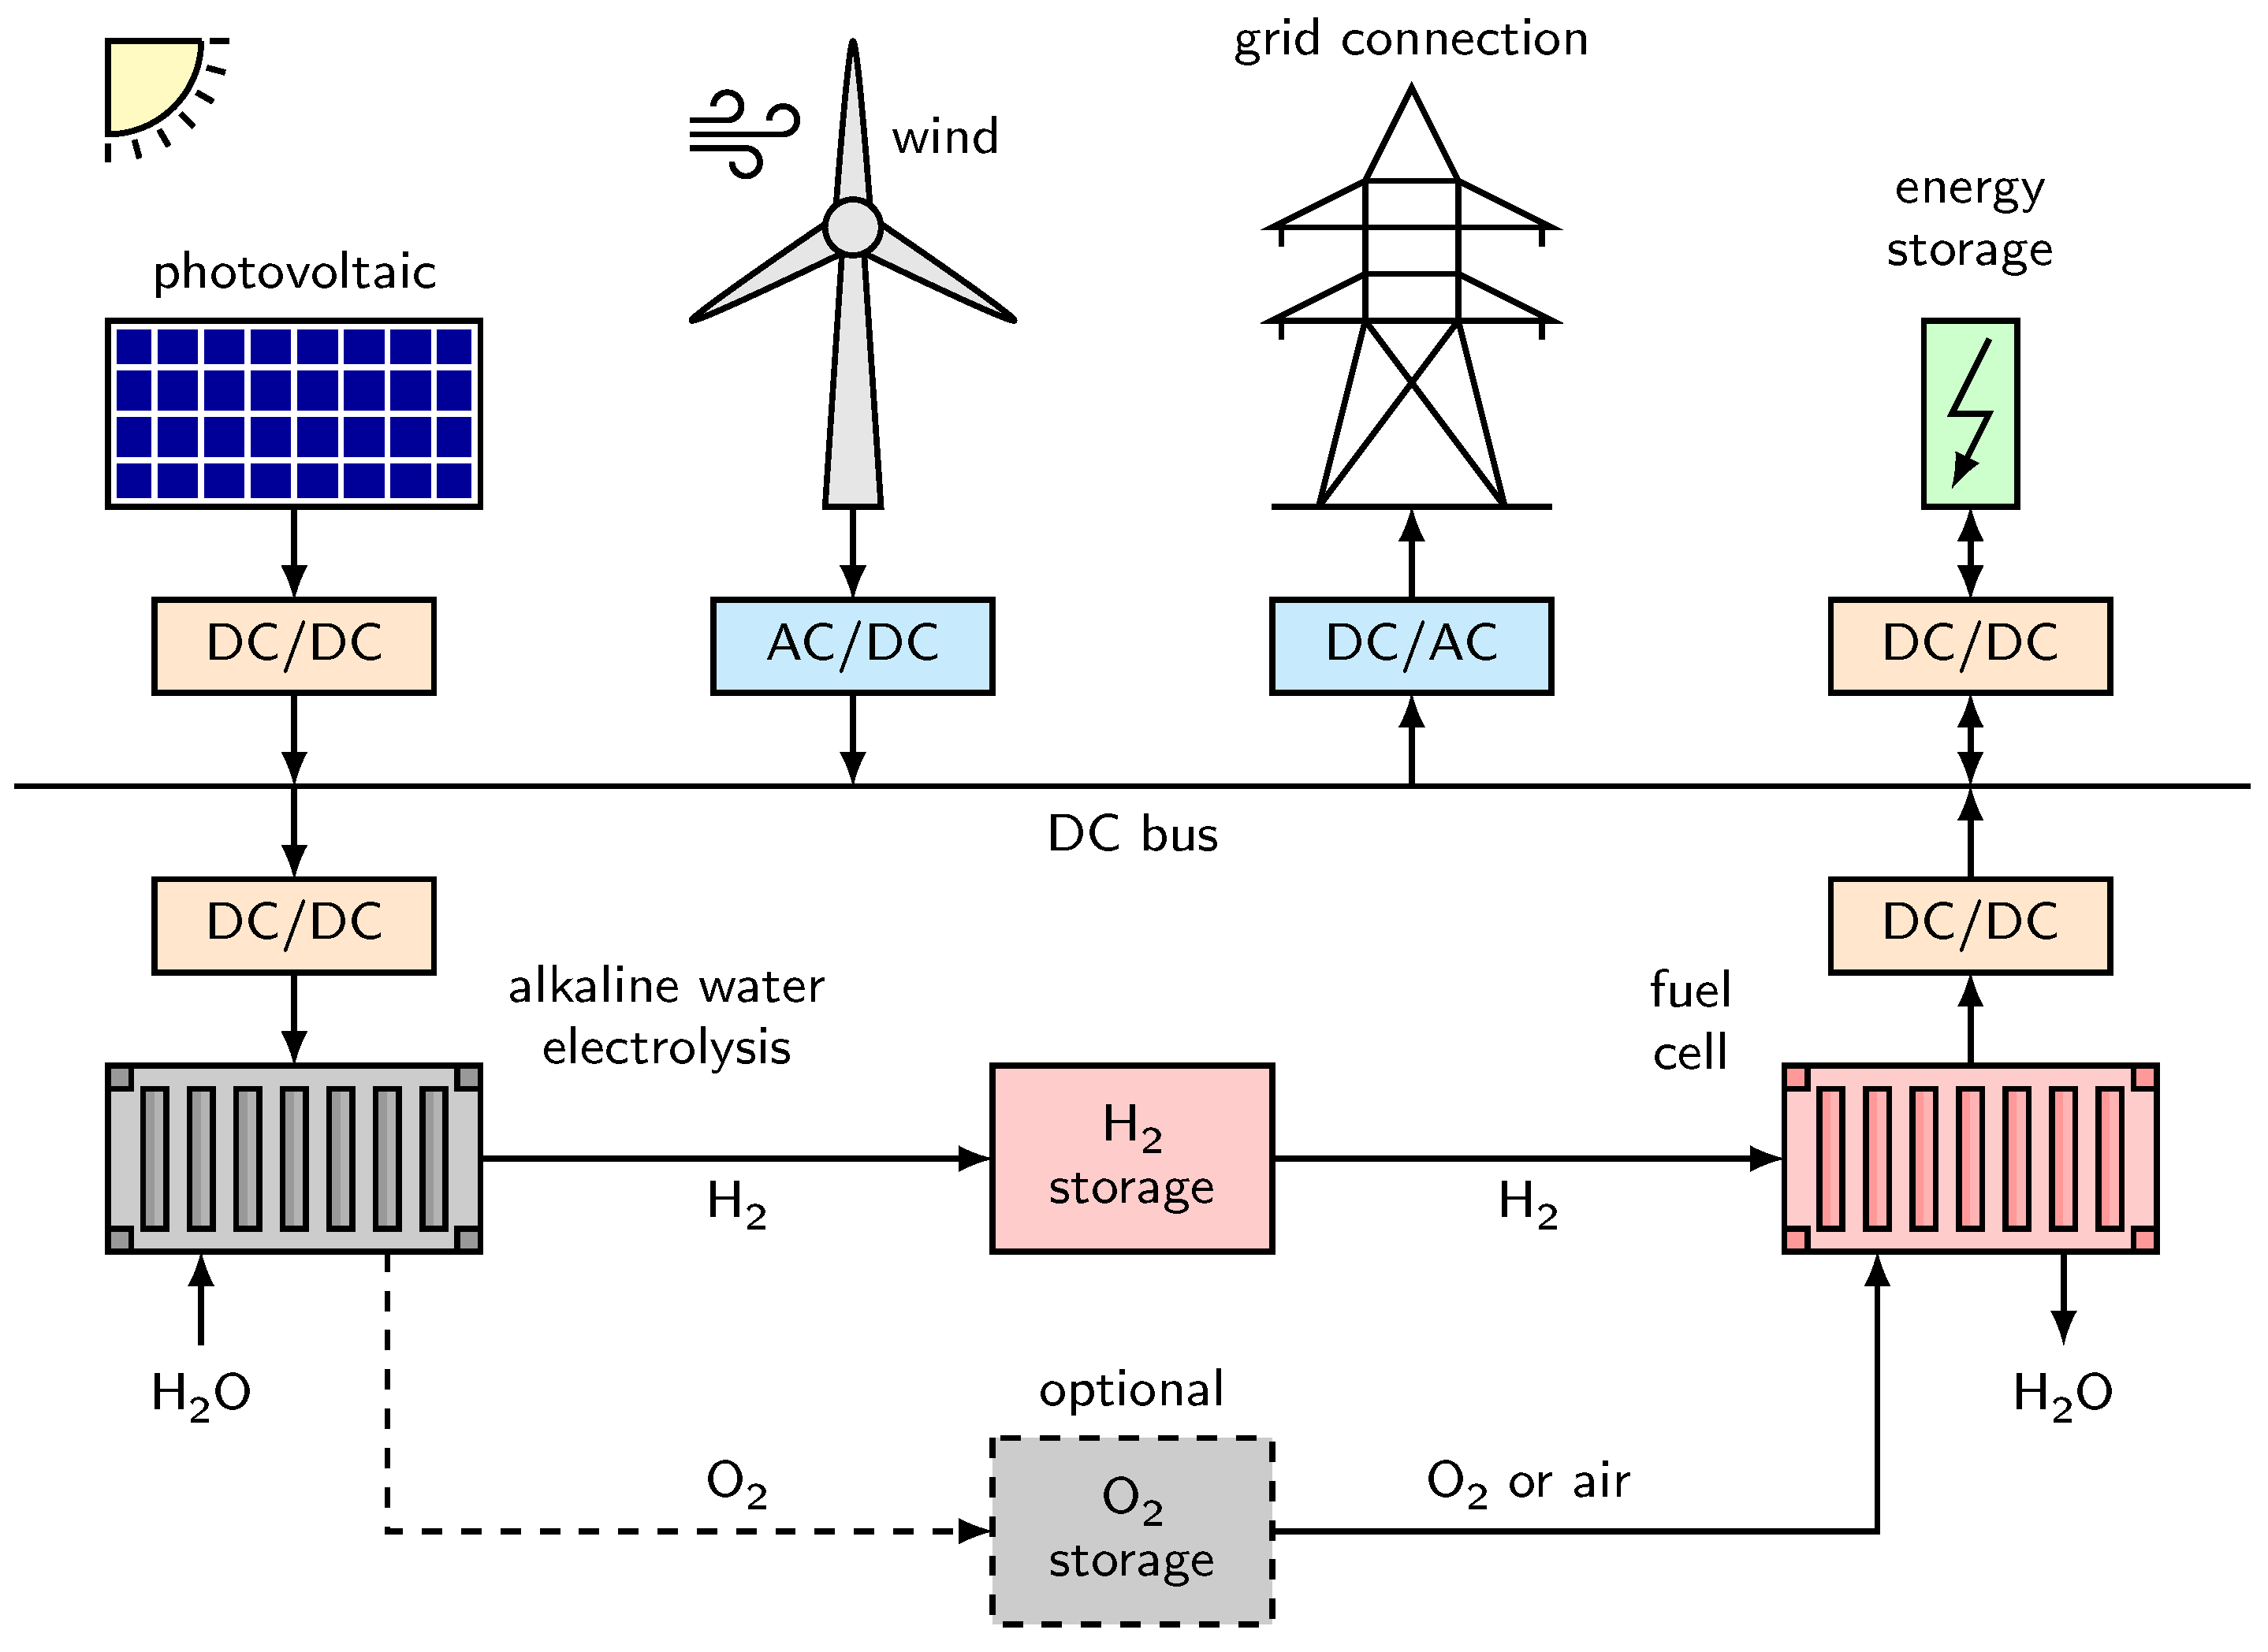
An exemplary process scheme for a hydrogen energy system is provided in Figure 12. Photovoltaic panels and wind turbines are connected with suitable converters to a DC bus, from which alkaline water electrolyzers are powered. The produced hydrogen can be stored for later application in fuel cells. To raise the fuel cell efficiency, the produced oxygen can be used instead of air. Therefore, an additional storage tank must be available, which incurs further costs [86].
The fuel cells are also connected to the DC bus, and the power can be used by the electricity grid with DC/AC converters. At lower energy demands, hydrogen can be produced and converted back into energy when it is needed. As conventional alkaline water electrolyzers are designed for operation at constant conditions, occurring fluctuations may be damped by additional energy storage devices like batteries, supercapacitors, or flywheels [25,28,82]. When excess energy is available, this energy storage can be charged to be fully available when needed. The damping quantity is limited to a certain degree of fluctuation, as the energy storage amount is also restricted to the capacity of all installed devices. Additionally, the produced hydrogen can also be used for the decarbonization of industrial processes or as a fuel in the transport sector [87,88,89]. To raise the overall efficiency, some DC/DC converters could be neglected by optimized system designs by lowering the system flexibility. Furthermore, when the alkaline water electrolyzers are able to operate under dynamic conditions, additional energy storage devices are not required or, at least, the number of such devices could be lowered. There are still some challenges for electrolyzer manufacturers to overcome before this possibility becomes available.
With an increasing share of renewable energies in the power grid, it is difficult to maintain a constant power frequency. Such hydrogen energy systems or alkaline water electrolyzers can be used to stabilize the power frequency by damping the fluctuations. An additional benefit would be the reduction of the conventional spinning reserve, which reduces costs and emissions [87,90]. A predictive control can be used for stable and efficient operation. Pressurized alkaline electrolyzers are more suitable for damping fast fluctuations, whereas atmospheric units can handle the slow fluctuations [87].
9. Limitations and Solution Approaches
The implementation of a hydrogen energy system into the existing power grid is a challenging task with some limitations which must be overcome in order to guarantee high system availability. The main problem of an alkaline water electrolyzer powered by renewable energy is the high gas impurity in the part-load range, which can cause a safety shutdown when reaching a foreign gas contamination of 2 vol.% [31,91]. Hence, the annual operation time is limited to the time spans with sufficient renewable energy [91].
9.1. Limited Operation Time
The limited operation time leads to a high number of startup and shutdown cycles, which can exceed the maximal start/stop count defined by the manufacturer and, therefore, can lower the expected system lifetime or warranty agreements. Mainly, the electrodes are affected by the repetitive start/stop behavior and the electrode degradation is accelerated [48,82]. Nickel electrodes are known to degrade significantly after 5000 to 10,000 start/stop cycles. When operating with photovoltaic power only, 7000 to 11,000 cycles are already reached in the period of 20 to 30 years. The fluctuating nature of renewable energy amplifies the electrode degradation, as this phenomenon acts partly as a start/stop process [92]. This issue can be solved by the development of stable electrode compositions or self-repairing electrode surfaces [92].
To circumvent the drawbacks of having only one renewable power source, such as in the daytime-limited operation with solar power, the combination of several energy sources enhances the overall efficiency. While the operation with only PV shows a faradaic efficiency of approximately 40%, wind power leads to a faradaic efficiency of around 80%. The combination of both technologies enhances the faradaic efficiency above 85% [79].
To hinder the gas impurity from reaching the lower explosion limit, the part-load range of most alkaline electrolyzers is limited to 10 to 25% of their nominal load [82,91]. Fluctuations below the minimal load can be balanced out with the implementation of energy storage devices, as shown in Figure 12; however, in some scenarios, the available energy storage will not be sufficient. When the gas impurity is still in a tolerable region, short periods without an electrode polarization can be allowed. The cathode starts to degrade noticeably below a voltage of around 0.25 V [82]. Thus, the complete shutdown can be held until reaching this voltage limit. The available time depends on the electrode composition, as the electrochemical double layer acts as a capacitor and delays the voltage breakdown after a power loss. Experimentally, a time span of around 10 min has been reported [82].
9.2. Optimal System Design and Operation Strategies
To mitigate the rise of gas impurities during low power availability, an optimal system design can allow enough time until sufficient energy is available again. While the gas volume inside the system acts as a buffer tank and dilutes the gas contamination, the liquid and the solid volume of an electrolyzer buffers the system temperature during part-load operation [25,71].
Furthermore, to maintain an efficient operation, the system temperature has to be in an optimal range of 50 to 80 °C for an electrolyte solution with 20 to 30 wt.% KOH [25]. As most renewable-energy-powered alkaline water electrolyzers will not provide a separate heating unit, the temperature needs to be reached and maintained only by the heat of the reaction [4]. Temperatures above 80 °C should be avoided with a suitable cooling system to prevent high degradation rates. An alternative would be the operation at low temperatures to damp electrode degradation, but then, very active electrocatalysts are needed to reach a sufficient efficiency [86].
More experimental and theoretical work is needed to fully understand the dynamic behavior of alkaline water electrolyzers powered by renewable energy [25]. In addition to an optimal system design, suitable dynamic operation strategies can be beneficial for lowering the gas impurity. While low gas impurities occur with separated electrolyte cycles, high gas impurities result in combined mode. The measured stationary gas impurities in Figure 6 are reached after a specific duration. When the electrolyzer is able to switch between both operation modes automatically, this can be used to switch to the separated mode when the gas impurity is too high, and then combine again when a sufficient gas production rate is available. Experimental work shows that the gas impurity can be almost halved by this approach [31].
The primary reason for high gas contamination is the continuous operation at low current densities. This circumstance can be prevented by reducing the overall cell area (overloading) or by subdividing the system into several smaller blocks [91]. While the implementation of electrolyzers with smaller electrode areas also limits the maximal load compared to larger systems, partial system operation is a more elegant method. During low power availability, single stacks or compartments of a system with multiple stacks can be powered off, which lowers the available electrode area and therefore results in higher current densities [93]. Obviously, this strategy causes problems in maintaining the optimal system temperature due to the disabled components. An alternative method to prevent adverse process states is the use of predictive control systems. For example, when low renewable power availability is forecasted, the system can change the temperature, pressure, or operation mode to a more suitable state before negative effects occur [87].
10. Conclusions
The combination of alkaline water electrolysis and renewable energy for sustainable hydrogen production is an essential step towards the decarbonization of industrial processes and the transport sector [87,88,89]. To determine the most relevant limitations and to propose suitable solution approaches, the technologies have to be fully understood [25]. Whereas the process of alkaline water electrolysis can be defined by current–voltage characteristics and the resulting gas impurity, photovoltaic panels and wind turbines should be operated at the maximal power point [73,74,79]. Therefore, the influencing parameters must be known. Different model approaches exist, out of which the most suitable one should be chosen. While empirical correlations are often only valid for the specific experimental setup, physically reasonable models can be used in a more general way to develop new solutions. For alkaline water electrolysis, many experimental and theoretical data are available to calculate and analyze the cell voltage under operation conditions. As the actual system design and cell arrangement differ for every electrolyzer, certain parameters have to be determined experimentally to use the proposed models for another system. Mainly, this issue exists for electrode compositions and separator materials. To describe the gas purity of hydrogen and oxygen mathematically, only models and correlations on an empirical basis are currently available due to the high number of influencing variables [31,32]. As the gas impurity mainly determines the system availability of an alkaline water electrolyzer, more research for the development of physically-based models is needed. The dynamic system behavior should be analyzed, as optimized dynamic operation strategies can be beneficial for the overall system efficiency. Many models with different complexity levels are available for the description of the current–voltage characteristics of photovoltaic panels. Most models rely on physical principles and manufacturer data [75]. Thus, proper modeling for different systems is possible. The power conversion by wind turbines can be described by system properties and suitable correlations for the performance coefficient [74]. As this variable is influenced by many parameters, including the design of the turbine blades, the correlation should only be used for very similar wind turbines, or the parameters must be determined experimentally or by simulation.
To conclude, there are appropriate models available for all components of a hydrogen energy system. However, some descriptions need further improvement to be applicable to a variety of different system designs. With this knowledge and with experimental studies, many researchers have already examined the limitations of renewable-powered alkaline water electrolyzers [48,79,82]. The central prospect is to increase the operation time through intelligent system designs and advantageous operational concepts. While the implementation of conventional energy storage devices to damp the dynamics is a first logical step, alkaline water electrolyzers should be enabled to handle all dynamics directly to reduce costs and to enhance the efficiency [25]. As the hydrogen production from fossil energy carriers is less expensive than hydrogen from electrolysis processes, only optimized systems with the use of excess renewable energy can be competitive.
Author Contributions
Conceptualization, methodology, software, validation, formal analysis, investigation, data curation, writing—original draft preparation, visualization, J.B.; resources, writing—review and editing, J.B. and T.T.; supervision, project administration, funding acquisition, T.T. All authors have read and agreed to the published version of the manuscript.
Funding
This work is funded by the Deutsche Forschungsgemeinschaft (DFG, German Research Foundation) Project numbers: 290019031; 391348959.
Acknowledgments
The authors thank the Institute of Electrical Information Technology (IEI) of the Clausthal University of Technology for providing the weather data.
Conflicts of Interest
The authors declare no conflict of interest. The funders had no role in the design of the study; in the collection, analyses, or interpretation of data; in the writing of the manuscript, or in the decision to publish the results.
Abbreviations
| AC | Alternating current |
| AEL | Alkaline water electrolysis |
| CFD | Computational fluid dynamics |
| DC | Direct current |
| HTEL | High-temperature electrolysis |
| ILs | Ionic liquids |
| MPP | Maximum power point |
| PEMEL | Proton exchange membrane electrolysis |
| PV | Photovoltaic |
| SOEL | Solid oxide electrolysis |
Appendix A. Correlations and Parameters
A correlation for the reversible cell voltage of alkaline water electrolysis is given in (A1). The obtained value can be used for the calculation of the cell voltage in (7) or (8) at atmospheric conditions. For a pressurized system, extended correlations are required, as the reversible cell voltage increases at higher pressures [40]. The empirical correlation parameters for the calculation of cell voltage by (7) and (8) are given in Table A1.

| Parameter | Equation (7) [28,94] | Equation (8) [39] | Unit |
|---|---|---|---|
| 8.05 | 4.45153 | ||
| −2.5 | 6.88874 | °C−1 | |
| s | 0.185 | 0.33824 | |
| 1.002 | −0.01539 | ||
| 8.424 | 2.00181 | °C A−1 | |
| 247.3 | 15.24178 | °C2 A−1 | |
| – | −3.12996 | ||
| – | 4.47137 |
The correlations for the calculation of specific electrolyte conductivity for KOH and NaOH can be found in (A2) and (A3). The required correlation parameters are listed in Table A2. The validity range for (A2) is a temperature T from 258.15 to 373.15 K and KOH mass fractions between 0.15 and 0.45. Equation (A3) is valid for temperatures between 25 and 50 °C and NaOH mass fractions from 0.08 to 0.25 [52,57].
Table A2.
Parameters for the calculation of the specific electrolyte conductivities of KOH and NaOH solutions by Equations (A2) and (A3) [52,57].
| Parameter | Equation (A2) [57] | Unit | Equation (A3) [52] | Unit |
|---|---|---|---|---|
| 27.9844803 | −45.7 | |||
| −0.924129482 | 1.02 | °C−1 | ||
| −0.0149660371 | 3200 | |||
| −0.0905209551 | −2990 | |||
| 0.0114933252 | 784 | |||
| 0.1765 | – | – | – | |
| 6.96648518 | – | – | ||
| −2898.15658 | – | – |
References
- Sherif, S.; Barbir, F.; Veziroglu, T. Towards a Hydrogen Economy. Electr. J. 2005, 18, 62–76. [Google Scholar] [CrossRef]
- Suleman, F.; Dincer, I.; Agelin-Chaab, M. Environmental Impact Assessment and Comparison of Some Hydrogen Production Options. Int. J. Hydrog. Energy 2015, 40, 6976–6987. [Google Scholar] [CrossRef]
- Dincer, I.; Acar, C. Review and Evaluation of Hydrogen Production Methods for Better Sustainability. Int. J. Hydrog. Energy 2015, 40, 11094–11111. [Google Scholar] [CrossRef]
- Gandía, L.M.; Oroz, R.; Ursúa, A.; Sanchis, P.; Diéguez, P.M. Renewable Hydrogen Production: Performance of an Alkaline Water Electrolyzer Working under Emulated Wind Conditions. Energy Fuels 2007, 21, 1699–1706. [Google Scholar] [CrossRef]
- Santos, D.M.F.; Sequeira, C.A.C.; Figueiredo, J.L. Hydrogen Production by Alkaline Water Electrolysis. Quim. Nova 2013, 36, 1176–1193. [Google Scholar] [CrossRef]
- Wang, M.; Wang, Z.; Gong, X.; Guo, Z. The Intensification Technologies to Water Electrolysis for Hydrogen Production—A Review. Renew. Sustain. Energy Rev. 2014, 29, 573–588. [Google Scholar] [CrossRef]
- Gahleitner, G. Hydrogen from Renewable Electricity: An International Review of Power-to-Gas Pilot Plants for Stationary Applications. Int. J. Hydrog. Energy 2013, 38, 2039–2061. [Google Scholar] [CrossRef]
- Carpetis, C. Estimation of Storage Costs for Large Hydrogen Storage Facilities. Int. J. Hydrog. Energy 1982, 7, 191–203. [Google Scholar] [CrossRef]
- Michalski, J.; Bünger, U.; Crotogino, F.; Donadei, S.; Schneider, G.S.; Pregger, T.; Cao, K.K.; Heide, D. Hydrogen Generation by Electrolysis and Storage in Salt Caverns: Potentials, Economics and Systems Aspects with Regard to the German Energy Transition. Int. J. Hydrog. Energy 2017, 42, 13427–13443. [Google Scholar] [CrossRef]
- Pellow, M.A.; Emmott, C.J.M.; Barnhart, C.J.; Benson, S.M. Hydrogen or Batteries for Grid Storage? A Net Energy Analysis. Energy Environ. Sci. 2015, 8, 1938–1952. [Google Scholar] [CrossRef] [Green Version]
- Qadrdan, M.; Abeysekera, M.; Chaudry, M.; Wu, J.; Jenkins, N. Role of Power-to-Gas in an Integrated Gas and Electricity System in Great Britain. Int. J. Hydrog. Energy 2015, 40, 5763–5775. [Google Scholar] [CrossRef]
- Schouten, J.; Janssenvanrosmalen, R.; Michels, J. Modeling Hydrogen Production for Injection into the Natural Gas Grid: Balance between Production, Demand and Storage. Int. J. Hydrog. Energy 2006, 31, 1698–1706. [Google Scholar] [CrossRef]
- Goncharov, A.; Guglya, A.; Melnikova, E. On the Feasibility of Developing Hydrogen Storages Capable of Adsorption Hydrogen Both in Its Molecular and Atomic States. Int. J. Hydrog. Energy 2012, 37, 18061–18073. [Google Scholar] [CrossRef]
- Goncharov, A.; Guglya, A.; Melnikova, E. Corrigendum to “On the Feasibility of Developing Hydrogen Storages Capable of Adsorption Hydrogen Both in Its Molecular and Atomic States” [Int J Hydrogen Energy, 37 (2012) 18061–18073]. Int. J. Hydrog. Energy 2013, 38, 3521. [Google Scholar] [CrossRef]
- Schmidt, O.; Gambhir, A.; Staffell, I.; Hawkes, A.; Nelson, J.; Few, S. Future Cost and Performance of Water Electrolysis: An Expert Elicitation Study. Int. J. Hydrog. Energy 2017, 42, 30470–30492. [Google Scholar] [CrossRef]
- Schalenbach, M.; Zeradjanin, A.R.; Kasian, O.; Cherevko, S.; Mayrhofer, K.J. A Perspective on Low-Temperature Water Electrolysis-Challenges in Alkaline and Acidic Technology. Int. J. Electrochem. Sci. 2018, 13, 1173–1226. [Google Scholar] [CrossRef]
- Zeng, K.; Zhang, D. Recent Progress in Alkaline Water Electrolysis for Hydrogen Production and Applications. Prog. Energy Combust. Sci. 2010, 36, 307–326. [Google Scholar] [CrossRef]
- Carmo, M.; Fritz, D.L.; Mergel, J.; Stolten, D. A Comprehensive Review on PEM Water Electrolysis. Int. J. Hydrog. Energy 2013, 38, 4901–4934. [Google Scholar] [CrossRef]
- David, M.; Ocampo-Martínez, C.; Sánchez-Peña, R. Advances in Alkaline Water Electrolyzers: A Review. J. Energy Storage 2019, 23, 392–403. [Google Scholar] [CrossRef] [Green Version]
- Buttler, A.; Spliethoff, H. Current Status of Water Electrolysis for Energy Storage, Grid Balancing and Sector Coupling via Power-to-Gas and Power-to-Liquids: A Review. Renew. Sustain. Energy Rev. 2018, 82, 2440–2454. [Google Scholar] [CrossRef]
- Rashid, M.; Mesfer, M.K.A.; Naseem, H.; Danish, M. Hydrogen Production by Water Electrolysis: A Review of Alkaline Water Electrolysis, PEM Water Electrolysis and High Temperature Water Electrolysis. Int. J. Eng. Adv. Technol. 2015, 4, 80–93. [Google Scholar]
- Götz, M.; Lefebvre, J.; Mörs, F.; McDaniel Koch, A.; Graf, F.; Bajohr, S.; Reimert, R.; Kolb, T. Renewable Power-to-Gas: A Technological and Economic Review. Renew. Energy 2016, 85, 1371–1390. [Google Scholar] [CrossRef] [Green Version]
- Marini, S.; Salvi, P.; Nelli, P.; Pesenti, R.; Villa, M.; Berrettoni, M.; Zangari, G.; Kiros, Y. Advanced Alkaline Water Electrolysis. Electrochim. Acta 2012, 82, 384–391. [Google Scholar] [CrossRef]
- Seibel, C.; Kuhlmann, J.W. Dynamic Water Electrolysis in Cross-Sectoral Processes. Chem. Ing. Tech. 2018, 90, 1430–1436. [Google Scholar] [CrossRef]
- Shen, X.; Zhang, X.; Li, G.; Lie, T.T.; Hong, L. Experimental Study on the External Electrical Thermal and Dynamic Power Characteristics of Alkaline Water Electrolyzer. Int. J. Energy Res. 2018, 42, 3244–3257. [Google Scholar] [CrossRef]
- Clarivate Analytics. Web of Science Database. 2020. Available online: http://apps.webofknowledge.com (accessed on 14 January 2020).
- Ehret, O.; Bonhoff, K. Hydrogen as a Fuel and Energy Storage: Success Factors for the German Energiewende. Int. J. Hydrog. Energy 2015, 40, 5526–5533. [Google Scholar] [CrossRef]
- Ulleberg, O. Modeling of Advanced Alkaline Electrolyzers: A System Simulation Approach. Int. J. Hydrog. Energy 2003, 28, 21–33. [Google Scholar] [CrossRef]
- Đukić, A.; Firak, M. Hydrogen Production Using Alkaline Electrolyzer and Photovoltaic (PV) Module. Int. J. Hydrog. Energy 2011, 36, 7799–7806. [Google Scholar] [CrossRef]
- LeRoy, R.L. The Thermodynamics of Aqueous Water Electrolysis. J. Electrochem. Soc. 1980, 127, 1954. [Google Scholar] [CrossRef]
- Haug, P.; Koj, M.; Turek, T. Influence of Process Conditions on Gas Purity in Alkaline Water Electrolysis. Int. J. Hydrog. Energy 2017, 42, 9406–9418. [Google Scholar] [CrossRef]
- Haug, P.; Kreitz, B.; Koj, M.; Turek, T. Process Modelling of an Alkaline Water Electrolyzer. Int. J. Hydrog. Energy 2017, 42, 15689–15707. [Google Scholar] [CrossRef]
- Renaud, R.; Leroy, R. Separator Materials for Use in Alkaline Water Electrolysers. Int. J. Hydrog. Energy 1982, 7, 155–166. [Google Scholar] [CrossRef]
- Kraglund, M.R.; Aili, D.; Jankova, K.; Christensen, E.; Li, Q.; Jensen, J.O. Zero-Gap Alkaline Water Electrolysis Using Ion-Solvating Polymer Electrolyte Membranes at Reduced KOH Concentrations. J. Electrochem. Soc. 2016, 163, F3125–F3131. [Google Scholar] [CrossRef]
- Kraglund, M.R.; Carmo, M.; Schiller, G.; Ansar, S.A.; Aili, D.; Christensen, E.; Jensen, J.O. Ion-Solvating Membranes as a New Approach towards High Rate Alkaline Electrolyzers. Energy Environ. Sci. 2019, 12, 3313–3318. [Google Scholar] [CrossRef] [Green Version]
- Hnát, J.; Paidar, M.; Schauer, J.; Žitka, J.; Bouzek, K. Polymer Anion-Selective Membranes for Electrolytic Splitting of Water. Part II: Enhancement of Ionic Conductivity and Performance under Conditions of Alkaline Water Electrolysis. J. Appl. Electrochem. 2012, 42, 545–554. [Google Scholar] [CrossRef] [Green Version]
- Hnát, J.; Plevová, M.; Žitka, J.; Paidar, M.; Bouzek, K. Anion-Selective Materials with 1,4-Diazabicyclo[2.2.2]Octane Functional Groups for Advanced Alkaline Water Electrolysis. Electrochim. Acta 2017, 248, 547–555. [Google Scholar] [CrossRef]
- Phillips, R.; Dunnill, C.W. Zero Gap Alkaline Electrolysis Cell Design for Renewable Energy Storage as Hydrogen Gas. RSC Adv. 2016, 6, 100643–100651. [Google Scholar] [CrossRef] [Green Version]
- Sánchez, M.; Amores, E.; Rodríguez, L.; Clemente-Jul, C. Semi-Empirical Model and Experimental Validation for the Performance Evaluation of a 15 kW Alkaline Water Electrolyzer. Int. J. Hydrog. Energy 2018, 43, 20332–20345. [Google Scholar] [CrossRef]
- Hammoudi, M.; Henao, C.; Agbossou, K.; Dubé, Y.; Doumbia, M. New Multi-Physics Approach for Modelling and Design of Alkaline Electrolyzers. Int. J. Hydrog. Energy 2012, 37, 13895–13913. [Google Scholar] [CrossRef]
- Koj, M.; Gimpel, T.; Schade, W.; Turek, T. Laser Structured Nickel-Iron Electrodes for Oxygen Evolution in Alkaline Water Electrolysis. Int. J. Hydrog. Energy 2019, 44, 12671–12684. [Google Scholar] [CrossRef]
- Koj, M.; Qian, J.; Turek, T. Novel Alkaline Water Electrolysis with Nickel-Iron Gas Diffusion Electrode for Oxygen Evolution. Int. J. Hydrog. Energy 2019, 44, 29862–29875. [Google Scholar] [CrossRef]
- Hall, D.E. Electrodes for Alkaline Water Electrolysis. J. Electrochem. Soc. 1981, 128, 740. [Google Scholar] [CrossRef]
- Huot, J.Y. Low Hydrogen Overpotential Nanocrystalline Ni-Mo Cathodes for Alkaline Water Electrolysis. J. Electrochem. Soc. 1991, 138, 1316. [Google Scholar] [CrossRef]
- Rauscher, T.; Bernäcker, C.I.; Mühle, U.; Kieback, B.; Röntzsch, L. The Effect of Fe as Constituent in Ni-Base Alloys on the Oxygen Evolution Reaction in Alkaline Solutions at High Current Densities. Int. J. Hydrog. Energy 2019, 44, 6392–6402. [Google Scholar] [CrossRef]
- Fan, C. Study of Electrodeposited Nickel-Molybdenum, Nickel-Tungsten, Cobalt-Molybdenum, and Cobalt-Tungsten as Hydrogen Electrodes in Alkaline Water Electrolysis. J. Electrochem. Soc. 1994, 141, 382. [Google Scholar] [CrossRef]
- Rauscher, T.; Müller, C.I.; Schmidt, A.; Kieback, B.; Röntzsch, L. Ni–Mo–B Alloys as Cathode Material for Alkaline Water Electrolysis. Int. J. Hydrog. Energy 2016, 41, 2165–2176. [Google Scholar] [CrossRef]
- Ursúa, A.; San Martín, I.; Barrios, E.L.; Sanchis, P. Stand-Alone Operation of an Alkaline Water Electrolyser Fed by Wind and Photovoltaic Systems. Int. J. Hydrog. Energy 2013, 38, 14952–14967. [Google Scholar] [CrossRef]
- Henao, C.; Agbossou, K.; Hammoudi, M.; Dubé, Y.; Cardenas, A. Simulation Tool Based on a Physics Model and an Electrical Analogy for an Alkaline Electrolyser. J. Power Sources 2014, 250, 58–67. [Google Scholar] [CrossRef]
- Balabel, A.; Zaky, M.S.; Sakr, I. Optimum Operating Conditions for Alkaline Water Electrolysis Coupled with Solar PV Energy System. Arab. J. Sci. Eng. 2014, 39, 4211–4220. [Google Scholar] [CrossRef]
- Vermeiren, P. Zirfon®: A New Separator for Ni-H2 Batteries and Alkaline Fuel Cells. Int. J. Hydrog. Energy 1996, 21, 679–684. [Google Scholar] [CrossRef]
- Le Bideau, D.; Mandin, P.; Benbouzid, M.; Kim, M.; Sellier, M. Review of Necessary Thermophysical Properties and Their Sensivities with Temperature and Electrolyte Mass Fractions for Alkaline Water Electrolysis Multiphysics Modelling. Int. J. Hydrog. Energy 2019, 44, 4553–4569. [Google Scholar] [CrossRef]
- Shoor, S.K.; Walker, R.D.; Gubbins, K.E. Salting out of Nonpolar Gases in Aqueous Potassium Hydroxide Solutions. J. Phys. Chem. 1969, 73, 312–317. [Google Scholar] [CrossRef]
- Grover, P.K.; Ryall, R.L. Critical Appraisal of Salting-Out and Its Implications for Chemical and Biological Sciences. Chem. Rev. 2005, 105, 1–10. [Google Scholar] [CrossRef] [PubMed]
- Randall, M.; Failey, C.F. The Activity Coefficient of Non-Electrolytes in Aqueous Salt Solutions from Solubility Measurements. The Salting-out Order of the Ions. Chem. Rev. 1927, 4, 285–290. [Google Scholar] [CrossRef]
- Lang, W.; Zander, R. Salting-out of Oxygen from Aqueous Electrolyte Solutions: Prediction and Measurement. Ind. Eng. Chem. Fundam. 1986, 25, 775–782. [Google Scholar] [CrossRef]
- See, D.M.; White, R.E. Temperature and Concentration Dependence of the Specific Conductivity of Concentrated Solutions of Potassium Hydroxide. J. Chem. Eng. Data 1997, 42, 1266–1268. [Google Scholar] [CrossRef]
- De Souza, R.F.; Padilha, J.C.; Gonçalves, R.S.; Rault-Berthelot, J. Dialkylimidazolium Ionic Liquids as Electrolytes for Hydrogen Production from Water Electrolysis. Electrochem. Commun. 2006, 8, 211–216. [Google Scholar] [CrossRef]
- Zhao, Y.; Zhao, J.; Huang, Y.; Zhou, Q.; Zhang, X.; Zhang, S. Toxicity of Ionic Liquids: Database and Prediction via Quantitative Structure–Activity Relationship Method. J. Hazard. Mater. 2014, 278, 320–329. [Google Scholar] [CrossRef]
- Zhao, Y.; Gani, R.; Afzal, R.M.; Zhang, X.; Zhang, S. Ionic Liquids for Absorption and Separation of Gases: An Extensive Database and a Systematic Screening Method. AIChE J. 2017, 63, 1353–1367. [Google Scholar] [CrossRef]
- Zhao, Y.; Pan, M.; Kang, X.; Tu, W.; Gao, H.; Zhang, X. Gas Separation by Ionic Liquids: A Theoretical Study. Chem. Eng. Sci. 2018, 189, 43–55. [Google Scholar] [CrossRef]
- De Souza, R.F.; Padilha, J.C.; Gonçalves, R.S.; de Souza, M.O.; Rault-Berthelot, J. Electrochemical Hydrogen Production from Water Electrolysis Using Ionic Liquid as Electrolytes: Towards the Best Device. J. Power Sources 2007, 164, 792–798. [Google Scholar] [CrossRef]
- Schalenbach, M.; Lueke, W.; Stolten, D. Hydrogen Diffusivity and Electrolyte Permeability of the Zirfon PERL Separator for Alkaline Water Electrolysis. J. Electrochem. Soc. 2016, 163, F1480–F1488. [Google Scholar] [CrossRef] [Green Version]
- Trinke, P.; Haug, P.; Brauns, J.; Bensmann, B.; Hanke-Rauschenbach, R.; Turek, T. Hydrogen Crossover in PEM and Alkaline Water Electrolysis: Mechanisms, Direct Comparison and Mitigation Strategies. J. Electrochem. Soc. 2018, 165, F502–F513. [Google Scholar] [CrossRef]
- Roy, A.; Watson, S.; Infield, D. Comparison of Electrical Energy Efficiency of Atmospheric and High-Pressure Electrolysers. Int. J. Hydrog. Energy 2006, 31, 1964–1979. [Google Scholar] [CrossRef]
- Ursúa, A.; Sanchis, P. Static–Dynamic Modelling of the Electrical Behaviour of a Commercial Advanced Alkaline Water Electrolyser. Int. J. Hydrog. Energy 2012, 37, 18598–18614. [Google Scholar] [CrossRef]
- Dobó, Z.; Palotás, Á.B. Impact of the Voltage Fluctuation of the Power Supply on the Efficiency of Alkaline Water Electrolysis. Int. J. Hydrog. Energy 2016, 41, 11849–11856. [Google Scholar] [CrossRef]
- Dobó, Z.; Palotás, Á.B. Impact of the Current Fluctuation on the Efficiency of Alkaline Water Electrolysis. Int. J. Hydrog. Energy 2017, 42, 5649–5656. [Google Scholar] [CrossRef]
- Speckmann, F.W.; Bintz, S.; Birke, K.P. Influence of Rectifiers on the Energy Demand and Gas Quality of Alkaline Electrolysis Systems in Dynamic Operation. Appl. Energy 2019, 250, 855–863. [Google Scholar] [CrossRef]
- De Fátima Palhares, D.D.; Vieira, L.G.M.; Damasceno, J.J.R. Hydrogen Production by a Low-Cost Electrolyzer Developed through the Combination of Alkaline Water Electrolysis and Solar Energy Use. Int. J. Hydrog. Energy 2018, 43, 4265–4275. [Google Scholar] [CrossRef]
- Hug, W.; Bussmann, H.; Brinner, A. Intermittent Operation and Operation Modeling of an Alkaline Electrolyzer. Int. J. Hydrog. Energy 1993, 18, 973–977. [Google Scholar] [CrossRef]
- Firak, M.; Djukic, A. An Investigation into the Effect of Photovoltaic Module Electric Properties on Maximum Power Point Trajectory with the Aim of Its Alignment with Electrolyzer U-I Characteristic. Therm. Sci. 2010, 14, 729–738. [Google Scholar] [CrossRef]
- Đukić, A. Autonomous Hydrogen Production System. Int. J. Hydrog. Energy 2015, 40, 7465–7474. [Google Scholar] [CrossRef]
- Dai, J.; Liu, D.; Wen, L.; Long, X. Research on Power Coefficient of Wind Turbines Based on SCADA Data. Renew. Energy 2016, 86, 206–215. [Google Scholar] [CrossRef]
- Chin, V.J.; Salam, Z.; Ishaque, K. Cell Modelling and Model Parameters Estimation Techniques for Photovoltaic Simulator Application: A Review. Appl. Energy 2015, 154, 500–519. [Google Scholar] [CrossRef]
- Vergura, S. A Complete and Simplified Datasheet-Based Model of PV Cells in Variable Environmental Conditions for Circuit Simulation. Energies 2016, 9, 326. [Google Scholar] [CrossRef]
- Kovač, A.; Marciuš, D.; Budin, L. Solar Hydrogen Production via Alkaline Water Electrolysis. Int. J. Hydrog. Energy 2019, 44, 9841–9848. [Google Scholar] [CrossRef]
- Bhattacharyya, R.; Misra, A.; Sandeep, K. Photovoltaic Solar Energy Conversion for Hydrogen Production by Alkaline Water Electrolysis: Conceptual Design and Analysis. Energy Convers. Manag. 2017, 133, 1–13. [Google Scholar] [CrossRef]
- Khalilnejad, A.; Riahy, G. A Hybrid Wind-PV System Performance Investigation for the Purpose of Maximum Hydrogen Production and Storage Using Advanced Alkaline Electrolyzer. Energy Convers. Manag. 2014, 80, 398–406. [Google Scholar] [CrossRef]
- Badwal, S.P.S.; Giddey, S.S.; Munnings, C.; Bhatt, A.I.; Hollenkamp, A.F. Emerging Electrochemical Energy Conversion and Storage Technologies. Front. Chem. 2014, 2. [Google Scholar] [CrossRef] [Green Version]
- Kolli, A.; Gaillard, A.; De Bernardinis, A.; Bethoux, O.; Hissel, D.; Khatir, Z. A Review on DC/DC Converter Architectures for Power Fuel Cell Applications. Energy Convers. Manag. 2015, 105, 716–730. [Google Scholar] [CrossRef]
- Ursúa, A.; Barrios, E.L.; Pascual, J.; San Martín, I.; Sanchis, P. Integration of Commercial Alkaline Water Electrolysers with Renewable Energies: Limitations and Improvements. Int. J. Hydrog. Energy 2016, 41, 12852–12861. [Google Scholar] [CrossRef]
- Zini, G.; Tartarini, P. Wind-Hydrogen Energy Stand-Alone System with Carbon Storage: Modeling and Simulation. Renew. Energy 2010, 35, 2461–2467. [Google Scholar] [CrossRef]
- Akpinar, E.K.; Akpinar, S. An Assessment on Seasonal Analysis of Wind Energy Characteristics and Wind Turbine Characteristics. Energy Convers. Manag. 2005, 46, 1848–1867. [Google Scholar] [CrossRef]
- Babu, N.R.; Arulmozhivarman, P. Wind Energy Conversion Systems-A Technical Review. J. Eng. Sci. Technol. 2013, 8, 493–507. [Google Scholar]
- Douglas, T.G.; Cruden, A.; Infield, D. Development of an Ambient Temperature Alkaline Electrolyser for Dynamic Operation with Renewable Energy Sources. Int. J. Hydrog. Energy 2013, 38, 723–739. [Google Scholar] [CrossRef]
- Kiaee, M.; Cruden, A.; Infield, D.; Chladek, P. Utilisation of Alkaline Electrolysers to Improve Power System Frequency Stability with a High Penetration of Wind Power. IET Renew. Power Gener. 2014, 8, 529–536. [Google Scholar] [CrossRef]
- Varone, A.; Ferrari, M. Power to Liquid and Power to Gas: An Option for the German Energiewende. Renew. Sustain. Energy Rev. 2015, 45, 207–218. [Google Scholar] [CrossRef] [Green Version]
- Parra, D.; Swierczynski, M.; Stroe, D.I.; Norman, S.; Abdon, A.; Worlitschek, J.; O’Doherty, T.; Rodrigues, L.; Gillott, M.; Zhang, X.; et al. An Interdisciplinary Review of Energy Storage for Communities: Challenges and Perspectives. Renew. Sustain. Energy Rev. 2017, 79, 730–749. [Google Scholar] [CrossRef]
- Kiaee, M.; Infield, D.; Cruden, A. Utilisation of Alkaline Electrolysers in Existing Distribution Networks to Increase the Amount of Integrated Wind Capacity. J. Energy Storage 2018, 16, 8–20. [Google Scholar] [CrossRef] [Green Version]
- Hug, W.; Divisek, J.; Mergel, J.; Seeger, W.; Steeb, H. Highly Efficient Advanced Alkaline Electrolyzer for Solar Operation. Int. J. Hydrog. Energy 1992, 17, 699–705. [Google Scholar] [CrossRef]
- Kuroda, Y.; Nishimoto, T.; Mitsushima, S. Self-Repairing Hybrid Nanosheet Anode Catalysts for Alkaline Water Electrolysis Connected with Fluctuating Renewable Energy. Electrochim. Acta 2019, 323, 134812. [Google Scholar] [CrossRef]
- Djafour, A.; Matoug, M.; Bouras, H.; Bouchekima, B.; Aida, M.; Azoui, B. Photovoltaic-Assisted Alkaline Water Electrolysis: Basic Principles. Int. J. Hydrog. Energy 2011, 36, 4117–4124. [Google Scholar] [CrossRef]
- Artuso, P.; Zuccari, F.; Dell’Era, A.; Orecchini, F. PV-Electrolyzer Plant: Models and Optimization Procedure. J. Sol. Energy Eng. 2010, 132, 031016. [Google Scholar] [CrossRef]
Figure 1.
The number of publications per year from 1990 to 2019 containing the specified keywords. Around 2010, the publication rate increases due to greater interest in the energy turnaround. While the topic is often discussed technology-independently (unspecified), more publications for low-temperature technologies, like alkaline water electrolysis (AEL) and proton exchange membrane electrolysis (PEMEL), are available than for the high-temperature technology solid oxide electrolysis (SOEL) [26].

Figure 2.
A schematic flow diagram of an alkaline water electrolyzer. The electrolyte is pumped through the electrolysis cell where the gas evolution takes place. Adjacent gas separators split both phases, and the liquid phase flows back to the electrolysis stack. Heat exchangers ensure that the optimal temperature is maintained, and the product gases can be purified afterward.

Figure 3.
Different cell designs for alkaline water electrolysis. Whereas (a) shows a conventional assembly with a defined distance between both electrodes, (b) depicts a zero-gap assembly where the electrodes are directly pressed onto the separator [38].
Figure 3.
Different cell designs for alkaline water electrolysis. Whereas (a) shows a conventional assembly with a defined distance between both electrodes, (b) depicts a zero-gap assembly where the electrodes are directly pressed onto the separator [38].

Figure 4.
The calculated cell voltage of an atmospheric alkaline water electrolyzer at a temperature of 60 °C according to Equation (8). The overall cell voltage consists of the reversible cell voltage , ohmic losses , and activation overvoltages [39,40].

Figure 5.
The calculated specific electrolyte conductivity as a function of the electrolyte concentrations of sodium hydroxide (NaOH) and potassium hydroxide (KOH) solutions at different temperatures obtained by Equations (A2) and (A3). The correlation parameters can be found in Table A2 [52,57].

Figure 6.
Anodic gas impurity ( in ) in relation to the current density at different pressure levels for (a) separated and (b) mixed electrolyte cycles, at a temperature of 60 °C, with an electrolyte concentration of approximately 32 wt.% and an electrolyte volume flow of 0.35 L min−1 [64].
Figure 6.
Anodic gas impurity ( in ) in relation to the current density at different pressure levels for (a) separated and (b) mixed electrolyte cycles, at a temperature of 60 °C, with an electrolyte concentration of approximately 32 wt.% and an electrolyte volume flow of 0.35 L min−1 [64].

Figure 7.
Typical time-related profiles for (a) solar radiation and (b) wind velocity, measured by the weather station of the Clausthal University of Technology. Though solar radiation peaks around noon, wind velocity shows sinusoidal oscillations.
Figure 7.
Typical time-related profiles for (a) solar radiation and (b) wind velocity, measured by the weather station of the Clausthal University of Technology. Though solar radiation peaks around noon, wind velocity shows sinusoidal oscillations.

Figure 8.
Schematic of alkaline water electrolysis powered by solar energy. Photovoltaic panels convert the solar radiation into electricity, which can be used for the operation. The implementation of a DC/DC power converter is optional, as direct and indirect coupling is possible [70,78,79].

Figure 9.
Example calculation results of the (a) current–voltage characteristics of a photovoltaic panel at different solar radiation levels and the corresponding (b) power–voltage curve. Additionally, a current–voltage characteristic of an alkaline water electrolyzer (AEL) is implemented. The intersections determine the possible operation points. For an efficient operation, the distance to the maximal power points (MPP) should be minimal [29,72,73].

Figure 10.
Schematic of alkaline water electrolysis powered by wind energy. Wind turbines convert the available wind power into electricity, which can be used for the operation. The implementation of a suitable AC/DC converter is mandatory [74,79].

Figure 11.
Example calculation results of (a) the performance coefficient for various rotor blade pitch angles using Equation (17) and (b) the wind turbine power for different wind velocities using Equation (16). The maximum power point (MPP) trajectory is marked [74,79].

Figure 12.
The schematic process scheme of a hydrogen energy system. Photovoltaic panels and wind turbines generate renewable energy to power alkaline water electrolyzers, and stored hydrogen can be converted back into electricity by fuel cells. Therefore, either oxygen or air can be utilized. Additional energy storage devices can damp fluctuations, and the complete hydrogen energy system can be used for power grid stabilization [25,28,82,87].

Table 1.
Parameters for the example calculation of the photovoltaic current using Equation (10). The number of serial ns and parallel np connected photovoltaic cells, the short-circuit current Isc, the open-cell voltage Uoc, the serial Rs and parallel resistance Rp, and the non-ideality factor m are setup-specific data. A constant cell temperature Tc is assumed [29,72,73].
| m | |||||||
|---|---|---|---|---|---|---|---|
| – | – | A | V | Ω | Ω | – | °C |
| 9 | 2 | 5.98 | 4.615 | 0.099 | 20 | 1.6 | 48 |
© 2020 by the authors. Licensee MDPI, Basel, Switzerland. This article is an open access article distributed under the terms and conditions of the Creative Commons Attribution (CC BY) license (http://creativecommons.org/licenses/by/4.0/).
Share and Cite
MDPI and ACS Style
Brauns, J.; Turek, T. Alkaline Water Electrolysis Powered by Renewable Energy: A Review. Processes 2020, 8, 248. https://0-doi-org.brum.beds.ac.uk/10.3390/pr8020248
AMA Style
Brauns J, Turek T. Alkaline Water Electrolysis Powered by Renewable Energy: A Review. Processes. 2020; 8(2):248. https://0-doi-org.brum.beds.ac.uk/10.3390/pr8020248
Chicago/Turabian StyleBrauns, Jörn, and Thomas Turek. 2020. "Alkaline Water Electrolysis Powered by Renewable Energy: A Review" Processes 8, no. 2: 248. https://0-doi-org.brum.beds.ac.uk/10.3390/pr8020248
Note that from the first issue of 2016, this journal uses article numbers instead of page numbers. See further details here.