Intelligent Setting Method of Reagent Dosage Based on Time Series Froth Image in Zinc Flotation Process


1
School of Automation, Central South University, Changsha 410083, China
2
School of Information Science and Engineering, Hunan Normal University, Changsha 410081, China
*
Author to whom correspondence should be addressed.
Processes 2020, 8(5), 536; https://0-doi-org.brum.beds.ac.uk/10.3390/pr8050536
Submission received: 29 March 2020
/
Revised: 29 April 2020
/
Accepted: 30 April 2020
/
Published: 3 May 2020
(This article belongs to the Special Issue Advances in Condition Monitoring, Optimization and Control for Complex Industrial Processes)
Abstract
:It is well known that the change of the reagent dosage during the flotation process will cause the froth image to change continuously with time. Therefore, an intelligent setting method based on the time series froth image in the zinc flotation process is proposed. Firstly, the sigmoid kernel function is used to estimate the cumulative distribution function of bubble size, and the cumulative distribution function shape is characterized by sigmoid kernel function parameters. Since the reagent will affect the froth image over a period of time, the time series of bubble size cumulative distribution function is processed by the ELMo model and the dynamic feature vectors are output. Finally, XGBoost is used to establish the nonlinear relationship modeling between reagent dosage and dynamic feature vectors. Industrial experiments have proved the effectiveness of the proposed method.
1. Introduction
Froth flotation is a physical and chemical process that occurs at the three-phase interface of solids, liquids, and gases, and is used to separate valuable minerals from gangue. Froth flotation is an industrial process of processing minerals. The flotation process is affected by a variety of operating variables, such as slurry level, pH value, and reagent dosage [1]. Of all operating variables, the reagent dosage is the most critical [2]. The zinc flotation process is a typical complex industrial system, and it is difficult to recognize a clear mechanism to establish a first principle model [3]. At present, the method of controlling the reagent dosage in the actual flotation process is mainly achieved by the operator observing the surface characteristics of the froth image, such as bubble size, texture, and gray value [4].
With the development of advanced technologies such as industrial automation, cloud computing, and artificial intelligence, the modeling, monitoring, and control of complex industrial systems have new technical support [5]. In reference [6], deep reinforcement learning is applied to the boost control of diesel engines. The results show that the performance is better than the traditional proportion integral derivative (PID) controller. In the reference [7], the intelligent algorithm is applied to the optimal sitting and sizing of a distributed generation system, which improves the economic benefits and safety of the distributed generation system.
In recent years, many scholars have studied the method of controlling the reagent dosage in the flotation process [8,9,10]. In reference [11], a control strategy based on the sensitive features of froth images is proposed. The strategy proposed to adjust the reagent dosage based on the feed grade, and established a model of feed grade estimation based on the sensitive features of the froth image. Then, based on the operation mode method, the reagent dosage is preset according to the feed grade. However, it only analyzes the froth image of a single moment, and it is difficult to avoid the noise effect of single frame image. In reference [12], the authors analyzed the effect of reagent dosage on performance indicators, and then proposed a collaborative optimization method for reagent dosage based on key feature changes and case-based reasoning. The proposed method achieved a certain effect on the antimony flotation process, but it was difficult for the method to overcome the time lag problem on the flotation process. In reference [13], the case-based reasoning method was used to optimize the control of the reagent dosage in the magnetite flotation process, the results show that the method reduces the fluctuation of tailings grade, but it was difficult to deal with the disturbance in the flotation process.
In reference [14], it is pointed out that the visual features of the froth image play an important role in the flotation process. In reference [15], the Wasserstein Distance-Based CycleGAN method was used to measure the color features of the froth image, and the color features were applied to guide the flotation process of bauxite. In reference [16], the author introduced the biologically inspired Gabor wavelet transform to extract the texture features of froth images, and applied the texture features to the online state recognition of the flotation process.
Among all visual features of the froth image, the bubble size is the most critical [17]. In reference [18], the authors modeled the relationship between flotation process performance and bubble size of froth through neural networks. The results prove that the average bubble size of the froth image is very important to guide the stability of the flotation process. In reference [19], a control strategy is proposed to optimize the recovery of valuable minerals by tracking the expected bubble size distribution. In reference [20], a control strategy based on bubble size distribution is proposed to control the reagent dosage by minimizing the difference between the output bubble size distribution and the optimal bubble size distribution. In reference [21], the feedback controller maintains the probability density function of bubble size at the setpoint through the reagent dosage. In reference [22], the method used the bubble size probability density function to characterize the froth state. The reagent dosage is optimally controlled by minimizing the difference between the current bubble size probability density function and the optimal bubble size probability density function.
The features of the froth image in the zinc flotation process can reflect the working conditions of the flotation process, and the bubble size is the most obvious among all the features. In this paper, the bubble size cumulative distribution function (CDF) is used as a new feature of the froth image, and the estimation method of bubble size CDF is proposed. Because the change of reagent dosage will cause the froth image features to change continuously with time, this paper analyzes the relationship between the time series of bubble size CDF and the reagent dosage. Compared with the single-frame bubble image feature at a single moment, the time series froth image feature can reduce the influence of noise. The proposed method does not require manual participation, avoids the disadvantages of unstable performance indicators, and large reagent consumption due to differences in manual experience in the zinc flotation process, which is conducive to improving the economic benefits of the flotation plant.
The rest of the paper is structured as follows. A description of the process is presented in Section 2. The method for the estimation of bubble size CDF is shown in Section 3. The reagent dosage intelligent setting based on time series of bubble size CDF is discussed in Section 4. The industrial experiment and discussion are contained in Section 5. Section 6 draws the conclusions of this article.
2. Process Description
In the actual production process, the zinc flotation process is often accompanied by lead flotation, and this work focuses on the zinc flotation process. The simplified process of zinc flotation process is shown in Figure 1.
The purpose of the zinc flotation process is to extract zinc elements from sphalerite. The zinc element in the slurry mainly exists in the form of zinc sulfide (ZnS). After the chemical reaction between the slurry and the reagent, the froth layer and underflow are formed in the flotation bank. In the zinc flotation process, the reagent is made up of foaming reagent (ROH), activating reagent (CuSO4), capture reagent (C4H9OCSSNa) and PH adjustment reagent (H2SO4 and Ca(OH)2), according to a certain proportion.
The capacity of the flotation bank is about , with a flow rate of . The zinc flotation process includes the following stages: first zinc rougher, zinc rougher I, zinc rougher II, zinc cleaner I and zinc cleaner II, zinc cleaner III, and zinc scavenger. The slurry and reagent react chemically in the agitated tank, and a large amount of bubbles are generated under the action of the foaming agent. The zinc minerals adhere to the bubble surface to form mineralized bubbles, overflow from the first zinc rougher bank, and enter the zinc cleaner I. At the same time, the water-soluble material forms an underflow in the first zinc rougher bank and flows into the zinc rougher I. The same principle is followed in the subsequent flotation process. Finally, the zinc concentrate product is obtained from the zinc cleaner III bank, and the underflow in the zinc scavenger bank forms tailings.
The reagent acting in the first zinc rougher bank has an important influence on the final performance index (concentrate grade, tailing grade) in the zinc flotation process. The zinc flotation process has a long flow, severe time lag, many operating variables, and strong coupling, resulting in a very complicated zinc flotation process mechanism, making it difficult to establish an accurate dynamic model. Currently, the flotation plant controls the dosage of reagent manually. The method for controlling the reagent dosage in the zinc flotation process is as follows: the operator repeatedly inspects the froth state in the flotation process, and judges the reagent dosage according to production experience. In the process, the operator’s experience becomes extremely important. However, the experience level of different operators is very different, and it is difficult to ensure that the operating variables of the complex flotation process remain stable. A zinc flotation process monitoring system was established by installing a camera at the first zinc rougher bank [23]. Collecting and analyzing froth images through a monitoring system to reduce manual participation is a prerequisite for achieving automatic reagent control.
3. Estimation Method of Bubble Size CDF
In this paper, bubble size CDF is used to characterize the bubble size distribution. When determining a series of random variables, if there is an integrable probability density function on the real axis, the CDF is expressed as:
In the Equation (1), represents the bubble size, and is the probability density function of the bubble size. We use the flotation process monitoring system to obtain 2-D froth images under different working conditions in the zinc flotation process, as shown in Figure 2. Class 1 appears in the case of under-dosing, class 2 appears in the case of normal dosing, and class 3 appears in the case of over-dosing.
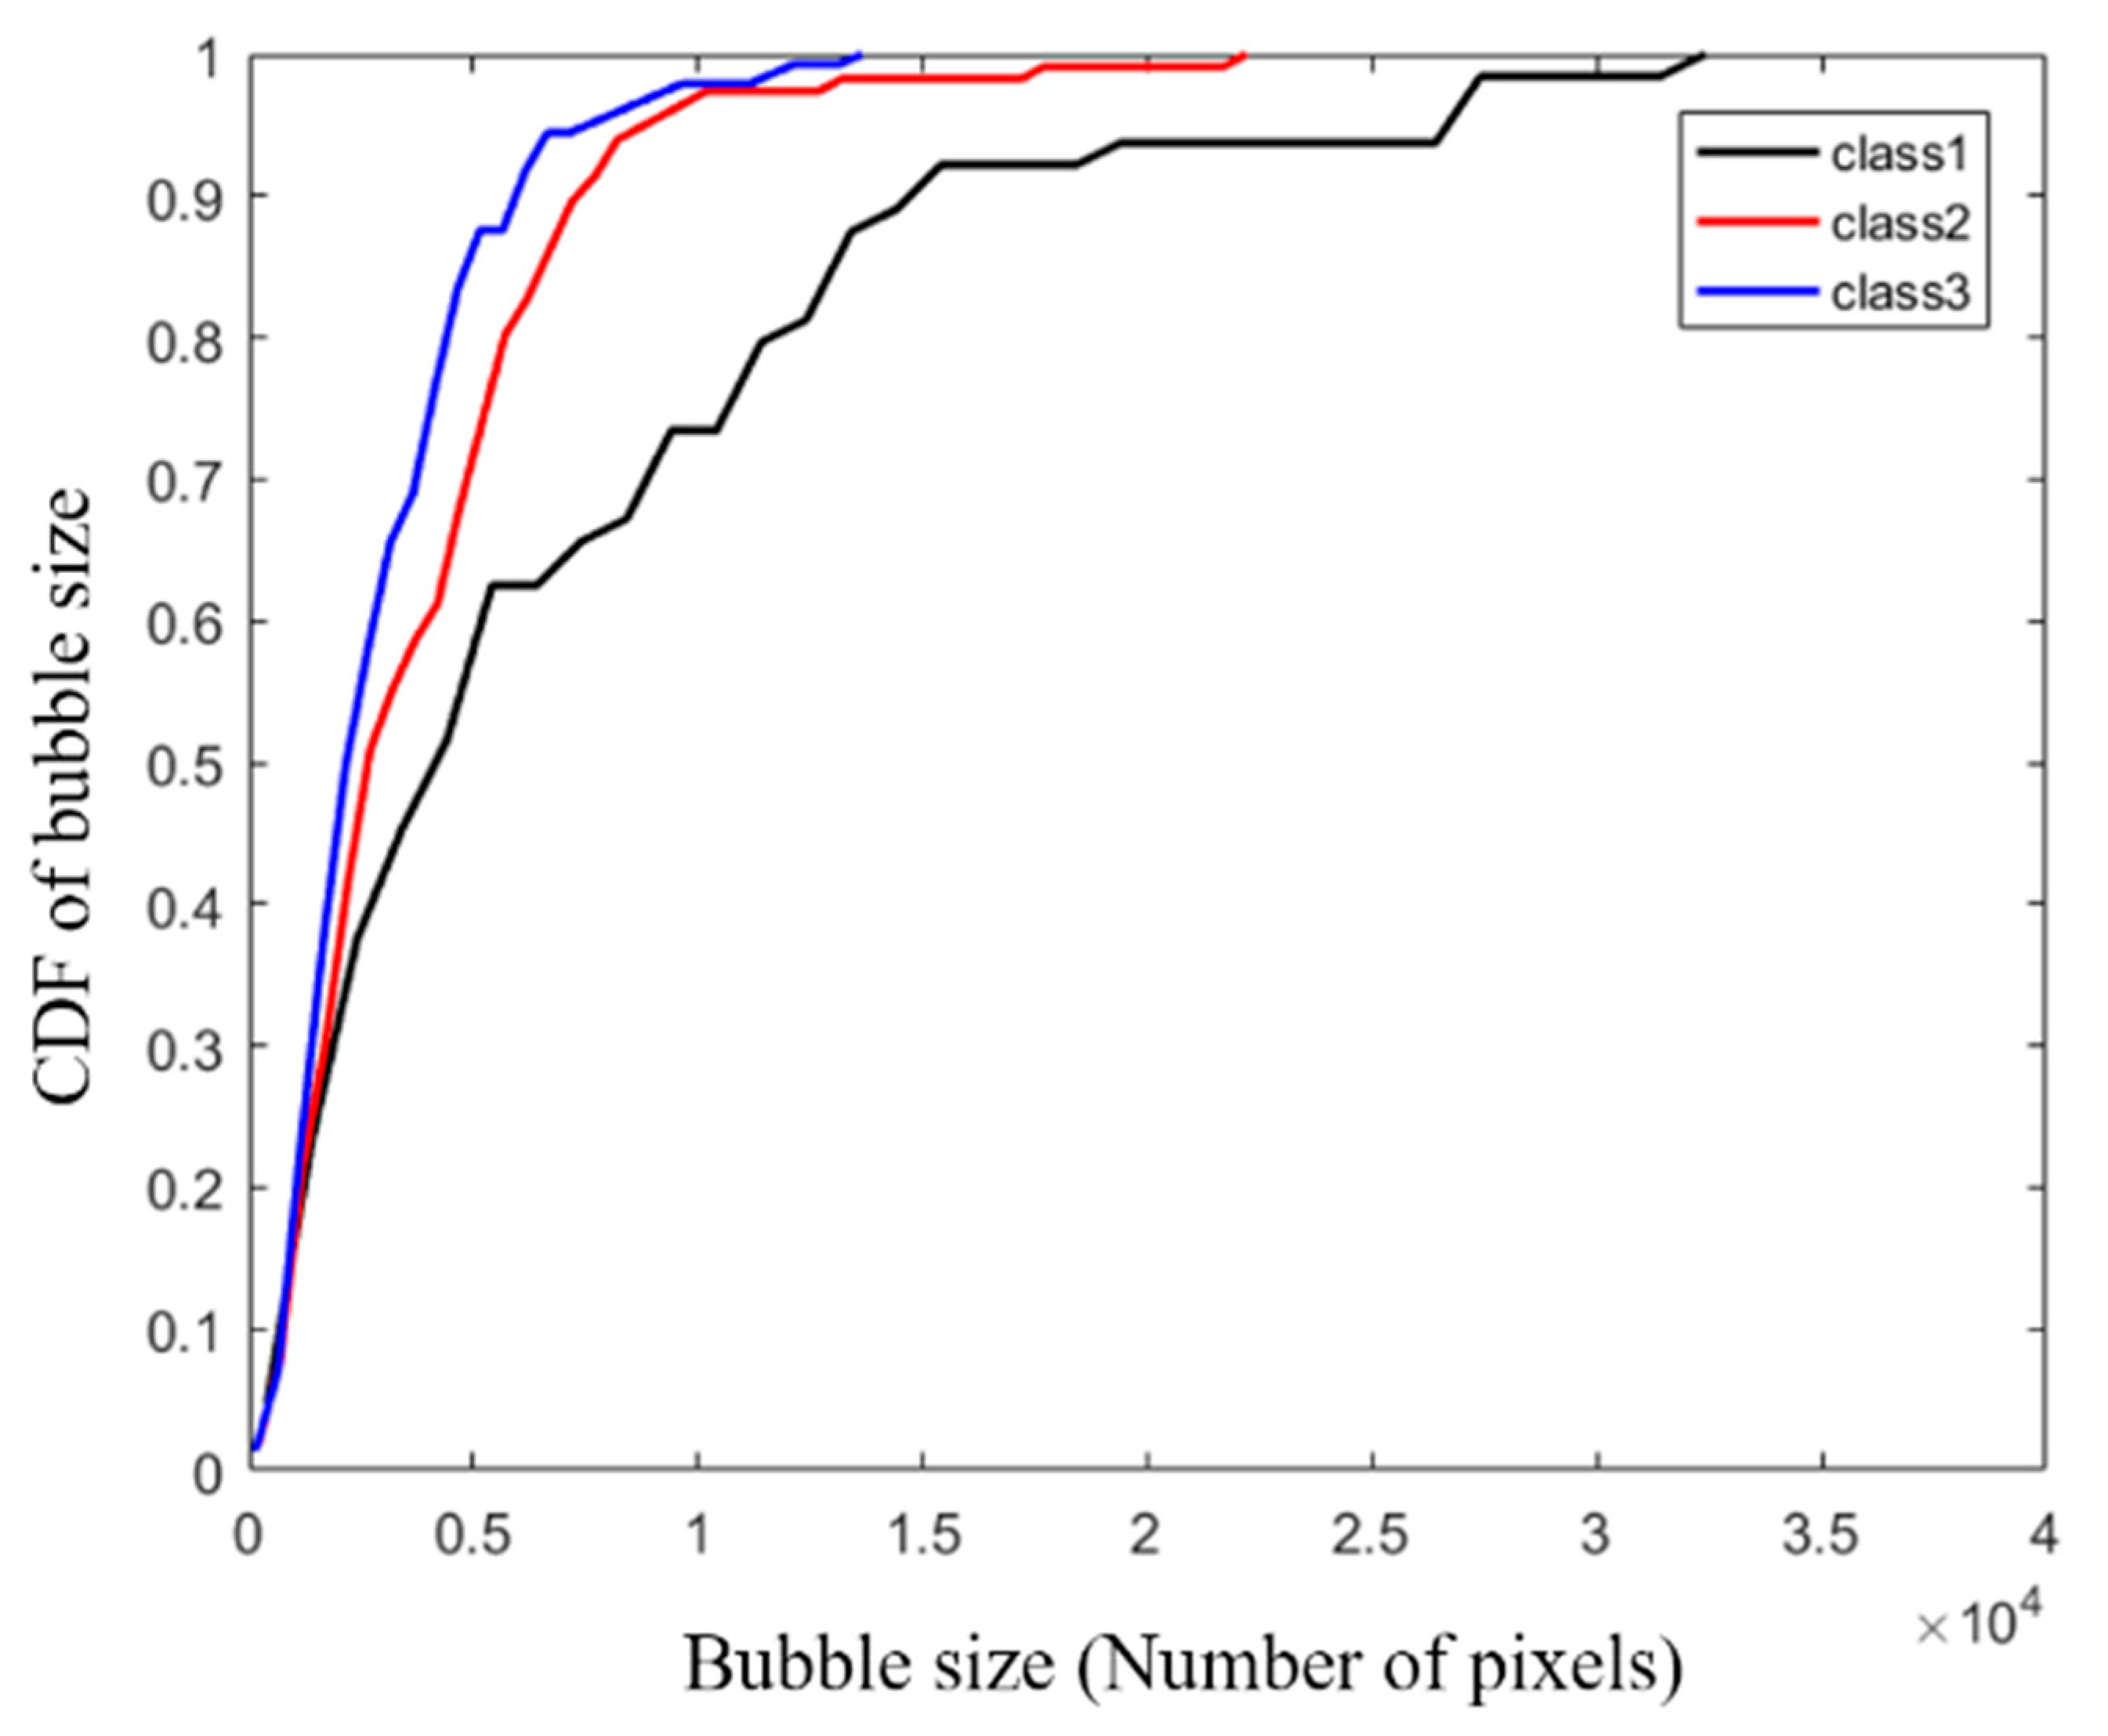
The resolution of the froth image captured by the camera in the flotation monitoring system is . With the original watershed algorithm it is difficult to accurately segment images such as the froth image without background, and this paper uses an improved watershed algorithm to segment the froth image to get the number of pixels contained in a single bubble [24]. The bubble size CDF of the different classes of the froth image is shown in Figure 3.
The standard sigmoid function expression:
The shape of the sigmoid function in the first quadrant of the coordinate system is highly similar to the shape of the bubble size CDF, so it will be feasible to estimate the bubble size CDF with the sigmoid kernel function. Here, we use a sigmoid kernel function to estimate the CDF of bubble size. Expressed as:
The parameters determine the shape of the CDF. The parameters were obtained using the least-squares algorithm [25].
where is the estimated sample size, is the CDF value when the bubble size is , and is the sigmoid kernel estimated value.
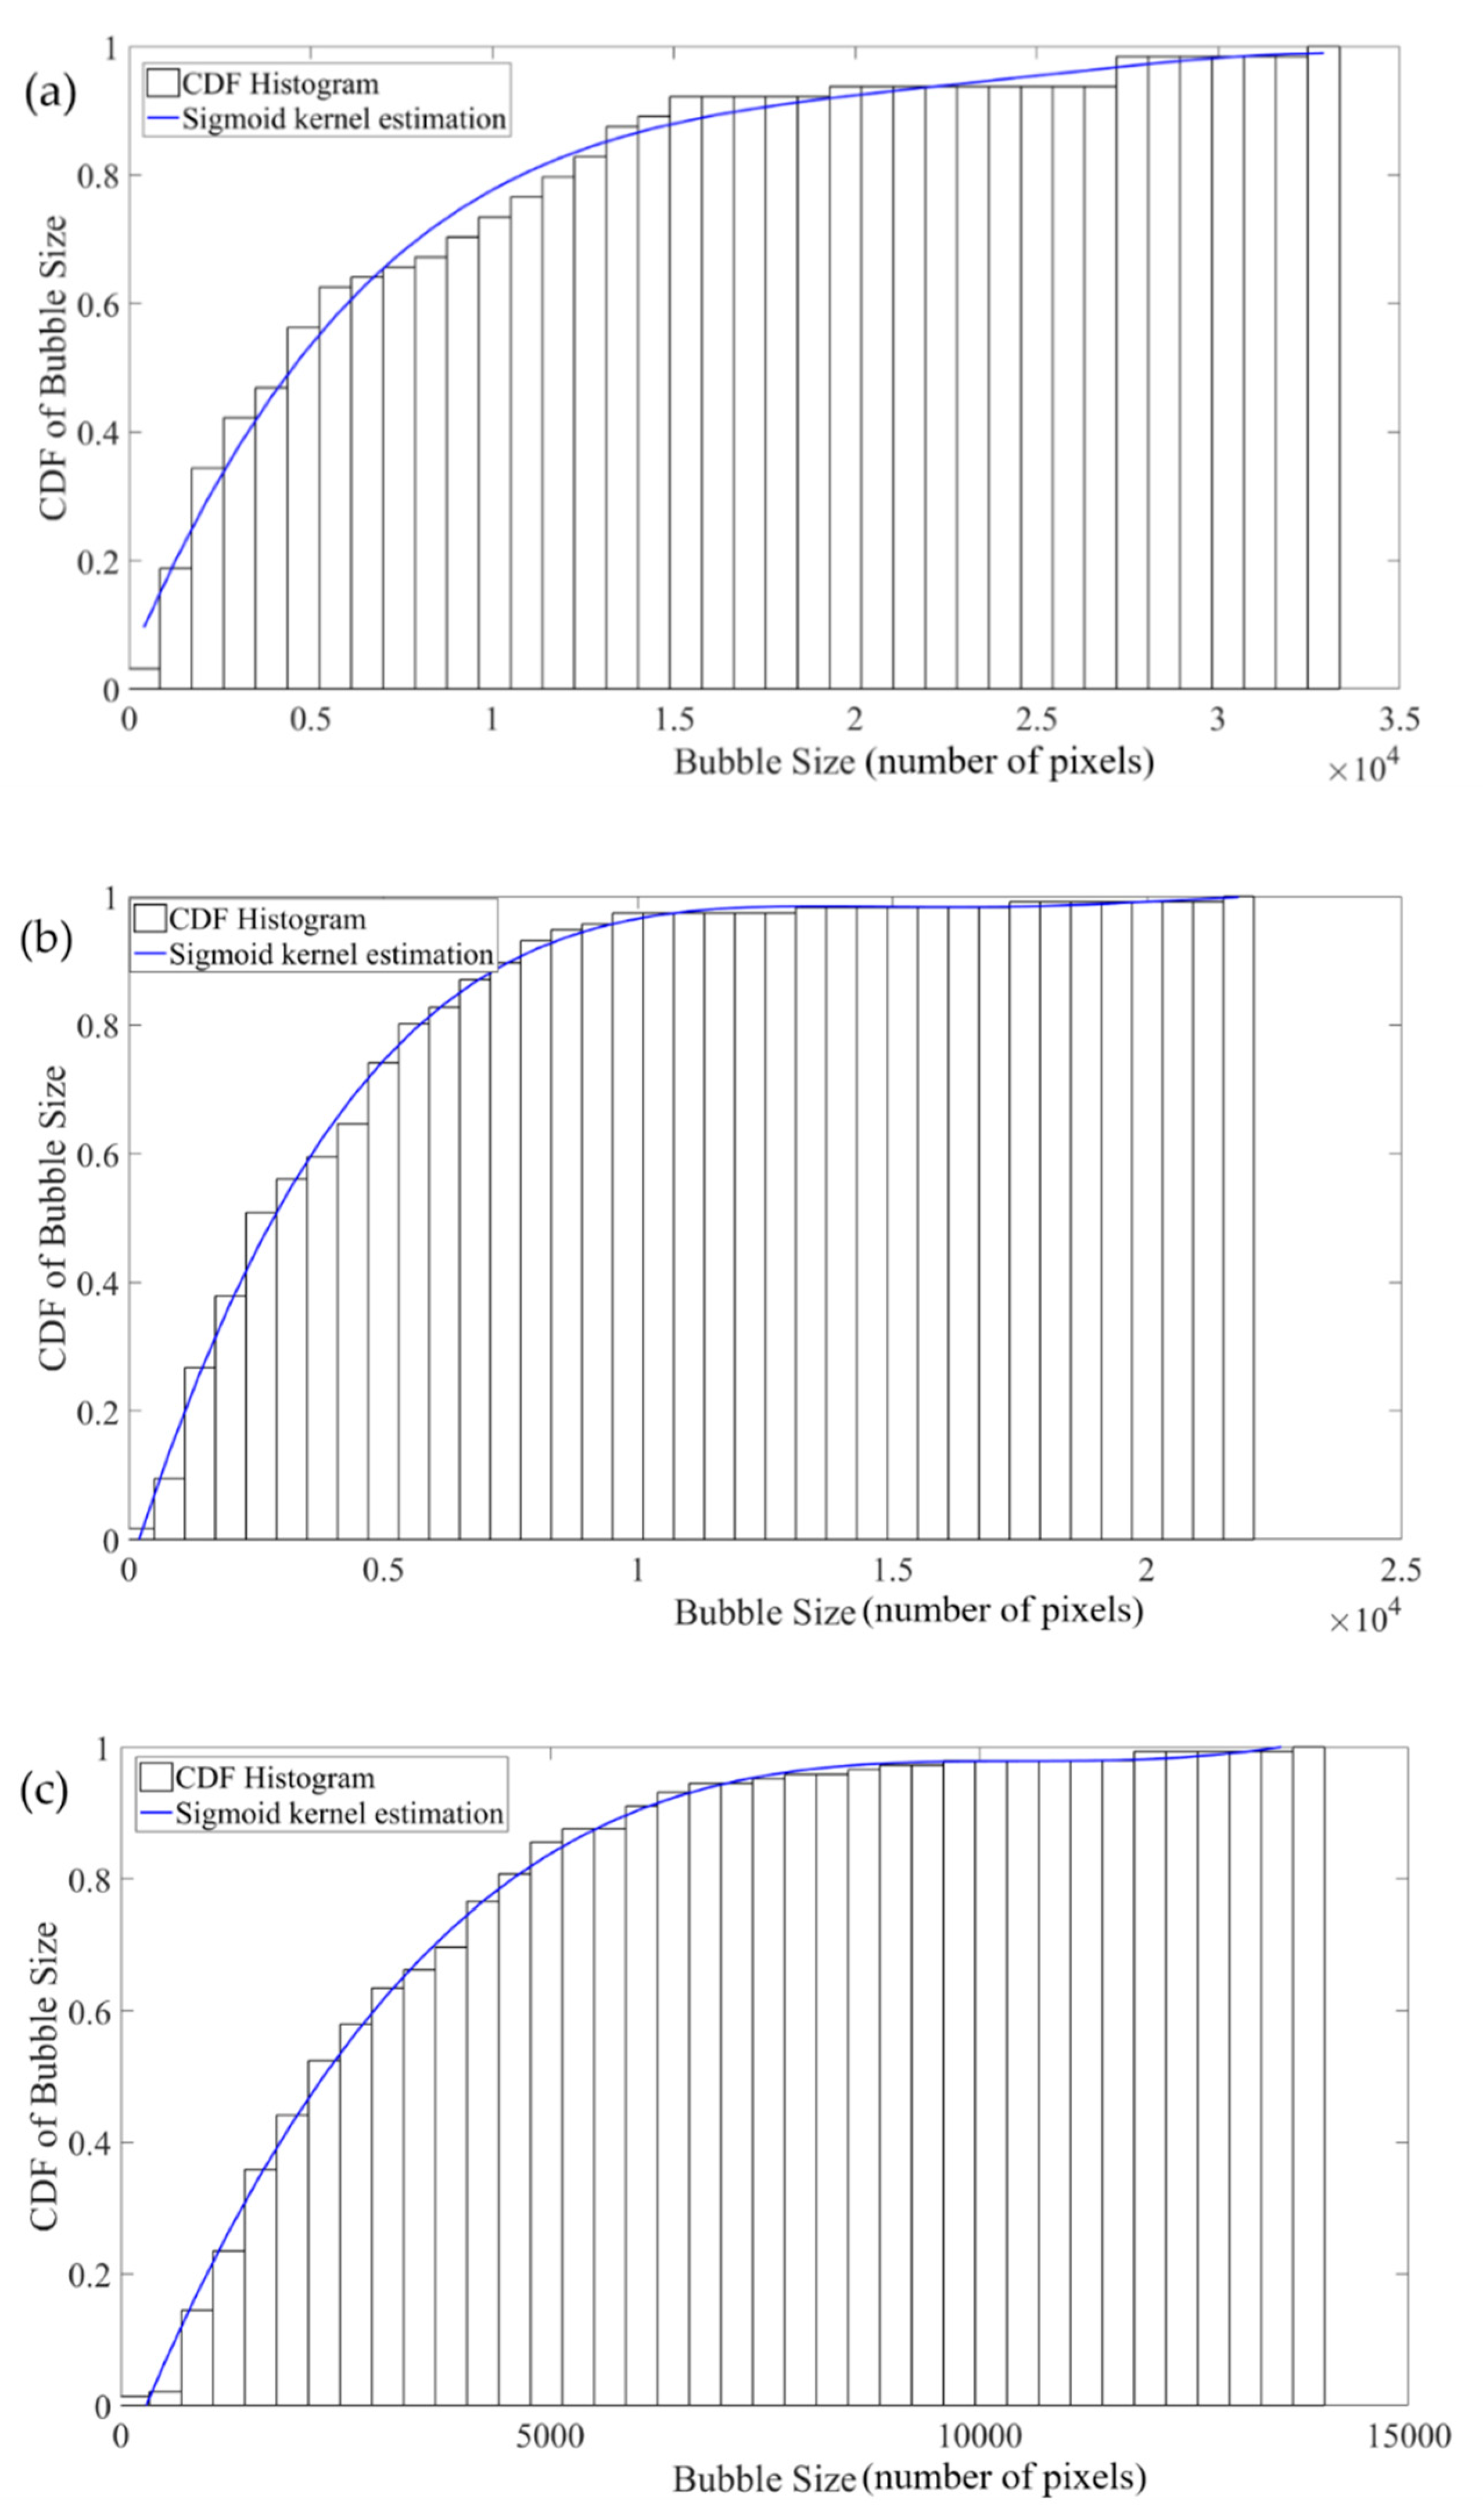
Figure 4 shows the experimental results of estimating the bubble size CDF using the sigmoid kernel function.
4. Reagent Dosage Intelligent Setting Based on Time Series of Bubble Size CDF
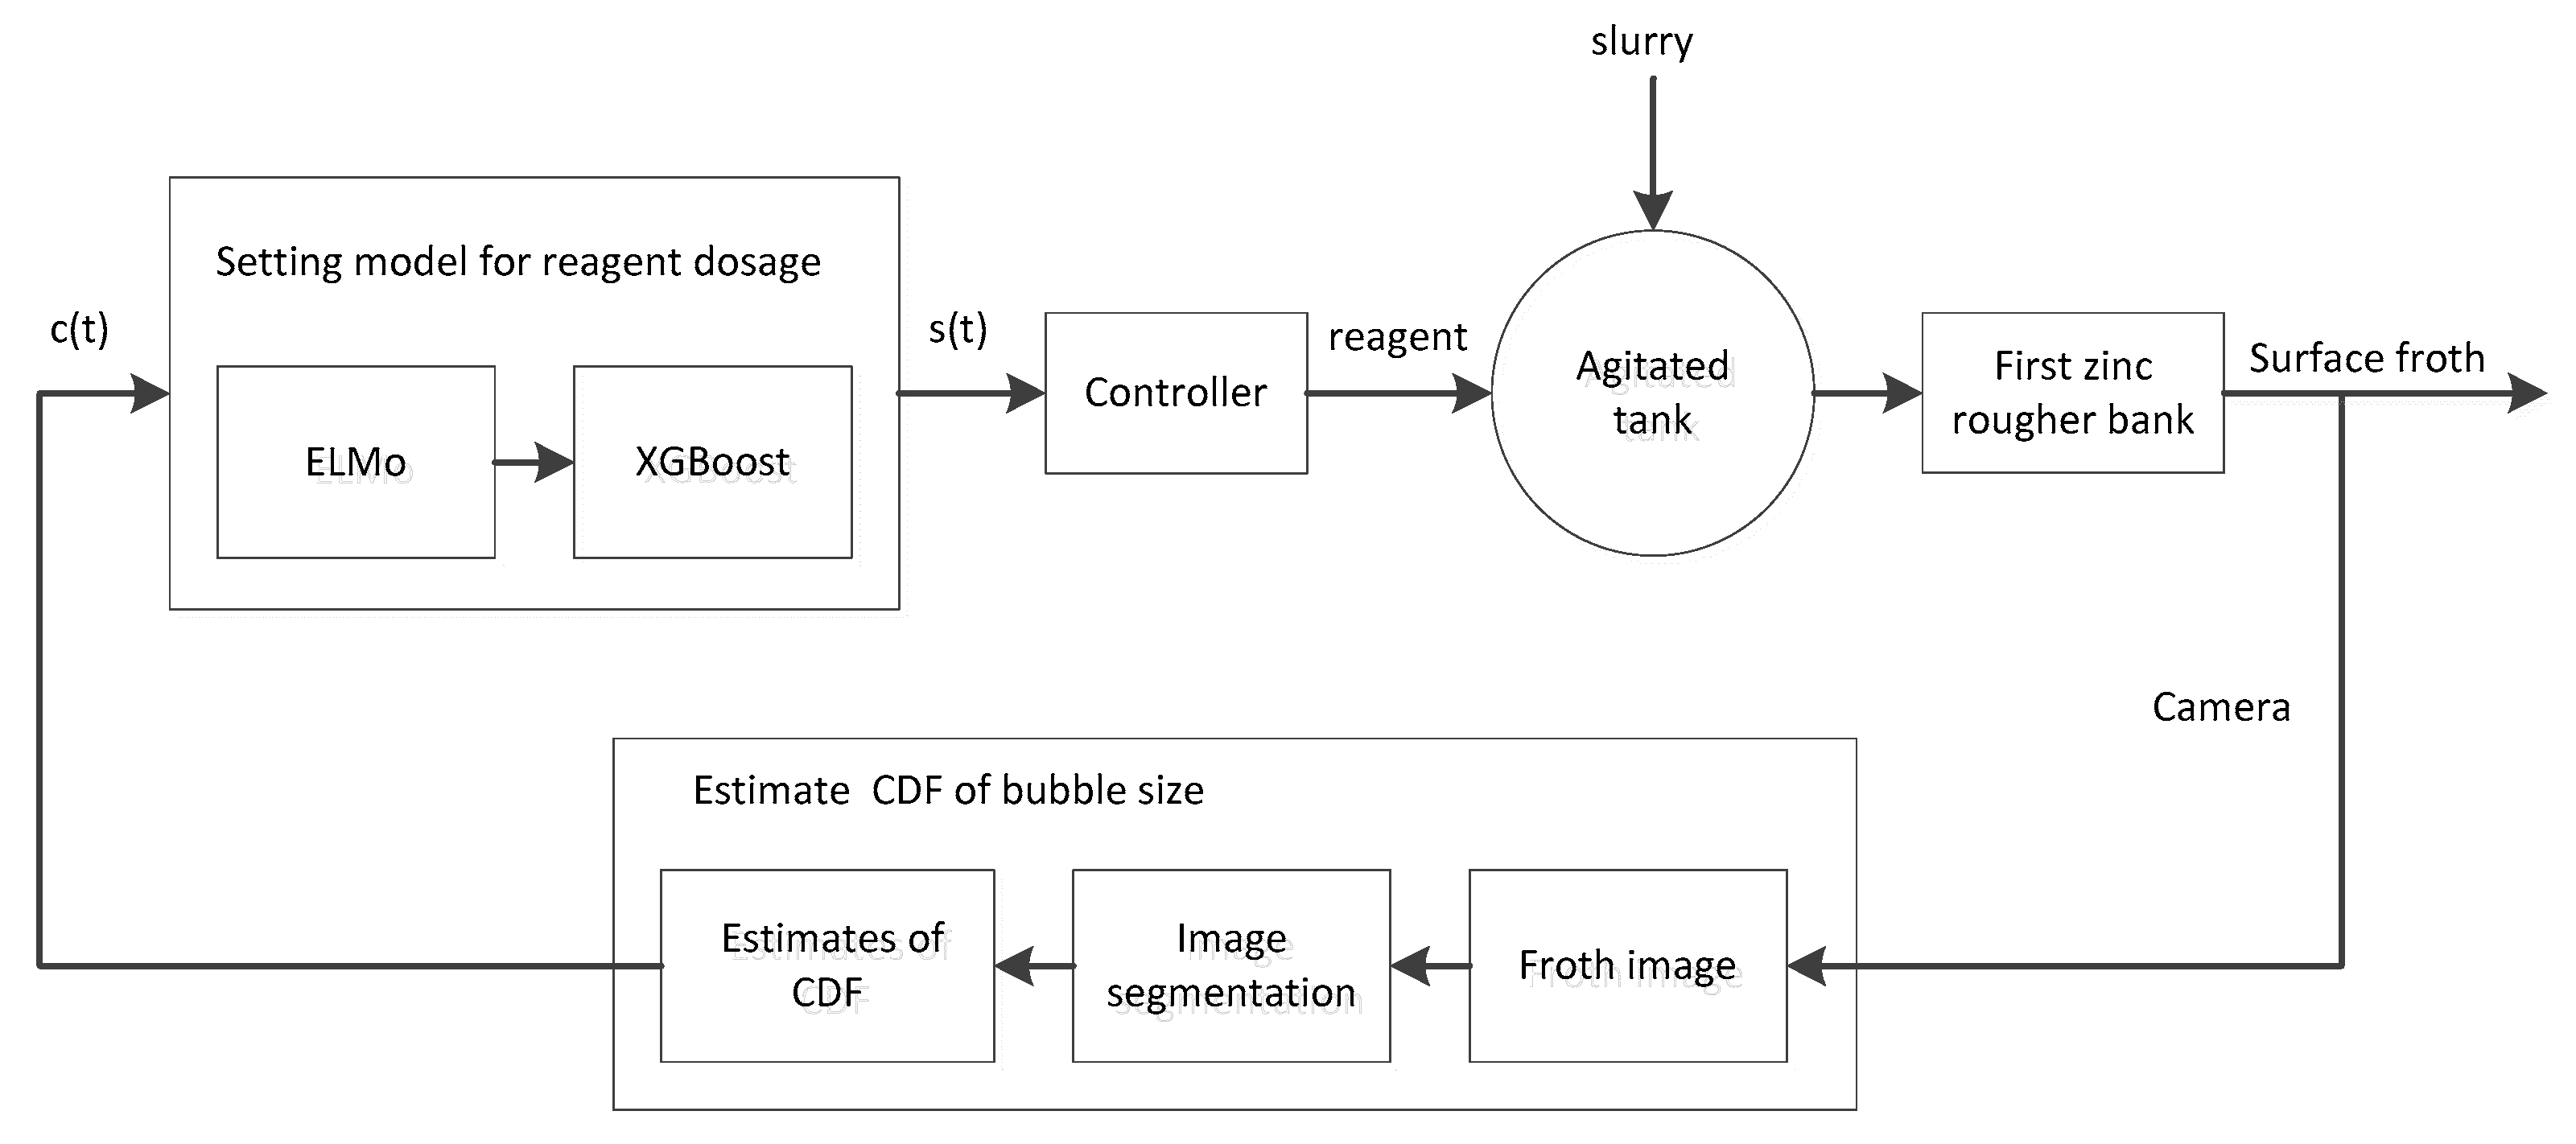
During the zinc flotation process, the bubble size CDF has an important influence on the grade of concentrate and tailing. The bubble size CDF under different working conditions shows different shapes. In this paper, the structure diagram of the intelligent setting of the reagent dosage based on time series froth image is shown in Figure 5.
Froth images of the first zinc rougher were captured by the camera. After the bubble image was segmented, the sigmoid kernel function was used to estimate the bubble size CDF, and the sigmoid kernel function parameters were used to characterize the CDF shape of bubble size. In the reagent dosage setting method, ELMo was used to process the time series features to obtain dynamic feature vectors, and XGBoost was used to establish the nonlinear relationship model between the dynamic feature vectors and the reagent dosage. In this way, the intelligent setting of the reagent dosage was realized.
4.1. Time Series Processing by Elmo
The ELMo model was proposed by Peter for natural language processing in 2018 [26]. Due to its efficient performance, ELMo has always been regarded as one of the excellent word embedding models. ELMo can recognize polysemy after training, that is, different word expresses a different meaning in different sentences. In the zinc flotation process, the current froth image is affected by the previous froth image, the time-series froth image after ELMo processing can express a deeper meaning.
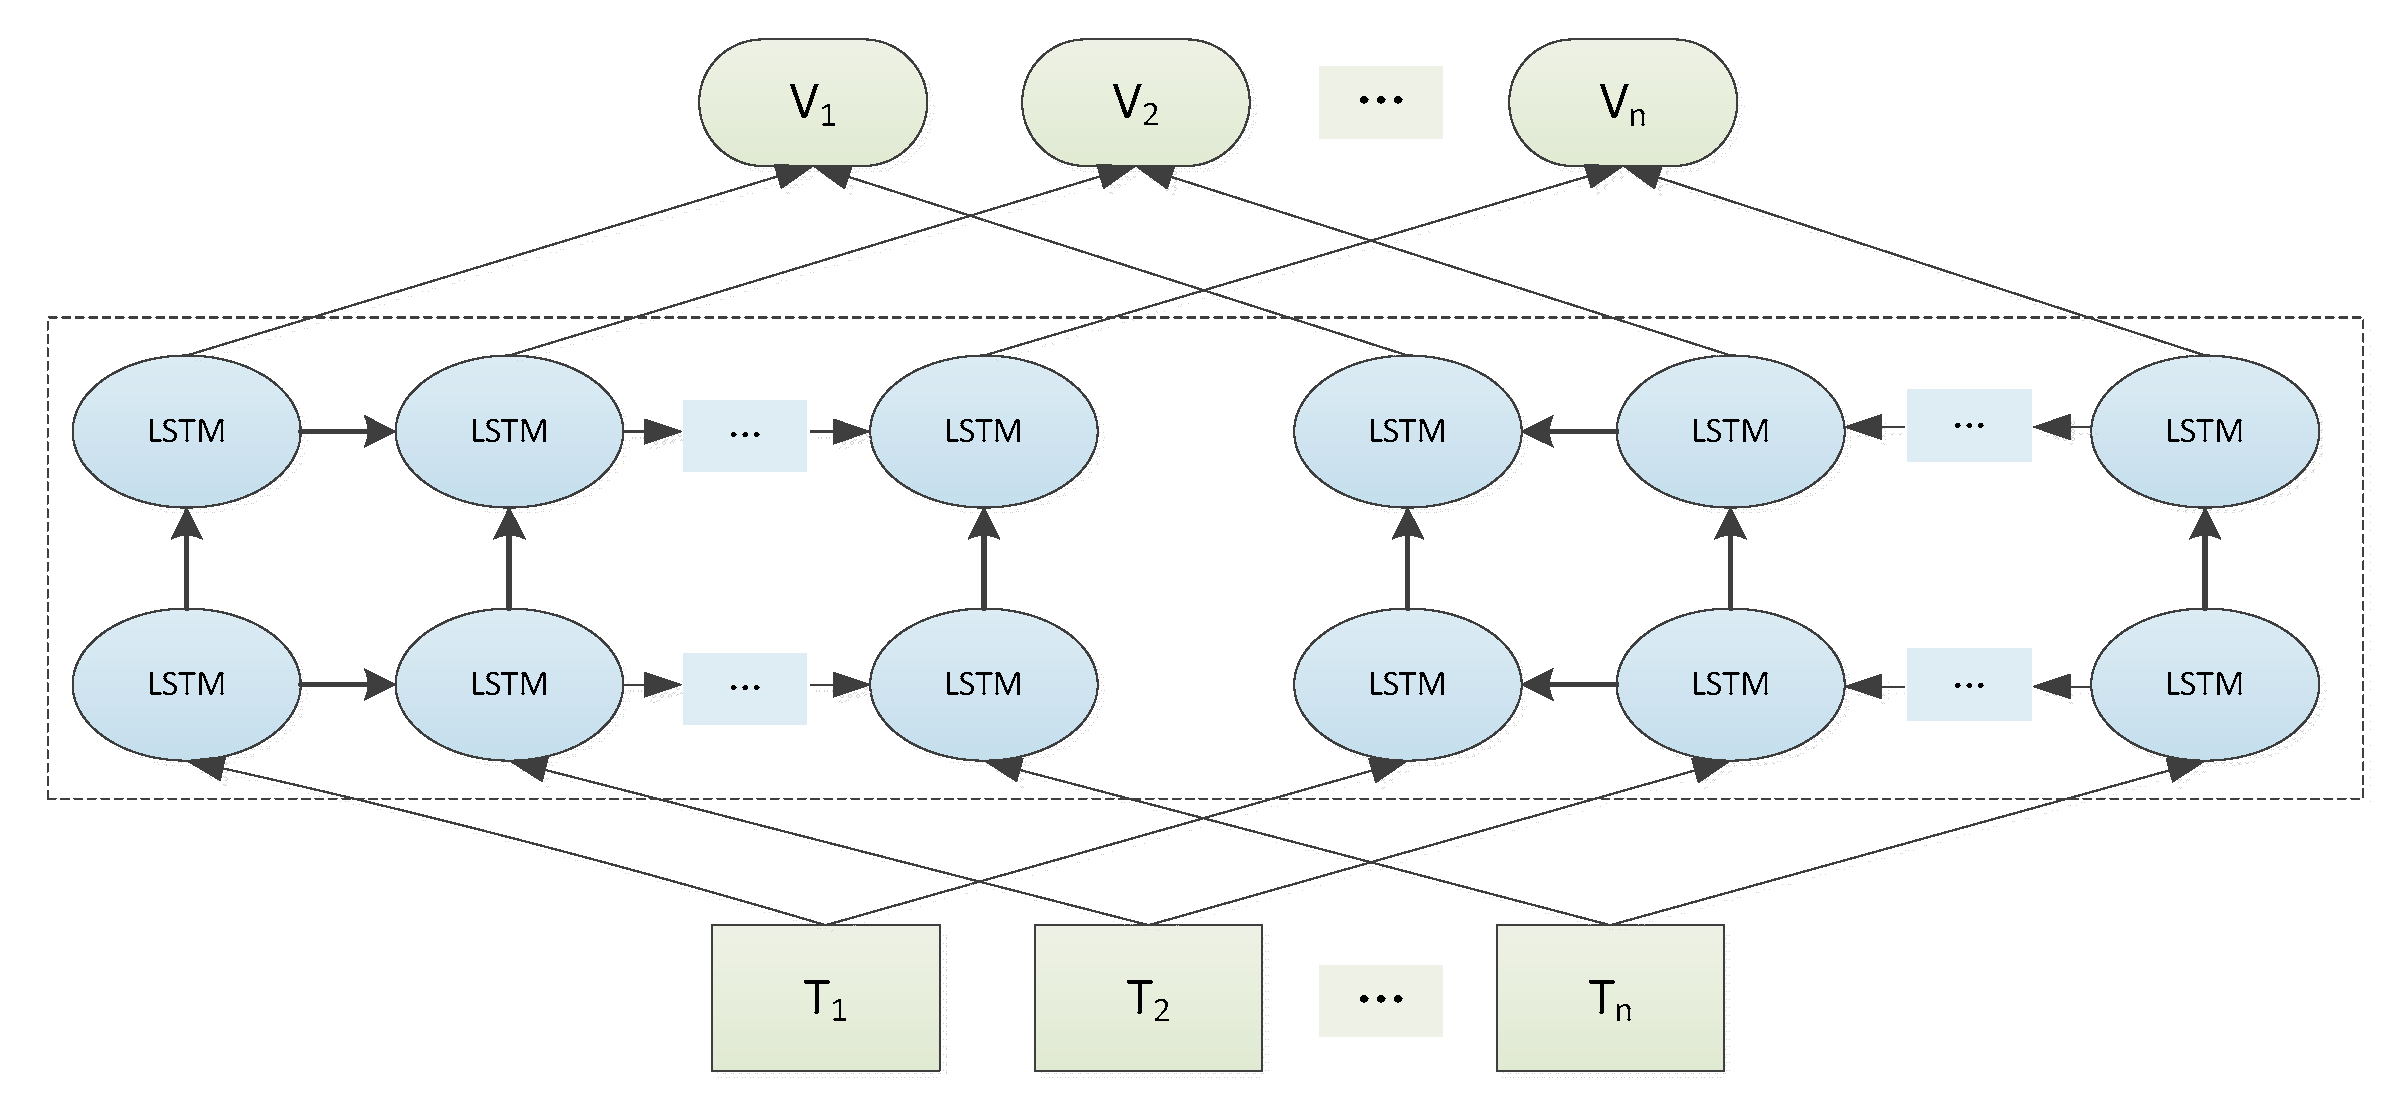
ELMo model training is mainly divided into two steps. The first step is to build a bidirectional language model (biLM) based on LSTM, and adjust the model parameters through large-scale corpus training. The second step is to input the text into the ELMo model, and the weighted combination biLM multilayer output state is output as a dynamic feature vector. Its model structure is shown in Figure 6.
It is assumed that a continuous sequence containing tokens is given. The forward expression and backward expression are used to represent the relationship between the current token and the time series tokens before and after it.
The forward expression is:
The backward expression is:
The forward expression means predicting the current token through the previous tokens, and the backward expression means predicting the current token through the following tokens.
The objective function combines forward expression and backward expression. The meaning of the current token in the time series is determined by maximizing the likelihood probability of the objective function. This expression is shown in Equation (7).
Among them, represents the initial word embedding vector of the input biLM model, represents the output of the LSTM layer input to softmax, represent the forward LSTM layer, represent the backward LSTM layer.
The dynamic feature vector is equal to the weighted combination of the output vectors of each LSTM layer, as shown in Equation (8).
where is the weight of word embeddings in different layers, and it is a scalar parameter. is the vector output from the layer LSTM.
The dynamic feature vector of the froth image features obtained by ELMo can characterize the state of the froth image over a period of time. In this paper, the time series bubble size CDF used to train ELMo. The output of the top LSTM in biLM is selected as the dynamic feature vector of ELMo.
4.2. Nonlinear Relationship Modeling by Xgboost
Chen et al. proposed the XGBoost algorithm in 2016 [27]. XGBoost is an efficient integrated learning method, and a few other integrated learning methods can be better than the configured XGBoost. XGBoost algorithm performs a second-order Taylor expansion of the loss function, and uses the complexity of the tree structure as a regular term, which can effectively avoid overfitting. In addition, XGBoost supports multi-threaded and can make full use of the machine’s CPU core, thereby improving the speed and performance of the algorithm.
When there are samples in a given dataset , each sample contains m-dimensional features. XGBoost is used as a regression model to determine the estimated value through the input feature . XGBoost is trained through dataset , and trees are constructed. The accumulated value of these trees is the output value. Expressed as:
where is the feature space of decision trees. T is the number of leaves in a tree. XGBoost is trained by minimizing the objective function. The objective function is shown in Equation (10).
where represents the penalty term, which can reduce the risk of overfitting. γ represents the regularization parameter, λ means L2 regularization. is a differentiable convex loss function. The second-order Taylor expansion of the loss function in the objective function is shown in Equation (11).
where and are the first and the second order gradient statistic on the loss function.
By training XGBoost, a nonlinear relationship model of bubble size CDF time series and reagent dosage is established. The input is the dynamic feature vector generated by ELMo processing of the bubble size CDF time series, and the output is the reagent dosage.
5. Experiment and Discussion
The purpose of this work is to make a reasonable set value of the reagent dosage by analyzing the time series of the froth image of the first zinc rougher bank.
After the reagent works, the froth image of the first zinc rougher bank will respond first, and the froth of the first zinc rougher bank will affect the concentrate grade and tailing grade. When the dosage of the reagent is set low, the bubble size in the froth image is larger, indicating that there are fewer minerals attached to the surface of the bubble, which ultimately leads to a lower concentrate grade and a higher tailing grade. When the dosage of reagent is set higher, the result is the opposite. Figure 7 shows the different concentrate grades and tailing grades corresponding to different froth images.
In order to verify the intelligent setting method of reagent dosage, we collected 7 consecutive days of industrial data from a zinc flotation plant in China to train the relevant models in the proposed method. During the zinc flotation process, the operator recorded operating variables, including reagent dosage, concentrate grade, and tailing grade. The flotation monitoring system collects the froth image of the first zinc rougher bank in real time. The froth images at the first zinc rougher bank are captured at a rate of 1 frame/5 min; the concentrate grade and tailings grade are obtained using X-ray analysis instruments.
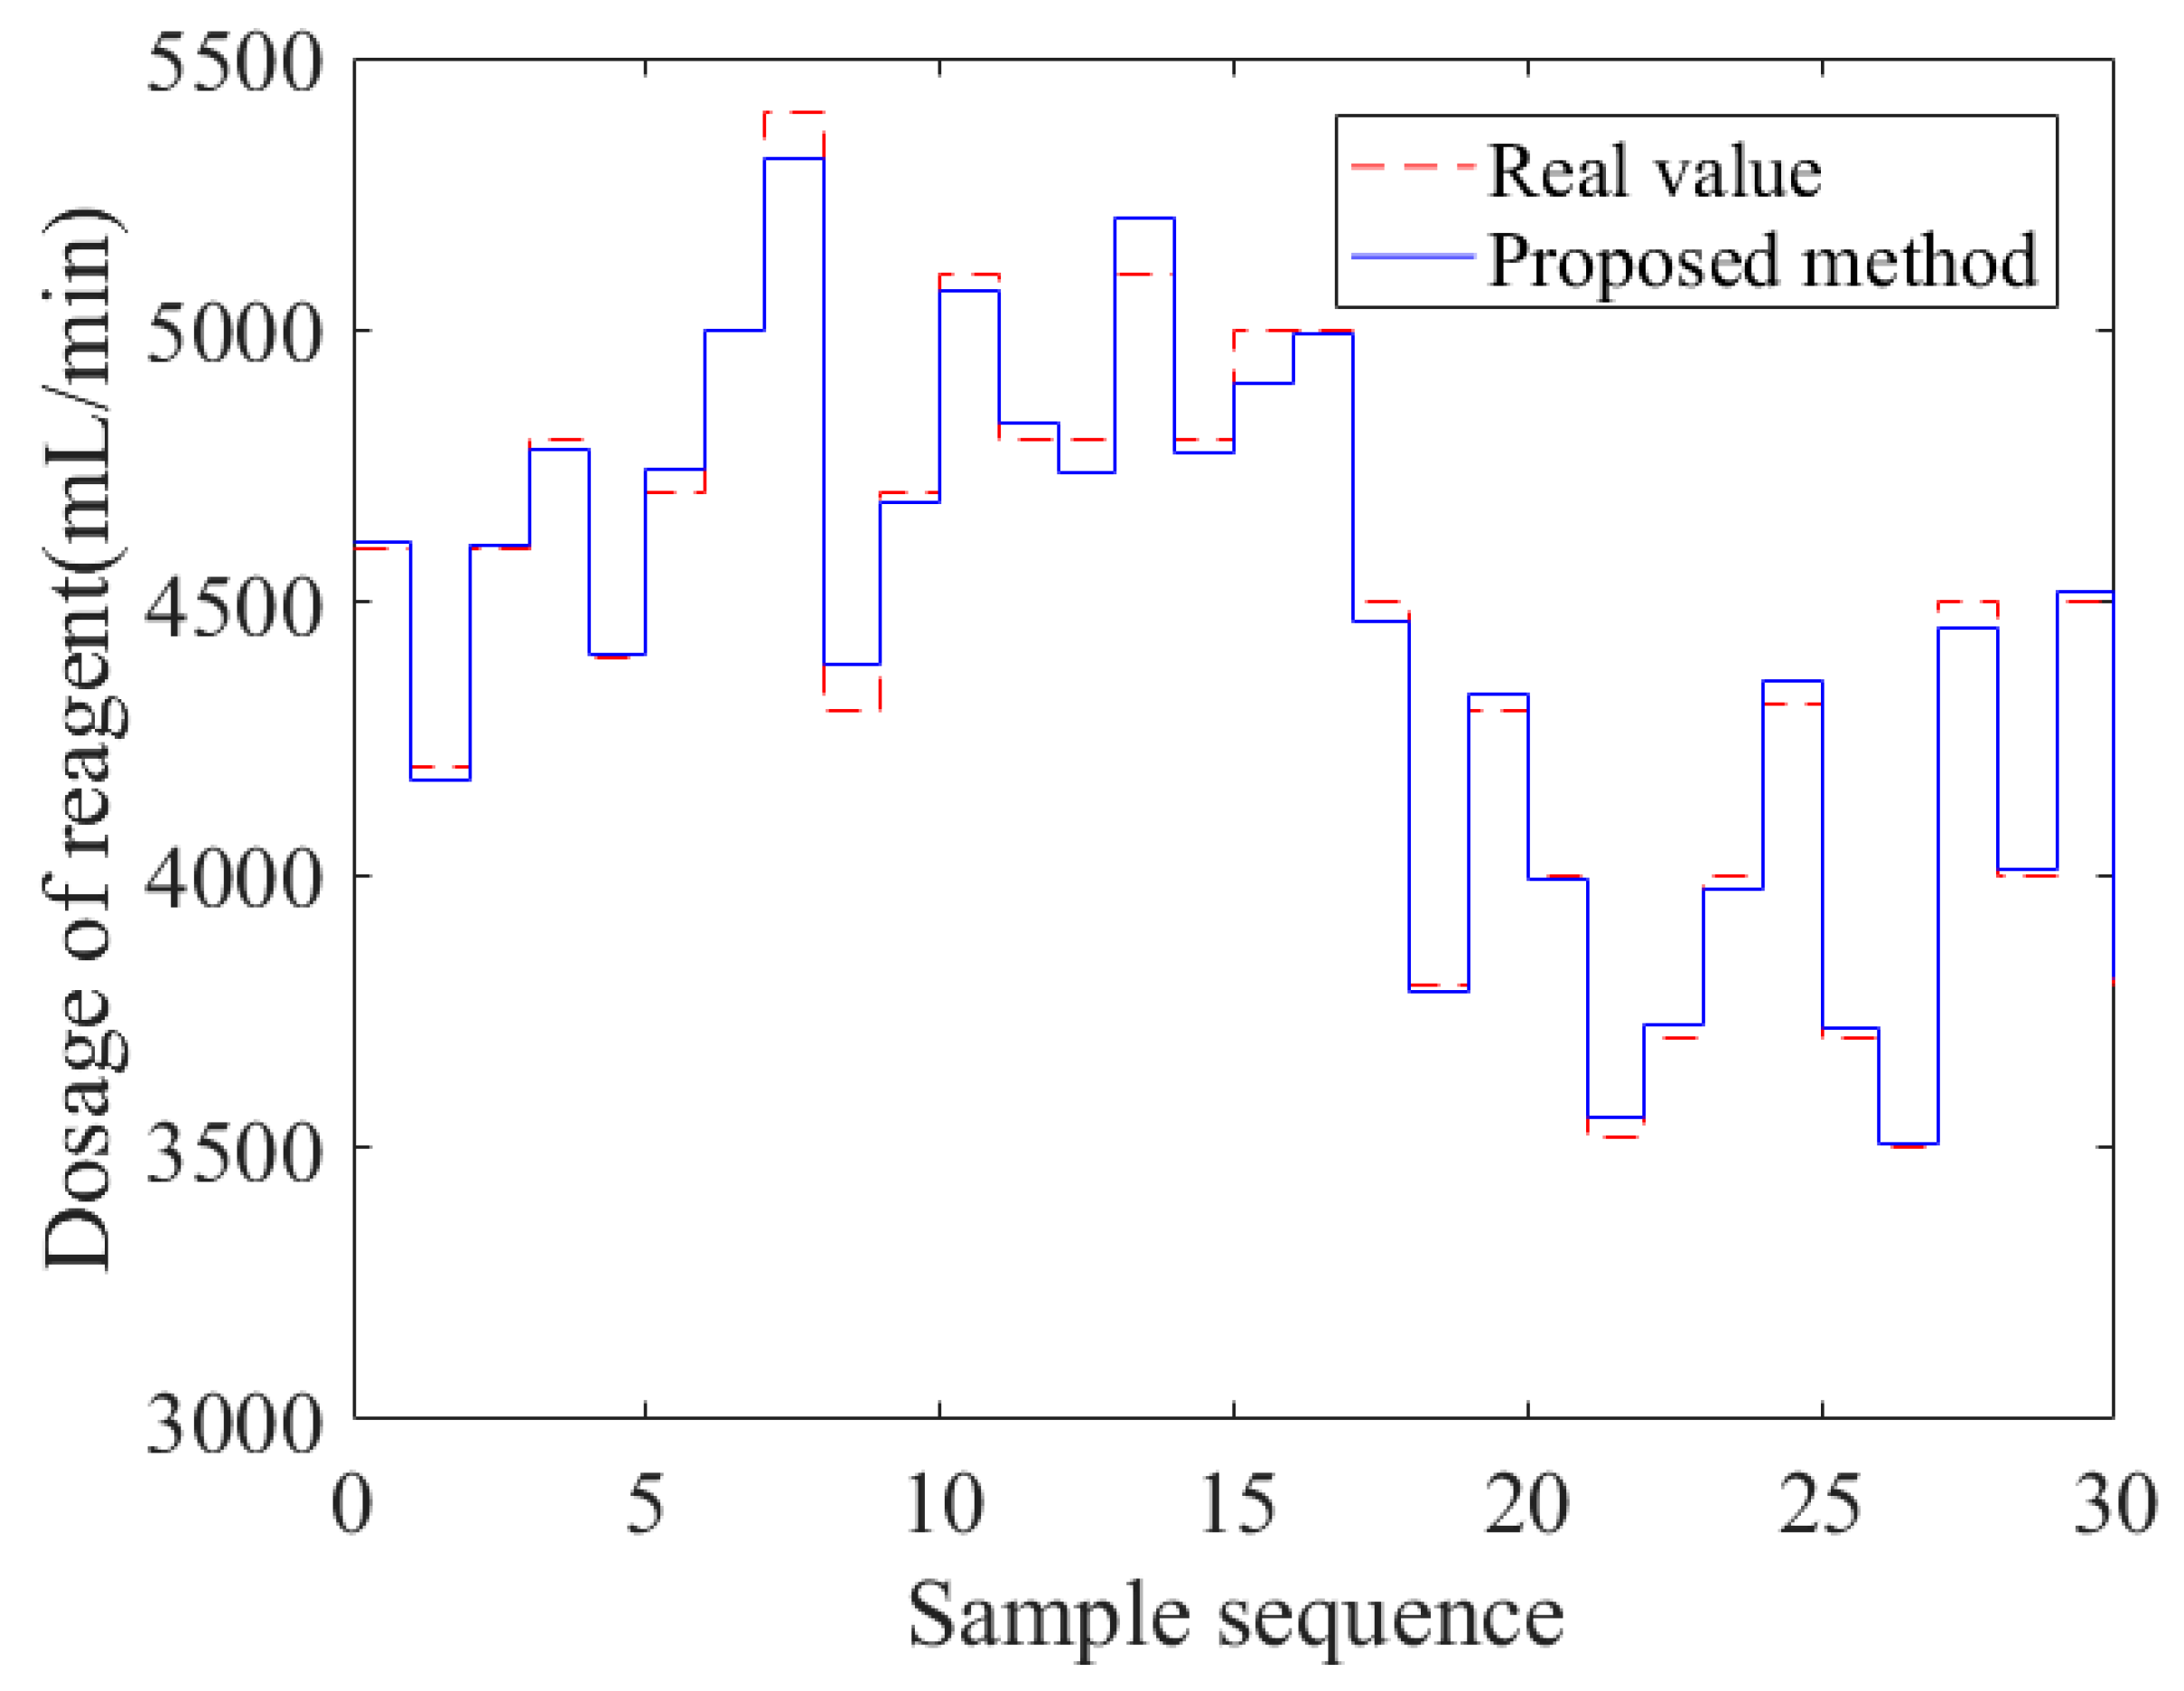
The design of ELMo’s biLM consists of two bidirectional LSTMs. Each LSTM network layer consists of 512 cells, followed by a softmax layer. The initialization XGBoost parameters are as follows: boost tree depth max_depth = 5, learning rate learning_rate = 0.1, number of iterations n_estimators = 160. Figure 8 shows the reagent dosage obtained by simulation using the proposed method, and the real reagent dosage.
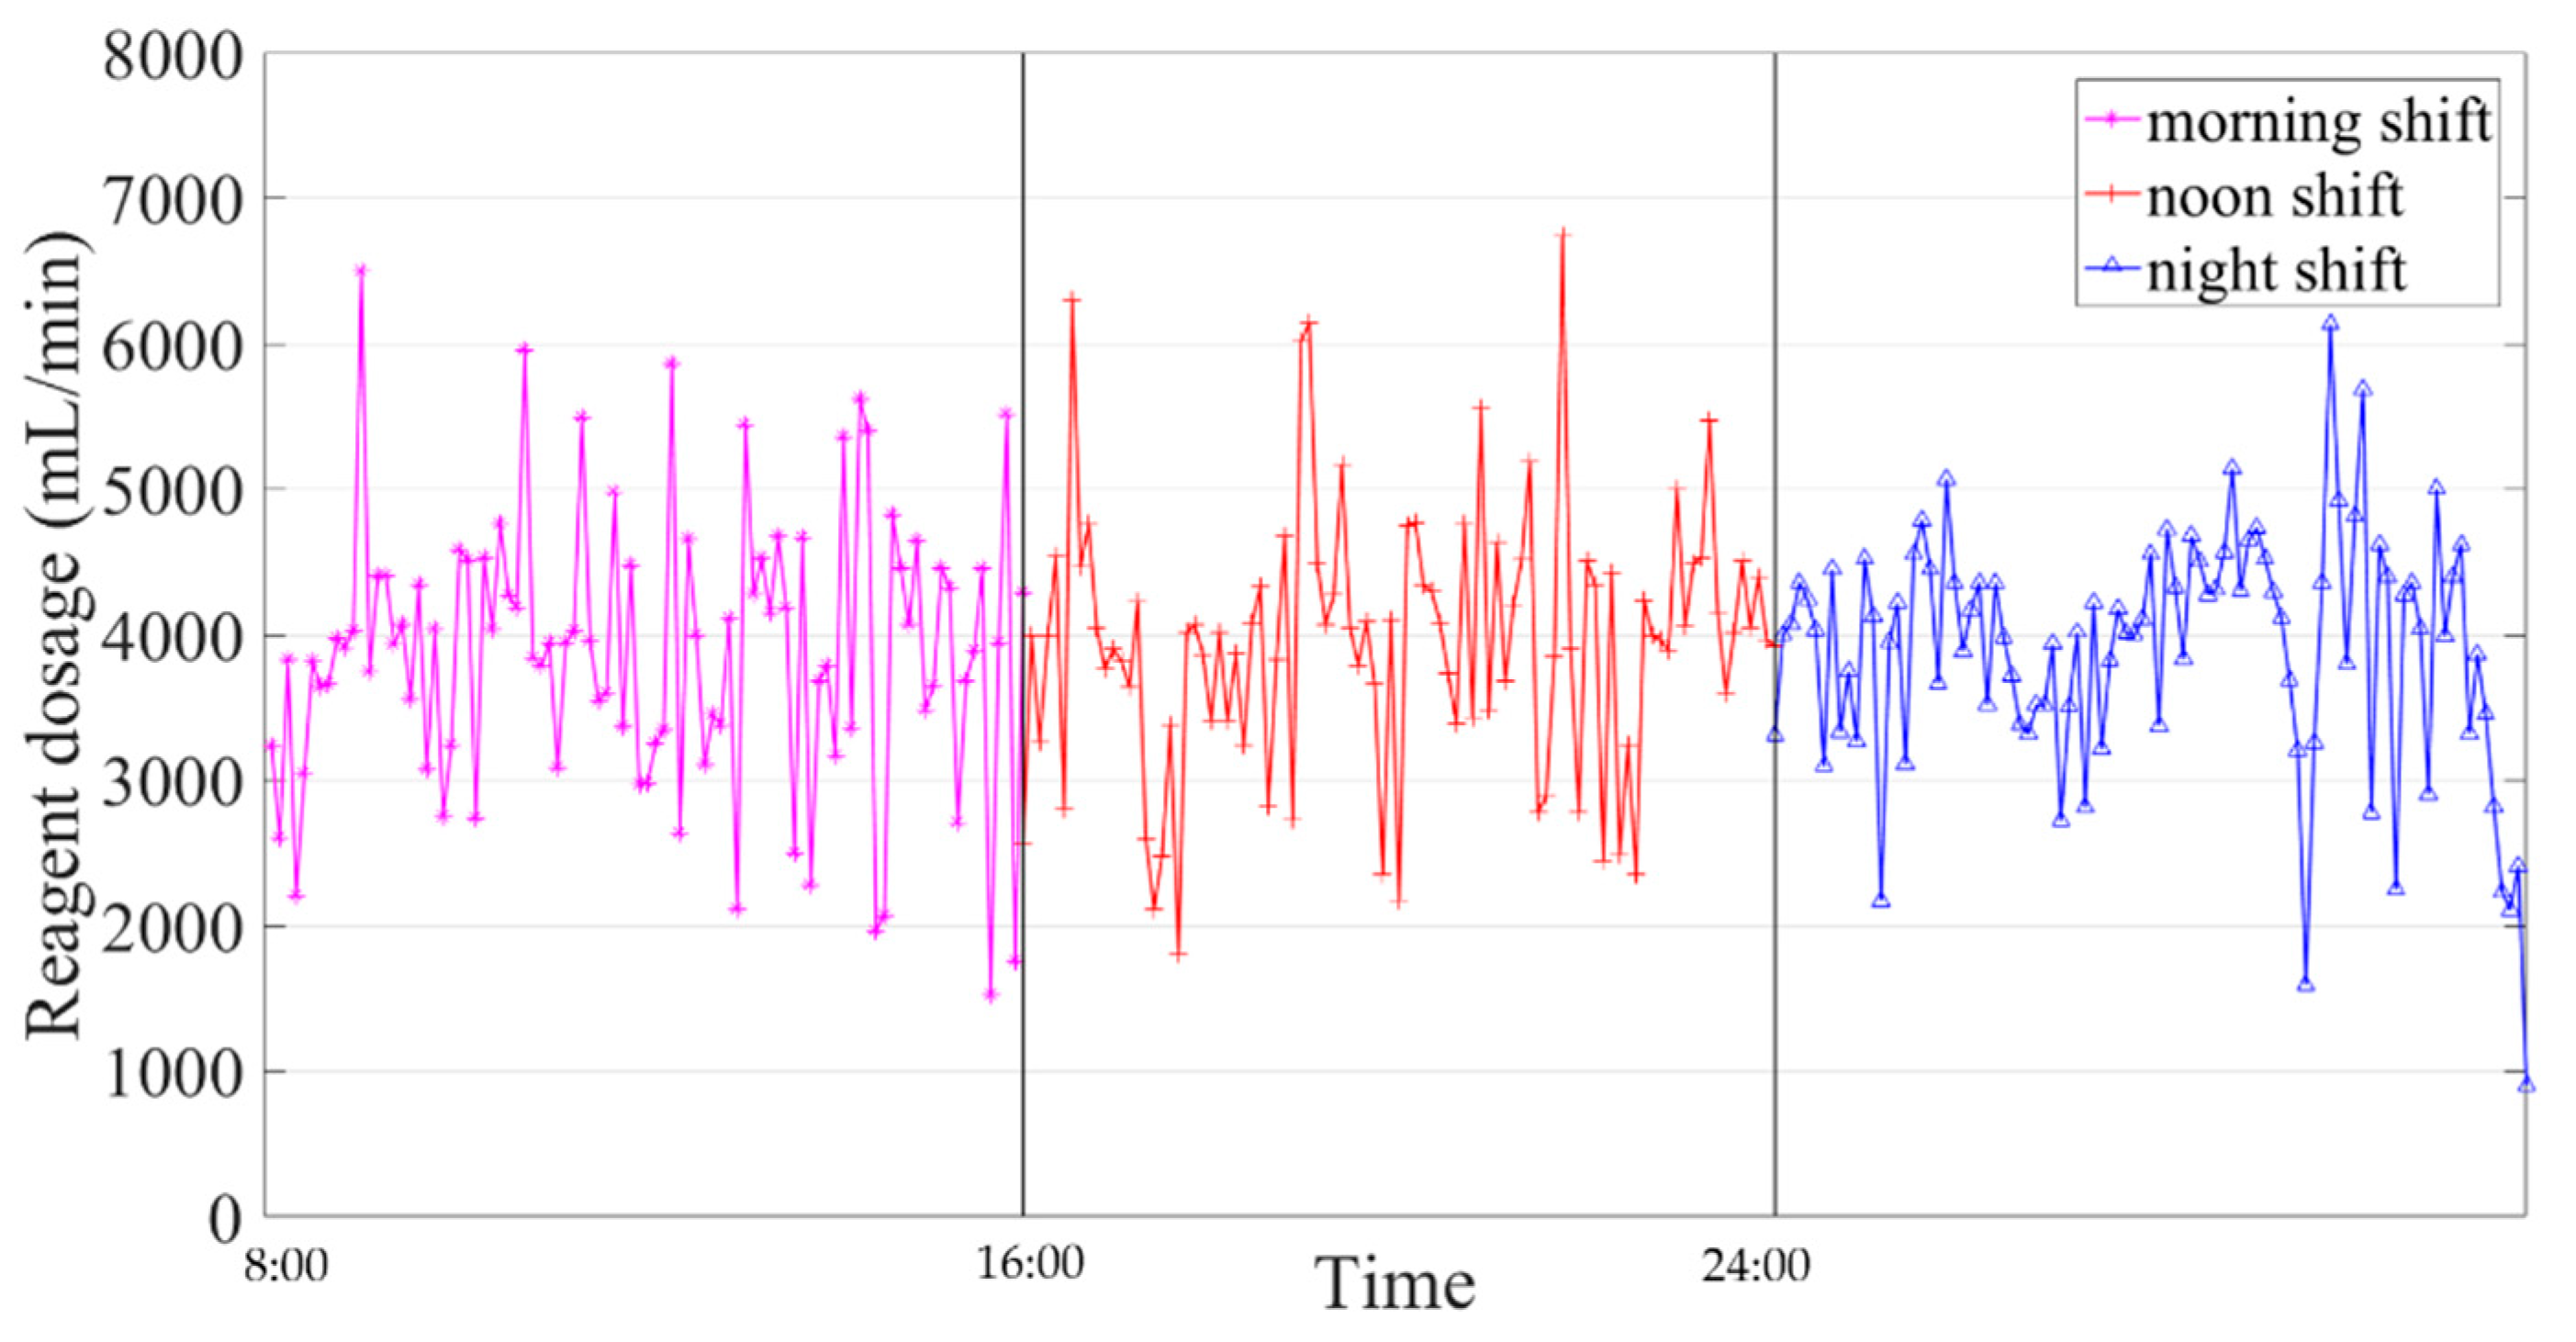
To verify the feasibility of the proposed method, we applied it to a zinc flotation plant in China and recorded data in real time. According to the duty arrangement of the flotation plant, it is divided into three shifts of the morning shift, noon shift and night shift, each shift is 8 h. During each shift we recorded the relevant data and statistics. Figure 9 shows the set value of the reagent dosage for three shifts.
According to further statistics, the total consumption of reagents on that day was 5620.32 L.
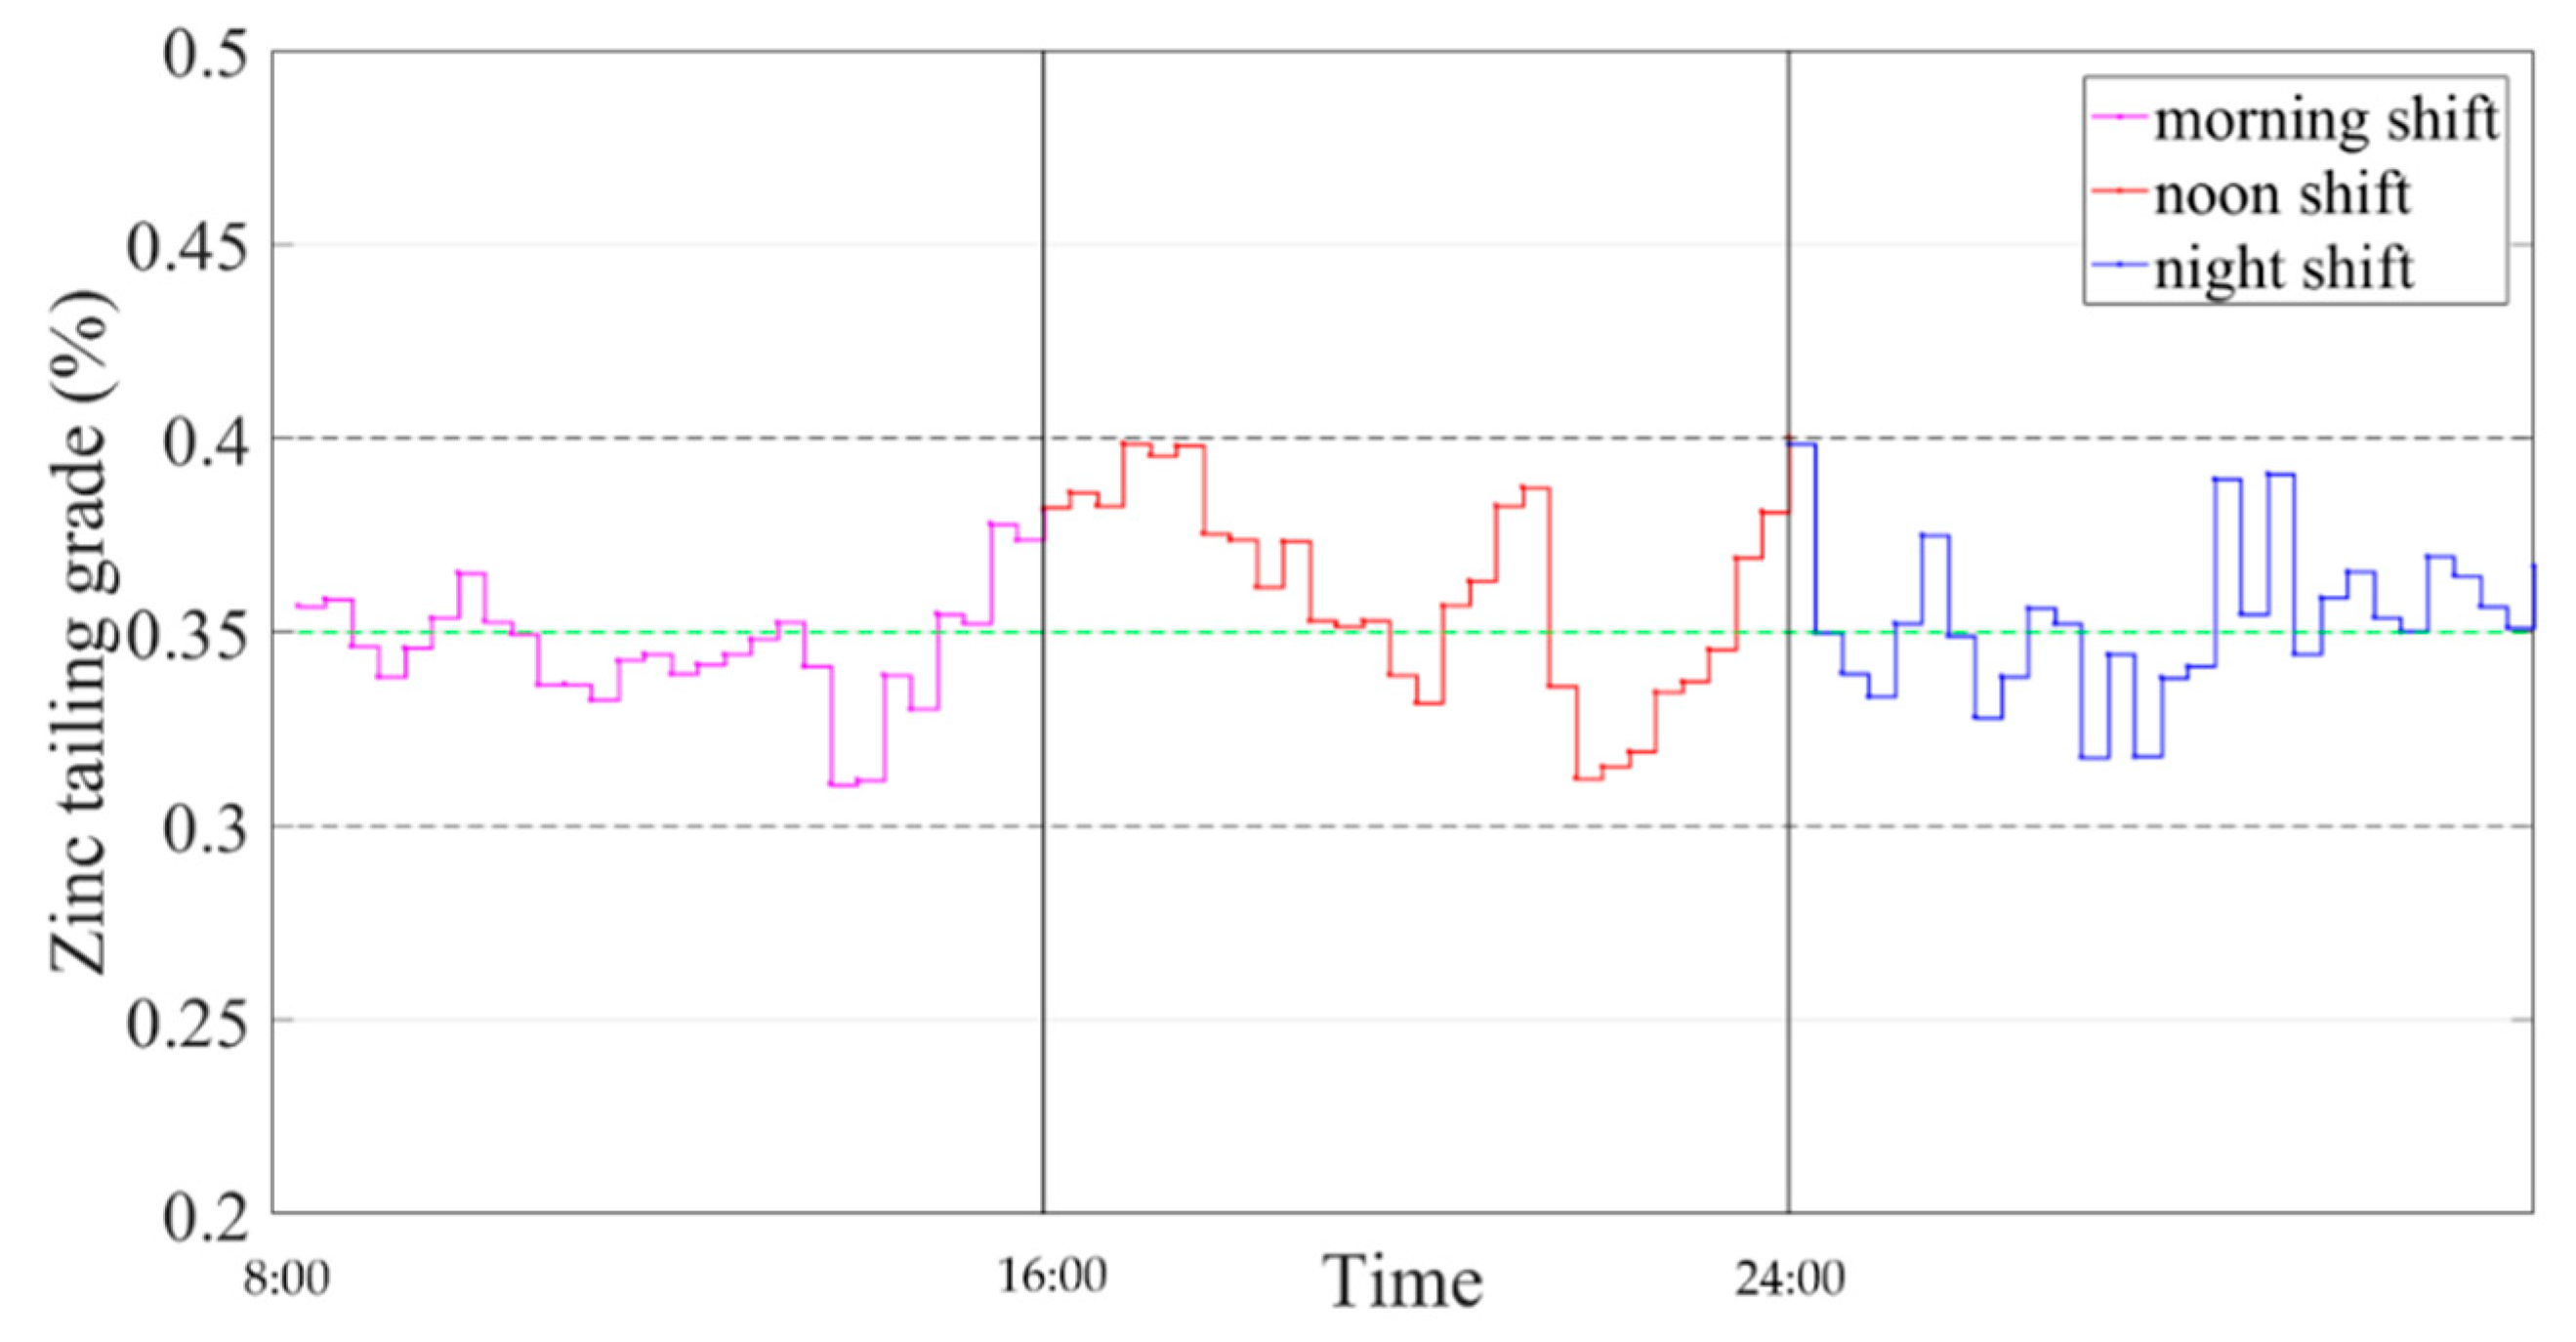
Figure 10 and Figure 11 show the test results of concentrate grade and tailing grade for three shifts.
According to the requirements of China’s zinc flotation plant, it is necessary to stabilize the concentrate grade at about 54% and the tailings grade at about 0.35%. The results show that the proposed method can meet the production requirement.
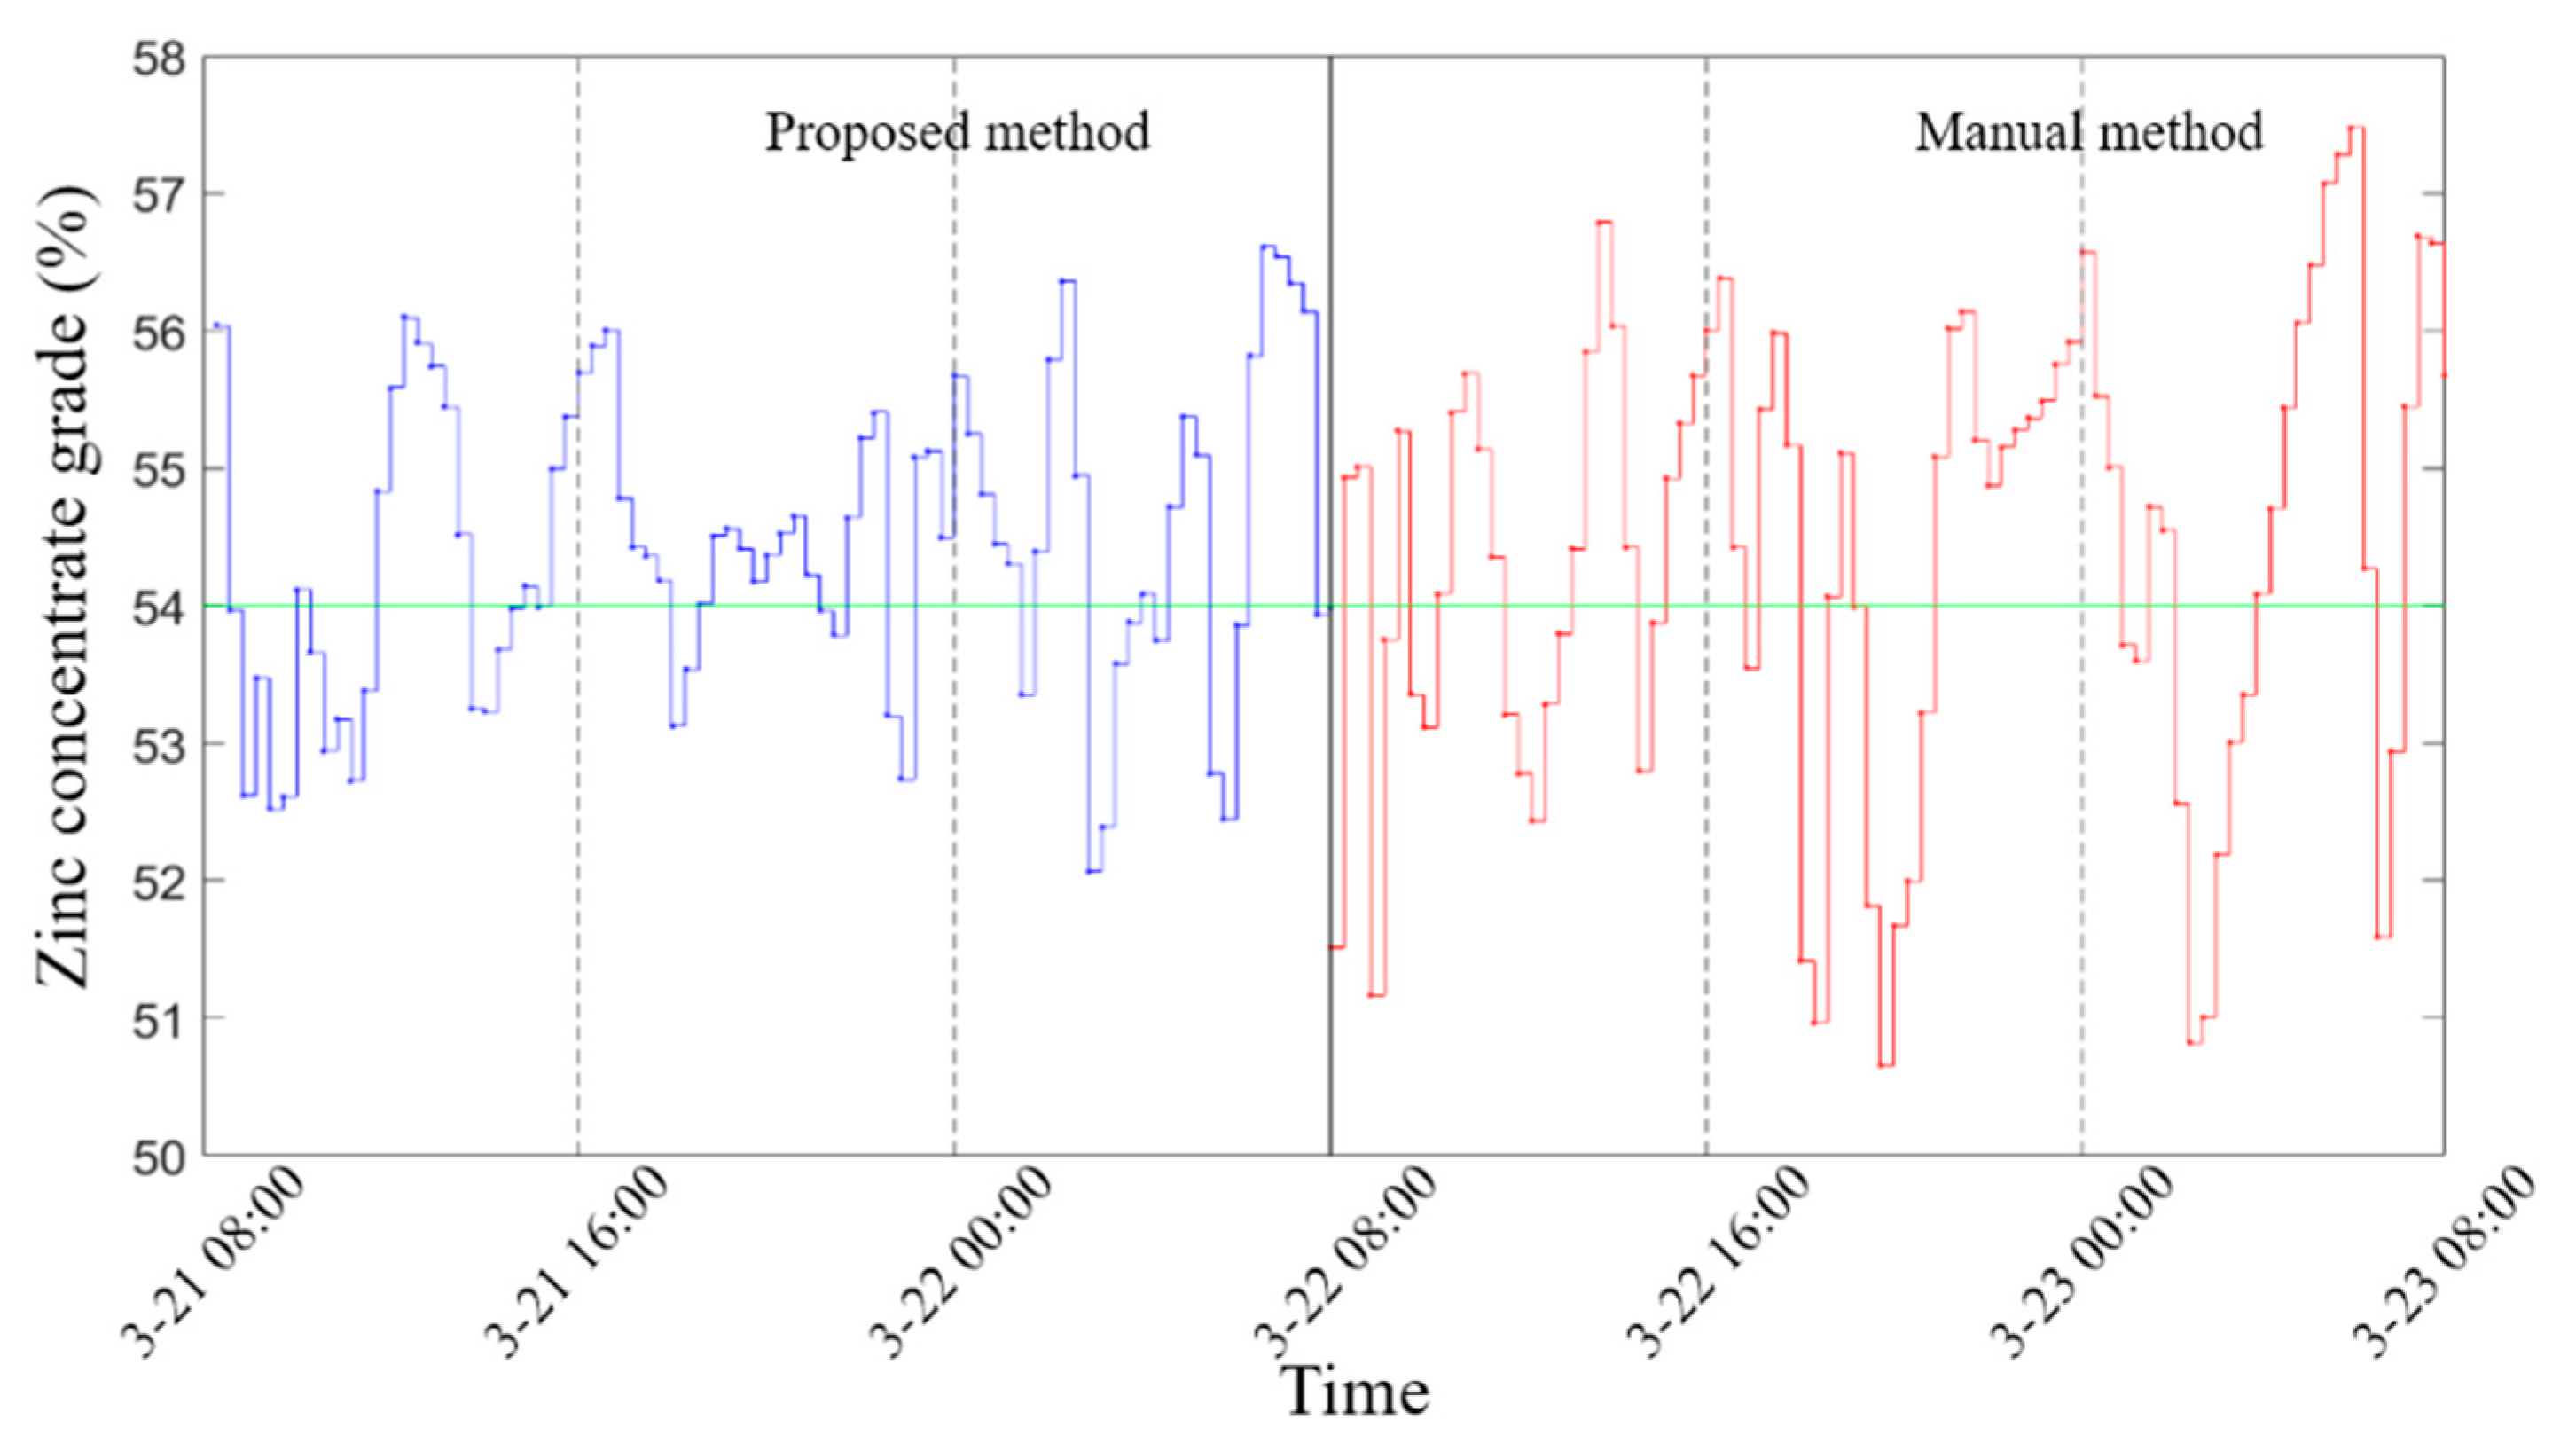
The traditional dosage of reagents in the flotation process is determined by manual experience. It is worth noting that manual experience is different due to individual differences. Because the flotation plant is divided into three shifts in the morning, middle and evening, different people work. Figure 12 and Figure 13 show the changes of concentrate grade and tailings grade from 21 to 23 March 2020 using the proposed method and manual method.
Table 1 summarizes the performance index evaluation parameters of the proposed method and manual method, where represents the average and represents the variance.
The method proposed in this paper does not require manual participation, which reduces the employment cost of the plant. In addition, the experimental results show that the proposed method has a better control effect on the concentrate grade and tailings grade than the manual method.
6. Conclusions
In this work, a method for intelligently setting the reagent dosage based on the time series froth image in the zinc flotation process is proposed. In this paper, the bubble size CDF is used as a new feature of the froth image, and the estimation method of bubble size CDF is proposed. Because the change of reagent dosage will cause the froth image features to change continuously with time, this paper uses the ELMo model to process the bubble size CDF time series, and generates dynamic feature vectors based on the bubble size CDF time series. Compared with the single frame froth image feature at a single moment, the dynamic feature vector can reduce the influence of noise in the flotation process. Finally, the efficient XGBoost algorithm was used to establish the nonlinear relationship model between the dynamic feature vectors and the dosage of reagent in the flotation process. The industrial experiment results show that the proposed method can stabilize the concentrate grade and tailing grade more than the traditional manual method in the zinc flotation process. In addition, the proposed method does not require manual participation, avoids inconsistent product quality due to differences in manual experience, and improves the economic benefits of the flotation plant.
Author Contributions
Z.T. performed data curation and provided the funding; L.T. conceived the methodology and wrote the original draft; G.Z. performed the review; Y.X. performed the formal analysis; J.L. provided research materials. All authors have read and agreed to the published version of the manuscript.
Funding
This research was funded by NSFC—Guangdong joint fund of key projects (No. U1701261), National Natural Science Foundation of China (No. 61771492).
Acknowledgments
The authors would like to acknowledge the research support from the NSFC—Guangdong joint fund of key projects (No. U1701261) and National Natural Science Foundation of China (No. 61771492).
Conflicts of Interest
The authors declare that the article will be reported without any conflict of interest.
References
- Shean, B.J.; Cilliers, J.J. A review of froth flotation control. Int. J. Miner. Process. 2011, 100, 57–71. [Google Scholar]
- Jovanovic, I.; Miljanovic, I.; Jovanovic, T. Soft computing-based modeling of flotation processes—A review. Miner. Eng. 2015, 84, 34–63. [Google Scholar]
- Gao, Z.; Saxen, H.; Gao, C. Guest Editorial: Special section on data-driven approaches for complex industrial systems. IEEE Trans. Ind. Inform. 2013, 9, 2210–2212. [Google Scholar] [CrossRef]
- Popli, K.; Afacan, A.; Liu, Q.; Prasad, V. Real-time monitoring of entrainment using fundamental models and froth images. Miner. Eng. 2018, 124. [Google Scholar] [CrossRef]
- Gao, Z.; Nguang, S.K.; Kong, D. Advances in Modelling, Monitoring, and Control for Complex Industrial Systems. Complexity 2019. [Google Scholar] [CrossRef]
- Hu, B.; Yang, J.; Li, J. Intelligent Control Strategy for Transient Response of a Variable Geometry Turbocharger System Based on Deep Reinforcement Learning. Processes 2019, 7, 601. [Google Scholar] [CrossRef] [Green Version]
- Liu, W.; Luo, F.; Liu, Y.; Ding, W. Optimal Siting and Sizing of Distributed Generation Based on Improved Nondominated Sorting Genetic Algorithm II. Processes 2019, 7, 955. [Google Scholar] [CrossRef] [Green Version]
- Li, Z.M.; Gui, W.H. The Method of Reagent Control Based on Time Series Distribution of Bubble Size in a Gold-Antimony Flotation Process. Asian J. Control 2018, 20, 2223–2236. [Google Scholar]
- Jiang, Y.; Fan, J.L.; Chai, T.Y.; Li, J.; Lewis, F.L. Data-Driven Flotation Industrial Process Operational Optimal Control Based on Reinforcement Learning. IEEE Trans. Ind. Inform. 2018, 14, 1974–1989. [Google Scholar] [CrossRef]
- Zou, Y.L.; Yang, C.H.; Wang, X.L.; Zhao, L.; Xie, Y. Reagent Feed Intelligent Setting Based on Belief Rule Base for Antimony Roughing Flotation. In Proceedings of the 28th Chinese Control and Decision Conference, Yinchuan, China, 28–30 May 2016; pp. 848–853. [Google Scholar]
- Xie, Y.F.; Wu, J.; Xu, D.G.; Yang, C.; Gui, W. Reagent Addition Control for Stibium Rougher Flotation Based on Sensitive Froth Image Features. IEEE Trans. Ind. Electron. 2017, 64, 4199–4206. [Google Scholar] [CrossRef]
- Cao, B.F.; Xie, Y.F.; Gui, W.H.; Yang, C.; Li, J. Coordinated optimization setting of reagent dosages in roughing-scavenging process of antimony flotation. J. Cent. South Univ. 2018, 25, 95–106. [Google Scholar] [CrossRef]
- Li, H.; Chai, T.; Zhang, L. Hybrid Intelligent Optimal Control for flotation processes. In Proceedings of the 2012 American Control Conference, Montreal, QC, Canada, 27–29 June 2012; pp. 4891–4896. [Google Scholar]
- Aldrich, C.; Marais, C.; Shean, B.J.; Cilliers, J.J. Online monitoring and control of froth flotation systems with machine vision: A review. Int. J. Miner. Process. 2010, 96, 1–13. [Google Scholar] [CrossRef]
- Liu, J.; He, J.; Xie, Y.; Gui, W.; Tang, Z.; Ma, T.; He, J.; Niyoyita, J.P. Illumination-Invariant Flotation Froth Color Measuring via Wasserstein Distance-Based CycleGAN With Structure-Preserving Constraint. IEEE Trans. Cybern. 2020, 99, 1–14. [Google Scholar] [CrossRef] [PubMed]
- Liu, J.; Zhou, J.; Tang, Z.; Gui, W.; Xie, Y.; He, J.; Ma, T.; Niyoyita, J.P. Toward Flotation Process Operation-State Identification via Statistical Modeling of Biologically Inspired Gabor Filtering Responses. IEEE Trans. Cybern. 2019, 99, 1–14. [Google Scholar] [CrossRef] [PubMed]
- Bournival, G.; Ata, S.; Jameson, G.J. Bubble and Froth Stabilizing Agents in Froth Flotation. Miner. Process. Extr. Met. Rev. 2017, 38, 366–387. [Google Scholar] [CrossRef]
- Hosseini, M.R.; Shirazi, H.H.A.; Massinaei, M.; Mehrshad, N. Modeling the Relationship between Froth Bubble Size and Flotation Performance Using Image Analysis and Neural Networks. Chem. Eng. Commun. 2015, 202, 911–919. [Google Scholar] [CrossRef]
- Riquelme, A.; Desbiens, A.; Del Villar, R.; Maldonado, M. Predictive control of the bubble size distribution in a two-phase pilot flotation column. Miner. Eng. 2016, 89, 71–76. [Google Scholar] [CrossRef]
- Xie, Y.F.; Cao, B.F.; He, Y.P.; Gui, W.; Yang, C. Reagent dosages control based on bubble size characteristics for flotation process. IET Control Theory Appl. 2016, 10, 1404–1411. [Google Scholar] [CrossRef]
- Jinping, L.; Jiezhou, H.; Wuxia, Z.; Xu, P.; Tang, X. TCvBsISM: Texture Classification via B-splines-based Image Statistical Modeling. IEEE Access 2018, 6, 44876–44893. [Google Scholar]
- Zhu, J.Y.; Gui, W.H.; Yang, C.H.; Liu, J.; Tang, Y. Probability Density Function of Bubble Size Based Reagent Dosage Control for Flotation Process. Asian J. Control 2014, 16, 765–777. [Google Scholar] [CrossRef]
- Zhaohui, T.; Heng, L.; Jinping, L.; Gui, W. Component based software design and development of froth flotation visual monitoring system. In Proceedings of the 2013 25th Chinese Control and Decision Conference (CCDC), Guiyang, China, 25–27 May 2013. [Google Scholar]
- Jahedsaravani, A.; Massinaei, M.; Marhaban, M.H. An image segmentation algorithm for measurement of flotation froth bubble size distributions. Measurement 2017, 111, 29–37. [Google Scholar] [CrossRef]
- Tripathi, Y.M.; Kayal, T.; Dey, S. Estimation of the PDF and the CDF of exponentiated moment exponential distribution. Int. J. Syst. Assur. Eng. Manag. 2017, 8, 1282–1296. [Google Scholar] [CrossRef]
- Peters, M.; Neumann, M.; Iyyer, M.; Gardner, M.; Clark, C.; Lee, K.; Zettlemoyer, L. Deep Contextualized Word Representations. In Proceedings of the 2018 Conference of the North American Chapter of the Association for Computational Linguistics: Human Language Technologie, New Orleans, LA, USA, 1–6 June 2018. [Google Scholar]
- Chen, T.; Guestrin, C.; Assoc Comp, M. XGBoost: A Scalable Tree Boosting System. In Proceedings of the 22nd ACM SIGKDD International Conference on Knowledge Discovery and Data Mining, San Francisco, CA, USA, 13–17 August 2016. [Google Scholar]
Figure 1.
Flow diagram of the zinc flotation process.

Figure 2.
The typical froth images in zinc flotation process.

Figure 3.
Bubble size cumulative distribution function (CDF) of different class froth image.

Figure 4.
The estimation of bubble size CDF for different froth images: (a) class 1, (b) class 2, (c) class 3.
Figure 4.
The estimation of bubble size CDF for different froth images: (a) class 1, (b) class 2, (c) class 3.

Figure 5.
The structure diagram of the reagent dosage intelligent setting based on time series froth image.
Figure 5.
The structure diagram of the reagent dosage intelligent setting based on time series froth image.

Figure 6.
The framework of ELMo.

Figure 7.
Typical froth image corresponds to concentrate grade and tailing grade.

Figure 8.
The proposed method is used to simulate the set value and real value of the reagent dosage.
Figure 8.
The proposed method is used to simulate the set value and real value of the reagent dosage.

Figure 9.
Using the proposed method for the dosage of reagent during the experiment.

Figure 10.
Using the proposed method for the concentrate grade during the experiment.

Figure 11.
Using the proposed method for the tailing grade during the experiment.

Figure 12.
Comparison of change in concentrate grade by proposed method and manual method.

Figure 13.
Comparison of change in concentrate grade by proposed method and manual method.


Table 1.
Performance index evaluation parameters of the proposed method and manual method.
| Proposed Method | Manual Method | |||
|---|---|---|---|---|
| Concentrate grade | 54.37 | 54.39 | ||
| Tailing grade | 0.36 | 0.37 | ||
© 2020 by the authors. Licensee MDPI, Basel, Switzerland. This article is an open access article distributed under the terms and conditions of the Creative Commons Attribution (CC BY) license (http://creativecommons.org/licenses/by/4.0/).
Share and Cite
MDPI and ACS Style
Tang, Z.; Tang, L.; Zhang, G.; Xie, Y.; Liu, J. Intelligent Setting Method of Reagent Dosage Based on Time Series Froth Image in Zinc Flotation Process. Processes 2020, 8, 536. https://0-doi-org.brum.beds.ac.uk/10.3390/pr8050536
AMA Style
Tang Z, Tang L, Zhang G, Xie Y, Liu J. Intelligent Setting Method of Reagent Dosage Based on Time Series Froth Image in Zinc Flotation Process. Processes. 2020; 8(5):536. https://0-doi-org.brum.beds.ac.uk/10.3390/pr8050536
Chicago/Turabian StyleTang, Zhaohui, Liyong Tang, Guoyong Zhang, Yongfang Xie, and Jinping Liu. 2020. "Intelligent Setting Method of Reagent Dosage Based on Time Series Froth Image in Zinc Flotation Process" Processes 8, no. 5: 536. https://0-doi-org.brum.beds.ac.uk/10.3390/pr8050536
Note that from the first issue of 2016, this journal uses article numbers instead of page numbers. See further details here.