Compartment Model of Mixing in a Bubble Trap and Its Impact on Chromatographic Separations


1
Department of Biotechnology, University of Natural Resources and Life Sciences Vienna, Muthgasse 18, 1190 Vienna, Austria
2
Forschungszentrum Jülich, IBG-1: Biotechnology, 52428 Jülich, Germany
*
Author to whom correspondence should be addressed.
Processes 2020, 8(7), 780; https://0-doi-org.brum.beds.ac.uk/10.3390/pr8070780
Submission received: 8 June 2020
/
Revised: 28 June 2020
/
Accepted: 1 July 2020
/
Published: 3 July 2020
(This article belongs to the Special Issue Redesign Processes in the Age of the Fourth Industrial Revolution)
Abstract
:Chromatography equipment includes hold-up volumes that are external to the packed bed and usually not considered in the development of chromatography models. These volumes can substantially contribute to band-broadening in the system and deteriorate the predicted performance. We selected a bubble trap of a pilot scale chromatography system as an example for a hold-up volume with a non-standard mixing behavior. In a worst-case scenario, the bubble trap is not properly flushed before elution, thus causing the significant band-broadening of the elution peak. We showed that the mixing of buffers with different densities in the bubble trap device can be accurately modeled using a simple compartment model. The model was calibrated at a wide range of flow rates and salt concentrations. The simulations were performed using the open-source software CADET, and all scripts and data are published with this manuscript. The results illustrate the importance of including external holdup volumes in chromatography modeling. The band-broadening effect of tubing, pumps, valves, detectors, frits, or any other zones with non-standard mixing behavior can be considered in very similar ways.
1. Introduction
Ion exchange chromatography is widely used for the purification of proteins [1,2,3]. The preferred mode of elution is the application of a step gradient, where a defined concentration of modifier is applied to the column and the target molecule is desorbed. The chosen concentration of modifier is such that the co-elution of impurities is minimized and the recovery of the target molecule is high [4,5]. Ideally, a narrow elution profile is achieved with high product concentration and a low volume. Band-broadening effects work against ideal elution behavior and are thus critical for different reasons [6,7]. In general, band-broadening in chromatography columns is caused by axial dispersion (axial diffusion, hydrodynamic dispersion), a non-uniformity of flow (radial heterogeneity), mass-transfer limitations, and extra-column contributions, which can occur before and after the chromatography column [8,9]. Essentially, holdup volumes in tubing, mixers, pumps, valves, connectors and frits are the main causes for extra column dispersion. In particular, at small scales, chromatographic performance is significantly influenced and band-broadening effects have to be mathematically considered in order to model the true separation profile [10,11,12,13]. However, also at pilot and process scales, extra-column effects can become important, especially when the column is smaller in relation to the whole chromatography system. As a consequence, band-broadening leads to an increased volume of the target fraction, along with all the negative implications of this process.
Preparative chromatography systems are customarily equipped with bubble traps to protect the column from gas bubbles that may result from the degassing of initially cold process solutions at room temperature [4]. Bubble traps typically have a volume of ~100–500 mL, depending on the scale of the respective chromatography system. As such, the extra-column contribution of the trap to band-broadening can be significant.
In mechanistic modeling, the effect of extra-column volumes is most commonly described by a series of continuously stirred tank reactors (CSTRs) and plug flow reactors (PFRs). Such models only aim at creating an accurate representation of outcome. In contrast, computational fluid dynamics (CFD) is concerned with the investigation of flow patterns in a recreated geometry of the physical system to investigate dispersion effects as they occur in reality [10]. However, CFD simulations are computationally expensive, and, moreover, the combination of complex mass-transfer and adsorption models, as applied in chromatography, is not trivial [14].
In the present study, we selected a bubble trap of a pilot scale chromatography system as a representative device that could cause significant extra-column band-broadening via non-standard mixing behavior. The goal was to visualize and characterize the mixing behavior by tracer experiments and establish a simplified model based on PFRs and CSTRs that could be straightforwardly implemented into existing chromatography modelling software.
2. Materials and Methods
2.1. Materials
Experiments were performed on an ÄKTA pilot system from GE Healthcare (Uppsala, Sweden).
The Source 30 Q resin and the pilot scale column Fineline 100 were also obtained from GE Healthcare. Sodium chloride, sodium hydroxide, and Tris-hydrochloride salts for buffer preparation were purchased from Merck. Sodium nitrate was also purchased from Merck. Heat shock fraction bovine serum albumin (A9647) and vitamin B12 were both from Sigma Aldrich (Vienna, Austria).
2.2. Modelling Software
Chromatography Analysis and Design Toolkit (CADET) Version 3.1.2 [15] was used to set up and solve the models of the ÄKTA pilot system, i.e., the bubble trap model and the general rate model of the column. The CADET-MATCH software [16] was used to perform the inverse fitting procedure, i.e., estimate model parameters from measured concentration profiles. Template CADET scripts (Python 3.6+) for simulating salt transitions with and without the compartment model of the bubble trap are provided in the Supplementary Materials.
2.3. Linear Gradient and Step Elution Experiments
Linear gradient and step elution experiments with BSA were carried out using a 0.63 L Source 30 Q column, with and without the inclusion of the bubble trap in the flow path. The buffer system consisted of 7.5 pH, 20 mM Tris-HCl as the equilibration buffer and 20 mM Tris-HCl with 1 M NaCl added as the salt modifier. The sample load was 1.5 mg of BSA per mL column for each experiment. The residence time for all runs was 3 min, which equated to a flow rate of 200 mL/min.
The linear gradient length was 12 column volumes (CV) from 0 to 400 mM NaCl. Step elution was performed at a concentration of 200 mM NaCl. Conductivity and absorption at 280 nm were measured online.
2.4. Salt Transition Experiments
Salt transition experiments were carried out with 0.25, 0.5, 1.0, and 2.0 M NaCl in water at ambient temperature (20–24 °C) and flow rates of 100, 150, 200, 250, and 300 mL/min. For visualization, runs at 1 M NaCl supplemented with vitamin B12 were performed at the flow rates mentioned above.
3. Results
As outlined in the introduction, we selected the bubble trap as an example for a zone in a process system with particularly ineffective mixing properties. Our experimental set-up was designed to study salt transition from low to high molarity, as often encountered during elution in ion exchange (IEX) chromatograpyh. Our intention was to investigate this unfavorable scenario to develop a model for describing non-standard mixing behavior. At this point, it has to be noted that in industrial practice, this situation is avoided by flushing the bubble trap with elution buffer prior to the elution step.
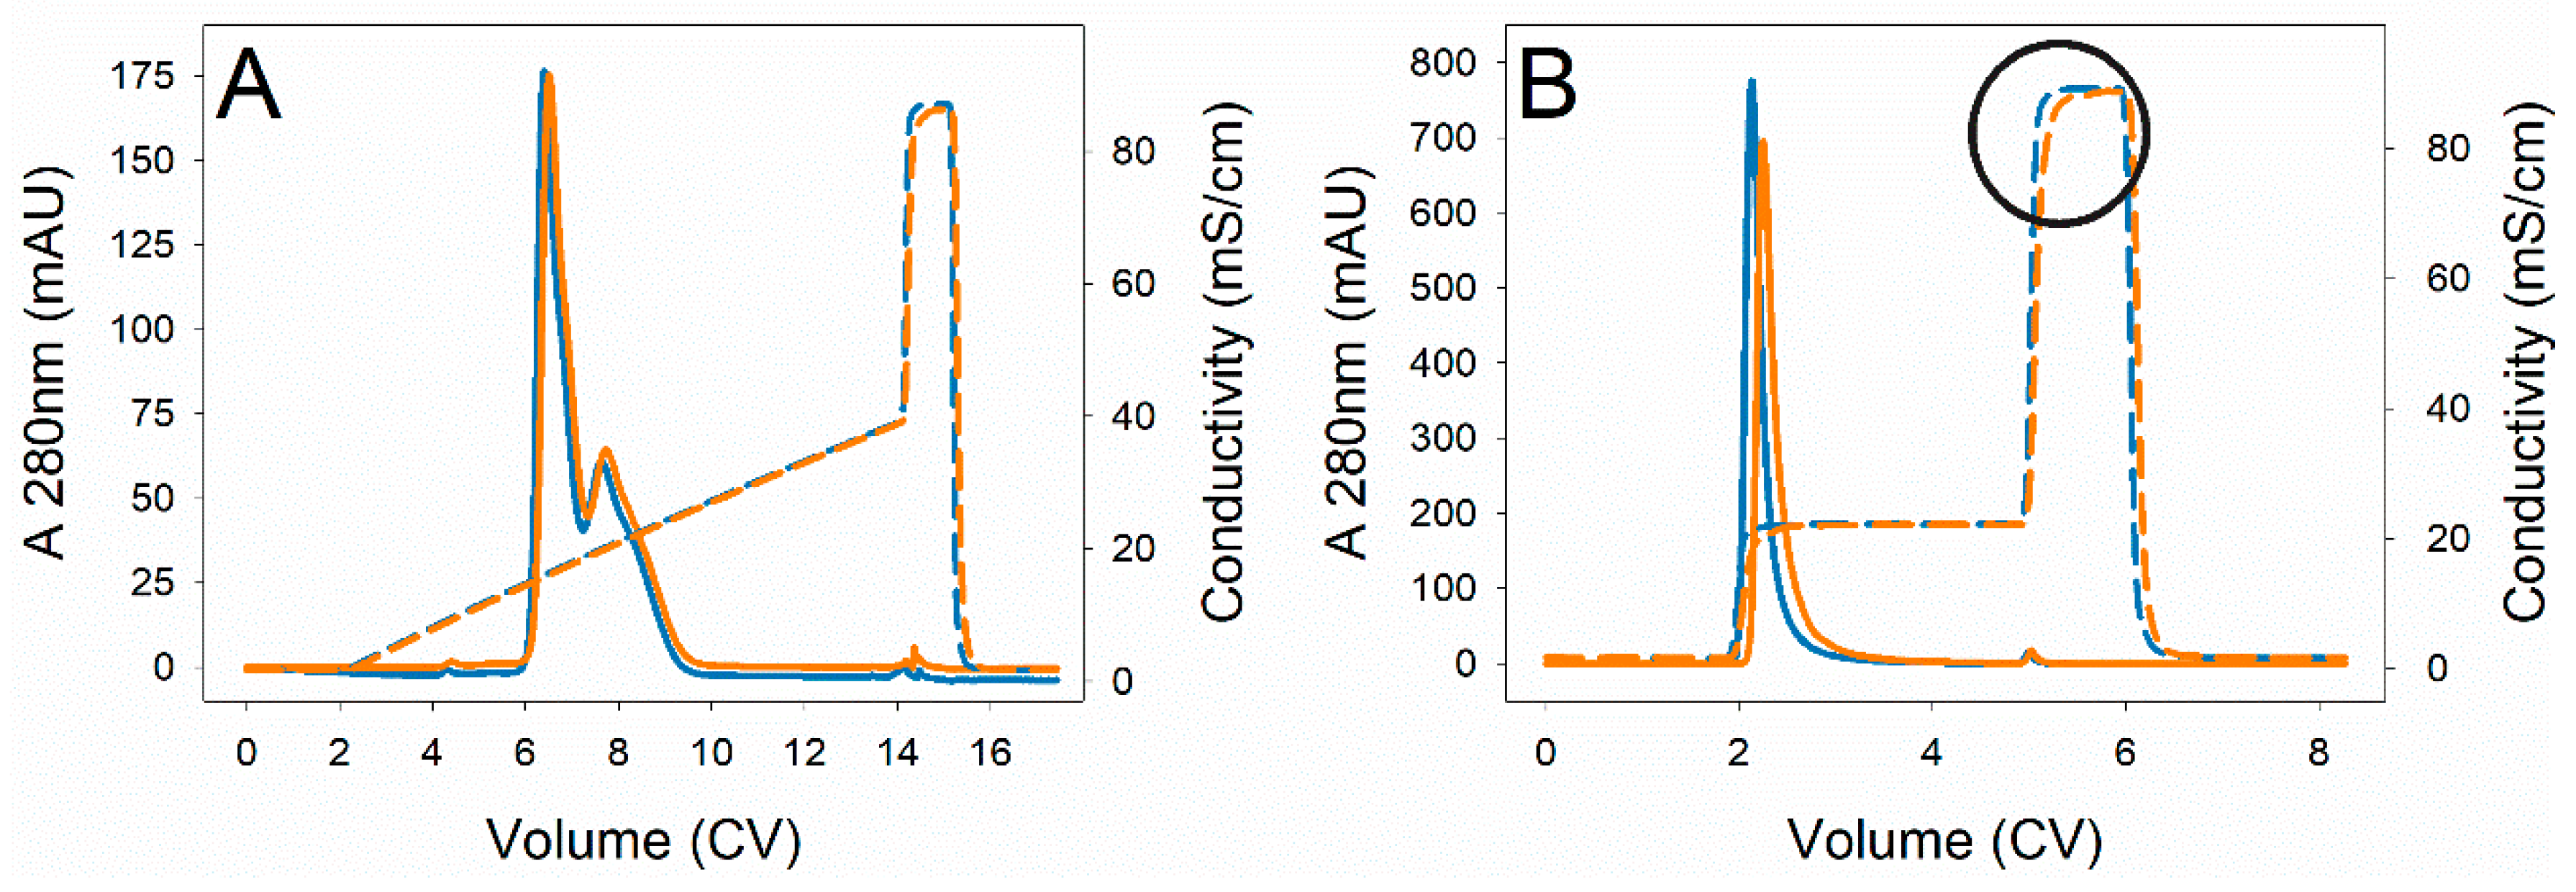
Experimentally, the influence of the bubble trap on separation efficiency was assessed using a column of intermediate size (0.6 L) and bovine serum albumin (BSA) consisting of 75% monomers and 25% dimers and multimers as a sample. This mixture can be well separated on a high-performance anion exchanger (L Source 30 Q). Figure 1 shows separation runs with and without the inclusion of the bubble trap in the flow path.
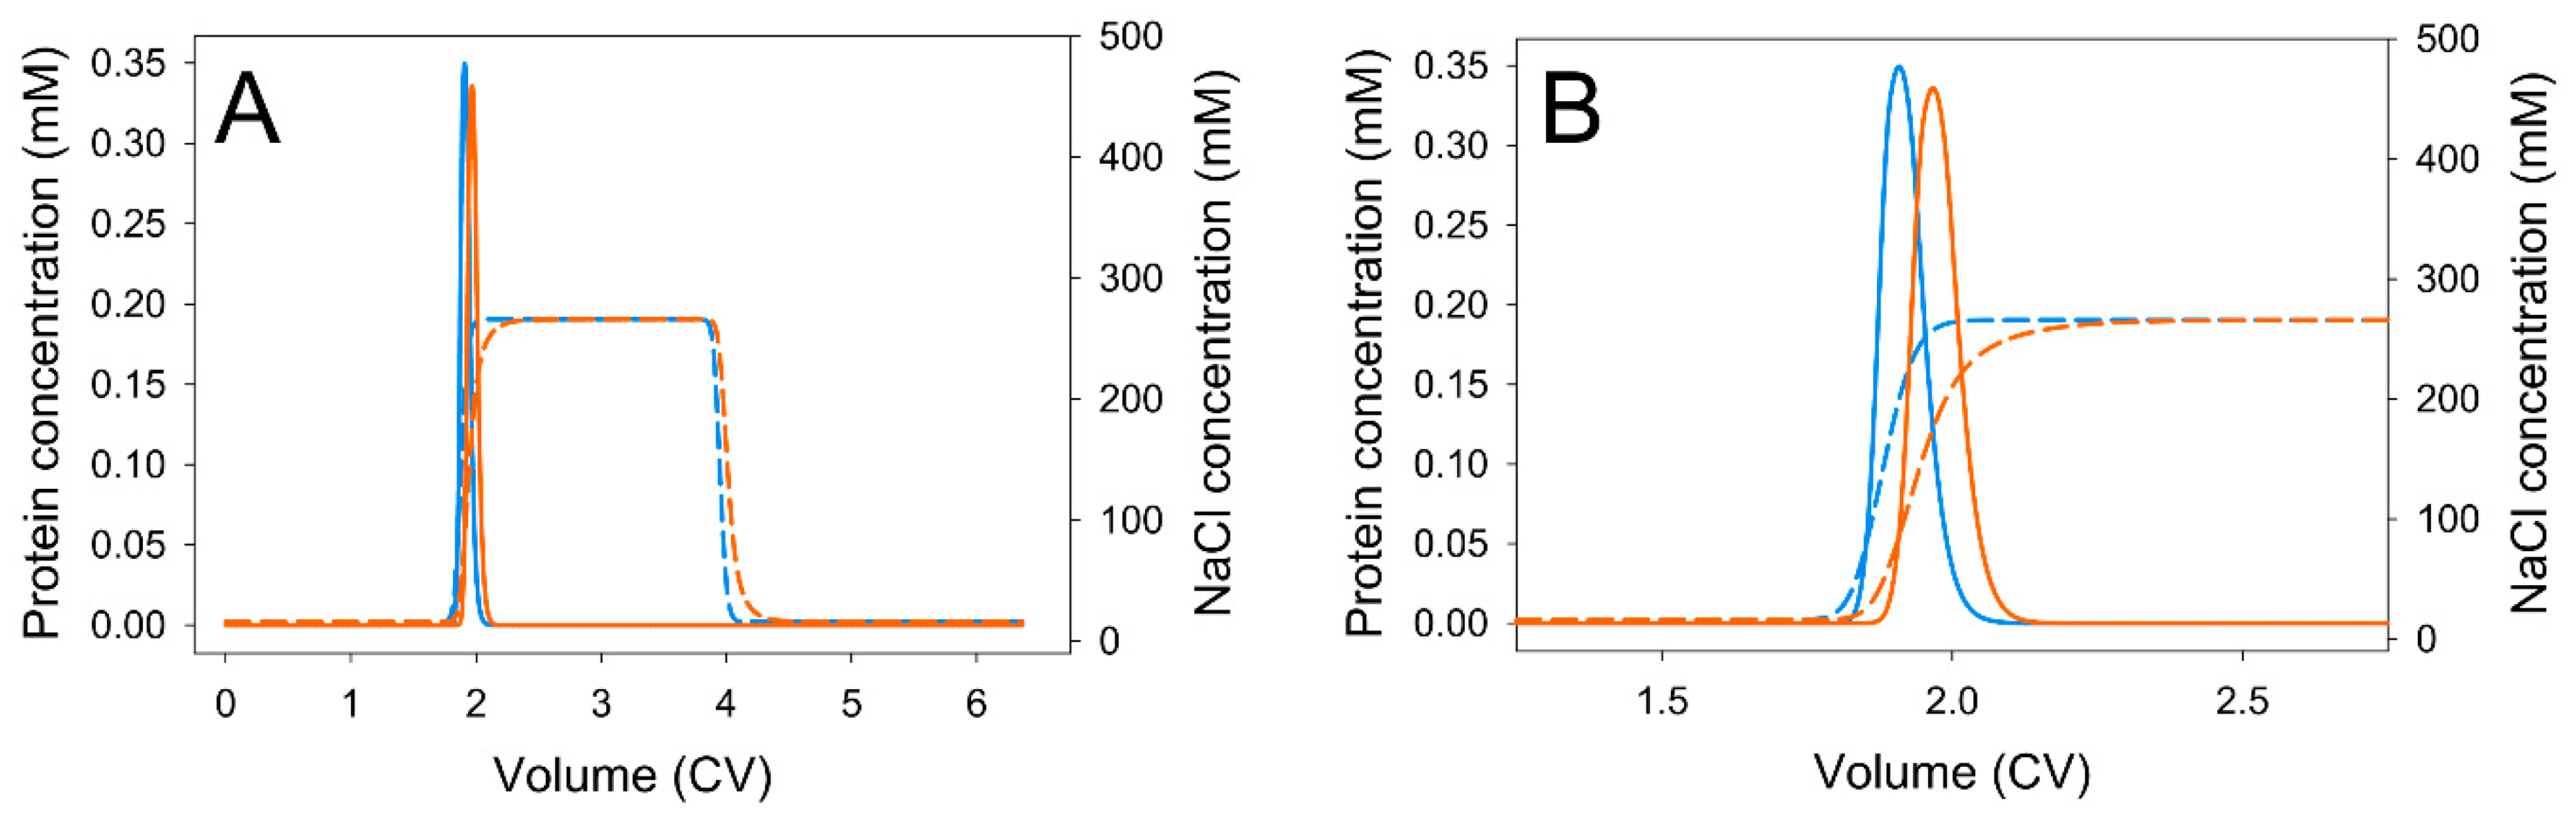
For linear gradient elution (LGE) in Figure 1A, practically no difference in terms of the resolution between the two runs could be observed, and the two protein variants were equally well-separated in both cases. The inclusion of the bubble trap only resulted in a small shift to a larger retention volume without impacting the resolution. In contrast, step elution runs at 0.2 M NaCl revealed differences in terms of a significant band-broadening with a variance increase of 18% (as determined by moment analysis) when the bubble trap was connected (Figure 1B). Evidently, this broadening was caused by a mixing effect that significantly altered the salt transition profile from the theoretical rectangular shape. This deviation could be well-recognized during transition to 1 M NaCl, as indicated in Figure 1B.
We investigated this mixing behavior of the bubble trap in more detail by step inputs at different salt concentrations and flow rates. Vitamin B12 was added as a marker substance for visualization. Pictures and videos were recorded (see Supplementary Materials), and, based on the observed mixing behavior, a compartment model comprising different mixing zones was derived. A schematic drawing of the bubble trap is shown in Figure 2.
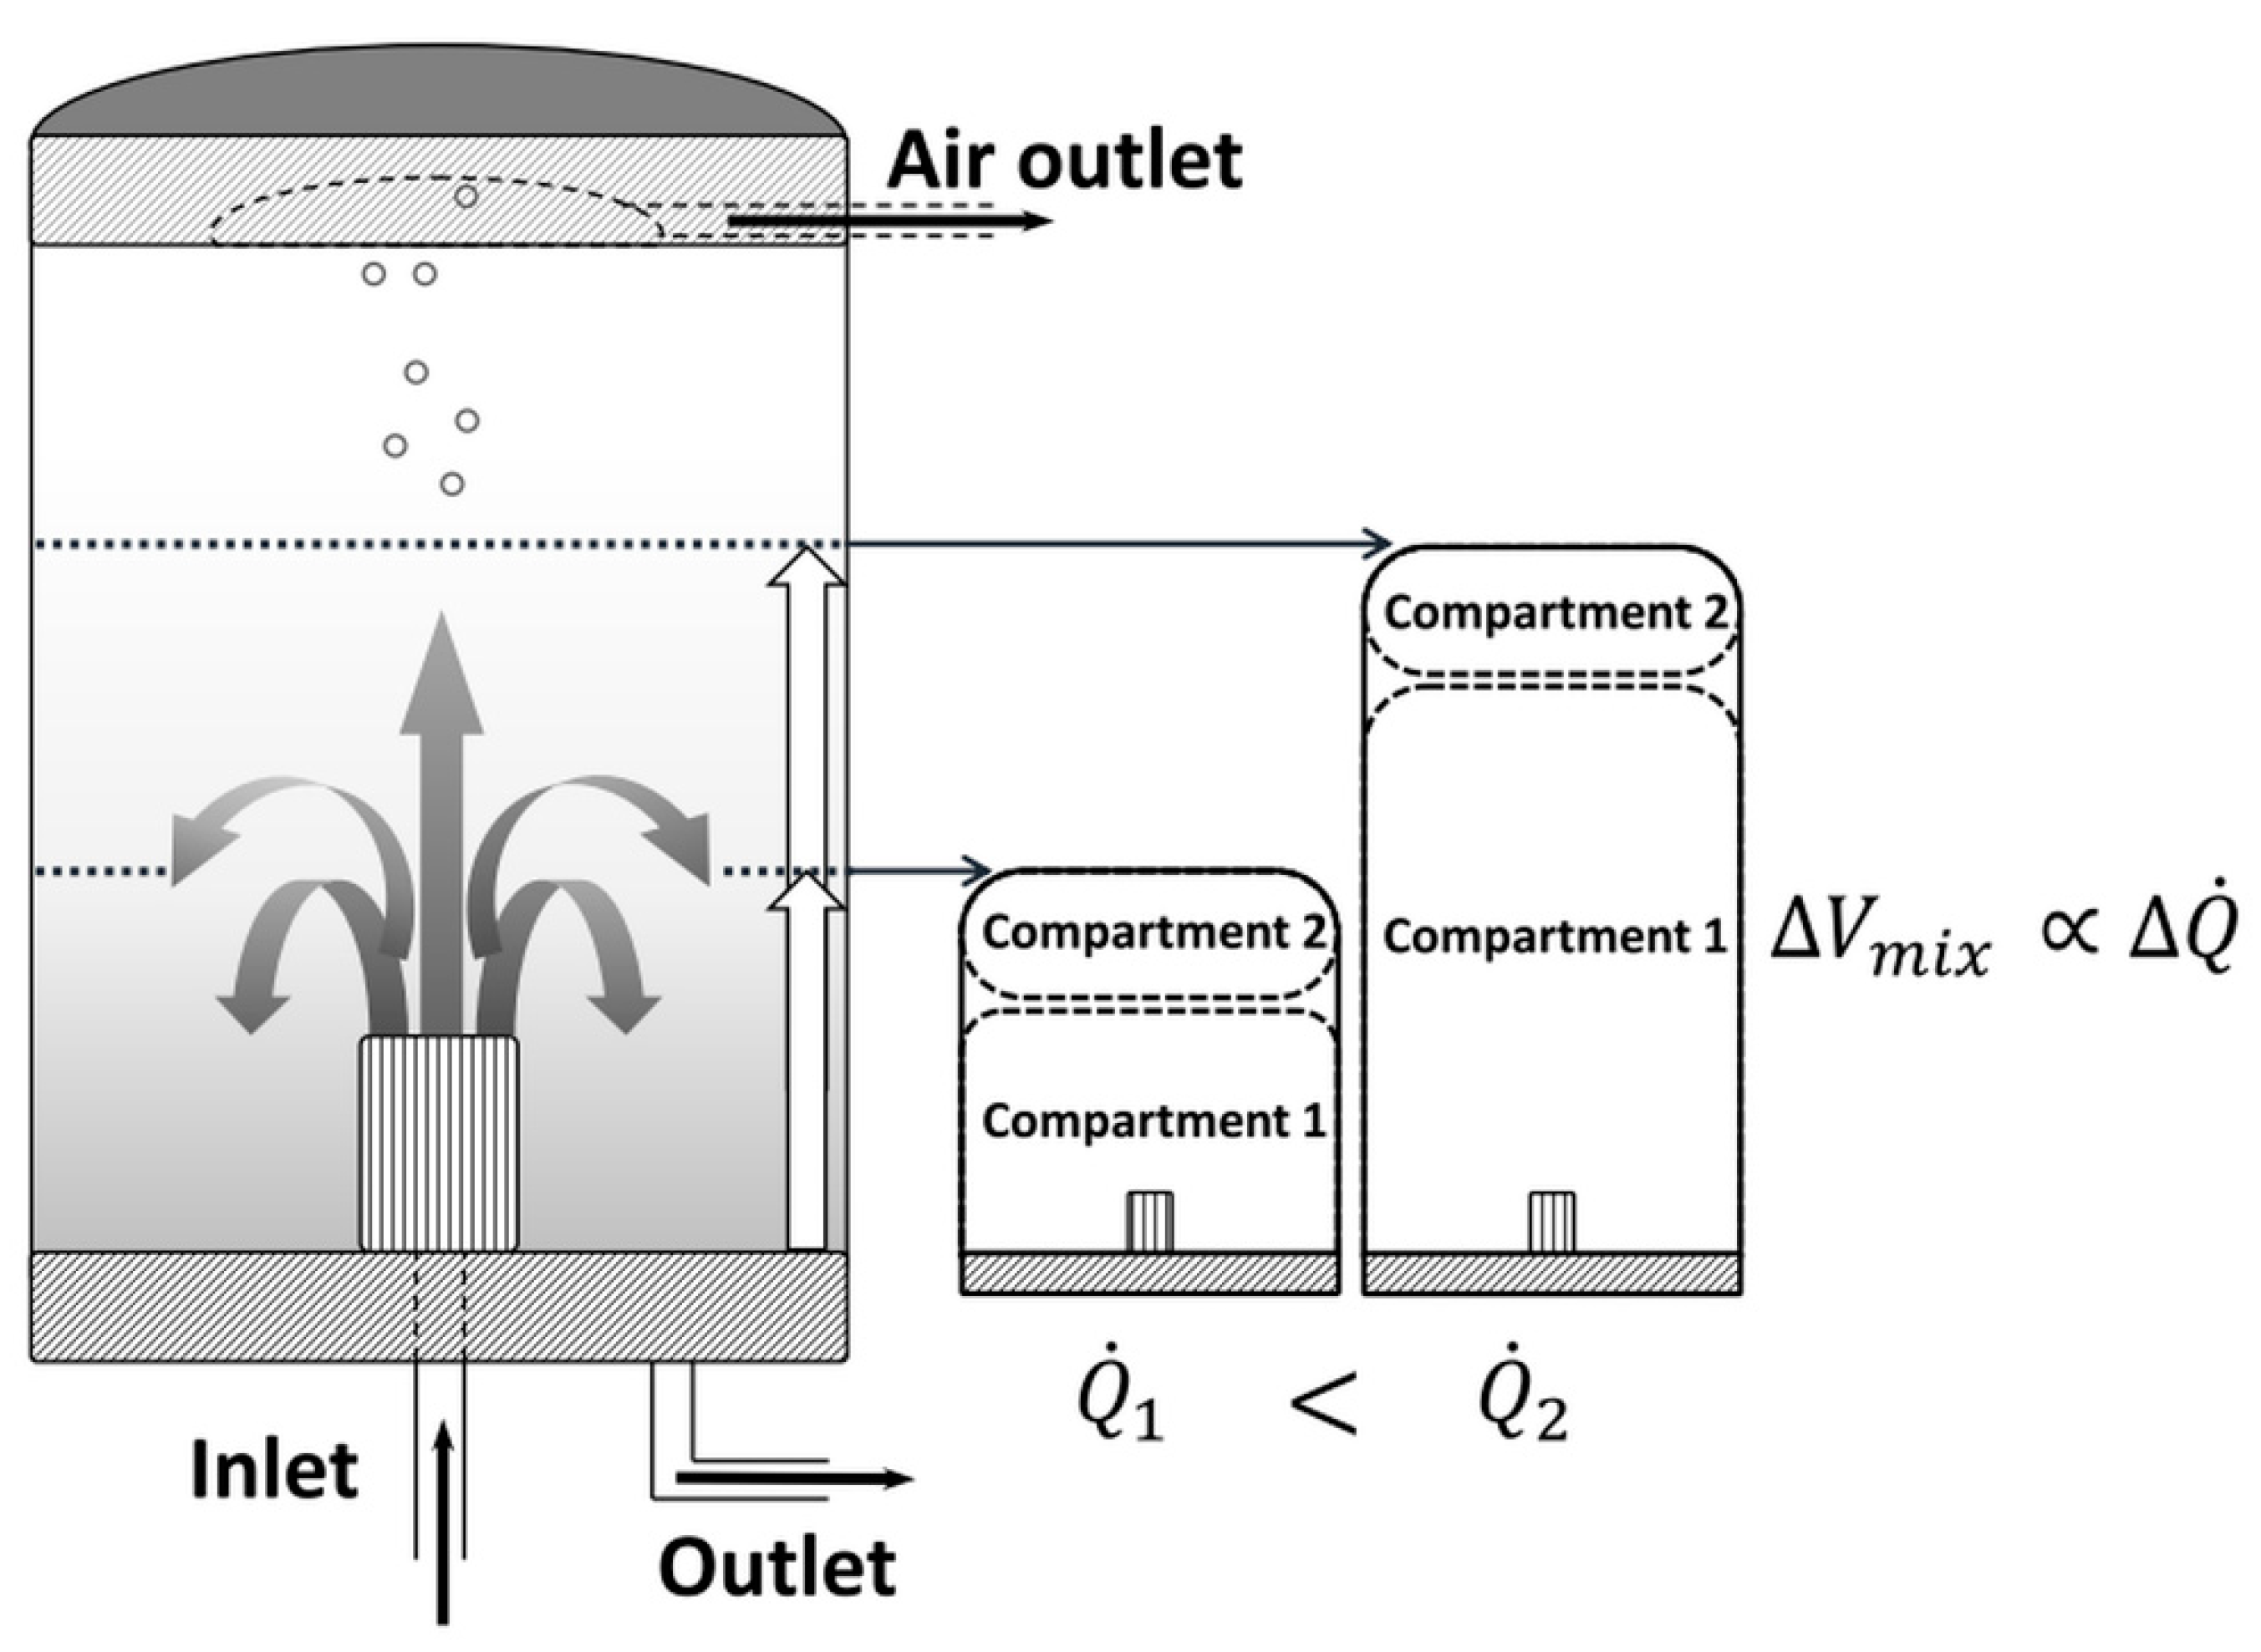
It is important to note that the bubble trap did not contain any active mixing devices like stirrers or other moving parts. The incoming liquid entered the glass cylinder through an inlet at a higher elevation level than the outlet, which was located at the bottom cap of the cylinder. As such, incoming liquid exited the cylinder quite rapidly. However, as evident from the videos, a mixing zone with high turbulence developed in the lower section of the cylinder. The volume of this zone was observed to increase with increasing flow rate. Above this zone, the liquid appeared stagnant without any significant turbulence. The runs with vitamin B12 showed that turbulence was not homogeneously distributed within the mixing zone. Turbulence was highest at the bottom and gradually decreased along the height of the cylinder. Furthermore, a fraction of the liquid was constantly driven into the bottom outlet. Obviously, the fluid dynamics were rather complex. We took some major simplifications and developed a model comprising two interconnected, ideally mixed compartments to simulate the turbulence gradient (Figure 3).
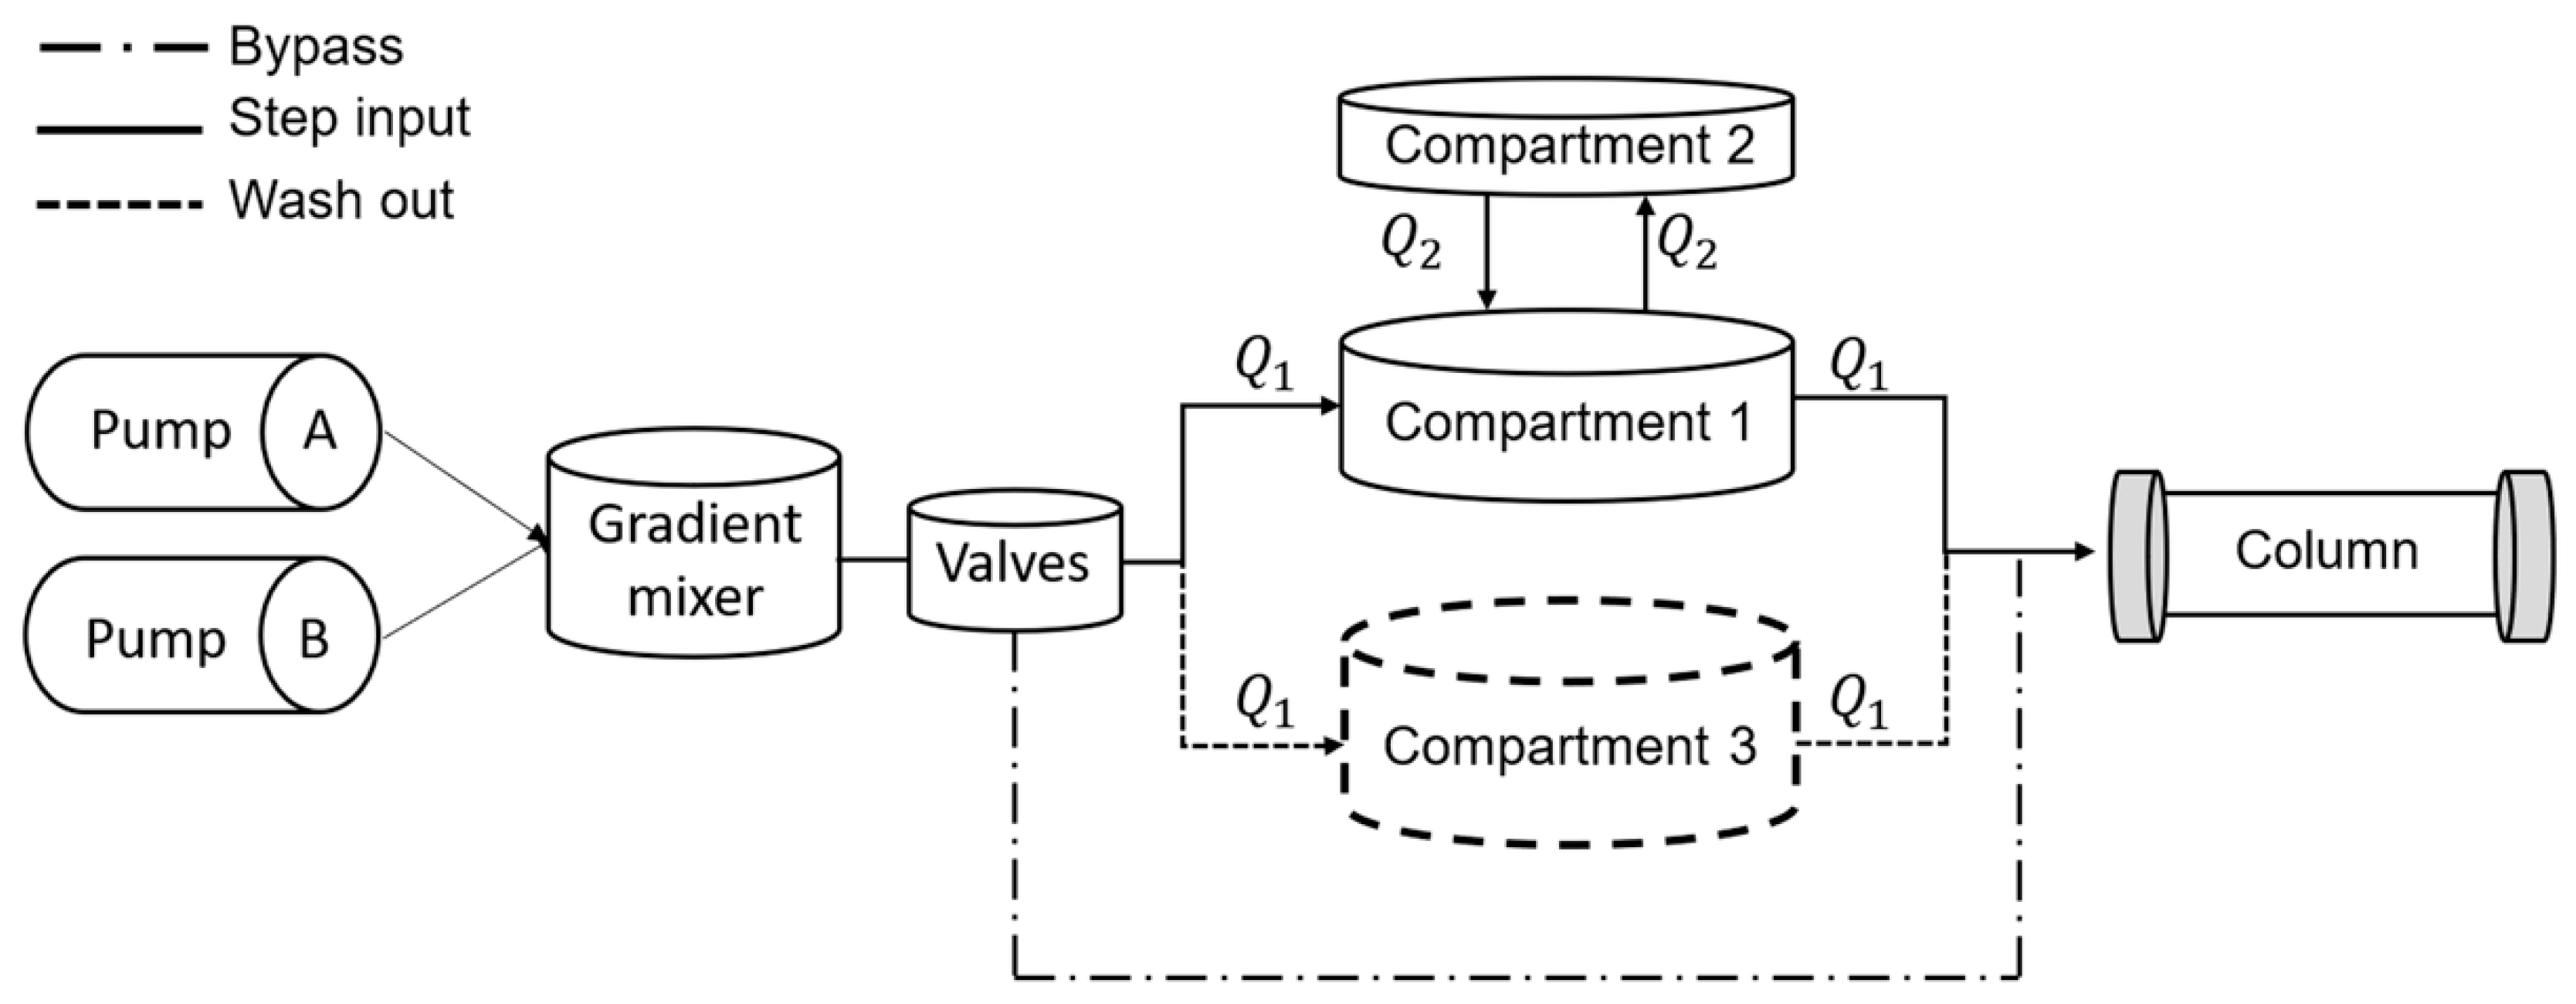
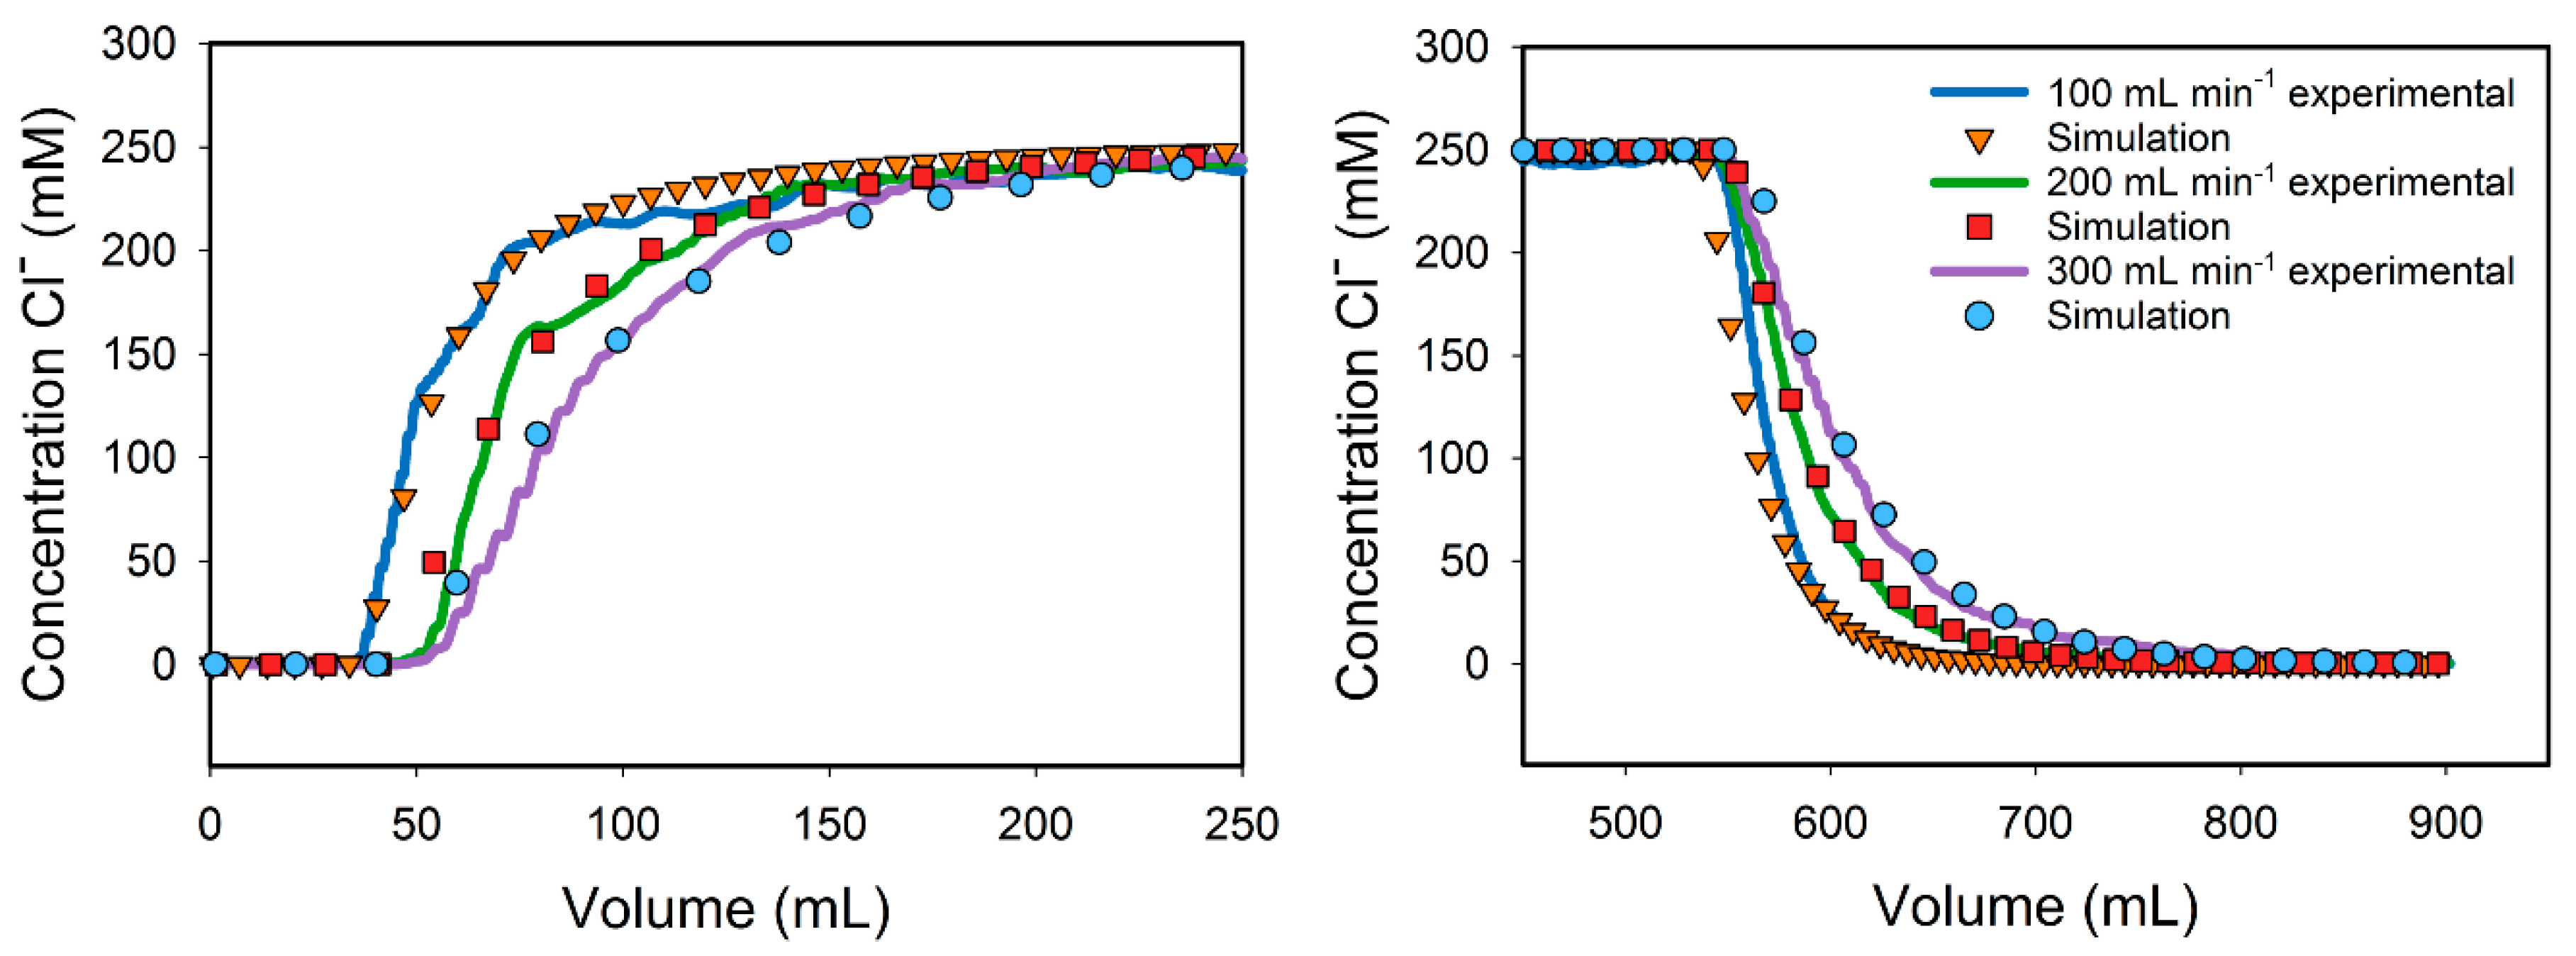
The first part of the model accounted for a system where the density of the incoming buffer was higher than that of the present buffer in the bubble trap, a situation that is common during elution with NaCl buffers. In this case, Compartment 1 represented the main mixing zone, and its volume was flow-dependent. Compartment 2 was a second zone that was bidirectionally interconnected with Compartment 1. The volume of Compartment 2 was lower, and reduced turbulence was simulated by a constant and rather low liquid exchange rate of 20% between the two zones, i.e., Q2 = 0.2 × Q1. The second part of the model (dashed in Figure 3) described a situation where the incoming buffer had a much lower density and accelerated the displacement of the buffer with the higher density. In such a case, e.g., during re-equilibration after elution, the transition was much faster, as could also be observed in the videos. This situation resembled an almost perfectly mixed system and only required one zone (Compartment 3) for simulation. For the simulation of the whole chromatography system assembly, the individual dead-volumes and extra-column contributions of the ÄKTA pilot system and the column hardware were modelled by a series of PFRs and CSTRs, as described by numerous authors [14,17,18,19]. For the implementation of the bubble trap, the compartment model was represented by a network of CSTRs. Salt transition experiments were carried out at four different salt concentrations and five flow rates. Individual conductivity profiles, including the wash-out, were subjected to an inverse parameter estimation. To determine pump delays and system volumes, blank runs were carried out without the bubble trap first. A central problem was that the raw data output of the chromatography system software does not contain pump ramp-ups and wind-downs, which frequently occur during a typical chromatography run and result in delays in the time or volume scale. As a result, the correction of these delays was required. A simple solution to this problem was the inclusion of a PFR in the flow-path of the model with a volume corresponding to the time offset caused by the pump delay at the applied flow rate. For a flow rate of 200 mL/min, the volume of the PFR was 27 mL. The two CSTRs representing the gradient mixer and valves had volumes of 5 and 2 mL, respectively. After establishing the chromatography system model for all flow rates, salt transition profiles through the bubble trap were fitted with the compartment model. The model was capable of matching the measured profiles very well. However, due to a large number of possible ratios of the respective CSTR volumes that resulted in similar fits, the best fit did not necessarily represent a physically meaningful image of reality. Thus, we applied a global fitting strategy where all flow rates were concurrently analyzed, with built-in constraints that were based on physical observations: (1) CSTR1 was linearly dependent on the flow rate; (2) CSTR2 was constant for each flow rate but depended on the liquid density, which was determined by the salt concentration; and (3) VCSTR3 = VCSTR1 + VCSTR2. The fitting procedure included step elution as well as re-equilibration. The latter step was characterized by a fast wash-out of the cylinder. The fitted parameters are listed in Table 1, and selected fits are shown in Figure 4.
For the obtained parameters, all simulations were in good agreement with the corresponding experimental observations. For the lowest flow rate of 100 mL/min, CSTR1 was 15 mL for the lowest density and decreased to 7 mL for higher densities. For the highest flow rate and low density, the volume was 40 mL and decreased to 20 mL for the highest density. These trends were reasonable because high flow rates caused the incoming liquid to reach higher levels in the chamber, whereas high densities counteracted this effect. Due to one of the constraints, CSTR2 was constant for all flow rates. It varied only slightly for the different densities, with an average value of ~8.5 mL and a low coefficient of variation of 8.9%. The implementation of the constraints in the global fitting procedure yielded physically plausible reactor volumes for the different zones, which were apparent during the transition experiments. It is clear that our compartment model is a very simplified depiction of the physical reality. Nevertheless, the model works well and due to its simple construction, and it can be easily implemented into commercially available mechanistic chromatography modelling software. As a final step, we decided to simulate a simple step elution process to demonstrate that our compartment model is able to simulate the band-broadening effect during the elution of a protein. Naturally, we used CADET for the simulation of protein elution, but other software capable of simulating sorption processes can be used as well. The binding and elution of proteins was described by the general rate model and the steric mass action (SMA) adsorption model [20] with a 0.6 L (i.d. = 10 cm; height = 8 cm) column operated at 200 mL/min with a step elution of 0.2 M NaCl. A theoretical adsorption system consisting of a monomeric protein was used in this simulation because the BSA sample used in the physical experiments contained a large amount of charge variants and multimers. At this point, is has to be noted that only the impact of the bubble trap was of interest in this simulation. Therefore, we used the SMA isotherm parameters of RNAse from literature [21], which are as follows: Ke = 0.27, z = 1.6, and σ = 30. The ionic capacity of the resin was set to 160 mmol/L, and mass transport parameters were selected to be typical for a small protein and a resin of intermediate particle diameter and pore size. We used a film mass transfer coefficient kf of 1.5 × 10⁻³ cm/s and an effective pore diffusion coefficient De of 5 × 10⁻⁷ cm²/s. As explained above, the major intention of this simulation was the direct comparison of desorption with and without the inclusion of the compartment model. The porosities for the column (based on the resin Source 30 Q) were set as follows: particle porosity (εp) = 0.53 and the void fraction of the column (ε) = 0.35.
The axial dispersion in the packed bed, obtained by an inverse fit of a salt transition through the column, was 2.3 × 10⁻⁴ cm²/s. Protein band-broadening from column dynamics were deliberately omitted because the area of interest was solely the band-broadening caused by the change in the transition profile during step elution and the influence on desorption. Figure 5 shows the generated simulations with and without the inclusion of the bubble trap in the flow path. In good agreement with the experimental behavior shown in Figure 1B, the model predicted a significant band-broadening of about 11% increase in variance and a retention shift of 37 mL. The simulation clearly emphasized the big impact of the dispersion caused by the bubble trap on the separation performance. The column size used for this simulation was 0.6 L and could be classified as intermediate size with respect to pilot scale chromatography. Considering the high capacities usually encountered with modern ion exchange resins, it is feasible that even smaller columns might be used in pilot scale protein purification. In such cases, the relative peak broadening effect when using the bubble trap is likely to be even higher, and, thus, care must be taken to maintain the required separation efficiency. In practice, this can be accomplished by performing a wash of the bubble trap with an elution buffer and bypassing the column prior to the actual elution step. When the column size is much bigger than the one used here, this washing step can be omitted. Using the developed compartment model, one can easily determine this threshold column size.
4. Discussion
We showed that the inclusion of a bubble trap caused significant band-broadening during step elution procedures, as expected. The bubble trap had a complex mixing behavior that was highly influenced by the density of the mixed fluids. Step changes and high flow rates resulted in longer residence times within the trap and larger effective mixing volumes. In contrast, a gradual change of the liquid as applied in linear gradient elution resulted in rapid mixing and transition through the trap and thus caused only slight shifts in retention time but not significant band-broadening.
A model based on two interconnected CSTRs, representing ideally mixed zones, that describes the influence of the bubble trap during step elution was developed. The CSTR volumes critically depend on the flow rate and density of buffer solutions that are mixed in the bubble trap during gradient elution. Due to a constraint-based concurrent fitting procedure, they have physical meaning and can be interpolated between the tabulated values. Our approach of interconnected CSTRs could be applied to model other challenging mixing problems with irregular residence time distributions. In such cases, CSTRs in series might fail. For example, a future application could be the use of this type of inter-connection to simulate expanded bed chromatography by varying volumes and column porosity throughout a stack of individual nodes of rate models with adsorption capabilities to predict or design such processes.
Supplementary Materials
The following are available online at https://0-www-mdpi-com.brum.beds.ac.uk/2227-9717/8/7/780/s1, Figure S1: Mixing volume at different flow rates, Video S1: Bubble-trap step gradient, Python script S1: Äkta Pilot bypass script, Python script S2: Compartment model script.
Author Contributions
Conceptualization, J.B. and R.H.; methodology, J.B.; software, W.H.; validation, J.B., R.H. and E.v.L.; formal analysis, J.B.; investigation, J.B.; resources, R.H.; data curation, J.B.; writing—original draft preparation, J.B.; writing—review and editing, R.H. and E.v.L.; visualization, J.B.; supervision, R.H.; project administration, R.H.; funding acquisition, R.H. All authors have read and agree to the published version of the manuscript.
Funding
This research received no external funding.
Conflicts of Interest
The authors declare no conflict of interest.
References
- Carta, G.; Jungbauer, A. Protein Chromatography: Process Development and Scale-Up; Wiley-VCH: Weinheim, Germany, 2010. [Google Scholar]
- Yamamoto, S.; Nakanishi, K.; Matsuno, R. Ion-Exchange Chromatography of Proteins. In Chromatographic Science Series; CRC Press: Boca Raton, FL, USA, 1988; ISBN 978-0-8247-7903-0. [Google Scholar]
- Hahn, R. Methods for characterization of biochromatography media. J. Sep. Sci. 2012, 35, 3001–3032. [Google Scholar] [CrossRef]
- Hagel, L.; Jagschies, G.; Gail, S. Handbook of Process Chromatography, 2nd ed.; Academic Press: Cambridge, USA, 2008. [Google Scholar]
- Janson, J.-C. Protein Purification: Principles, High Resolution Methods, and Applications, 3rd ed.; Wiley: Hoboken, NJ, USA, 2011. [Google Scholar]
- Guiochon, G.; Shirazi, D.G.; Felinger, A.; Katti, A.M. Fundamentals of Preparative and Nonlinear Chromatography; Academic Press: Cambridge, MA, USA, 2006; ISBN 978-0-12-370537-2. [Google Scholar]
- Huber, J.F.; Rizzi, A. Influence of the accuracy of the extra-column peak-width determination on the verificaton of theoretical plate-height equations. J. Chromatogr. A 1987, 384, 337–348. [Google Scholar] [CrossRef]
- Gritti, F.; Guiochon, G. Mass transfer kinetics, band broadening and column efficiency. J. Chromatogr. A 2012, 1221, 2–40. [Google Scholar] [CrossRef] [PubMed]
- Schweiger, S.; Jungbauer, A. Scalability of pre-packed preparative chromatography columns with different diameters and lengths taking into account extra column effects. J. Chromatogr. A 2018, 1537, 66–74. [Google Scholar] [CrossRef] [PubMed]
- Shankar, A.; Lenhoff, A.M. Dispersion in round tubes and its implications for extracolumn dispersion. J. Chromatogr. A 1991, 556, 235–248. [Google Scholar] [CrossRef]
- Kaltenbrunner, O.; Jungbauer, A.; Yamamoto, S. Prediction of the preparative chromatography performance with a very small column. J. Chromatogr. A 1997, 760, 41–53. [Google Scholar] [CrossRef]
- Persson, P.; Kempe, H.; Zacchi, G.; Nilsson, B. Estimation of adsorption parameters in a detailed affinity chromatography model based on shallow bed experiments. Process Biochem. 2005, 40, 1649–1659. [Google Scholar] [CrossRef]
- Iurashev, D.; Schweiger, S.; Jungbauer, A.; Zanghellini, J. Dissecting peak broadening in chromatography columns under non-binding conditions. J. Chromatogr. A 2019, 1599, 55–65. [Google Scholar] [CrossRef] [PubMed]
- Ghosh, P.; Vahedipour, K.; Lin, M.; Vogel, J.H.; Haynes, C.; von Lieres, E. Computational fluid dynamic simulation of axial and radial flow membrane chromatography: Mechanisms of non-ideality and validation of the zonal rate model. J. Chromatogr. A 2013, 1305, 114–122. [Google Scholar] [CrossRef] [PubMed]
- Leweke, S.; Von Lieres, E. Chromatography Analysis and Design Toolkit (CADET). Comput. Chem. Eng. 2018, 113, 274–294. [Google Scholar] [CrossRef]
- Heymann, W. CADET-Match, CADET Parameter Estimation Engine. Available online: https://github.com/modsim/CADET-Match/ (accessed on 2 July 2020).
- Kumar, V.; Leweke, S.; von Lieres, E.; Rathore, A.S. Mechanistic modeling of ion-exchange process chromatography of charge variants of monoclonal antibody products. J. Chromatogr. A 2015, 1426, 140–153. [Google Scholar] [CrossRef] [PubMed]
- Shekhawat, L.K.; Manvar, A.P.; Rathore, A.S. Enablers for QbD implementation: Mechanistic modeling for ion-exchange membrane chromatography. J. Membr. Sci. 2016, 500, 86–98. [Google Scholar] [CrossRef]
- He, Q.-L.; Leweke, S.; von Lieres, E. Efficient numerical simulation of simulated moving bed chromatography with a single-column solver. Comput. Chem. Eng. 2018, 111, 183–198. [Google Scholar] [CrossRef]
- Brooks, C.A.; Cramer, S.M. Steric mass-action ion exchange: Displacement profiles and induced salt gradients. AIChE J. 1992, 38, 1969–1978. [Google Scholar] [CrossRef]
- Osberghaus, A.; Hepbildikler, S.; Nath, S.; Haindl, M.; von Lieres, E.; Hubbuch, J. Optimizing a chromatographic three component separation: A comparison of mechanistic and empiric modeling approaches. J. Chromatogr. A 2012, 1237, 86–95. [Google Scholar] [CrossRef] [PubMed]
Figure 1.
Separation of a bovine serum albumin (BSA) sample on Source 30 Q anion exchanger on an ÄKTA pilot chromatography system. Runs were performed without (blue) and with (orange) the inclusion of a bubble trap. Solid lines represent UV, and dashed lines represent conductivity profiles. (A) Linear gradient elution from 0 to 0.4 M NaCl over 12 CV. (B) Elution with a step input of 0.2 M NaCl.

Figure 2.
Schematic representation of the ÄKTA pilot bubble trap, including the simplified depiction of flow behavior by ideally mixed compartments.
Figure 2.
Schematic representation of the ÄKTA pilot bubble trap, including the simplified depiction of flow behavior by ideally mixed compartments.

Figure 3.
Schematic representation of the complete ÄKTA pilot system including the bubble trap and the chromatography column used for simulation with CADET.
Figure 3.
Schematic representation of the complete ÄKTA pilot system including the bubble trap and the chromatography column used for simulation with CADET.

Figure 4.
Parameter fitting for transition curves of step input at 250 mM NaCl for flow rates of 100, 200, and 300 mL/min. Lines represent experimental runs, and symbols represent the respective fits.
Figure 4.
Parameter fitting for transition curves of step input at 250 mM NaCl for flow rates of 100, 200, and 300 mL/min. Lines represent experimental runs, and symbols represent the respective fits.

Figure 5.
(A) Simulation of 0.2 M NaCl step elution with and without the inclusion of the compartment model representing a bubble trap. Simulations were performed without (blue) and with (orange) the inclusion of a bubble trap. Solid lines represent protein concentration profiles (mM), and dashed lines represent salt concentration profiles (mM). (B) Enhanced view of step elution.


Table 1.
Results of respective continuously stirred tank reactor (CSTR) volumes obtained by a global fitting strategy concurrently applying the compartment model to runs performed at different flow rates and NaCl concentrations.
Table 1.
Results of respective continuously stirred tank reactor (CSTR) volumes obtained by a global fitting strategy concurrently applying the compartment model to runs performed at different flow rates and NaCl concentrations.
| CSTR 1 (cm³) | CSTR 2 (cm³) | CSTR 3 (cm³) | |||||
|---|---|---|---|---|---|---|---|
| Salt Step Concentration (mM) | Flow Rate (cm³/min) | Mean | SD | Mean | SD | Mean | SD |
| 250 mM | 100 | 15.47 | 0.53 | 9.04 | 0.178 | 24.50 | 0.66 |
| 150 | 21.83 | 0.69 | 30.87 | 0.87 | |||
| 200 | 28.18 | 1.12 | 37.22 | 1.28 | |||
| 250 | 34.54 | 1.62 | 43.58 | 1.77 | |||
| 300 | 40.90 | 2.14 | 49.94 | 2.28 | |||
| 500 mM | 100 | 7.38 | 0.33 | 9.51 | 0.01 | 16.88 | 0.33 |
| 150 | 14.01 | 0.25 | 23.51 | 0.25 | |||
| 200 | 20.64 | 0.16 | 30.14 | 0.17 | |||
| 250 | 27.27 | 0.08 | 36.77 | 0.09 | |||
| 300 | 33.90 | 0.00 | 43.41 | 0.01 | |||
| 1000 mM | 100 | 7.29 | 0.31 | 7.48 | 0.29 | 14.77 | 0.51 |
| 150 | 13.47 | 0.08 | 20.95 | 0.31 | |||
| 200 | 19.65 | 0.17 | 27.13 | 0.21 | |||
| 250 | 25.73 | 0.48 | 33.21 | 0.45 | |||
| 300 | 32.00 | 0.64 | 39.48 | 0.53 | |||
| 2000 mM | 100 | 7.63 | 0.17 | 8.31 | 0.09 | 15.94 | 0.09 |
| 150 | 10.82 | 0.10 | 19.13 | 0.02 | |||
| 200 | 14.02 | 0.05 | 22.32 | 0.07 | |||
| 250 | 17.21 | 0.08 | 25.51 | 0.14 | |||
| 300 | 20.40 | 0.14 | 28.71 | 0.22 | |||
© 2020 by the authors. Licensee MDPI, Basel, Switzerland. This article is an open access article distributed under the terms and conditions of the Creative Commons Attribution (CC BY) license (http://creativecommons.org/licenses/by/4.0/).
Share and Cite
MDPI and ACS Style
Beck, J.; Heymann, W.; von Lieres, E.; Hahn, R. Compartment Model of Mixing in a Bubble Trap and Its Impact on Chromatographic Separations. Processes 2020, 8, 780. https://0-doi-org.brum.beds.ac.uk/10.3390/pr8070780
AMA Style
Beck J, Heymann W, von Lieres E, Hahn R. Compartment Model of Mixing in a Bubble Trap and Its Impact on Chromatographic Separations. Processes. 2020; 8(7):780. https://0-doi-org.brum.beds.ac.uk/10.3390/pr8070780
Chicago/Turabian StyleBeck, Jürgen, William Heymann, Eric von Lieres, and Rainer Hahn. 2020. "Compartment Model of Mixing in a Bubble Trap and Its Impact on Chromatographic Separations" Processes 8, no. 7: 780. https://0-doi-org.brum.beds.ac.uk/10.3390/pr8070780
Note that from the first issue of 2016, this journal uses article numbers instead of page numbers. See further details here.