Article

Technical Potential for Energy and GWP Reduction in Chemical–Pharmaceutical Industry in Germany and EU—Focused on Biologics and Botanicals Manufacturing

Institute for Separation and Process Technology, Clausthal University of Technology, Leibnizstr. 15, D-38678 Clausthal-Zellerfeld, Germany
*
Author to whom correspondence should be addressed.
Submission received: 5 June 2020 / Revised: 29 June 2020 / Accepted: 8 July 2020 / Published: 11 July 2020
(This article belongs to the Section Biological Processes and Systems)

Abstract

:
European policy demands climate neutrality by the year 2050. Therefore, any manufacturing optimization needs to be achieved in the well-known pareto of global warming potential (GWP) reduction combined with cost of goods (COG) reduction at increasing product amounts, while still being able to compete in the world market. The chemical–pharmaceutical industry is one of the most energy-intensive industries. The pharmaceutical industry operates with low batch sizes, but high margins. This study analyzes, based on the literature and Bundesministerium für Wirtschaft und Energie (BMWi; English: Federal Ministry for Economic Affairs and Energy)-funded project results, the technical potentials for energy and GWP reduction, while focusing on biologics and botanicals, because those are already widely based on natural raw material resources. The potential impact for green technologies is pointed out in relation to climate-neutral manufacturing.

1. Introduction

Germany contributes about 2% to the worldwide CO2eq emissions [1]. Industrial manufacturing contributes about 30% [2], whereas the chemical–pharmaceutical industry contributes about 14% [3], being third in the rankings after the iron and steel and cement industries. These energy-intensive industries have therefore founded a consortium [4]. German industry accounts for about 5.6 million employees and EUR two trillion turnover per year, being the fourth largest industrial nation [5]. The chemical–pharmaceutical industry in Germany is, after automotive and civil engineering, the third largest in terms of sales and employees [1,3].
Apart from energy consumption, all natural chemical material conversions have to be taken into account due to the chemical nature of these industries. The pharmaceutical industry is a small part of the chemical–pharmaceutical industry due to the low metric tons per year products compared to petro and bulk chemicals, and even to fine chemicals manufacturing [6,7].
Almost all companies have announced that they will be climate neutral by 2050 [8,9]. A Verband der Chemischen Industrie (VCI; English: German Chemical Industry Association) study points out the demand for about EUR 50 billion investments to be made and refinanced, as well as the green energy demand to be tripled for the chemical–pharmaceutical industry alone to about 650 TWh from the current total 250 TWh in 2020. In addition, this politically necessary energy change with estimated EUR 2.3 trillion costs has to be implemented by the industry to cope with increasing competition in the world market [10].
Global warming potential (GWP) analysis by life cycle assessment (LCA) has become the state-of-the-art method in this area for quite some time [11,12]. The general idea goes back to the activities during the oil crisis starting in the 1970s, developing pinch technology [13]. In general, it should be kept in mind that the industry has combined massive product improvements and enlargement with efficient manufacturing technologies [14] at a 60% manufacturing increase with a 20% energy reduction and a 50% GWP reduction [15].
Enhanced energy efficiency projects in industry focus on more efficient energy supply by combined heat and power generation due to energy efficiency factor increases and gas power stations substituting for coal, as well as buildings with appropriate insulation and LED lighting and the integration of heating and cooling air conditioning [16,17].
About 90% of petro- and bulk chemical manufacturing energy demand is correlated with distillation, i.e., evaporation and condensation enthalpy are natural and expected, alongside the appropriate isolation of units and energy integration. Therefore, raw material substitution for a bio-based economy [18] is a driver here. The integration of power-to-x [19] and sun fuels [20] are technical foci as well.
In contrast and in addition, this paper focuses on biologics and botanicals, because they are already sustainable green natural products. No raw material change has to be discussed. The central question is how manufacturing technology could be technically improved, optimized, and intensified in order to gain the most efficient processes due to maximized resource and energy utilization, as well as the cost of goods (COGs).
In addition to the technical options, the potential gain in the magnitude of GWP and energy demand reduction should be pointed out, as well as an economic evaluation of the COGs structure needed in relation to the world market and competitors. About 90 percent of German pharmaceutical companies have less than 500 employees.
Bundesministerium für Wirtschaft und Energie (BMWi; English: Federal Ministry for Economic Affairs and Energy)-funded projects have provided the option to develop such technological changes in manufacturing for about 10 years. Any transfer into regulated industries is long-term and requires substantial efforts to validate and approve such new technologies [21]. About 60–90% of efforts are dedicated to the downstream direction [22,23,24]. Therefore, any research starts here.
From 2012–2015 the project Energieeffiziente Prozesse durch Mikro-Trenntechnik (EProMit; English: Energy-Efficient Processes by Micro-Separation Technology) has been focused on process intensification in the downstream processing and the development of milli-structured devices for distillation, extraction and membranes for application in main unit operations [25]. From 2016–2019, Traceless Plant Traceless Production (TPTP) has extended the work towards complete processes, because any industrial application needs to be evaluated in total, by adding the missing unit operations, chromatography, precipitation/crystallization and lyophilization for final product preparation before formulation, filling and finishing. As a logical consequence, any innovation has to be proved by piloting studies. Therefore, at first, upstream processing unit operations were included in fed-batch and continuous perfusion fermentation for biologics, and solid–liquid extraction processes for botanicals. As such, upstream and downstream process integration could provide any feed-based lot operation with the potential for autonomous process operation.
Process design has been shown to accelerate via a model-based approach, integrating the quality-by-design approach demanded by regulatory authorities [26,27]. Digitalization with digital twins and autonomous process operations aided by advanced process control methods are thereby prepared. Nevertheless, any theory has to be validated experimentally for proper industrial decisions. Therefore, final model validation has been shown successfully by pilot studies for botanicals [28,29,30,31,32] and biologics [33]. Botanicals show the highest improvement potential by yield improvements (60–80%), organic solvent substitution (water-based pressurized hot water extraction (PHWE)) and solvent reduction by reducing the process time (factors 5–20) resulting in significant COGs (factors of two to 10) and GWP (factors of four to 20) reductions [27,33].
Biologics manufacturing has been improved drastically in terms of COGs (five to 10) and GWP (five to 10) [34]. Consequently, as a final step, only needed before broad industrialization, any prototype operation has to be proven valid for industrial decision makers who have a natural tendency towards a conservative modest technical imagination ability and total risk avoidance in such strictly regulated industries [35]. In this study, the potential for a reduction in energy and GWP has been analyzed by assessing the status quo and using data from the literature, as well as BMWi-funded project results, in order to identify the most important activities needed in research and industry to reach the goal of climate neutrality.

2. Biologics

2.1. Overview and Current State of Biologics

The effort to reduce greenhouse gas (GHG) emissions has been steadily gaining momentum in recent decades. A major milestone was reached in 2015 by the Paris Agreement [36] to stop global warming, which was then adopted worldwide, e.g., by the Obama administration’s Clean Power Plan [37] and Germany’s Federal Climate Change Act (Bundes-Klimaschutzgesetz) [2], which forces the government to take action to ensure CO2 neutralilty by the year 2050.
Germany’s GHG emissions accounted for a total of 805 million tons in 2019 (down from 1251 million tons in 1990; see Figure 1), which was about 2% of the worldwide emissions [1]. The German industry directly contributed 23.3% to the overall emissions in 2019 [2]. It is also the largest end energy consumer with 736 TWh or 29.5% (total end energy demand in 2019 was 2499 TWh) [38]. Including these indirect emissions, the contribution of the industry sector to Germany’s overall emissions was estimated by VCI to be 36.3% in 2017 [3]. The energy demand of the chemical–pharmaceutical sector is about 20% [3]. To reach the goal of climate neutrality by 2050, Germany must reduce its emissions by 54–56% compared to 1990, down to 543 million tons in 2030, as can be seen in Figure 1.
However, in the past decade there was neither a decrease in emissions nor energy demand in this sector. The development of CO2 emissions and the energy demand of the pharma sector alone is shown in Figure 2. Approximately 1.9 Mt CO2 was emitted by pharmaceutical production in 2017, not counting other GHG emissions [6], while the pharma sector’s energy demand stayed constant overall at 6.57 TWh in 2017 [7].
These numbers are in good agreement with global GHG emissions by the pharma industry, estimated to be about 52 Mt CO2eq globally [39]. Extending the scope by accounting for indirect energy related emissions [40], the total GHG emission of the pharma industry is much higher and has recently been highlighted by China’s pharma industry GHG emissions alone, which were calculated as 55.34 Mt CO2 in 2016 [41]. All data sets suggest that the pharmaceutical industries’ GHG emissions are actually increasing rather than decreasing due to increasing drug demands worldwide.
Biologics make up about 30% of the pharmaceutical industry market. The world pharmaceutical market is estimated to be EUR 1.2 billion in 2018, with about 44% US market and 24% Germany sales [42]. The industry is dominated by global players, so-called big pharma, due to high investments and high risks of failure in costly clinical trials [43].
Technical trends are transferred from traditional batches to continuous manufacturing [42], Green Chemistry [44] and biotechnological drugs. Societal needs for innovative medicines and sufficient supplies at moderate costs due to healthcare system limitations are accepted without discussion [45]. Recent studies perpetuating the belief that there is no need for improvement in such a small industry do not benefit the global situation and are wrong, for example:
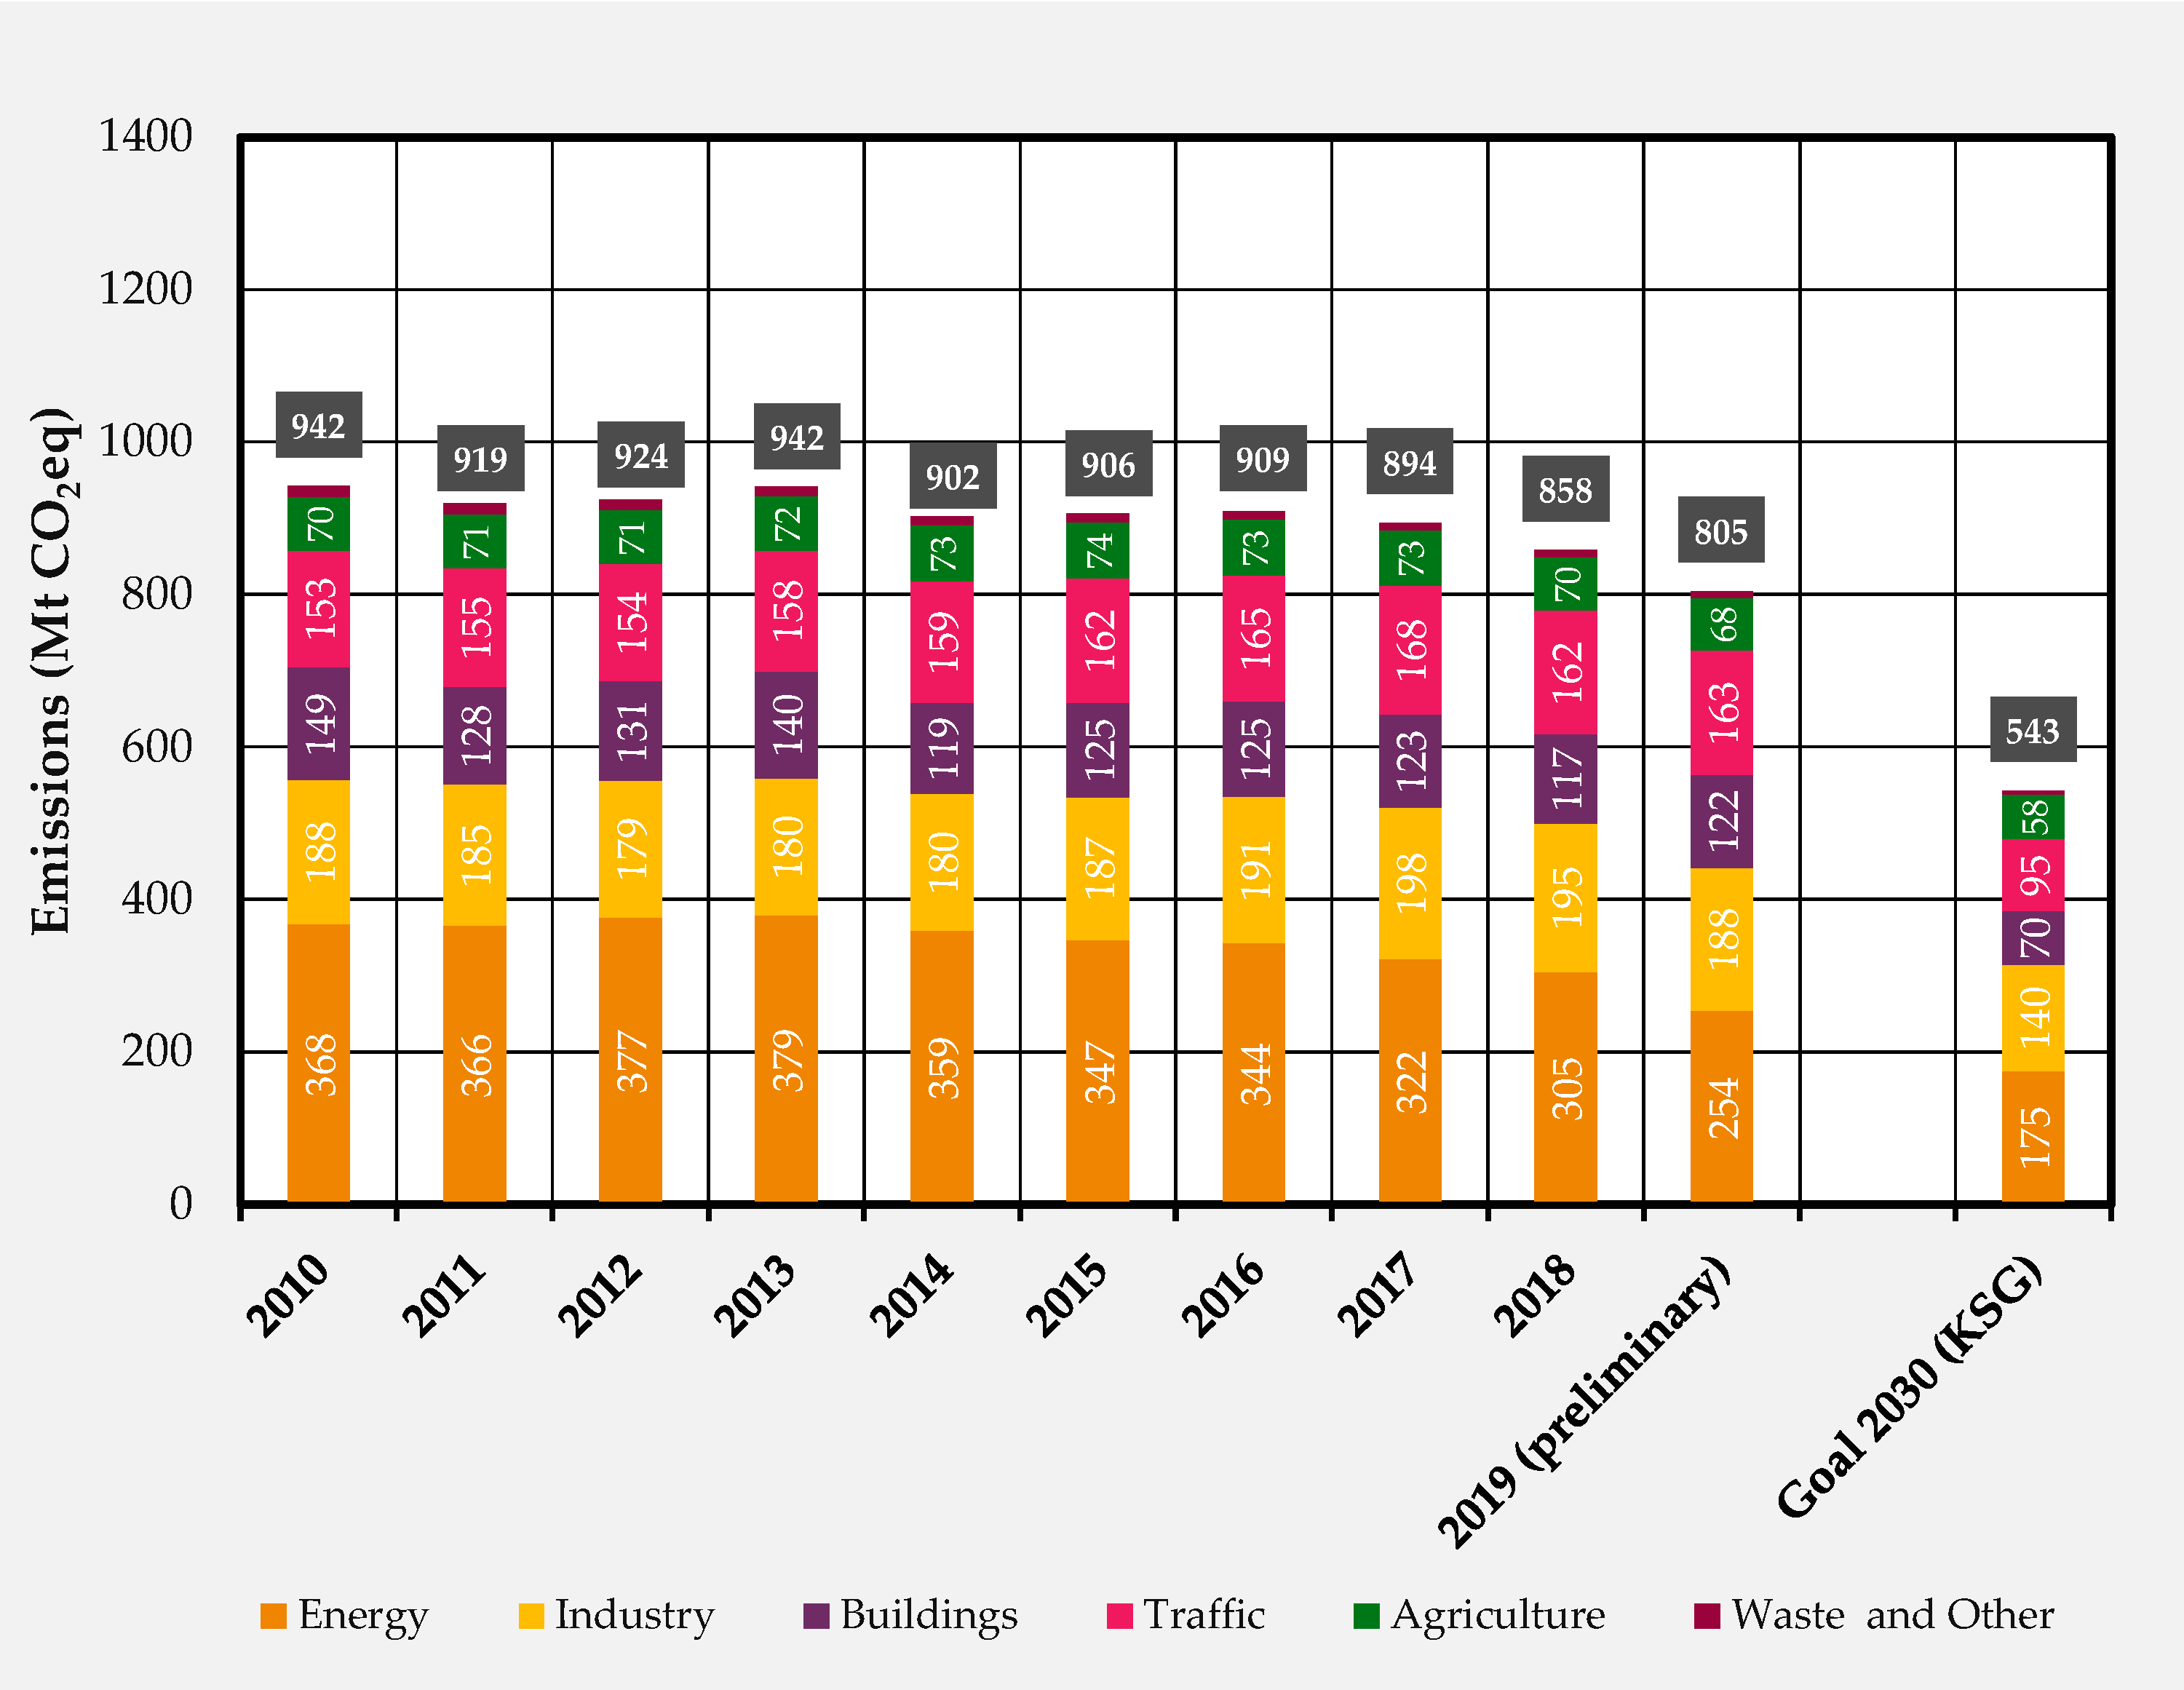
  • Single-use plastic items are forbidden and reduced in daily life; in biotech manufacturing, however, they are booming due to single-use technology, advantages in cleaning efforts, personal resources and flexibility in various batches and products, as well as costs [46].
  • Other studies point out that the pharmaceutical industry is inefficient compared to automotive manufacturing [47]: “The total global emissions of the pharma sector amounts to about 52 megatonnes of CO2e in 2015, more than the 46.4 megatonnes of CO2e generated by the automotive sector in the same year. The value of the pharma market, however, is smaller than the automotive market. By our calculations, the pharma market is 28 percent smaller yet 13 percent more polluting than the automotive sector”.
Biologics manufacturing is most often characterized by the monoclonal antibody (mAb) production platform process, as mAbs make up about 50% of all biologics. In many studies, the energy demand and environmental impact of biologics manufacturing have been evaluated by life cycle assessment; water for injection (WFI) has consistently been identified as a key factor [47,48,49,50,51,52,53,54]. While they are mostly used for chromatographic steps, typical product-specific volumes of cleaning-in-place (CIP) and sterilizing-in-place (SIP) are in the range of 4–20 m3WFI/kgmAb [48,50,55,56,57,58].
Idris et al. showed that, for a large-scale 20 m3 mAb process (titer 2 g/L), 1.9 m3WFI/kgmAb is used just for Protein A chromatography [50]. Overall process WFI usage accumulated to a total of about 4 m3WFI/kgmAb, so Protein A chromatography usage was about 47%, marking it, by far, the most GHG emission-intensive unit operation. In addition, the subsequent ion-exchange (IEX) and hydrophobic interaction chromatography (HIC) accumulates to a total of 3 m3WFI/kgmAb. However, in batch processes, the chromatographic steps can make up about 75% of the total WFI usage. Sinclair et al. also investigated the environmental impact of biologics manufacturing in detail with the example of mAb platform processes [47]. Again, Protein A chromatography had the biggest environmental footprint of all unit operations, though CIP/SIP (globally, across all unit operations) was the biggest contributor to GHG emissions and energy demand. When assessing all known studies in the literature, we found that the production of 1 kg mAb is estimated to cause between 3500 and 5000 kg of CO2eq, accompanied by a specific cumulative energy demand (CED) between 10 and 20 MWh/kgmAb. To put these numbers into perspective, we can look at the most common products made by the chemical industry.
Table 1 summarizes the GWP and energy demands of different production methods for hydrogen, ammonia, urea, and methanol. Their emissions, as well as energy usage, are about 1000 times smaller compared to mAb production. Even if the economy of scale and larger quantities must be considered in this context, it cannot be denied that the pharma sector, especially in the case of biologics manufacturing, is in urgent need of improving its process efficiency, as every sector in Germany is obliged to contribute to the goal of climate neutrality. To evaluate the potential in reducing GHG emission and energy demand, the status quo needs to be assessed. Then, a test model can be developed, which must be validated in terms of its sensibility regarding the input of estimated data.
With a return of EUR 4500 million just for biotech-dedicated enterprises and EUR 11,400 million for biopharmaceuticals in Germany (2018), biologics make up about 10–20% of the pharma market returns in Germany [59]; therefore, emissions related to biologics manufacturing in Germany can be estimated to be about 0.2–0.4 Mt CO2eq/a, while the energy demand can be estimated to be 0.6–1.2 TWh/a (based on data in Figure 2). Then, by considering the European and global pharma market share, 1–2 Mt CO2eq/a and 3–6 TWh/a in EU-28, respectively, 5–10 Mt CO2eq/a and 15–30 TWh/a can be extrapolated globally. Reverse calculating the GHG emissions of the total pharma sector globally by the initially introduced factor of five to 10 leads to 50–100 Mt CO2eq/a, which is in very good agreement with the reported data we discussed in the introduction [40,42].

2.2. Technical Project Results for Biologics

After assessing the status quo of biologics manufacturing in Germany and EU-28, it is important to extensively investigate the effect of uncertainty regarding key assumptions in order to analyze sensitivity. Process improvements in terms of yield and WFI strongly influence the footprint of biologics manufacturing. The studied range of process improvements as well as their assumed contribution to GWP and CED are summarized in Table 2. The rationale for the reference parameters as well as a comparison to reported data were already described in the sections above. Here, the rationale for choosing the range of process improvements and their contribution to impact categories are given.
Process improvements, e.g., upstream titer, separation efficiency downstream, as well as by substituting a single or several standard unit operations by innovative technologies, such as aqueous two-phase extraction, have been shown extensively in the literature. The authors showed that process yields can be increased by at least 10–30%. By shifting from traditional fed-batch processing to a complete continuous process will remove most of the need for CIP/SIP, and in combination with more efficient buffer usage, will at least result in a decrease in WFI consumption in the range of 50–70%. Regarding the impact of WFI on GWP and CED, it has already been pointed out that this has been shown to be at least 50%, and considering that WFI is used in every process step, it can be safely assumed that it can contribute up to 90% of overall GWP and CED.
To have the best compatibility with the literature and reported data, we decided to assess the potential for GWP and energy reduction by using the mAb platform process as a representative model system as well. First, the status quo (2020) is compared as discussed above, with model predicted emissions. Model inputs are the range of reference GWP and CED as well as product titer (6 g/L), batch size (12 m3, 6 in parallel), overall process yield (60%), and the number of batches per year (40). The production size is not meant to represent the production of a single product, but rather to cover the biological production volume at a typical representative single-enterprise level. Impact categories from this single-enterprise level were therefore scaled with a factor of 10 to obtain the number of total biologics manufactured in Germany.
The project results for the technical solution are visualized in Figure 3. Improvements in terms of lower COGs by a factor of five to 10, combined with GWP reductions of two to five, were achieved.

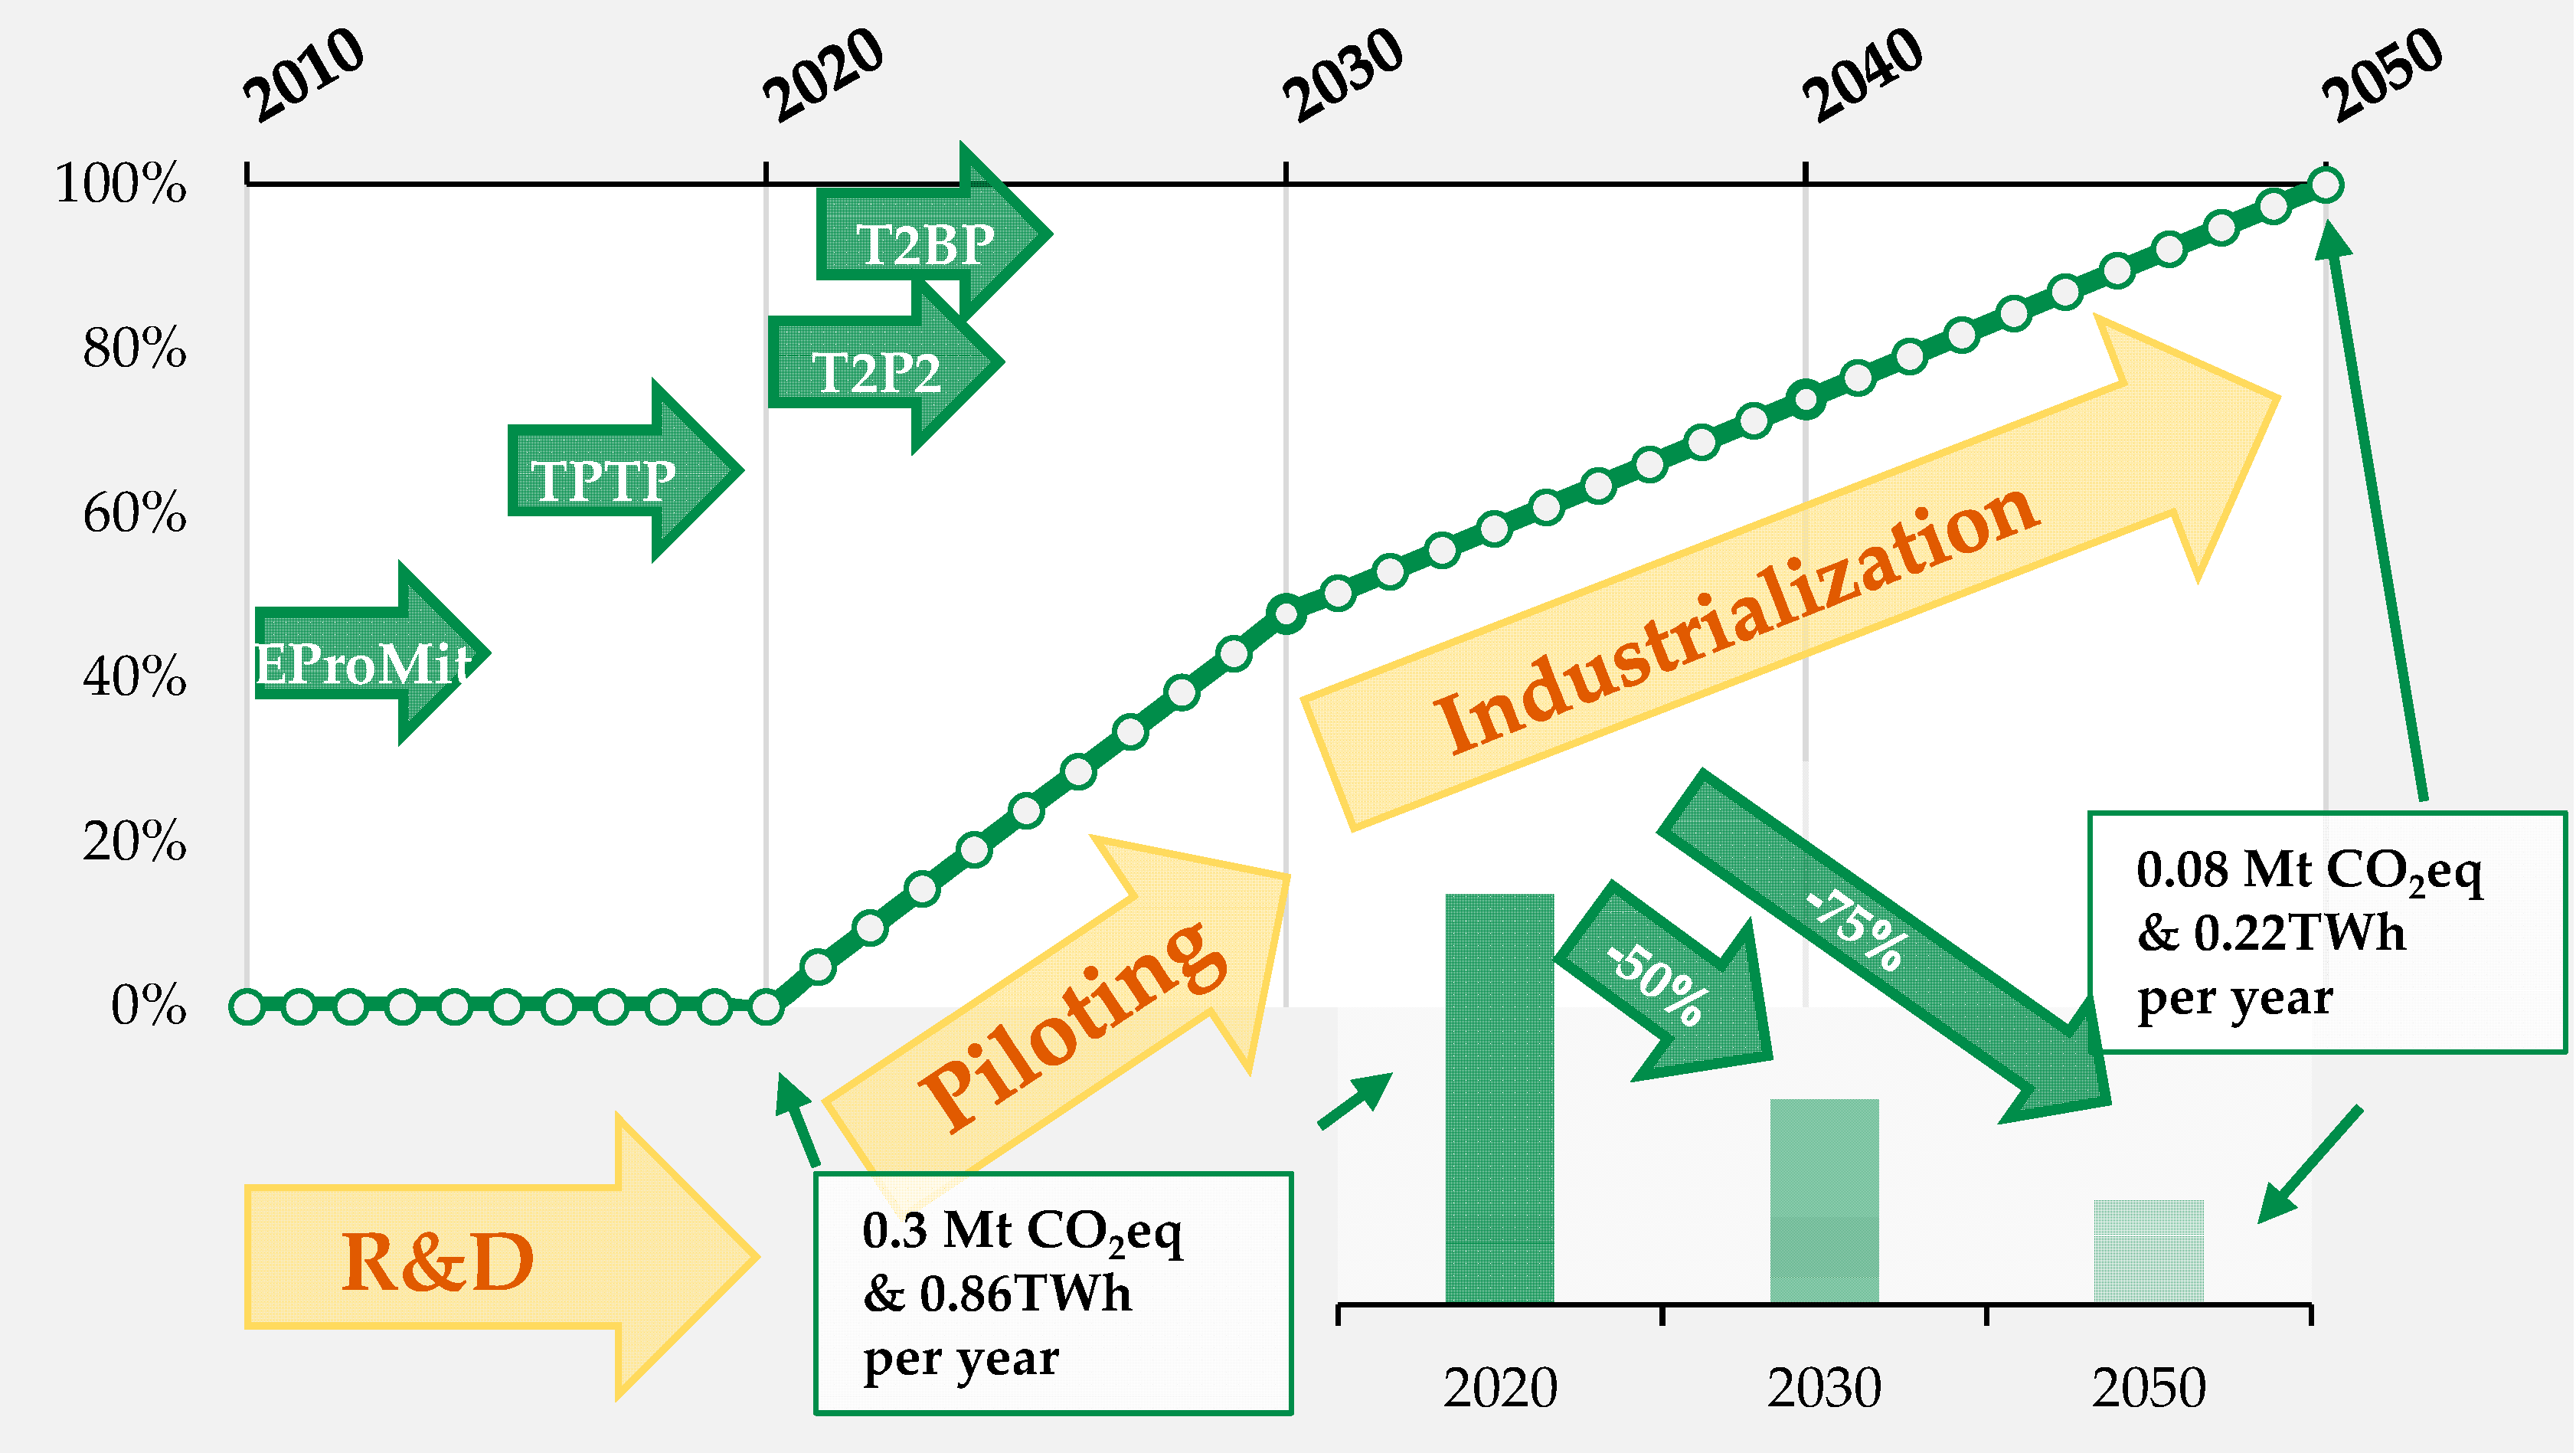
2.3. Industrialization of Biologics

In Figure 4 (GWP) and Figure 5 (CED), the extrapolated values for German biologics in 2020, as discussed previously, are about 0.2–0.4 Mt CO2eq (GWP) and 0.6–1.2 TWh (CED).
Comparing this range to the calculated emissions and energy demand for the year 2020, as shown in Table 3, reveals a very good match for GWP and CED. As model prediction accuracy and precision is given, the development of environmental impact factors over time can be calculated.
To analyze the potential GWP and energy saving in biologics manufacturing, three scenarios are discussed, which cover the complete range of possible impact factors and process improvements. GHG emissions in the year 2020 were assessed to be at least 0.3 Mt CO2eq. When discussing the best-case scenario, it is assumed, for the year 2030, that the goal of cutting down emissions by 50% (as stated in the Climate Change Act) will be reached, which will in fact only be possible if the biologics industry immediately starts to adapt to the presented technology potential. When considering 2030–2050 to be the industrialization period needed by the pharma sector to complete implementations, by the year 2050, biologicals manufacturing could cut down its GHG emissions by 74.4% (0.078 Mt CO2eq/a) compared to the reference year 2020. The cumulative reduction in GHG emissions from 2030 to 2050 in this scenario is 1.056 Mt CO2eq.
When considering what lies between the best- and worst-case scenarios, it is assumed that GHG emissions in 2030 will only be reduced by 25%, due to implementation at a slower pace. Only major improvements will find their way into the industry by the year 2050. Even so, the utilization will reduce GHG emissions by 52.4% compared to 2020. The cumulative emission reduction over the course of industrialization (2030 to 2050) is 0.773 Mt CO2eq.
In the worst-case scenario, we assume that no reduction in emissions will be achieved by the year 2030, which is given for the development shown in Figure 2, and is unfortunately very realistic. In this case, the industry will not have shifted to continuous production and has ignored technological innovations like alternative unit operations, process modeling to operate at optimal conditions, etc. Due to this delay in technology adaption, by the year 2050, biologics manufacturing’s carbon footprint would only be reduced to about 9% compared to 2020. Therefore, the cumulative emission reduction over the course of 2030 to 2050 due to minor efficiency improvements is 0.412 Mt CO2eq.
The last scenario is unacceptable. Industry, as well as the government, need to promote the development and industrialization of process achievements, as shown in academia, if there is to be any hope to fully achieve the Climate Change Act goals. Great progress has already been made in the chemical industry; now the pharma industry needs to catch up.
The roadmap for achieving climate-neutral biologics manufacturing is shown in Figure 6. Staring with the demonstration of proof-of-principle and then validation (EProMit 2012–2015 as well as TPTP from 2016–2019), the next necessary project phases prior to industrialization will be to present pilot studies for biologicals (Total Traceless Biologics Plant (TTBP)) as well as botanicals (Total Traceless Phyto Plant (T2P2)).

3. Botanicals

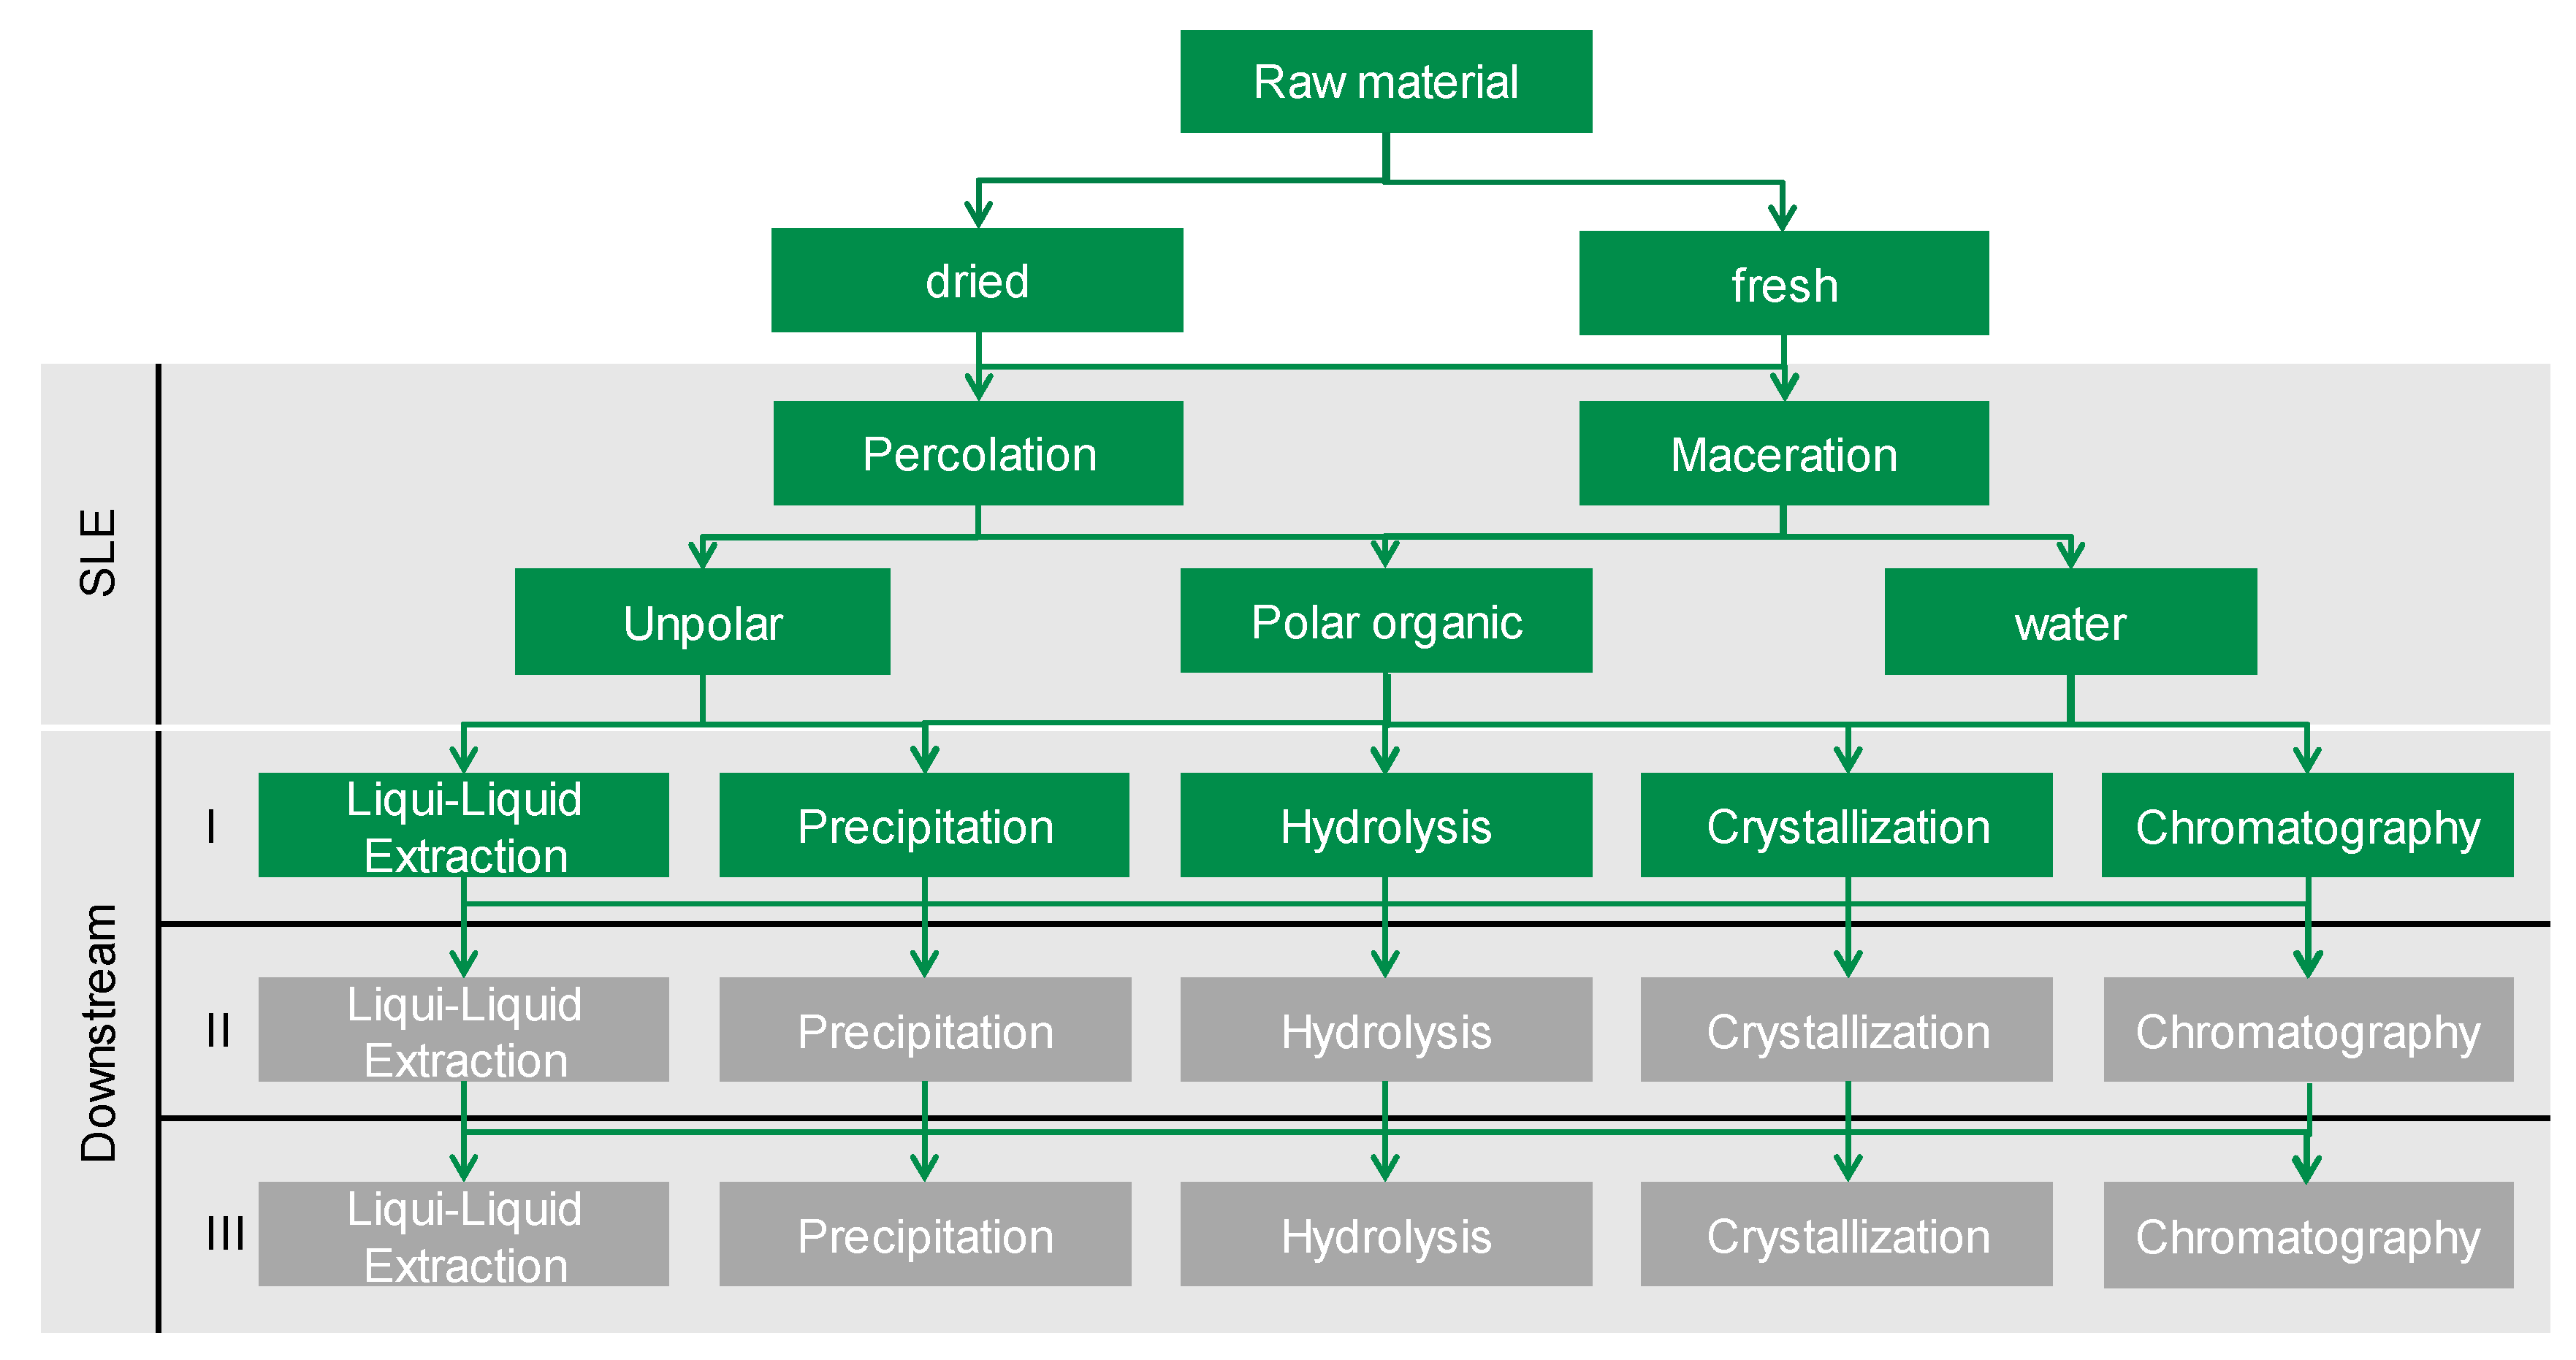
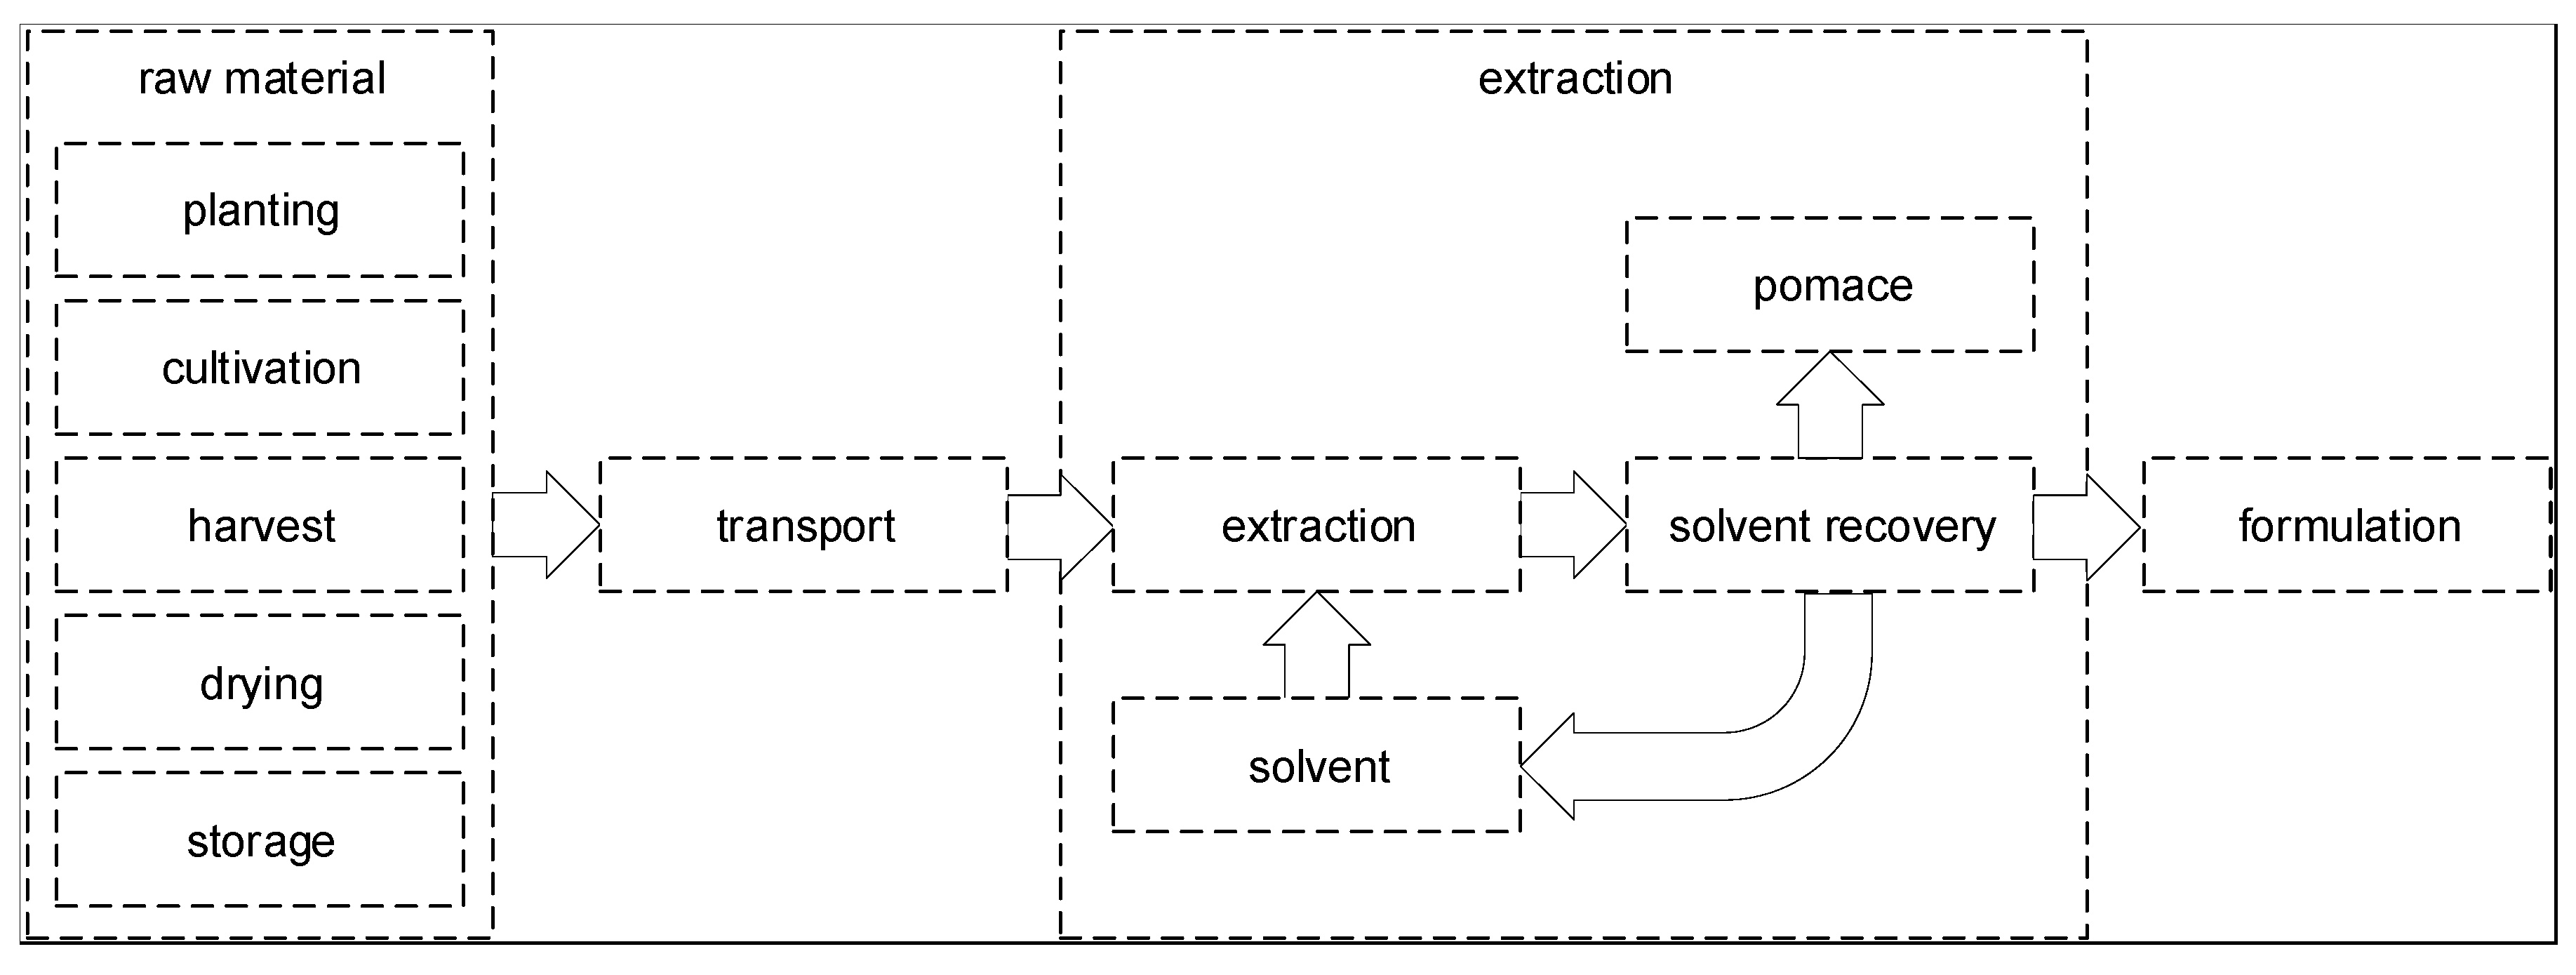
3.1. Overview and Current State of Botanicals

The annual global herbal medicine market is estimated to be EUR 130 billion with a share of 55% belonging to herbal pharmaceuticals. Japan and China share about 50% of the market. The annual growth rates are still about 5–7% due to the common trend in natural products [43,60]. Even so, about 5% of active pharmaceutical ingredients are natural and about 23% are of natural origin with synthetic modifications [61]. Germany has about 12,000 ha of medicinal plant cultivation areas, which need to be increased towards 20,000 ha as 80% of the country’s raw material is imported with about 750 companies involved [62,63].
There are two scenarios for the reduction in CO2 emissions from plant material, either dried or fresh (Figure 7). Currently, dried plant parts are used for the extraction of plant ingredients. After harvesting, these parts are dried for storage up to a maximum residual moisture of 7%.
The supply chain for herbal raw materials has a major influence on the CO2 footprint of the process, which must be balanced (Figure 8).

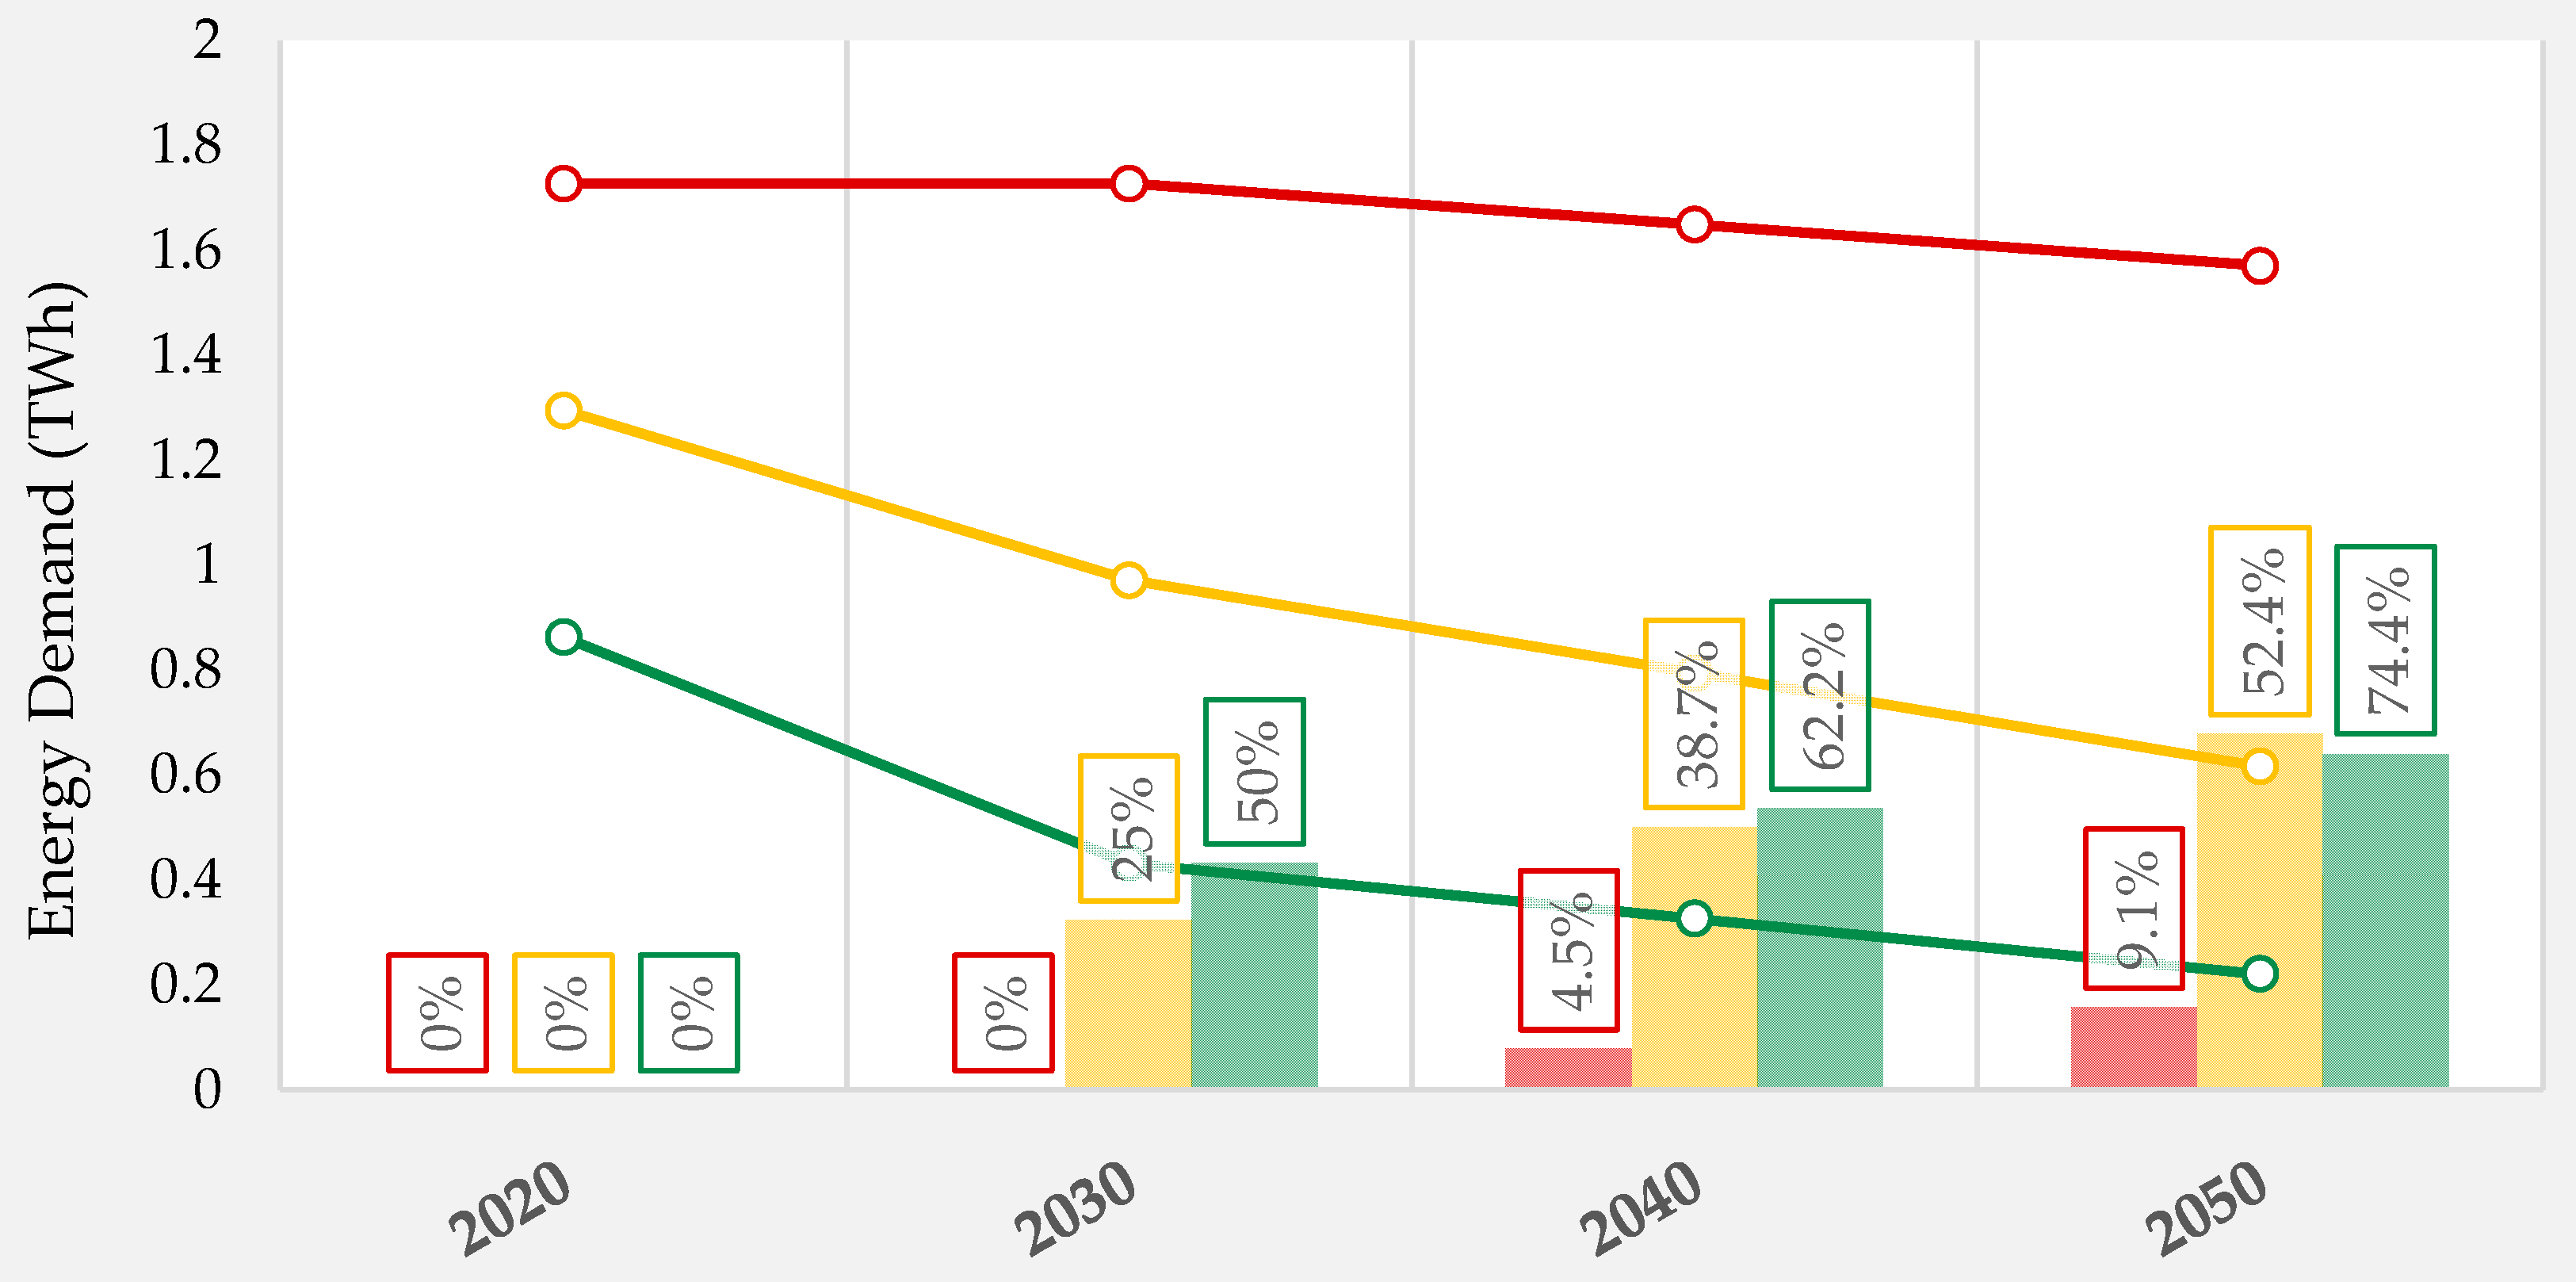
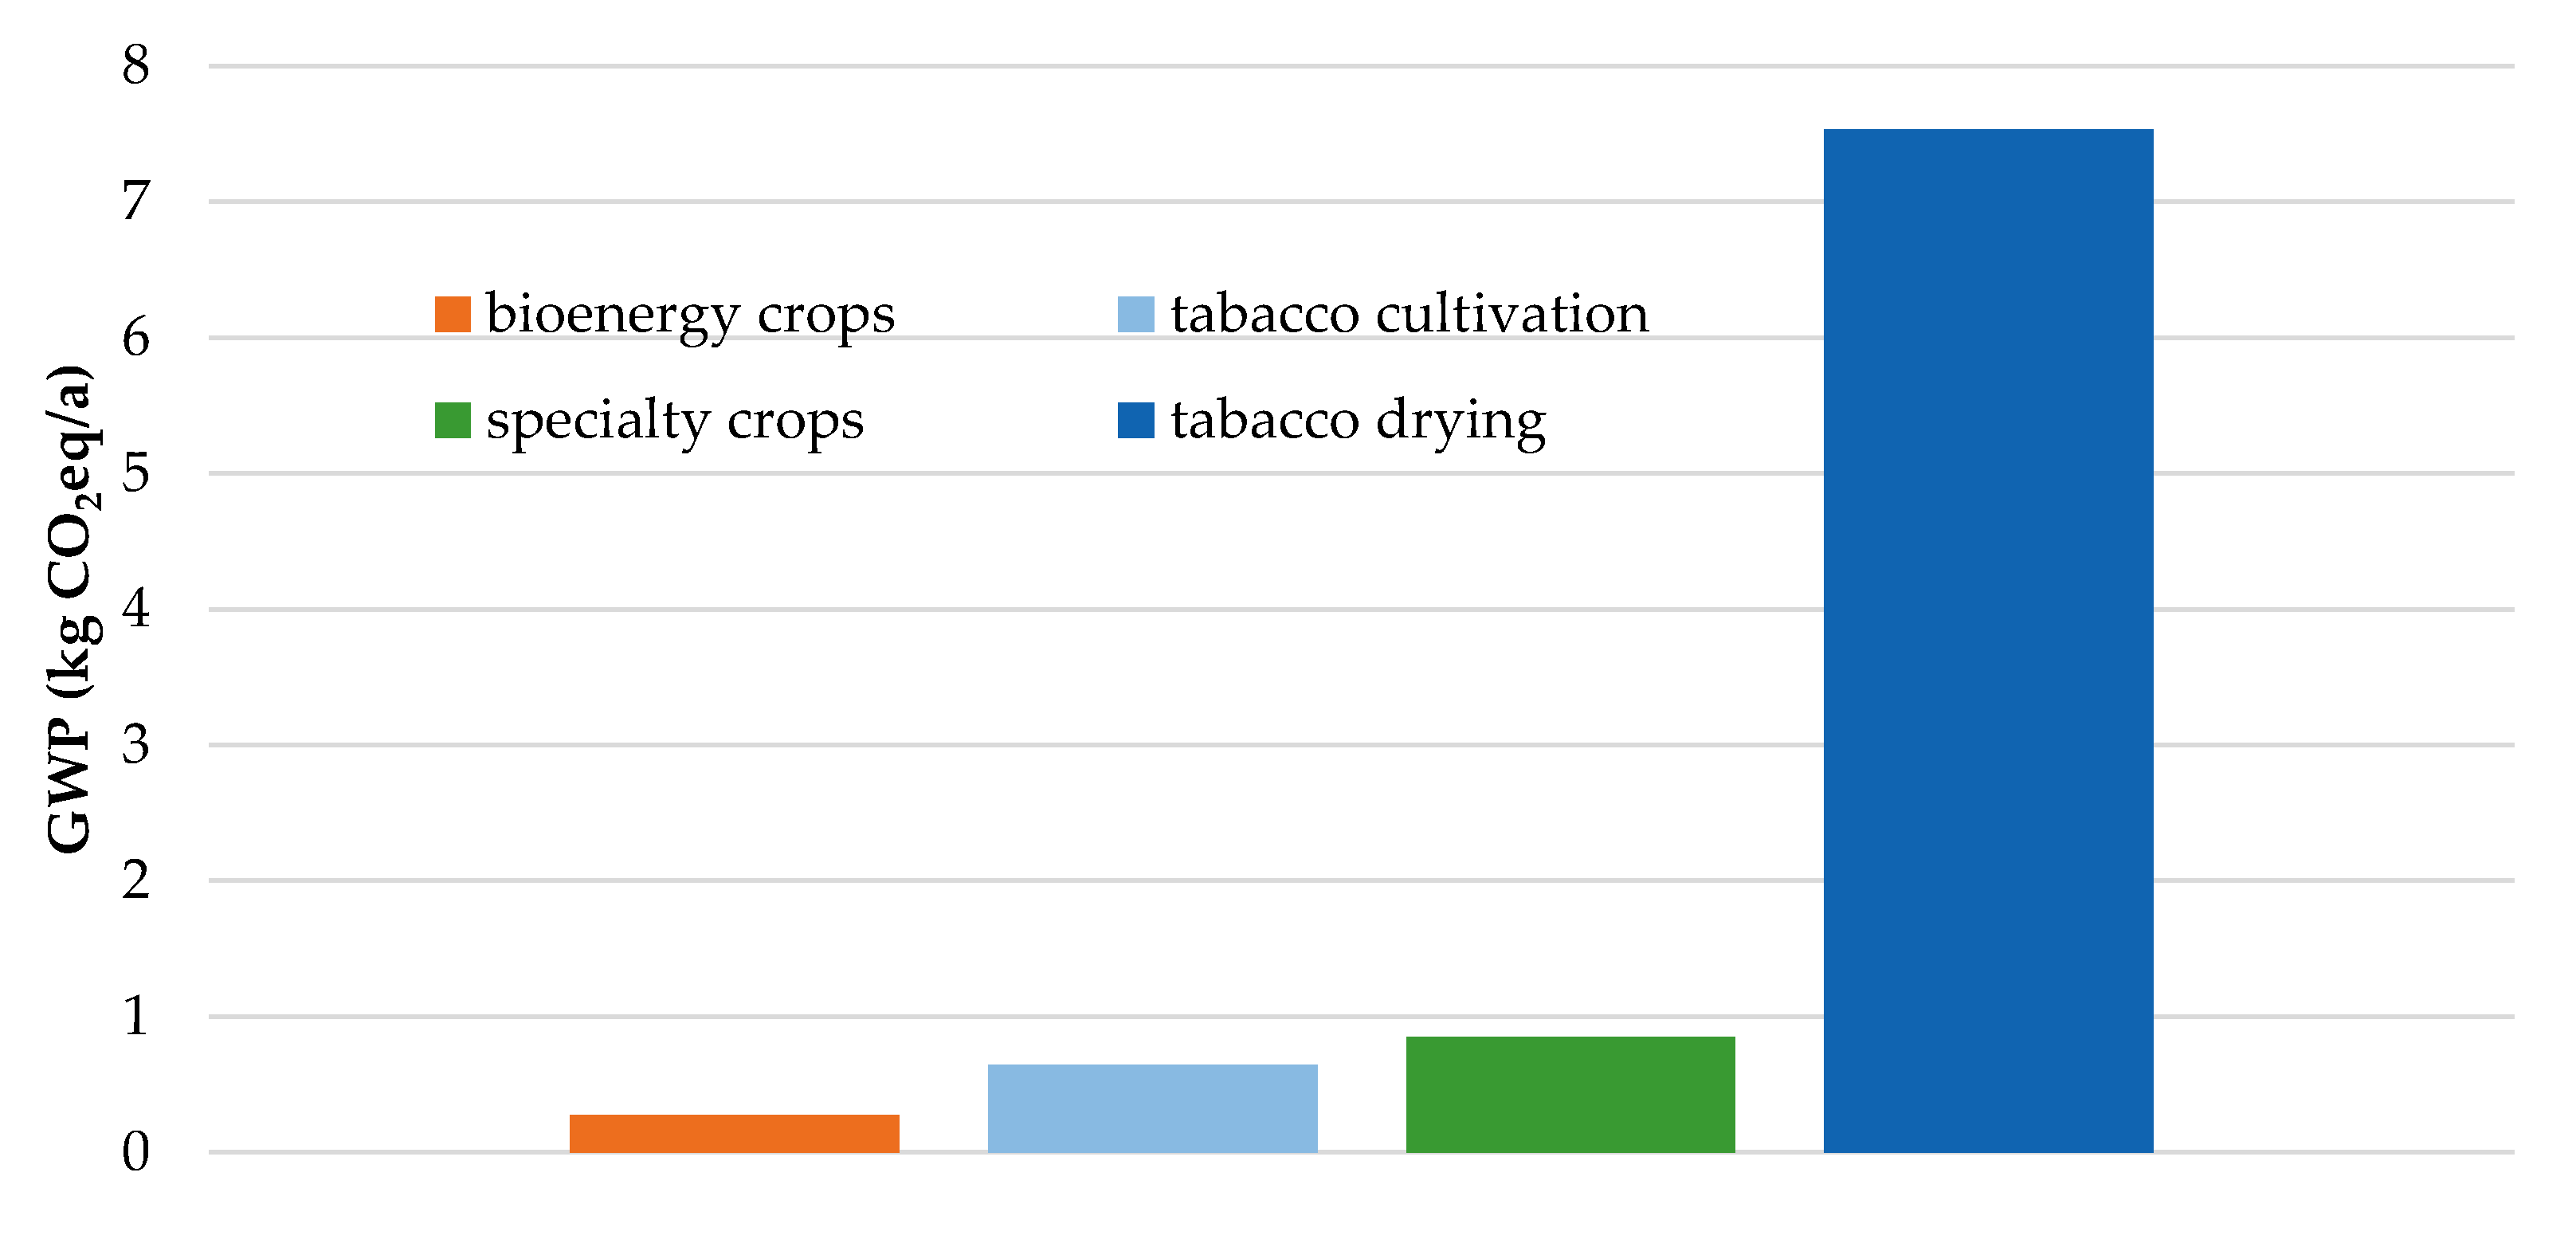
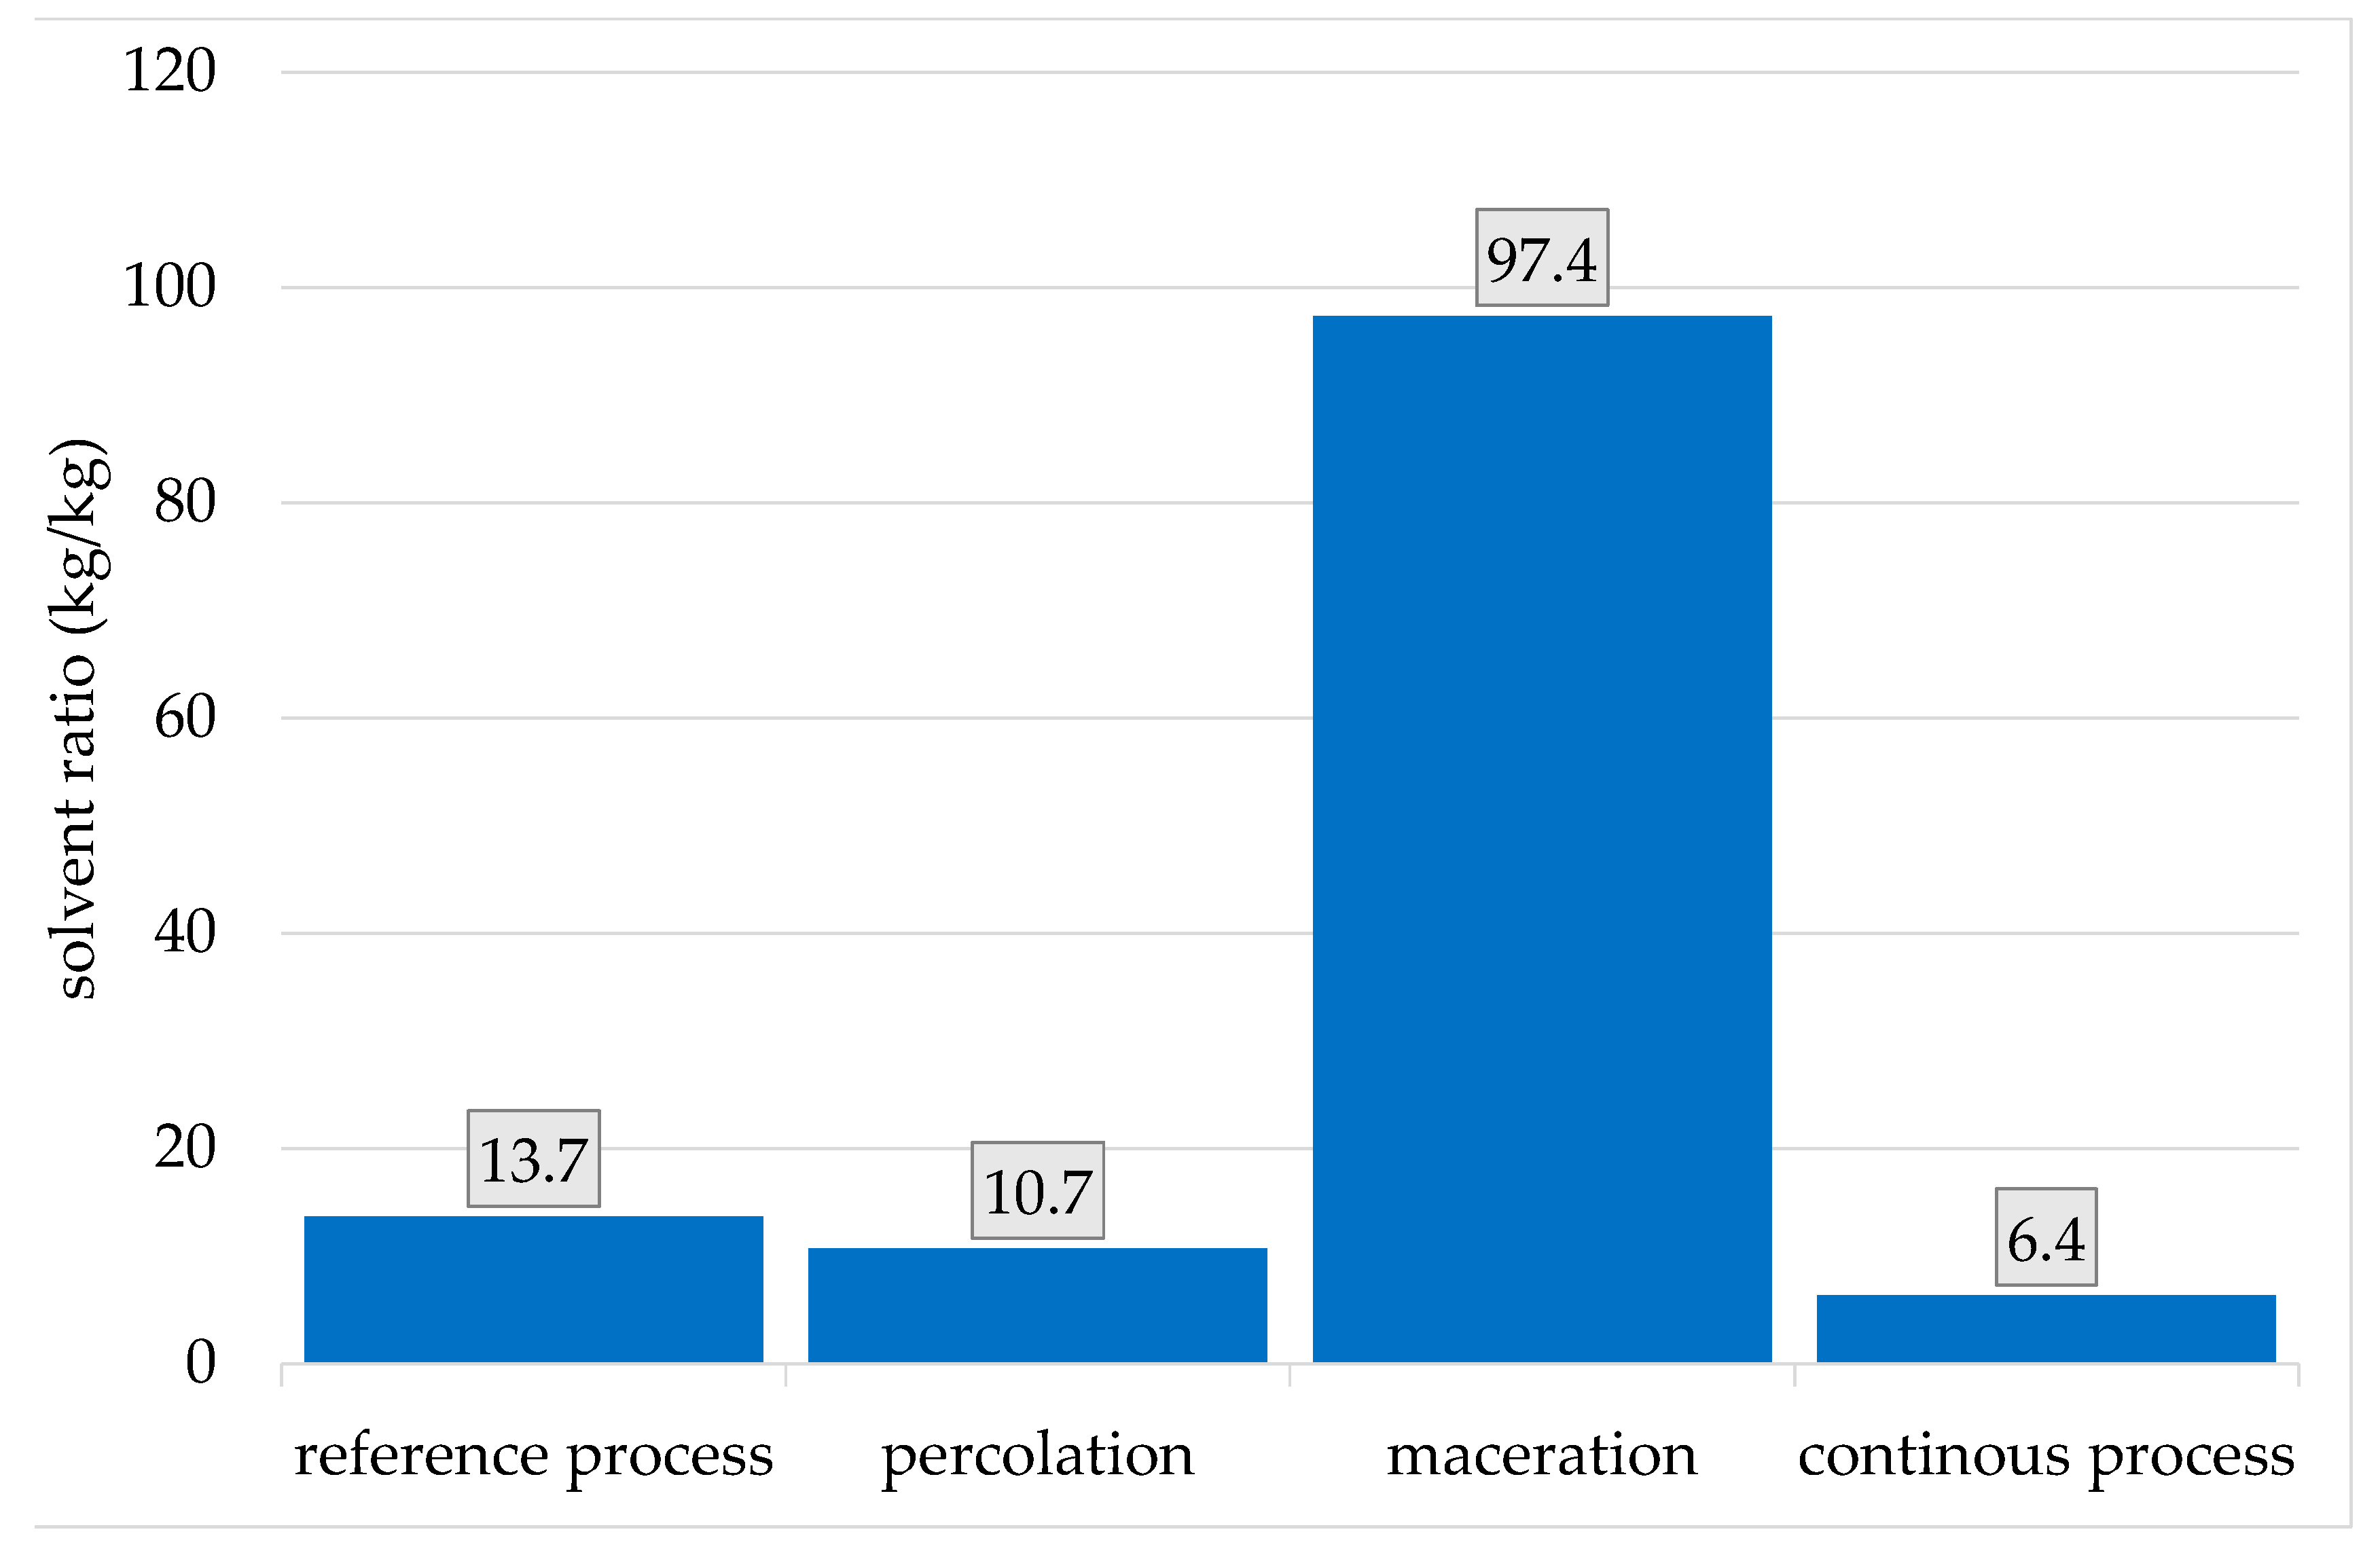
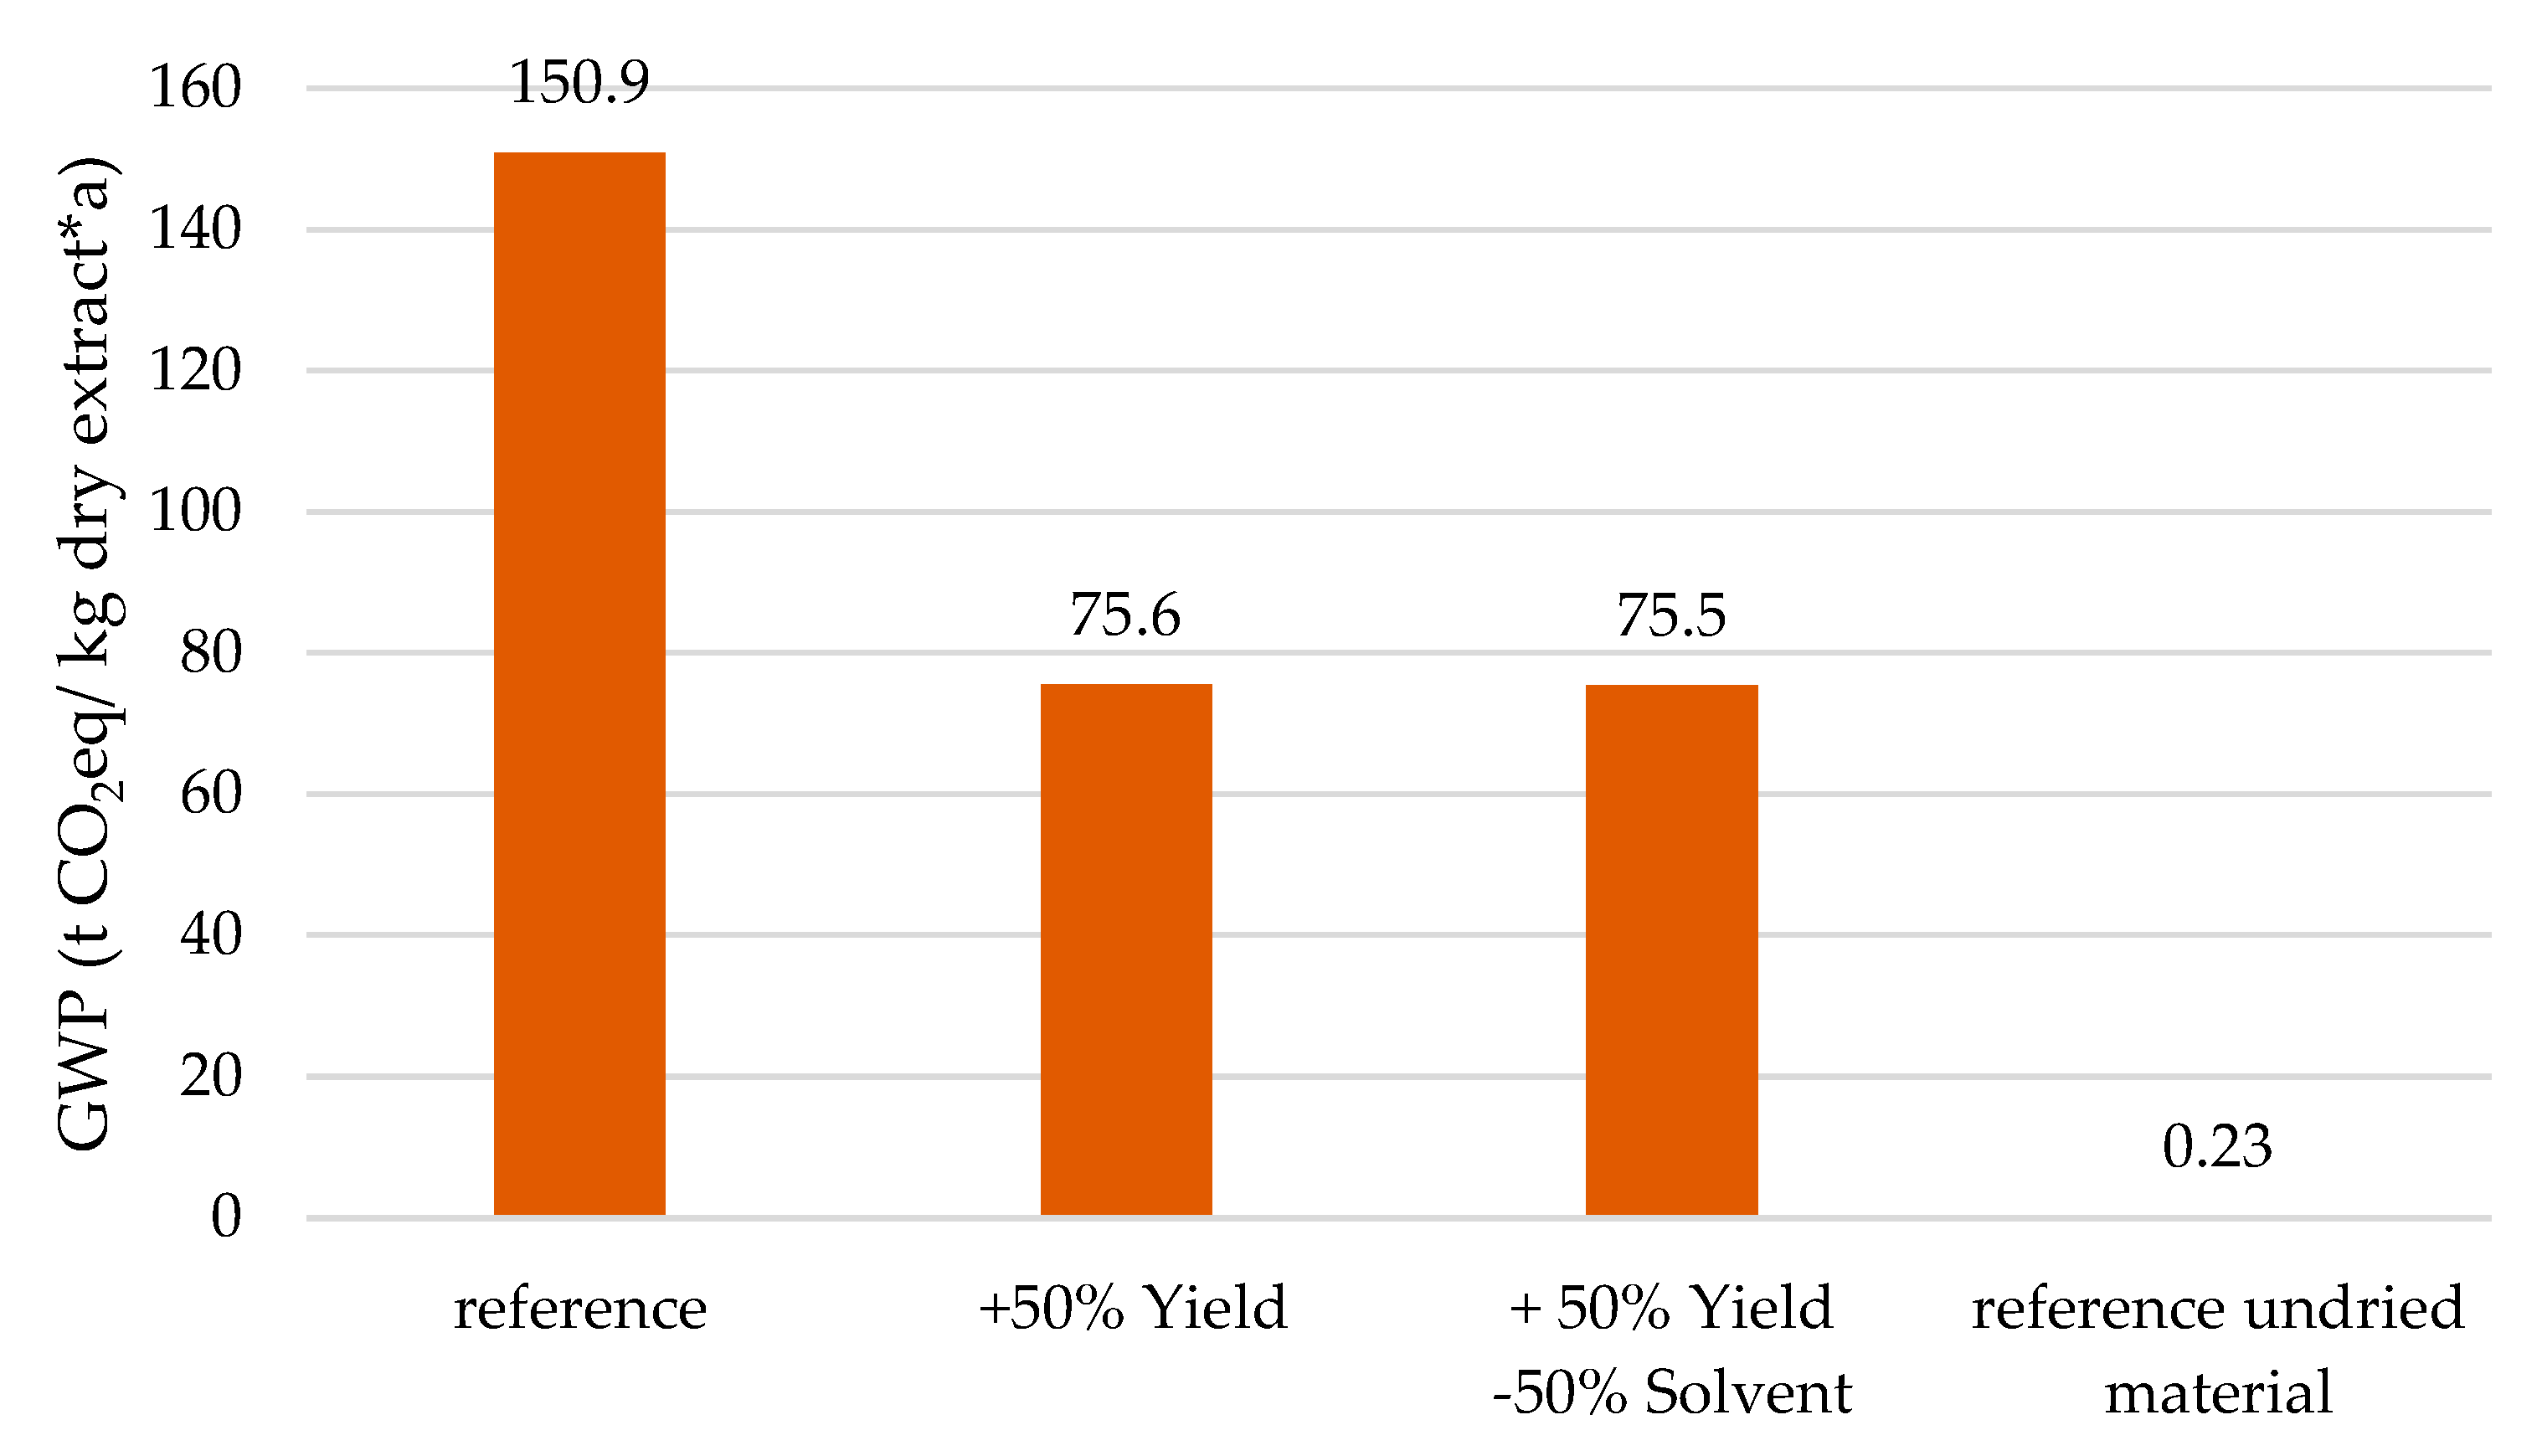
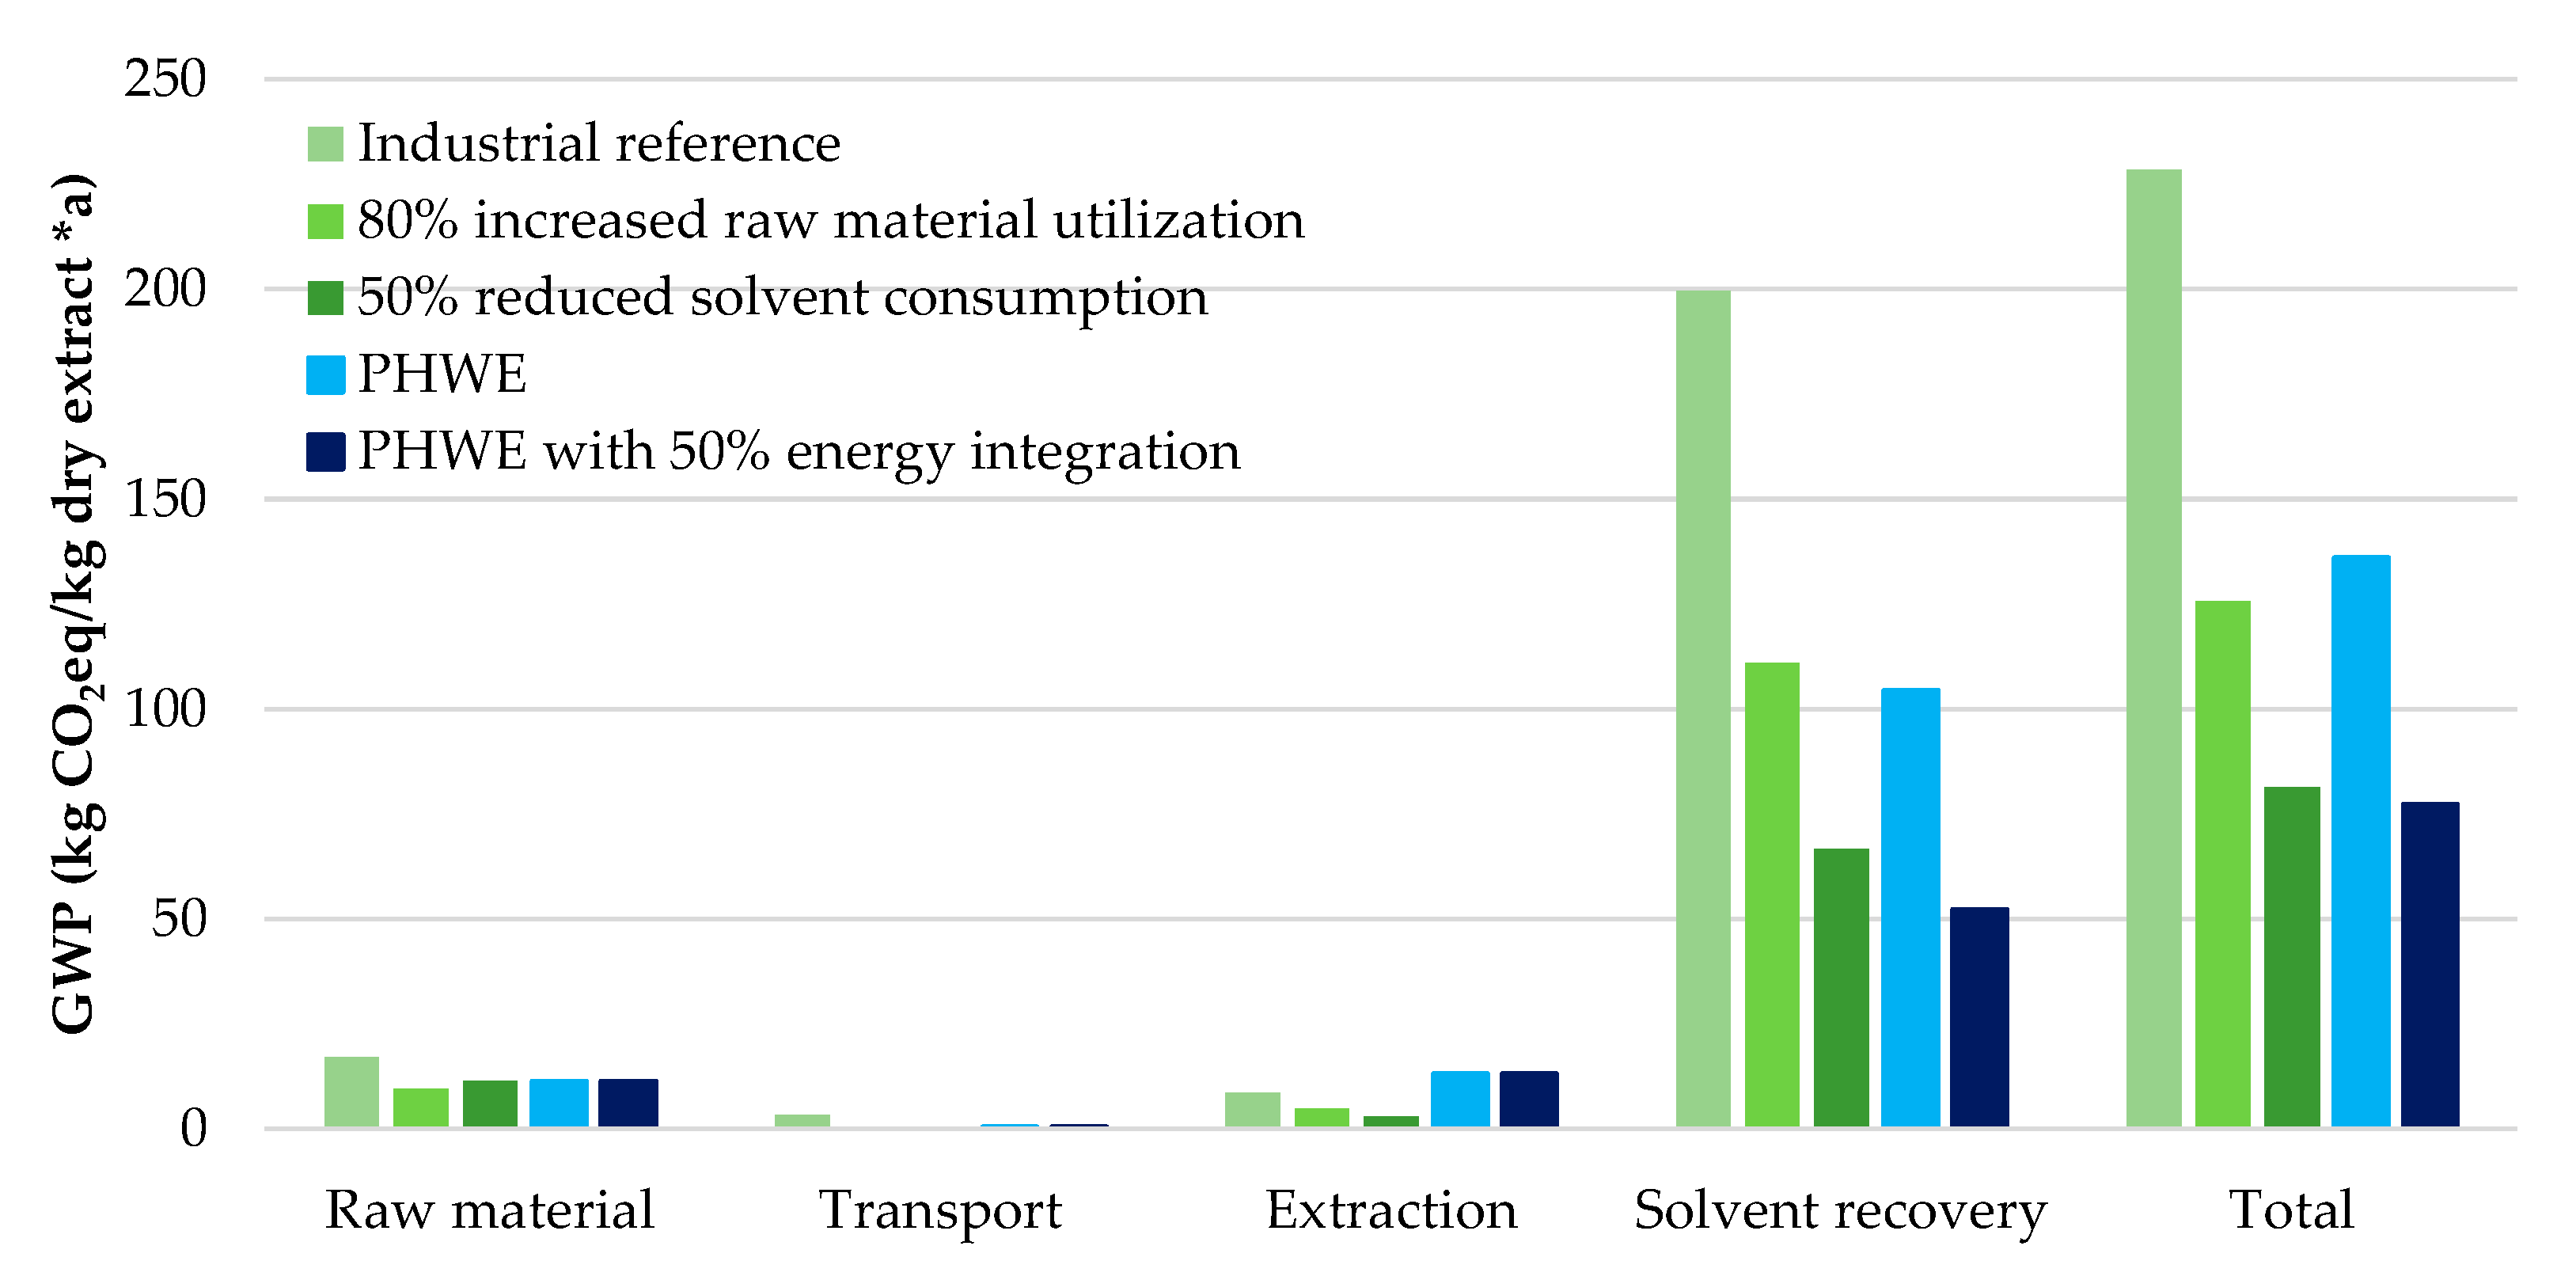
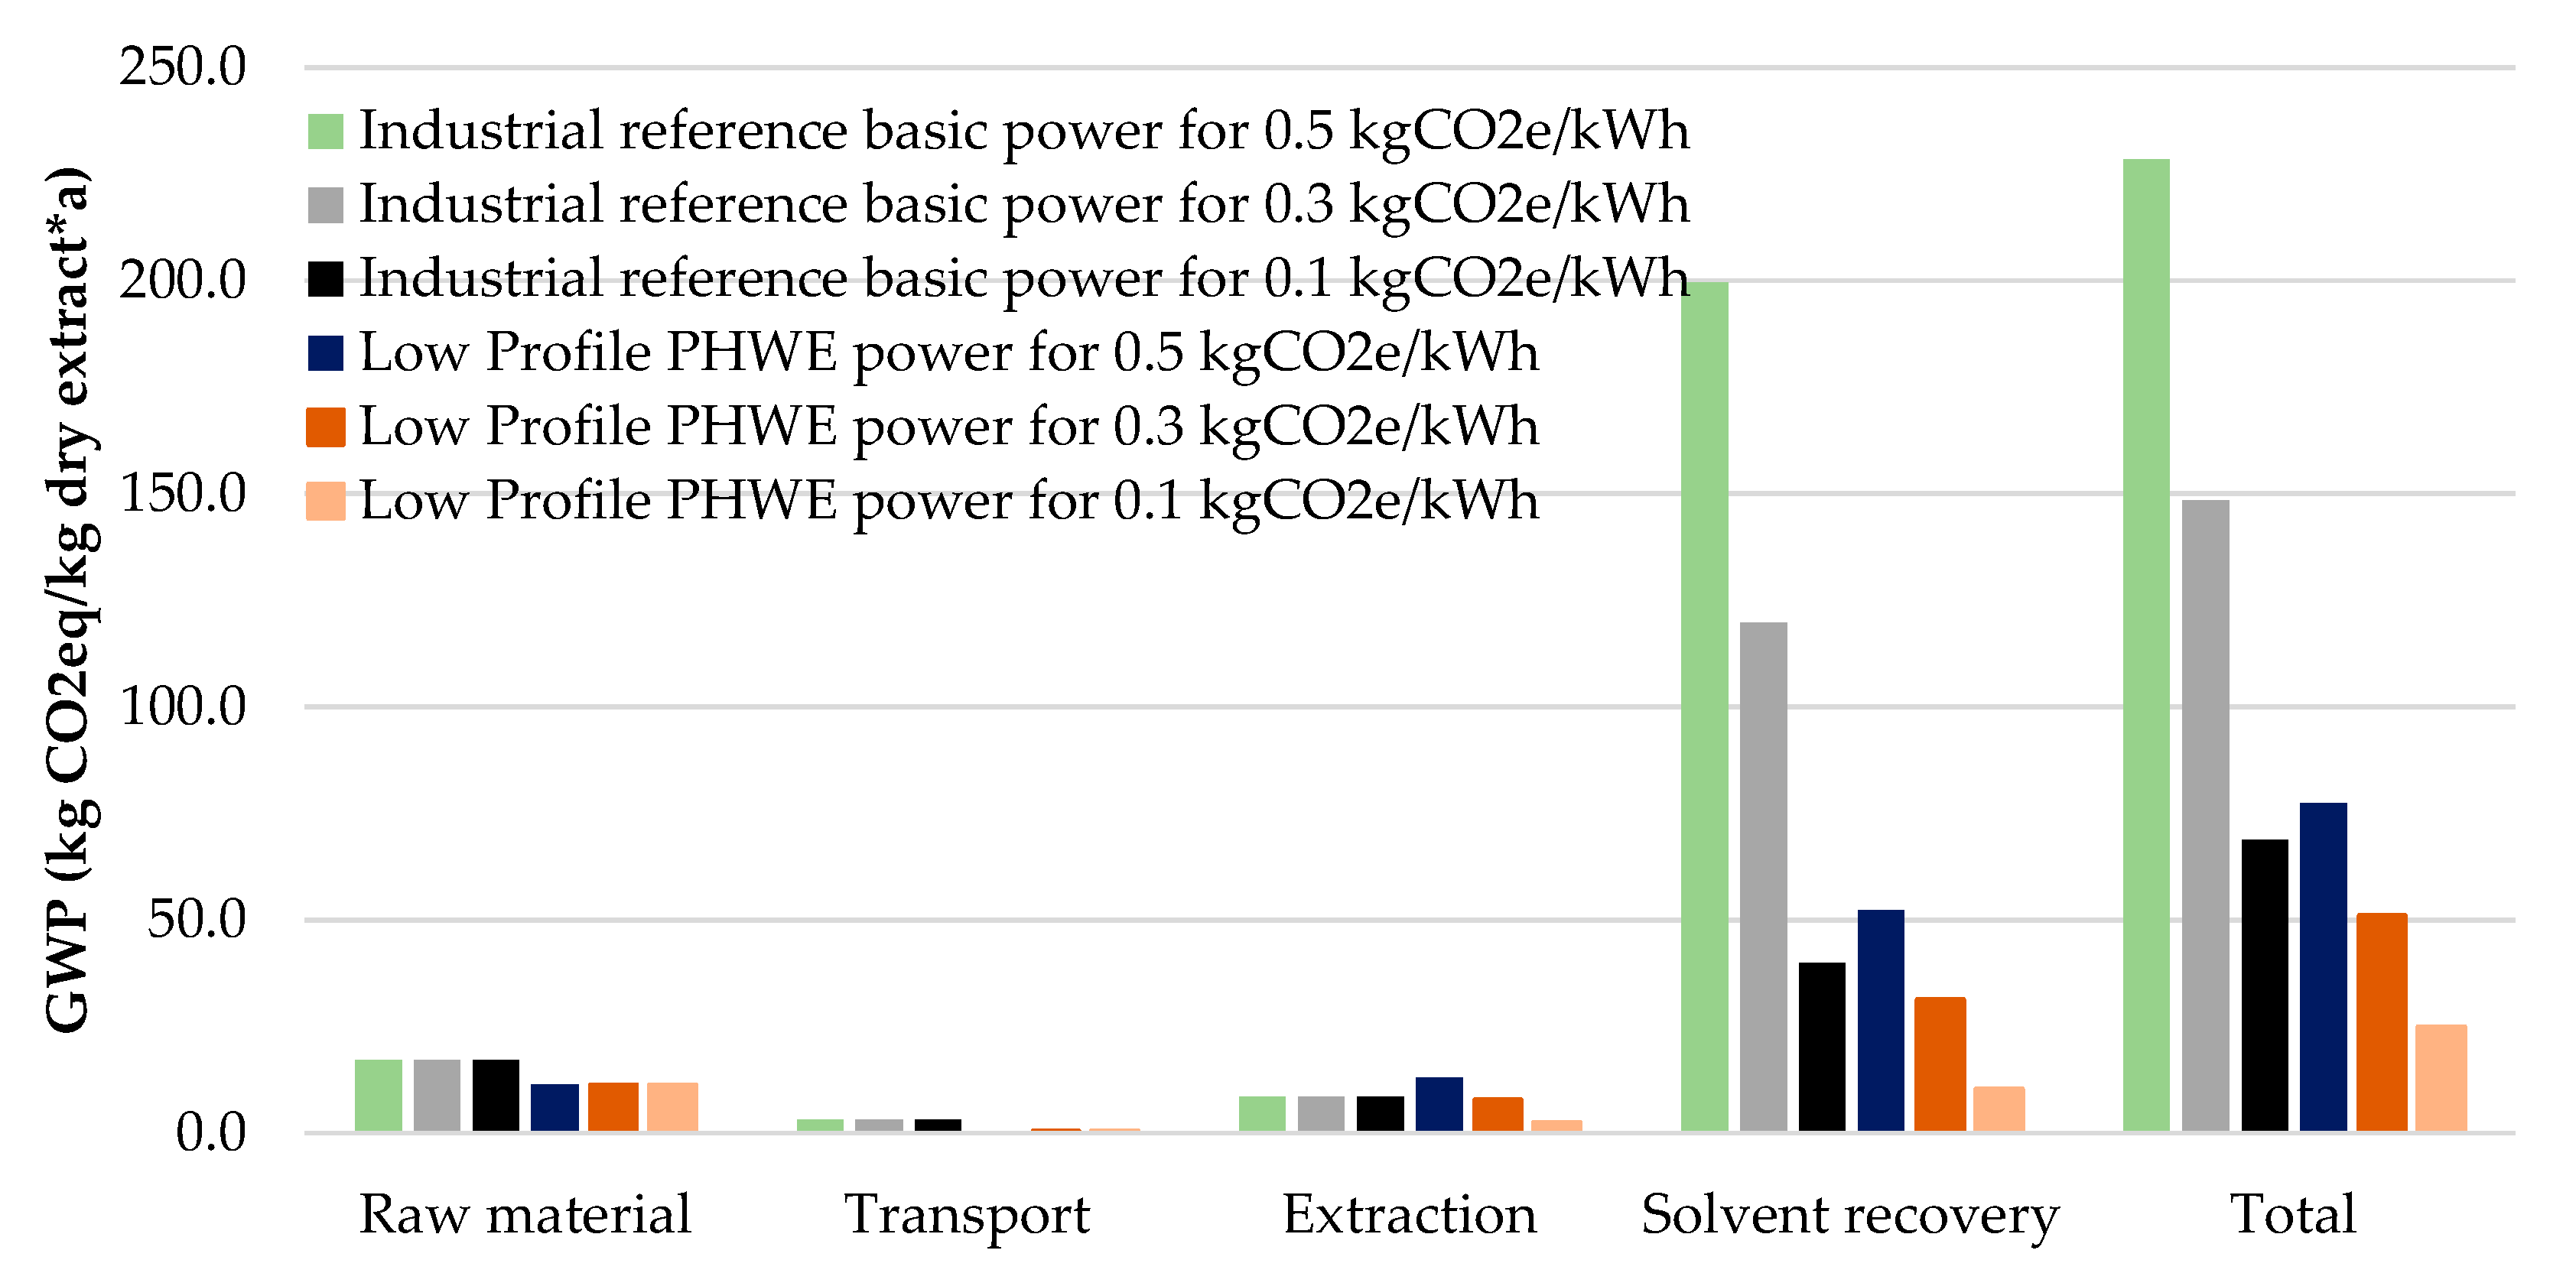
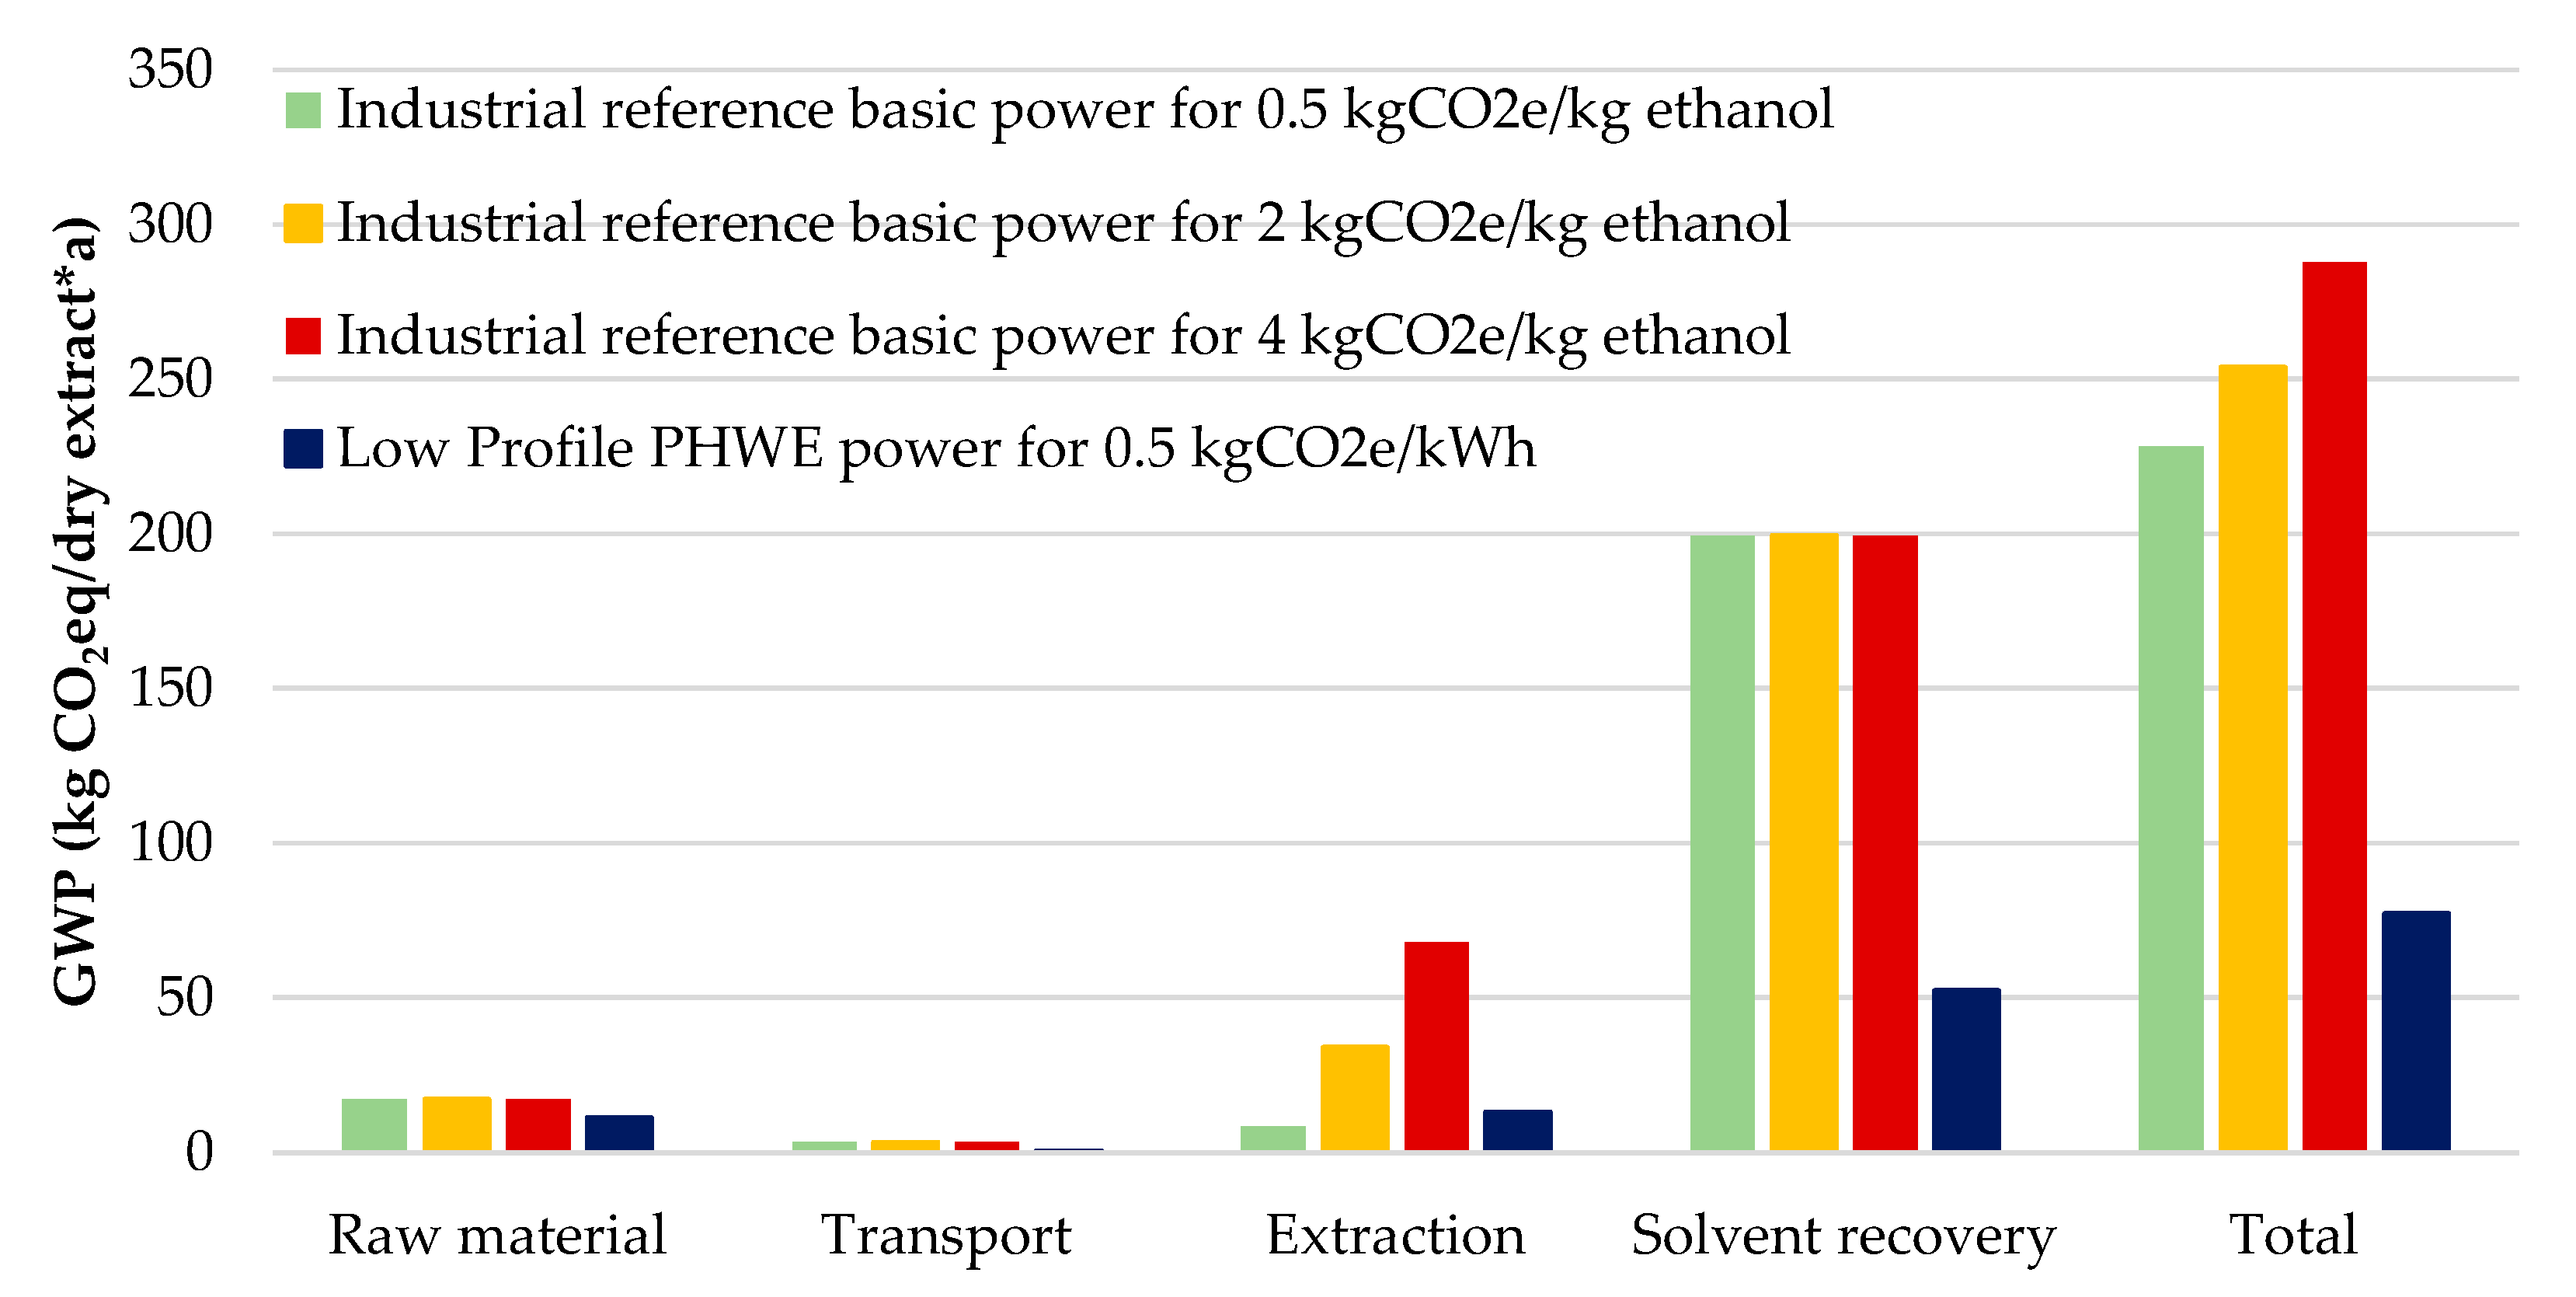
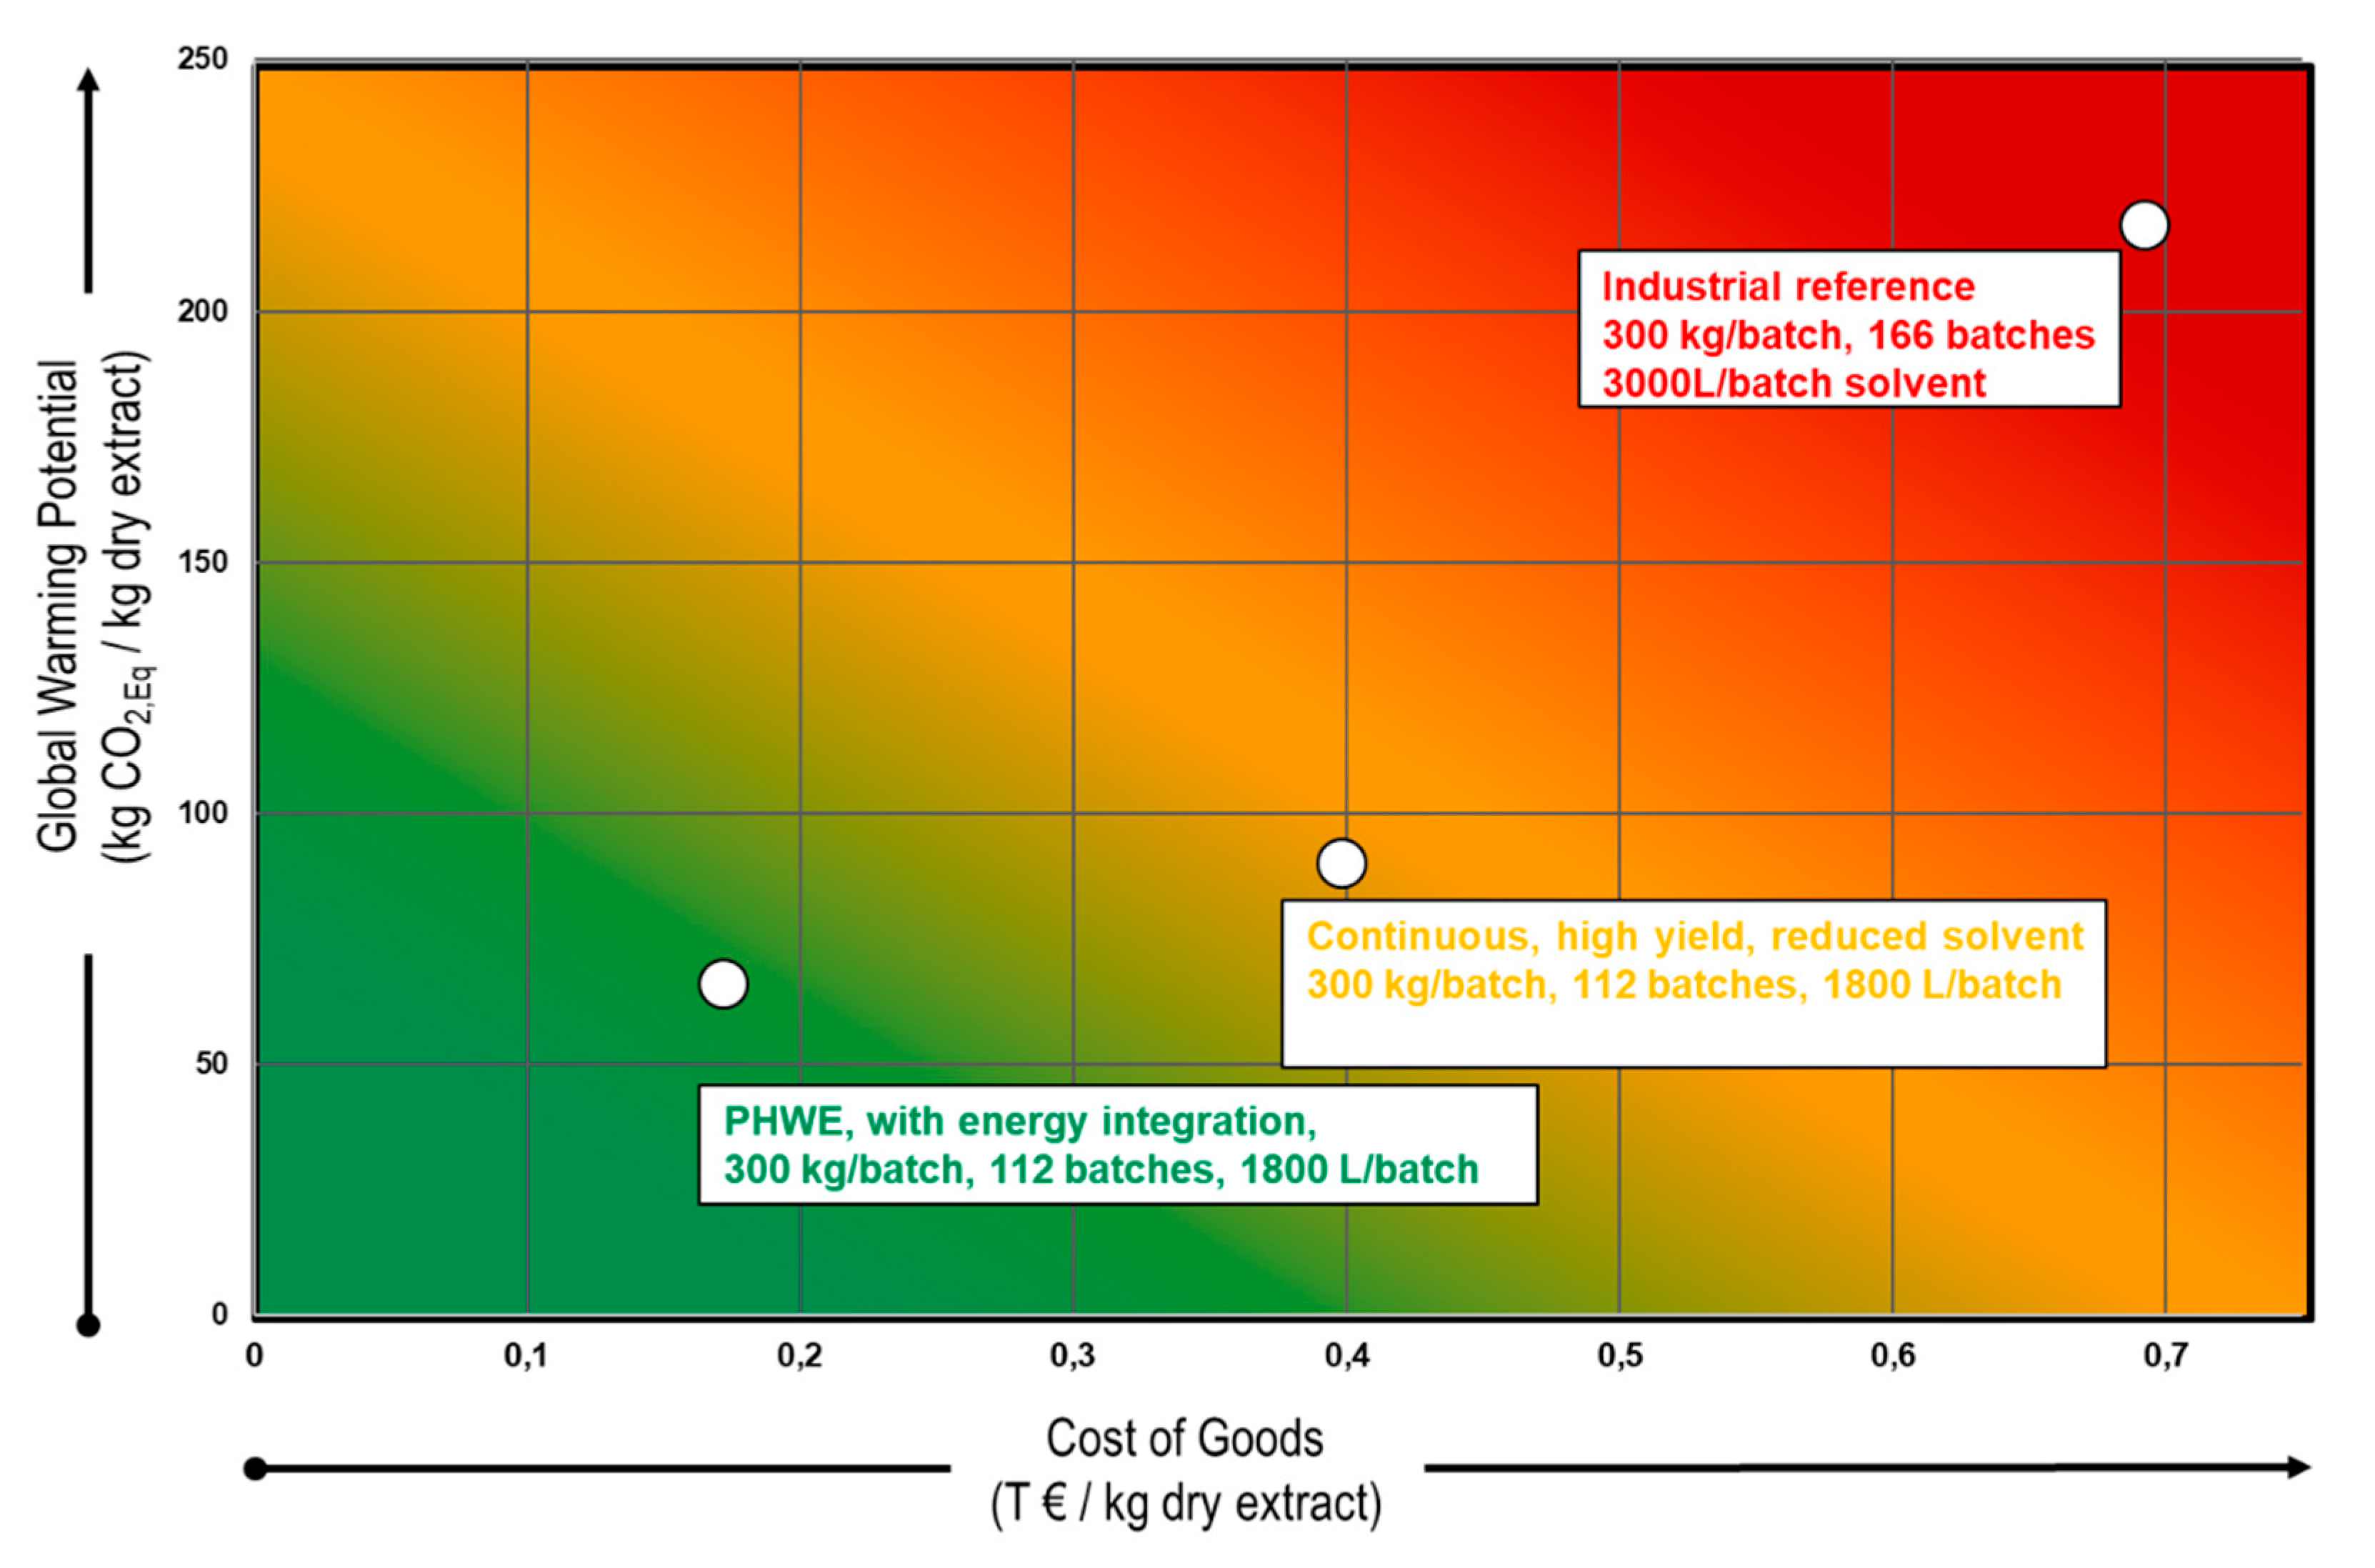
3.2. Technical Project Results for Botanicals

The comparison of cultivation and processing methods, which started immediately before extraction, reveals a large savings potential in the drying of the material (Figure 9).
By using fresh, undried plant material, 90% of the GWP in carbon dioxide equivalents can be saved [67]. This approach is supported by the development of new business models and the technologies required to achieve them [68].
The industrial manufacturing processes of the extraction industry are strongly influenced by traditional recipes (pharmacopeia), which have a high potential for optimization, as can be seen in Figure 10. The optimization of the shown process results in a saving potential of 55% for the required solvent. It also shows that maceration, as a simple process with a dependence on diffusion, requires large quantities of solvent.
For this reason, the comparison of different manufacturing technologies within the framework of process development is an important tool for increasing efficiency.
The comparison of extraction processes shows a clear potential for significant improvements.
The GWP of the analyzed process is 99%, caused by the cultivation (1 kg CO2eq/kg DM) and drying (7 kg CO2eq/kg DM) of the raw materials. As a direct consequence, every increase in yield reduces the total footprint of the process directly (Figure 11). A change from traditional macerations towards exhaustive percolations increases yields by up to 80%, as has been proven in recent projects.
Processing times that are multiple days long and solvent volumes ≥10 L per kilogram extracted from raw material are not uncommon and are part of traditional recipes. This process is defined as an industrial reference process and is compared to common approaches for optimization. The comparison of different extraction methods (Figure 12), i.e., percolation, maceration, PHWE or steam distillation, enables 30–80% higher yields in the extraction process [69]. Additionally, the correct choice of particle size and temperature allows for fast extractions, decreasing the required solvent drastically by a factor of two [70] (see Table 4).
Pressurized hot water extraction utilizes the properties of water up to 200 °C for rapid and exhaustive extractions [28,71]. This allows us to substitute ethanol or other organic solvents with water and energy. This concept can be optimized further by implementing energy integration strategies or low-cost water recovery, based on nanofiltration. In total, this enables an overall reduction of 70% in total specific CO2 emissions, as can be seen in Figure 13.
A further benefit is the possibility of the integration of PHWE into a low-carbon power grid. This pushes PHWE towards a 90% reduction in CO2 emissions.
The substitution of organic solvents with water has the added benefit of reducing the secondary emissions caused by solvent production (Figure 14).
The project results for the technical solution are visualized in Figure 15. Improvements in terms of lower COGs by a factor of five to 10, combined with GWP reductions of three to five, and 70% of 1000 kWh/kg product/a could be achieved.

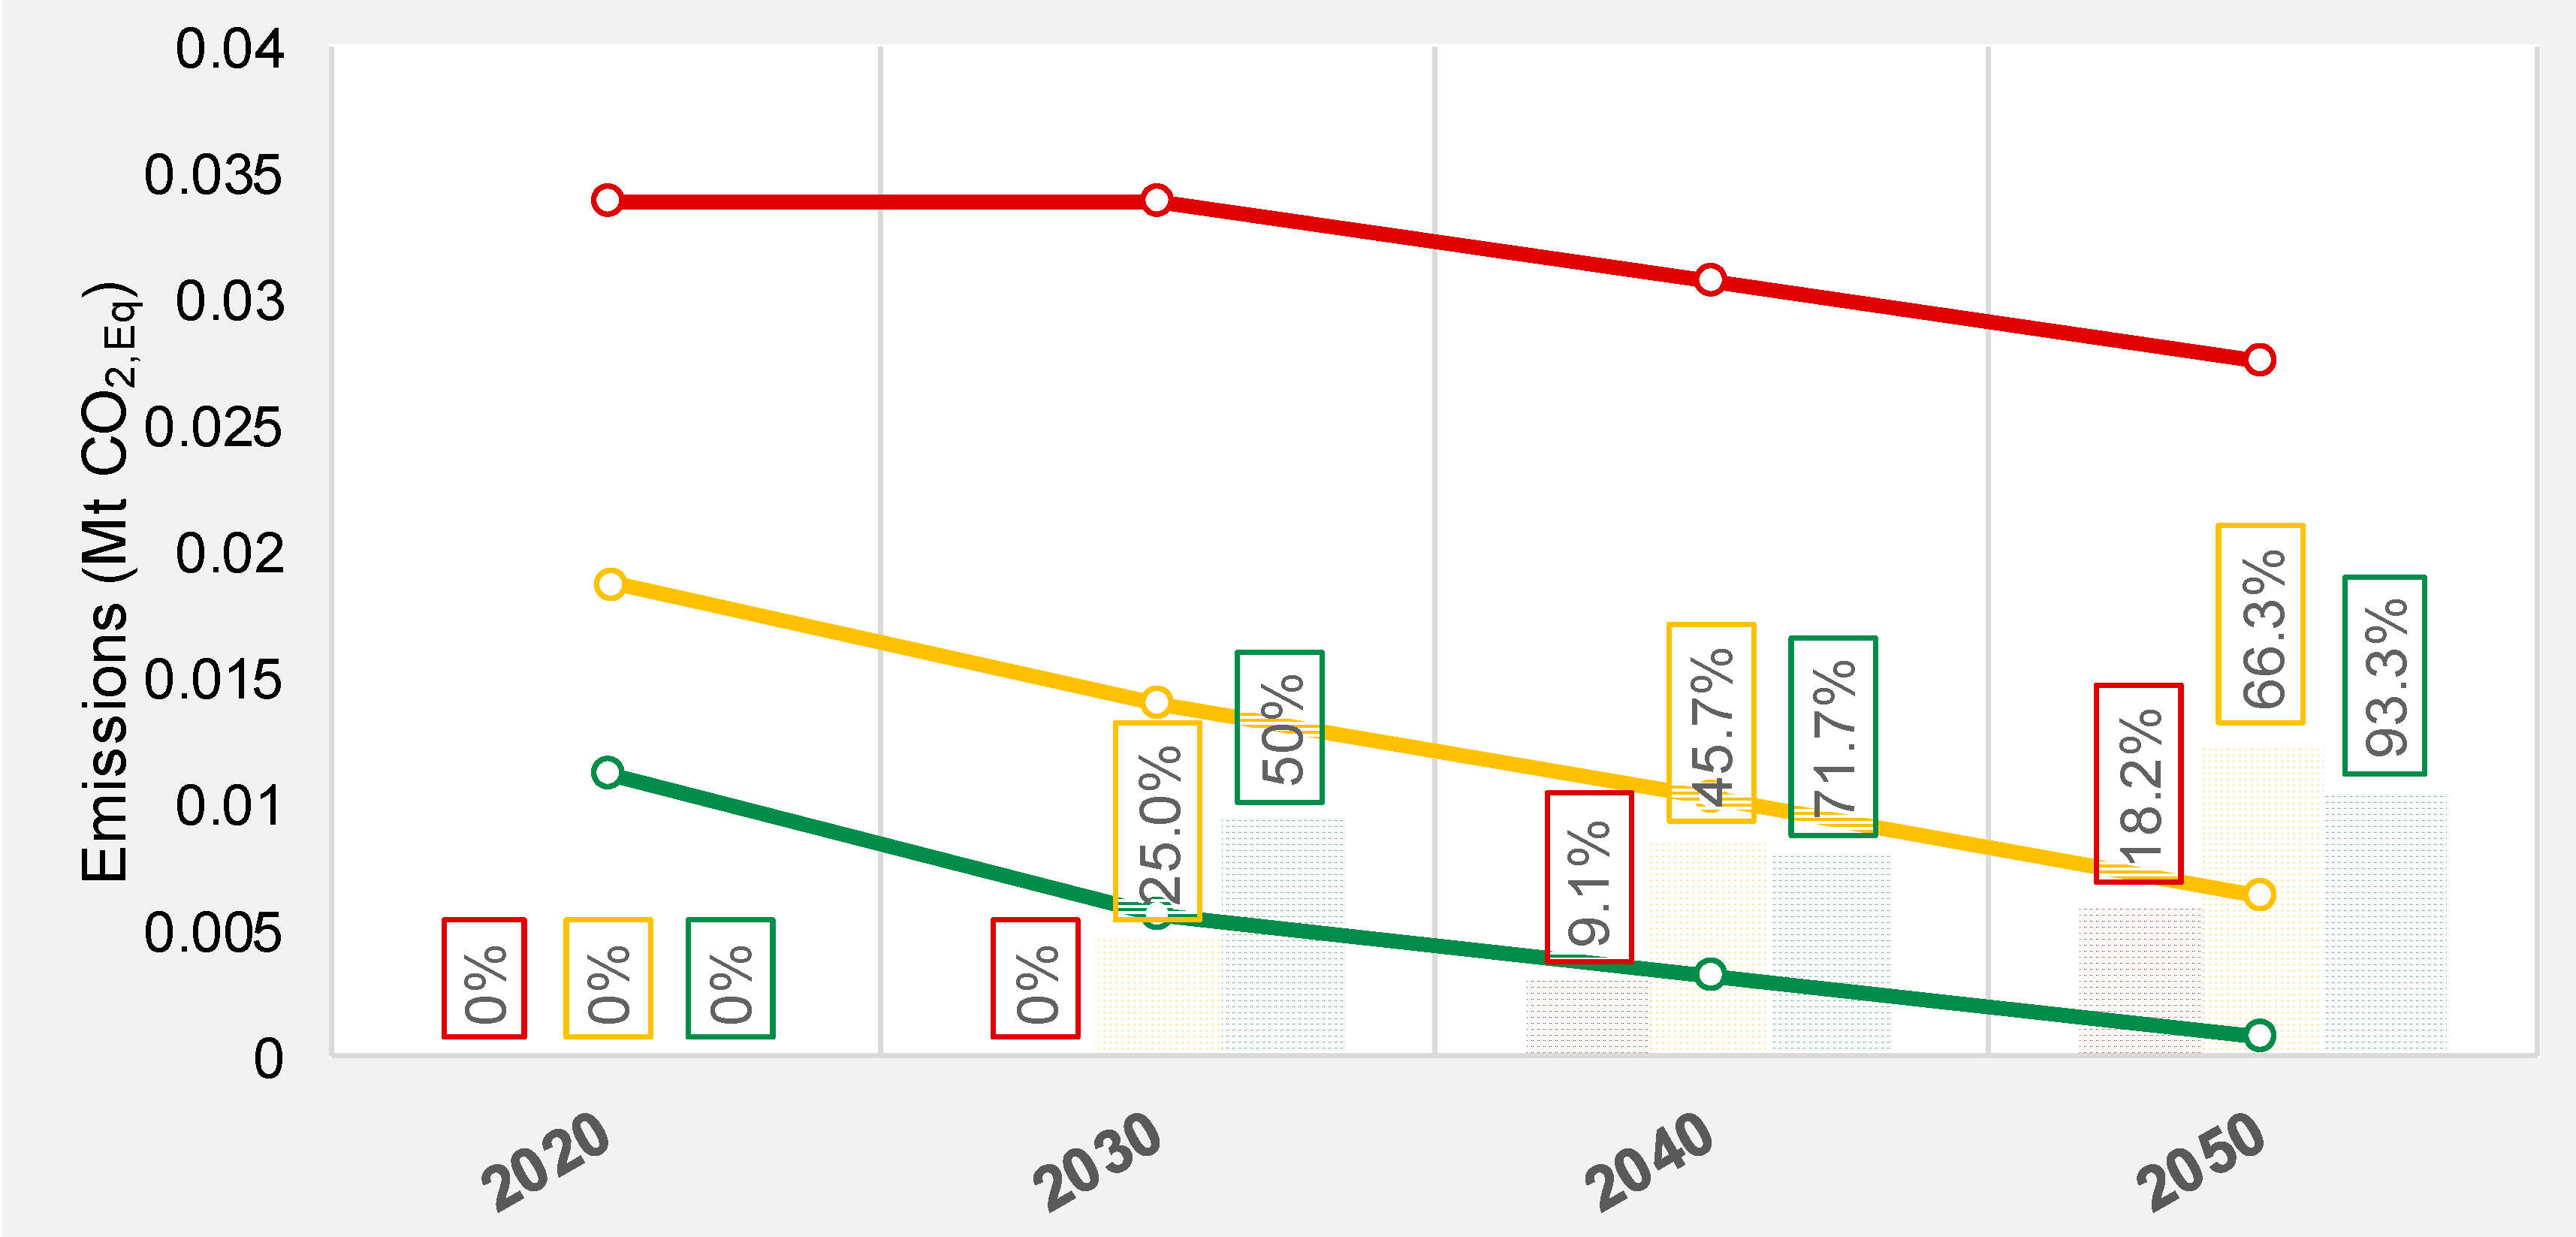
3.3. Industrialization Potential of Botanicals

The roadmap towards climate neutral industry is shown in Figure 16 and discusses three scenarios towards climate neutrality for the German extraction industry of about 100 companies. The production of 150 t of dry extract results in 0.03 Mt CO2eq annually, which is caused by extraction.
If the available technical solutions are implemented immediately and successfully, the best-case scenario results in a total reduction in emissions of over 90%, which is equivalent to a total GWP reduction of 0.5 Mt CO2eq from 2030–2050. This scenario considers a 50% increase in yield and a total solvent reduction of 50% across the industry. Additionally, a high level of integration of renewable energy is considered, with 100 g CO2eq/kWh.
A slow implementation, with a 30% increased yield and 30% reduced solvent consumption, can still reduce the total emissions by 66% in total.

4. Conclusions

This study points out the technical potential for energy and GWP reductions in biologics and botanicals manufacturing. The largest environmental impact can be attributed to WFI for CIP/SIP in the case of biologics manufacturing. The potential shift from batch to continuous production has the highest potential, as well as the adoption of process technologies that need less WFI and enable higher product yields. The political demand for climate-neutral manufacturing requires a reduction in GWP alongside increasing product amounts, combined with decreasing COGs, to be competitive in the world market. In addition, the necessary investments in innovative green technologies to be implemented in manufacturing operations must be made. The German industry is the fourth largest worldwide and needs to compete in the world market in order to provide employment for 5.6 million people and generate a turnover of about EUR two trillion.
The chemical–pharmaceutical industry is the largest in Germany, with about 500,000 employees and a EUR 200 billion turnover, accounting in 2019 for Chemical/Pharma GER: 30 Mt CO2eq und 163 TWh, Pharma GER: 3 Mt CO2eq und 16 TWh, Biologics GER: 0.3 Mt CO2eq and 1.6 TWh. VCI has pointed out that EUR 50 billion of additional investment and 650 TWh of additional green energy are needed to achieve climate-neutral status. Climate neutrality implies that all applications must contribute to achieve such a target.
For example, BASF had 3.5 Mt CO2eq/a (Scope2) in 2019, Bayer 3.71 Mt and 38.7 PJ (2019) and Boehringer 3 Mt CO2eq and 2TWh (2012) [72,73,74]. Basic chemicals like ammonia, urea and methanol, have a GWP of 2–5 kg CO2eq/kg product [14]. Botanicals are less efficient by a factor of 100, whereas biologics account for a factor of 1000 higher.
The German industry has annual GWP of 188 Mt CO2eq with a 750 TWh energy demand. Biologics contribute about 1.1% to the annual industrial GWP, with a 0.5% contribution to turnover and 0.4% to employment. The share of botanicals is 0.007% of industrial GWP contribution, with 0.2% employment and 0.15% turnover contributions, leading to three times more efficient GWP manufacturing operations than biologics.
Botanicals and biologics are already sustainable because of their natural feedstock base. BMWi-funded projects on botanicals and biologics over the last 10 years prove the technical potential for any industrialization to become climate neutral. Technologies like milli-structured process intensification devices, the shift from batch operation to continuous operation and the substitution of organic solvents for water-based processing have been developed and have proven feasible in combination with process modeling based on the quality-by-design approaches demanded by regulatory authorities for autonomous processing, generating digital twins for advanced process control and analytical process technology for real-time release testing.
The last missing link for broad industrialization is any prototype operation in order to prove naturally conservative industry decisions in a strictly regulated environment the technical and economic feasible option for an innovative solution.

Author Contributions

Conceptualization, J.S.; investigation, A.S., L.U., J.S.; writing—original draft preparation, A.S., L.U., J.S.; writing—review and editing, A.S., L.U, J.S..; supervision, J.S. All authors have read and agreed to the published version of the manuscript.

Funding

We gratefully acknowledged the budget provided by Bundesministerium für Wirtschaft und Energie (BMWi; English: Federal Ministry for Economic Affairs and Energy) Projektträger Jülich, Michael Gahr, for enabling studies on industrialization such as ours.

Acknowledgments

The authors would like to acknowledge the contribution of their institute colleagues and the funding of BMWi, Projektträger Jülich, M. Gahr. We also gratefully acknowledge the support of Reinhard Ditz, especially for the English proofreading.

Conflicts of Interest

The authors declare no conflict of interest.

Abbreviations

BMWiBundesministerium für Wirtschaft und Energie; English: Federal Ministry for Economic Affairs and Energy
CEDcumulative energy demand
CIPcleaning-in-place
COGcost of goods
DMdried material
EDenergy demand
EHelectrolysis hydrogen
EHCelectrolysis hydrogen and carbon dioxide
EProMitEnergieeffiziente Prozesse durch Miktro-Trenntechnik; English: Energy-Efficient Processes by Micro-Separation Technology
GHGgreenhouse gas
GWPglobal warming potential
HIChydrophobic interaction chromatography
IEXion-exchange
IFimprovement factor
LCAlife cycle assessment
mAbmonoclonal antibody
MPmethanol pyrolysis
PHWEpressurized hot water extraction
SIPsterilization-in-place
T2P2Total Traceless Phyto Plant
TPTPTraceless Plant Traceless Production
TTBPTotal Traceless Biologics Plant
VCIVerband der Chemischen Industrie e.V.; English: German Chemical Industry Association
WEwater electrolysis
WFIwater for injection

References

  1. Umweltbundesamt. National trend tables for greenhouse gas emissions. In The German Climate Protection Act; Umweltbundesamt: Dessau-Rosslau, Germany, 2020. [Google Scholar]
  2. Bundesministerium für Umwelt, Naturschutz und Nukleare Sicherheit. Gesetz zur Einführung eines Bundes-Klimaschutzgesetzes und zur Änderung Weiterer Vorschriften. 2019. Available online: https://www.bmu.de/gesetz/bundes-klimaschutzgesetz/ (accessed on 1 June 2020).
  3. Verband der chemischen Industrie e.V. Energiestatistik in Daten und Fakten; Verband der Chemischen Industrie e.V.: Frankfurt, Germany, 2020. [Google Scholar]
  4. Energieintensiven Industrien Deutschland (EID). Die Energieintensiven Industrien in Deutschland: Impulsgeber für den Industriestandort Deutschland; EID: Berlin, Germany, 2020. [Google Scholar]
  5. Deutschland in Zahlen (DIZ); Institut der Deutschen Wirtschaft Köln Medien GmbH (Eds.) Available online: https://www.deutschlandinzahlen.de/ (accessed on 1 June 2020).
  6. Destatis. Luftemissionen: Deutschland, Jahre, Luftemissionsart, Produktionsbereiche, Wiesbaden, Germany. Statistisches Bundesamt; Data Licence by-2-0. Available online: https://www-genesis.destatis.de/genesis/online?operation=sprachwechsel&language=en (accessed on 1 June 2020).
  7. Destatis. Energieverbrauch der Betriebe im Verarbeitenden Gewerbe: Deutschland, Jahre, Nutzung des Energieverbrauchs, Wirtschaftszweige, Energieträger, Wiesbaden, Germany. Statistisches Bundesamt; Data Licence by-2-0. Available online: https://www-genesis.destatis.de/genesis/online?operation=sprachwechsel&language=en (accessed on 1 June 2020).
  8. BASF. Our Climate Protection Goal. 2020. Available online: https://www.basf.com/global/en/who-we-are/sustainability/we-produce-safely-and-efficiently/energy-and-climate-protection/climate-protection-goals.html (accessed on 1 June 2020).
  9. LANXESS. LANXESS to Become Climate Neutral by 2040. 2019. Available online: https://lanxess.com/en/Media/Press-Releases/2019/11/LANXESS-to-become-climate-neutral-by-2040 (accessed on 1 June 2020).
  10. Gerbert, P.; Herhold, P.; Burchardt, J.; Schönberger, S.; Rechenmacher, F.; Kirchner, A.; Kemmler, A.; Wünsch, M. Klimapfade für Deutschland; Boston Consulting Group GmbH (BCG): München, Germany, 2018. [Google Scholar]
  11. Becks, H.; Gelbke, H. Die Ökoeffizienz-Analyse nach BASF. TATuP-Zeitschrift für Technikfolgenabschätzung in Theorie und Praxis. 2001, 10, 34–39. [Google Scholar] [CrossRef]
  12. Burger, J.; Asprion, N.; Blagov, S.; Böttcher, R.; Nowak, U.; Bortz, M.; Welke, R.; Küfer, K.-H.; Hasse, H. Multi-Objective Optimization and Decision Support in Process Engineering—Implementation and Application. Chem. Ing. Tech. 2014, 86, 1065–1072. [Google Scholar] [CrossRef]
  13. Linnhoff March. Introduction to Pinch Technology. Available online: https://www.ou.edu/class/che-design/a-design/Introduction%20to%20Pinch%20Technology-LinhoffMarch.pdf (accessed on 1 June 2020).
  14. Geres, R.; Kohn, A.; Lenz, S.; Ausfelder, F.; Bazzanella, A.M.; Möller, A. Roadmap Chemie 2050—Auf dem Weg zu einer Treibhausgasneutralen Chemischen Industrie in Deutschland; DECHEMA Gesellschaft für Chemische Technik und Biotetechnologie e.V.: Frankfurt, Germany, 2019. [Google Scholar]
  15. Verband der Chemischen Industrie e.V. (VCI) (Ed.) Available online: https://www.vci.de (accessed on 1 June 2020).
  16. Boehringer Ingelheim. Klimaschutz: Urkunde von Umweltministerin für Boehringer Ingelheim. Available online: https://www.boehringer-ingelheim.de/pressemitteilung/klimaschutz-urkunde-von-umweltministerin-fuer-boehringer-ingelheim (accessed on 1 June 2020).
  17. Boehringer Ingelheim. Bericht im Rahmen der Wirtschaftsinititative Nachhaltigkeit (WIN) Baden-Württemberg: Berichtsjahr 2016. Available online: https://www.win-bw.com/fileadmin/downloads/2_charta/berichte/Boehringer_Ingelheim_Nachhaltigkeitsbericht_2016.pdf (accessed on 1 June 2020).
  18. Positionspapier der Bundesregierung. Zwischenevaluierung von Horizont 2020; Federal Ministry of Education and Research (BMBF): Bonn, Germany, 2017. [Google Scholar]
  19. Renn, O. Ein Kompass für die Energiewende: Das Kopernikus-Projekt Energiewende-Navigationssystem (ENavi) ist gestartet. GAIA Ecol. Perspect. Sci. Soc. 2017, 26, 68–69. [Google Scholar] [CrossRef] [Green Version]
  20. Molins, F.; Schweers, E. Zu SunFuels aus CO2 in einer Ein-Schritt-Fotosynthese. Chem. Ing. Tech. 2018, 90, 1143. [Google Scholar] [CrossRef]
  21. Bundesministerium für Wirtschaft und Energie. Bekanntmachung Forschungsförderung im 6. Energieforschungsprogramm “Forschung Für Eine Umweltschonende, Zuverlässige Und Bezahlbare Energieversorgung”; Bundesministerium für Wirtschaft und Energie: Berlin, Germany, 2014. [Google Scholar]
  22. Sattler, K. Thermische Trennverfahren; John Wiley & Sons: Hoboken, NJ, USA, 2012; ISBN 978-3-527-30243-7. [Google Scholar]
  23. Kirk-Othmer Encyclopedia of Chemical Technology; John Wiley & Sons: Hoboken, NJ, USA, 2000; ISBN 9780471238966.
  24. Sommerfeld, S.; Strube, J. Challenges in biotechnology production—Generic processes and process optimization for monoclonal antibodies. Chem. Eng. Process. Process Intensif. 2005, 44, 1123–1137. [Google Scholar] [CrossRef]
  25. Strube, J. Energieeffiziente Prozesse durch Mikro-Trenntechnik (EProMit): Schlussbericht zum Forschungsvorhaben; Technische Informationsbibliothek: Hannover, Germany, 2015. [Google Scholar]
  26. FDA. Guidance for Industry. PAT—A Framework for Innovative Pharmaceutical Development, Manufacturing, and Quality Assurance. 2004. Available online: https://www.fda.gov/downloads/drugs/guidances/ucm070305.pdf (accessed on 19 February 2018).
  27. Uhlenbrock, L.; Sixt, M.; Strube, J. Quality-by-Design (QbD) process evaluation for phytopharmaceuticals on the example of 10-deacetylbaccatin III from yew. Resour. Effic. Technol. 2017, 3, 137–143. [Google Scholar] [CrossRef]
  28. Sixt, M.; Strube, J. Systematic and Model-Assisted Evaluation of Solvent Based- or Pressurized Hot Water Extraction for the Extraction of Artemisinin from Artemisia annua L. Processes 2017, 5, 86. [Google Scholar] [CrossRef] [Green Version]
  29. Schmidt, A.; Sixt, M.; Huter, M.; Mestmäcker, F.; Strube, J. Systematic and Model-Assisted Process Design for the Extraction and Purification of Artemisinin from Artemisia annua L.—Part II: Model-Based Design of Agitated and Packed Columns for Multistage Extraction and Scrubbing. Processes 2018, 6, 179. [Google Scholar] [CrossRef] [Green Version]
  30. Mestmäcker, F.; Schmidt, A.; Huter, M.; Sixt, M.; Strube, J. Systematic and Model-Assisted Process Design for the Extraction and Purification of Artemisinin from Artemisia annua L.—Part III: Chromatographic Purification. Processes 2018, 6, 180. [Google Scholar] [CrossRef] [Green Version]
  31. Huter, M.; Schmidt, A.; Mestmäcker, F.; Sixt, M.; Strube, J. Systematic and Model-Assisted Process Design for the Extraction and Purification of Artemisinin from Artemisia annua L.—Part IV: Crystallization. Processes 2018, 6, 181. [Google Scholar] [CrossRef] [Green Version]
  32. Kornecki, M.; Schmidt, A.; Lohmann, L.; Huter, M.; Mestmäcker, F.; Klepzig, L.; Mouellef, L.; Zobel-Roos, S.; Strube, J. Accelerating Biomanufacturing by Modeling of Continuous Bioprocessing—Piloting Case Study of Monoclonal Antibody Manufacturing. Processes 2019, 7, 495. [Google Scholar] [CrossRef] [Green Version]
  33. Sixt, M.; Uhlenbrock, L.; Strube, J. Toward a Distinct and Quantitative Validation Method for Predictive Process Modelling—On the Example of Solid-Liquid Extraction Processes of Complex Plant Extracts. Processes 2018, 6, 66. [Google Scholar] [CrossRef] [Green Version]
  34. Kornecki, M.; Strube, J. Accelerating Biologics Manufacturing by Upstream Process Modelling. Processes 2019, 7, 166. [Google Scholar] [CrossRef] [Green Version]
  35. Cetinkaya, E.; Liu, N.; Simons, T.J.; Wallach, J. Petrochemicals 2030: Reinventing the Way to Win in a Changing Industry; McKinsey & Co: New York, NY, USA, 2018. [Google Scholar]
  36. Report of the Conference of the Parties on its twenty-first session, held in Paris from 30 November to 13 December 2015. Addendum. Part two: Action taken by the Conference of the Parties at its twenty-first session.
  37. Carbon Pollution Emission Guidelines for Existing Stationary Sources: Electric Utility Generating Units; 40 CFR Part 60. Available online: https://www.federalregister.gov/documents/2015/10/23/2015-22842/carbon-pollution-emission-guidelines-for-existing-stationary-sources-electric-utility-generating (accessed on 1 June 2020).
  38. Arbeitsgemeinschaft Energiebilanzen e.V. Auswertungstabellen zur Energiebilanz Deutschland. Available online: https://ag-energiebilanzen.de/10-0-Auswertungstabellen.html (accessed on 1 June 2020).
  39. Belkhir, L.; Elmeligi, A. Carbon footprint of the global pharmaceutical industry and relative impact of its major players. J. Clean. Prod. 2019, 214, 185–194. [Google Scholar] [CrossRef]
  40. Protocol, G.G. A Corporate Accounting and Reporting Standard; World Resources Institute and World Business Council for Sustainable Development: Geneva, Switzerland, 2004. [Google Scholar]
  41. Gao, Z.; Geng, Y.; Wu, R.; Chen, W.; Wu, F.; Tian, X. Analysis of energy-related CO2 emissions in China’s pharmaceutical industry and its driving forces. J. Clean. Prod. 2019, 223, 94–108. [Google Scholar] [CrossRef]
  42. Srai, J.S.; Badman, C.; Krumme, M.; Futran, M.; Johnston, C. Future Supply Chains Enabled by Continuous Processing—Opportunities and Challenges. May 20–21, 2014 Continuous Manufacturing Symposium. J. Pharm. Sci. 2015, 104, 840–849. [Google Scholar] [CrossRef] [PubMed] [Green Version]
  43. The Business Research Company. The Growing Pharmaceuticals Market: Expert Forecasts and Analysis. Available online: https://blog.marketresearch.com/the-growing-pharmaceuticals-market-expert-forecasts-and-analysis (accessed on 1 June 2020).
  44. Wenda, S.; Illner, S.; Mell, A.; Kragl, U. Industrial biotechnology—The future of green chemistry? Green Chem. 2011, 13, 3007–3047. [Google Scholar] [CrossRef]
  45. Pharmaceutical Online. Measuring COVID-19’s Impact on Availability of Drugs and API from India and China. Available online: https://www.pharmaceuticalonline.com/doc/measuring-covid-s-impact-on-availability-of-drugs-and-api-from-india-and-china-0001 (accessed on 1 June 2020).
  46. Pietrzykowski, M.; Flanagan, W.; Pizzi, V.; Brown, A.; Sinclair, A.; Monge, M. An environmental life cycle assessment comparison of single-use and conventional process technology for the production of monoclonal antibodies. J. Clean. Prod. 2013, 41, 150–162. [Google Scholar] [CrossRef]
  47. Bethir, L. Big Pharma Emits More Greenhouse Gases than the Automotive Industry. Available online: https://phys.org/news/2019-05-big-pharma-emits-greenhouse-gases.html (accessed on 1 June 2020).
  48. Grote, F.; Ditz, R.; Strube, J. Downstream of downstream processing: Development of recycling strategies for biopharmaceutical processes. J. Chem. Technol. Biotechnol. 2012, 87, 481–497. [Google Scholar] [CrossRef]
  49. Ramasamy, S.V.; Titchener-Hooker, N.J.; Lettieri, P. Life cycle assessment as a tool to support decision making in the biopharmaceutical industry: Considerations and challenges. Food Bioprod. Process. 2015, 94, 297–305. [Google Scholar] [CrossRef]
  50. Idris, A.; Chua, G.K.; Othman, M.R. Incorporating potential environmental impact from water for injection in environmental assessment of monoclonal antibody production. Chem. Eng. Res. Des. 2016, 109, 430–442. [Google Scholar] [CrossRef] [Green Version]
  51. Siegert, M.-W.; Lehmann, A.; Emara, Y.; Finkbeiner, M. Harmonized rules for future LCAs on pharmaceutical products and processes. Int. J. Life Cycle Assess. 2019, 24, 1040–1057. [Google Scholar] [CrossRef]
  52. Lalor, F.; Fitzpatrick, J.; Sage, C.; Byrne, E. Sustainability in the biopharmaceutical industry: Seeking a holistic perspective. Biotechnol. Adv. 2019, 37, 698–707. [Google Scholar] [CrossRef] [PubMed]
  53. Shirahata, H.; Hirao, M.; Sugiyama, H. Multiobjective decision-support tools for the choice between single-use and multi-use technologies in sterile filling of biopharmaceuticals. Comput. Chem. Eng. 2019, 122, 114–128. [Google Scholar] [CrossRef]
  54. Marques, C.M.; Moniz, S.; de Sousa, J.P.; Barbosa-Povoa, A.P.; Reklaitis, G. Decision-support challenges in the chemical-pharmaceutical industry: Findings and future research directions. Comput. Chem. Eng. 2020, 134, 106672. [Google Scholar] [CrossRef]
  55. Ho, S.V.; McLaughlin, J.M.; Cue, B.W.; Dunn, P.J. Environmental considerations in biologics manufacturing. Green Chem. 2010, 12, 755. [Google Scholar] [CrossRef]
  56. Pietrzykowski, V.P.; Flanagan, W.; Pietrzykowski, M.; Brown, A.; Sinclair, A.; Monge, M. An Environmental Lifecycle Assessment of Single-Use and Conventional Process Technology: Comprehensive Environmental Impacts. BioPharm Int. 2014, 27, 3. [Google Scholar]
  57. Bunnak, P.; Allmendinger, R.; Ramasamy, S.V.; Lettieri, P.; Titchener-Hooker, N.J. Life-cycle and cost of goods assessment of fed-batch and perfusion-based manufacturing processes for mAbs. Biotechnol. Prog. 2016, 32, 1324–1335. [Google Scholar] [CrossRef]
  58. Renteria Gamiz, A.G.; de Soete, W.; Heirman, B.; Dahlin, P.; de Meester, S.; Dewulf, J. Environmental sustainability assessment of the manufacturing process of a biological active pharmaceutical ingredient. J. Chem. Technol. Biotechnol. 2019, 94, 1937–1944. [Google Scholar] [CrossRef]
  59. Bundesverband der Pharmazeutischen Industrie e.V. Pharma-Daten 2019. Berlin. Available online: https://www.bpi.de/de/service/pharma-daten (accessed on 1 June 2020).
  60. Bart, H.J.; Bäcker, W.; Bischoff, F.; Godecke, R.; Johannisbau, W.; Jordan, V.; Stockfleth, R.; Strube, J.; Wiesmet, V. Phytoextrakte—Produkte und Prozesse: Vorschlag für einen neuen, fachübergreifenden Forschungsschwerpunkt; Dechema e.V., Ed.; Dechema e.V.: Frankfurt am Main, Germany, 2012. [Google Scholar]
  61. Dar, R.A.; Shahnawaz, M.; Rasool, S.; Qazi, P.H. Natural product medicines: A literature update. J. Phytopharm. 2017, 6, 349–351. [Google Scholar]
  62. FNR. Fachagentur Nachwachsende Rohstoffe: Ein Projektträger des Bundesministeriums für Ernährung und Landwirtschaft. Available online: https://www.fnr.de/ (accessed on 1 June 2020).
  63. proplanta. Das Informationszentrum für Landwirtschaft. Available online: https://www.proplanta.de/ (accessed on 1 June 2020).
  64. Zafeiridou, M.; Hopkinson, N.S.; Voulvoulis, N. Cigarette Smoking: An Assessment of Tobacco’s Global Environmental Footprint Across Its Entire Supply Chain. Environ. Sci. Technol. 2018, 52, 8087–8094. [Google Scholar] [CrossRef] [PubMed]
  65. Kraatz, S.; Sinistore, J.C.; Reinemann, D.J. Energy intensity and global warming potential of corn grain ethanol production in Wisconsin (USA). Food Energy Secur. 2013, 2, 207–219. [Google Scholar] [CrossRef]
  66. Tongwane, M.; Mdlambuzi, T.; Moeletsi, M.; Tsubo, M.; Mliswa, V.; Grootboom, L. Greenhouse gas emissions from different crop production and management practices in South Africa. Environ. Dev. 2016, 19, 23–35. [Google Scholar] [CrossRef] [Green Version]
  67. Leibniz-Institut für Agrartechnik und Bioökonomie e.V. Leitfaden Trocknung von Arznei- und Gewürzpflanzen; Leibniz-Institut für Agrartechnik und Bioökonomie e.V.: Potsdam, Germany, 2017. [Google Scholar]
  68. Uhlenbrock, L.; Ditz, R.; Strube, J. Process Engineering Accelerating an Economic Industrialization Towards a Bio-Based World. Molecules 2019, 24, 1853. [Google Scholar] [CrossRef] [PubMed] [Green Version]
  69. Sixt, M.; Strube, J. Systematic Design and Evaluation of an Extraction Process for Traditionally Used Herbal Medicine on the Example of Hawthorn (Crataegus monogyna JACQ.). Processes 2018, 6, 73. [Google Scholar] [CrossRef] [Green Version]
  70. Sixt, M.; Strube, J. Pressurized hot water extraction of 10-deacetylbaccatin III from yew for industrial application. Resour. Effic. Technol. 2017, 3, 177–186. [Google Scholar] [CrossRef]
  71. Sixt, M.; Schmidt, A.; Mestmäcker, F.; Huter, M.; Uhlenbrock, L.; Strube, J. Systematic and Model-Assisted Process Design for the Extraction and Purification of Artemisinin from Artemisia annua L.—Part I: Conceptual Process Design and Cost Estimation. Processes 2018, 6, 161. [Google Scholar] [CrossRef] [Green Version]
  72. BASF. BASF Online Report 2019. Available online: https://report.basf.com/2019/en/ (accessed on 1 June 2020).
  73. Bayer. Sustainability Report 2019. Bayer AG, Ed.; Available online: https://www.investor.bayer.de/en/reports/sustainability-reports/ (accessed on 1 June 2020).
  74. Boehringer Ingelheim (Ed.) Corporate Social Responsibility Report. Available online: http://csrreport.us.boehringer-ingelheim.com/ (accessed on 1 June 2020).
Figure 1. Development of greenhouse gas (GHG) emissions in Germany in sectors defined by Climate Change Act. Data are obtained from numbers published by the German Environment Agency [2].
Processes 08 00818 g001
Figure 2. Development of CO2 emissions (yellow bars) and energy demand (red line) of the pharma sector in Germany. Data source: Statistisches Bundesamt (Destatis), Genesis Online; data licence by-2–0 [6,7].
Processes 08 00818 g002
Figure 3. Biologicals’ global warming potential (GWP) vs. cost of goods (COGs) portfolio. Monoclonal antibody (mAb).
Processes 08 00818 g003
Figure 4. Calculation of greenhouse gas (GHG) emissions (lines) and reduction compared to 2020 (bars) for biologics manufacturing in Germany. Three process improvement scenarios are considered: red = worst case (low impact and slow industrialization); orange = realistic (impact as discussed, normal industrialization time) and green = best case (highest impact and fast industrialization).
Processes 08 00818 g004
Figure 5. Calculation of energy demand (lines) and reduction compared to 2020 (bars) for biologics manufacturing in Germany. Three process improvement scenarios are considered: red = worst case (low impact and slow industrialization); orange = realistic (impact as discussed, normal industrialization time) and green = best case (highest impact and fast industrialization).
Processes 08 00818 g005
Figure 6. Roadmap for climate neutral biologics manufacturing by Bundesministerium für Wirtschaft und Energie (BMWi; English: Federal Ministry for Economic Affairs and Energy)-funded projects. Bundesministerium für Wirtschaft und Energie (BMWi; English: Federal Ministry for Economic Affairs and Energy), Energieeffiziente Prozesse durch Mikro-Trenntechnik (EProMit; English: Energy-Efficient Processes by Micro-Separation Technology), Traceless Plant Traceless Production (TPTP), Total Traceless Biologics Plant (TTBP), Total Traceless Phyto Plant (T2P2), research and development (R&D).
Processes 08 00818 g006
Figure 7. Development approaches for processing plant material. Solid–liquid extraction (SLE).
Processes 08 00818 g007
Figure 8. Supply chain for herbal raw materials.
Processes 08 00818 g008
Figure 9. Global warming potential (GWP) of raw material supply for extraction, based on data from [64,65,66].
Processes 08 00818 g009
Figure 10. Solvent saving potential of a typical industrial process for extract production.
Processes 08 00818 g010
Figure 11. Impact of yield improvements on specific global warming potential (GWP) of extraction processes.
Processes 08 00818 g011
Figure 12. Comparison of different optimization approaches on total global warming potential (GWP) of the process. Pressurized hot water extraction (PHWE).
Processes 08 00818 g012
Figure 13. Dependence of extraction processes on indirect CO2 emissions from power generation. Pressurized hot water extraction (PHWE).
Processes 08 00818 g013
Figure 14. Dependence of extraction processes on the direct CO2 emissions of solvent production.
Processes 08 00818 g014
Figure 15. Botanicals global warming potential (GWP) vs. COGs portfolio.
Processes 08 00818 g015
Figure 16. Calculation of GHG emissions (lines) and reduction compared to 2020 (bars) for botanicals manufacturing in Germany. Three process improvement scenarios are considered: red = worst case (low impact and slow industrialization); orange = realistic (impact as discussed, normal industrialization time) and green = best case (highest impact and fast industrialization).
Processes 08 00818 g016
Table 1. Emissions and energy demand of chemical products. Global warming potential (GWP) and energy demand (ED) are derived from electricity demand. The data source used to construct the table can be found in [14]. Abbreviations: water electrolysis (WE), methanol pyrolysis (MP), electrolysis hydrogen (EH), electrolysis hydrogen and carbon dioxide (EHC).
ProductGWP (kg/kg)ED (MWh/t)
Hydrogen WE24.451.60
Hydrogen MP4.829.50
Ammonia EH5.169.17
Ammonia MP1.673.40
Urea0.460.97
MeOH EHC5.239.52
MeOH MP1.623.30
Table 2. Reference monoclonal antibody (mAb) process impact factors, possible process improvements and their effect on impact factors investigated in this study. Improvement factor (IF), global warming potential (GWP), cumulative energy demand (CED), water for injection (WFI).
RangeGWP (t/kg)CED (MWh/kg)IFyield (%)IFWFI (%)GWPWFI (%)CEDWFI (%)
Min3.501010505050
Avg4.251520607070
Max5.002030709090
Table 3. Calculated data using reference values as shown in minimum, average and maximum greenhouse gas (GHG) emissions and cumulative energy demand (CED) of biologicals manufacturing in Germany for the year 2020.
CaseGWP (Mt CO2eq)CED (TWh)
Best0.300.09
Avg0.371.3
Worst0.431.7
Table 4. Optimization pathways for solid–liquid extraction. Pressurized hot water extraction (PHWE).
Optimization PathwayYieldSolventTemperatureEnergy Recovery
Reference0%0%20 °C0%
Increased Yield+80%0%20 °C0%
Decreased Solvent+50%−50%20 °C0%
PHWE+50%−50%120 °C0%
PHWE with energy integration+50%−50%120 °C50%

