Article

Impacts of Low-Carbon Targets and Hydrogen Production Alternatives on Energy Supply System Transition: An Infrastructure-Based Optimization Approach and a Case Study of China

Department of Energy and Power Engineering, Tsinghua-BP Clean Energy Center, Tsinghua University, Beijing 100084, China
*
Author to whom correspondence should be addressed.
Submission received: 16 December 2020 / Revised: 4 January 2021 / Accepted: 13 January 2021 / Published: 15 January 2021
(This article belongs to the Special Issue Redesign Processes in the Age of the Fourth Industrial Revolution)

Abstract

:
Low-carbon transition pathways oriented from different transition targets would result in a huge variation of energy system deployment and transition costs. Hydrogen is widely considered as an imperative energy carrier to reach carbon neutral targets. However, hydrogen production, either from non-fossil power or fossil fuels with carbon capture, is closely linked with an energy supply system and has great impacts on its structure. Identifying an economically affordable transition pathway is attractive, and energy infrastructure is critical due to massive investment and long life-span. In this paper, a multi-regional, multi-period, and infrastructure-based model is proposed to quantify energy supply system transition costs with different low-carbon targets and hydrogen production alternatives, and China is taken as a case study. Results show that, fulfilling 2-degree and 1.5-degree temperature increase targets would result in 84% and 151% increases in system transition costs, 114% and 246% increases in infrastructure investment, and 211% and 339% increases in stranded investment, compared to fulfilling stated policy targets. Producing hydrogen from coal would be economical when carbon capture and sequestration cost is lower than 437 yuan per tonne, and reduce infrastructure investment and stranded coal investment by 16% and 35% respectively, than producing hydrogen from renewable power.

1. Introduction

Low carbon transition of energy systems is critical to global carbon mitigation. According to an report from International Energy Agency (IEA), 90% of global carbon emissions came from burning fossil fuels in 2015 [1]. In 2019, global carbon emissions from energy sectors reached 34.2 billion tonnes with an average growth rate of 1.1% in the last decade [2]. Despite rapid growth of renewable energy in recent years, fossil fuels still accounted for 84% in global primary energy supply in 2019 [2]. In energy consumption sectors, fossil fuels accounted for 67% of global energy final use, whilst electricity only accounted for 19% [1].
Achieving a carbon neutral or even negative emissions target would reshape energy systems thoroughly from primary energy supply to final use. Applying carbon removal technologies and improving shares of electricity, hydrogen, biomass, and other renewable resources in energy final use sectors to replace fossil energy are essential to reduce carbon emissions. In view that most renewable resources are converted to electricity, improving electrification in final energy use is an inevitable choice to reduce carbon emissions [3]. Fossil energy use in some specific production and household sectors, such as steel sector, cannot be replaced by electricity, whilst hydrogen has great potential in these sectors [4]. Further, biomass resources and their conversion products, as carbon neutral fuels in life-span, can also play an important role in some specific sectors to replace fossil fuels, such as power sector [5]. Carbon capture and storage (CCS) can be deployed in industry sectors and power sectors with fossil fuels combustion to remove most carbon emissions, which converts fossil technologies to carbon neutral technologies [6]. Bioenergy with carbon capture and storage (BECCS) [7] and direct air capture (DAC) [8] enable negative carbon emissions. Moreover, renewable subsidies, carbon taxes, and carbon trade are effective measures to reduce carbon emissions in energy supply and conversion sectors, especially in power sectors [9].
Different transition targets would lead to different transition costs from reshaping energy supply systems, with corresponding transition actions. Faster transition would not only lead to massive deployment of decarbonisation technologies with higher costs, but also result in huge stranded costs of existing fossil energy infrastructure. Various transition targets have been put forward by international organizations and many countries. The Paris Agreement adopted in December 2015 aims to limit the temperature increase to well below 2 degree above pre-industrial levels and to pursue efforts to limit the temperature increase to 1.5 degree [10]. The Intergovernmental Panel on Climate Change (IPCC) pointed out that carbon emissions should be reduced to net zero around 2050 and 2070 to achieve the 1.5-degree target and the 2-degree target, respectively [11]. European Commission has proposed a strategy to achieve carbon neutrality within the European Union by 2050 [12]. China, the largest developing country in the world, has pledged to reach summit of carbon emissions by around 2030, and improve non-fossil energy shares to 50% in primary energy supply by 2050 [13].
Reducing energy supply system transition costs to obtain an affordable and executable transition strategy is attractive, and energy infrastructure is critical in cost reduction due to its massive investment and long life-span. Firstly, energy infrastructure is imperative to secure energy supply, and inadequate non-fossil energy infrastructure would block carbon reduction. Secondly, energy demand would keep growing in many countries, and consequently energy infrastructure would be constructed along with growing demand to secure energy supply. Thirdly, a faster transition would result in significant investment on non-fossil energy infrastructure, and also lead to stranded investment in fossil energy infrastructure.
In the meanwhile, albeit the fact that hydrogen is widely considered as an imperative energy carrier to reach a carbon neutral target due to its potential to replace fossil fuels in end-use sectors with zero carbon emissions [14], multiple hydrogen production alternatives can lead to a life-span carbon neutral ultimate with different energy system deployment and transition costs. Hydrogen can be produced from fossil fuels and non-fossil power, and consequently classified into three categories, namely green hydrogen, blue hydrogen and black hydrogen [15]. Green hydrogen and black hydrogen indicate that hydrogen is produced from non-fossil power and fossil fuels respectively, and blue hydrogen indicates that hydrogen is produced from fossil fuels with CCS to remove carbon emissions. Green hydrogen and blue hydrogen can both lead to carbon neutral, but result in different energy system deployment and transition costs. Green hydrogen would significantly accelerate the expansion of the power system, leading to large investment of non-fossil power infrastructure. Blue hydrogen would moderate fossil energy demand reduction, and part of fossil energy infrastructure can be remained, which would consequently reduce stranded costs of fossil energy infrastructure, but CCS facilities would lead to huge costs.
This paper aims to obtain transition pathways oriented from different transition targets with least system transition costs and specific energy infrastructure deployment strategies, and analyze the impact of hydrogen production alternatives on energy system planning and transition costs.
Top-down methods are widely applied to quantify carbon mitigation costs, such as computable general equilibrium (CGE) models, but detailed infrastructure planning strategies cannot be obtained by these methods. These models are suited to quantify economic impacts, whilst they cannot reduce system costs by optimization, and the resolution of time, space, technology and energy carriers is insufficient when quantifying energy supply system transition costs. Most studies focus on the costs resulting from a single policy or strategy, whilst a few provide a comprehensive view. Fujimori et al. [16] quantified GDP losses in Japan with a comprehensive mitigation strategy based on a CGE model, which varied from 1.2% to 2.5% of GDP to reduce 80% of carbon emissions by 2050. McCollum et al. [14] estimated global energy investment to fulfill the Paris Agreement by 2050 using a few widely applied models, which all comprised of CGE models. Zhang et al. [17] analyzed the impact of carbon trade policies based on a CGE model, and pointed out that the GDP losses would be 0.16%, 1.33%, and 1.42% in U.S., Japan, and South Korea, respectively. Liu and Lu [18] applied a dynamic CGE model to quantify the economic impact of carbon tax in China. Wang et al. quantified the cost to achieve Copenhagen targets in Guangdong, China, which would be 1.4% of GDP based on a two-region CGE model [19].
Bottom-up methods, such as energy planning models (EPM), are widely applied to obtain the deployment of energy systems with least costs by optimization. Most of these researches focus on specific technology, energy carrier, and sectors, and thus they cannot quantify the transition costs in the overall energy systems, whilst those models that describe the entire energy system have yet to be improved in terms of infrastructure description and temporal and spatial resolution [20]. Emodi et al. [21] analyzed impacts of transition policies in Nigeria towards 2040 based on the Long-range Energy Alternative Planning (LEAP) model, in which only energy mix was described. Apostolou [22] developed an optimization model to obtain the planning of hydrogen system, in which hydrogen would be used in power and transport sectors. Chen et al. [23] developed a multi-regional and multi-period optimization model of power systems in China, whilst new transmission grids and power storage facilities were not described. Zhang et al. [24] developed a multi-regional model to obtain the planning of gas pipelines in China, whilst monthly demand fluctuation and storage facilities were neglected. Pan et al. [25] developed a model of the oil supply chain in China, whilst regional variation was neglected. Mou and Li [26] obtained the optimal coal flow amongst regions in China, whilst infrastructure limitation was not taken into consideration, such as production capacity and transmission capacity.
Most bottom-up models of hydrogen supply systems focus on green hydrogen rather than blue hydrogen, and impacts of hydrogen systems on the power and fossil energy systems are not analyzed. Samsatli and Staffell [27] developed a wind-hydrogen integrated optimization model to obtain the optimal hydrogen system planning in Great Britain. Baufume and Grueger [28] developed a hydrogen pipeline optimization model using Geographical Information System (GIS) method, and all hydrogen was produced from renewable power. A hydrogen-renewable system model was developed to analyze the impacts of hydrogen systems on curtailment reduction [29].
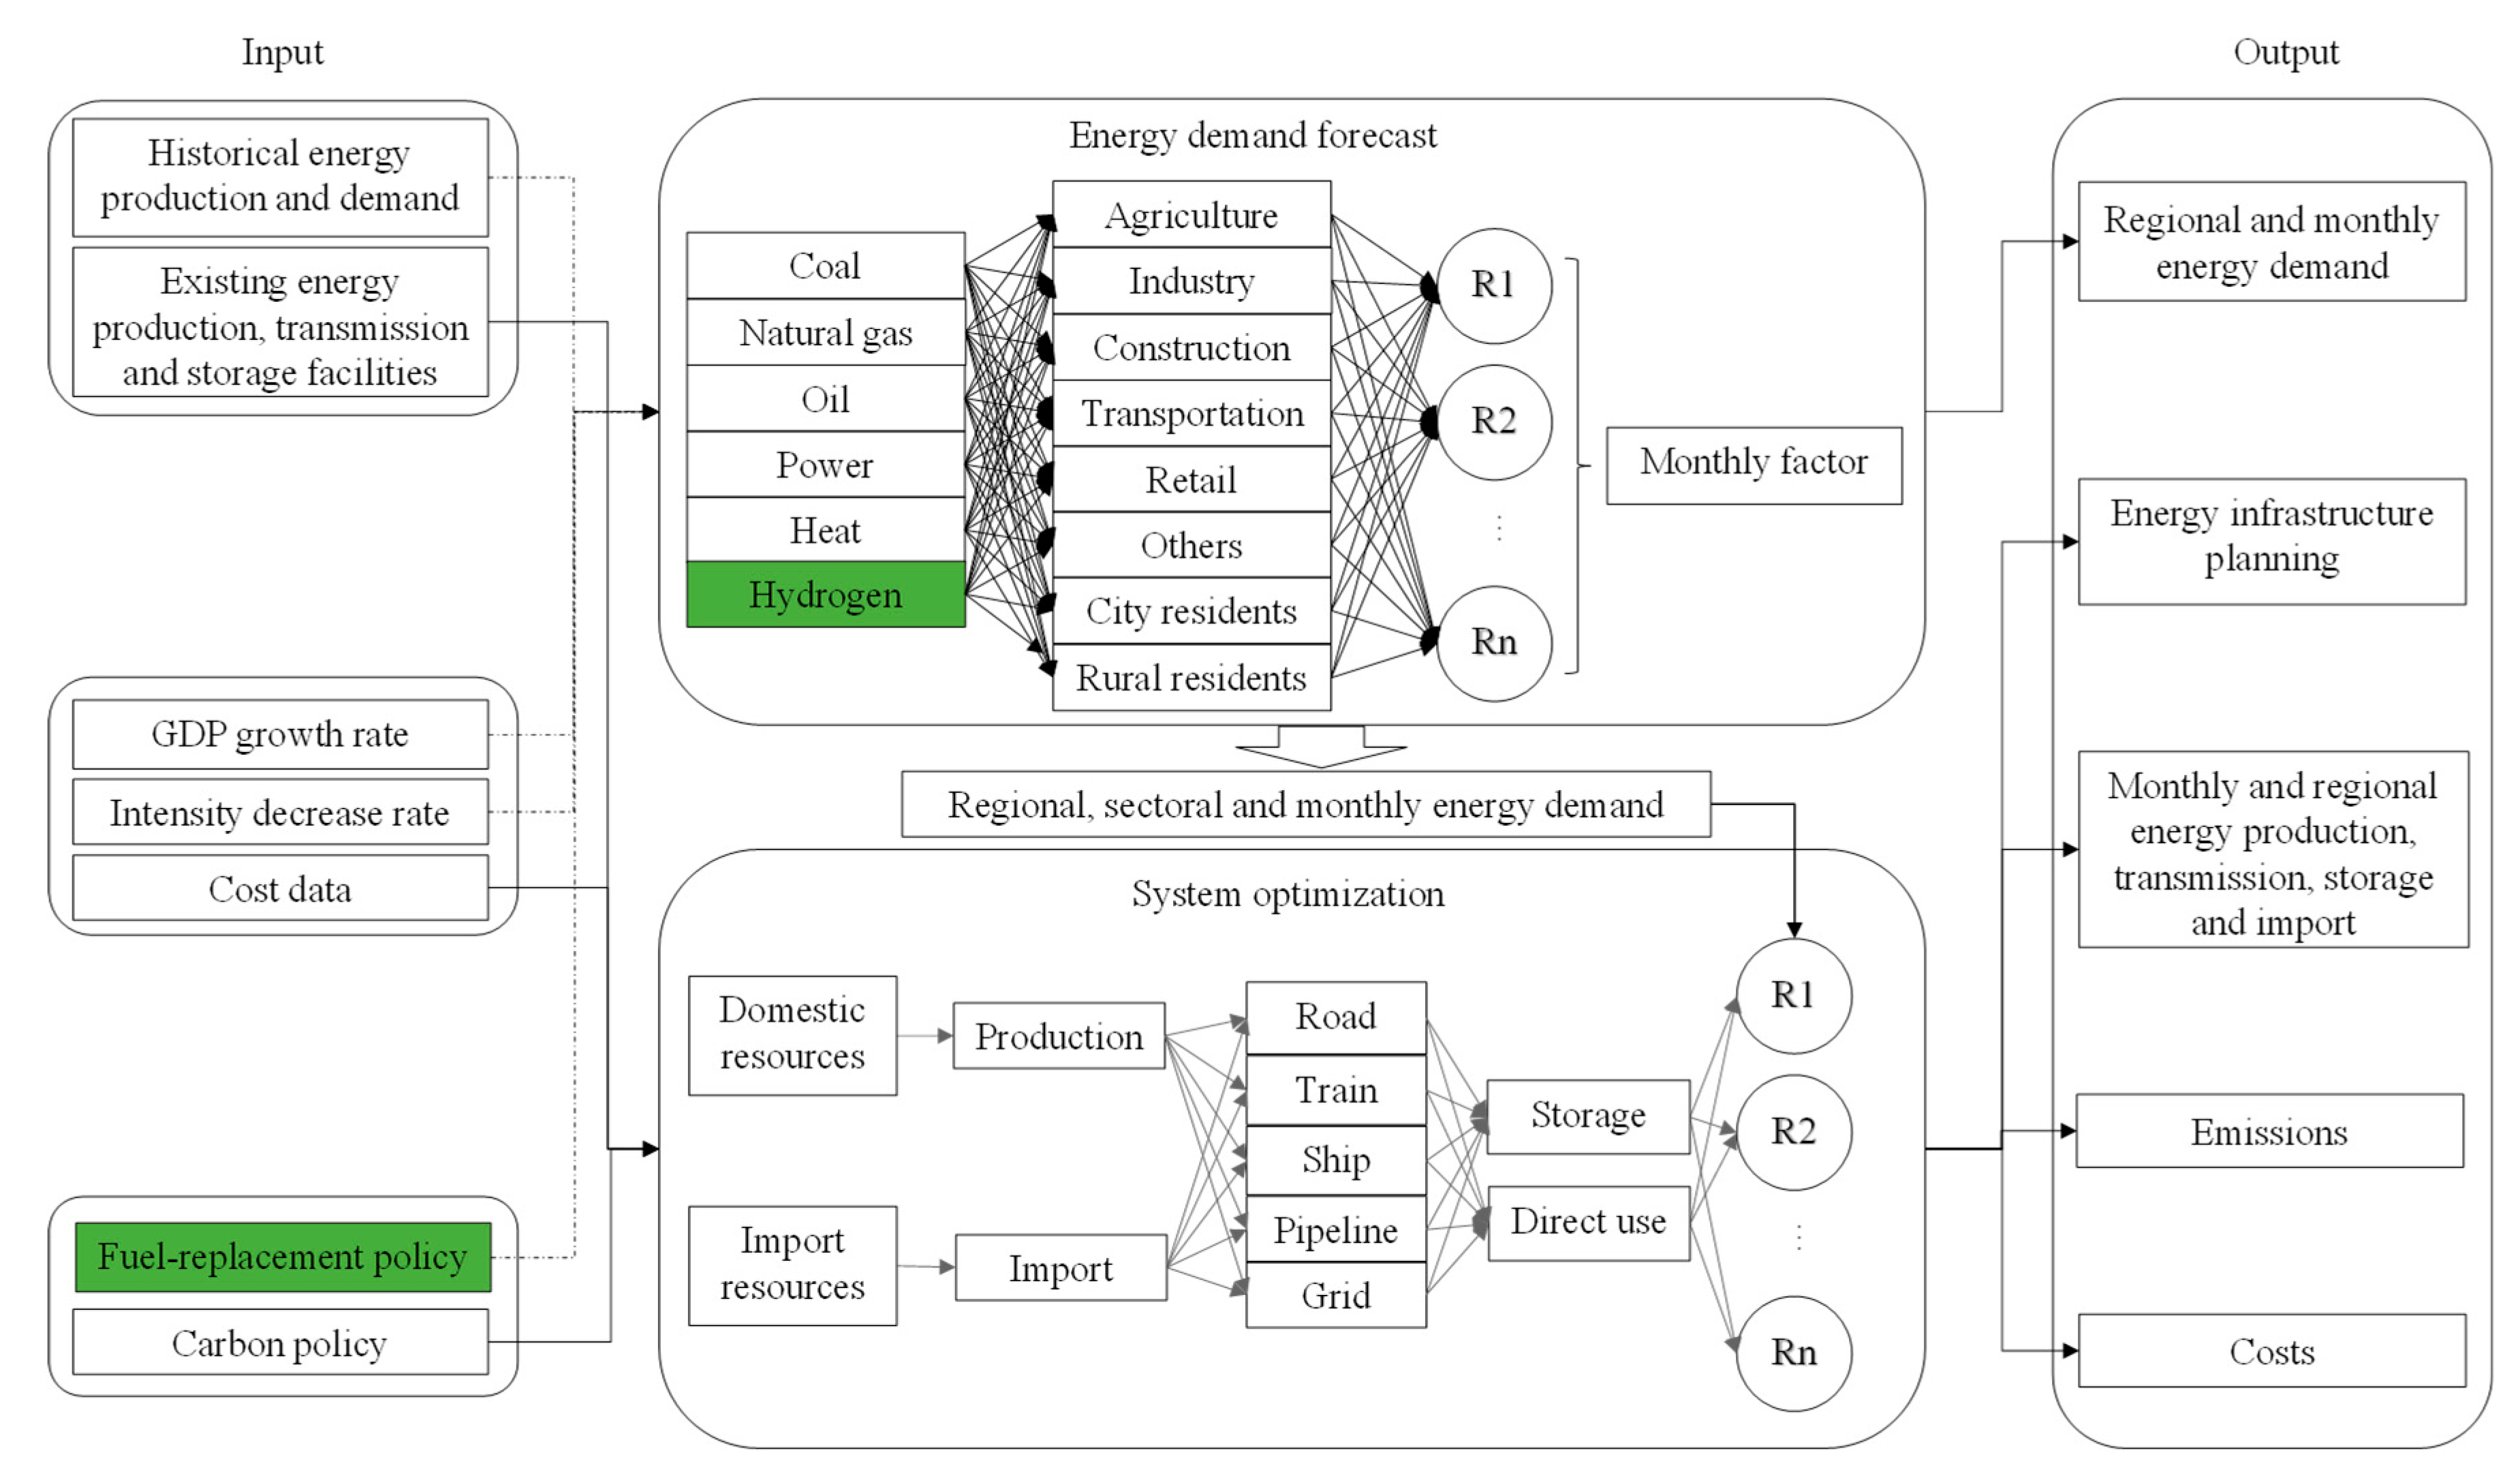
In our previous work, we developed the China Regional Energy Supply System Optimization Model (CRESOM) [30], which is a multi-regional, multi-period and infrastructure-based optimization model integrating coal, natural gas, oil and power systems in China, to obtain the energy system planning strategy with least costs. The pathway with least costs oriented from stated transition targets in 2050 was then analyzed, and the infrastructure planning strategy was pointed out [31]. However, Hydrogen systems and carbon removal technologies were not included in CRESOM, so that transition pathways towards carbon neutral could not be described.
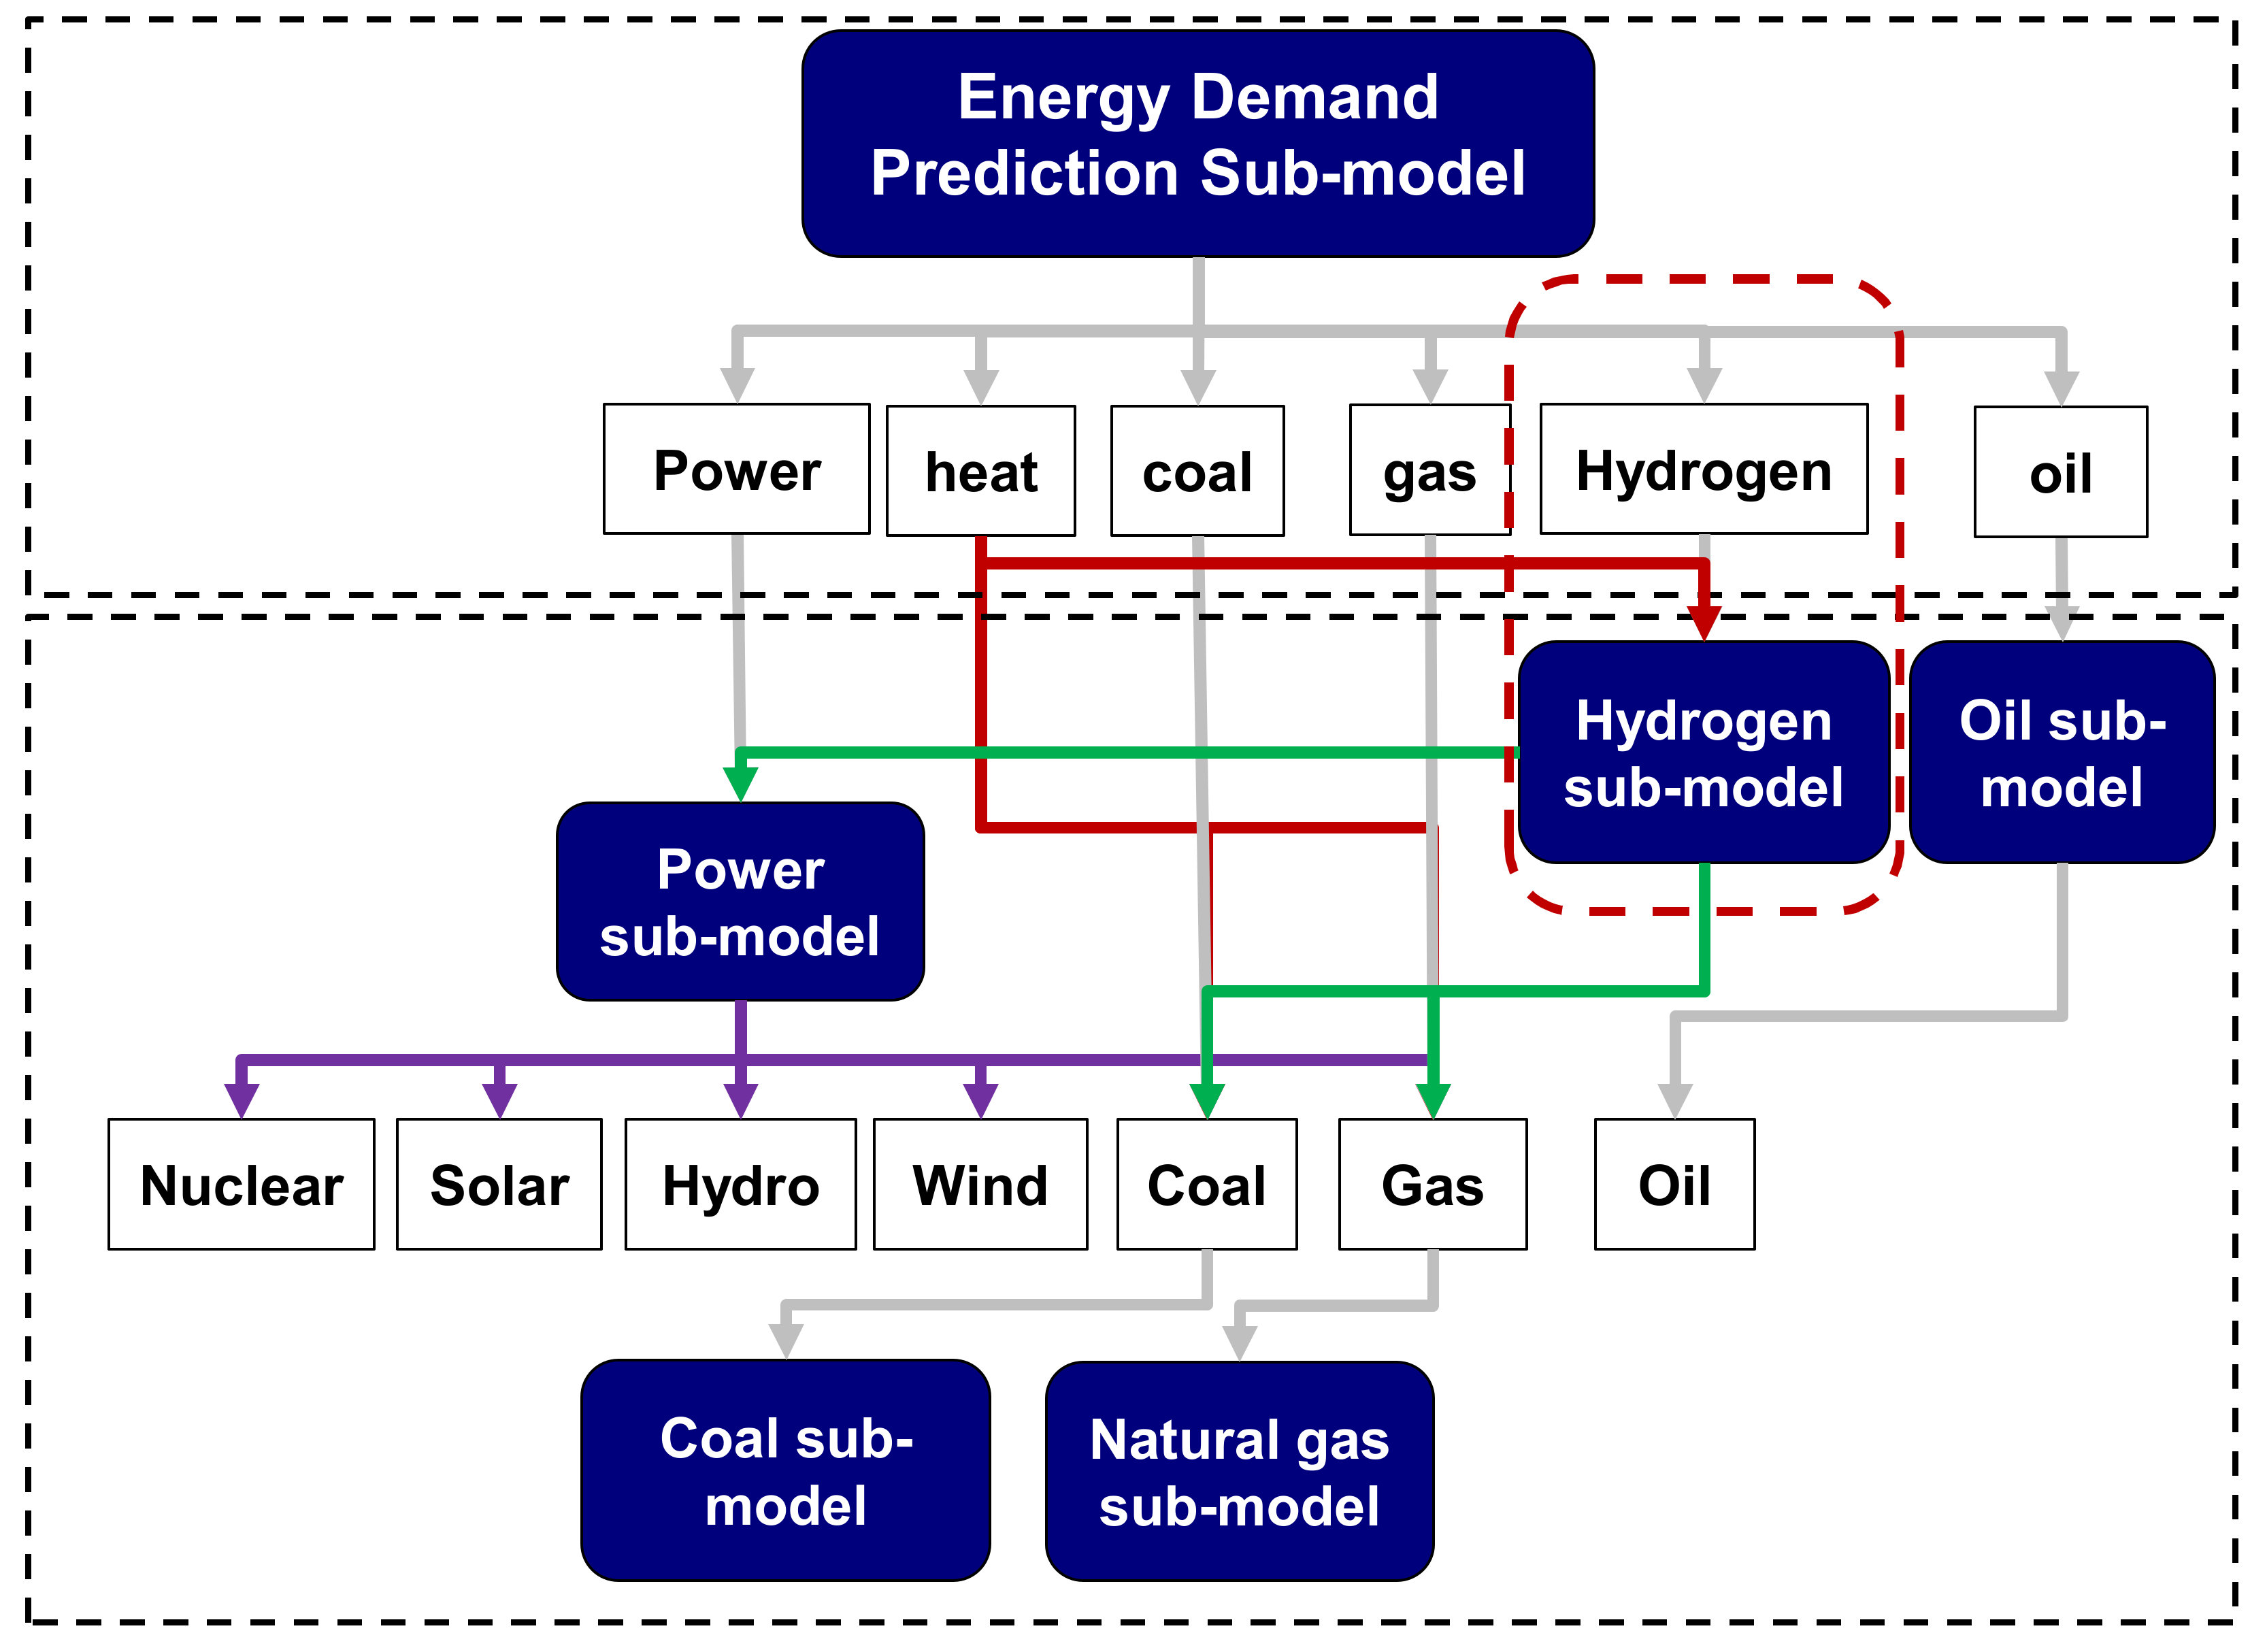
In this paper, CRESOM is applied and improved to carry out this analysis. Firstly, a hydrogen system planning sub-model with multiple production options, including fossil fuels and non-fossil power, is developed and integrated into the existing model, so that the improved CRESOM can describe transition pathways towards carbon neutral. Secondly, representative transition pathways are designed applying low carbon technologies and varying degrees of strategies mentioned above, namely improving electrification and hydrogen penetration in final use, raising carbon prices and applying carbon removal technologies. Thirdly, the optimal energy system planning and transition costs in all pathways are obtained and compared using improved CRESOM, and impacts of technology choice on hydrogen production are analyzed.
China is taken as a case study, the largest energy consumer with growing energy demand. In 2019, China accounted for 24% of global primary energy consumption and 29% of global carbon emissions, and fossil fuels still accounted for 85% in primary energy supply in China [2]. According to BP Outlook 2019 [32], total energy demand in China would keep growing with an average annual growth rate of 1.1% from 2017 to 2040. China has pledged to carry out low carbon transition and reduce carbon emissions. In stated policies, non-fossil energy would account for 15%, 20%, and 50%of primary energy demand in 2020, 2030 and 2050 respectively [13].
The novelty of this paper can be summarized as three points compared with previous studies. Firstly, an infrastructure-based hydrogen supply system model is developed and integrated with coal, natural gas, oil and power systems, so that impacts of hydrogen system planning on existing energy systems can be analyzed, and impacts of hydrogen production technology is pointed out. Secondly, a bottom-up and infrastructure-based model describing entire energy systems can be applied to obtain energy system planning strategies with least costs. Thirdly, energy system transition costs and corresponding planning strategies oriented from various transition targets are pointed out, with higher resolution compared to other models.
This paper is organized as follows. In Section 2, the methodology is illustrated. In Section 3, the design of all scenarios is described. In Section 4, results are demonstrated and discussed. In Section 5, the main conclusions are summarized.

2. Methodology

2.1. Modelling Framework

CRESOM is designed to predict energy demand in end-use sectors given specific assumptions and obtain the optimal planning strategy of energy supply systems with least costs by optimization. CRESOM describes 30 regions in China, and the supply and demand balance is on a monthly scale. The planning period covers from 2016 to 2050. National coal, natural gas, oil, power and hydrogen systems are described, whilst other renewable resources such as biomass and geothermal are neglected due to the relatively small scale.
The framework of CRESOM is shown in Figure 1, and the marked part has been improved. Input data comprise of three categories, namely historical input, forecast input and scenario input. Historical input describes historical energy production and demand, and existing infrastructure. Forecast input comprises of forecast of GDP, energy intensity and technology costs. Scenario inputs are used to design scenarios, and the capability to improve hydrogen penetration in final energy use is added. The calculation has two parts. Firstly, CRESOM can forecast final energy demand of each energy carrier in each region, sector and month, and the function to forecast hydrogen demand is added. Energy demand is forecast based on GDP and energy intensity forecast in each region, sector and year, considering fuel-replacement policies in scenario input. Secondly, given future final energy demand, CRESOM can obtain the optimal planning strategy of coal, gas, oil, power and hydrogen systems by optimization, and the hydrogen sub-model is newly added in this paper. The objective function describes overall costs in energy supply chains in a long term, including energy production, import, transmission, processing and infrastructure costs. Energy distribution costs are excluded in the objective function. Firstly, adding distribution costs or not with current spatial resolution cannot affect the outcome of optimization, because that would be a constant number in the objective function. Secondly, distribution costs cannot be calculated precisely with current spatial resolution, and adding it into the objective function would reduce the accuracy of the system overall costs. The output of CRESOM includes energy demand forecast, energy system planning, energy flows amongst regions, and carbon emissions.
The interactions amongst sub-models in CRESOM is shown in Figure 2, and the hydrogen sub-model is newly added. Firstly, the energy demand prediction sub-model is applied to forecast energy demand in end-use sectors. Secondly, final product oil demand is set as input data for the oil sub-model, and the optimal system planning of oil systems can be obtained by optimization. Thirdly, total hydrogen demand, comprising of final hydrogen demand and hydrogen demand in heat generation, is set as input for the hydrogen sub-model, and the optimal planning of the hydrogen system can be obtained as well. Fourthly, total power demand includes final power demand and power in hydrogen generation, and is set as input for the power sub-model. Similarly, total coal and natural gas demand comprises of final demand, and demand in heat, hydrogen and power generation. Lastly, the optimal planning of coal and natural gas systems can be obtained by coal and natural gas sub-models.
The hydrogen sub-model is illustrated in the following part, and other parts have been introduced in detail in previous studies [30].

2.2. Hydrogen Sub-Model

2.2.1. General Description

The hydrogen sub-model is developed to obtain the optimal planning strategy of hydrogen supply systems. Superstructure modelling methods are applied to develop the hydrogen sub-model, which describe multiple feasible strategies to balance hydrogen supply and demand, and obtain the strategy with least costs by optimization. The hydrogen sub-model forms a mixed integer liner programming (MILP) problem. A MILP problem generally comprises of parameters, variables, constraints and the objective function.
In the hydrogen sub-model, parameters indicate input data, including resources, geographical information, forecast input in CRESOM, and hydrogen penetration in end-use sectors. Variables can be distinguished as design variables and operational variables, describing infrastructure capacity and infrastructure application respectively. In this model, hydrogen generation capacity, pipeline transmission capacity and storage capacity are design variable. Hydrogen generation, transmission, and storage are operational variables. Equality constraints describe the demand forecast, supply-demand balance and infrastructure expansion. Inequality constraints include constraints of resources, geographical location and infrastructure capacity. Objective function indicates the overall system costs in a long period. The nomenclature is shown in Appendix A.

2.2.2. Equality Constraints

In CRESOM, hydrogen demand is forecast in each region, sector, month and year. Firstly, energy demand in each region, sector and year equals to GDP multiplied by energy intensity based on forecast input. Then, yearly hydrogen demand equals to energy demand multiplied by hydrogen penetration, based on scenario input. Lastly, monthly hydrogen demand equals to yearly hydrogen demand multiplied by a monthly factor. Therefore, monthly hydrogen demand in each sector and region can be obtained, as shown in Equation (1). Equation (2) describes the balance of hydrogen supply and demand in each month and region. In each region, total hydrogen supply comprises of local hydrogen generation, net transmission from other regions and net reduction of local hydrogen storage. Hydrogen infrastructure expansion is described in Equations (3)–(5), including generation capacity, pipeline capacity, and storage capacity.
D r , t , m = G D P r , t × I D r , t × H S r , t × M F r , m
D r , t , m = e g e e , r , t , m + r r ( t p r r , r , t , m - t p r , r r , t , m + t r r r , r , t , m - t r r , r r , t , m ) + ( b s r , t , m e s r , t , m )
g c e , r , t = g c e , r , t - 1 + i n g e , r , t
p c r , r r , t = p c r , r r , t - 1 + i n p r , r r , t
s c r , t = s c r , t - 1 + i n s r , t

2.2.3. Inequality Constraints

Inequality constraints include resource constraints, infrastructure constraints and geographical constraints. Resources constraints indicate that hydrogen generation capacity is limited by upper bound of exploitable renewable resources, as shown in Equation (6). The upper bound of renewable power generation capacity in this model keeps consistent with previous studies [33]. The monthly fluctuation of renewable resources comes from historical data [34]. Infrastructure constraints indicate that hydrogen generation, transmission and storage are limited by generation capacity, transmission capacity and storage capacity, as shown in Equations (7)–(9). Geographical constraints indicate that hydrogen can be transmitted only between adjacent regions, as shown in Equations (10)–(11). Binary variables are applied to describe the location of two regions. It would equal to 1 if two regions are adjacent. Otherwise, it would be 0.
R e , r , t , m g e e , r , t , m
g e e , r , t , m t t 0 i n g e , r , t / 12
t p r , r r , t 0 , m t t 0 i n p r , r r , t / 12
e s r , t , m t t 0 i n s r , t
- L × b r , r r t p r , r r , t , m L × b r , r r
( b r , r r 1 ) × L t r t r , r r , t , m

2.2.4. The Objective Function

The objective function describes the overall costs during a long period, including transmission cost, infrastructure investment cost, fuel cost and carbon cost, and the overall costs can be calculated using a discount rate, as shown in Equations (12)–(16).
c = t ( ( t c t t + t c i t + t c f t + t c c t ) / ( 1 + D I S ) t 2016 )
t c t t = r , r r , m ( t p r , r r , t , m × D R r , r r × C T P + t r r , r r , t , m × D R r , r r × C T R )
t c f t = e , r , m g e e , r , t , m × G F e , t × C F e , r , t
t c i t = e , r i n g e , r , t × C G e , t + r , r r i n p r , r r , t × D R r , r r × C P t + r i n s r , t × C S t
t c c t = e , r , m g e e , r , t , m × G F e , t × F C e × C C t
Equations above make up a MILP problem, and the problem is solved on the platform of General Algebraic Modeling System (GAMS) [35].

3. Scenarios and Assumptions

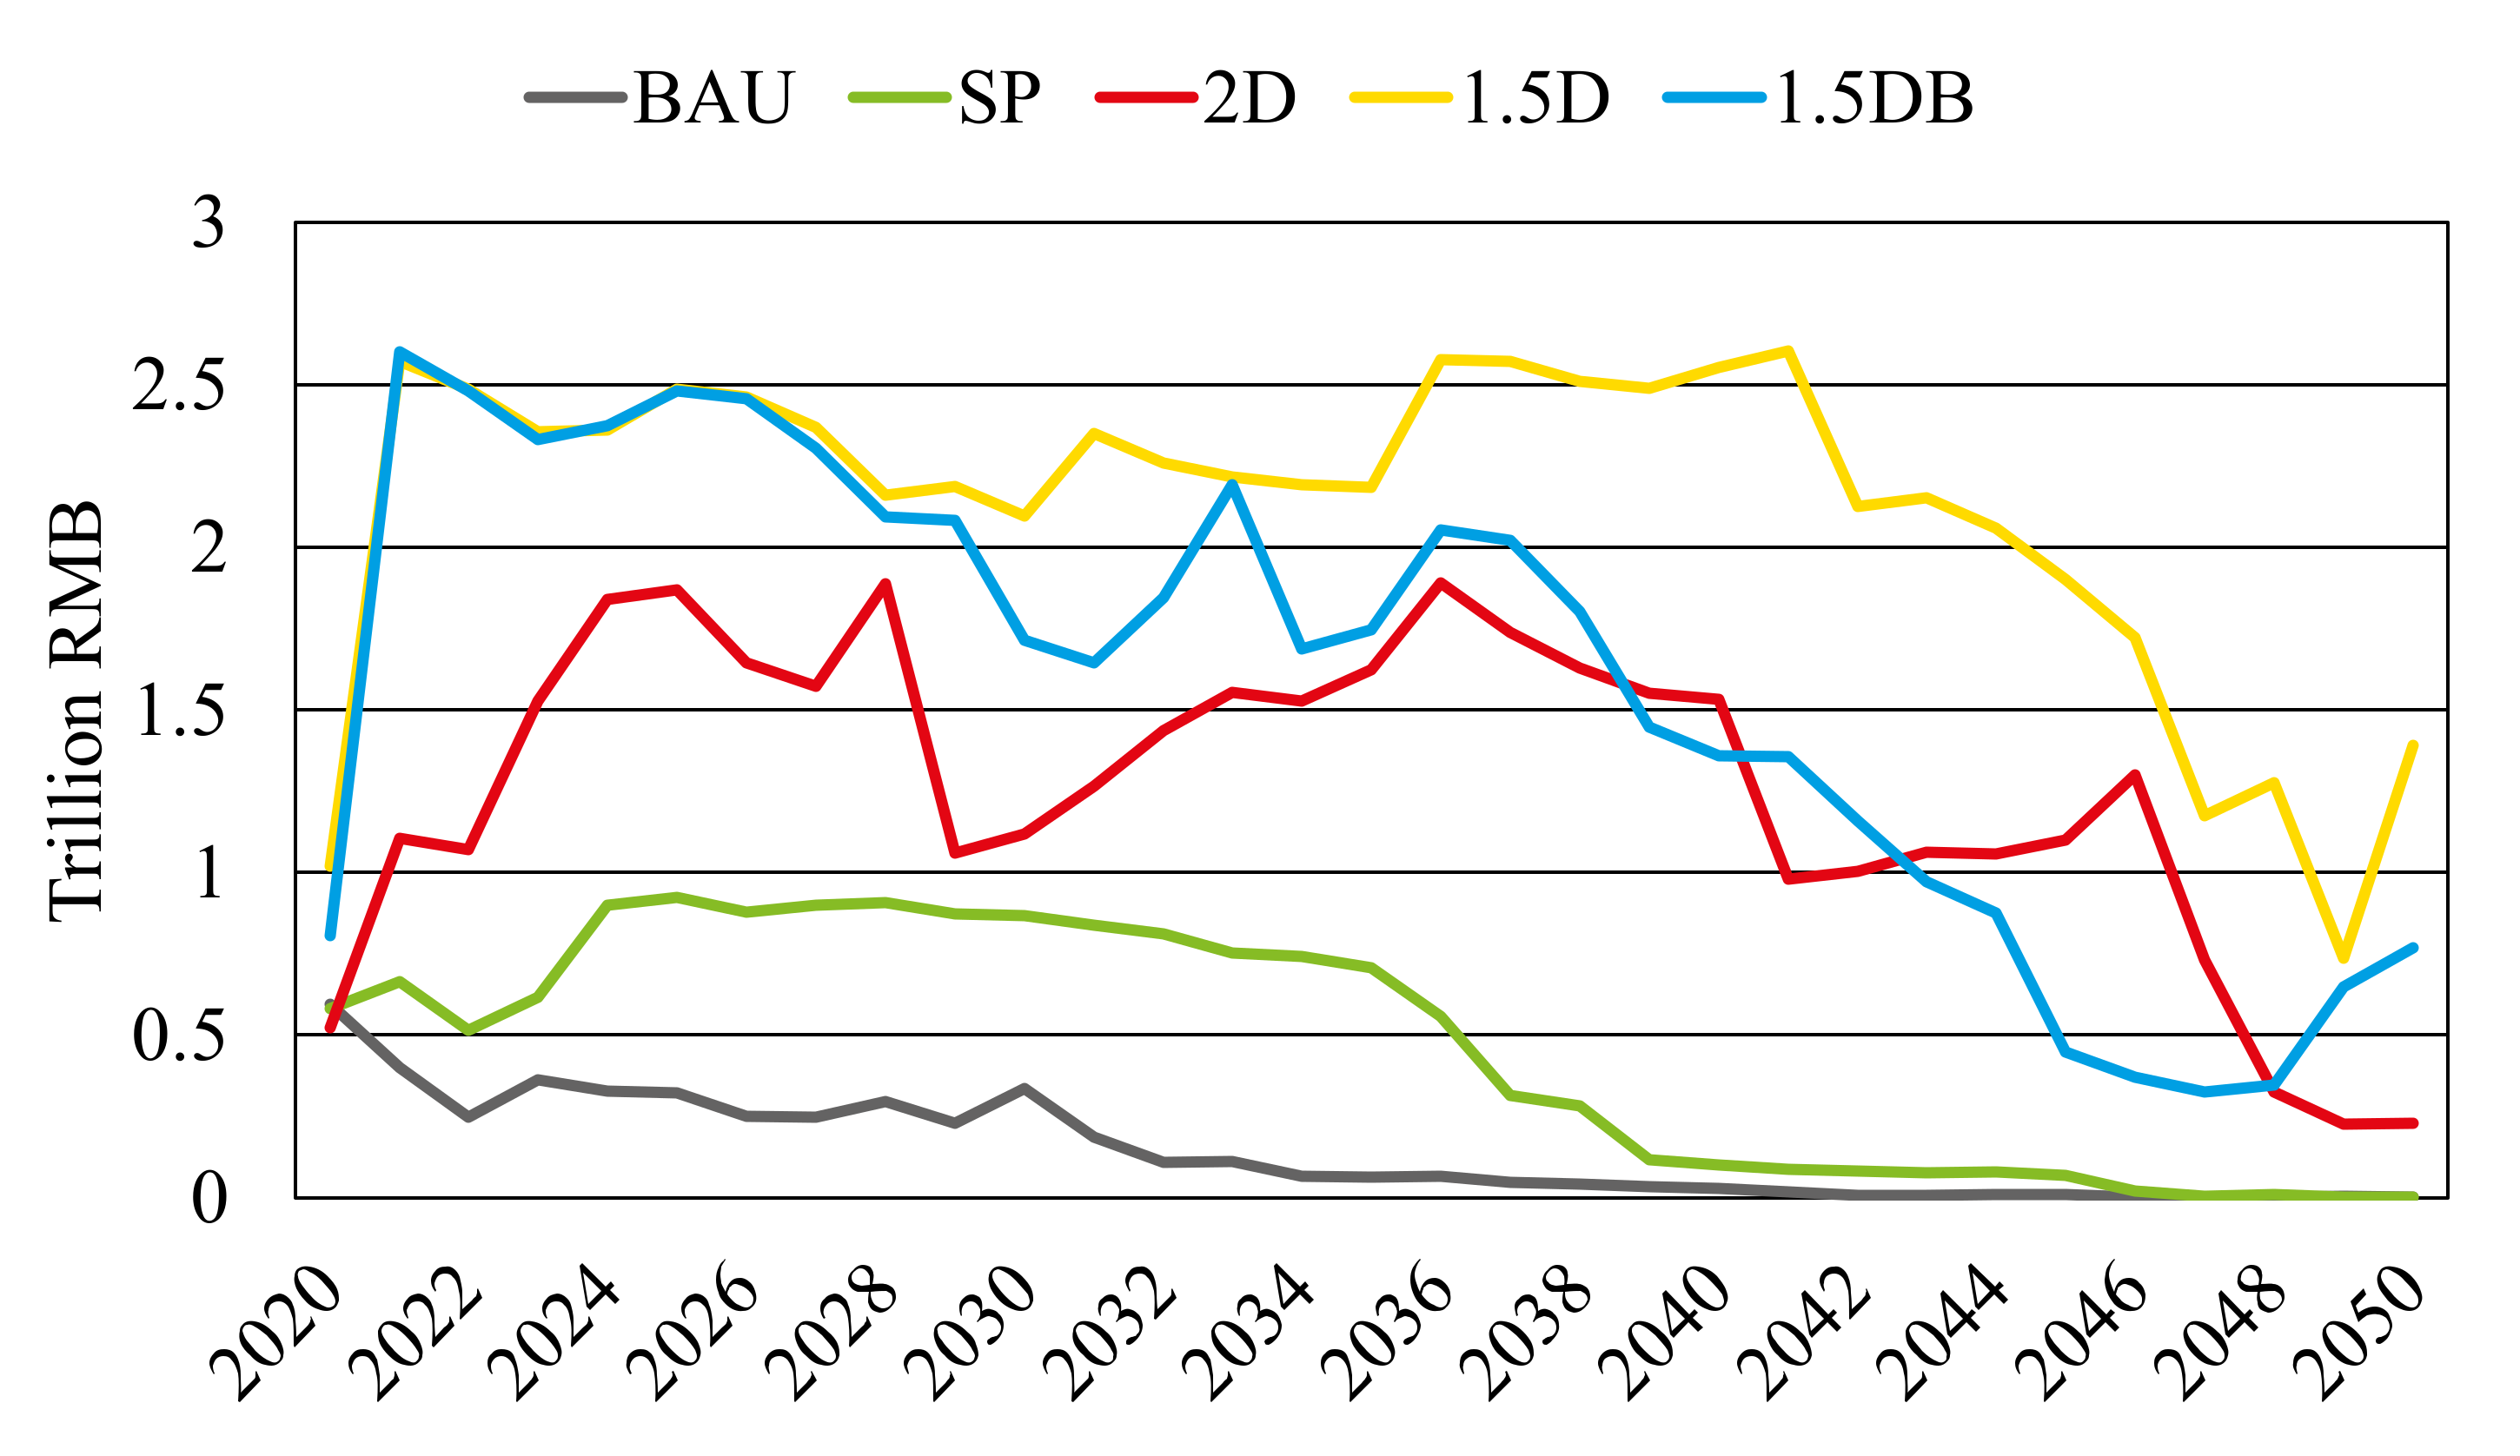
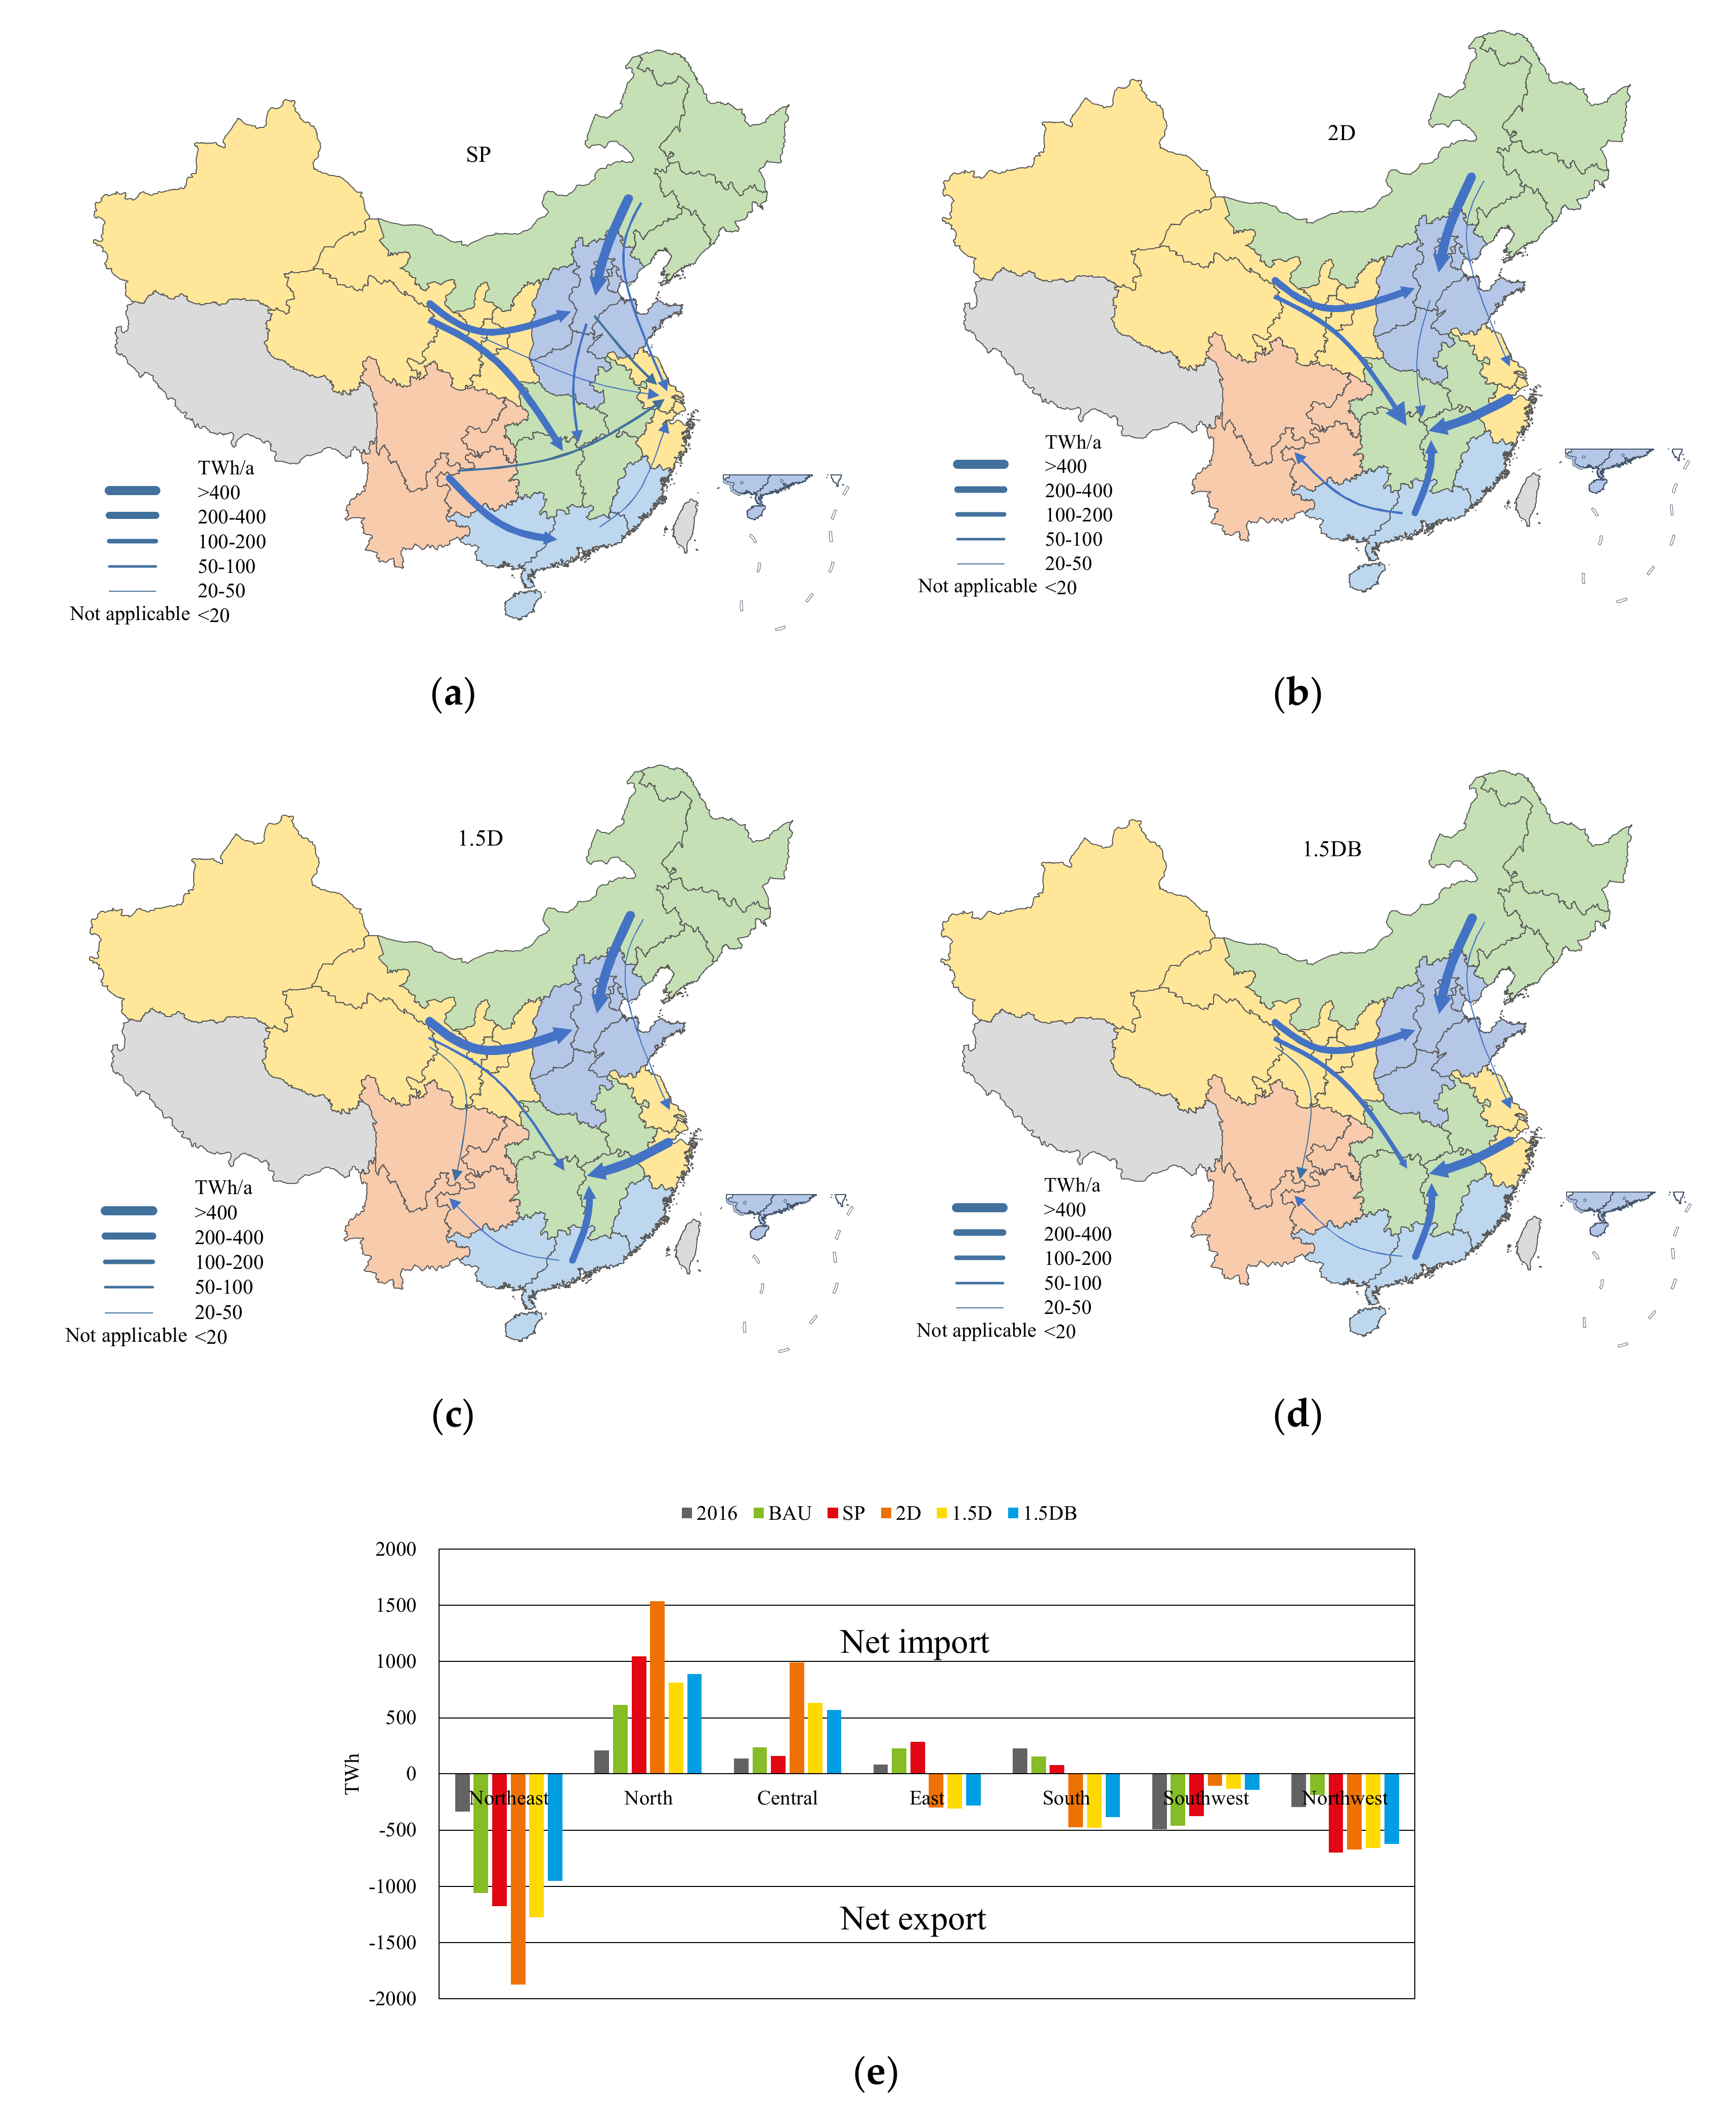
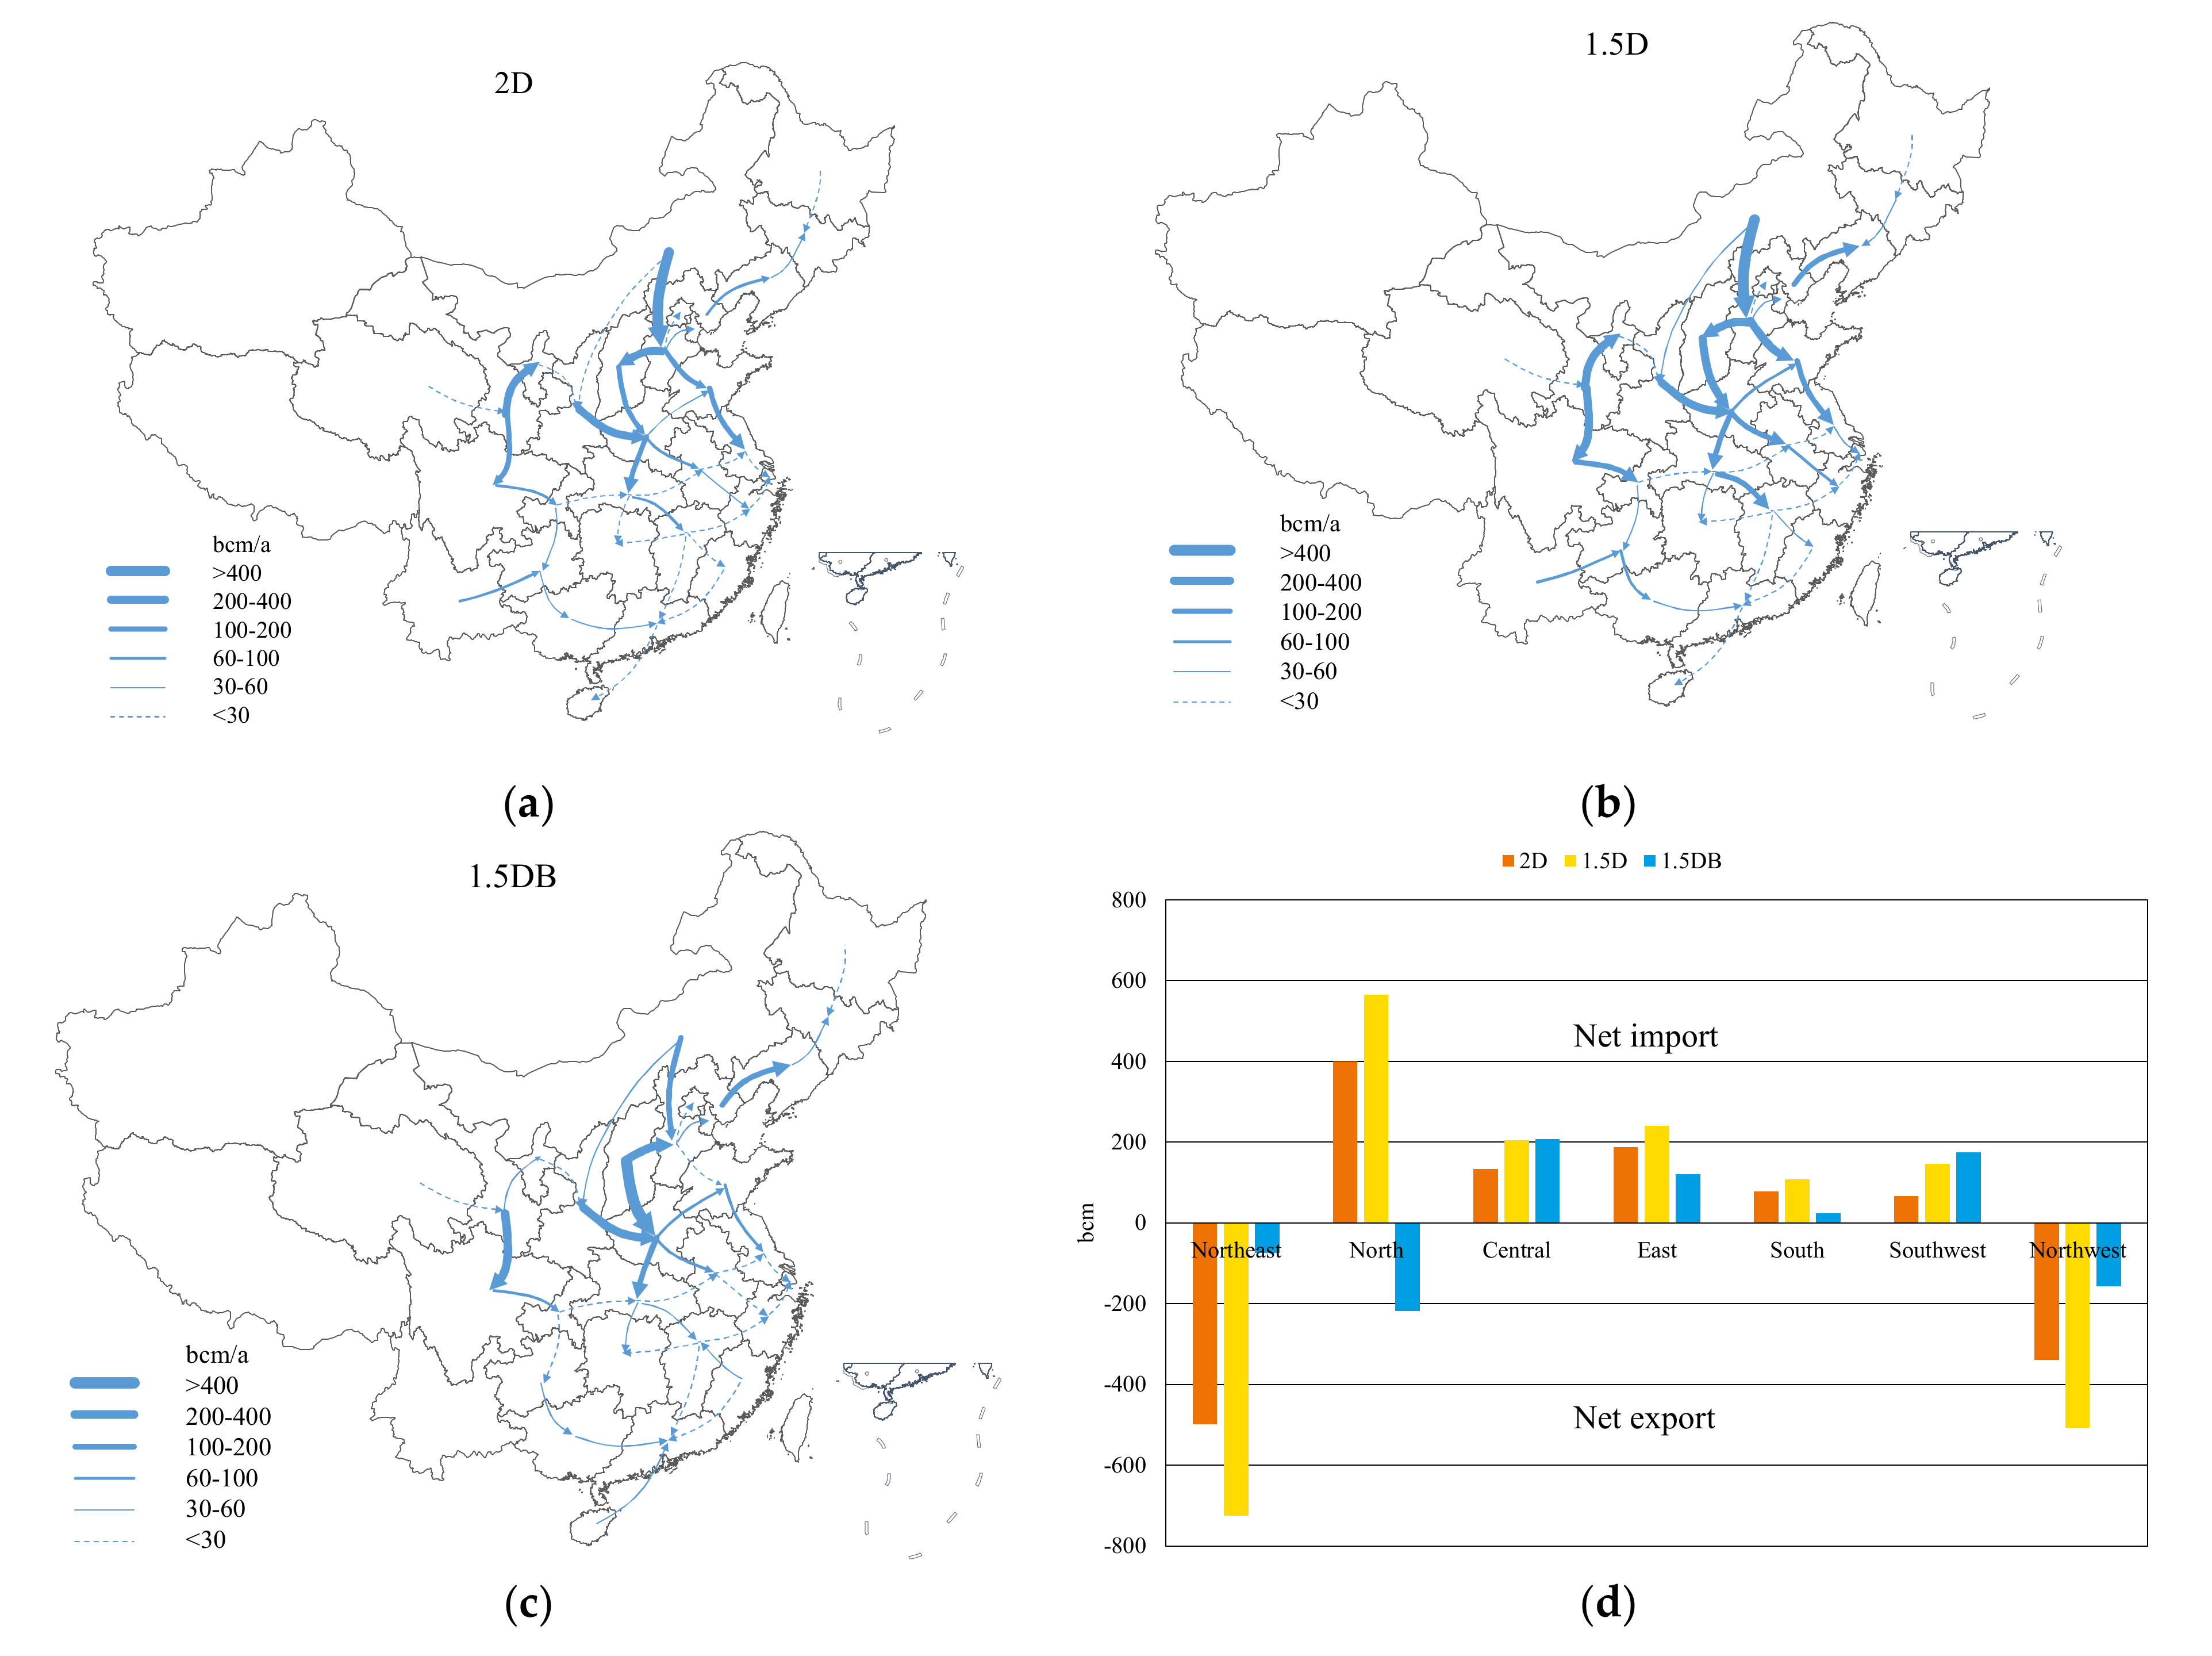
Five representative transition pathways are designed to fulfill different transition targets. The business-as-usual scenario (BAU) describes the pathway which does not necessarily to fulfill any transition targets, whilst the low carbon transition is still under way due to efficiency improvement and cost reduction along with technology progress. The stated policy scenario (SP) describes the pathway to achieve stated policies by improving non-fossil and natural gas shares in primary energy supply. In current policies, non-fossil energy is expected to account for 50% by 2050, and natural gas is expected to account for 20% by 2030. The 2-degree scenario (2D) describes the pathway to achieve the target of “well below 2 degree” in the Paris Agreement, which indicates to reach carbon neutral by 2070. In the 2D scenario, carbon emissions are assumed to be cut by 72% by 2050 compared to emissions in 2016, because the planning period in CRESOM only covers from 2016 to 2050. The 1.5-degree scenario (1.5D) describes the pathway to achieve the target of “1.5 degree” in the Paris Agreement, which indicates to reach carbon neutral by 2050. Consequently, in the 1.5D scenario, carbon emissions are expected to decrease by 98% by 2050 compared to 2016, and all hydrogen is produced from non-fossil power. Although some emissions would still be retained, carbon neutral would still be achieved because of the carbon sink. In view that hydrogen can be produced from fossil fuels, and carbon neutral can still be achieved applying carbon capture and storage, the 1.5-degree scenario with blue hydrogen (1.5DB) is designed for comparison, and all hydrogen is produced from fossil fuels with CCS facilities.
Various transition targets are fulfilled by implementing transition strategies with varying degree in these five pathways, as shown in Table 1. The forecast input in CRESOM are consistent in all scenarios, which indicates that energy efficiency improvement and costs reduction along with technology progress are consistent in all scenarios, as shown in Appendix B. Transition strategies in all scenarios are designed by varying scenario input. Low, moderate, medium, high, and aggressive represent different degrees of fuel replacement in end-use sectors. Aggressive transition approaches would result in higher penetration of power and hydrogen in final energy demand, and quantitative indicators in these scenarios are shown in Table 2.
In the SP scenario, current policies indicate to improve power and natural gas shares in final energy use to partly replace coal and oil, and carbon prices are set to improve renewable power shares in power generation to raise non-fossil energy shares in the primary energy supply. Hydrogen and CCS are assumed not to be widely applied in the SP scenario according to current policies.
In the 2D scenario, more aggressive strategies are expected to be implemented than the SP scenario to cut emissions by 72% by 2050. Besides further improving electrification and raising carbon prices, hydrogen is expected to be widely used in end-use sectors to replace fossil fuels, and CCS is set as an optional technology in power sectors. Deploying CCS depends on whether it can reduce overall costs, which basically reflects the comparison of CCS costs and carbon prices.
In the 1.5D scenario, nearly all energy demand in end-use sectors are fulfilled by power and hydrogen in order to cut most carbon emissions in final consumption. All hydrogen is produced from power, and higher carbon prices would facilitate CCS deployment in power sectors to cut all carbon emissions in power generation.
In the 1.5DB scenario, all hydrogen is produced from fossil fuels, and CCS is applied in hydrogen production sectors in order to cut all emissions.

4. Results and Discussion

4.1. System Transition Costs

Overall system costs in order to achieve different transition targets can be obtained, including costs of production, import, processing, storage, transmission and infrastructure investment. Transition costs indicate the extra costs of energy systems in transition scenarios compared to the BAU scenario. Overall system costs and transition costs are shown in Table 3, and fuel costs are included in fuel systems. For example, coal costs in power generation are included in coal system costs rather than power system costs, and power costs in hydrogen production are included in power system costs rather than hydrogen system costs.
Implications can be summarized as three aspects. Firstly, fulfilling aggressive targets would lead to sharp increase of energy system transition costs. Results show that system transition costs would be 23.6, 43.5, and 59.4 trillion yuan to fulfill the stated policy, 2-degree and 1.5-degree targets. This indicates that to fulfill the 2-degree and 1.5-degree targets, energy supply system transition costs would be 1.8 and 2.5 times compared to fulfilling the stated-policy target. Secondly, aggressive transition strategies would significantly increase the costs of power system and carbon prices, because hydrogen and power are much more expensive than coal without carbon prices, and only high carbon prices would facilitate fuel replacement in energy end-use sectors. Thirdly, the choice of technical pathway to produce hydrogen highly depends on the cost of CCS, and the balance cost is 437 yuan per tonne in 2016 yuan. In this study, overall system costs in 1.5D and 1.5DB scenarios are similar, whilst 7.5 trillion yuan are spent to capture carbon emissions in hydrogen production. CCS has not been widely applied in energy sectors, consequently the reduction of CCS costs would be highly uncertain. Results show that the critical value of CCS cost is 437 yuan per tonne, which indicates that if the CCS cost is lower than that in the long term, producing hydrogen from coal with CCS would be an economic choice.

4.2. Investment on National Energy Infrastructure

CRESOM describes the following national major energy infrastructure: coal production capacity, national natural gas pipelines, LNG terminals, natural gas storage facilities, crude oil pipelines, product oil pipelines, oil refinery facilities, power plants, power transmission grids, batteries, hydrogen generation facilities, hydrogen storage facilities and national hydrogen pipelines. Due to the limitation of spatial resolution, energy distribution infrastructure within a region is excluded in CRESOM, whilst it would not affect the optimal strategy of system planning. Total investment and its composition are shown in Table 4.
Implications can be summarized as three points. Firstly, fulfilling aggressive transition targets would lead to significant infrastructure investment. Results show that investment in the BAU, SP, 2D and 1.5D scenarios would be 3.9, 9.1, 19.5, and 31.6 trillion yuan in 2016 net present RMB. It indicates that investment to achieve the 2-degree and 1.5-degree targets would be 2.1 and 3.5 times than achieving stated policy targets. Secondly, in all scenarios, the major part of investment is in the power system, especially renewable power, whilst investment on fossil energy is relatively low, because China has invested heavily in fossil energy infrastructure, and infrastructure in some sectors is already stranded, such as coal production capacity. Thirdly, producing hydrogen from coal with CCS rather than power would reduce investment by 17% or 5.2 trillion yuan in 2016 RMB, mainly in solar power plants and onshore wind plants, because producing hydrogen from coal would make full use of coal infrastructure without the need for new power facilities.
Figure 3 shows annual investment on energy infrastructure mentioned above from 2020 to 2050. Compared to the stated policy target, fulfilling the Paris agreement targets would result in a significant increase in energy infrastructure investment from now and for several decades. In the SP scenario, investment would gradually reduce after 2035, because total energy demand is expected to reach the summit around 2040 [32].

4.3. Stranded Fossil Energy Infrastructure Investment

Low carbon transition strategies would inevitably lead to the shutdown of some fossil energy infrastructure before they reach their lifespan, resulting in stranded costs. In China, the fossil energy infrastructure most affected by the low carbon transition includes coal production capacity, coal power and oil refining facilities. Table 5 shows the residual value of assets when infrastructure is shut down. Table 6 shows lifespan reduction on fossil energy infrastructure.
Implications can be summarized as two points. Firstly, low carbon transition strategies would significantly reduce lifespan of fossil energy infrastructure and result in considerable stranded investment. Results show that stranded investment to fulfill 2-degree and 1.5-degree targets would be 3.1 and 4.4 times than achieving stated policy targets. Secondly, coal production capacity plays an important role in stranded costs, and producing hydrogen from coal to achieve 1.5-degree targets would reduce stranded costs by 35% or 0.835 trillion yuan in 2016 RMB.

4.4. Energy System Planning

To fulfill aggressive transition targets, power and hydrogen systems would play a critical role in low-carbon energy systems, whilst fossil energy systems are expected to reduce. Therefore, this paper highlights the planning of power and hydrogen systems, especially the impacts of fulfilling the 2-degree and 1.5-degree targets.

4.4.1. Power System Planning

Aggressive transition strategies would significantly increase power demand, due to deep electrification and to great demand produce green hydrogen, and consequently result in rapid construction of power facilities. National power system planning indicators are shown in Table 7.
Non-fossil power plants and storage facilities would increase tremendously to achieve aggressive targets, including nuclear, wind and solar power, whilst hydropower is limited by exploitable resources. Results show that nuclear, onshore wind, offshore wind and solar power capacity would reach 872, 3223, 453 and 7116 GW in the 1.5D scenario, which is 2.9, 3.0, 2.4, and 4.5 times than that in the SP scenario respectively. Consequently, storage capacity in the 2D and 1.5D scenarios is 6.6 and 8.9 times than that in the SP scenario in order to integrate massive renewable power with huge volatility.
CCS technology is expected to apply on coal power and gas power to fulfill the 1.5-degree target, and gas power capacity is expected to be higher than coal power. Firstly, gas power is more flexible than coal power to change output load, and thus the capability of gas power to integrate renewable power is better. Secondly, due to high carbon costs and less carbon intensity, gas power is expected to be cheaper than coal power, despite the fact that coal is cheaper than gas.
Power flows amongst seven major regions would be significantly changed to fulfill 2-degree and 1.5-degree targets, whilst it would keep consistent with current power flows in the SP scenario, as shown in Figure 4. Currently, power is transmitted from inland regions with abundant coal and renewable resources to coastal regions, and this status is expected to be strengthened to fulfill state policy targets, as shown in Figure 4a. To fulfill 2-degree and 1.5-degree targets, East China and South China are expected to export power to inland regions rather than importing power. On the one hand, with the rapid growth of power demand and the decrease of fossil power, the scale of renewable power in resource-rich regions is gradually constrained by exploitable resources. On the other hand, with the fast decrease of renewable power costs, local renewable power in coastal regions is expected to be cheaper than importing renewable power from inland regions.

4.4.2. Hydrogen System Planning

Since hydrogen demand is relatively small now, fulfilling the transition targets indicates to build a complex hydrogen system from scratch, including production, transmission and storage facilities. The technology choice to produce hydrogen is critical to the layout of the system. In this paper, hydrogen is produced from renewable power in the 2D and 1.5D scenario, and hydrogen is produced from fossil fuels, mainly coal, in the 1.5DB scenario. Key indicators of hydrogen system planning are shown in Table 8. Hydrogen flows amongst all regions are shown in Figure 5.
Producing hydrogen from fossil fuels with CCS would result in less production capacity and pipelines, but more storage facilities. Firstly, abundant and cheap coal resources locate in only a few northern provinces. Considering that hydrogen transmission is expensive than coal transmission, it is cheaper to import hydrogen directly from the nearby provinces with abundant coal resources, but cheaper to import coal for most provinces which are far from coal-abundant provinces. Therefore, pipeline networks in the 1.5DB scenario are smaller than the 1.5D scenario. Secondly, hydrogen storage capacity aims to address seasonal fluctuation of hydrogen demand, and spare production capacity and pipeline networks are also helpful. In the 1.5D scenario, larger pipeline networks can help to tackle demand fluctuation by coordinating amongst regions, whilst in the 1.5DB scenario, many regions have to solve the fluctuation alone by local storage facility due to no pipelines. Lastly, due to seasonal fluctuation of renewable resources, the utility rate of production capacity in the 1.5D scenario is significantly lower than that in the 1.5DB scenario, resulting in more production capacity.

5. Conclusions

In this paper, the infrastructure-based model CRESOM is improved by integrating the hydrogen supply system to describe the low carbon transition pathway in China. Representative scenarios are designed to describe transition pathways oriented from different transition targets, including targets in stated policies and the Paris Agreement. Moreover, two pathways are designed to analyze the impact of the technology choice to produce hydrogen on system planning and costs. The improved CRESOM is applied to quantify energy system transition costs and obtain corresponding energy system planning strategies with least costs in all pathways.
Results show that, fulfilling 2-degree and 1.5-degree temperature increase targets would result in 84% and 151% increases in system transition costs, 114% and 246% increases in infrastructure investment, and 211% and 339% increase in stranded investment, compared to fulfilling stated policy targets. Moreover, fulfilling 2-degree and 1.5-degree targets would reshape power systems and build hydrogen systems from scratch, whilst fulfilling stated policy targets would strengthen current trends of power system deployment. The key to choose hydrogen production technology is CCS costs, and the balance cost is 437 yuan per tonne. Besides that, producing hydrogen from coal would reduce stranded coal investment by 35%, and investment in main infrastructure by 16%, compared to producing hydrogen from renewable power.

Author Contributions

Writing—original draft, methodology, T.L.; writing—review editing, P.L.; conceptualization and supervision, Z.L. All authors have read and agreed to the published version of the manuscript.

Funding

This research was funded by The National Natural Science Foundation of China 71934006, 71690245) and the Phase III Collaboration between BP and Tsinghua University.

Institutional Review Board Statement

Not applicable.

Informed Consent Statement

Not applicable.

Data Availability Statement

No new data were created or analyzed in this study.

Acknowledgments

The authors gratefully acknowledge the support by The National Natural Science Foundation of China (71934006, 71690245) and the Phase III Collaboration between BP and Tsinghua University.

Conflicts of Interest

The authors declare no conflict of interest.

Appendix A

Table A1. Nomenclature: Subscript.
SymbolMeaningSymbolMeaning
r , r r Regions t Year
m Month e Generation technologies
Table A2. Nomenclature: Parameters.
SymbolMeaning and UnitSymbolMeaning and Unit
D P r , r r Distance by pipeline km F C e Carbon factor tCO2/t or bcm
D R r , r r Distance by road km G F e , t Fuel use bcm/t or bcm or kwh
D r , t , m Demand bcm C T X Transmission cost yuan/(bcm*km)
G D P r , t GDP yuan C G e , t Generation capacity cost yuan/(bcm/y)
I D r , t Intensity bce/yuan C P t Pipeline investment cost yuan/km
H S r , t Hydrogen share % C S t Storage facility cost yuan/bcm
M F r , m Monthly factor C F e , r , t Fuel cost yuan/ton or bcm or kwh
R e , r Resources limitation D I S Discount rate
C C t Carbon cost yuan/t
Table A3. Nomenclature: Variables.
SymbolMeaning and UnitSymbolMeaning and Unit
g e e , r , t , m Generation bcm i n g e , r , t Generation expansion bcm/y
t p r , r r , t , m Pipeline transmission bcm i n p r , r r , t Pipeline expansion bcm/y
t r r , r r , t , m Road transmission bcm i n s r , t Storage expansion bcm
b s r , t , m Store at 1st bcm t c t t Total transmission cost yuan
e s r , t , m Store at 30th bcm t c i t Total investment cost yuan
g c e , r , t Generation capacity bcm t c f t Total fuel cost yuan
p c r , r r , t Pipeline capacity bcm t c c t Total carbon cost yuan
s c r , t Storage capacity bcm c Overall cost yuan

Appendix B

Table A4. GDP and energy intensity assumptions [33].
202020352050
GDP growth rate %6.543.601.03
Energy intensity tec/104 yuan0.4930.2960.188
Table A5. Technology costs assumptions [23,36].
202020352050
Coal power yuan/W3.63.273.04
Gas power yuan/W2.9732.462.11
Nuclear power yuan/W17.24613.5213.52
Hydropower yuan/W5.9856.1006.192
Onshore wind power yuan/W74.173.59
Offshore wind power yuan/W10.54.783.71
Solar power yuan/W63.733.21
Batteries yuan/kWh2380997774
Carbon Capture and Storage yuan/tonne10001000951
Coal to hydrogen yuan/(cubic meter annual)1.5731.4591.353
Gas to hydrogen yuan/(cubic meter annual)0.75570.70100.6502
Power to hydrogen yuan/(cubic meter annual)0.81620.70910.6037
Hydrogen storage tank yuan/cubic meter 108.67.4

References

  1. IEA. World Energy Statistics 2019; IEA: Paris, France, 2019. [Google Scholar]
  2. BP. Statistical Review of World Energy; BP: London, UK, 2020. [Google Scholar]
  3. Peng, W.; Yang, J.; Lu, X.; Mauzerall, D.L. Potential co-benefits of electrification for air quality, health, and CO2 mitigation in 2030 China. Appl. Energy 2018, 218, 511–519. [Google Scholar] [CrossRef]
  4. Shafiei, E.; Davíðsdóttir, B.; Leaver, J.; Stefansson, H.; Asgeirsson, E.I. Energy, economic, and mitigation cost implications of transition toward a carbon-neutral transport sector: A simulation-based comparison between hydrogen and electricity. J. Clean. Prod. 2017, 141, 237–247. [Google Scholar] [CrossRef]
  5. Hiloidhari, M.; Baruah, D.; Kumari, M.; Kumari, S.; Thakur, I.S. Prospect and potential of biomass power to mitigate climate change: A case study in India. J. Clean. Prod. 2019, 220, 931–944. [Google Scholar] [CrossRef]
  6. Wang, X.; Du, L. Study on carbon capture and storage (CCS) investment decision-making based on real options for China’s coal-fired power plants. J. Clean. Prod. 2016, 112, 4123–4131. [Google Scholar] [CrossRef]
  7. Pang, M.; Zhang, L.; Liang, S.; Liu, G.; Wang, C.; Hao, Y.; Wang, Y.; Xu, M. Trade-off between carbon reduction benefits and ecological costs of biomass-based power plants with carbon capture and storage (CCS) in China. J. Clean. Prod. 2017, 144, 279–286. [Google Scholar] [CrossRef]
  8. Fasihi, M.; Efimova, O.; Breyer, C. Techno-economic assessment of CO2 direct air capture plants. J. Clean. Prod. 2019, 224, 957–980. [Google Scholar] [CrossRef]
  9. Martelli, E.; Freschini, M.; Zatti, M. Optimization of renewable energy subsidy and carbon tax for multi energy systems using bilevel programming. Appl. Energy 2020, 267, 115089. [Google Scholar] [CrossRef]
  10. Tanaka, K.; O’Neill, B.C. The Paris Agreement zero-emissions goal is not always consistent with the 1.5 °C and 2 °C temperature targets. Nat. Clim. Chang. 2018, 8, 319–324. [Google Scholar] [CrossRef]
  11. IPCC. Special Report on Global Warming of 1.5 °C; Cambridge University Press: Cambridge, UK, 2018. [Google Scholar]
  12. European Commission. A Clean Planet for All. A European Long-Term Strategic Vision for a Prosperous, Modern, Competitive and Climate Neutral Economy; European Commission: Brussels, Belgium, 2018. [Google Scholar]
  13. National Development and Reform Commission. Strategies on Energy Production and Consumption (2016–2030); National Development and Reform Commission: Beijing, China, 2016.
  14. Mccollum, D.; Zhou, W.; Bertram, C.; De Boer, H.-S.; Bosetti, V.; Busch, S.; Després, J.; Drouet, L.; Emmerling, J.; Fay, M.; et al. Energy investment needs for fulfilling the Paris Agreement and achieving the Sustainable Development Goals. Nat. Energy 2018, 3, 589–599. [Google Scholar] [CrossRef] [Green Version]
  15. IEA. The Future of Hydrogen; IEA: Paris, France, 2019. [Google Scholar]
  16. Fujimori, S.; Mosui, T.; Matsuoka, Y. Development of a global computable general equilibrium model coupled with detailed energy end-use technology. Appl. Energy 2014, 128, 296–306. [Google Scholar] [CrossRef]
  17. Zhang, X.; Qi, T.Y.; Ou, X.M.; Zhang, X.L. The role of multi-region integrated emissions trading scheme: A computable general equilibrium analysis. Appl. Energy 2017, 185, 1860–1868. [Google Scholar] [CrossRef]
  18. Yu, L.; Yingying, L. The economic impact of different carbon tax revenue recycling schemes in China: A model-based scenario analysis. Appl. Energy 2015, 141, 96–105. [Google Scholar]
  19. Wang, P.; Dai, H.; Ren, S.-Y.; Zhao, D.-Q.; Masui, T. Achieving Copenhagen target through carbon emission trading: Economic impacts assessment in Guangdong Province of China. Energy 2015, 79, 212–227. [Google Scholar] [CrossRef]
  20. Debnath, K.B.; Mourshed, M. Challenges and gaps for energy planning models in the developing-world context. Nat. Energy 2018, 3, 172–184. [Google Scholar] [CrossRef] [Green Version]
  21. Emodi, N.V.; Emodi, C.C.; Murthy, G.P.; Emodi, A.S.A. Energy policy for low carbon development in Nigeria: A LEAP model application. Renew. Sustain. Energy Rev. 2017, 68, 247–261. [Google Scholar] [CrossRef]
  22. Apostolou, D. Optimisation of a hydrogen production–storage–re-powering system participating in electricity and transportation markets. A case study for Denmark. Appl. Energy 2020, 265, 114800. [Google Scholar] [CrossRef]
  23. Chen, S.; Liu, P.; Li, Z. Multi-regional power generation expansion planning with air pollutants emission constraints. Renew. Sustain. Energy Rev. 2019, 112, 382–394. [Google Scholar] [CrossRef]
  24. Zhang, Q.; Li, Z.; Wang, G.; Sun, Z. Study on the impacts of natural gas supply cost on gas flow and infrastructure deployment in China. Appl. Energy 2016, 162, 1385–1398. [Google Scholar] [CrossRef]
  25. Pan, L.; Liu, P.; Li, Z. A system dynamic analysis of China’s oil supply chain: Over-capacity and energy security issues. Appl. Energy 2017, 188, 508–520. [Google Scholar] [CrossRef]
  26. Mou, D.; Li, Z. A spatial analysis of China’s coal flow. Energy Policy 2012, 48, 358–368. [Google Scholar] [CrossRef]
  27. Samsatli, S.; Staffell, I.; Samsatli, N.J. Optimal design and operation of integrated wind-hydrogen-electricity networks for decarbonising the domestic transport sector in Great Britain. Int. J. Hydrog. Energy 2016, 41, 447–475. [Google Scholar] [CrossRef]
  28. Baufumé, S.; Grüger, F.; Grube, T.; Krieg, D.; Linssen, J.; Weber, M.F.; Hake, J.-F.; Stolten, D. GIS-based scenario calculations for a nationwide German hydrogen pipeline infrastructure. Int. J. Hydrog. Energy 2013, 38, 3813–3829. [Google Scholar] [CrossRef]
  29. Colbertaldo, P.; Agustin, S.B.; Campanari, S.; Brouwer, J. Impact of hydrogen energy storage on California electric power system: Towards 100% renewable electricity. Int. J. Hydrog. Energy 2019, 44, 9558–9576. [Google Scholar] [CrossRef]
  30. Li, T.; Liu, P.; Li, Z. A multi-period and multi-regional modeling and optimization approach to energy infrastructure planning at a transient stage: A case study of China. Comput. Chem. Eng. 2020, 133, 106673. [Google Scholar] [CrossRef]
  31. Li, T.; Liu, P.; Li, Z. Quantitative relationship between low-carbon pathways and system transition costs based on a multi-period and multi-regional energy infrastructure planning approach: A case study of China. Renew. Sustain. Energy Rev. 2020, 134, 110159. [Google Scholar] [CrossRef]
  32. BP. BP Energy Outlook, 2019 ed.; BP: London, UK, 2019. [Google Scholar]
  33. Li, T.; Li, Z.; Li, W. Scenarios analysis on the cross-region integrating of renewable power based on a long-period cost-optimization power planning model. Renew. Energy 2020, 156, 851–863. [Google Scholar] [CrossRef]
  34. National Bureau of Statistic. Monthly Power Generation in 2018; National Bureau of Statistic: London, UK, 2019.
  35. GAMS Development Corporation. GAMS—A User’s Guide; GAMS Development Corporation: Washington, DC, USA, 2008. [Google Scholar]
  36. Hydrogen Industrial Technology Innovation Alliance of China. China’s Hydrogen Energy and Fuel Cell Industry. 2019. Available online: http://www.h2cn.org/publicati/215.html (accessed on 10 October 2020).
Figure 1. The framework of CRESOM.
Processes 09 00160 g001
Figure 2. The interaction amongst sub-models in CRESOM.
Processes 09 00160 g002
Figure 3. Annual investment demand on infrastructure from 2020 to 2050.
Processes 09 00160 g003
Figure 4. Power flows amongst regions in 2050: (a) Stated policy scenario; (b) 2-Degree scenario; (c) 1.5-Degree scenario; (d) 1.5-Degree scenario with blue hydrogen; (e) Comparison amongst scenarios.
Processes 09 00160 g004
Figure 5. Hydrogen flows amongst regions in 2050: (a) 2-Degree scenario; (b) 1.5-Degree scenario; (c) 1.5-Degree scenario with blue hydrogen; (d) Comparison amongst scenarios.
Processes 09 00160 g005
Table 1. Scenarios setting.
Transition ApproachesBAUSP2D1.5D1.5DB
Improving energy efficiencySame
Technology progressSame
Improve electrification--ModerateMediumAggressive
Improve hydrogen penetration----ModerateAggressive
Carbon prices--LowMediumHigh
CCS Deployment----Power generationPower and hydrogen generation
Non-fossil shares in 2050--50%----
Carbon reduction by 2050----−72%−98%
Table 2. Key indicators in 2050 in all scenarios.
Indicators in 2050BAUSP2D1.5D1.5DB
Carbon prices yuan per tonne038077411611161
Carbon reduction compared to 2016/%331729898
Shares in final energy demand/%
Power2937596868
Hydrogen00132323
Fossil fuels65572122
Heat66777
Shares in primary energy demand %
Fossil fuels725014319
Non-fossil energy2850869781
Table 3. Overall system costs and transition costs.
Trillion Yuan in 2016 Net Present RMBBAUSP2D1.5D1.5DB
Overall system costs71.394.9114.8130.7130.8
Coal41.936.430.328.129.5
Natural gas6.810.511.111.711.7
Oil8.88.26.86.46.4
Hydrogen000.91.28.9
Power13.721.634.044.035.9
Carbon018.331.739.138.4
Transition costs--23.643.559.459.5
Table 4. Investment on national energy infrastructure.
Trillion Yuan in 2016 Net Present RMBBAUSP2D1.5D1.5DB
Total investment3.99.119.531.626.4
Coal production capacity0.170.07000
National natural gas pipelines0.100.140.180.180.19
LNG terminals0.030.070.080.100.10
Natural gas storage facilities0.040.060.070.090.09
Crude and product oil pipelines0.140.100.040.010.01
Oil refinery facilities0.180.120.060.030.03
Coal power plants0.400.070.120.190.07
Natural gas power plants0.100.110.140.400.24
Nuclear power plants0.300.351.025.855.68
Hydropower plants0.590.610.660.660.66
Onshore wind power plants1.242.906.797.075.21
Offshore wind power plants0.320.661.361.491.36
Solar power plants0.003.276.3111.959.07
National transmission grids0.280.440.660.740.55
Batteries0.030.181.41.911.82
Hydrogen pipelines000.250.360.18
Hydrogen storage facilities000.040.050.11
Hydrogen generation facilities000.350.511.00
Table 5. Stranded investment on fossil energy infrastructure.
Trillion Yuan in 2016 Net Present RMBSP2D1.5D1.5DB
Total stranded investment0.85572.66013.75593.0719
Coal production capacity0.63701.88242.41921.5841
Coal power plants0.17270.51760.96011.1110
Oil refining facilities0.04600.26010.37670.3767
Table 6. Average lifespan reduction on fossil energy infrastructure.
Lifespan Reduction/YearSP2D1.5D1.5DB
Coal production capacity−6.8−13.5−15.6−12.4
Coal power plants−9.7−15.5−20.5−22.0
Oil refining facilities−3.0−9.3−11.7−11.7
Table 7. Power system planning indicators in 2050.
IndicatorsBAUSP2D1.5D1.5DB
Power demand/TWh900511,23422,77527,49118,379
Power demand to produce hydrogen/TWh00634391110
Power storage capacity/TWh0.0490.3402.2533.0182.731
Cross-province transmission/TWh23652916444938323294
Total power generation capacity/GW223241899361126628258
Coal power89149540800
Coal power CCS00020082
Gas power56828100
Gas power CCS000338211
Nuclear power224302782872817
Hydropower458461461461461
Onshore wind power4631084294032231812
Offshore wind power114188445453422
Solar power771592404571164453
Table 8. Hydrogen system planning indicators in 2050.
Indicators2D1.5D1.5DB
Hydrogen demand/bcm155022452245
Hydrogen storage capacity/bcm16.720.356.1
Hydrogen generation capacity/(bcm/a)180726142274
Utility rate %85.885.998.7
Publisher’s Note: MDPI stays neutral with regard to jurisdictional claims in published maps and institutional affiliations.

