Oxygen-Blown Gasification of Pulp Mill Bark Residues for Synthetic Fuel Production


RISE Energy Technology Center AB, Box 726, S-941 28 Piteå, Sweden
*
Author to whom correspondence should be addressed.
Processes 2021, 9(1), 163; https://0-doi-org.brum.beds.ac.uk/10.3390/pr9010163
Submission received: 21 December 2020
/
Revised: 11 January 2021
/
Accepted: 12 January 2021
/
Published: 15 January 2021
(This article belongs to the Special Issue Process Design of Biomass Thermochemical Conversion)
Abstract
:Synthetic fuel production via gasification of residual biomass streams from the pulp and paper industry can be an opportunity for the mills to enable improved resource utilization and at the same time reduce the production of excess heat. This paper summarizes initial oxygen-blown gasification experiments with two bark residues from a European pulp and paper mill, i.e., a softwood bark and a hardwood bark. The gasification process was characterized by measuring syngas yields and process efficiency to find optimum operating conditions. In addition, impurities in the syngas and ash behavior were characterized. Maximum yields of CO and H2 were obtained from softwood bark and amounted to approximately 29 and 15 mol/kg fuel, respectively. Optimum cold gas efficiency was achieved at an oxygen stoichiometric ratio of λ = 0.40 and was approximately 76% and 70% for softwood bark and hardwood bark, respectively. Increased λ had a reducing effect on pollutants in the syngas, e.g., higher hydrocarbons, NH3, HCl, and soot. The situation for sulfur species was more complex. Evaluation of the bark ashes indicated that slag formation could start already from 800 °C. Furthermore, a non-intrusive laser diagnostics technique gave rapid feedback on the millisecond scale. Measured syngas temperature and water content were in good agreement with the applied reference methods.
1. Introduction
Greenhouse gas (GHG) emissions from the transportation sector represent almost a quarter of the total GHG emissions in Europe. Within the transportation sector, road transport was responsible for more than 70% of the GHG emissions from transport in 2014. To reduce climate impact and accelerate development towards low-emission mobility, the European Commission adopted a strategy where alternative energy for transport was included. This strategy included the use of advanced biofuels, electricity, hydrogen, and renewable synthetic fuels for road transport [1]. However, renewable sources have to be sustainable. Primarily, the biofuels’ value chains must not create greater emissions than the fossil fuels they replace. Secondly, biomass production must not compete for land use with food or feed production. At the same time, biomass production should not take place in areas with high carbon stock, such as biodiverse forests, wetlands, and peatlands [2].
The pulp and paper industry has a long history of using forest biomass for its production. Here, mainly cellulose is used in the products. Other tree parts, such as the bark, or other wood components, such as the lignin, are separated from the process and are today mainly combusted for steam generation. The steam is subsequently used for paper drying and/or electricity production. Excess heat is often used as district heating in nearby cities. Despite this, pulp and paper mills are often associated with an excess of heat, especially during the summer months and/or in warmer areas with less heat demand or where the paper mills are located far from other heat consumers. One possibility to reduce the amount of excess heat from a mill is to utilize bark and other residual streams to produce biofuels via various gasification routes.
Gasification is a thermochemical process that breaks down any carbonaceous feedstocks into a simple product gas with a usable heating value. The product gas (also called synthesis gas or syngas), consisting mainly of CO and H2, can subsequently be used for the synthesis of various fuels and chemicals. Several different gasification technologies have been developed over the years, in most cases to convert coal into various fuels, chemicals, and other products [3,4]. However, biomass gasification technologies aiming for synthetic fuels have also been demonstrated, e.g., [5,6,7].
Oxygen-blown entrained flow gasifiers currently dominate the coal gasification market where synthetic fuels or chemicals are targeted. The reason is the high syngas quality that is generated by the high-temperature process [3]. Depending on the targeted end-product, different syngas compositions are desired for optimal catalytic synthesis into fuels or chemicals. The H2/CO ratio is often considered an important parameter for the production of motor fuels, and this ratio should lie somewhere around 2 if long-chain hydrocarbons via the Fischer–Tropsch process are targeted [8]. Therefore, the syngas usually has to be adjusted, typically through the water-gas shift reaction CO + H2O ⇌ CO2 + H2, in order to reach the desired H2/CO ratio [3]. This is also the case for oxygen-blown biomass gasification, which results in a syngas composition with a too low H2/CO ratio compared to what is required for fuel synthesis [9].
Alternative ways to boost the H2 content of the syngas are to add H2 produced from water electrolysis or mix it with syngas produced from supercritical water gasification (SCWG). SCWG is a process for the conversion of organic materials in the water at temperatures and pressures above the critical point of water (i.e., 374 °C and 221 bar). Temperatures above 500 °C are usually employed, resulting in H2 and CO2 as main products [10]. From a pulp industry perspective, the use of SCWG could be an attractive way to produce H2 from the lignin in the black liquor since it was previously reported that the high alkali content of black liquor improved gas yields from SCWG, producing a gas rich in H2 [11].
This is exactly the combination of processes that are being studied in the European Pulp & Fuel project within which this work has been performed, i.e., oxygen-blown gasification of bark residues in combination with SCWG of black liquor aiming for synthetic fuel production [12]. The Pulp & Fuel project received funding from the European Union’s Horizon 2020 research and innovation program and consists of ten partners from four European countries. The project addresses the thermochemical conversion of industrial wastes produced at a pulp and paper mill into biofuel.
This paper summarizes the initial oxygen-blown gasification experiments with bark residues from the French pulp mill Fibre Excellence (one of the partners in the Pulp & Fuel project). One of the objectives was to study how syngas composition and gasification efficiency were affected by different operating conditions of the gasification process, and thereby identify optimal operating conditions. Another important aspect was to quantify certain syngas impurities that need to be removed before any downstream fuel synthesis. Additionally, the experiments aimed at generating practical knowledge about the behavior of inorganic ash elements during gasification to ultimately propose an appropriate disposal strategy. Finally, a non-intrusive measurement technique, based on tunable diode laser absorption spectroscopy (TDLAS), was tested to investigate the possibilities for fast feedback of the gasification performance (on the millisecond scale). This work was carried out to investigate whether the methodology has the potential to be part of any artificial intelligence-based process control system that could automatically optimize the gasification process in the future.
2. Materials and Methods
2.1. The Gasifier
The fixed-bed oxygen-blown gasifier (FOXBG, ~20 kW) used in this work was previously described in detail [13]. Wiinikka et al. showed that the FOXBG produced a syngas of the same high quality, and similar composition, as syngas produced from a much larger (1 MW) entrained flow biomass gasifier operated with the same feedstock. Naturally, the smaller FOXBG requires less resources for each experiment compared to the 1 MW entrained flow gasifier. Since FOXBG still provides the equivalent gas quality, it was used in this project to minimize costs. A brief overview of the FOXBG is given below.
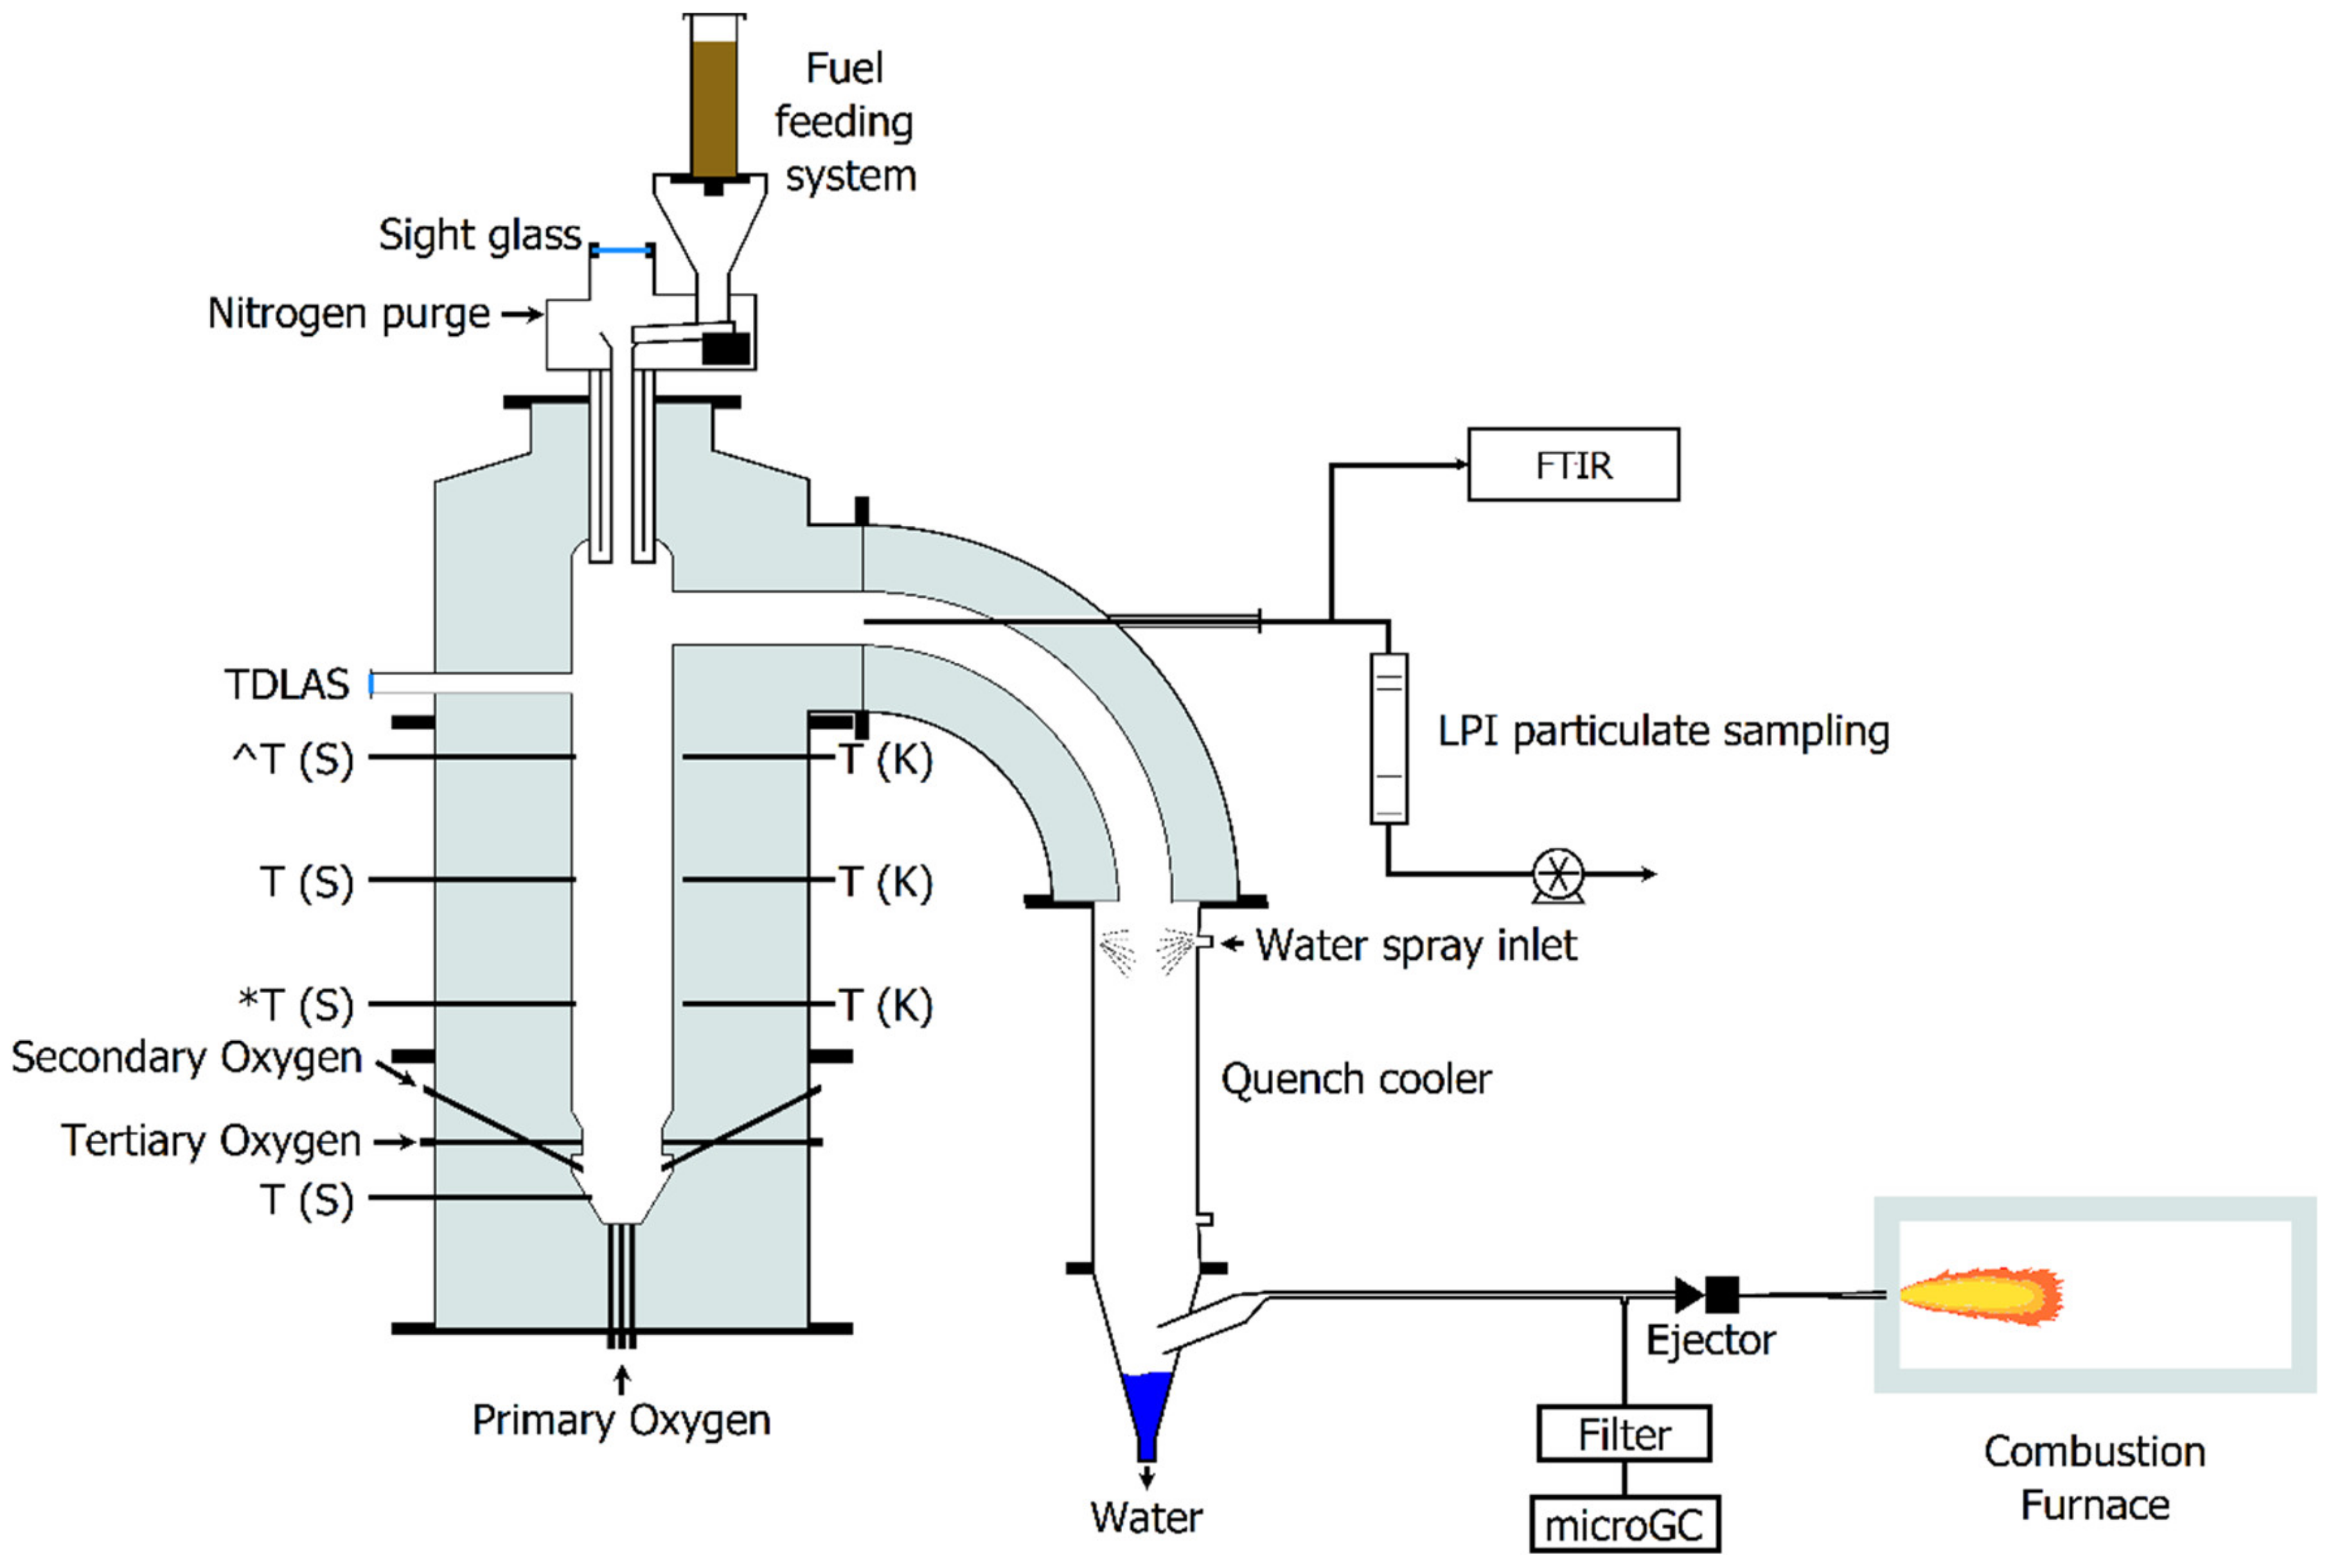
The FOXBG (see Figure 1) was constructed from an outer steel shell, approximately 0.7 m in diameter, and 1.75 m in height. Insulation and refractory materials on the inside of the reactor were made of Vibron 175B (85% Al2O3, 12% SiO2, <1% Fe2O3). The bottom part of the gasifier was formed as a truncated cone, with a maximum diameter of 0.19 m and a total volume of approximately 1.4 dm3. The dimensions of the freeboard section, located above the bed, were 0.19 m in diameter and approximately 0.9 m in height.
The pelletized fuels used in the campaign were introduced to the reactor via a mechanical type fuel feeder. The pellets were fed from the top of the freeboard section and landed on the bed at the bottom of the reactor. Approximately 10 L/min of N2 was added into the fuel feeder to prevent possible ignition in case hot gases rose from the reactor into the feeder. The oxidation agent, in this case, pure oxygen (O2), was introduced through different inlets at the bottom part of the reactor, named primary, secondary, and tertiary. Primary oxygen was introduced from underneath the bed (tubes inner diameter, Øi, 3 mm), whereas both secondary and tertiary inlets (tubes Øi 1 mm) were positioned above the bed according to the description in an earlier publication [13]. All ingoing gas flows were monitored using Bronkhorst mass flow controllers (Bronkhorst F201AV).
The process temperatures within the reactor were measured using four S type thermocouples located along the freeboard and bed zone (Figure 1). The process temperature was measured by the thermocouple marked *T (S), located 0.4 m above the reactor bottom. The positions of the other thermocouples and the TDLAS measurement were 0.6 m, 0.8 m (^T (S)), and 0.9 m (TDLAS) above the reactor bottom. The thermocouples were protected by sintered alumina tubes and inserted approximately 10 mm into the reactor. Moreover, K type thermocouples were used to measure the temperature of the refractory lining as well as syngas exiting the reactor.
A water sprayed quench was installed downstream of the syngas outlet. The water sprays cooled the gas and captured most of the particulate matter in the water. Finally, the majority of the syngas was incinerated in a separate combustion chamber, using a propane torch as a continuous ignition source. The pressure inside the gasification reactor was controlled manually, using an air-driven ejector located on the syngas pipe upstream from the combustion chamber, and held at approximately 100 Pa relative to atmospheric pressure.
Syngas samples were extracted from different positions in the pilot plant. This is described in more detail below. However, it is worth mentioning here that the sample lines from the gasifier outlet, sampling hot syngas to the Fourier-transform infrared spectroscopy instrument (FTIR) and particulates to the low-pressure impactor (LPI), were trace-heated to approximately 150 °C in order to avoid condensation of water vapor. In addition, for the micro gas chromatograph (µGC) measurements, a small but accurately measured flow of helium (He) was used as a tracer to allow for syngas mass flow estimations and enable calculations on total yields and carbon mass balance. This method was successfully used in previous gasification experiments using an entrained flow gasifier [14].
2.2. Fuels
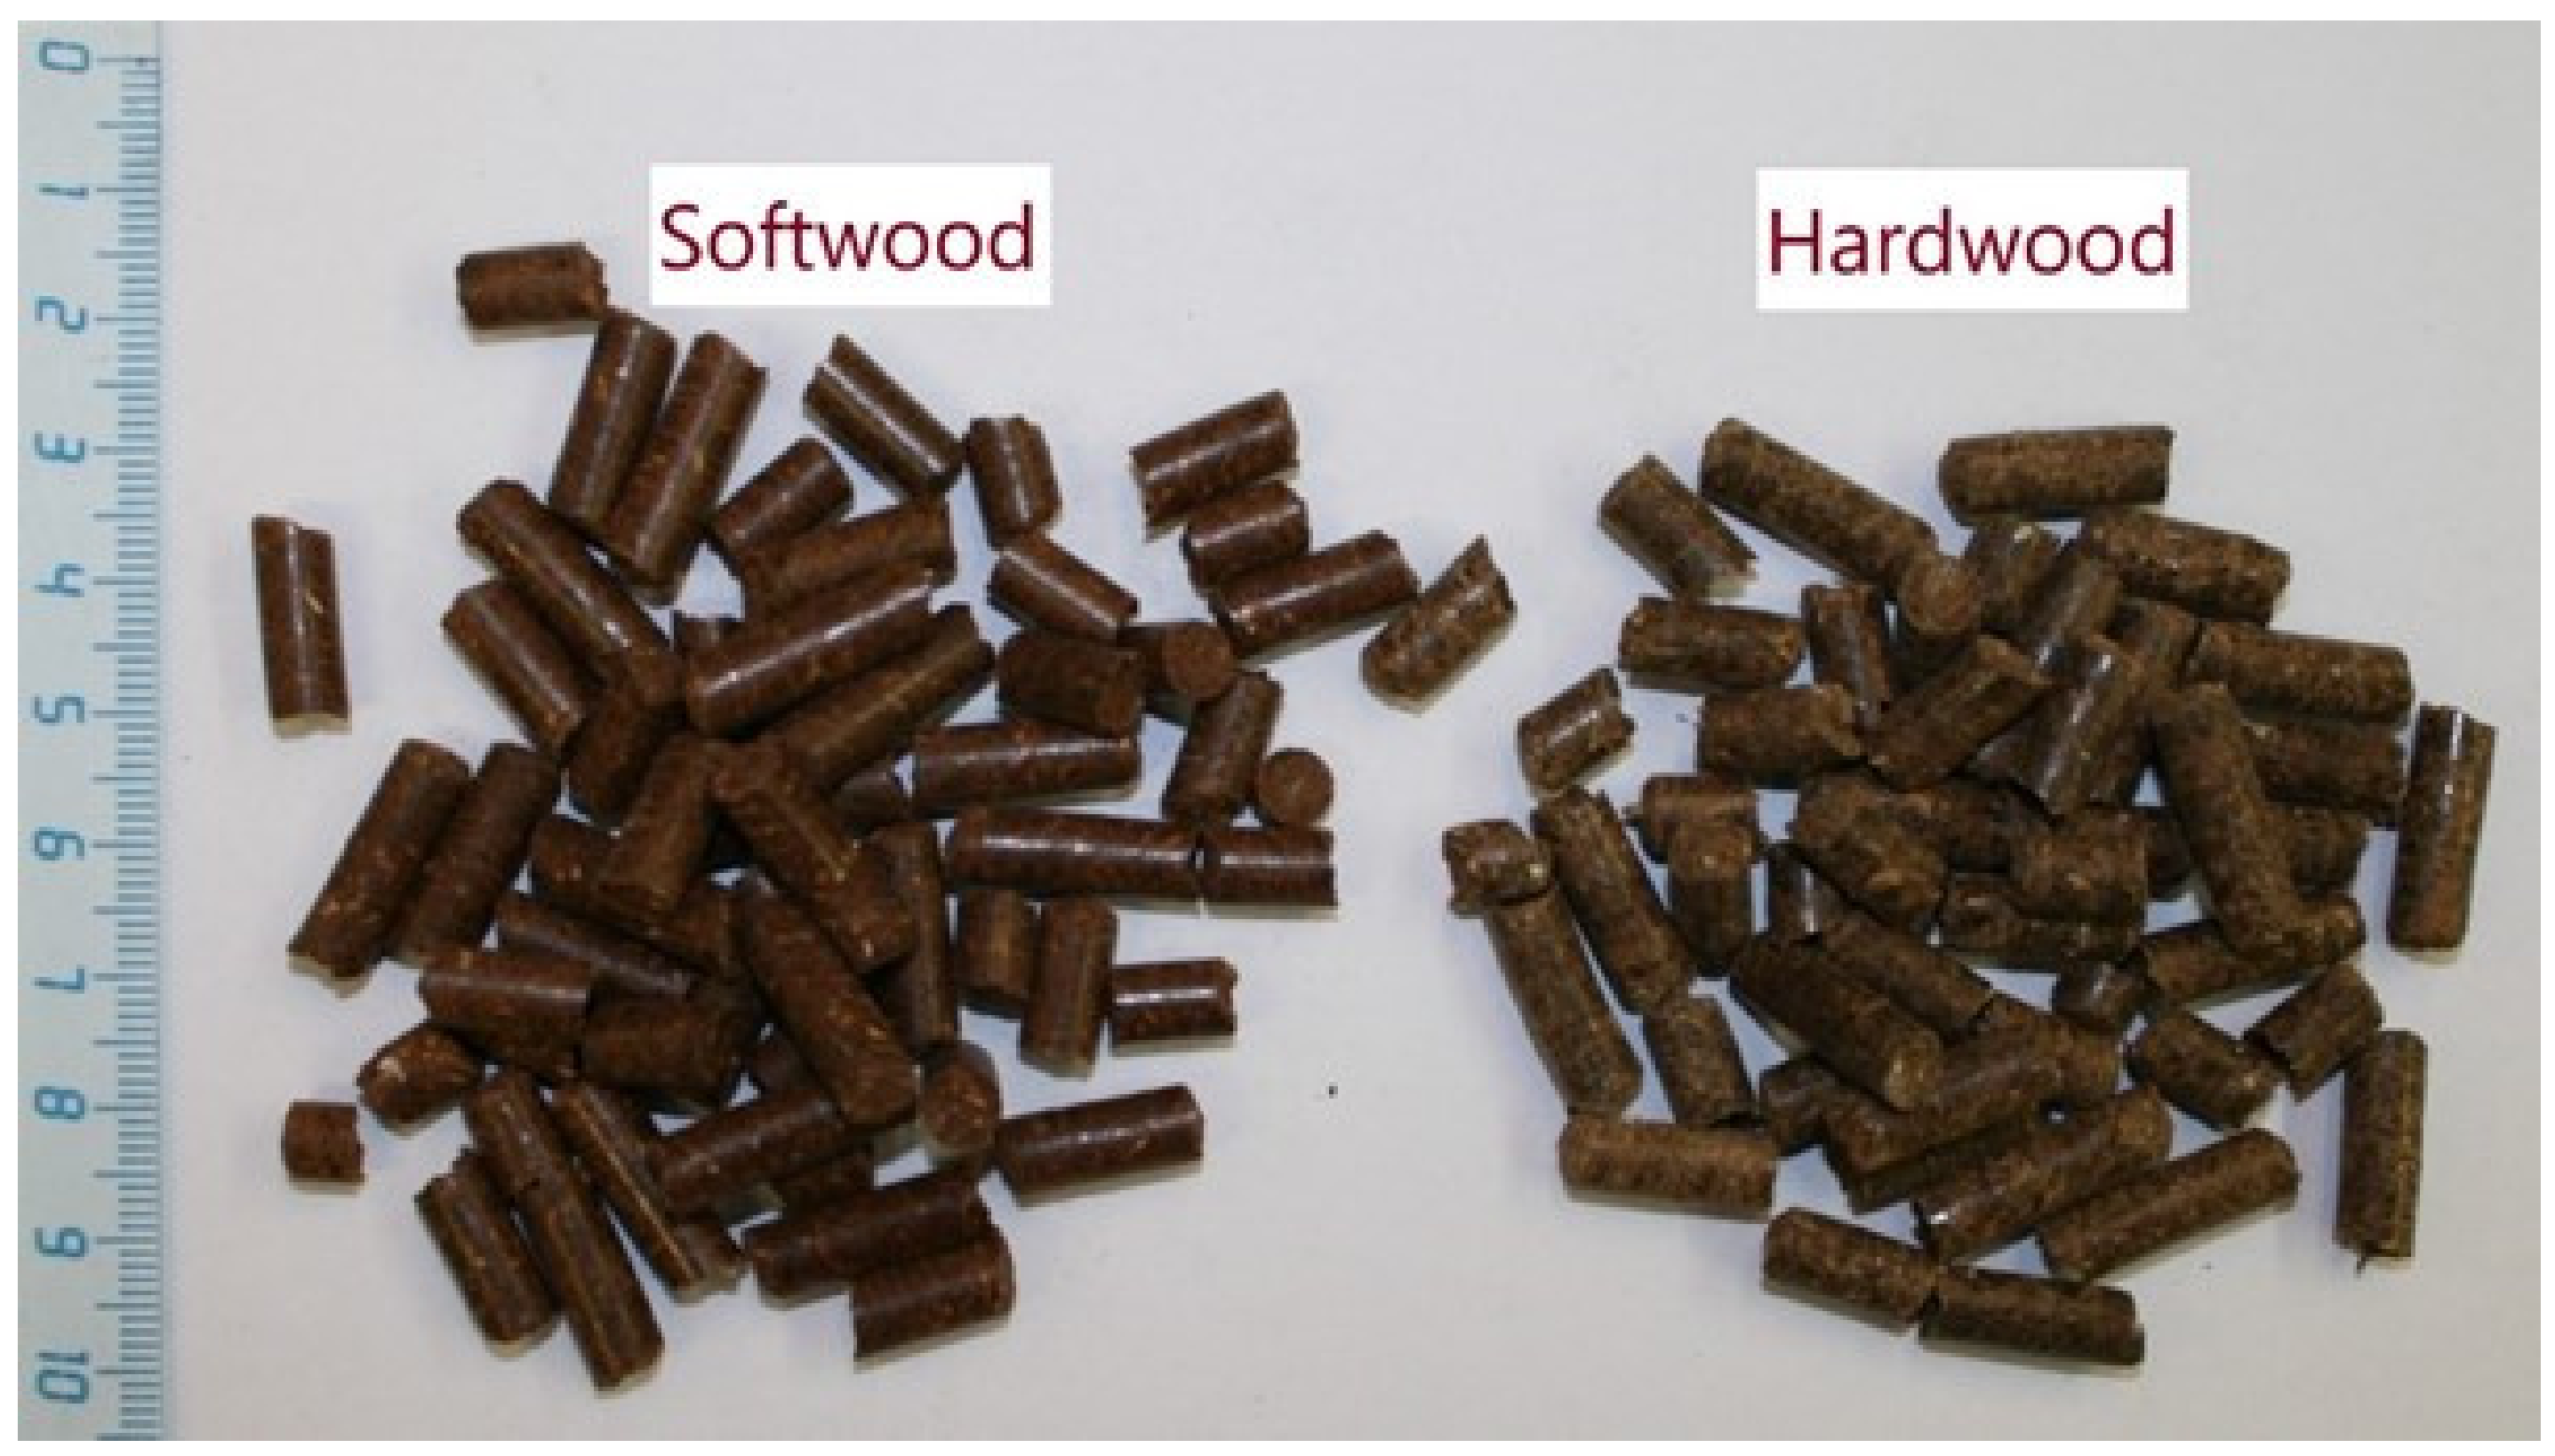
The fuels used in this work, softwood and hardwood bark residues, originated from the Fibre Excellence pulp mill in Saint Gaudens, France. The bark residues were dried, milled, and then pelletized to 6 mm in diameter and approximately 6–20 mm in length, Figure 2.
Proximate and ultimate analyses of the pelletized fuels, performed by the external company ALS Global directly after delivery, are tabulated in Table 1. The results indicate that the feedstocks were relatively similar in terms of moisture and ash content, as well as in calorific value. Furthermore, the inorganic part contained significant amounts of silicon (Si) in both fuels, probably coming from soil contaminants. The major difference between the two fuels was the calcium (Ca) content, which was almost three times higher in the hardwood bark. During the experimental period, the fuels were stored indoors, i.e., at normal room temperature and ambient air humidity. Fuel moisture content was measured in-house on several occasions during the experiments. The moisture content measured in-house was lower than the one reported from the external analysis. This was probably caused by fuel drying during storage. However, the moisture content of the two fuels used during the experiments was 8.2 ± 0.5% (average ± standard deviation) and 7.6 ± 0.9% for the softwood bark and hardwood bark, respectively.
2.3. Operating Conditions
Before each experiment, the refractory lining inside the gasifier was heated to approximately 1100 °C using an electrical, 8 kW, spiraled silicon carbide element installed vertically in the center of the reactor. At the start of the experiment, the heater was removed and replaced by the fuel feeding system. Each experimental day included one or more operating conditions, i.e., setpoints. Previous studies, both theoretical and experimental, have shown that the so-called O2 stoichiometric ratio, λ, is the most important process parameter when it comes to gasification, as it affects both the temperature, syngas composition, and efficiency of the gasification process [14]. The O2 stoichiometric ratio, λ, is defined as the ratio between supplied O2, ṁO2 (kg/h), and the amount of O2 required for stoichiometric combustion, ṁO2,stoich (kg/h), see Equation (1).
In this work, gasification experiments were performed with the two fuel types at different λ setpoints (0.26–0.62), see Table 2. The distribution of oxygen was set so that the oxygen supply in the primary register corresponded to the theoretically required amount needed to convert all the fixed carbon to carbon monoxide. For most setpoints, the secondary flow was set to correspond to a total λ of 0.30 through primary and secondary together. The remaining amount of oxygen was added through the tertiary register. For setpoints corresponding to λ < 0.30, minor adjustments were made to obtain a significant flow through the secondary register. Moreover, the oxygen distribution was incorrectly set during two tests (softwood λ = 0.40 and 0.47). However, this did not seem to affect the results significantly (see Section 3 below).
To obtain stable and representative gas concentration measurements, each individual setpoint was operated for at least one hour whenever possible. Experience has shown that the syngas composition stabilized at a new level approximately 15–20 min after the start of a new setpoint. Experimental data collected during the last 20–40 min of each setpoint were used in the evaluation. Included datapoints were generally averaged before being presented in Section 3.
The fuel feeding rate was set so that a thermal power of approximately 20 kW was achieved. The fuel feeder was calibrated separately for each fuel type before any gasification experiment. Although there were some variations in the fuel feeding rate between different setpoints, this was compensated for when calculating the actual λ value in Table 2. Between individual setpoints, the fuel feeding was stopped while the oxygen flow was maintained. This procedure ensured that the remaining char was burned out of the bed. In this way, the risk of possible memory-effects during the experimental days was minimized.
The operating conditions, process temperatures, and carbon closures for each setpoint are summarized in Table 2. The process temperature was measured using the thermocouple marked *T (S) in Figure 1, and varied between approximately 850–1150 °C. The temperature in the bed was generally 50–250 °C lower compared to the process temperature.
2.4. Syngas Sampling and Analysis
2.4.1. Gaseous Components
A Fourier-transform infrared spectroscopy instrument (FTIR) was used to continuously analyze the concentrations of H2O, HCl, and NH3 in the gas, at a sampling rate of 5 Hz. The relatively quick sampling frequency also enabled monitoring of the process stability. The FTIR sampled syngas from a trace-heated line (~150 °C) at the outlet of the gasifier (before the quench cooler), as seen in Figure 1. The instrument itself measured gas concentrations at 190 °C.
Additionally, syngas was continuously sampled from the syngas pipe after the quench cooler using a µGC (Varian 490 GC with molecular sieve 5 A and PoraPlot U columns) as seen in Figure 1. Before entering the instrument, the gas was cleaned using a glass wool filter and cooled, using a Peltier cooler, to approximately 4 °C to remove residual moisture. The µGC logged He, H2, N2, O2, CO, CO2, CH4, C2H6, C2H4, and C2H2 concentrations approximately once every 3 min.
In addition to online measurements, gas bag samples were collected and analyzed using a gas chromatograph (GC). Two gas bag samples were collected for each setpoint. The sample bags were rinsed three times with air before use. The GC (CP 3800, Varian, Palo Alto, CA, USA), described in previous works [13], was able to analyze the same compounds as the µGC, with the exception of He. However, the GC was also able to analyze additional hydrocarbons using a flame ionization detector (FID) and sulfur compounds using a pulsing flame detector (PFPD). It is worth noting that the instrument was not able to separate C2H2 and C2H4, and that these compounds were presented together when using the instrument.
2.4.2. Particulate Matter
A 13-stage gravimetric low-pressure impactor (LPI), from Dekati Ltd., Kangasala, Finland, was used to analyze particulate matter entrained in the syngas. Like the FTIR, the LPI sampled syngas from a trace heated line (~150 °C) at the outlet of the gasifier located before the quench cooler. The LPI itself was also heated to approximately 150 °C to avoid condensation of water vapor. Particles were separated gravimetrically based on their aerodynamic diameter, between 0.03–13 μm, enabling estimations of mass concentration (mg/Nm3) and size distribution of particulate matter in the syngas.
2.5. Online Tunable Diode Laser Absorption Spectroscopy (TDLAS) Measurements
Water vapor, temperature, and soot were measured using tunable diode laser absorption spectroscopy (TDLAS) using absorption lines between 7153–7155 cm−1. The system consisted of a distributed feedback laser diode, a laser controller, and a data acquisition system. The same absorption lines have been used in several publications, e.g., [15]. A more detailed description of the system and the process used in this publication can be found in [16,17].
The measurements in the gasifier were performed by directing the laser beam through the gasifier using in-house built optical access ports. The location of the optical access ports was roughly at the same height as ^T (S) in the reactor, i.e., approximately 0.8-0.9 m above the bed. The optical access ports were built as a pipe, going from the inner wall to the outside of the reactor, where the end of the pipe had a window. The optical ports were equipped with an inlet for N2, giving the possibility to constantly flush the pipe to ensure a constant pathlength. With the N2 flushed optical access, it was assumed that the absorbing pathlength was equal to the inner diameter of the reactor (19 cm).
The TDLAS system was operated at 100 Hz, and the acquired spectra were averaged in sequences of 100 spectra, resulting in a sampling rate of 1 Hz, this sampling rate was equal to the one of the control system and the FTIR. The averaging was used to reduce the impact of electrical noise to the results.
2.6. Ash Sampling and Analysis
During operation, ash accumulated in the reactor bed. The operation time was, therefore limited because experiments had to be completed before the bed was filled with ash. Furthermore, the ash could only be extracted after the reactor had cooled down after an experimental day. The ash samples were therefore the result of all operating conditions implemented during that experimental day, including the char combustion occurring in between individual gasification setpoints. The gasification process was thereby “semi-continuous”, meaning that fuel and oxidant feeding, as well as syngas production, was continuous, but ash extraction was not.
The ash samples, in the form of loose powder and slag, were analyzed with respect to elemental composition using a Hitachi tabletop scanning electron microscope (SEM) equipped with an energy dispersive x-ray spectrometer (EDS). Furthermore, the particulate matter collected by the LPI, containing soot and fly ash, underwent similar analysis. The SEM was used to analyze heterogeneous organic and inorganic materials down to a micrometer (μm) scale. Powder samples were placed on aluminum studs using copper tape, and slag bits were fastened on a holder. The SEM created a topographic image of the sample surface, after which the EDS unit was used to analyze the characteristic x-rays to obtain qualitative and quantitative elemental information. An average elemental concentration and standard deviation were obtained for each experimental run by analyzing three different samples (one powder and two slag samples) and looking at three different spots on each sample.
2.7. Thermodynamic Equilibrium Calculations
Thermodynamic equilibrium calculations were performed to study the behavior of the ash constituents as a function of temperature. The analysis was performed using the Factsage 7.2 Software, which includes databases for hundreds of pure substances and solution phases. By minimizing the Gibbs free energy of the studied system, the software made it possible to study which compounds were thermodynamically stable at different conditions. Databases used in the calculations were the FactPS and FToxid.
Using the elemental composition obtained from the SEM-EDS measurements as input, the thermodynamic modeling was performed by varying the temperature between 500–1500 °C in 100 °C increments.
3. Results and Discussion
3.1. Process Temperature
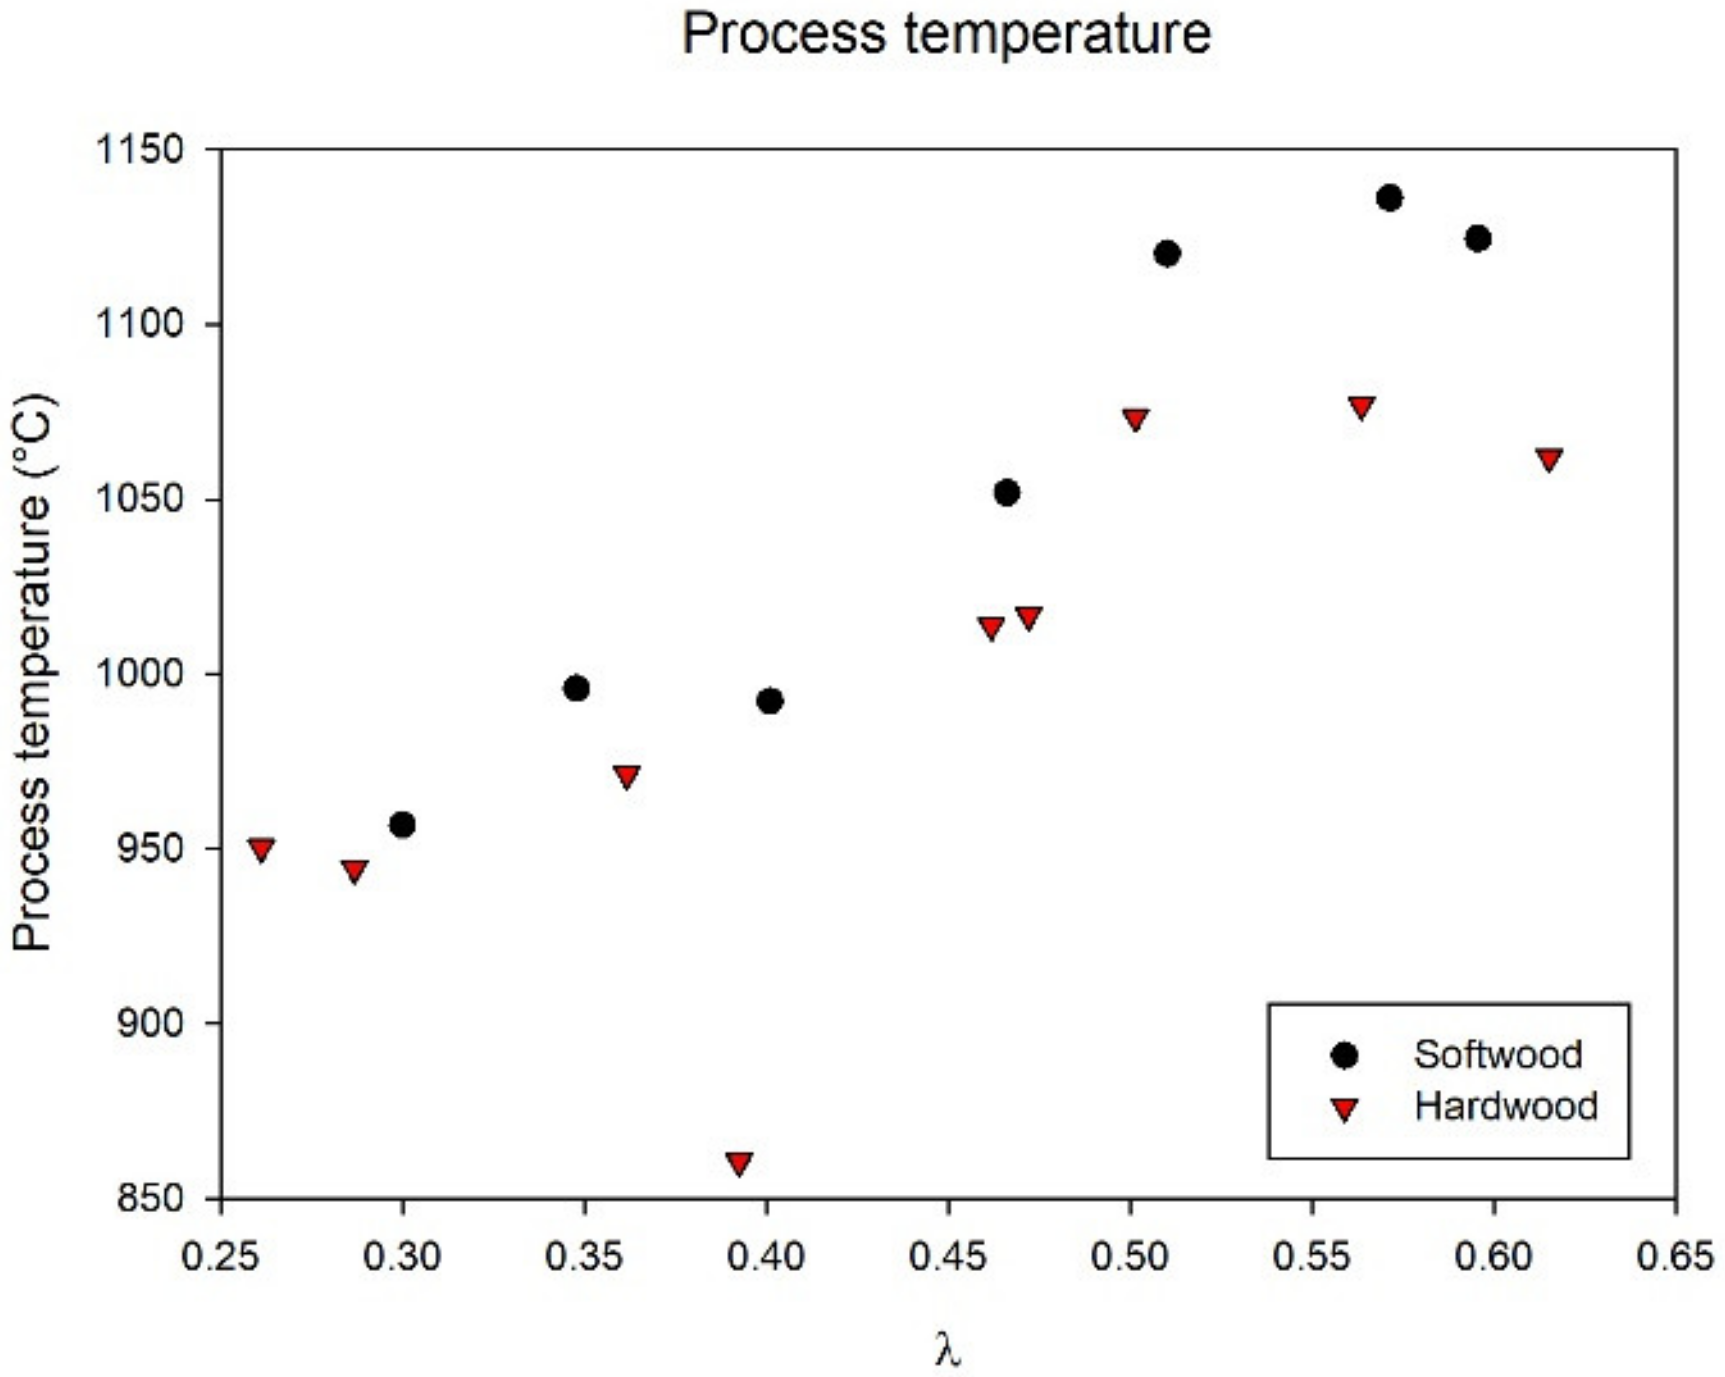
The process temperature during oxygen blown gasification is mainly affected by the O2 stoichiometric ratio, i.e., λ. A higher λ means that more O2 is being added to the process, resulting in higher process temperature due to increased heat generation from exothermic combustion reactions. The measured process temperatures for the two fuels, softwood and hardwood bark, can be seen in Figure 3. The process temperatures for both fuels, softwood and hardwood bark, increased with higher λ, as expected.
The low process temperature for hardwood at λ ~0.40 was most likely caused by the lower starting temperature in the gasifier during that experimental day compared to the other hardwood experiments. Furthermore, the same reason was believed to be responsible for the unnatural temperature trend at λ above 0.50. This can be explained by the relatively high ceramic mass inside the gasification reactor, which made the system very sluggish, causing it to take a long time before reaching thermal equilibrium. The three highest λ setpoints were operated during one experimental day for each feedstock. The experiments were performed in the order λ = 0.60, 0.55, and 0.50 for both fuels (note that these were the targeted λ values and not the actual values). Thus, the temperature measurements for the higher λ setpoints were probably underestimated since the system did not reach thermal equilibrium.
This was, however, not expected to have had such a huge impact on the main components of the syngas. It has previously been shown that the main components (CO, H2, and CO2) reached a new equilibrium relatively quickly after a λ change [18,19,20]. Methane (CH4), on the other hand, was shown to be strongly correlated to the process temperature [9], which also turned out to be the result of the low-temperature experiment with hardwood at λ 0.40.
3.2. Major Syngas Species and Gasification Efficiency
The yields of the major syngas components hydrogen (H2), carbon monoxide (CO), and carbon dioxide (CO2) were calculated from the µGC gas analysis. The total syngas yield (mol/kg fuel) was calculated using the trace helium (He) concentration, as previously described [14]. The yield of steam (H2O) was obtained from the FTIR. All yields of the major syngas components can be seen in Figure 4 as functions of λ.
The highest yields of H2 and CO (Figure 4a,b) were obtained around λ 0.40 for softwood bark and around 0.50 for hardwood bark. The reduced yields of H2 and CO at lower λ were most likely caused by incomplete gasification, resulting in carbon and hydrogen atoms still being bound as hydrocarbons or other products of incomplete gasification such as soot, char, or tar (see Section 3.4, below). The poor carbon mass balance closure at λ below 0.35 may be an indication of char accumulation in the bed under these operating conditions (Table 2). An alternative explanation may be that the amount of tar and soot formed was underestimated due to non-representative sampling at lower λs. Of these two explanations, the former is considered to represent the most significant contribution to the incomplete mass balance.
The decrease in H2 and CO yields at higher λ values (λ > 0.5) could be explained by a shift towards chemical oxidation reactions increasing the formation of CO2 and H2O, as seen in Figure 4c,d. The gasification experiments with hardwood bark generally displayed a greater variation in the results compared to softwood bark. This was particularly noticeable for the H2 and CO data (Figure 4a,b). The data for softwood bark seemed to follow a smooth imaginary line, whereas the datapoints for hardwood bark were more scattered. The reason for this is not clear, but it may have been caused by experimental uncertainties.
3.3. Gasification Efficiency
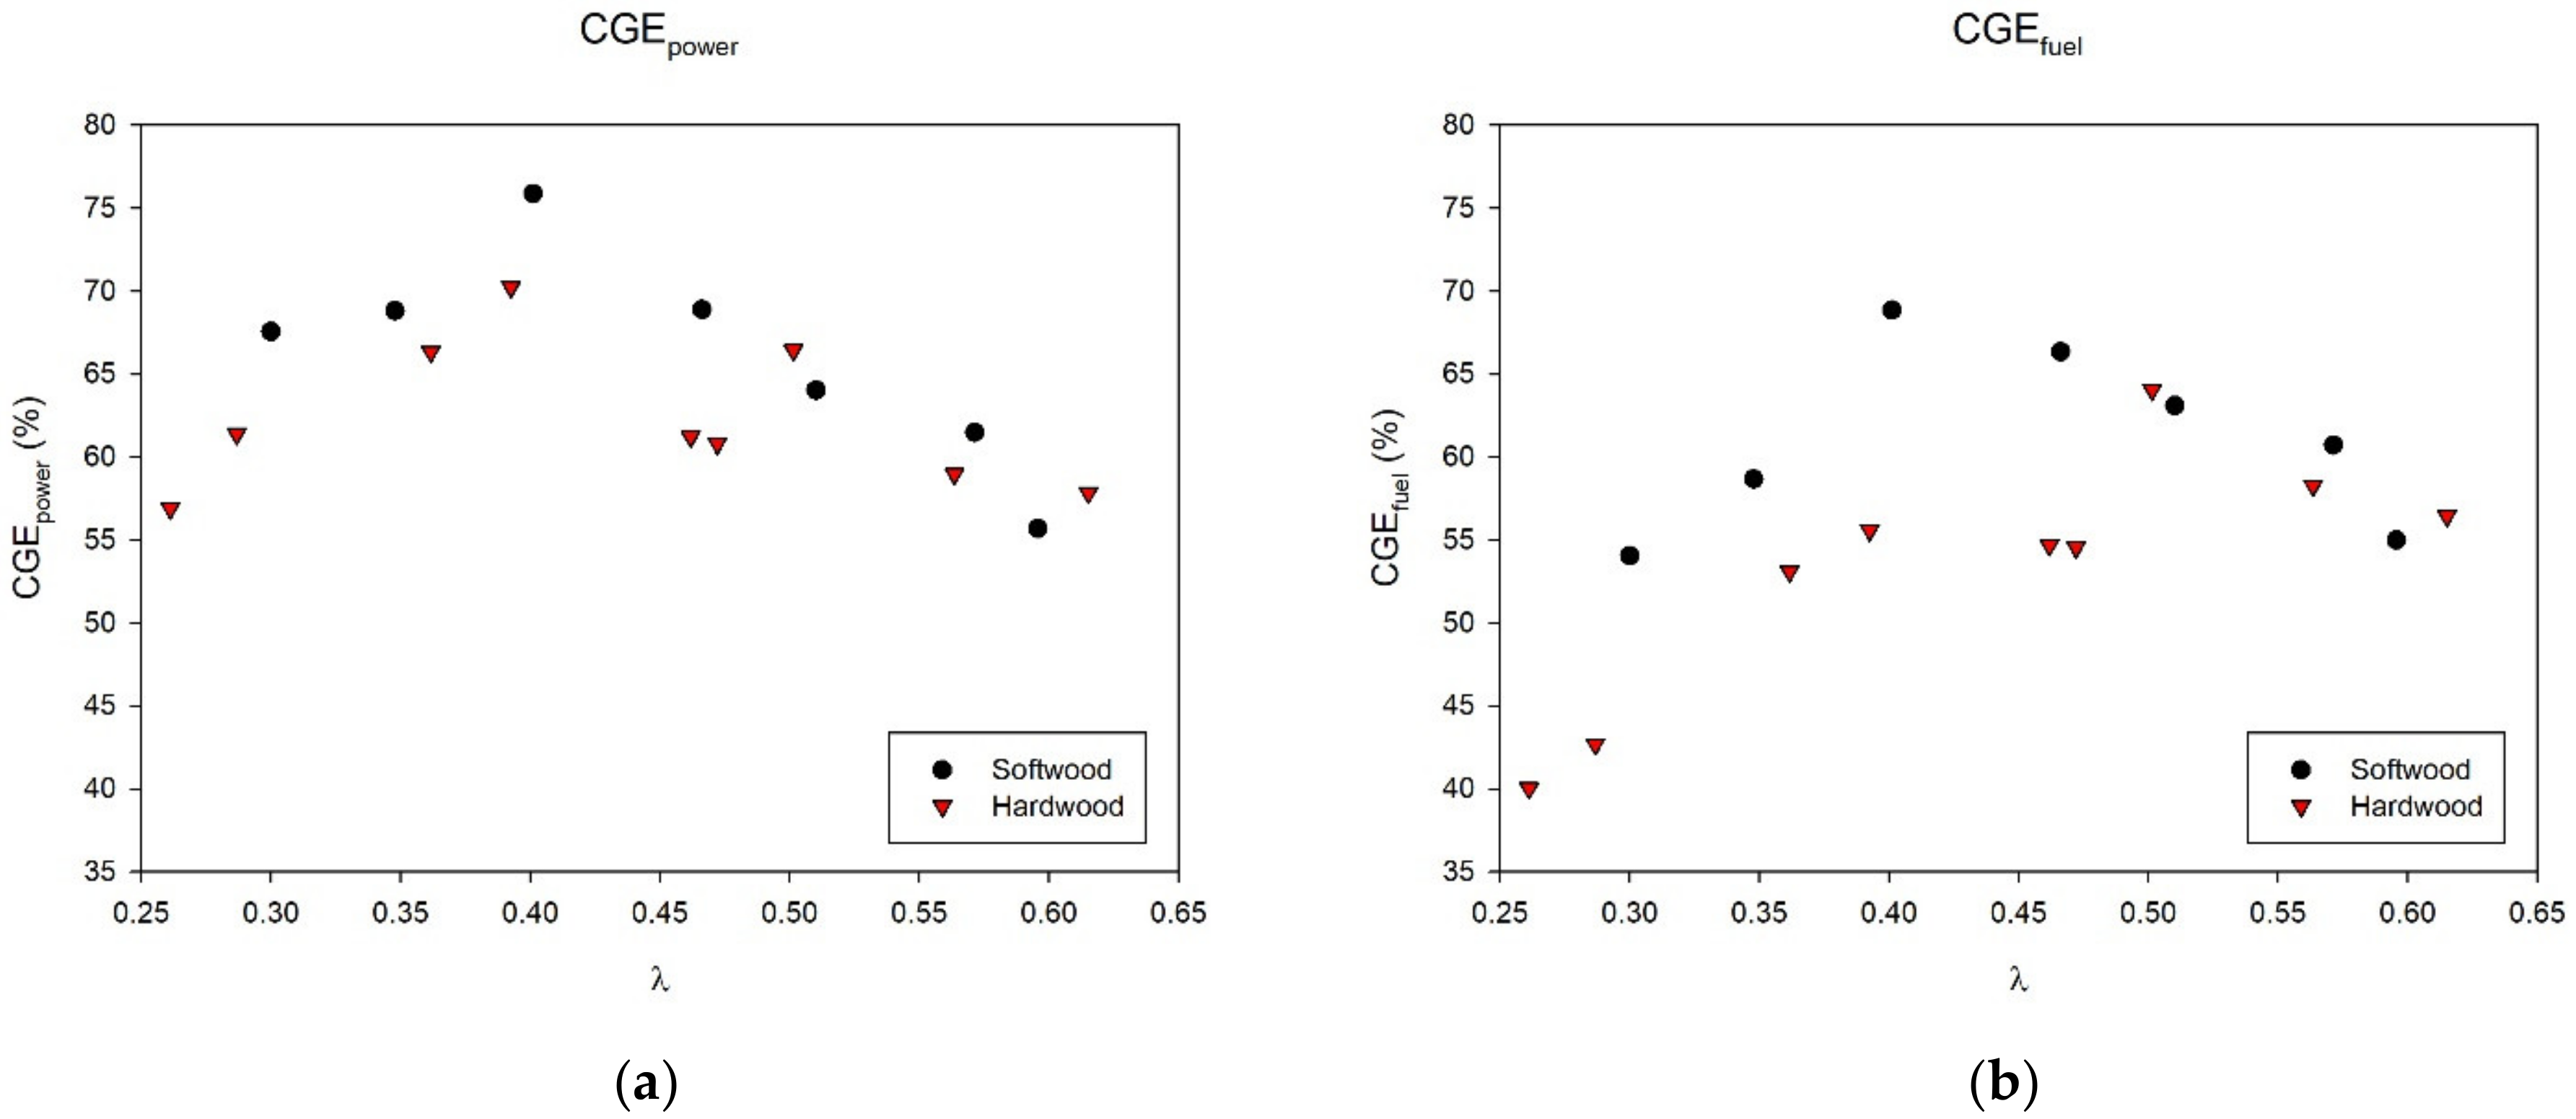
The yields of combustible gases reflect the efficiency of the gasification process. The efficiency can be measured using the so-called cold gas efficiency (CGE), which is defined as the ratio between the amount of chemical energy stored in the cooled syngas and the chemical energy from the fuel, as seen in Equation (2).
In Equation (2), ṁCG (kg/s) and ṁfuel (kg/s) are the mass flow of cold gas from the reactor and the mass flow of the fuel into the reactor, respectively. LHVCG (MJ/kg) and LHVfuel (MJ/kg) are the lower heating values for the cold gas and fuel, respectively [21].
Depending on the intended end use of the produced gas, calculations for CGE might differ. If the gas is supposed to be used for heat or power generation, all energetic components may be included (CGEpower) as they may all be burned in a gas turbine or engine. If the gas is instead supposed to be used for fuel synthesis, only the H2 and CO components are included (CGEfuel), as they are the only active components in the synthesis process if, e.g., methanol, dimethyl ether, or Fischer–Tropsch fuels are targeted [13,21].
Both CGE values were calculated for each setpoint and are presented in Figure 5 as functions of λ. The optimal values for softwood bark were obtained at λ ~0.40 for both CGEpower (76%) and CGEfuel (69%). For hardwood bark, the optimal values were obtained at λ ~0.40 for CGEpower (70%) and ~0.50 for CGEfuel (64%). The CGE values of hardwood bark had larger variations compared to softwood bark. The two points representing λ = 0.46 and 0.47 were most likely underestimated, probably due to experimental measurement errors caused by variations in operation.
The differences between hardwood bark and softwood bark may also have been caused by different oxygen distributions in the primary, secondary, and tertiary oxygen inlets. The oxygen mass flow distribution varied between some of the initial experiments (see Table 2), resulting in a couple of the softwood bark experiments having an oxygen distribution shifted towards the secondary and tertiary inlets. How oxygen distribution affects gasification performance is something that will be investigated further in future work.
3.4. Minor Syngas Components and Particles
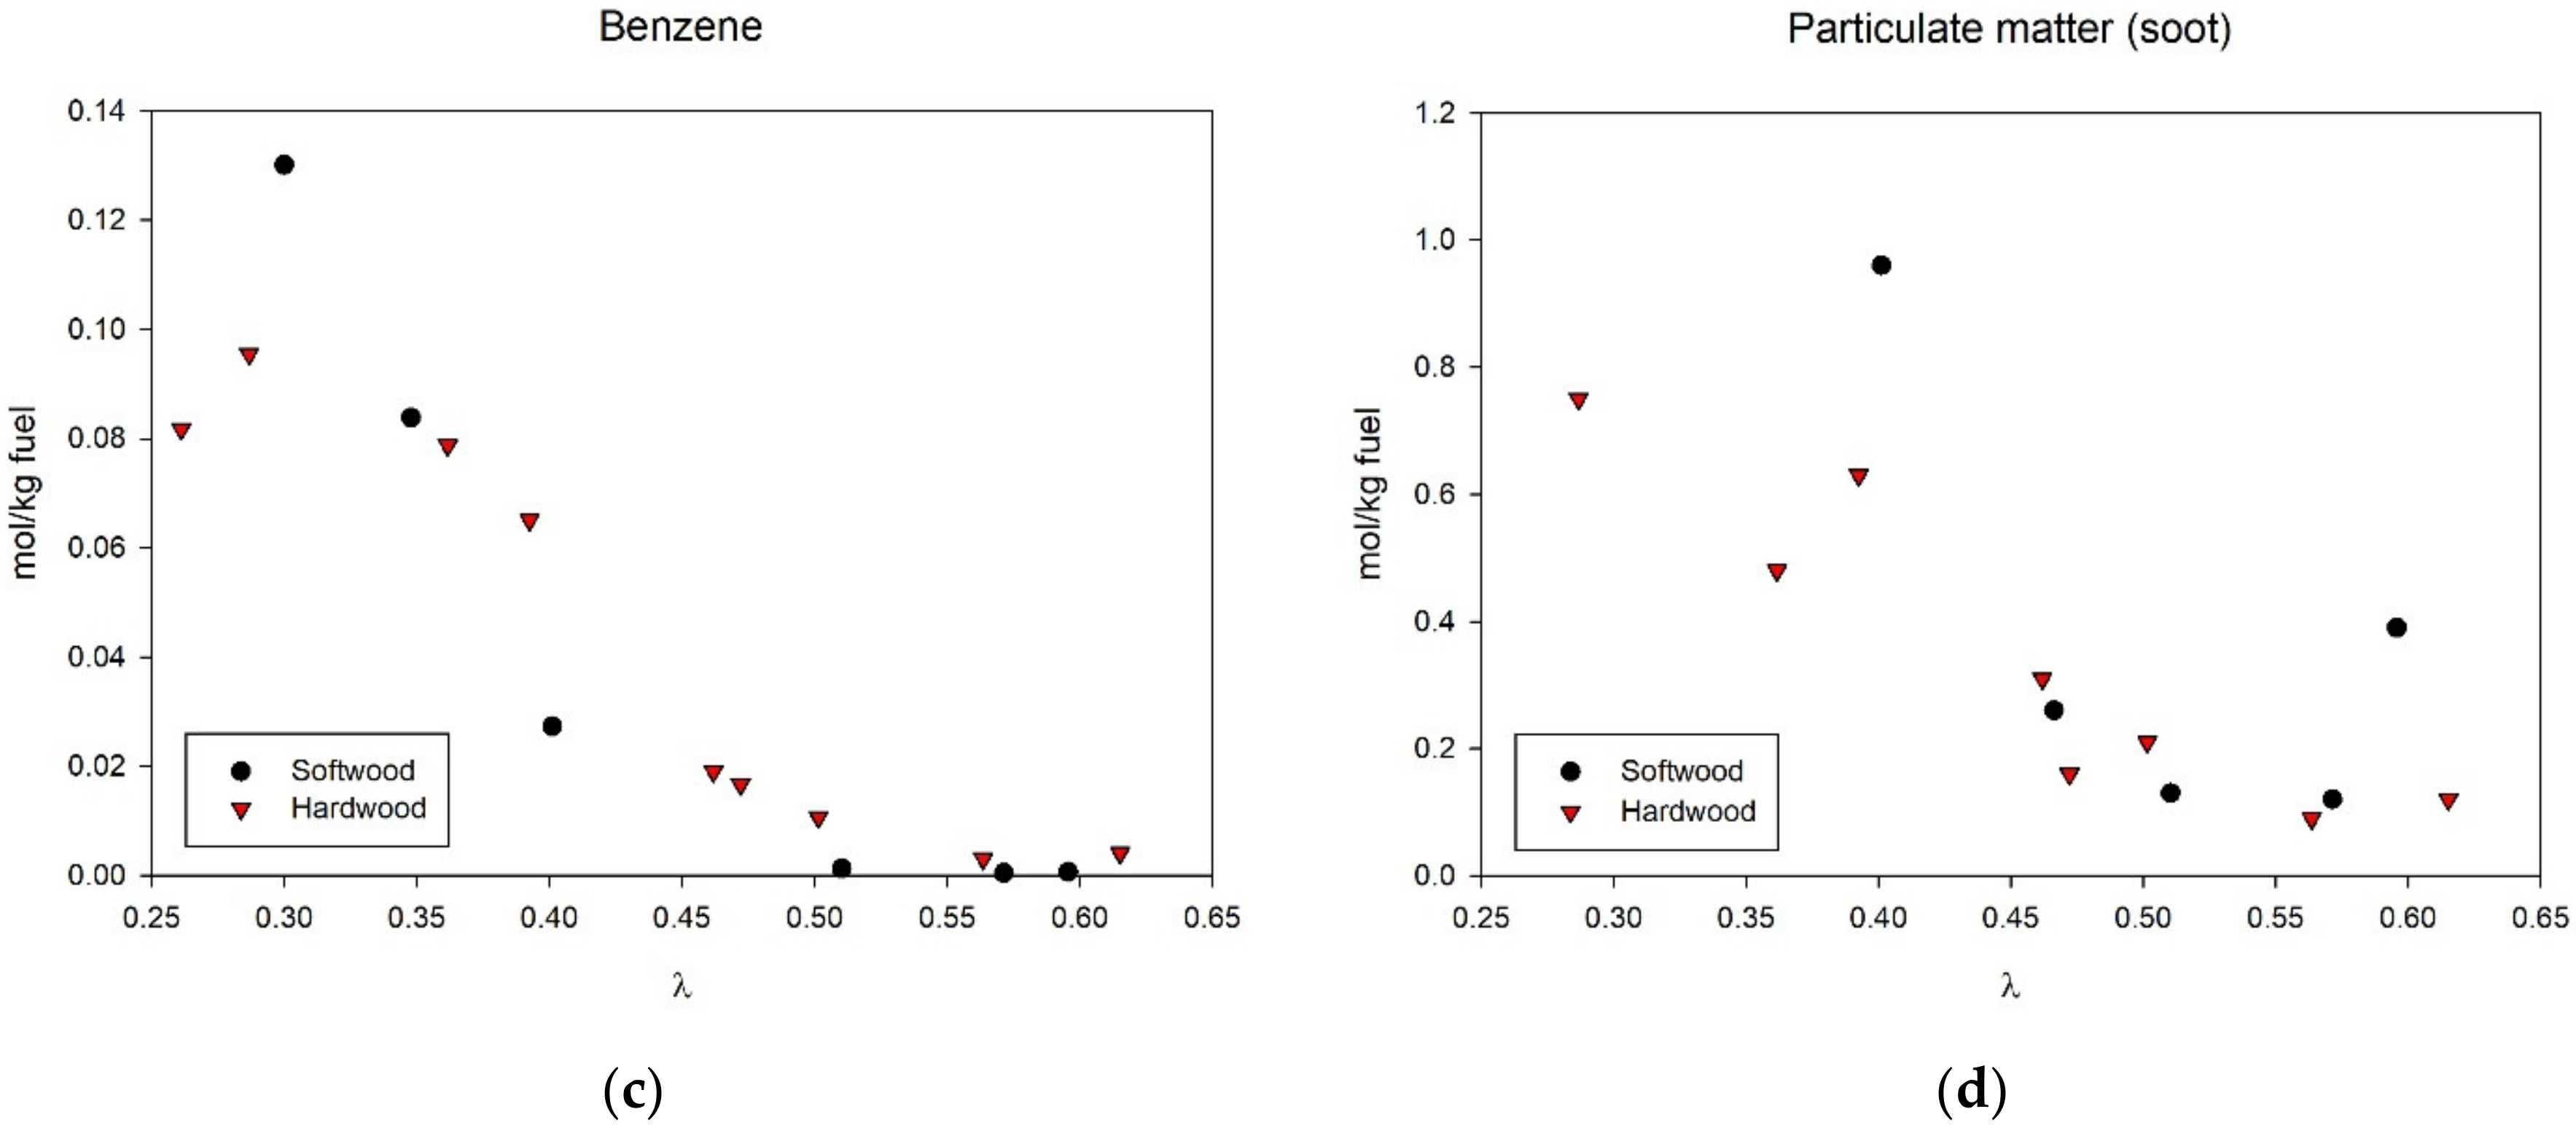
Tar formation is one of the major problems during the low-temperature gasification of biomass [22]. Tar undergoes secondary and tertiary reactions at higher temperatures generating polyaromatic hydrocarbons (PAHs) [23], which ultimately results in soot inception (e.g., [24]). Other research groups have previously shown that the amount of tar decreases with increasing gasification temperature [25,26,27]. At temperatures above 1100 °C, the tar yield became negligible, while soot was formed instead. The optimum for soot formation seemed to be found at about 1100–1200 °C, while even higher temperatures resulted in soot conversion. The idea behind the pilot design used in this work (FOXBG, Figure 1) was that the oxygen jets from the secondary and tertiary registers would result in sufficiently high reaction temperatures for tar destruction already in the gasification reactor. Experience has also shown that the syngas from FOXBG contains only small amounts of tars, but that some soot is formed instead. Of the aromatic components, benzene is mainly found, which was also the most abundant aromatic species found by Zhang et al. during partial oxidation of biomass at high temperatures [27]. For this reason, this section focuses on minor hydrocarbon species such as methane and acetylene, as well as benzene and soot in addition to some S-, N-, and Cl-containing syngas species.
The yields of the minor syngas components, methane (CH4), acetylene (C2H2), and benzene (C6H6), as well as the particulate matter (soot) entrained in the syngas, can be seen in Figure 6 as functions of λ. The yields of CH4 and C2H2 (Figure 6a,b) were obtained from the µGC gas analysis, while benzene (C6H6) (Figure 6c) was obtained from GC analysis of gas bag samples. The yields of the hydrocarbons decreased with increased λ for both fuels. Previous works have indicated that the syngas composition of these species strongly correlates with the gasification temperature [9] and that, like these experiments, the hydrocarbon yield decreases with increasing process temperature. The unexpectedly high concentration of CH4 and C2H2 for hardwood at λ = 0.40 can be explained by the lower process temperature during that experimental day, as seen in Figure 3.
The yield of soot (mol/kg fuel) (Figure 6d) was calculated assuming the particulate matter being composed entirely of carbon (i.e., molar mass 0.012 kg/mol). This is, of course, a rough approximation. Analysis of the particulate matter from gasification experiments at λ 0.40 using SEM/EDS revealed that the particles were composed of approximately 65 mol-% carbon, 25 mol-% oxygen, while inorganic elements such as silicon, potassium, and calcium accounted for the majority of the remaining part. Previous work showed that an increased process temperature (i.e., increased λ) resulted in a reduction of the carbon content of the particulate matter due to the oxidation of soot. At the same time, the proportion of inorganic material increased due to both carbon oxidation and a higher degree of inorganic vaporization from the fuel particle [28].
The soot yield was included in the carbon mass balance estimation of Table 2. However, based on the above discussion, it can be argued that the soot yield was overestimated due to the presence of other elements in the particulate matter, especially at higher λs. Nevertheless, estimated soot yields accounted for only a few percent of the total carbon balance in this work, and the results are still considered reasonable given the magnitude of other experimental measurement uncertainties.
The soot yield was reduced at higher λ for both fuels. This was in line with previous work, where soot and PAH yields from gasification of biomass were shown to decrease at higher λ [19]. Enhanced soot conversion is achieved at higher process temperatures and higher oxygen stoichiometry (e.g., [25]).
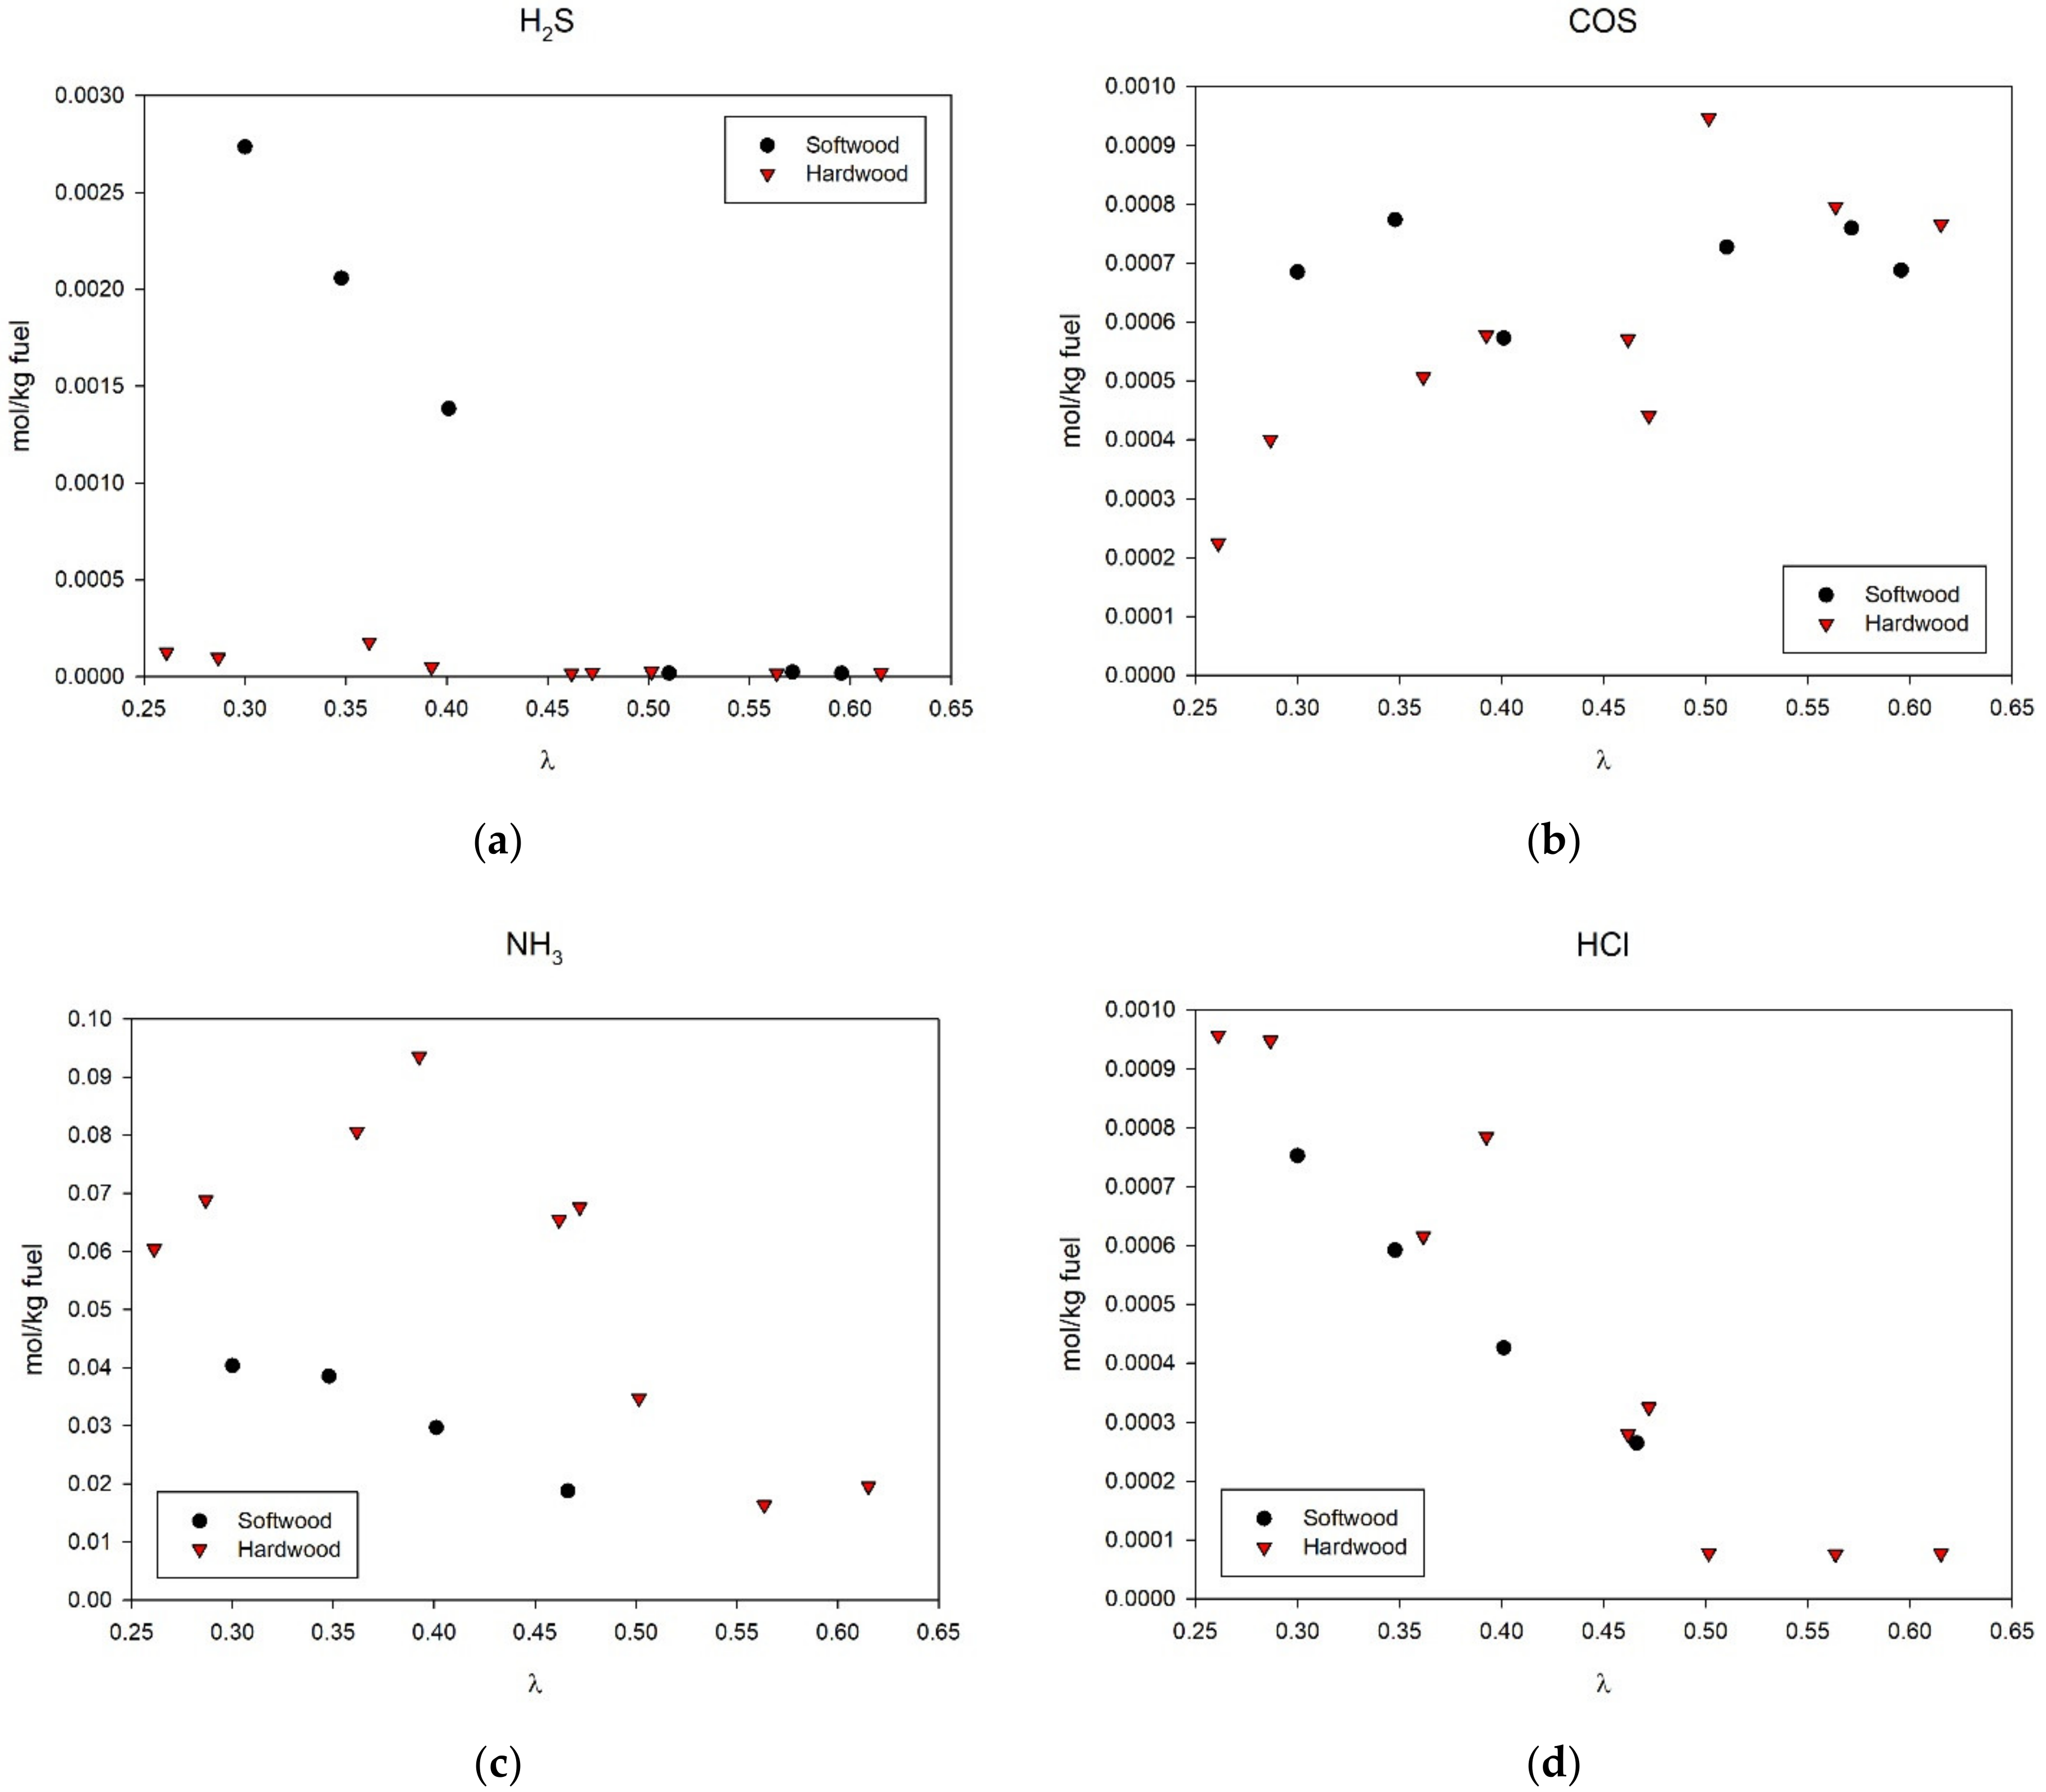
The gas yields of hydrogen sulfide (H2S) and carbonyl sulfide (COS) (Figure 7a,b) were obtained from GC analyses of gas bag samples, while ammonia (NH3) and hydrogen chloride (HCl) (Figure 7c,d) were obtained from the FTIR. The amounts of S, N, and Cl were relatively small compared to the other constituents in the feedstock (e.g., ash, C, H, and O), as seen in Table 1. Therefore S, N, and Cl were only found in low concentrations in the syngas and/or ash. The experimental measurement error becomes proportionally large at low concentrations, which may be one of the reasons why the mass balances for these elements have not been successfully closed.
The yield of H2S from softwood gasification seemed to decrease with increasing λ, whereas the COS yield was relatively constant over the experimentally tested λ range. Gasification of hardwood resulted in low H2S yields over the whole λ range. The hardwood COS yield was slightly lower compared to softwood at operational setpoints below λ = 0.40. Otherwise, the COS yields were similar from both feedstocks. It was previously concluded that the release of sulfur species during gasification of coal is complex and highly dependent on the mode of occurrence of sulfur, as well as the influence of other inorganic elements of the ash such as calcium (Ca) and magnesium (Mg), which may have a capturing effect [29,30]. The higher calcium content of the hardwood bark may therefore have prevented the sulfur release, resulting in the overall lower H2S and COS yields in this work. Other researchers also conclude that additional research is necessary to fully understand the effect of stoichiometry, gasification temperature, and other inorganic species on the release of sulfur species to the product gas [31]. COS can be converted to H2S via the reaction COS + H2O ⇌ H2S + CO2, but reaction kinetics is reported to be slow [30]. This may explain why the COS yield did not appear to be significantly affected by operating conditions during the experimental trials (Figure 7b). Similar behavior was reported regarding the COS yields from different biomass feedstocks converted at different temperatures under gasification-like conditions [32].
The nitrogen content of hardwood bark was almost twice that of softwood bark (Table 1). This may be one of the reasons why the NH3 yield was approximately 1.5–3 times higher for hardwood bark compared to softwood bark (Figure 7c). Increasing λ seemed to decrease the yield of NH3. Other researchers showed that the conversion of NH3 to N2 during gasification was temperature-dependent, with the syngas content of NH3 decreasing with higher temperatures [33]. This may explain the results for NH3 in this work, which also indicated reducing NH3 yields at higher λ, i.e., higher temperature. Fuel-N may also result in the formation of HCN. However, the yield of HCN during gasification of biomass is usually much lower than the NH3 yield [33], and therefore not measured in this work.
The fuel content of chlorine in hardwood bark was approximately twice that of softwood bark (Table 1). Nevertheless, the estimated yields of HCl as functions of λ were essentially similar (Figure 7d). It is well known that chlorine tends to react with gaseous alkali species, which precipitate as alkali chlorides as the syngas is cooled downstream of the gasification reactor [34]. The total alkali content (K + Na) of the hardwood bark was approximately 1.6 times the corresponding content of the softwood bark. It was thus in the same order of magnitude as the difference in chlorine content. The formation of alkali chlorides may, therefore, explain the reduced HCl levels at higher λ, as the higher temperature is likely to result in greater evaporation of volatile alkali metals [35]. However, the chlorine mass balance was not the focus of this work and will therefore have to be investigated further in future studies.
3.5. Online TDLAS Measurements
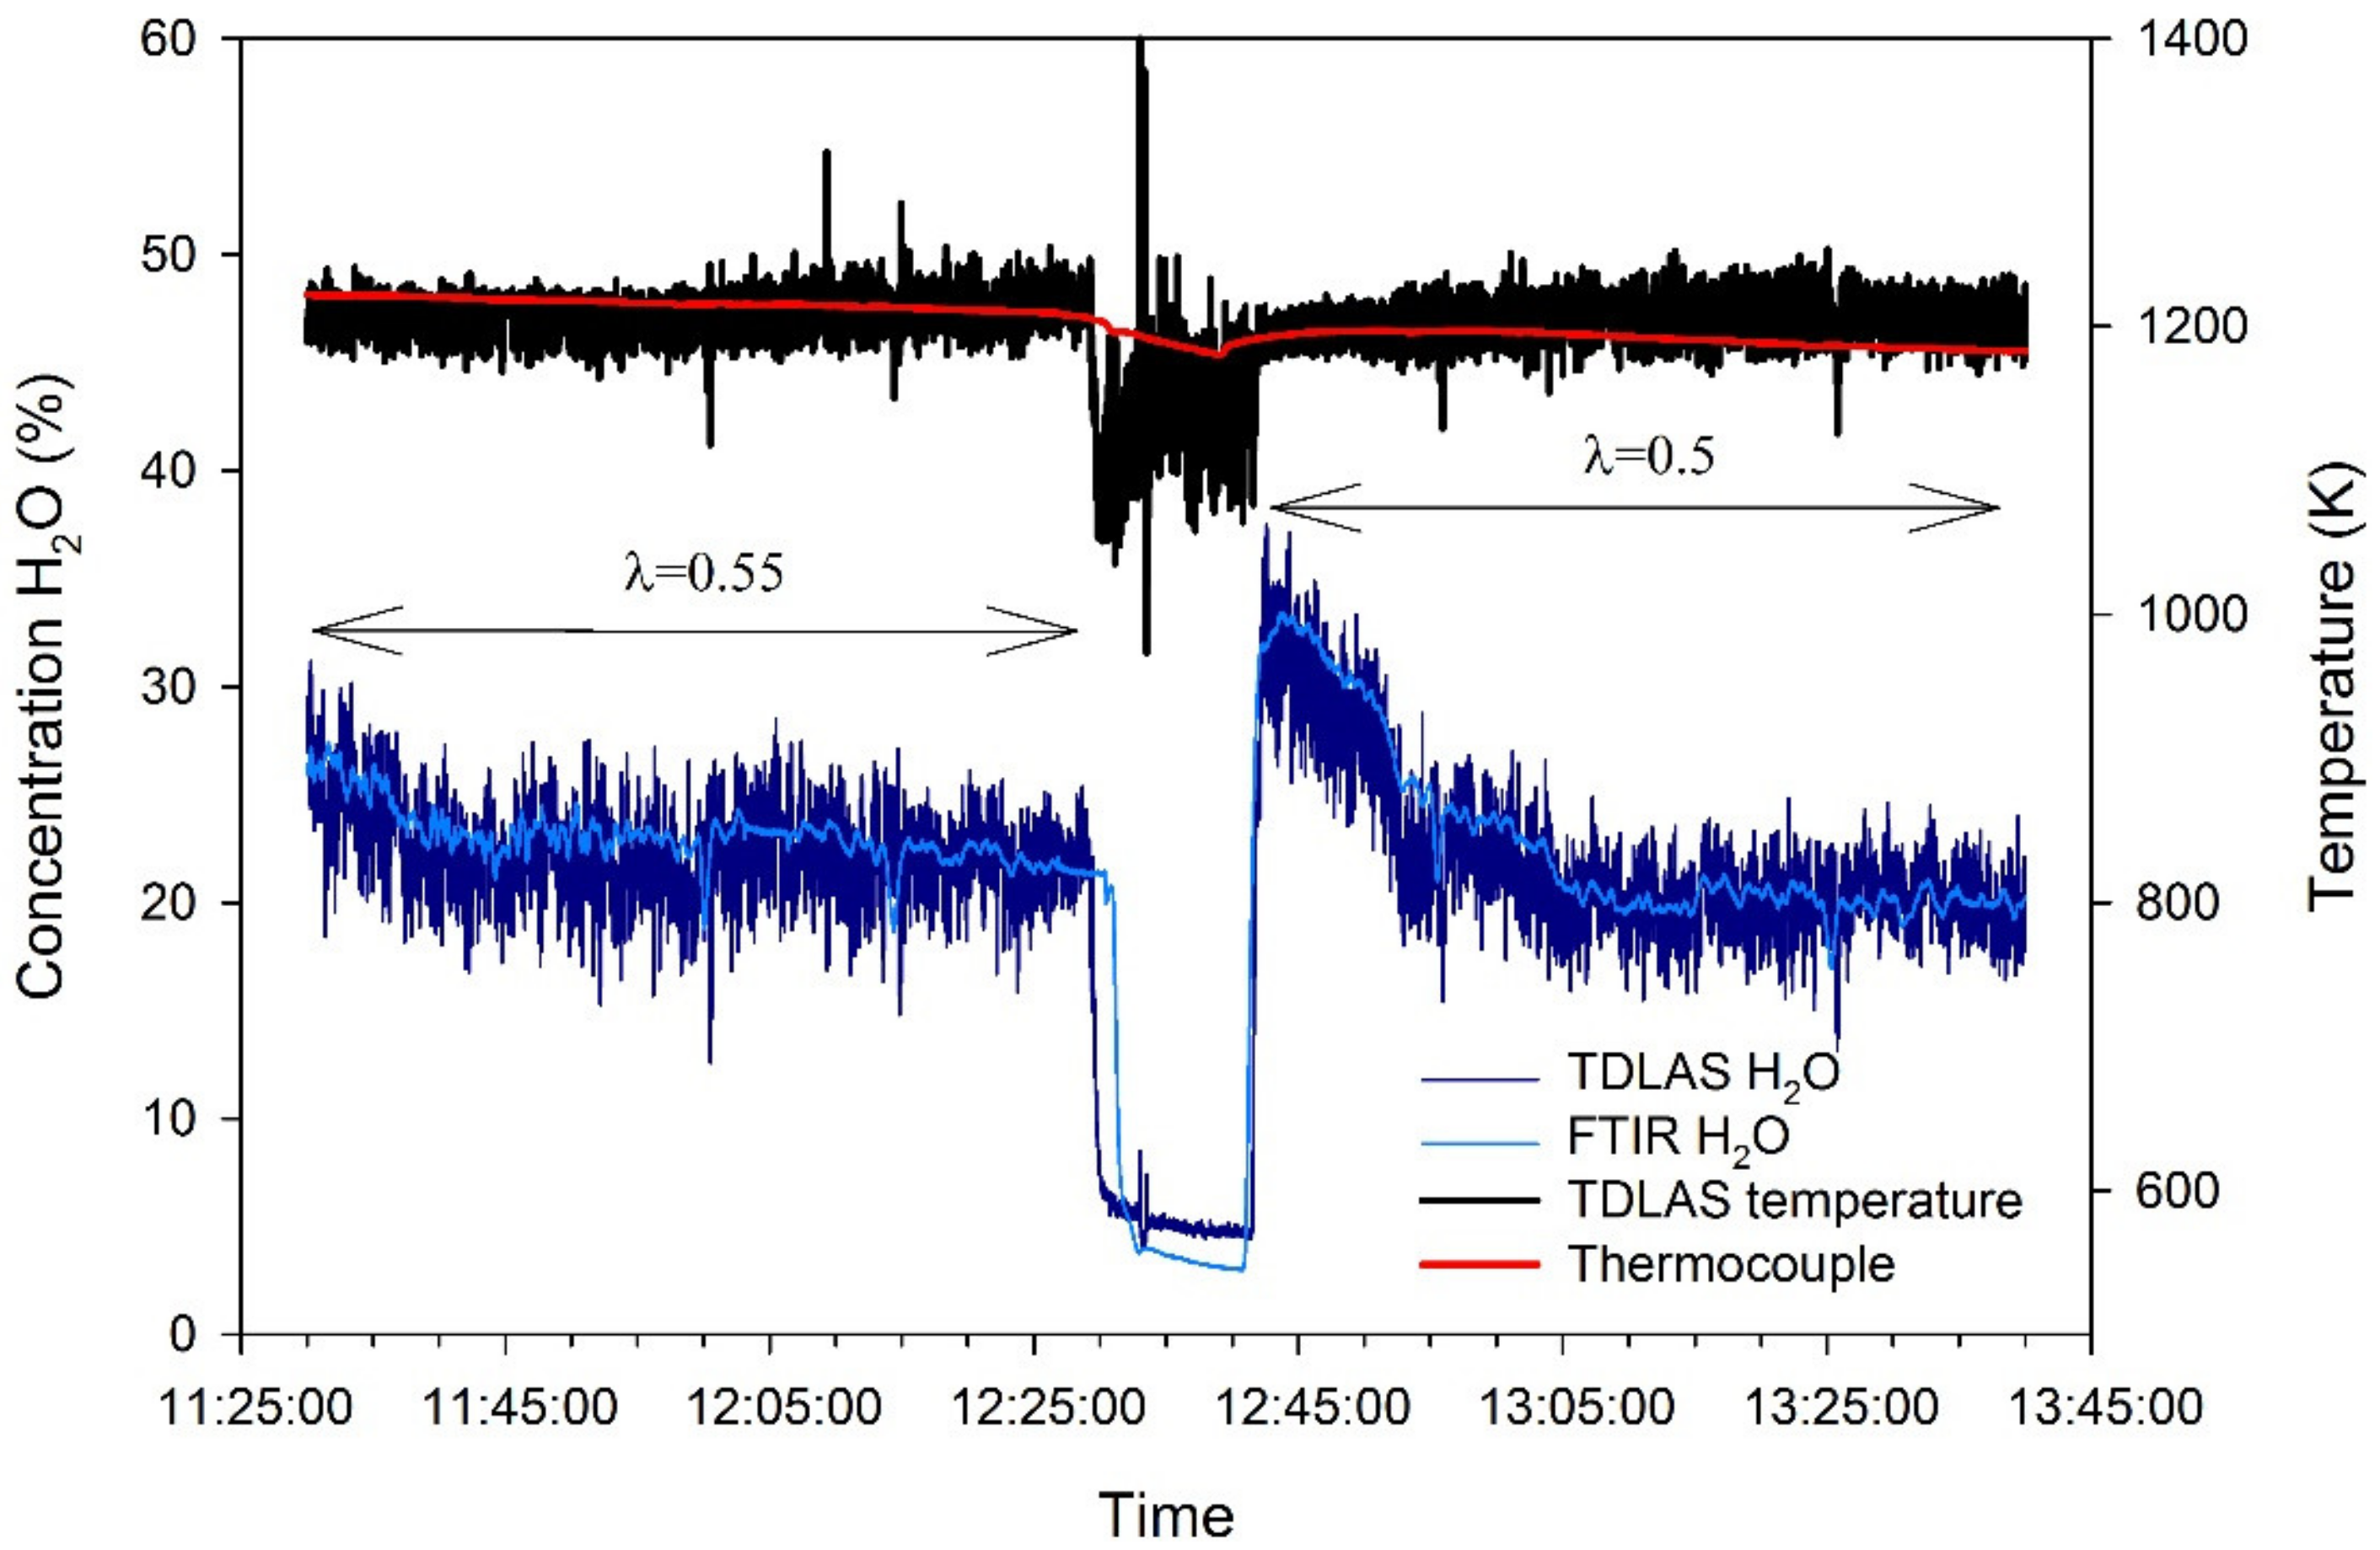
Figure 8 shows two hours of real-time water concentration measured by TDLAS and FTIR. In addition, the temperatures measured by the TDLAS and the thermocouple closest to the TDLAS-position are shown in the graph. The graph shows measurements during gasification at two equivalence ratios and char combustion in-between. The water concentration measured by the TDLAS was found close to the concentration measured by FTIR. The temperature derived from the TDLAS measurements showed a temperature around 1200 K. This temperature was in line with the thermocouple readings. Since the thermocouples used for measuring the temperature in the reactor core were placed inside alumina tubes with a diameter of 5 mm, this made the temperature fluctuations difficult to resolve due to the high thermal inertia. The temperature fluctuations could however, be resolved with the TDLAS technique.
The variations captured by the TDLAS in water concentration and temperature were observed in the raw spectroscopic TDLAS data as well as for the water concentration measured by the FTIR. However, the averaging effect of gas mixing probably resulted in smoothening of the water concentration measured by the FTIR. The FTIR instrument was located a few meters from the gasifier, and it, therefore, took a while before the syngas reached the FTIR’s measuring cuvette. Nevertheless, both instruments indicated evident fluctuations. It can therefore, be assumed that this was related to the process itself and not caused by measurement artifacts. By calculating the power spectral density of the water concentration from the TDLAS and the FTIR, and the reactor core pressure logged by the control system, the nature of the variations could be investigated. However, no clearly isolated frequency peaks in the calculated power spectral density plots were found for either of the signals. This indicates that the variations have no natural frequency and can be considered as randomly occurring.
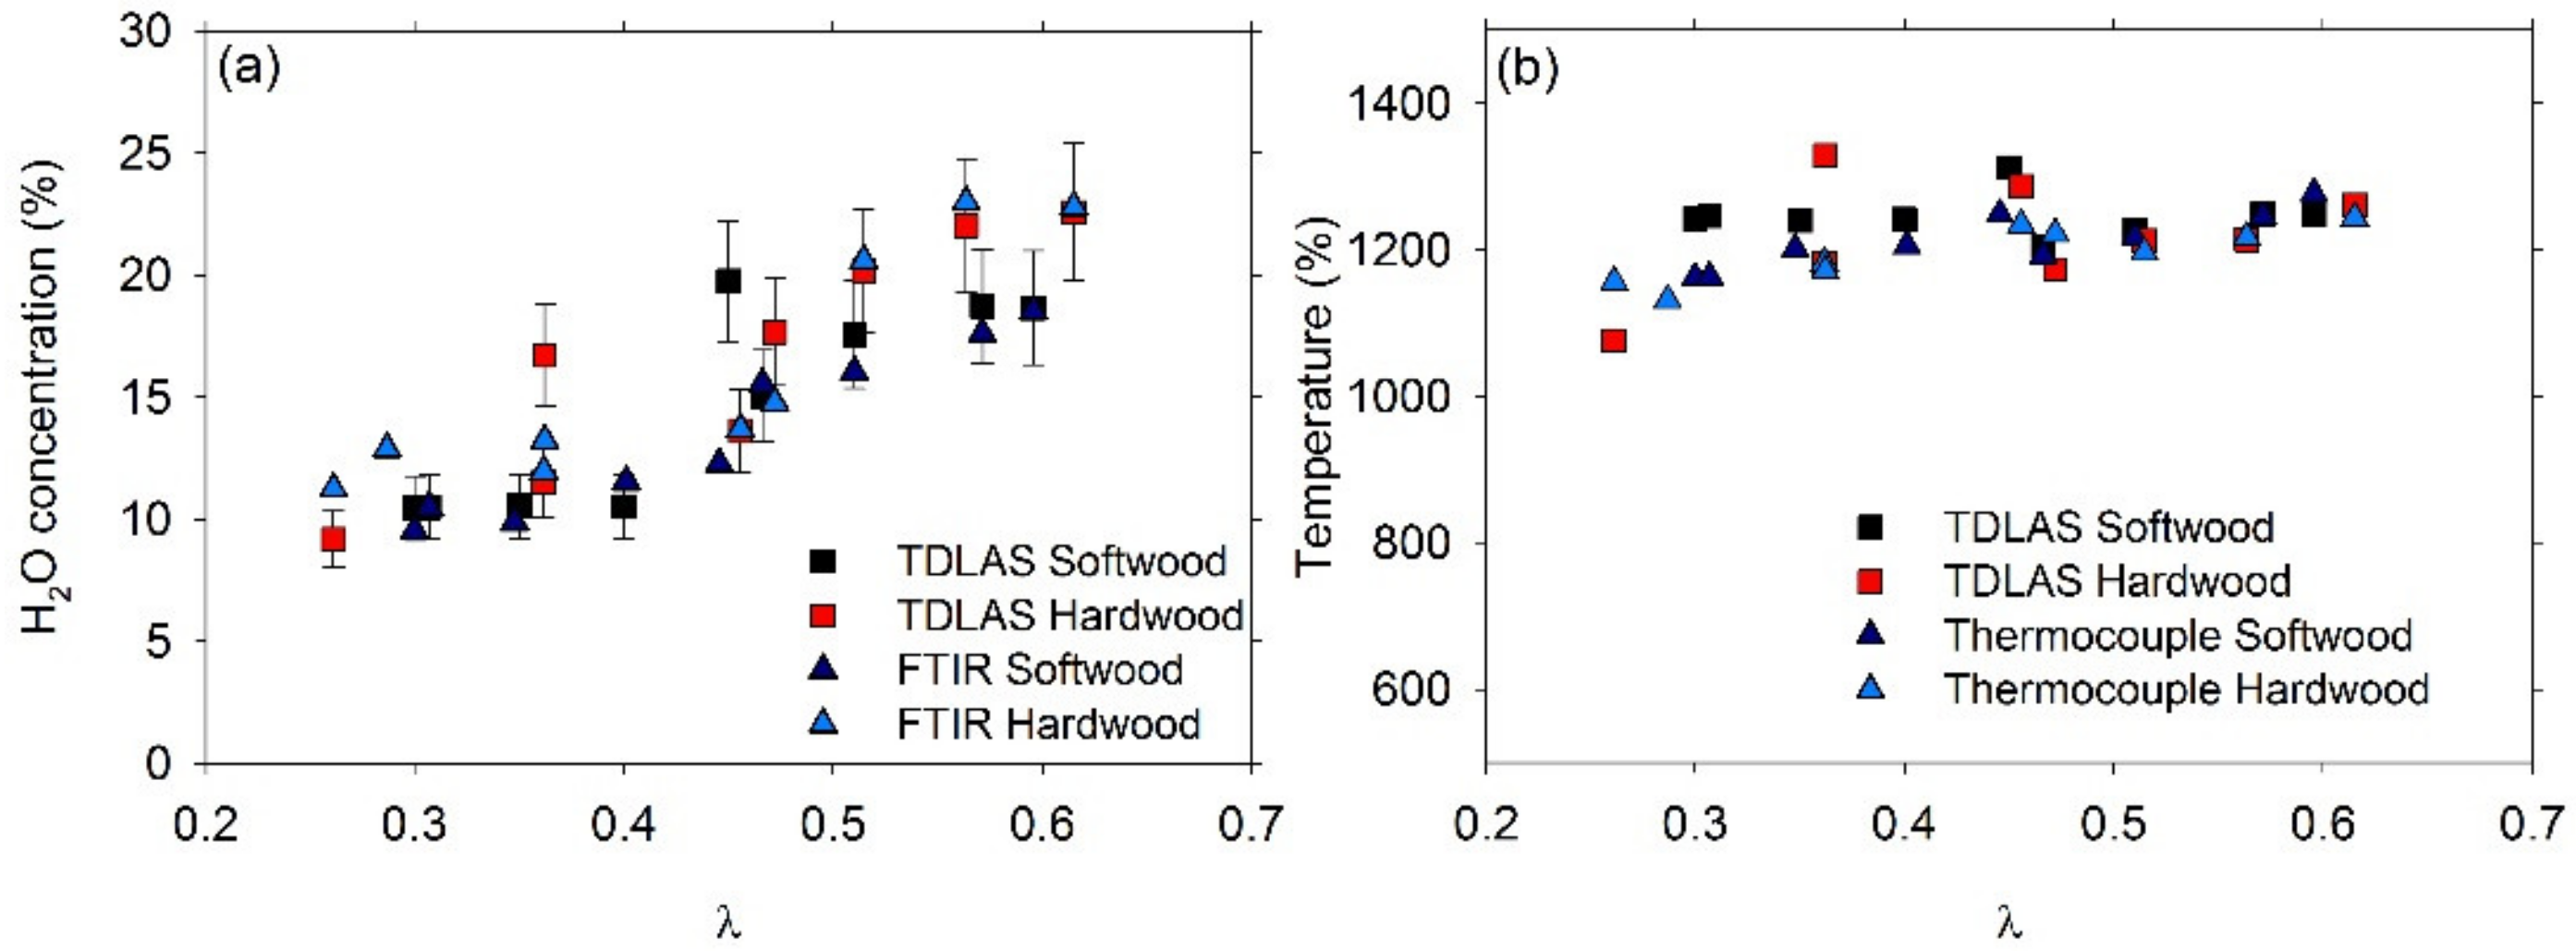
Figure 9 shows a comparison between the average water concentration measured with TDLAS and FTIR (a) and average temperatures measured by the TDLAS and the closest in-core thermocouple (b). The average values were calculated from the last 30 min of each experimental setpoint. Generally, the water concentration increased as a function of the O2 equivalence ratio, λ. It was also found that gasification of hardwood resulted in a higher concentration of water than softwood. The differences in water concentration between the TDLAS and the FTIR measurements were relatively small; here, the error bars represent the largest relative difference measured between the instruments in combustion mode. The largest source of uncertainty for the measurement was inaccuracies in pathlength. For this reactor, an error of 1 cm would account for a 5% relative difference in water concentration.
The temperature measured with both techniques showed temperature measurements between 1000–1400 K. As seen in Figure 8, the thermocouple had a very slow response time. How the reactor was operated, and in combination with averaging, may explain the difference between TDLAS and thermocouple readings for some of the set-points.
3.6. Inorganic Element Distribution
The bottom and fly ash samples were, as previously mentioned, analyzed using SEM-EDS. Three different spots were analyzed for each sample in order to estimate the average elemental composition and standard deviation. The average elemental composition was then used as input for thermodynamic equilibrium calculations to study the theoretical slag formation behavior at different process temperatures during gasification.
3.6.1. Bottom Ash
Ash, in both slag and powder form, was examined for both fuels using the method described in Section 2.6. The results from the bottom ash analysis are summarized in Table S1 (Supplementary Material).
The most common elements besides oxygen and carbon in the bottom ash were silicon and calcium for both fuel types. Comparing the ash analysis results with the fuel analysis (Table 1), the silicon contents in the fuel were approximately the same for both softwood and hardwood bark. The calcium content in the fuel (Table 1) was approximately three times higher for hardwood bark compared to softwood bark.
Thermodynamic equilibrium calculations were performed, using the elemental composition in Table S1 as input, in order to study the slag formation at different process temperatures relevant for gasification. The results from the thermodynamic equilibrium calculations are presented in Supplementary Material Figures S1 and S2 for softwood and hardwood bark, respectively. The most important information from a practical perspective is perhaps at what temperature the ash content was predicted to form slag.
It can be seen that slag formation was predicted to start at temperatures above 900 °C and that the majority of the inorganic elements were predicted to exist entirely in the molten slag phase at temperatures above 1200 °C for softwood bark (Figure S1). Hardwood bark showed similar behavior (Figure S2). However, the slag formation was predicted to start already at 800 °C, and Si and Ca were predicted to be entirely included in the slag phase above 1300 °C. Thus, hardwood bark showed a slightly larger temperature window in which both molten slag and solid phases could coexist. Depending on the viscosity of the slag and/or the slag-solid mixture, there is a temperature window, usually referred to as the “sticky zone”, where ash exhibits undesirable behavior for any gasifier [3]. Slag viscosity is determined by the slag composition and temperature. It has previously been shown that the viscosity increased with the increasing content of SiO2 [36], while alkali decreased the viscosity [37]. Predicting the slag viscosity was, however, out of the scope of the current paper.
3.6.2. Syngas Particulate Matter
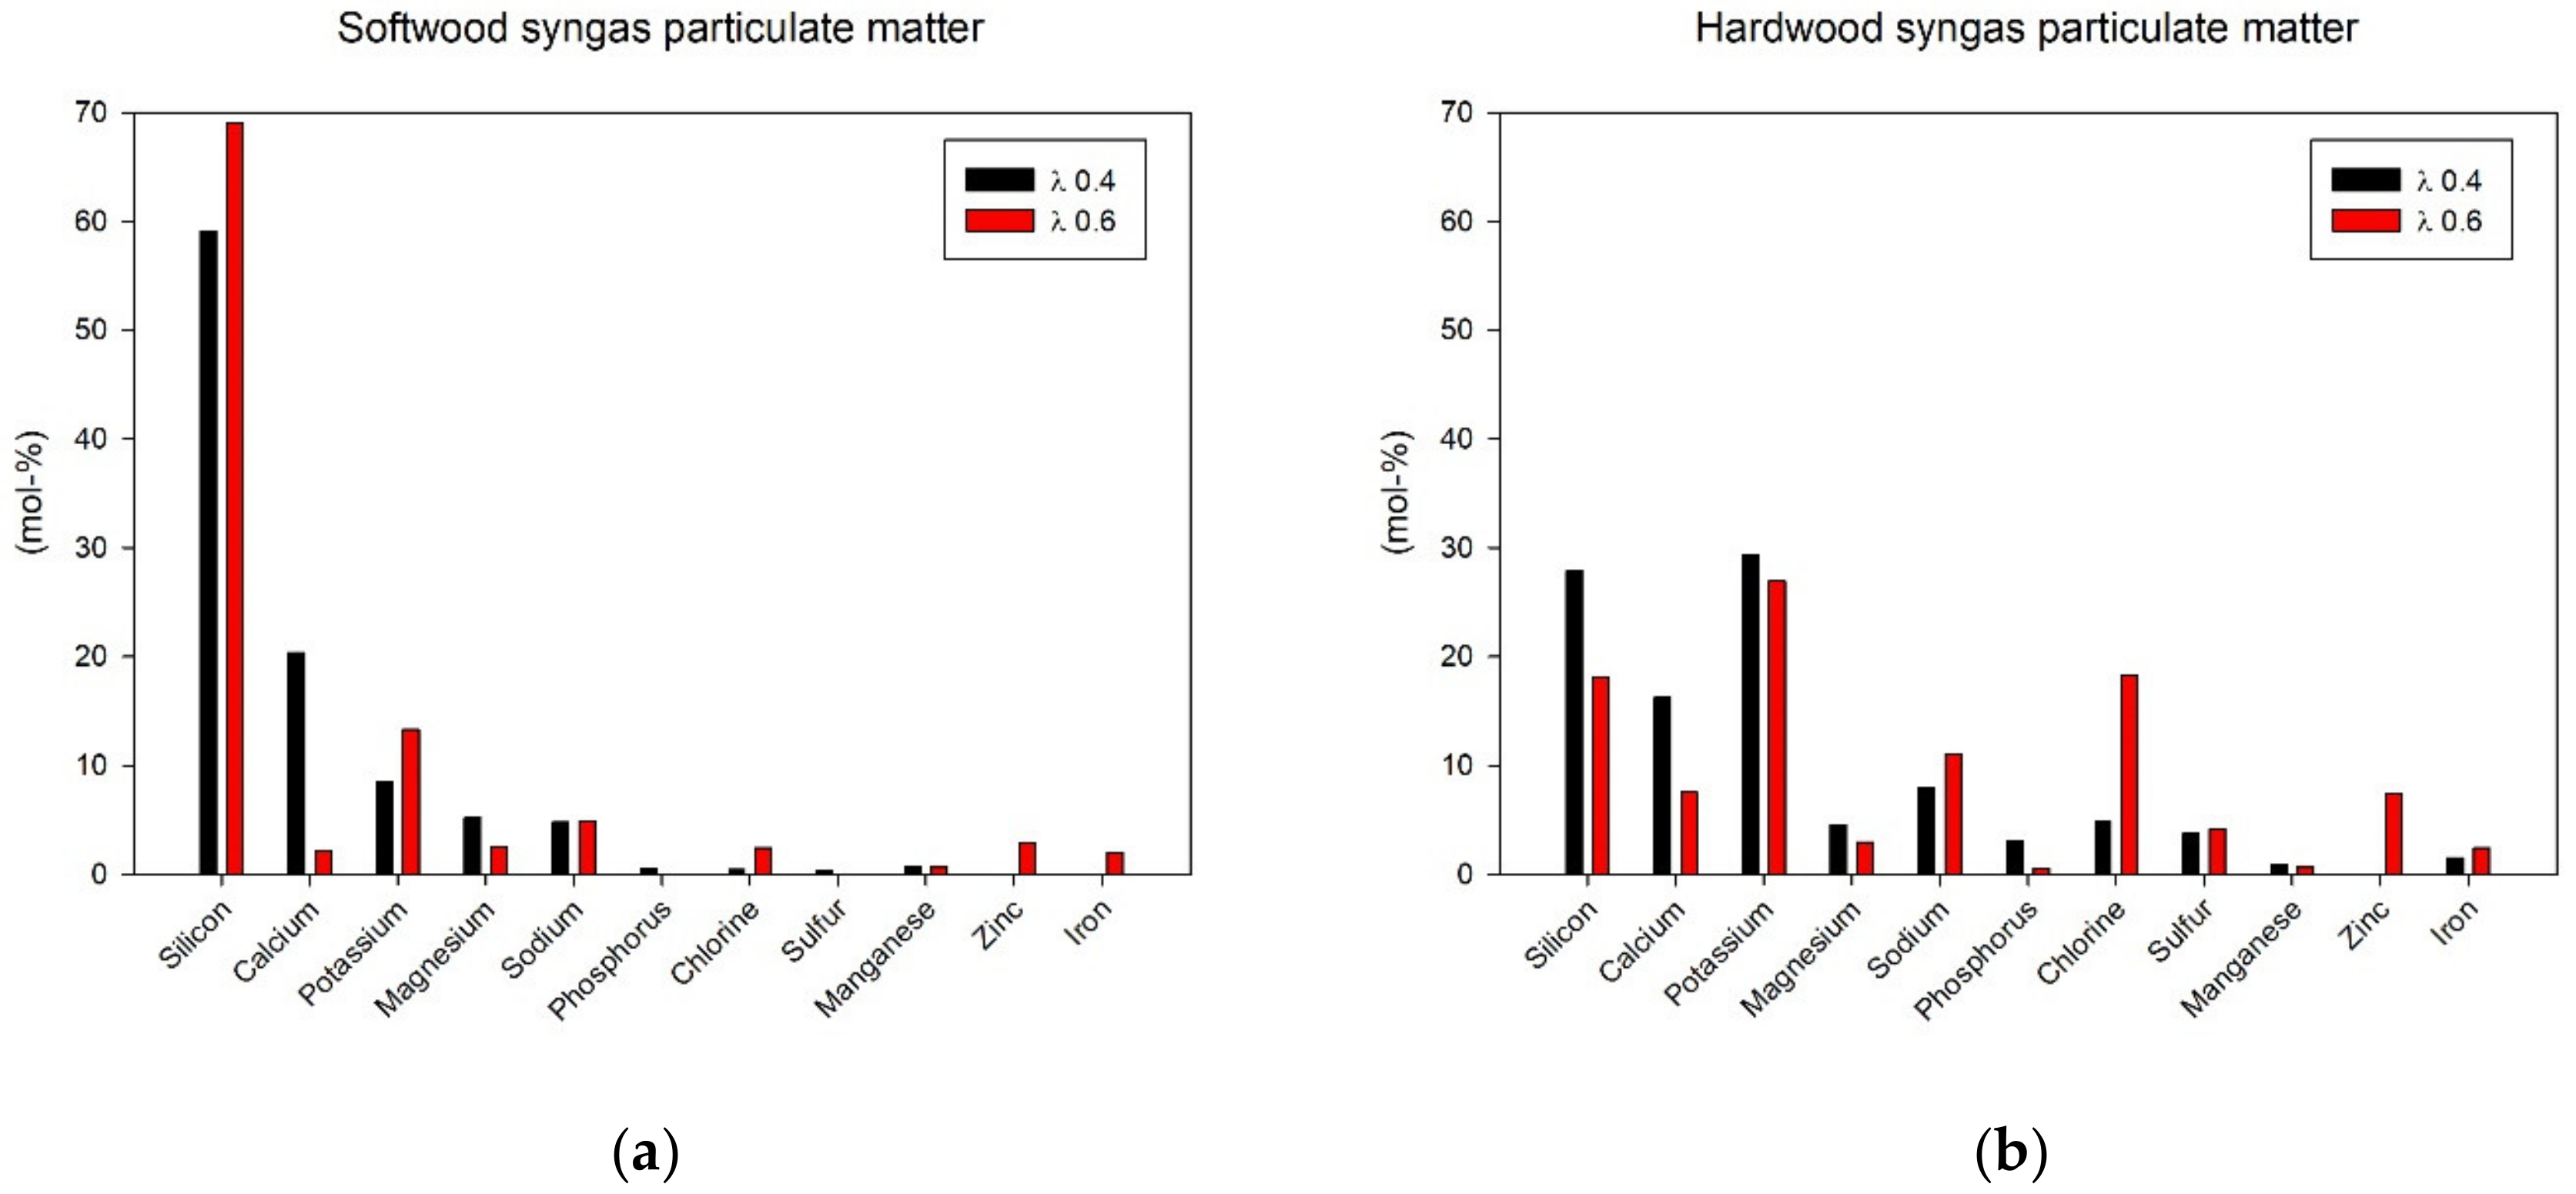
Particulate matter entrained in the syngas was also analyzed from LPI measurements using SEM-EDS, see Figure 10. The particulate matter from two setpoints, λ 0.40 and 0.60, was studied for each fuel type. Since only inorganic elements were of interest, the data were normalized, excluding C and O. Furthermore, Al was excluded from the graphs since the results could otherwise have been biased due to interactions with the aluminum foil on which the particles were sampled.
The Si content was higher for softwood compared to hardwood particulate matter, around 5–7 times higher, despite the hardwood fuel containing more Si according to the fuel analysis (Table 1). An explanation for this behavior could be that the hardwood fuel also contained a much higher content of Ca, which is known to react with Si to form various calcium silicates [38] that are expected to remain in the reactor bed. The lower content of Ca for softwood bark may thus have resulted in a larger proportion of Si leaving the bed as volatile SiO(g) [35], to later precipitate as particulate matter forming fly ash.
The yields of the alkali metals K and Na, as well as Zn and Cl in the particulate matter from gasification, were higher for hardwood compared to softwood. The reason for this was probably the higher content of these elements in the hardwood feedstock. Furthermore, the yields of these elements seemed to increase with λ, which seems natural since a higher gasification temperature (at higher λ) should result in higher volatility of these elements. Because of the higher volatility, there is also a higher probability for gaseous alkali species (e.g., K(g), Na(g), KOH(g), NaOH(g)) to react with HCl(g) forming alkali chlorides that subsequently precipitated in the syngas as fly ash particles [34]. The theory that a larger proportion of Cl is bound to alkali chlorides at higher λ also supports the results for HCl(g), seen in Figure 7d, which showed that the yield of HCl(g) decreased with increased λ.
4. Conclusions
Oxygen-blown fixed-bed gasification of bark residues from the pulp and paper industry was successfully demonstrated in the pilot scale. Maximum cold gas efficiency (CGE) was achieved at operating conditions around an oxygen stoichiometric ratio of λ = 0.40 and amounted to approximately 76% and 70% for softwood bark and hardwood bark, respectively. The corresponding yields of CO and H2, valuable for the downstream synthesis of motor fuels, were highest for the softwood bark. The maximum values were around 29 mol/kg fuel and 15 mol/kg fuel, respectively. The experiments indicated that carbon accumulated in the bed at operating conditions corresponding to λ below 0.35.
The yields of methane, acetylene, other higher hydrocarbons, and soot were correlated with the process temperature and decreased with increasing λ. Other minor impurities in the syngas, e.g., NH3 and HCl, also decreased with increasing λ. The situation for sulfur compounds, H2S and COS, was much more complex and seemed dependent on other inorganic elements in the fuel, such as calcium.
The non-intrusive measurement technique using TDLAS enabled time-resolved measurement of both water content and temperature in the syngas. The TDLAS results were in good agreement with the water content measured by the FTIR instrument and the thermocouple close to the TDLAS port, respectively. The TDLAS signals could theoretically be part of a future process—AI (artificial intelligence) control system that enables corrective action to optimize process efficiency.
Supplementary Materials
The following are available online at https://0-www-mdpi-com.brum.beds.ac.uk/2227-9717/9/1/163/s1, Figure S1: Predicted distribution of major inorganic elements from softwood bark as a function of process temperature (°C), Figure S2: Predicted distribution of major inorganic elements from hardwood bark as a function of process temperature (°C), Table S1: Elemental composition (mol-%) of bottom ash from softwood and hardwood bark measured using SEM-EDS. The average and standard deviations were calculated based on measurements of three different spots per sample.
Author Contributions
F.W. contributed with the original idea and planned most of the work. All authors were involved in the experiments and the evaluation of the results. Y.Ö. was responsible for TDLAS measurements and subsequent compilation of results. S.L. compiled the other parts and was also responsible for the thermodynamic equilibrium calculations. All authors have read and agreed to the published version of the manuscript.
Funding
The Pulp&Fuel project, within which this work was mainly carried out, received funding from the European Union’s Horizon 2020 research and innovation program under grant agreement No. 818011. The TDLAS method, for temperature and water concentration measurements, was developed within the Bio4Gasification (B4G) and Swedish Gasification Center (SFC), financed by the Swedish Energy Agency together with academia and industry partners.
Institutional Review Board Statement
Not applicable.
Informed Consent Statement
Not applicable.
Data Availability Statement
The data presented in this study are available on request from the corresponding author.
Acknowledgments
We would like to express our gratitude to the research engineers, operators, and technical staff at RISE ETC who have helped with the experiments.
Conflicts of Interest
The authors declare no conflict of interest.
References
- European Comission. A European Strategy for Low-Emission Mobility. 2020. Available online: https://ec.europa.eu/clima/policies/transport_en (accessed on 17 November 2020).
- European Comission. Sustainability Criteria. 2020. Available online: https://ec.europa.eu/energy/topics/renewable-energy/biofuels/sustainability-criteria_en (accessed on 17 November 2020).
- Higman, C.; van der Burgt, M. Gasification; Gulf Professional Publishing: Houston, TX, USA, 2008. [Google Scholar]
- Van Dyk, J.; Keyser, M.; Coertzen, M. Syngas production from South African coal sources using Sasol-Lurgi gasifiers. Int. J. Coal Geol. 2006, 65, 243–253. [Google Scholar] [CrossRef]
- Molino, A.; LaRocca, V.; Chianese, S.; Musmarra, D. Biofuels production by biomass gasification: A review. Energies 2018, 11, 811. [Google Scholar] [CrossRef] [Green Version]
- Farzad, S.; Mandegari, M.; Görgens, J. A critical review on biomass gasification, co-gasification, and their environmental assessments. Biofuels Res. J. 2016, 12, 483–495. [Google Scholar] [CrossRef]
- Landälv, I.; Gebart, R.; Marke, B.; Granberg, F.; Furusjö, E.; Löwnertz, P.; Öhrman, O.; Sørensen, E.; Salomonsson, P. Two years experience of the BioDME project—A complete wood to wheel concept. Environ. Prog. Sustain. Energy 2014, 33, 744–750. [Google Scholar] [CrossRef]
- Khodakov, A.Y.; Chu, W.; Fongarland, P. Advances in the development of novel Cobalt Fischer-Tropsch catalysts for synthesis of long-chain hydrocarbons and clean fuels. Chem. Rev. 2007, 107, 1692–1744. [Google Scholar] [CrossRef]
- Weiland, F. Pressurized Entrained Flow Gasification of Pulverized Biomass: Experimental Characterization of the Process Performance. Ph.D. Thesis, Luleå University of Technology, Luleå, Sweden, 2015. [Google Scholar]
- Correa, C.; Kruse, A. Supercritical water gasification of biomass for hydrogen production—Review. J. Supercrit. Fluids 2018, 133, 573–590. [Google Scholar] [CrossRef]
- Rönnlund, I.; Myréen, L.; Lundqvist, K.; Ahlbeck, J.; Westerlund, T. Waste to energy by industrially integrated supercritical water gasification—Effects of alkali salts in residual by-product from the pulp and paper industry. Energy 2011, 36, 2151–2163. [Google Scholar] [CrossRef]
- Pulp&Fuel. Pulp&Fuel—Pulp and Paper Industry Wastes to Fuel. 2020. Available online: http://pulpandfuel.eu/ (accessed on 18 November 2020).
- Wiinikka, H.; Wennebro, J.; Gullberg, M.; Pettersson, E.; Weiland, F. Pure oxygen fixed-bed gasification of wood under high temperature (>1000 °C) freeboard conditions. Appl. Energy 2017, 191, 153–162. [Google Scholar] [CrossRef]
- Weiland, F.; Wiinikka, H.; Hedman, H.; Wennebro, J.; Pettersson, E.; Gebart, R. Influence of process parameters on the performance of an oxygen blown entrained flow biomass gasifier. Fuel 2015, 153, 510–519. [Google Scholar] [CrossRef]
- Goldstein, C.; Spearrin, R.; Jeffries, J.; Hanson, R. Infrared laser-absorption sensing for combustion. Prog. Energy Combust. Sci. 2017, 60, 132–176. [Google Scholar] [CrossRef] [Green Version]
- Ögren, Y.; Gullberg, M.; Wennebro, J.; Sepman, A.; Tóth, P.; Wiinikka, H. Influence of oxidizer injection angle on the entrained flow gasification of torrefied wood powder. Fuel Process. Technol. 2018, 181, 8–17. [Google Scholar] [CrossRef]
- Wiinikka, H.; Sepman, A.; Ögren, Y.; Lindblom, B.; Nordin, L.-O. Combustion evaluation of renewable fuels for iron-ore pellet induration. Energy Fuels 2019, 33, 7819–7829. [Google Scholar] [CrossRef]
- Weiland, F.; Hedman, H.; Marklund, M.; Wiinikka, H.; Öhrman, O.; Gebart, R. Pressurized oxygen blown entrained-flow gasification of wood powder. Energy Fuels 2013, 27, 932–941. [Google Scholar] [CrossRef]
- Weiland, F.; Nilsson, P.; Gebart, R.; Wiinikka, H.; Gudmundsson, A.; Sanati, M. Online characterization of syngas particulates using aerosol mass spectrometry in entrained-flow biomass gasification. Aerosol Sci. Technol. 2014, 48, 1145–1155. [Google Scholar] [CrossRef]
- Weiland, F.; Nordwaeger, M.; Olofsson, I.; Nordin, A.; Wiinikka, H. Entrained flow gasification of torrefied wood residues. Fuel Process. Technol. 2014, 125, 51–58. [Google Scholar] [CrossRef] [Green Version]
- Wiinikka, H.; Johansson, A.-C.; Wennebro, J.; Carlsson, P.; Öhrman, O.G. Evaluation of black liquor gasification intended for synthetic fuel or power production. Fuel Process. Technol. 2015, 139, 216–225. [Google Scholar] [CrossRef]
- Devi, L.; Ptasinski, K.; Janssen, F. A review of the primary measures for tar elimination in biomass gasification processes. Biomass Bioenergy 2003, 24, 125–140. [Google Scholar] [CrossRef]
- Evans, T.; Evans, R.; Abatzoglou, N. Biomass Gasifier Tars: Their Nature, Formation, and Conversion; National Renewable Energy Laboratory: Golden, CO, USA, 1998.
- Apicella, B.; Russo, C.; Cerciello, F.; Stanzione, F.; Ciajolo, A.; Scherer, V.; Senneca, O. Insights on the role of primary and secondary tar reactions in soot inception during fast pyrolysis of coal. Fuel 2020, 275, 117957. [Google Scholar] [CrossRef]
- Qin, K.; Jensen, P.; Weigang, L.; Jensen, A. Biomass gasification behavior in an entrained flow reactor: Gas product distribution and soot formation. Energy Fuels 2012, 26, 5992–6002. [Google Scholar] [CrossRef] [Green Version]
- Qin, K.; Lin, W.; Jensen, P.; Jensen, A. High-temperature entrained flow gasification of biomass. Fuel 2012, 93, 589–600. [Google Scholar] [CrossRef]
- Zhang, Y.; Kajitani, S.; Ashizawa, M.; Oki, Y. Tar destruction and coke formation during rapid pyrolysis and gasification of biomass in a drop-tube furnace. Fuel 2010, 89, 302–309. [Google Scholar] [CrossRef]
- Wiinikka, H.; Toth, P.; Jansson, K.; Molinder, R.; Broström, M.; Sandström, L.; Lighty, J.; Weiland, F. Particle formation during pressurized entrained flow gasification of wood powder: Effects of process conditions on chemical composition, nanostructure and reactivity. Combust. Flame 2018, 189, 240–256. [Google Scholar] [CrossRef]
- Porbatzki, D.; Stemmler, M.; Müller, M. Release of inorganic trace elements during gasification of wood, straw, and miscanthus. Biomass Bioenergy 2011, 35 (Suppl. 1), S79–S86. [Google Scholar] [CrossRef]
- Bläsing, M.; Nazeri, K.; Müller, M. Release of alkali metal, sulphur and chlorine species during high-temperature gasification and co-gasification of hard coal, refinery residue, and petroleum coke. Fuel 2014, 126, 62–68. [Google Scholar] [CrossRef]
- Meng, X.; de Jong, W.; Fu, N.; Verkooijen, A. Biomass gasification in a 100 kWth steam-oxygen blown circulating fluidized bed gasifier: Effect of operational conditions on the product gas distribution and tar formation. Biomass Bioenergy 2011, 35, 2910–2924. [Google Scholar] [CrossRef]
- Bläsing, M.; Zini, M.; Müller, M. Influence of feedstock on the release of potassium, sodium, chlorine, sulfur, and phosphorus species during gasification of wood and biomass shells. Energy Fuels 2013, 27, 1439–1445. [Google Scholar] [CrossRef]
- Zhou, J.; Masutani, S.; Ishimura, D.; Turn, S.; Kinoshita, C. Release of fuel-bound nitrogen during biomass gasification. Ind. Eng. Chem. Res. 2000, 39, 626–634. [Google Scholar] [CrossRef]
- Bläsing, M.; Melchior, T.; Müller, M. Influence of the temperature on the release of inorganic species during high-temperature gasification of hard coal. Energy Fuels 2010, 24, 4153–4160. [Google Scholar] [CrossRef]
- Wang, Q.; Qiu, J.; Liu, Y.; Zheng, C. Effect of atmosphere and temperature on the speciation of mineral in coal combustion. Fuel Process. Technol. 2004, 85, 1431–1441. [Google Scholar] [CrossRef]
- Xuan, W.; Wang, H.; Xia, D. Deep structure analysis on coal slags with increasing silicon content and correlation with melt viscosity. Fuel 2019, 242, 362–367. [Google Scholar] [CrossRef]
- Chen, X.; Kong, L.; Bai, J.; Dai, X.; Li, H.; Bai, Z.; Li, W. The key for sodium-rich coal utilization in entrained flow gasifier: The role of sodium on slag viscosity-temperature behavior at high temperatures. Appl. Energy 2017, 206, 1241–1249. [Google Scholar] [CrossRef]
- Risnes, H.; Fjellerup, J.; Henriksen, U.; Moilanen, A.; Norby, P.; Papadikis, K.; Posselt, D.; Sørensen, L. Calcium addition in straw gasification. Fuel 2003, 82, 641–651. [Google Scholar] [CrossRef]
Figure 1.
Schematic process flow diagram of the fixed-bed oxygen blown gasifier (FOXBG). For process temperature, reference is made to measurements at the thermocouple *T (S), while temperature measurements with tunable diode laser absorption spectroscopy (TDLAS) were compared with top thermocouple, ^T (S).

Figure 2.
Picture of the fuel pellets used in this work. The ruler on the left-hand side indicates the scale in centimeters.
Figure 2.
Picture of the fuel pellets used in this work. The ruler on the left-hand side indicates the scale in centimeters.

Figure 3.
Process temperatures (°C) as a function of λ for softwood and hardwood bark fuel.

Figure 4.
Gas yields (mol/kg fuel) of the major syngas components (a) H2, (b) CO, (c) CO2, and (d) H2O as functions of λ.
Figure 4.
Gas yields (mol/kg fuel) of the major syngas components (a) H2, (b) CO, (c) CO2, and (d) H2O as functions of λ.

Figure 5.
Cold gas efficiencies (CGE) as a function of λ, (a) CGEpower and (b) CGEfuel.

Figure 6.
Gas yields of the minor syngas components (a) methane (CH4), (b) acetylene (C2H2), and (c) benzene (C6H6), as well as yield of particulate matter (d), as a function of λ given in mol/kg fuel.
Figure 6.
Gas yields of the minor syngas components (a) methane (CH4), (b) acetylene (C2H2), and (c) benzene (C6H6), as well as yield of particulate matter (d), as a function of λ given in mol/kg fuel.


Figure 7.
Gas yields (mol/kg fuel) of the trace syngas components (a) H2S, (b) COS, (c) NH3, and (d) HCl as functions of λ.
Figure 7.
Gas yields (mol/kg fuel) of the trace syngas components (a) H2S, (b) COS, (c) NH3, and (d) HCl as functions of λ.

Figure 8.
The real-time measurements of H2O by the TDLAS (tunable diode laser absorption spectroscopy) and FTIR (Fourier-transform infrared spectroscopy) and the temperature measured by TDLAS and thermocouple (type S). The data in the graph were acquired during gasification of hardwood for two equivalence ratios and the char combustion in between.

Figure 9.
The average water concentration (a) and average temperature (b) for λ ratios between 0.25–0.65 of the two tested fuels. Measurements with TDLAS (tunable diode laser absorption spectroscopy), FTIR (Fourier-transform infrared spectroscopy), and thermocouple (type S).
Figure 9.
The average water concentration (a) and average temperature (b) for λ ratios between 0.25–0.65 of the two tested fuels. Measurements with TDLAS (tunable diode laser absorption spectroscopy), FTIR (Fourier-transform infrared spectroscopy), and thermocouple (type S).

Figure 10.
Syngas particulate matter (mol-%) from LPI measurements of (a) softwood and (b) hardwood bark.
Figure 10.
Syngas particulate matter (mol-%) from LPI measurements of (a) softwood and (b) hardwood bark.


Table 1.
Fuel composition of softwood bark and hardwood bark pellets as delivered.
| Proximate Analysis (wt.%, as Received) | Softwood Bark | Hardwood Bark |
|---|---|---|
| Moisture * | 11.7 | 11.4 |
| Volatile matter | 62.5 | 62.6 |
| Fixed carbon | 19.1 | 19.4 |
| Ash | 6.7 | 6.6 |
| Ultimate analysis (wt.%, dry) | ||
| Carbon | 50.0 | 43.4 |
| Hydrogen | 5.62 | 5.21 |
| Oxygen | 36.3 | 43.4 |
| Sulfur | <0.10 | <0.10 |
| Nitrogen | 0.36 | 0.58 |
| Chlorine | 0.02 | 0.04 |
| Calorific analysis (MJ/kg, dry) | ||
| Lower heating value (LHV) | 18.6 | 17.1 |
| Major inorganic elements (mg/kg, dry) | ||
| Silicon | 15,100 | 16,400 |
| Aluminum | 2670 | 2710 |
| Calcium | 5950 | 17,400 |
| Iron | 1540 | 1320 |
| Potassium | 2000 | 3470 |
| Magnesium | 744 | 1270 |
| Manganese | 159 | 238 |
| Sodium | 372 | 383 |
| Phosphorus | 185 | 408 |
| Titanium | 155 | 155 |
* moisture content at delivery. The fuels dried somewhat before the gasification experiments, see text above for more details.
Table 2.
Operating conditions, measured process temperature, and resulting carbon closure of the experiments.
Table 2.
Operating conditions, measured process temperature, and resulting carbon closure of the experiments.
| Fuel | Fuel Feeding Rate | O2 Feeding Rate | λ | Process Temp. | Carbon Closure | ||
|---|---|---|---|---|---|---|---|
| Prim. | Sec. | Tert. | *T (S) | ||||
| kg/h | NL/min | NL/min | NL/min | - | °C | % | |
| Softwood | 4.21 | 12.96 | 6.24 | 0.00 | 0.30 | 957 | 89 |
| 4.24 | 12.96 | 6.24 | 3.20 | 0.35 | 996 | 93 | |
| 4.20 | 5.18 | 14.01 | 6.40 | 0.40 | 992 | 108 | |
| 4.20 | 6.02 | 11.81 | 11.88 | 0.47 | 1052 | 104 | |
| 4.12 | 12.97 | 6.17 | 12.76 | 0.51 | 1120 | 103 | |
| 4.04 | 12.97 | 6.17 | 15.95 | 0.57 | 1136 | 106 | |
| 4.23 | 12.97 | 6.17 | 19.14 | 0.60 | 1125 | 105 | |
| Hardwood | 4.31 | 9.34 | 4.63 | 0.00 | 0.26 | 950 | 78 |
| 4.42 | 13.48 | 2.26 | 0.00 | 0.29 | 944 | 88 | |
| 4.35 | 11.34 | 5.42 | 2.79 | 0.36 | 971 | 94 | |
| 4.59 | 14.34 | 2.42 | 5.59 | 0.39 | 861 | 103 | |
| 4.38 | 11.34 | 5.42 | 8.38 | 0.46 | 1014 | 96 | |
| 4.48 | 13.48 | 2.26 | 10.50 | 0.47 | 1017 | 97 | |
| 4.49 | 14.34 | 2.42 | 11.17 | 0.50 | 1073 | 105 | |
| 4.39 | 14.34 | 2.42 | 13.97 | 0.56 | 1077 | 103 | |
| 4.39 | 14.34 | 2.42 | 16.76 | 0.62 | 1062 | 106 | |
Publisher’s Note: MDPI stays neutral with regard to jurisdictional claims in published maps and institutional affiliations. |
© 2021 by the authors. Licensee MDPI, Basel, Switzerland. This article is an open access article distributed under the terms and conditions of the Creative Commons Attribution (CC BY) license (http://creativecommons.org/licenses/by/4.0/).
Share and Cite
MDPI and ACS Style
Weiland, F.; Lundström, S.; Ögren, Y. Oxygen-Blown Gasification of Pulp Mill Bark Residues for Synthetic Fuel Production. Processes 2021, 9, 163. https://0-doi-org.brum.beds.ac.uk/10.3390/pr9010163
AMA Style
Weiland F, Lundström S, Ögren Y. Oxygen-Blown Gasification of Pulp Mill Bark Residues for Synthetic Fuel Production. Processes. 2021; 9(1):163. https://0-doi-org.brum.beds.ac.uk/10.3390/pr9010163
Chicago/Turabian StyleWeiland, Fredrik, Sandra Lundström, and Yngve Ögren. 2021. "Oxygen-Blown Gasification of Pulp Mill Bark Residues for Synthetic Fuel Production" Processes 9, no. 1: 163. https://0-doi-org.brum.beds.ac.uk/10.3390/pr9010163
Note that from the first issue of 2016, this journal uses article numbers instead of page numbers. See further details here.