Article

Impedimetric Microcystin-LR Aptasensor Prepared with Sulfonated Poly(2,5-dimethoxyaniline)–Silver Nanocomposite

by
Mawethu Pascoe Bilibana
1,*,
Usisipho Feleni
2,*,
Avril Rae Williams
3 and
Emmanuel Iwuoha
1
1
SensorLab (University of Western Cape Sensor Laboratories), Chemical Sciences Building, University of the Western Cape, Bellville 7535, Cape Town, South Africa
2
Institute for Nanotechnology and Water Sustainability (iNanoWS), Florida Campus, College of Science, Engineering and Technology, University of South Africa, Johannesburg 1710, South Africa
3
Department of Biological and Chemical Sciences, University of the West Indies, Cave Hill Campus, Bridgetown BB11000, Barbados
*
Authors to whom correspondence should be addressed.
Submission received: 14 October 2020 / Revised: 10 January 2021 / Accepted: 15 January 2021 / Published: 19 January 2021
(This article belongs to the Special Issue Application of Metal-Based Nanoparticles in Electrochemical Systems)

Abstract

:
This paper presents a novel impedimetric aptasensor for cyanobacterial microcystin-LR (L, l-leucine; R, l-arginine) (MC-LR) containing a 5′ thiolated 60-mer DNA aptamer (i.e., 5′-SH-(CH2)6GGCGCCAAACAGGACCACCATGACAATTACCCATACCACCTCATTATGCCCCATCT CCGC-3′). A nanocomposite electrode platform comprising biocompatible poly(2,5-dimethoxyaniline) (PDMA)-poly(vinylsulfonate) (PVS) and silver nanoparticle (Ag0) on a glassy carbon electrode (GCE), i.e., (GCE/PDMA–PVS–Ag0) was used in the biosensor development. Small-angle X-ray scattering (SAXS) spectroscopic analysis revealed that the PDMA–PVS–Ag0 nanocomposites were polydispersed and contained embedded Ag0. Electrochemical impedance spectroscopy (EIS) responses of the aptasensor gave a dynamic linear range (DLR) and limit of detection (LOD) values of 0.01–0.1 ng L−1 MC-LR and 0.003 ng L−1 MC-LR, respectively. The cross-reactivity studies, which was validated with enzyme-linked immunosorbent assay (ELISA), showed that the aptasensor possesses excellent selectivity for MC-LR.

1. Introduction

Recently, novel nanocomposite materials with noble metal nanoparticles attached within a polymer matrix are being applied in biosensor development [1,2,3]. These hybrid nanocomposites containing embedded metal nanoparticles have large surface areas that enable the attachment of biological receptors, such as aptamers and enzymes, onto an electrode surface, which results in increased sensitivity [4,5,6,7,8,9]. Polyaniline (PANI) is a fascinating π conjugated conducting polymer with good environmental stability and ease of preparation. Its reversible doping chemistry is responsible for its being widely used in electrochromic devices, electrochemical capacitors, biosensors and chemical sensors [10,11,12,13,14,15]. However, the poor solubility of unmodified PANI in aqueous media limited its application in electrochemical biosensors [16]. The introduction of mono-alkyl or alkoxy substituents at the ortho position of the phenyl ring of the PANI molecule easily increases its solubility but reduces its conductivity. The introduction of 2,5-dialkoxy group onto the phenyl rings solves the problem of poor aqueous solubility while retaining the conductivity of PANI [17]. Masikini and co-workers reported that 2,5-dimethoxyaniline (DMA) produces soluble electrosynthetic poly(2,5-dimethoxyaniline) (PDMA), with a conductivity similar to that of polyaniline [1,18,19]. They demonstrated the application of an electrosynthetic PDMA–multi-walled carbon nanotube composite material in the development of highly impedimetric immunosensors for fumonisin B1 [20]. Microcystin-LR (L, l-leucine; R, l-arginine) (MC-LR) is considered the most potent cyanobacterial toxin and the most common variant among other microcystin congeners. MC-LR is carcinogenic and is widespread in aquatic environments [21,22,23,24]. MC-LR causes adverse health conditions at nanogram to a microgram of MC-LR per gram of water [25,26,27]. Consequently, a limit of 1 μg L−1 in drinking water and a maximum daily intake of 0.04 μg kg−1 body weight are recommended [27]. The monitoring of these limits requires the use of user-friendly, sensitive, inexpensive and portable analytical devices. Several analytical techniques for the detection and quantification of MC-LR in drinking water, including mouse bioassays [28], chemical assays [29] and enzyme-linked immunosorbent assays (ELISA) [30,31], have been reported. However, their widespread and routine implementation has been hindered because of low sample throughputs, expensive running costs, large sample consumption and the requirement of skilled personnel [32]. Thus, alternative approaches for the detection MC-LR with biosensors have attracted a lot of interest recently [33], including the use of aptamer-based biosensors [31,34,35,36,37,38,39,40,41,42]. Aptamers are short, single-stranded oligonucleotides (ssDNA) that bind to target analytes, such as MC-LR, with high affinity and specificity [43,44,45,46]. Lin et al. provided the first report of an electrochemical aptasensor in the detection of MC–LR [47]. Several reports have described MC-LR-based electrochemical biosensors incorporating aptamers as recognition elements [48,49,50,51,52]. An electrochemical biosensor is considered to have excellent performance if it exhibits high selectivity toward the target analyte [34,53,54,55,56]. Aptamers’ selectivity, affinity, thermostability and wide pH range of application compare very favorably with those of the traditional biorecognition elements (such as enzymes, antibodies and receptors) used in biosensors [57,58,59,60,61,62].
The aim of this study is to develop a highly sensitive MC-LR aptasensor prepared with thiolated DNA aptamer and electrosynthetic PDMA–poly(vinylsulfonate) (PVS) nanocomposite doped with silver nanoparticle (Ag0) on a glassy carbon electrode (GCE). The responses of the aptasensor will be presented as Bode phase plots of the electrochemical impedance spectroscopy (EIS) data in order to determine the phase shifts (i.e., changes in the phase angle) caused by MC-LR. The MC-LR aptasensor’s preparation and Bode phase plot responses are schematically presented in Scheme 1.

2. Materials and Methods

2.1. Chemicals and Reagents

Reagent-grade trizma hydrochloride (Tris-HCl), sodium chloride (NaCl), magnesium chloride (MgCl2), disodium hydrogen phosphate (98%), 2-mercaptoethanol, potassium dihydrogen phosphate (99%), sodium hydrogen phosphate, potassium dihydrogen phosphate, hydrochloric acid, potassium chloride, 2,5-dimethoxyaniline (99%)(DMA), poly(vinylsulfonic acid) (PVS), silver nitrate (AgNO3), microcystin-LR (L, l-leucine; R, l-arginine) (MC-LR), microcystin-YR (Y, l-tyrosine; R, l-arginine) (MC-YR), microcystin-RR (l-arginine; l-arginine), nodularin-R (NODL-R), zearalenone (ZOE) and 17β estradiol (EE2) solutions were obtained from Sigma-Aldrich, Johannesburg, South Africa. 100 mM sodium phosphate buffer (PBS) containing 0.1 M KCl (pH 7.4) was used as the working buffer solution. 5′ thiolated DNA aptamer for microcystin-LR: 5′-SH-(CH2)6 GGCGCCAAACAGGACCACCATGACAATTACCCATACCACCTCATTATGCCCCATCTCCGC-3′ (MC-LR aptamer or SH-Apt), reported in the literature by Ng et al. [63] was purchased from Inqaba Biotech (Johannesburg, South Africa). The DNA aptamer solution was prepared by dissolving the thiolated 60-mer oligonucleotide in the binding buffer solution (50 mM Tris-HCl, pH 7.5, 150 mM NaCl and 2 mM MgCl2) and denatured by heating to 95 °C for 5 min, and then cooling gradually in ice to room temperature, in order to obtain the inherent 3-D structure. The stock solution of MC-LR aptamer was diluted using a phosphate buffer solution to obtain appropriate working concentrations. All aqueous solutions were prepared using deionized water purified by a Milli-Q water purification system (EMD Millipore, St Louis, MO, USA). Polishing pads, obtained from Buehler, Lake Bluff, IL, USA, and alumina micro powder (1.0, 0.3 and 0.05 µm alumina slurries), were used for polishing the glassy carbon electrode (GCE). All experiments were carried out at room temperature unless stated otherwise.

2.2. Electrochemical Experiments

A three-electrode cell, with GCE (3 mm diameter), platinum wire and silver/silver chloride (Ag/AgCl) (3 M NaCl type) as working, auxiliary and reference electrodes, respectively, was used for all the electrochemical measurements. Voltammetric experiments were performed on a BAS100W electrochemical workstation (Bioanalytical Systems Incorporated, BASi, West Lafayette, IN, USA). Electrochemical impedance spectroscopy (EIS) data were obtained with a ZAHNER IM6ex electrochemical workstation (ZAHNER-elektrik GmbH & Co., Kronach, Germany) at room temperature, 10 mV perturbation amplitude and frequency range of 100 kHz–100 MHz. Bode analysis of the EIS data was performed with ZView® software from Scribner Associates Incorporated (Southern Pines, NC, USA). All electrochemical experiments were conducted under an inert atmosphere obtained by degassing the cell with argon for approximately 10 min.

2.3. FTIR Spectroscopy

The characteristic features of the prepared materials were evaluated using a Fourier transform infrared spectrometer (FTIR) (PerkinElmer Spectrum 100, PerkinElmer Incorporated, Shelton, CT, USA). A Nicolet Evolution 100 UV-visible spectrometer (Thermo Fisher Scientific, Waltham, MA, USA) was used for all UV-vis absorption measurements of samples in quartz cuvettes.

2.4. Electron Microscopy

Scanning electron microscope (SEM) images were captured using a scanning electron microscope (JEOL–JSM 7500F). Transmission electron microscopy (TEM) images of the nanocomposite were obtained using a Tecnai G2 F20X-Twin MAT 200KV high resolution (HRTEM) equipped with an energy-dispersive X-ray spectroscopy (EDS) detector manufactured by Field Electron and Ion Company (FEI) Europe, Eindhoven, The Netherlands.

2.5. Small Angle X-ray Scattering (SAXS) Spectroscopy

Pore morphology, particle size distribution and architecture within the nanocomposites were determined by small-angle X-ray scattering (SAXS) measurements, using an Anton Paar-SAXSpace instrument from Anton Paar GmbH, Graz, Austria. The SAXS measurements were obtained using a line-collimation mode with an accessible q range value of 0.0732–1.66 nm, placed in a 1 mm diameter quartz capillary tube and positioned at a distance of 317 mm from the charge-coupled device (CCD) detector at a temperature of 20 °C. For each measurement, six frames were acquired at 100 s exposure time and averaged. In addition, deionized water was used as a reference under the same conditions as the nanocomposites. Data analysis was performed with the generalized indirect Fourier transformation (GIFT) software.

2.6. Atomic Force Microscopy

The surface topography and morphology of the deposited layers were analyzed with EasyScan atomic force microscope (AFM) manufactured by Nanosurf AG, Liestal, Switzerland). The silicon tip (n-type antimony-doped) of the AFM had a curvature radius of 2.5–3.5 m, a force constant of 1–5 N m−1 and a resonance frequency of 60–100 kHz. The samples for the AFM experiments were prepared by drop-coating the nanocomposite/water (5 μL) dispersion on a silicon wafer.

2.7. Electrodeposition of PDMA–PVS–Ag0

A bare GCE was polished to a mirror finish with 1.0, 0.3, and 0.05 μm alumina slurries, respectively, and then rinsed thoroughly with distilled water, followed by sonication in ethanol and water. The clean GCE was placed in a solution containing 1.0 M HCl, 100 mM DMA, 3 mM AgNO3 and 50 mM PVS. The solution was degassed with argon for about 10 min, and then a 15-cycle CV was performed at a potential window of −800 to +400 mV (vs. Ag|AgCl) and a scan rate of 40 mV s−1 to form GCE|PDMA–PVS–Ag0 nanocomposite electrode. The electroactivity of the PDMA–PVS–Ag0 nanocomposite material was studied at different scan rates (5–50 mV s−1) and a potential range of −800 to +400 mV in 1 M HCl and PBS solutions. EIS spectra were recorded with a Zahner IM6ex electrochemical workstation at a frequency range of 100 kHz to 100 MHz, an amplitude of 10 mV and a potential of 200 mV in PBS solution, pH 7.4. The Bode phase plots of the EIS data for GCE, GCE|PDMA, GCE|PDMA–PVS and GCE|PDMA–PVS–Ag0 were fitted to an equivalent circuit using ZView® software.

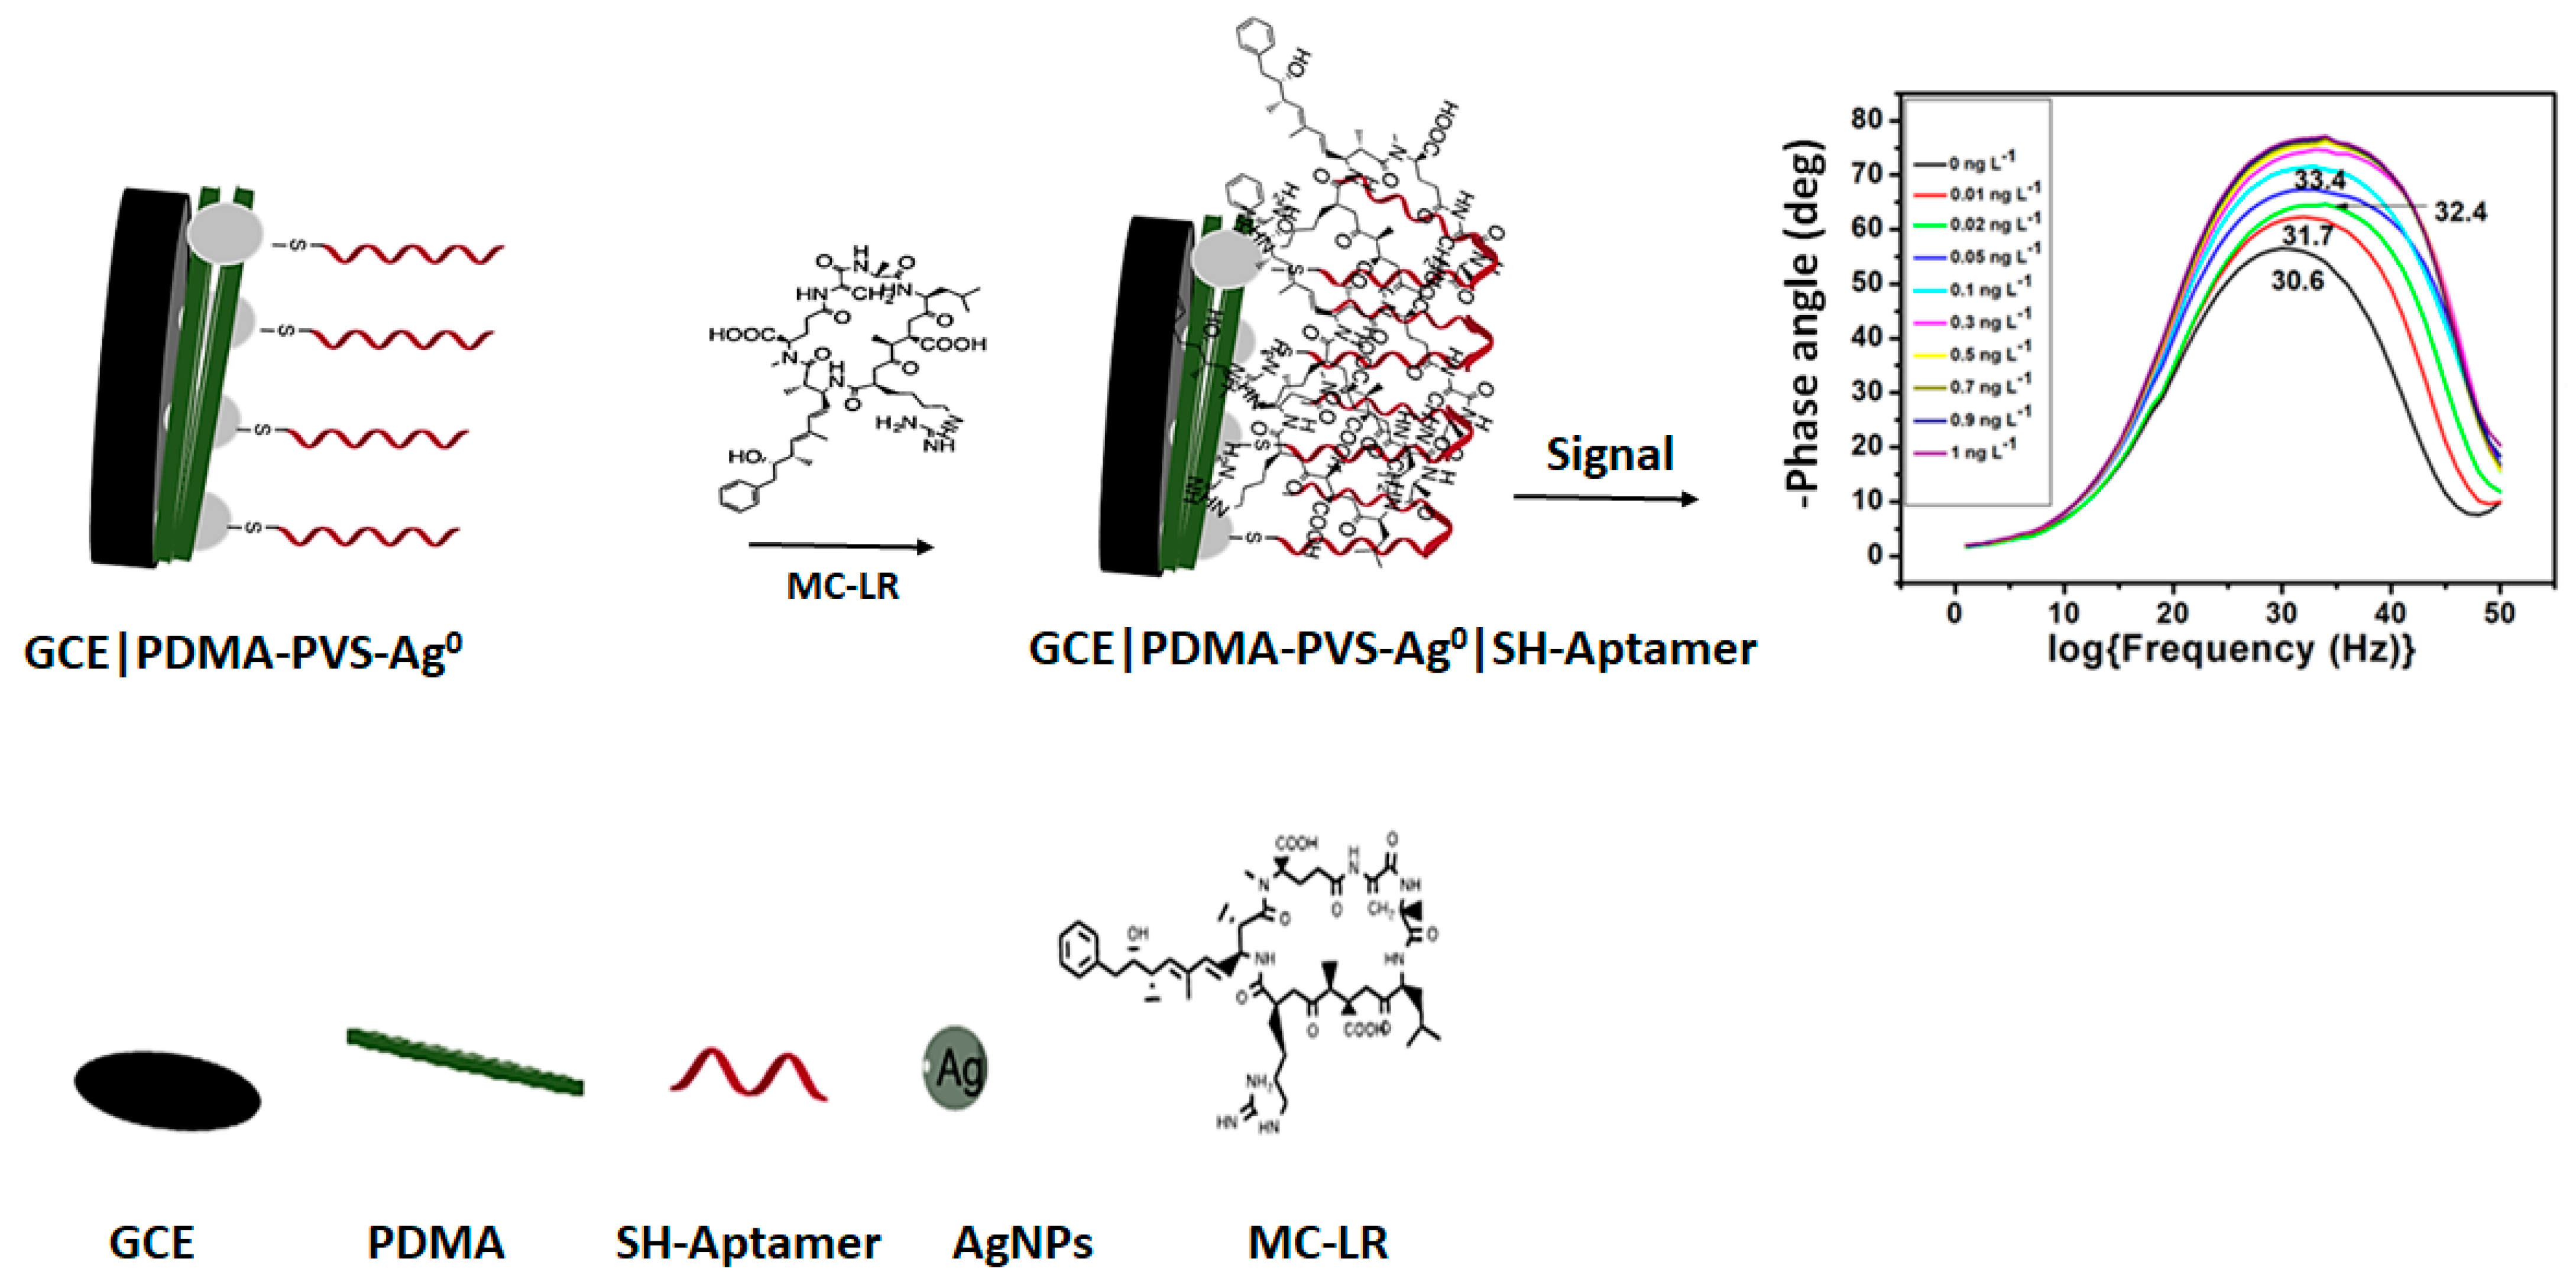
2.8. Aptasensor (GCE|PDMA–PVS–Ag0 |SH-Apt) Development and MC-LR Detection

1 μM 5′-thiol MC-LR-aptamer (SH-Apt) contained in the binding buffer solution (50 mM Tris, pH 7.5, 150 mM NaCl and 2 mM MgCl2) was drop-casted on GCE|PDMA–PVS–Ag0 nanocomposite electrode for about 24 h to cure. The aptamer-modified electrode (GCE|PDMA–PVS–Ag0|SH-Apt aptasensor) was rinsed with the binding buffer solution, followed by incubation in 1 mM 6-mercapto-1-hexanol (MCH) in 100 mM phosphate buffer, pH 7.0 for 30 min. The modified bioelectrode was then washed thoroughly with the binding buffer solution and used for electrochemical experiments, or stored in the binding buffer solution at 4 °C. For MC-LR detection experiments, the GCE|PDMA–PVS–Ag0 |SH-Apt aptasensor was incubated in 0.01–1.0 ng L−1 MC-LR solutions at room temperature for 1 min. Subsequently, the aptasensor was washed with the binding buffer solution to remove any unbound MC-LR. Electrochemical impedance spectra of the aptasensor were recorded, in the absence and presence of MC-LR, with a Zahner IM6ex electrochemical workstation at a frequency range of 100 kHz to 100 MHz, an amplitude of 10 mV and a potential of 200 mV in PBS solution. The Bode plots of the EIS spectra were fitted to an equivalent circuit using ZView® software. The calibration curve of the GCE|PDMA–PVS–Ag0 |SH-Apt aptasensor was constructed by plotting the peak phase angle responses of the aptasensor for 0.01–1.0 ng L−1 MC-LR.

3. Results and Discussion

3.1. In Situ Electro-Deposition of PDMA–PVS–Ag0 Nanocomposite

2,5-dimethoxyaniline was electro-polymerized on GCE by performing 15-cycle cyclic voltammetry (from −800 to +400 mV at a scan rate of 40 mV s−1) in a cell solution containing PVS and AgNO3. Poly(2,5-dimethoxyaniline)-poly(vinylsulfonic acid) copolymer was formed with concomitant nucleation of Ag and the intercalation of Ag0 nanoparticles within the copolymer to form PDMA–PVS–Ag0 nanocomposite. Successful copolymerization was indicated by the formation of a dark-green film on the GCE surface. As the polymerization process progressed, the peak current increased with the number of successive potential cycles, indicating that conductive copolymer layers were being deposited on the electrode surface. In Figure 1A, the voltammograms exhibit three redox peaks (a/a’, b/b’ and c/c’), whereas in Figure 1B the voltammograms exhibit redox peaks (a/a’, b/b’ and c/c’) and an additional cathodic peak (d), which are typical for the electrosynthesis of PDMA–PVS and Ag0, respectively [8,64]. The a/a’, b/b’ and c/c’ redox states of PDMA–PVS represent the leucomeraldine, emeraldine and pernigraniline forms of the copolymer. The two redox peaks at ~−100 mV/100 mV (a/a’) and ~−500 mV (c/c’) indicate the conversion of the leucoemeraldine base to emeraldine salt and emeraldine salt to pernigraniline salt, respectively [65]. These redox peaks provide evidence for the presence of discrete electroactive regions in both the doped PDMA–PVS and PDMA–PVS–Ag0 composites. The origin of another pair of redox peaks observed at −400 mV (b/b′) for both PDMA–PVS and PDMA–PVS–Ag0 is attributed to different intermediates and degradation products, including benzoquinone, emeraldine and emeraldine radical cation [66]. In Figure 1B, the cathodic peak d at −90 mV is for the reduction of Ag+ to Ag0 used in the formation of PDMA–PVS–Ag0 on the GCE surface. The reduction of Ag+ ions at −90 mV (d) during the reduction scan maintains charge neutrality in the polymer. During the reverse scan (i.e., anodic scan), the polymer was oxidized, followed by the insertion of Ag0 nanoparticles into PDMA–PVS composite, with several of the benzenoid units being converted to quinoid units in the process. It should be noted that electrosynthesis permits the precise control of the oxidation of PDMA and the uptake and reduction of AgNO3, in contrast to chemical synthesis where solution conditions alone determine the degree of Ag incorporation and the state of oxidation of the product [66].

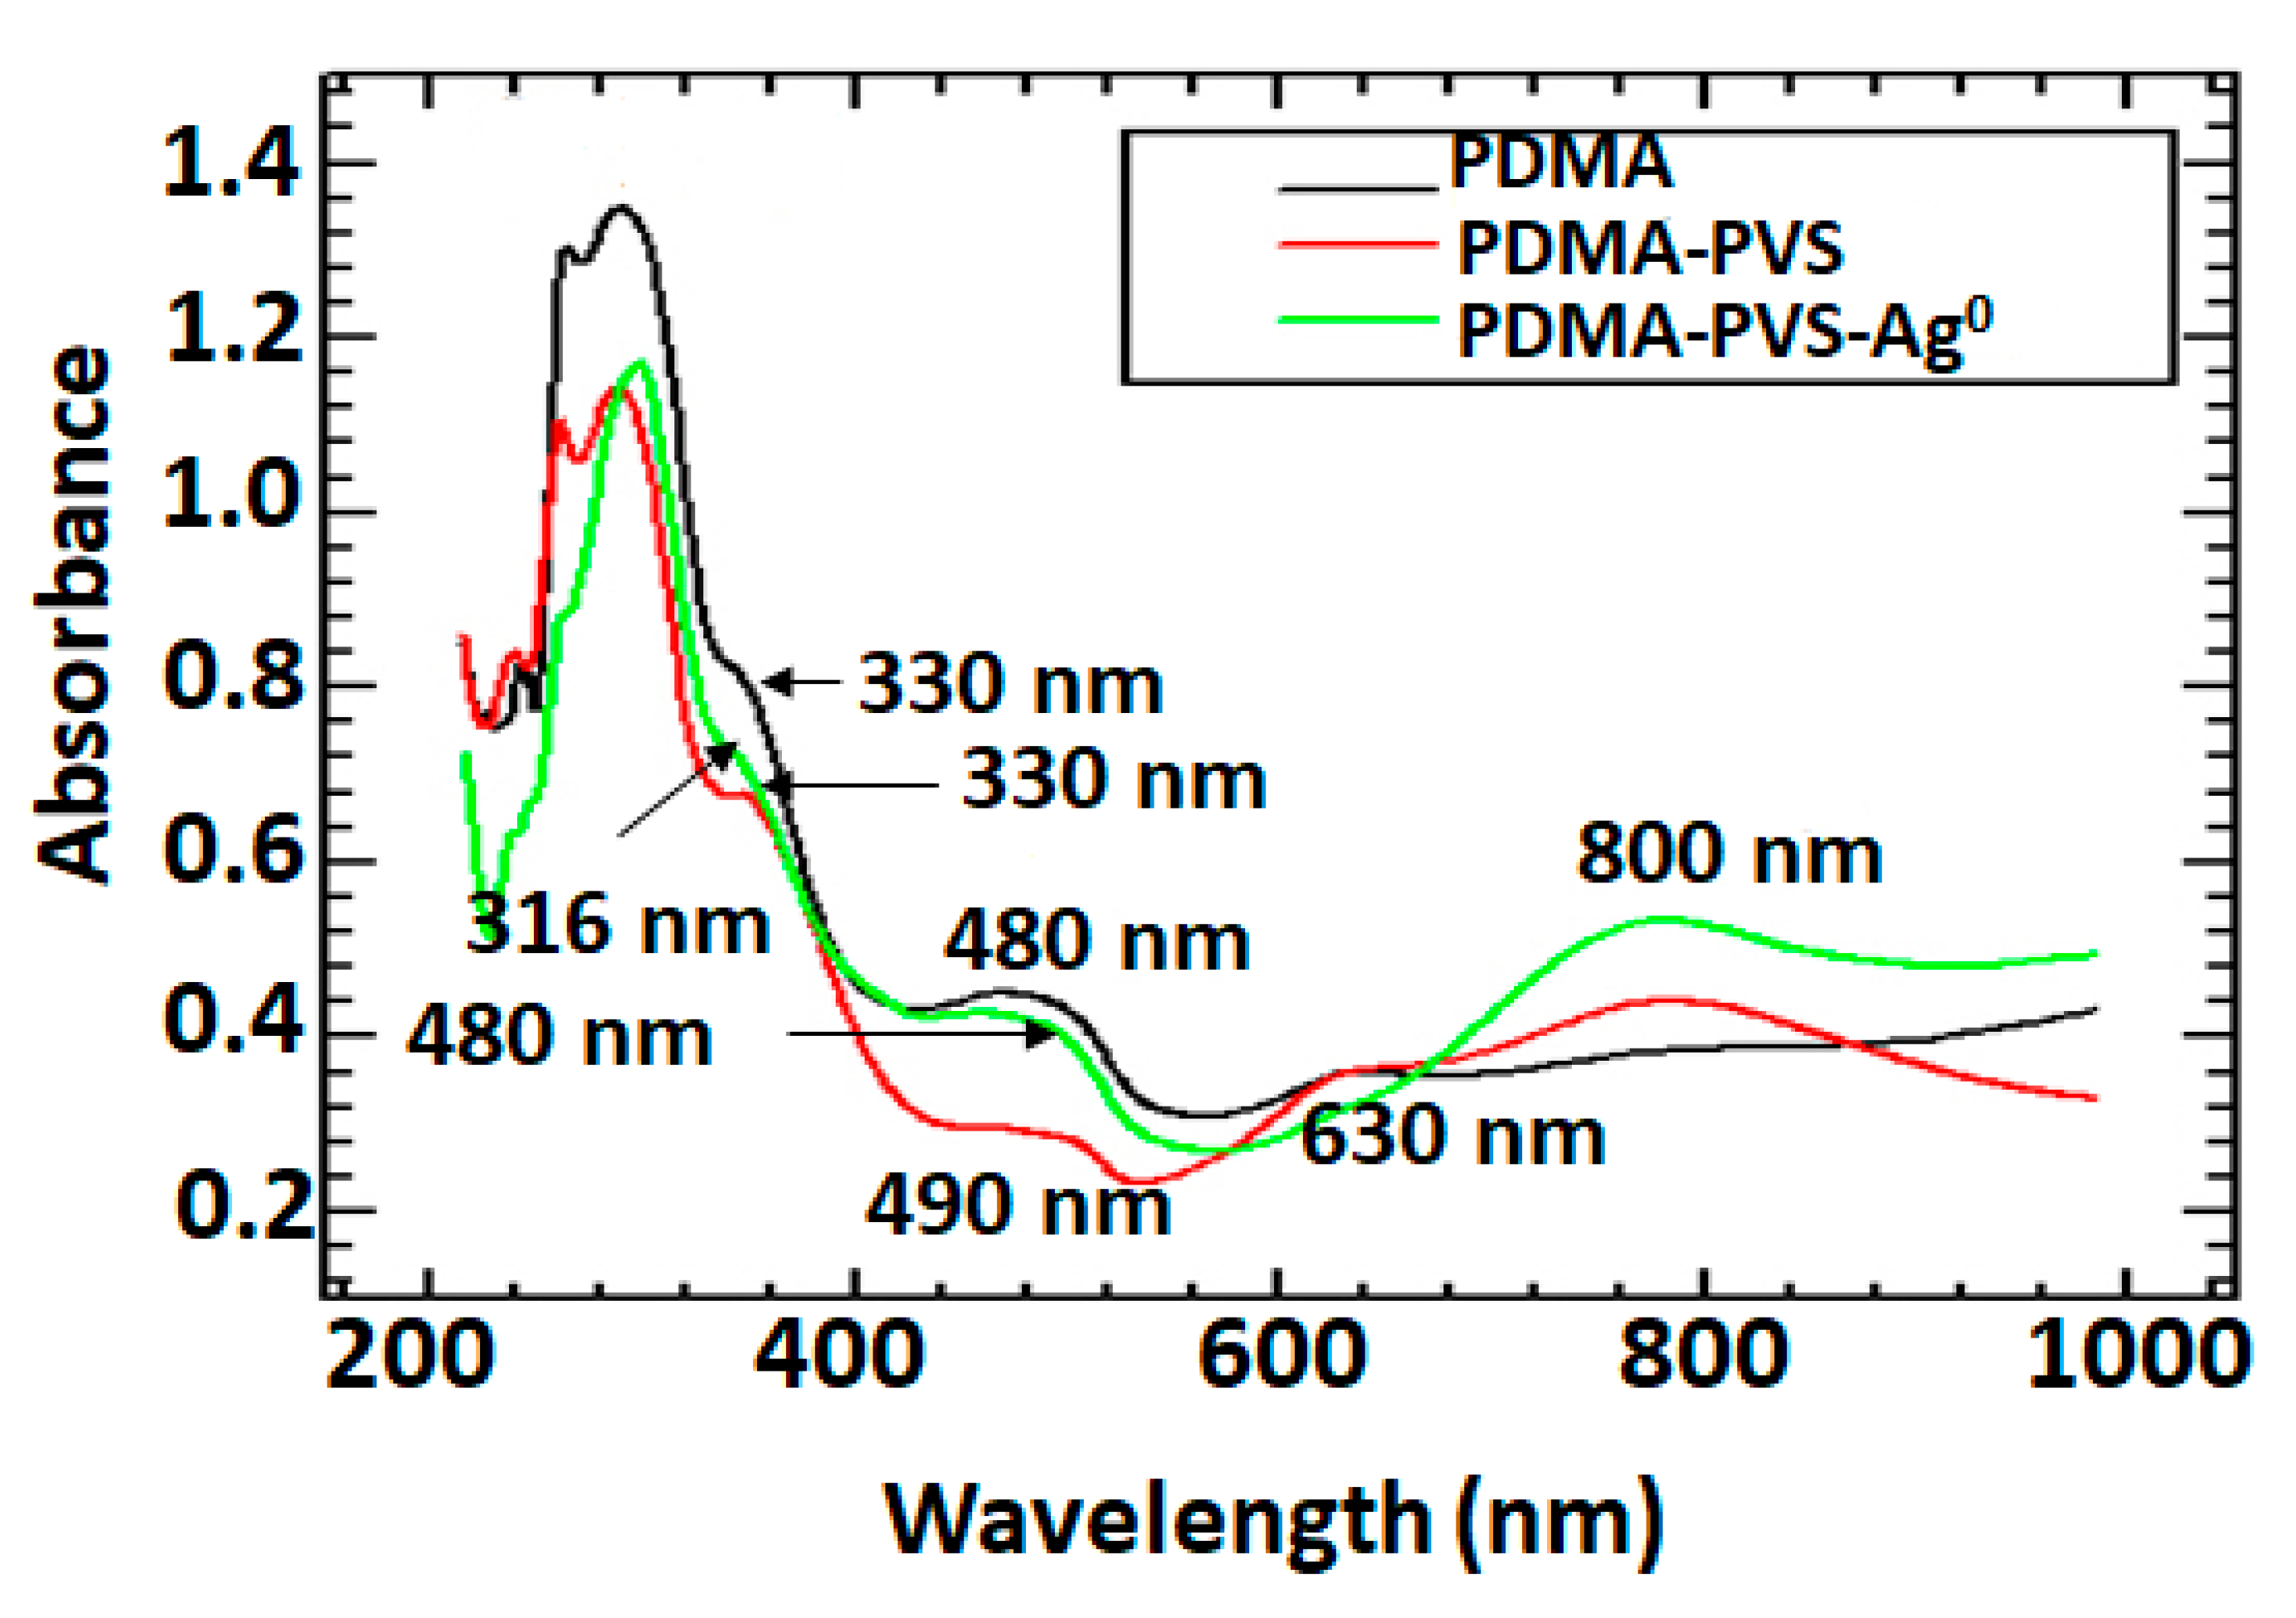
3.2. UV-vis Spectra of PDMA–PVS–Ag0 Nanocomposite

PDMA, PDMA–PVS and PDMA–PVS–Ag0 exhibit ultraviolet-visible (UV-vis) spectrophotometric features similar to those of polyaniline and its derivatives, indicating successful immobilization of the polymer on the electrode surface [66,67]. Figure 2 shows the UV-vis spectra of undoped PDMA, doped PDMA–PVS and PDMA–PVS–Ag0, where the absorption bands appear at different wavelengths and different intensities. The UV-vis spectra of the PDMA–PVS (red) and PDMA–PVS–Ag0 (green) composites display three absorbance bands characteristic of fully reduce emeraldine salt: the band at ca. 330 nm and two bands in the visible region at ca. 430 and 800 nm are assigned to the π–π* transition of benzoic and quinoid rings, n–π* transition which is due to polarons and n−π transition from excitons and the doping level [17]. The undoped PDMA film exhibited two characteristic bands at 330 and 430 nm, which are associated with the π-π transition of the C=C bonds within the benzenoid structure and exciton formation in the quinoid rings of emeraldine base. There was a marginal shift in the positions of the bands corresponding to the π–π* and polaronic transitions in the spectra collected during the electropolymerization of DMA by the addition of PVS and Ag+ ions. The shift is associated with the incorporation of the dopants to PDMA which decreases the energy level of the π-orbital, change the benzenoid to quinoid ratio and eventually shortened its conjugation length. The maximum wavelength (λmax) for the π–π* transition was blue-shifted from 330 to 316 nm. There was a prominent band (green line) at 430 nm (shifted from 480 nm), representing the polaronic band of PDMA when silver nanoparticles were formed in concert with PDMA upon partial oxidation. These shifts in the positions of the π–π* and polaronic transitions were attributed to the oxidative mechanism in the benzenoid structure of PDMA, while the changes in the intermolecular interactions between PDMA and PVS in the presence of Ag0 attributed to the n–π* polaronic transitions. We assume that some of the phenylamine units of PDMA are converted into quinone imine units with consequent reduction of Ag+ ions to Ag0. In general, phenylamine units donate their π-electrons from the occupied 2p orbitals to empty s orbitals of Ag+ ions to form σ-bonds. Then, the influence of back-donation of electron density from occupied d orbitals of Ag+ ions into the empty π*–2p antibonding orbitals of phenylamine molecules leads to the formation of π-bonds when the phenylamine units are converted into quinone, and Ag+ ions are subsequently reduced to Ag0 particles that are incorporated into the growing polymer matrix. Hence, the broad band at 430 nm overshadowed the Ag0 band that usually appears at ca. 420 nm on spectra relating to PDMA–PVS–Ag0. The appearance of the quinoid π–π transition band at ca. 630 nm in the spectra for doped PDMA–PVS and PDMA–PVS–Ag0 is indicative of complete doping of PDMA during electropolymerization by the sulfonic acid groups of PVS [17]. Because sulfonic acid groups are present in the polymeric backbone of PVS, we envisage the formation of interconnected network units of PDMA and PVS through intermolecular interactions between the sulfonate groups and the protonated amine nitrogen atoms in PDMA. The presence of electron-donating (two methoxy) groups on the phenyl rings within the DMA monomer further facilitates the binding of amine nitrogen atoms and sulfonic acid groups in PVS. The band at ~490 (red line) is normally associated with self-doping in sulfonated PANIs, while the broad band from 630 to 800 nm corresponds to the delocalization of protons in the emeraldine salt state of PDMA [68].

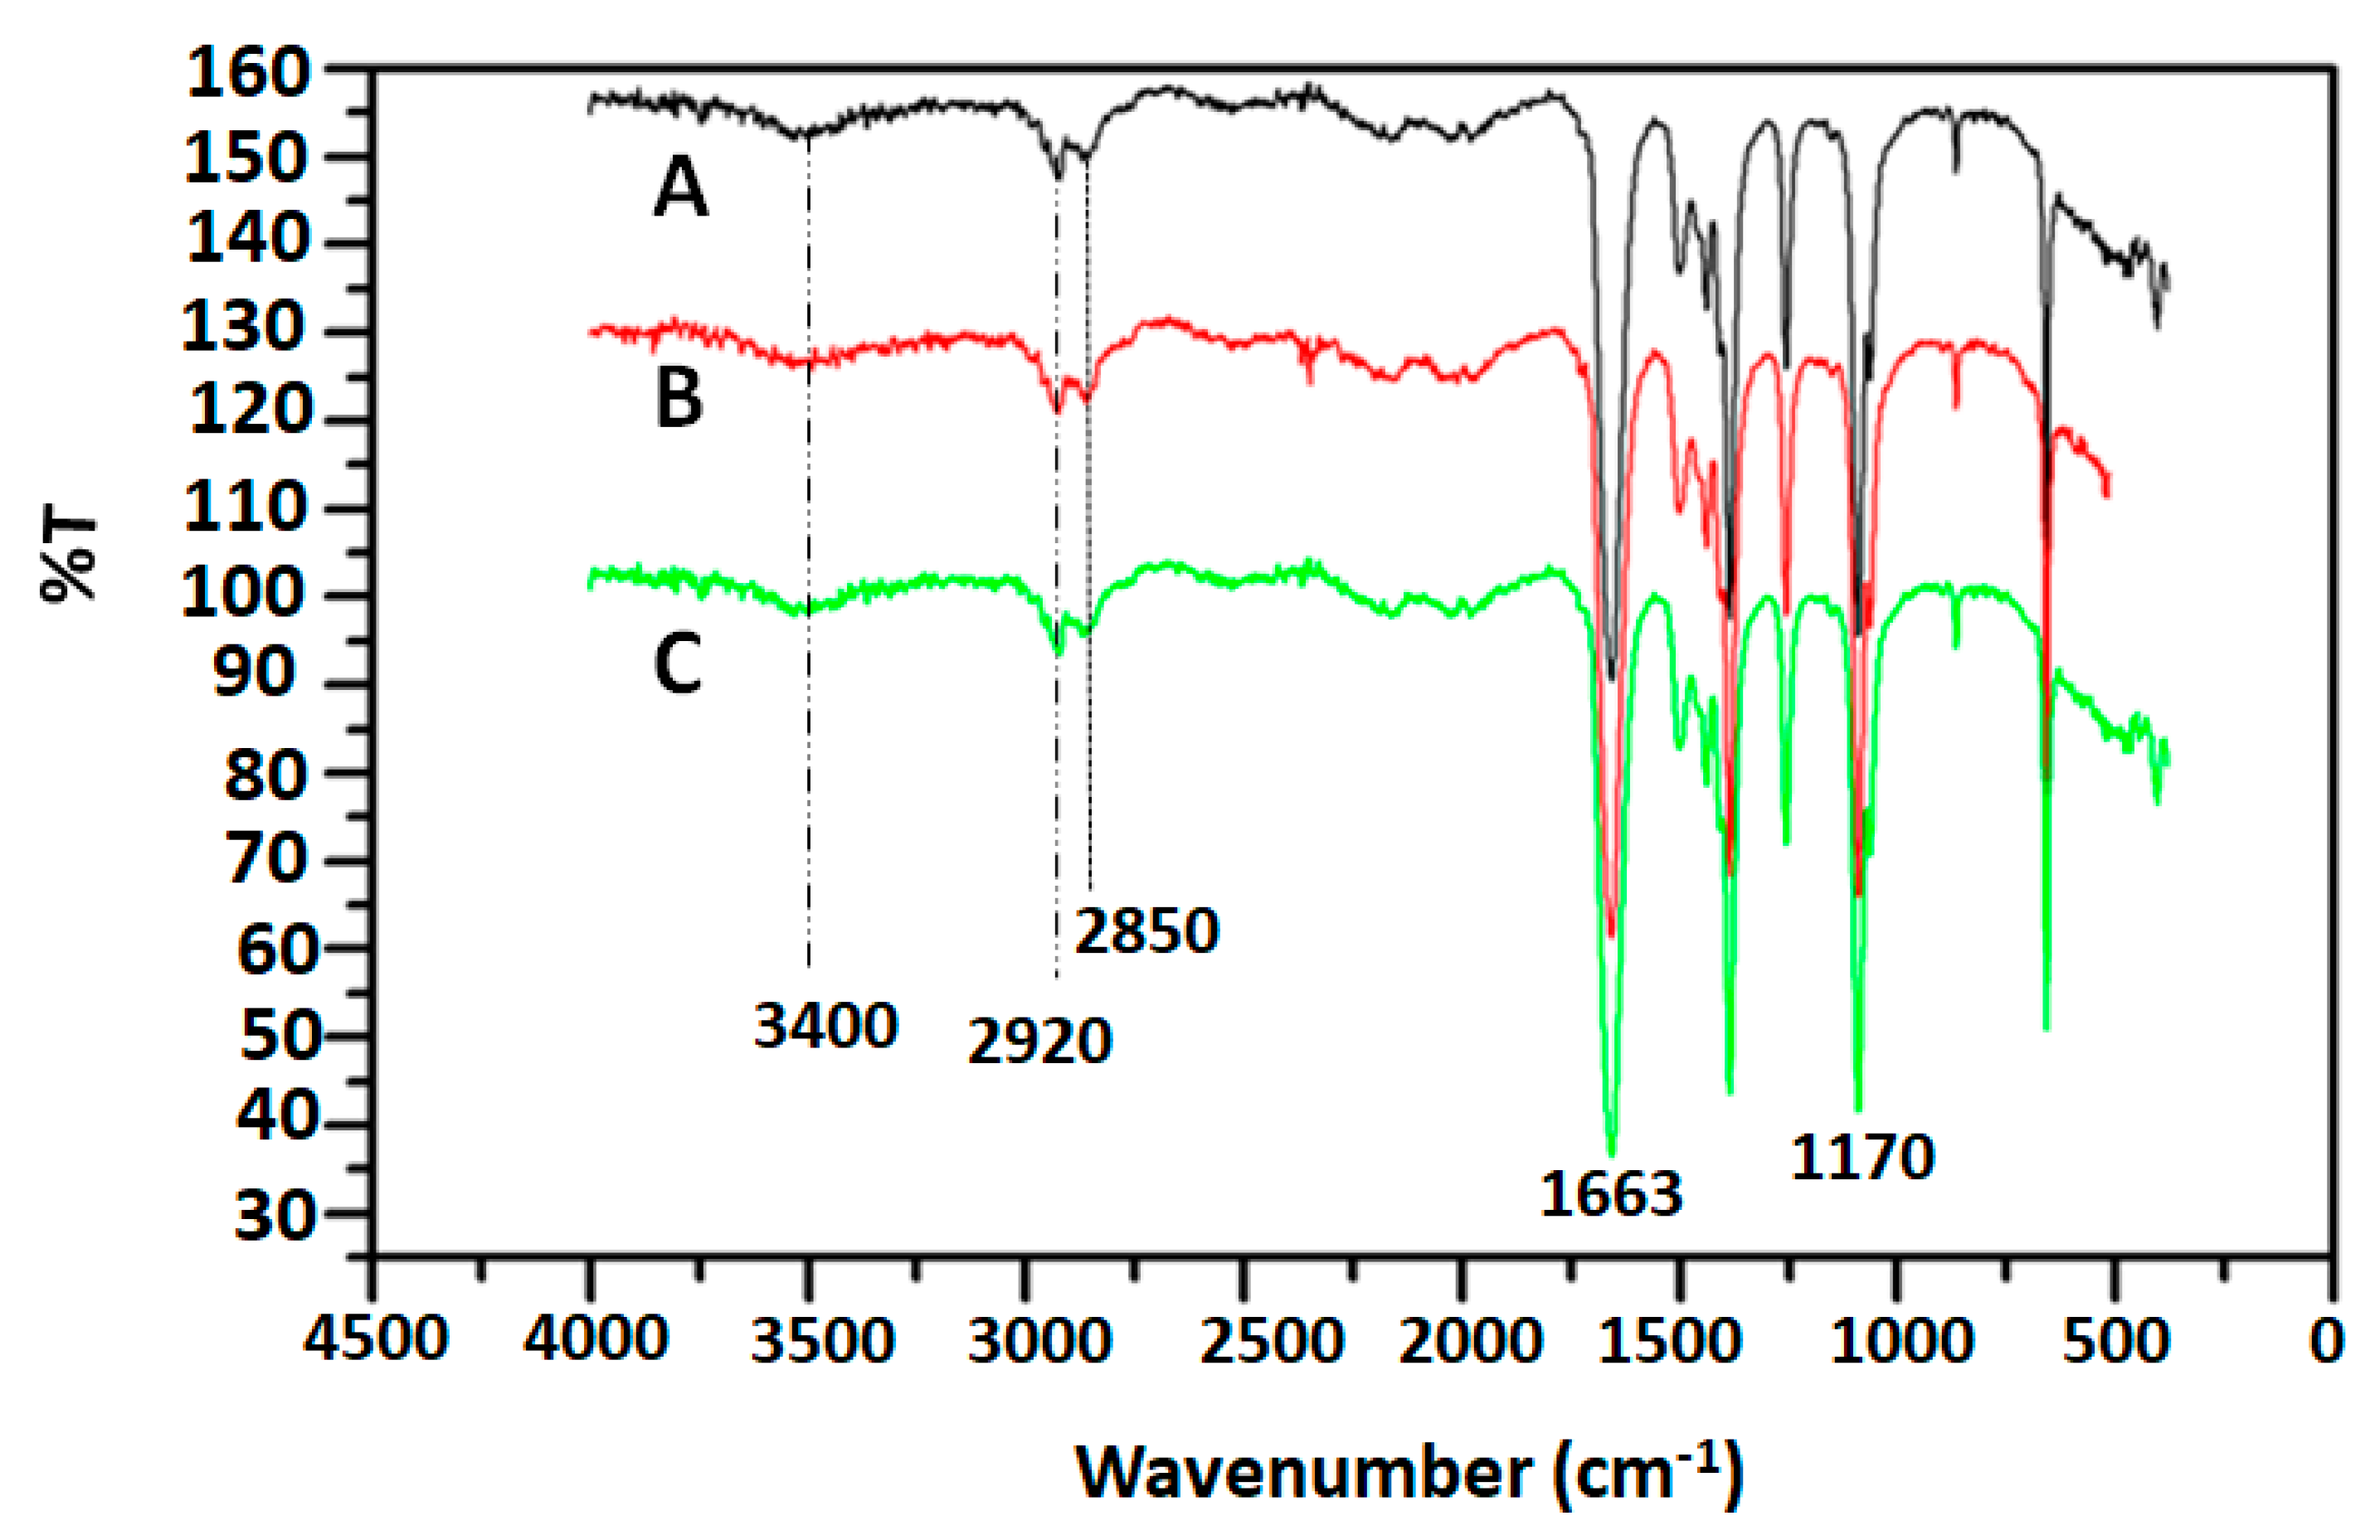
3.3. FTIR Spectroscopy of PDMA–PVS–Ag0 Nanocomposite

The FTIR spectra of the polymeric materials synthesized are presented in Figure 3 for PDMA (A), PDMA–PVS (B) and PDMA–PVS–Ag0 (C). Each spectrum shows a typical quinoid peak at 1588 cm−1 and a benzenoid peak at 1492 cm−1. Bands around 2920 and 2850 cm−1 were attributed to C–H stretching vibrations, and the band at 1139 cm−1 was assigned to in-plane C–H bending vibrations in the quinoid rings of the doped PDMA. The broad band in the region around 3400 cm−1 corresponds to N–H bond stretching. The absorption bands corroborate the emeraldine salt form of PDMA in the three samples. The C-NH-C bond stretching that is common to all the PDMA is evidenced by the presence of the prominent band at 1170 cm1 and the minor one 1050 cm1. The double bond character of C=N stretching vibration in PDMA is represented at 1663 cm1 for PDMA and its composites. The FTIR results indicate that the vibrational modes of PDMA are not altered in PDMA–PVS–Ag0 nanocomposites [69].

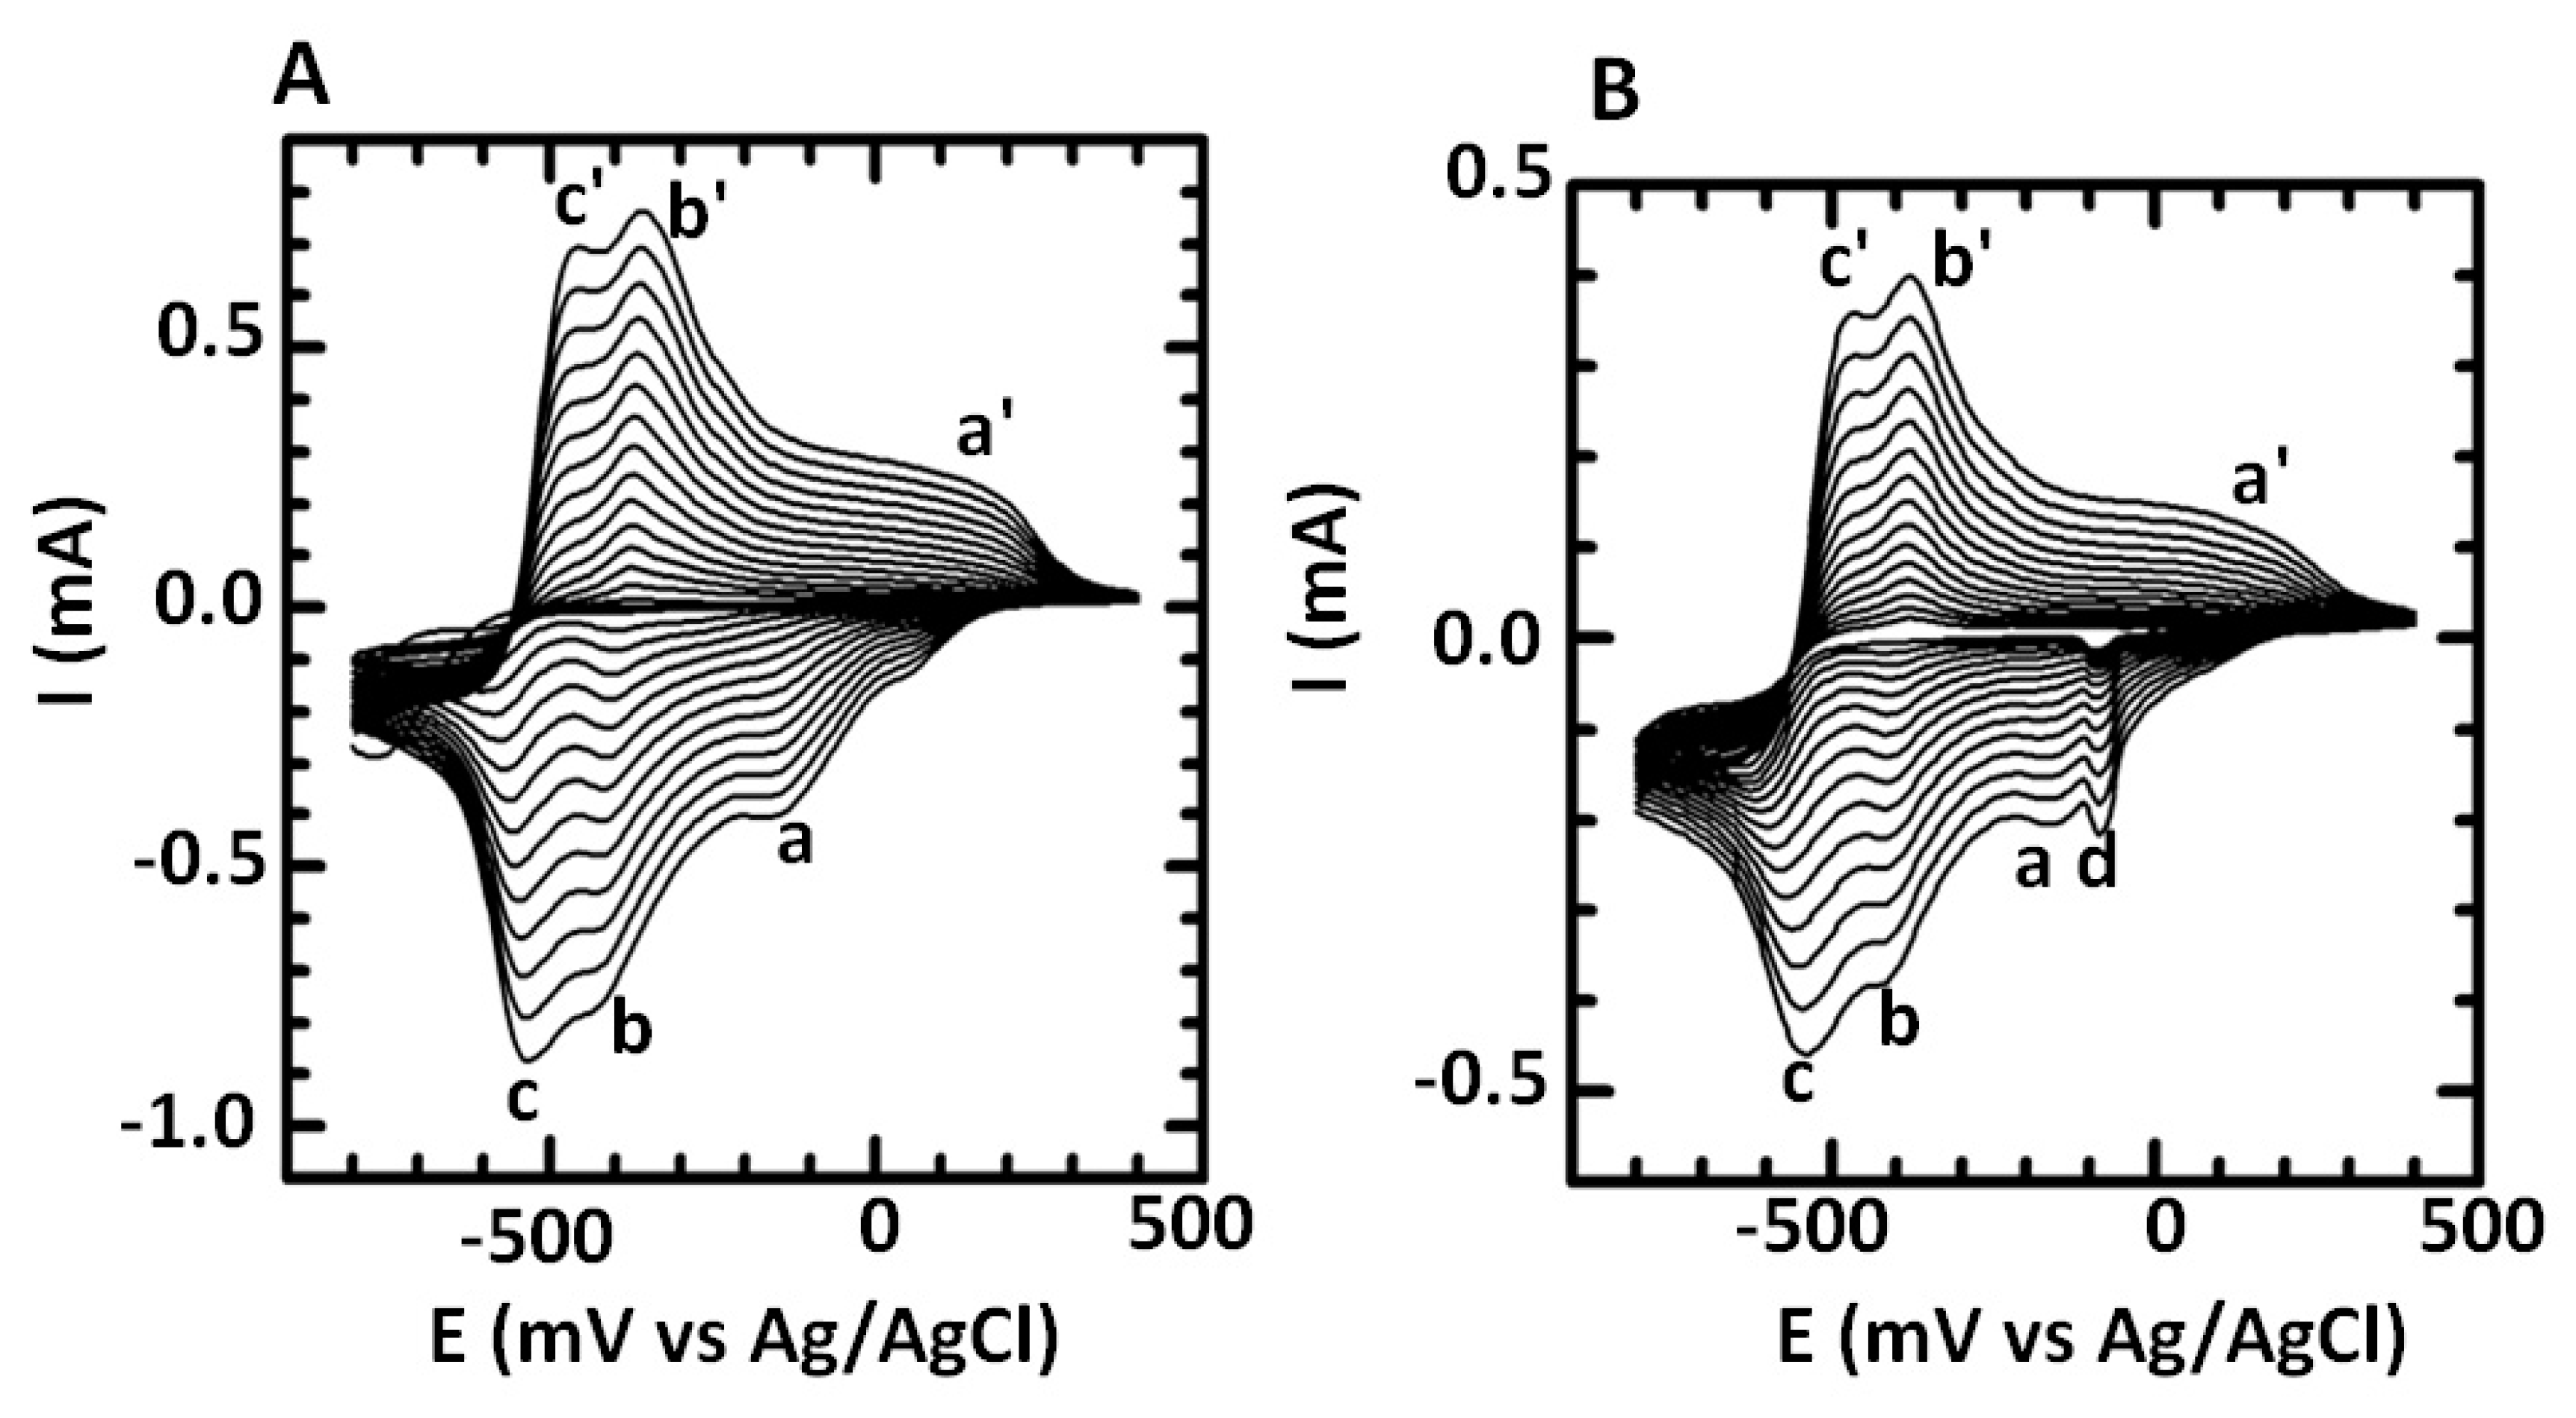
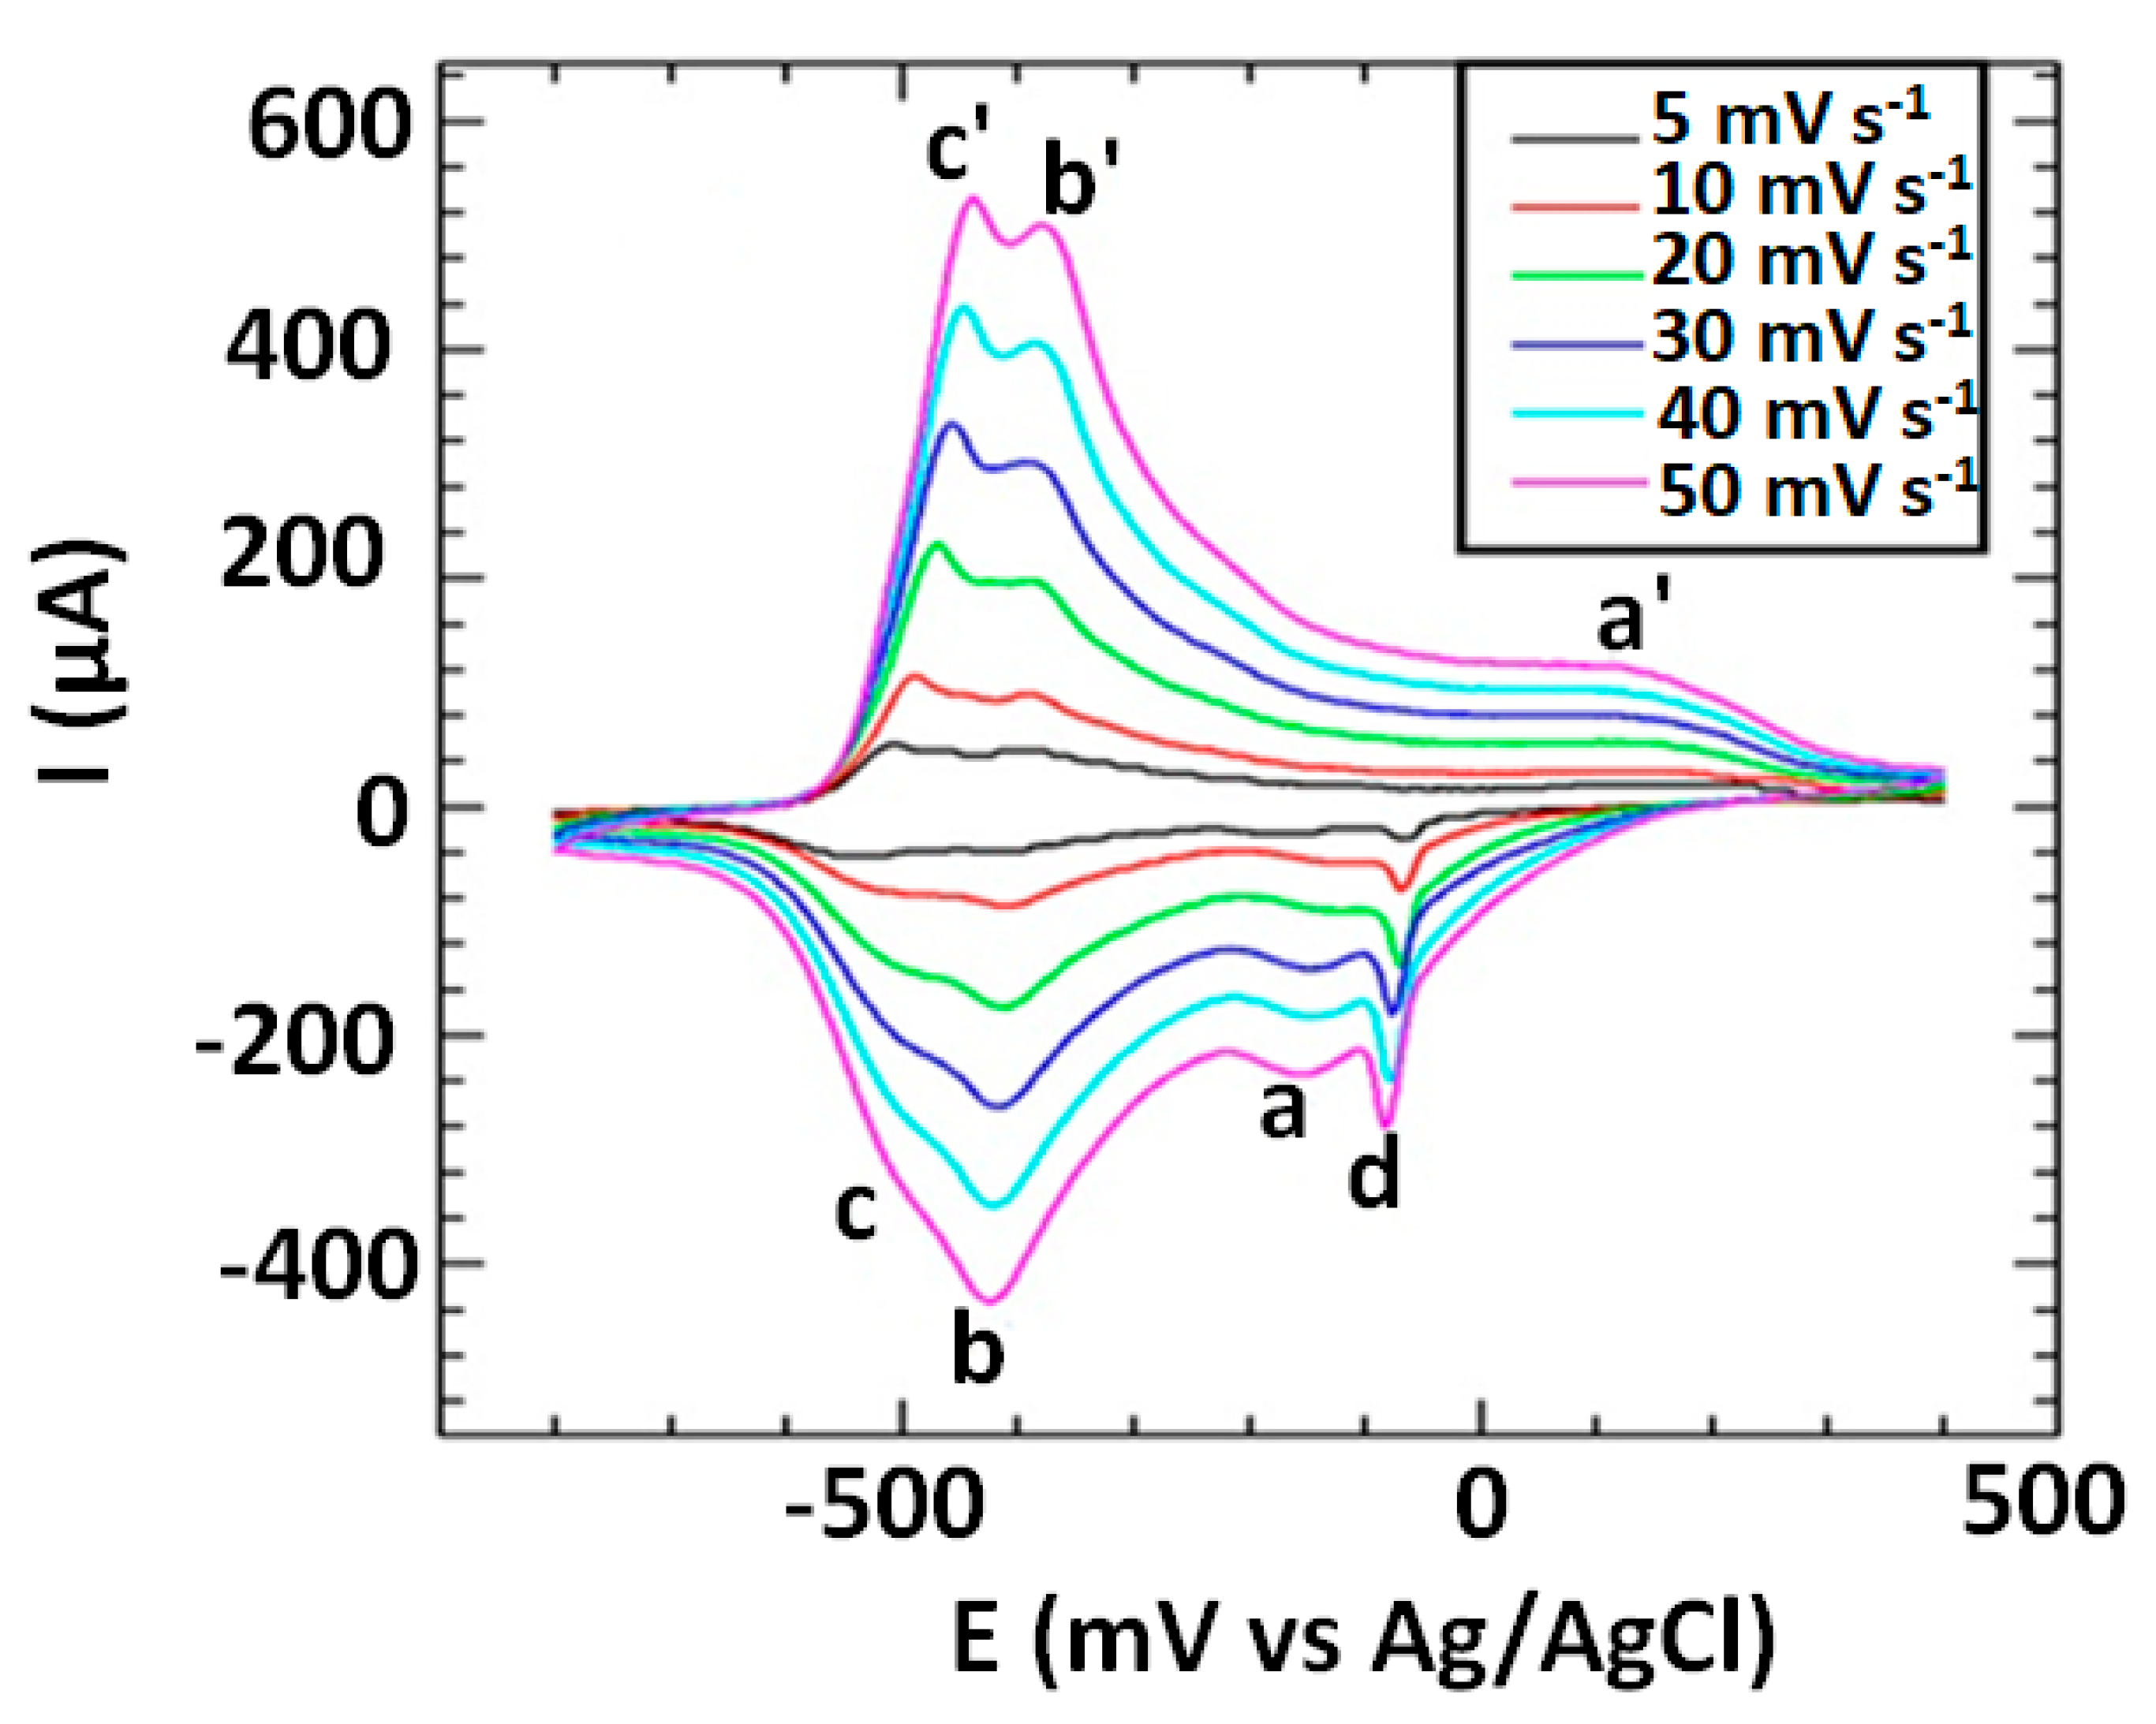
3.4. Electrochemical Characterization of PDMA–PVS–Ag0 Nanocomposite

The voltammograms of the PDMA–PVS–Ag0 nanocomposite plotted in Figure 4 displayed three redox peaks (a/a′ for the leucoemeraldine radical cation/leucoemeraldine pair; b/b′ for the emeraldine/emeraldine radical cation pair; and c/c′ for the pernigraniline/pernigraniline radical cation couple) and a cathodic peak d (at –90 mV) for Ag+ to Ag0. The peak currents of all the redox systems increased as the scan rate increased, and the peak potential of at least one peak (in this case, the cathodic peak b at −425 mV) remained constant at all scan rates. These properties confirm the presence of an electrodeposited film of electroactive material (in this case, PDMA–PVS–Ag0 nanocomposite) on the GCE surface. The peak potential value of anodic peak c′ changed from −520 mV at 5 mV s−1 to −440 mV at 50 mV s−1. This anodic shift in the peak potential of peak c′ with an increase in scan rate is reminiscent of electron delocalization (i.e., electron propagation or electron diffusion) along the polymer chain of the electroactive PDMA–PVS–Ag0 nanocomposite material [66]. The Randles–Sevčik analysis of the peak currents of the PDMA–PVS–Ag0 voltammograms was used to calculate the charge transfer coefficient, D, for charge propagation along the composite copolymer chain using Equation (1):
i p = 0.4463 nFAC nF ν D RT
where ip is the peak current, n is the number of electrons, F is the Faraday constant, A is the surface area of the working electrode, C is the bulk concentration of the electroactive species, ν is the potential scan rate, R is the gas constant, and T is the absolute temperature. The D value obtained for PDMA–PVS–Ag0 is 7.508 × 10⁻⁹ cm2 s−1, which is much higher than the values reported in the literature [20] for PDMA, and thus suggests higher conductivity of PDMA–PVS–Ag0 compared to pristine PDMA. The surface concentration (Γ*) of the electrodeposited PDMA–PVS–Ag0 film on GCE was calculated to be 4.14 × 10⁻⁴ mol cm−2 using the Brown–Anson relation [70,71]:
i p =   n 2 F 2 Γ * ν A 4 RT
where all the parameters are as defined in Equation (1).

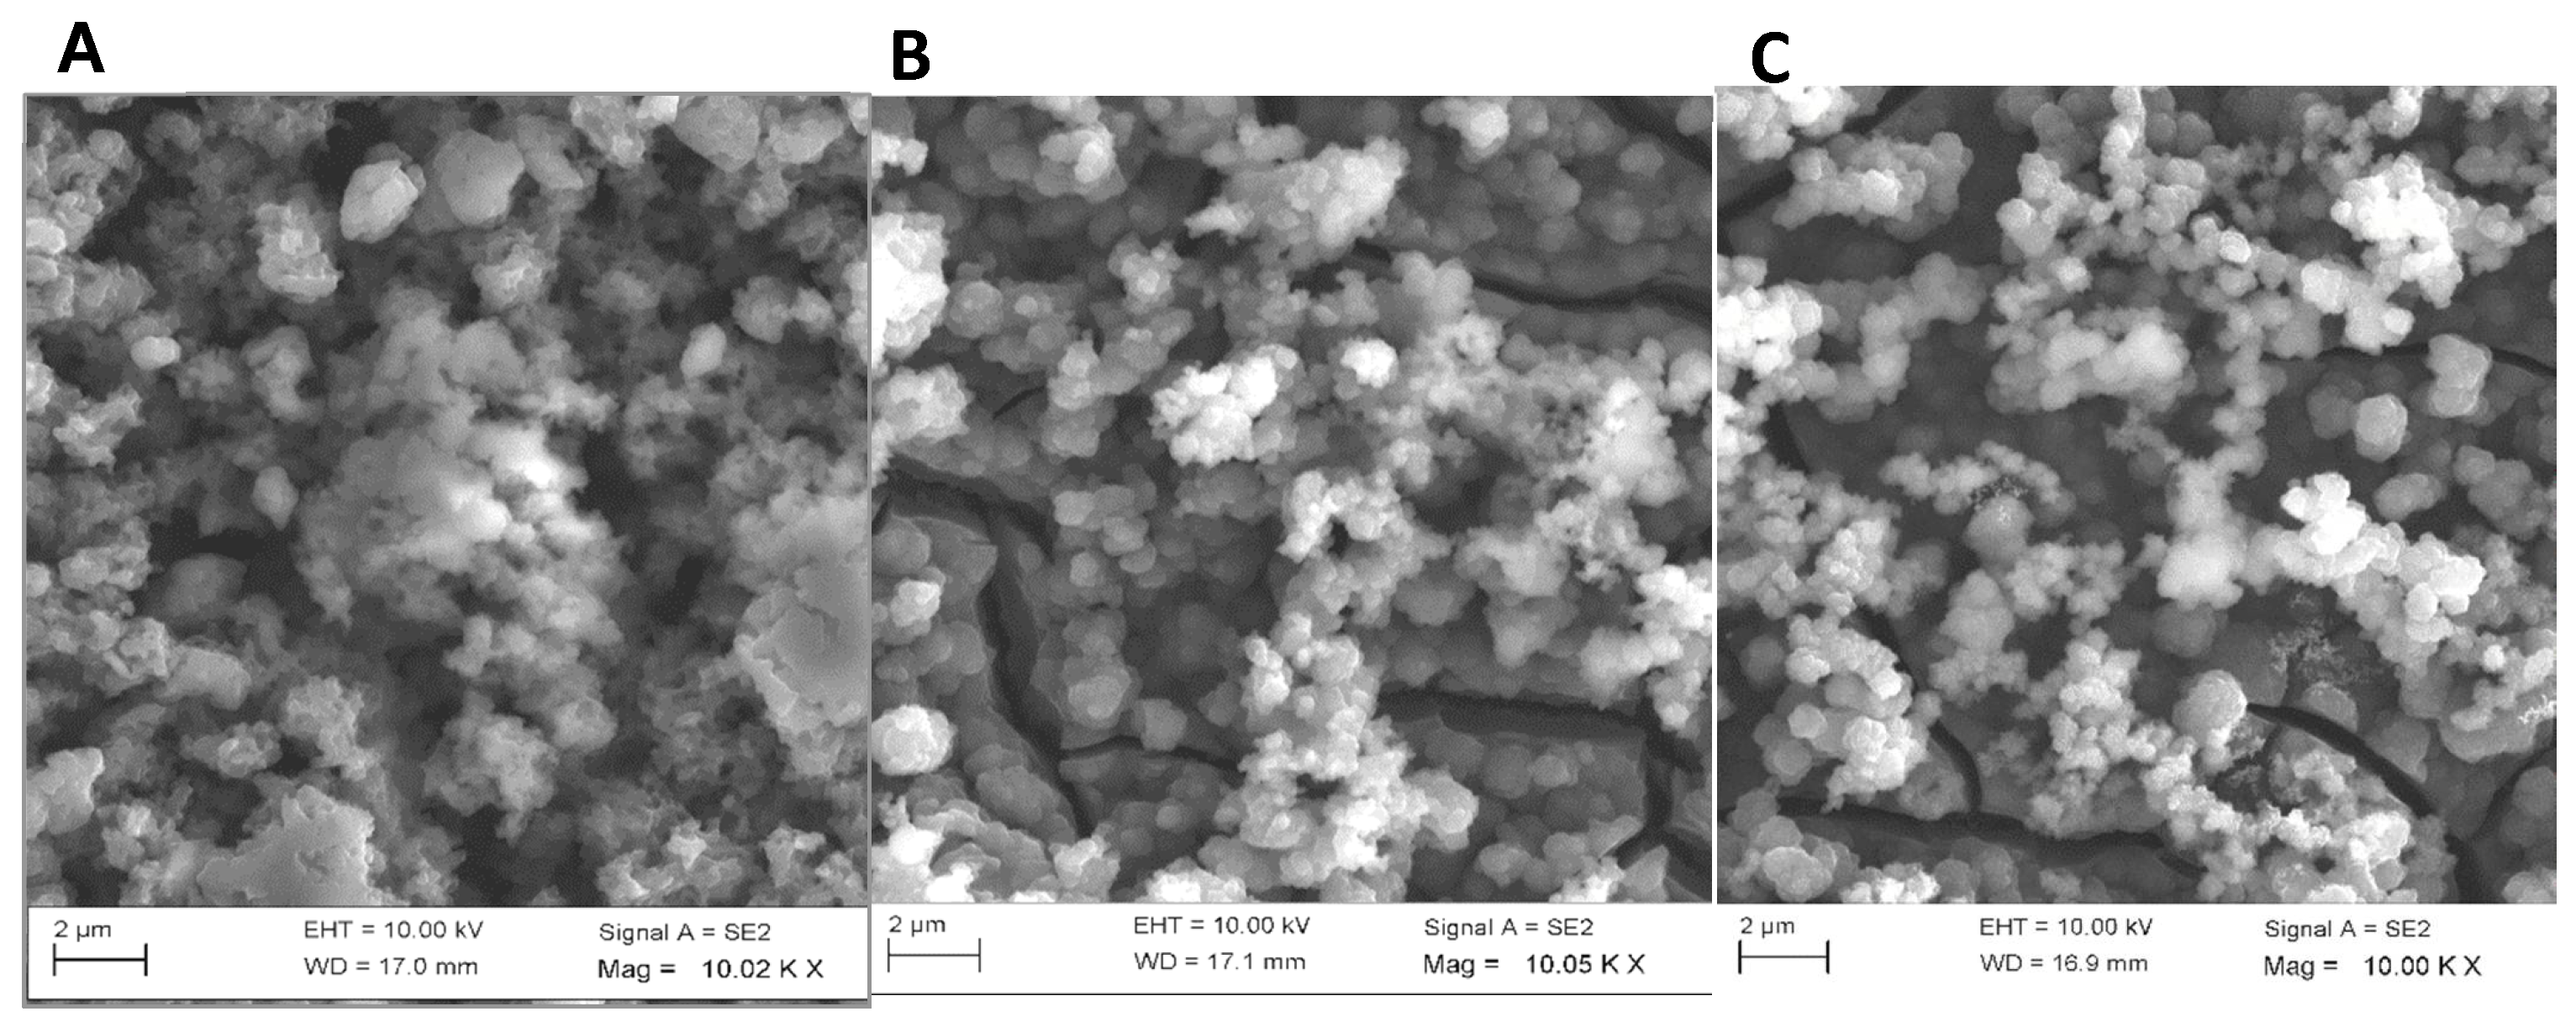
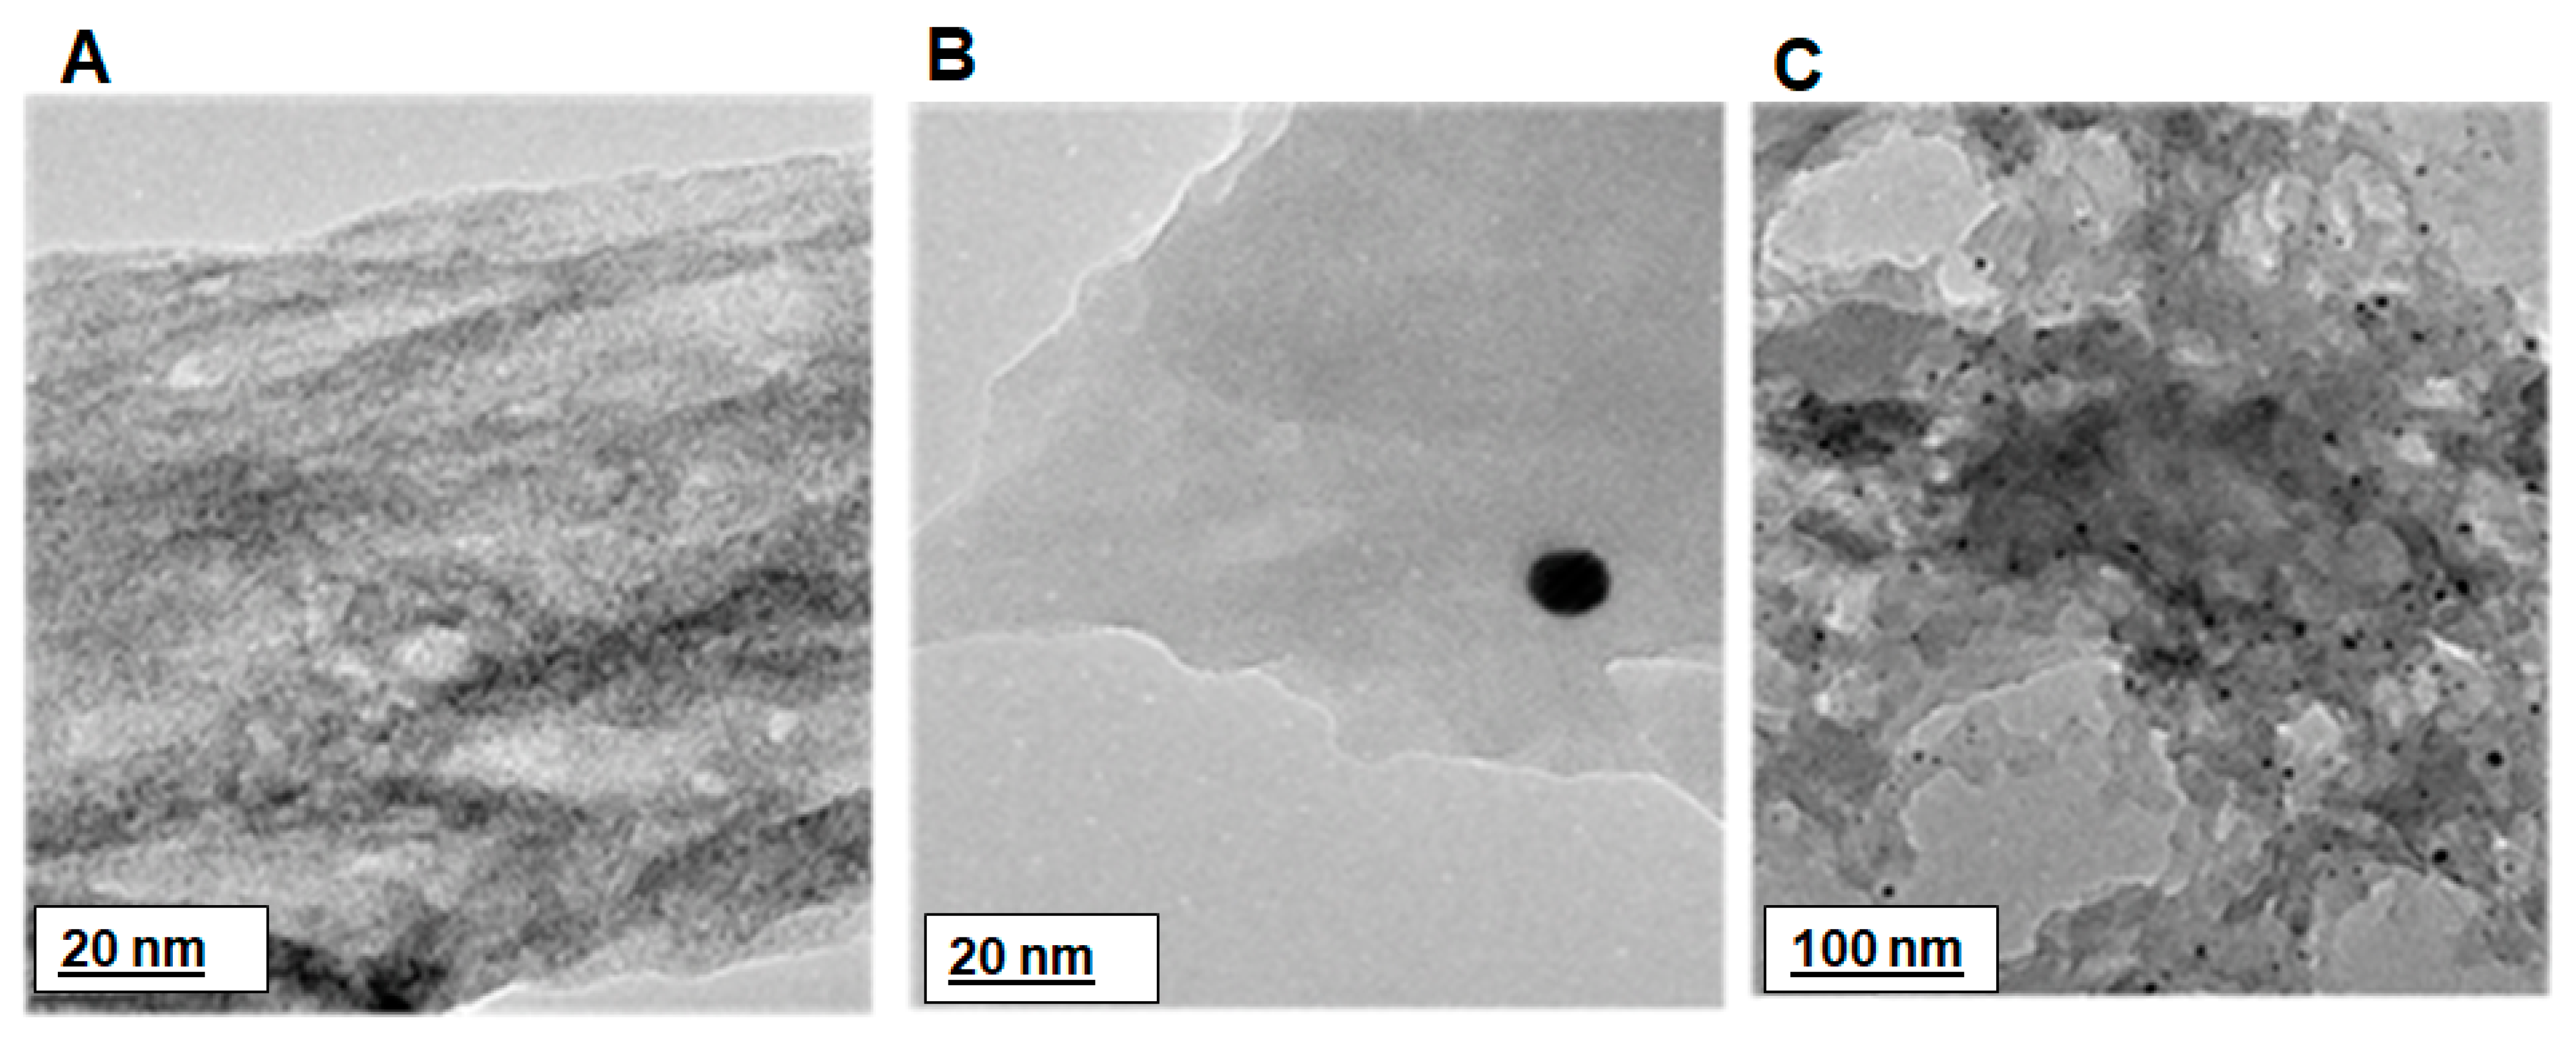
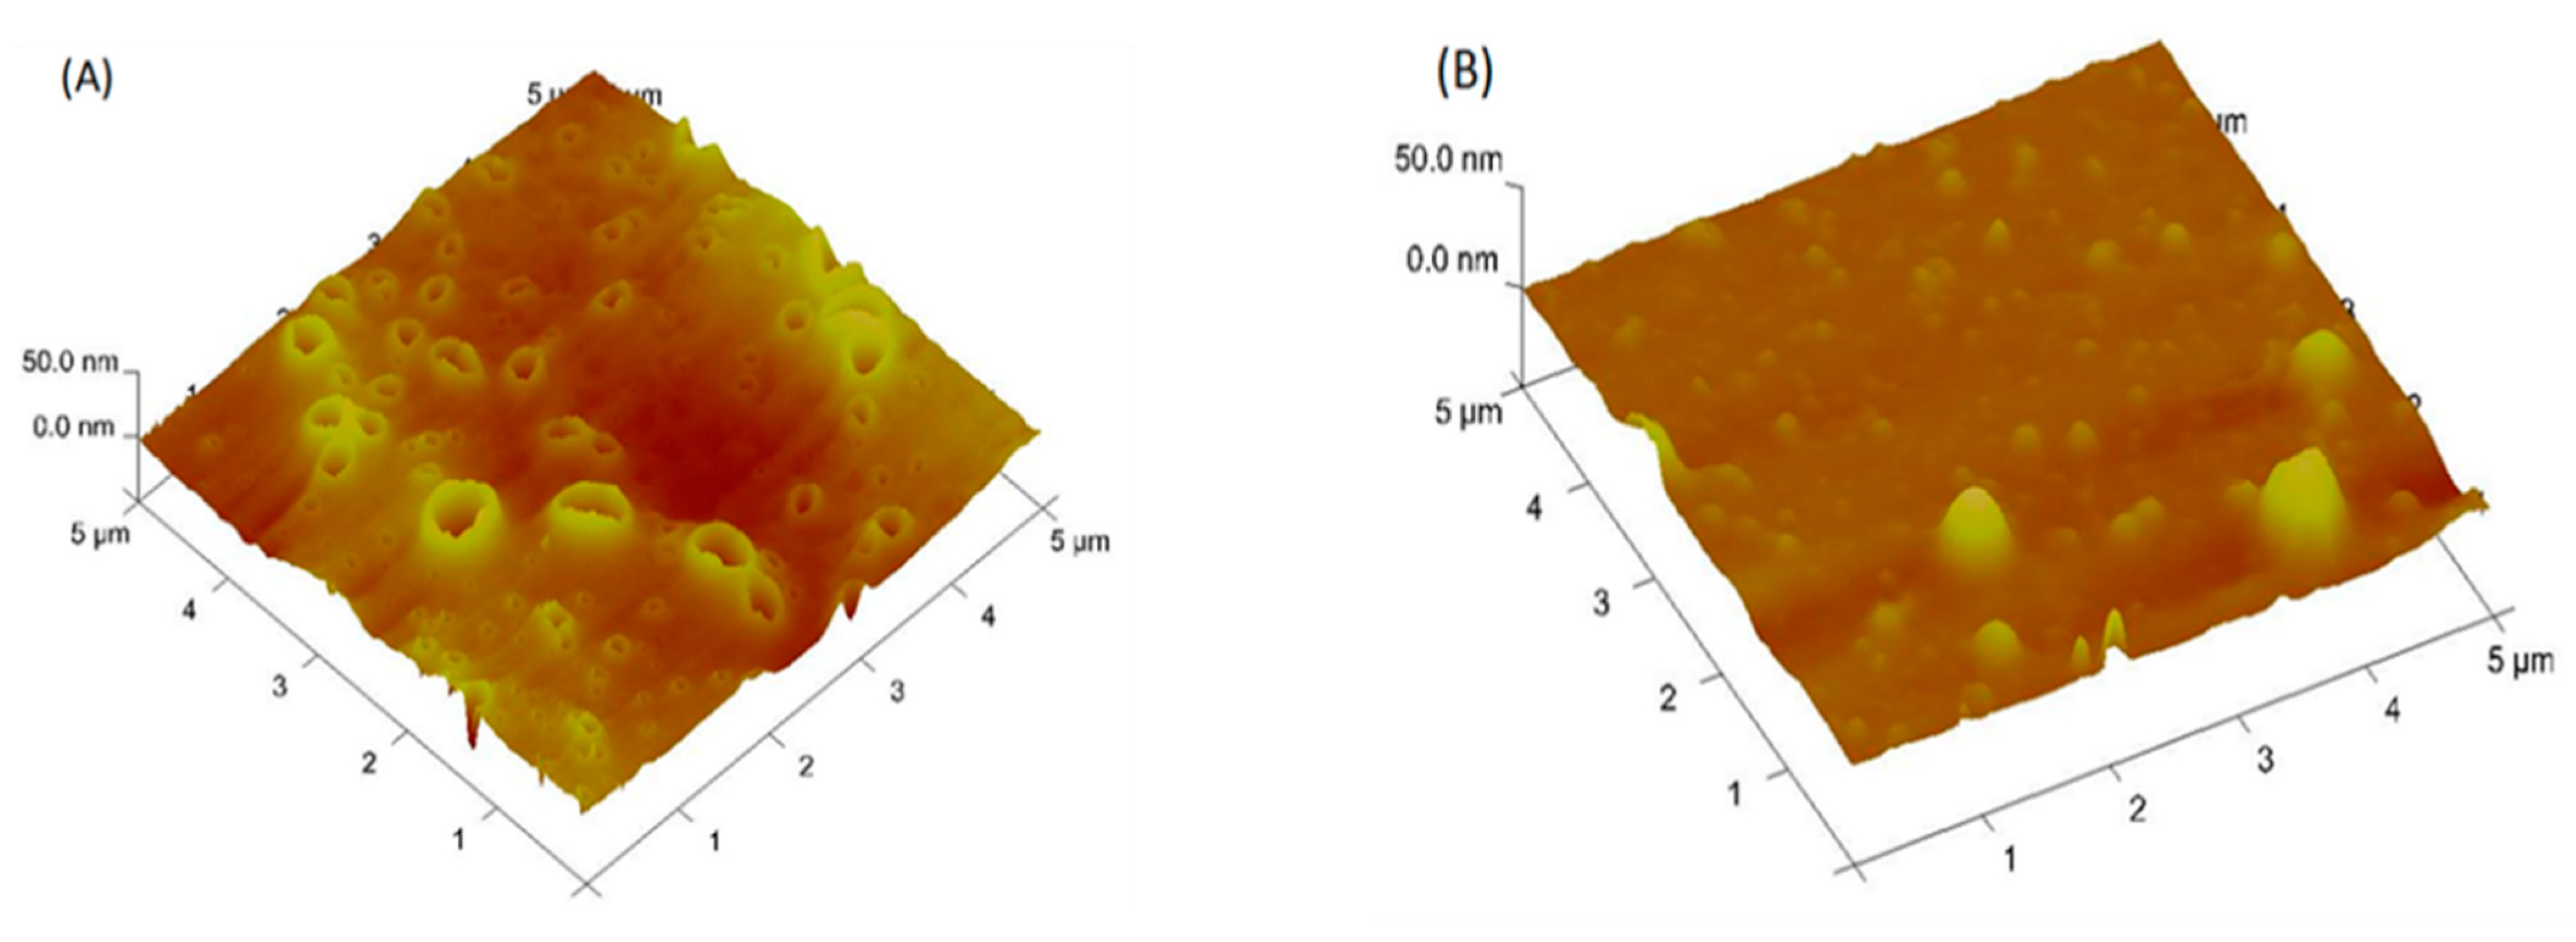
3.5. Morphology of PDMA–PVS–Ag0 Nanocomposite

The SEM images of PDMA, PDMA–PVS and PDMA–PVS–Ag0 nanocomposite presented in Figure 5, show a change from a cauliflower-shaped polymer network in PDMA and PDMA–PVS to a more granular spherical aggregate of PDMA–PVS–Ag0 particles.
The HRTEM images in Figure 6 display a change from a polymer network morphology for PDMA–PVS (in Figure 6A) to a polymer network with well-dispersed spherical nanostructures (i.e., the black spheres in the images) for PDMA–PVS–Ag0 nanocomposite (see Figure 6B,C). The HRTEM of PDMA–PVS–Ag0, thus, suggests the intercalation of Ag0 in the copolymer. The AFM image in Figure 7A indicates that the PDMA–PVS copolymer network formed craters that have a wide range of sizes, indicating polydispersity in PDMA–PVS. On the other hand, the AFM image of PDMA–PVS–Ag0 in Figure 7B, contain conical islands instead of craters due to Ag0-doping. The PDMA–PVS–Ag0 AFM exhibits less polydispersity than PDMA–PVS and has particles of predominantly smaller size.

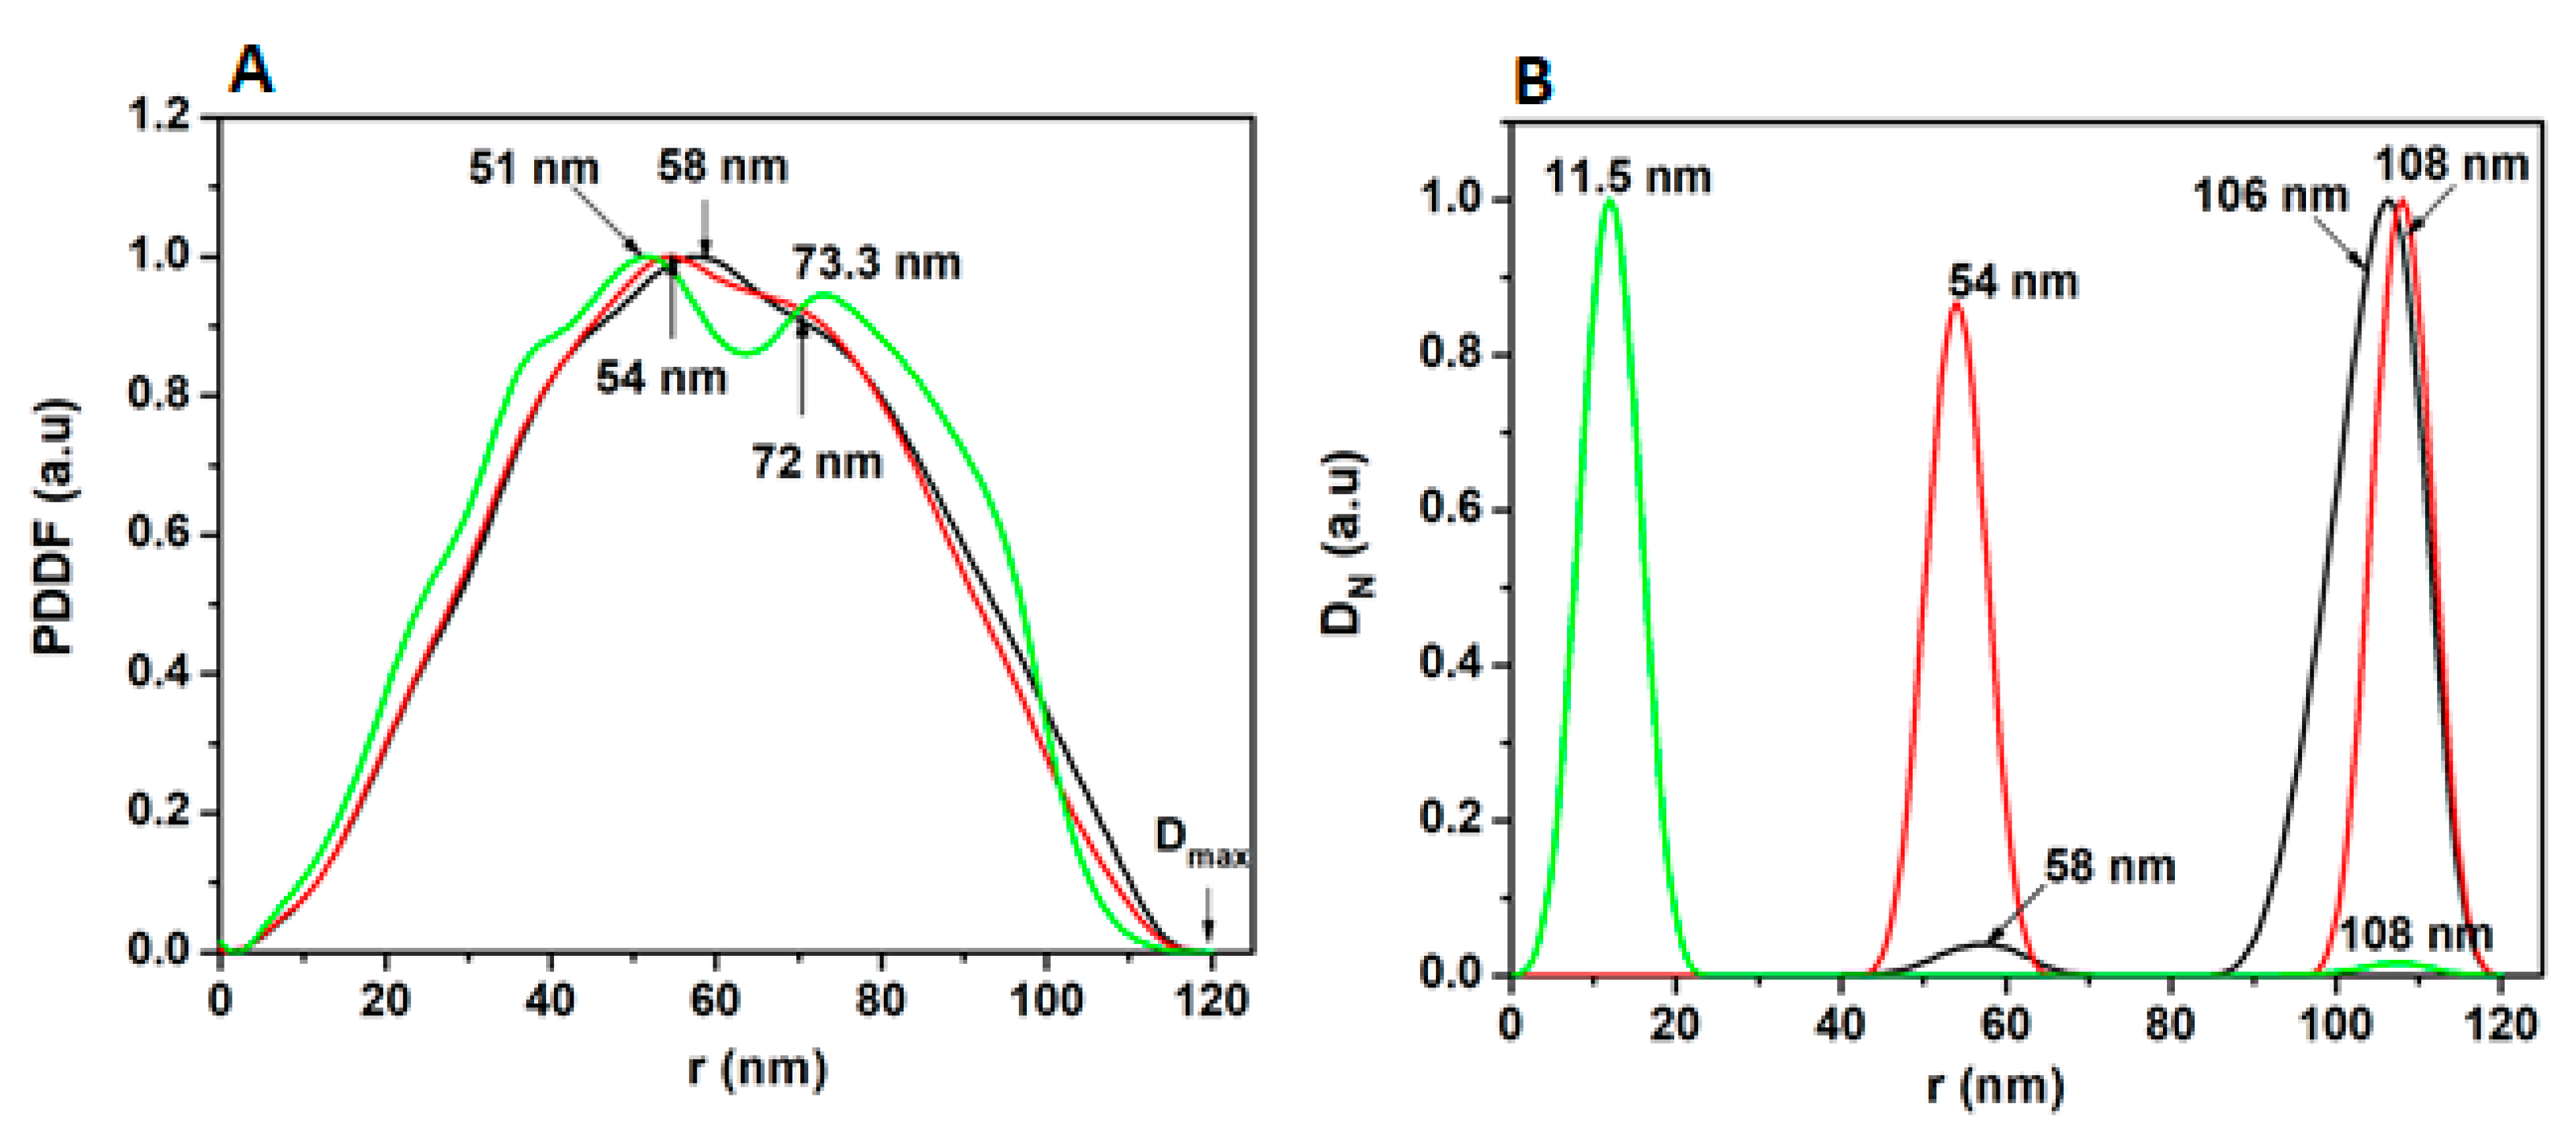
3.6. SAXS of PDMA–PVS–Ag0 Nanocomposite

Figure 8A shows the SAXS pair-distance distribution function (PDDF) plots for PDMA, PDMA–PVS and PDMA–PVS–Ag0 nanocomposite. The PDMA (black line) material exhibited a characteristic profile of spherically shaped particles, with a radius of 58 nm and a maximum diameter of 116 nm. In contrast to PDMA, the PDMA–PVS (red line) has maximum radii at 54 nm and 72 nm, which are attributed to the formation of copolymers involving PDMA and PVS. PDMA–PVS–Ag0 formed a dumbbell-shaped PDDF spectrum (green line) (attributable to peripheral Ag0-doping), with maximal radii at 51 nm and 73.3 nm. Figure 8B refers to the number-weighted distribution function (DN) SAXS plots. The three polymeric materials contain particles of radii 106–108 nm predominating in PDMA, indicating higher aggregation, compared to PDMA–PVS–Ag0 nanocomposite that has particles predominantly with a radius of 11.5. The SAXS DN plots also show the formation of intermediate size PDMA (radius 58 nm) and PDMA–PVS (radius 54 nm) particles. This agrees with the principle of nanostructurization of the polymeric materials with metal ions or long-chain sulfonic acids.

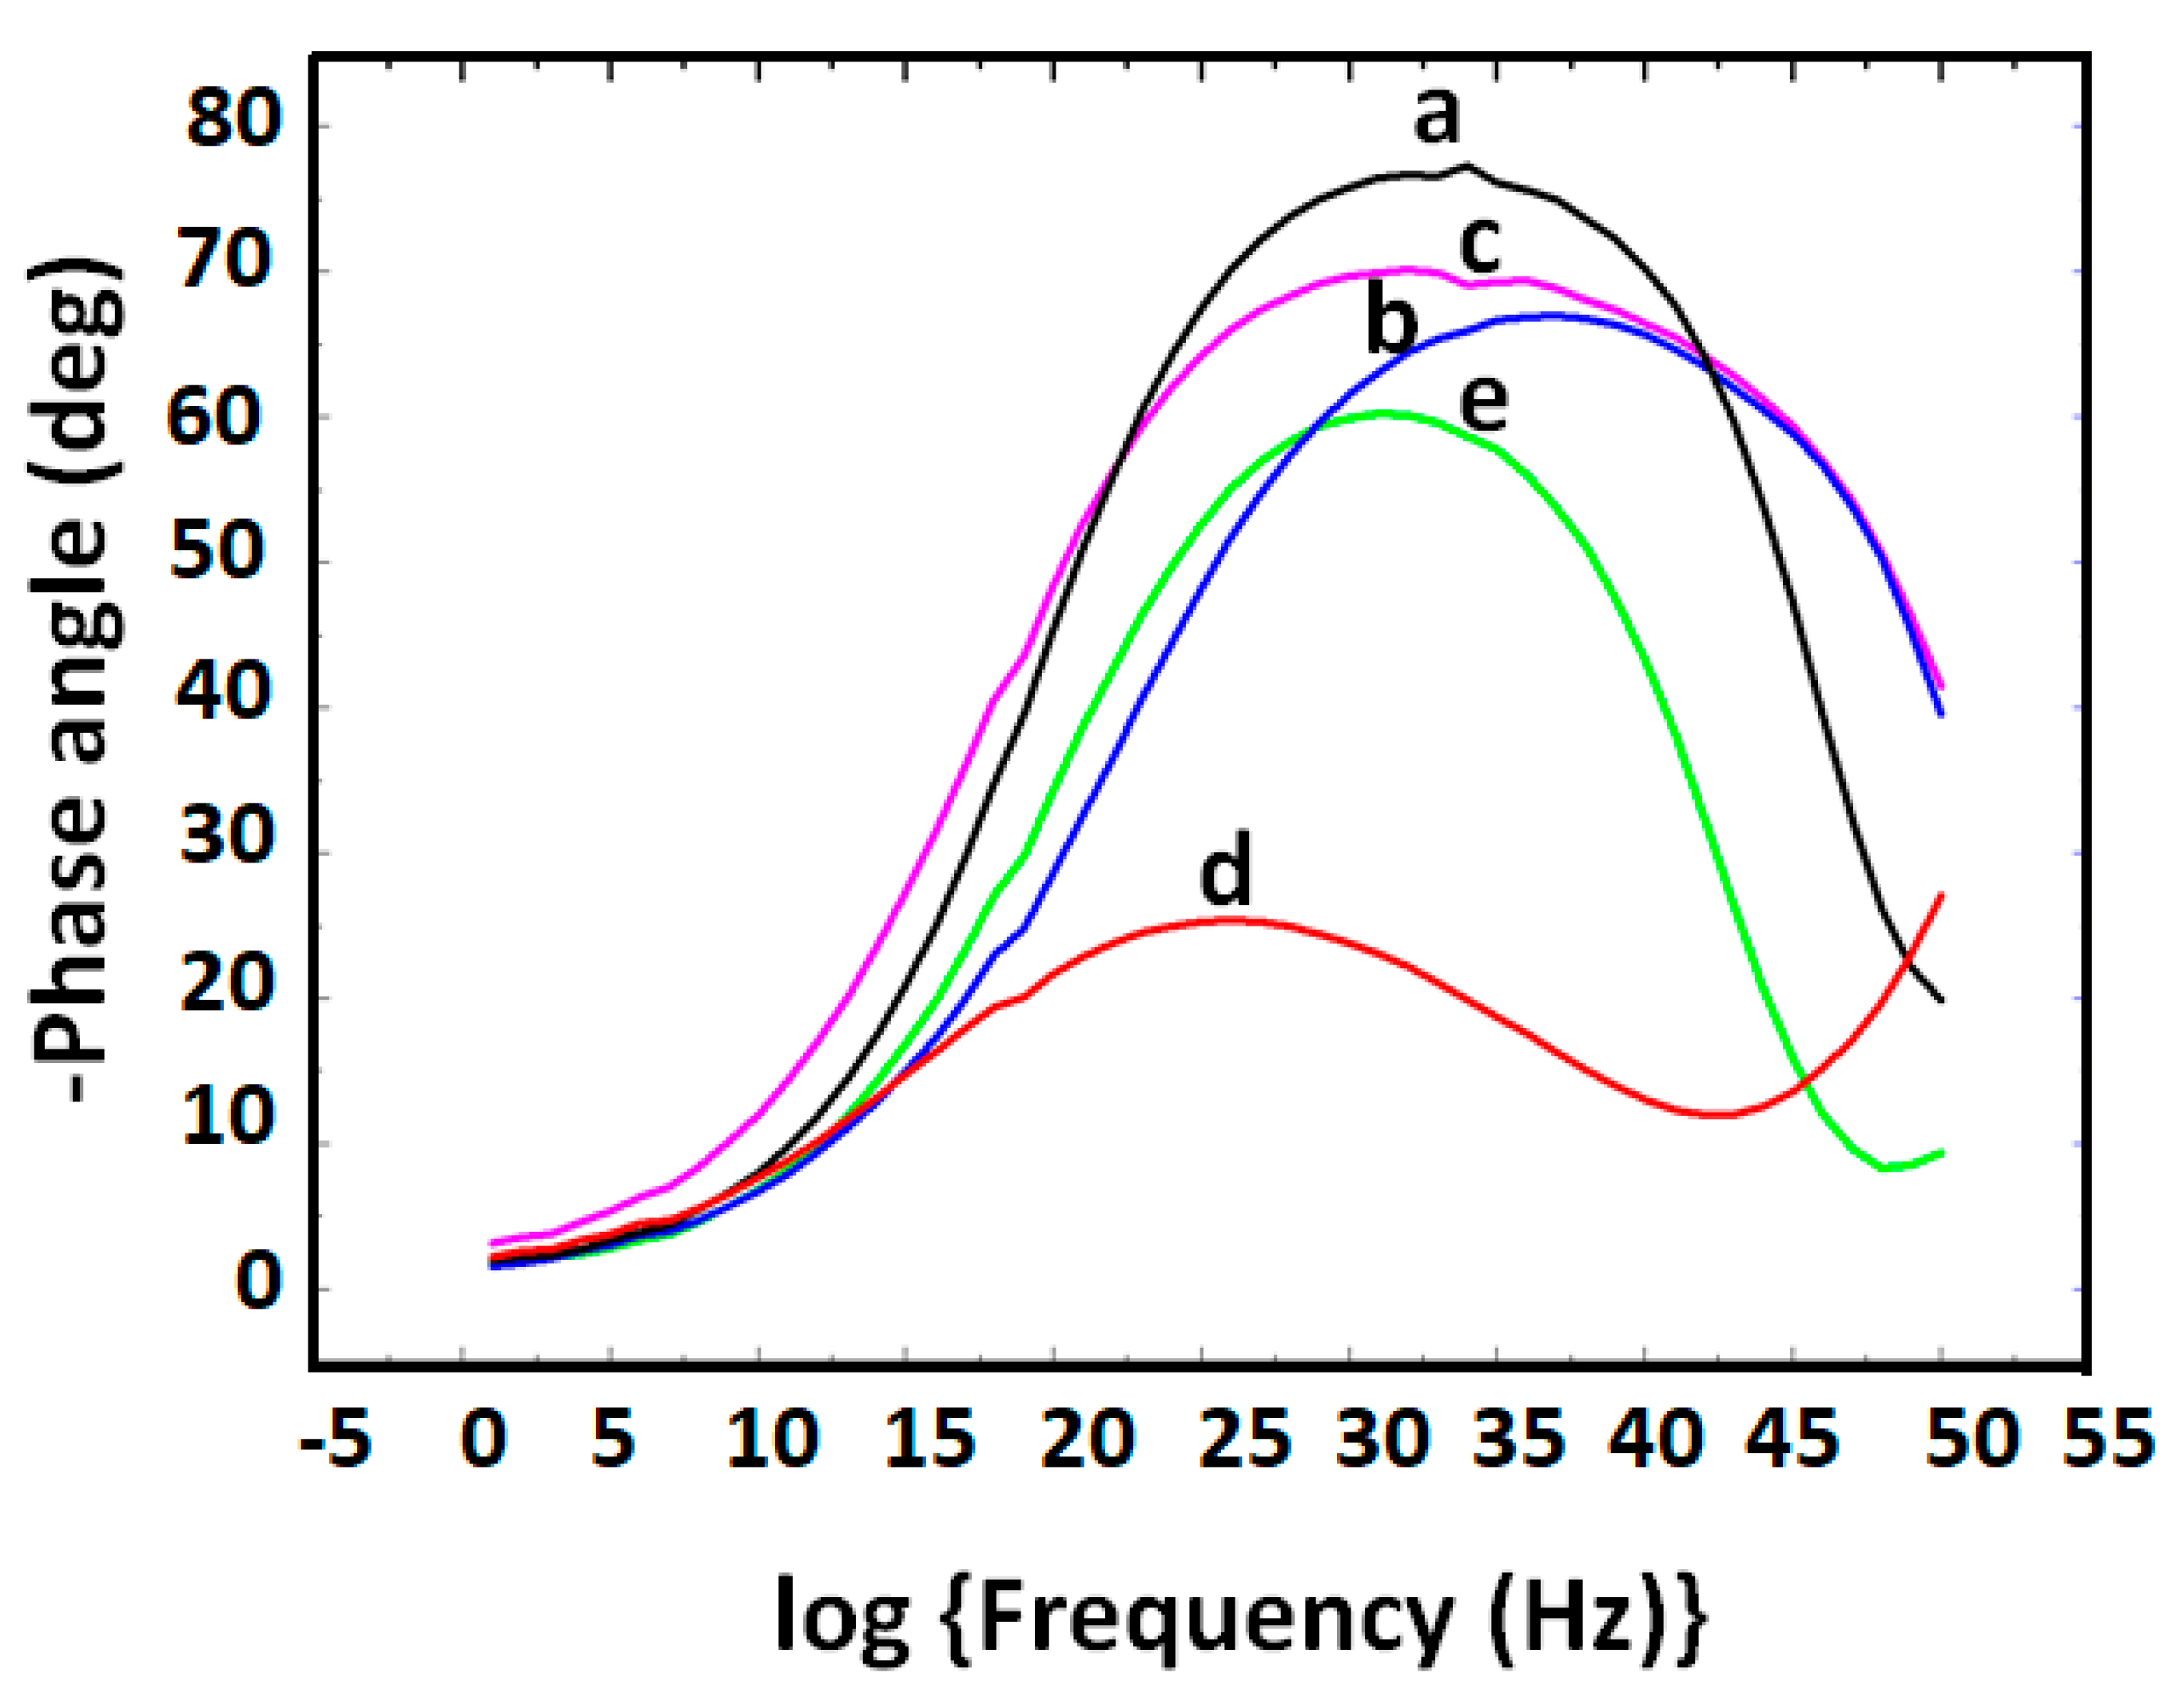
3.7. Bode Phase Angle Impedance Spectra of Aptasensor Components

Figure 9 is the equivalent circuit used to fit the EIS experimental data obtained with the various electrode system. The EIS Bode phase plots (-phase angle vs. log frequency) of the various GCE electrode systems are presented in Figure 10. -Phase angle (-Φ) values of 78° (curve a), 65° (curve b), 68° (curve c), 21° (curve d) and 58° (curve e) were obtained for GCE, GCE|PDMA–PVS, GCE|PDMA–PVS–Ag0 and GCE|PDMA–PVS–Ag0|SH-Apt, respectively, in 10 mM PBS (pH 7.4). All the electrodes exhibit semiconductor behavior since their -Φ values are < 90° [72]. The change in -Φ value (from 21° to 58°) upon the binding of the ssDNA aptamer (SH-Apt) to GCE|PDMA–PVS–Ag0 (to form GCE|PDMA–PVS–Ag0|SH-Apt), indicates that the binding of the ssDNA aptamer increased the charge density and conductivity of the electrode.

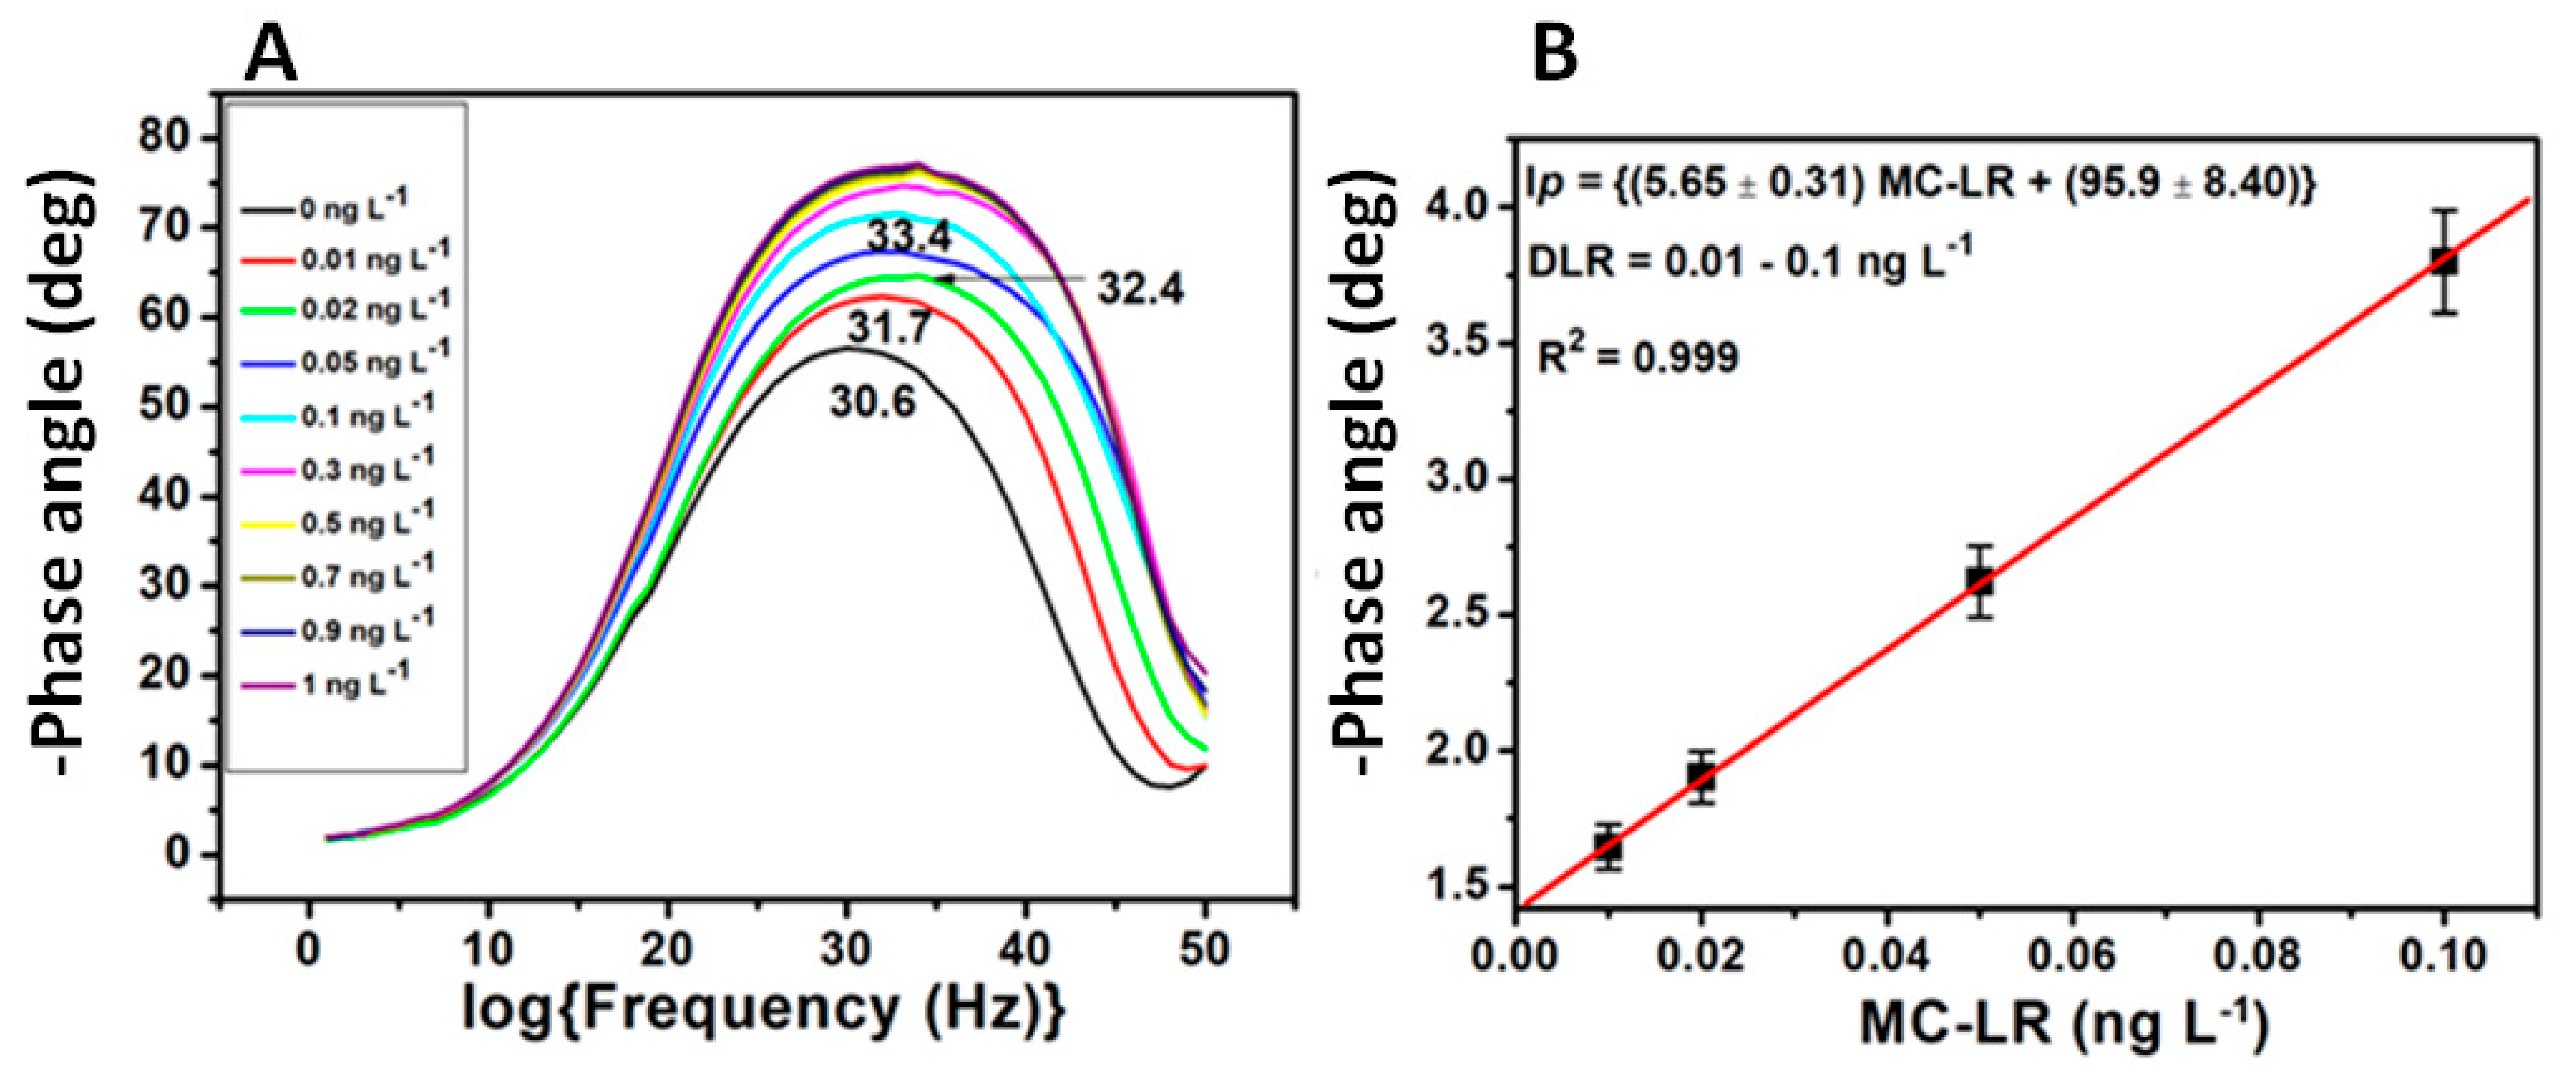
3.8. Calibration of MC-LR Aptasensor

The interactions between the aptamer in the GCE|PDMA–PVS–Ag0|SH-Apt aptasensor and MC-LR were studied in the presence of 10 mM PBS (pH 7.4) by monitoring the shifts in -Φ. Figure 11A illustrates the -Φ profile for 0.0–1.0 ng L−1 MC-LR, as well as shift in the log(frequency) value of the -Φ(maximum) from 30.6 to 33.4 as the concentration of MC-LR increased. The calibration graph of the aptasensor (Figure 11B) was constructed with ∆Φ values evaluated from the relation ∆Φ = -Φ(2) − (-Φ(1); where -Φ(1) = -Φ(maximum) value for GCE|PDMA–PVS–Ag0|SH-Apt alone; and -Φ(2) = -Φ(maximum) value for GCE|PDMA–PVS–Ag0|SH-Apt incubated with MC-LR. The experimental values were fitted by linear regression. The calibration curve was found to have a dynamic linear range (DLR) value of 0.01–0.1 ng L−1 MC-LR, with a correlation coefficient (R2) value of 0.999; and a limit of detection (LOD) value of 0.003 ng L−1 MC-LR. The LOD value was calculated as 3.3σ/S (where σ is the standard deviation of the ∆Φ response, and S is the slope of the calibration curve).
Zhang et al. [73] reported a LOD value of 20 ng L−1 for an MC-LR immunosensor based on Au nanoparticles (AuNPs)@metal–organic framework (MIL-101) composite as a platform. Thus, the immunosensor’s LOD value was by ~4 orders of magnitudes higher than what was obtained for the MC-LR aptasensor developed in this current work. Liu et al. [74] developed an MC-LR aptasensor on an AuNP@MoS2–TiONB platform, which produced a LOD value of 0.7 ng L−1, which is still ~2 orders of magnitudes higher than that of the aptasensor (PDMA–PVS–Ag0|SH-Apt) reported in this work. As can be seen in Table 1, other MC-LR aptasensors and immunosensors have LOD values ranging from 0.1–200 ng L−1, which implies that the aptasensor being reported in this study is very sensitive.

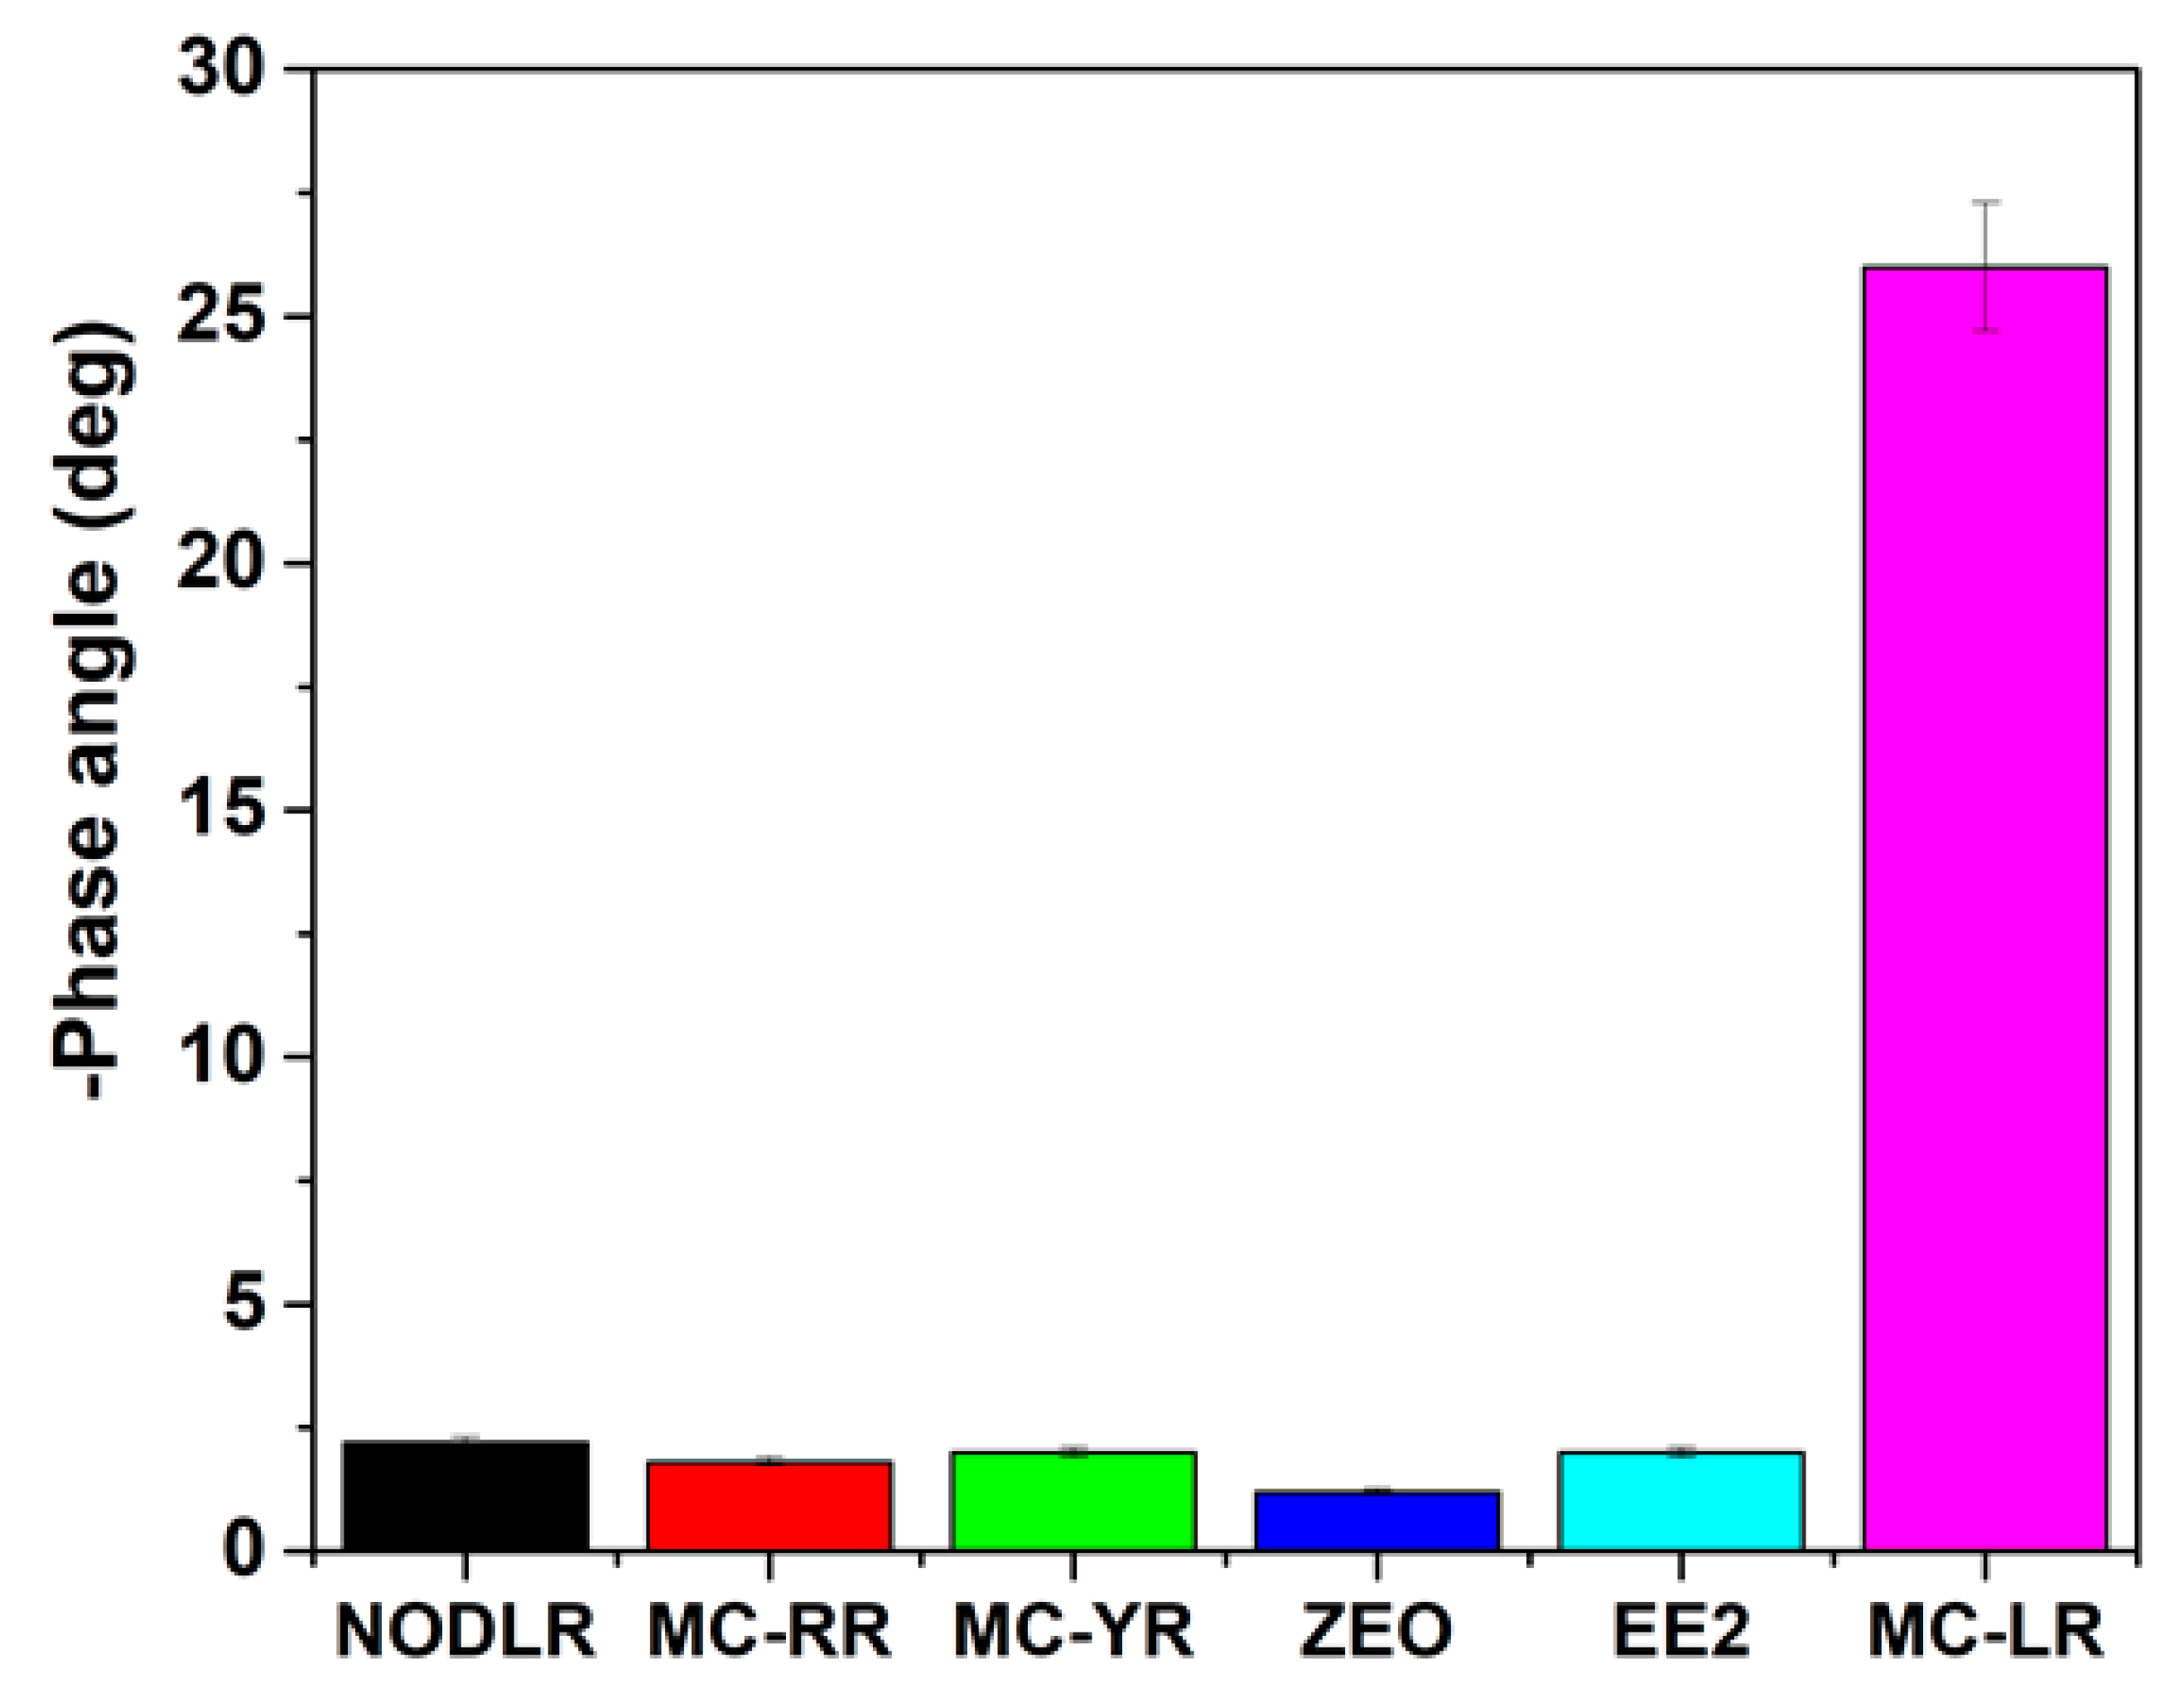
3.9. Cross-Reactivity of Aptasensor

The cross-reactivity of the impedimetric GCE|PDMA–PVS–Ag0|SH-Apt aptasensor for MC-LR was studied by assessing its Bode phase angle responses to zearalenone (ZEO), 17β-estradiol (EE2), nodularin-R (NODL-R), microcystin-RR (MC-RR) and microcystin-YR (MC-YR), which are toxins present in environmental water samples. The bar chart in Figure 12 summarizes the -Φ responses of the aptasensor when it was applied to 10 mM PBS solution spiked with 0.1 ng L−1 toxin. The toxins gave -Φ values ranging from 0.23° to 1.67°, which are very low compared to the -Φ value of 27° for MC-LR. The result shows that the aptasensor is highly selective for MC-LR, even where the toxins differ from MC-LR only in their amino acid residue, such as for MC-RR and MS-YR, where leucine is replaced by arginine and tyrosine, respectively. The cross-reactivity study was validated with enzyme-linked immunosorbent assay (ELISA).

4. Conclusions

In this study, a novel in situ electro-synthesized GCE|PDMA–PVS–Ag0 nanocomposite was prepared and evaluated. SAXS and AFM studies revealed that the PDMA–PVS–Ag0 formed polydispersed nanoparticles. The EIS-response studies of the GCE|PDMA–PVS–Ag0|SH-Apt aptasensor and its constituent materials were performed by Bode phase angle signal transduction. The aptasensor’s DLR and LOD values were evaluated to be 0.01–0.1 ng L−1 MC-LR and 0.003 ng L−1 MC-LR, respectively, which suggest its high sensitivity compared to other sensors (including MOF-based aptasensors and immunosensor, as well as MIP-based sensors, etc.) reported for MC-LR. The GCE|PDMA–PVS–Ag0|SH-Apt aptasensor exhibited very low cross-reactivity toward structurally related toxins and common estrogens (e.g., EE2) found in natural water samples.

Author Contributions

M.P.B., conceptualisation, Methodology, Investigation, Writing—Original Draft Preparation. U.F., data curation, validation, writing – reviewing and editing, A.R.W., data curation, writing—reviewing and editing. E.I., conceptualisation, project administration, supervision, writing—reviewing and editing. All authors have read and agreed to the published version of the manuscript.

Funding

This research was funded by the National Research Foundation (NRF) of South Africa, Grant number 85102.

Data Availability Statement

The data presented in this study are available on request from the corresponding author. The data are not publicly available due to privacy restriction.

Acknowledgments

This research work was partly funded by the National Research Foundation (NRF) of South Africa Scarce Skills Postdoctoral Fellowship awarded to M. Bilibana.

Conflicts of Interest

The authors declare no conflict of interest.

References

  1. Jain, S.; Surwade, S.P.; Agnihotra, S.R.; Dua, V.; Eliason, P.A.; Morose, G.J.; Manohar, S.K. Green chemistry synthesis of nanostructured poly(2,5-dimethoxyaniline). Green Chem. 2010, 12, 585–589. [Google Scholar] [CrossRef]
  2. Bober, P.; Stejskal, J.; Trchová, M.; Prokeš, J. Polyaniline–silver composites prepared by the oxidation of aniline with mixed oxidants, silver nitrate and ammonium peroxydisulfate: The control of silver content. Polymers 2011, 52, 5947–5952. [Google Scholar] [CrossRef]
  3. Busseron, E.; Ruff, Y.; Moulin, E.; Giuseppone, N. Supramolecular self-assemblies as functional nanomaterials. Nanoscale 2013, 5, 7098–7140. [Google Scholar] [CrossRef] [Green Version]
  4. Reddy, K.R.; Sin, B.C.; Ryu, K.S.; Kim, J.-C.; Chung, H.; Lee, Y. Conducting polymer functionalized multi-walled carbon nanotubes with noble metal nanoparticles: Synthesis, morphological characteristics and electrical properties. Synth. Met. 2009, 159, 595–603. [Google Scholar] [CrossRef]
  5. Neelgund, G.M.; Hrehorova, E.; Joyce, M.; Bliznyuk, V. Synthesis and characterization of polyaniline derivative and silver nanoparticle composites. Polym. Int. 2008, 57, 1083–1089. [Google Scholar] [CrossRef]
  6. Shan, S.; Shan, S.; Jiang, L.; Wang, Y.; Li, D. Synergistic antimicrobial effects of polyaniline combined with silver nanoparticles. J. Appl. Polym. Sci. 2012, 125, 3560–3566. [Google Scholar]
  7. Manesh, K.M.; Gopalan, A.I.; Lee, K.-P.; Komathi, S. Silver nanoparticles distributed into polyaniline bridged silica network: A functional nanocatalyst having synergistic influence for catalysis. Catal. Commun. 2010, 11, 913–918. [Google Scholar] [CrossRef]
  8. Bilibana, M.P.; Williams, A.R.; Rassie, C.; Sunday, C.E.; Makelane, H.; Wilson, L.; Ntshongontshi, N.; Jijana, A.N.; Masikini, M.; Baker, P.G.L.; et al. Electrochemical Aptatoxisensor Responses on Nanocomposites Containing Electro-Deposited Silver Nanoparticles on Poly(Propyleneimine) Dendrimer for the Detection of Microcystin-LR in Freshwater. Sensors 2016, 16, 1901. [Google Scholar] [CrossRef] [Green Version]
  9. Sunday, C.E.; Bilibana, M.P.; Qakala, S.; Tovide, O.; Molapo, K.M.; Fomo, G.; Ikpo, C.; Waryo, T.; Mbambisa, G.; Mpushe, B.; et al. Modulation of the matrix effect of nafion on tris(bipyridine) ruthenium(II) electrochemical probes by functionalisation with 4-nitrophenylazo graphene-gold nanocomposite. Electrochim. Acta 2014, 128, 128–137. [Google Scholar] [CrossRef]
  10. Bhadra, S.; Khastgir, D.; Singha, N.K.; Lee, J.H. Progress in preparation, processing and applications of polyaniline. Prog. Polym. Sci. 2009, 34, 783–810. [Google Scholar] [CrossRef]
  11. Xu, J.; Wang, K.; Zu, S.-Z.; Han, B.-H.; Wei, Z. Hierarchical Nanocomposites of Polyaniline Nanowire Arrays on Graphene Oxide Sheets with Synergistic Effect for Energy Storage. ACS Nano 2010, 4, 5019–5026. [Google Scholar] [CrossRef] [PubMed]
  12. Daniel, M.-C.; Astruc, D. Gold Nanoparticles: Assembly, Supramolecular Chemistry, Quantum-Size-Related Properties, and Applications toward Biology, Catalysis, and Nanotechnology. Chem. Rev. 2003, 104, 293–346. [Google Scholar] [CrossRef] [PubMed]
  13. Guo, S.; Wang, E. Synthesis and electrochemical applications of gold nanoparticles. Anal. Chim. Acta 2007, 598, 181–192. [Google Scholar] [CrossRef] [PubMed]
  14. Wang, Z.; Yuan, J.; Li, M.; Han, D.; Zhang, Y.; Shen, Y.; Niu, L.; Ivaska, A. Electropolymerization and catalysis of well-dispersed polyaniline/carbon nanotube/gold composite. J. Electroanal. Chem. 2007, 599, 121–126. [Google Scholar] [CrossRef]
  15. Tseng, R.J.; Huang, J.; Ouyang, J.; Kaner, R.B.; Yang, Y. Polyaniline Nanofiber/Gold Nanoparticle Nonvolatile Memory. Nano Lett. 2005, 5, 1077–1080. [Google Scholar] [CrossRef]
  16. Humpolíček, P.; Kasparkova, V.; Saha, P.; Stejskal, J. Biocompatibility of polyaniline. Synth. Met. 2012, 162, 722–727. [Google Scholar] [CrossRef]
  17. Sidwaba, U.; Feleni, U.; Makelane, H.; Nxusani, E.; Wilson, L.; Qakala, S.; Rassie, C.; Masikini, M.; Waryo, T.; Ajayi, R.F.; et al. A Novel Polyaniline Nanocomposite with Doping Effects of Poly (Methyl Methacrylate) and TiO2 Nanoparticles. JNanoR 2016, 44, 281–292. [Google Scholar] [CrossRef]
  18. Storrier, G.D.; Colbran, S.B.; Hibbert, D. Chemical and electrochemical syntheses, and characterization of poly(2,5-dimethoxyaniline) (PDMA): A novel, soluble, conducting polymer. Synth. Met. 1994, 62, 179–186. [Google Scholar] [CrossRef]
  19. Mateos, M.; Tchangaï, M.-D.; Meunier-Prest, R.; Heintz, O.; Herbst, F.; Suisse, J.-M.; Bouvet, M. Low Conductive Electrodeposited Poly(2,5-dimethoxyaniline) as a Key Material in a Double Lateral Heterojunction, for Sub-ppm Ammonia Sensing in Humid Atmosphere. ACS Sens. 2019, 4, 740–747. [Google Scholar] [CrossRef] [Green Version]
  20. Masikini, M.; Williams, A.R.; Sunday, C.E.; Waryo, T.T.; Nxusani, E.; Wilson, L.; Qakala, S.; Bilibana, M.; Douman, S.; Jonnas, A.; et al. Label Free Poly(2,5-dimethoxyaniline)–Multi-Walled Carbon Nanotubes Impedimetric Immunosensor for Fumonisin B1 Detection. Materials 2016, 9, 273. [Google Scholar] [CrossRef] [Green Version]
  21. Zanchett, G.; Oliveira-Filho, E.C. Cyanobacteria and Cyanotoxins: From Impacts on Aquatic Ecosystems and Human Health to Anticarcinogenic Effects. Toxins 2013, 5, 1896–1917. [Google Scholar] [CrossRef] [PubMed]
  22. Funari, E.; Testai, E. Human Health Risk Assessment Related to Cyanotoxins Exposure. Crit. Rev. Toxicol. 2008, 38, 97–125. [Google Scholar] [CrossRef] [PubMed]
  23. Lahti, K.; Rapala, J.; Färdig, M.; Niemelä, M.; Sivonen, K. Persistence of cyanobacterial hepatotoxin, microcystin-LR in particulate material and dissolved in lake water. Water Res. 1997, 31, 1005–1012. [Google Scholar] [CrossRef]
  24. Hoeger, S.J.; Hitzfeld, B.C.; Dietrich, D. Guidance values for microcystins in water and cyanobacterial supplement products (blue-green algal supplements): A reasonable or misguided approach? Toxicol. Appl. Pharmacol. 2005, 203, 273–289. [Google Scholar] [CrossRef] [Green Version]
  25. Chen, J.; Xie, P.; Li, L.; Xu, J. First identification of the hepatotoxic microcystins in the serum of a chronically exposed human population together with indication of hepatocellular damage. Toxicol. Sci. 2009, 108, 81–89. [Google Scholar] [CrossRef] [PubMed]
  26. Sotton, B.; Guillard, J.; A Nneville, O.; Maréchal, M.; Savichtcheva, O.; Domaizon, I. Trophic transfer of microcystins through the lake pelagic food web: Evidence for the role of zooplankton as a vector in fish contamination. Sci. Total Environ. 2014, 466–467, 152–163. [Google Scholar] [CrossRef] [PubMed]
  27. Burch, M. Effective Doses, Guidelines & Regulations. In Cyanobacterial Harmful Algal Blooms: State of the Science and Research Needs; Hudnell, H.K., Ed.; Springer: New York, NY, USA, 2008; pp. 831–853. [Google Scholar]
  28. Vasconcelos, V.; Pereira, E. Cyanobacteria diversity and toxicity in a Wastewater Treatment Plant (Portugal). Water Res. 2001, 35, 1354–1357. [Google Scholar] [CrossRef]
  29. Chianella, I.; Piletsky, S.A.; E Tothill, I.; Chen, B.; Turner, A.P. MIP-based solid phase extraction cartridges combined with MIP-based sensors for the detection of microcystin-LR. Biosens. Bioelectron. 2003, 18, 119–127. [Google Scholar] [CrossRef]
  30. Mathys, W.; Surholt, B. Analysis of microcystins in freshwater samples using high performance liquid chromatography and an enzyme-linked immunosorbent assay. Int. J. Hyg. Environ. Health 2004, 207, 601–605. [Google Scholar] [CrossRef]
  31. Kordasht, H.K.; Hassanpour, S.; Baradaran, B.; Nosrati, R.; Hashemzaei, M.; Mokhtarzadeh, A.; De La Guardia, M. Biosensing of microcystins in water samples; recent advances. Biosens. Bioelectron. 2020, 165, 112403. [Google Scholar] [CrossRef]
  32. Eggimann, S.; Mutzner, L.; Wani, O.; Schneider, M.Y.; Spuhler, D.; De Vitry, M.M.; Beutler, P.; Maurer, M. The Potential of Knowing More: A Review of Data-Driven Urban Water Management. Environ. Sci. Technol. 2017, 51, 2538–2553. [Google Scholar] [CrossRef] [PubMed] [Green Version]
  33. Singh, S.; Srivastava, A.; Oh, H.M.; Ahn, C.Y.; Choi, G.G.; Asthana, R.K. Recent trends in development of biosensors for detection of microcystin. Toxicon 2012, 60, 878–894. [Google Scholar] [CrossRef] [PubMed]
  34. Muchindu, M.; Iwuoha, E.; Pool, E.; West, N.; Jahed, N.; Baker, P.; Waryo, T.; Williams, A. Electrochemical ochratoxin A immunosensor system developed on sulfonated polyaniline. Electroanalysis 2011, 23, 122–128. [Google Scholar] [CrossRef]
  35. Suo, T.; Sohail, M.; Xie, S.; Li, B.; Chen, Y.; Zhang, L.; Zhang, X. DNA nanotechnology: A recent advancement in the monitoring of microcystin-LR. J. Hazard. Mater. 2021, 403, 123418. [Google Scholar] [CrossRef]
  36. Fomo, G.; Waryo, T.T.; Sunday, C.E.; Baleg, A.A.; Baker, P.G.; Iwuoha, E.I. Aptameric recognition-modulated electroactivity of poly(4-styrenesolfonic acid)-doped polyaniline films for single-shot detection of tetrodotoxin. Sensors 2015, 15, 22547–22560. [Google Scholar] [CrossRef] [Green Version]
  37. Vogiazi, V.; De La Cruz, A.; Mishra, S.; Shanov, V.; Heineman, W.R.; Dionysiou, D.D. A Comprehensive Review: Development of Electrochemical Biosensors for Detection of Cyanotoxins in Freshwater. ACS Sens. 2019, 4, 1151–1173. [Google Scholar] [CrossRef]
  38. Zhang, W.; Liu, Q.X.; Guo, Z.H.; Lin, J. Practical Application of Aptamer-Based Biosensors in Detection of Low Molecular Weight Pollutants in Water Sources. Molecules 2018, 23, 344. [Google Scholar] [CrossRef] [Green Version]
  39. Cunha, I.; Biltes, R.; Sales, M.G.F.; Vasconcelos, V. Aptamer-Based Biosensors to Detect Aquatic Phycotoxins and Cyanotoxins. Sensors 2018, 18, 2367. [Google Scholar] [CrossRef] [Green Version]
  40. Bostan, H.B.; Taghdisi, S.M.; Bowen, J.L.; Demertzis, N.; Rezaee, R.; Panahi, Y.; Tsatsakis, A.; Karimi, G. Determination of microcystin-LR, employing aptasensors. Biosens. Bioelectron. 2018, 119, 110–118. [Google Scholar] [CrossRef]
  41. Sunday, C.E.; Masikini, M.; Wilson, L.; Rassie, C.; Waryo, T.; Baker, P.G.L.; Iwuoha, E.I. Application on gold nanoparticles-dotted 4-nitrophyenylazo graphene in a label-free impedimetric deoxynivalenol immunosensor. Sensors 2015, 15, 3854–3871. [Google Scholar] [CrossRef] [Green Version]
  42. He, F.; Liang, L.; Zhou, S.; Xie, W.; He, S.; Wang, Y.; Tlili, C.; Tong, S.; Wang, D. Label-Free Sensitive Detection of Microcystin-LR via Aptamer-Conjugated Gold Nanoparticles Based on Solid-State Nanopores. Langmuir 2018, 34, 14825–14833. [Google Scholar] [CrossRef]
  43. Ellington, A.D.; Szostak, J.W. In vitro selection of RNA molecules that bind specific ligands. Nature 1990, 346, 818–822. [Google Scholar] [CrossRef] [PubMed]
  44. Sassanfar, M.; Szostak, J.W. An RNA motif that binds ATP. Nat. Cell Biol. 1993, 364, 550–553. [Google Scholar] [CrossRef] [PubMed]
  45. Bukari, B.A.; Citartan, M.; Ch’Ng, E.S.; Bilibana, M.P.; Rozhdestvensky, T.S.; Tang, T.-H. Aptahistochemistry in diagnostic pathology: Technical scrutiny and feasibility. Histochem. Cell Biol. 2017, 147, 545–553. [Google Scholar] [CrossRef] [PubMed]
  46. Bilibana, M.P.; Citartan, M.; Yeoh, T.S.; Rozhdestvensky, T.S.; Tang, T.-H. Aptamers as the Agent in Decontamination Assays (Apta-Decontamination Assays): From the Environment to the Potential Application In Vivo. J. Nucleic Acids 2017, 2017, 1–12. [Google Scholar] [CrossRef] [PubMed] [Green Version]
  47. Lin, Z.; Huang, H.; Xu, Y.; Gao, X.; Qiu, B.; Chen, X.; Chen, G. Determination of microcystin-LR in water by a label-free aptamer based electrochemical impedance biosensor. Talanta 2013, 103, 371–374. [Google Scholar] [CrossRef] [PubMed]
  48. Nakamura, C.; Kobayashi, T.; Miyake, M.; Shirai, M.; Miyakea, J. Usage of a DNA Aptamer as a Ligand Targeting Microcystin. Mol. Cryst. Liq. Cryst. Sci. Technol. Sect. A. Mol. Cryst. Liq. Cryst. 2001, 371, 369–374. [Google Scholar] [CrossRef]
  49. Eissa, S.; Ng, A.; Siaj, M.; Zourob, M. Label-Free Voltammetric Aptasensor for the Sensitive Detection of Microcystin-LR Using Graphene-Modified Electrodes. Anal. Chem. 2014, 86, 7551–7557. [Google Scholar] [CrossRef] [PubMed]
  50. Gan, C.; Wang, B.; Huang, J.; Qileng, A.; He, Z.; Lei, H.; Liu, W.; Liu, Y. Multiple amplified enzyme-free electrochemical immunosensor based on G-quadruplex/hemin functionalized mesoporous silica with redox-active intercalators for microcystin-LR detection. Biosens. Bioelectron. 2017, 98, 126–133. [Google Scholar] [CrossRef]
  51. Du, X.; Jiang, D.; Dai, L.; Zhou, L.; Hao, N.; Qian, J.; Qiu, B.; Wang, K. Fabricating photoelectrochemical aptasensor for selectively monitoring microcystin-LR residues in fish based on visible light-responsive BiOBr nanoflakes/N-doped graphene photoelectrode. Biosens. Bioelectron. 2016, 81, 242–248. [Google Scholar] [CrossRef]
  52. Liu, M.; Yu, J.; Ding, X.; Zhao, G. Photoelectrochemical Aptasensor for the Sensitive Detection of Microcystin-LR Based on Graphene Functionalized Vertically-aligned TiO2Nanotubes. Electroanalysis 2015, 28, 161–168. [Google Scholar] [CrossRef]
  53. Nandakumar, V.; Bishop, D.K.; Alonas, E.; Labelle, J.T.; Joshi, L.; Alford, T.L. A Low-Cost Electrochemical Biosensor for Rapid Bacterial Detection. IEEE Sens. J. 2011, 11, 210–216. [Google Scholar] [CrossRef]
  54. Radi, A.-E. Electrochemical Aptamer-Based Biosensors: Recent Advances and Perspectives. Int. J. Electrochem. 2011, 2011, 1–17. [Google Scholar] [CrossRef] [Green Version]
  55. Chen, C.; Xie, Q.; Yang, D.; Xiao, H.; Fu, Y.; Tan, Y.; Yao, S. Recent advances in electrochemical glucose biosensors: A review. RSC Adv. 2013, 3, 4473–4491. [Google Scholar] [CrossRef]
  56. Gupta, R.; Raza, N.; Bhardwaj, S.K.; Vikrant, K.; Kim, K.-H.; Bhardwaj, N. Advances in nanomaterial-based electrochemical biosensors for the detection of microbial toxins, pathogenic bacteria in food matrices. J. Hazard. Mater. 2021, 401, 123379. [Google Scholar] [CrossRef]
  57. Harada, K.; Frankel, A.D. Identification of two novel arginine binding DNAs. EMBO J. 1995, 14, 5798–5811. [Google Scholar] [CrossRef]
  58. Robertson, D.L.; Joyce, G.F. Selection in vitro of an RNA enzyme that specifically cleaves single-stranded DNA. Nat. Cell Biol. 1990, 344, 467–468. [Google Scholar] [CrossRef]
  59. Jayasena, S.D. Aptamers: An Emerging Class of Molecules That Rival Antibodies in Diagnostics. Clin. Chem. 1999, 45, 1628–1650. [Google Scholar] [CrossRef] [Green Version]
  60. Ming, T.; Luo, J.; Liu, J.; Sun, S.; Xing, Y.; Wang, H.; Xiao, G.; Deng, Y.; Cheng, Y.; Yang, Z.; et al. Paper-based microfluidic aptasensors. Biosens. Bioelectron. 2020, 170, 112649. [Google Scholar] [CrossRef]
  61. Chergui, S.; Rhili, K.; Poorahong, S.; Siaj, M. Graphene Oxide Membrane Immobilized Aptamer as a Highly Selective Hormone Removal. Membranes 2020, 10, 229. [Google Scholar] [CrossRef]
  62. Li, Y.; Li, Y.; Yang, Y. A new amperometric H2O2 biosensor based on nanocomposite films of chitosan–MWNTs, hemoglobin, and silver nanoparticles. J. Solid State Electrochem. 2011, 16, 1133–1140. [Google Scholar] [CrossRef]
  63. Ng, A.; Chinnappan, R.; Eissa, S.; Liu, H.; Tlili, C.; Zourob, M. Selection, Characterization, and Biosensing Application of High Affinity Congener-Specific Microcystin-Targeting Aptamers. Environ. Sci. Technol. 2012, 46, 10697–10703. [Google Scholar] [CrossRef] [PubMed]
  64. Kink, M.; Akinyeye, R.; Somerset, V.; Sekota, M.; Baker, P.; Iwuoha, E. Electrochemical and spectroscopic dynamics of nanostructured polynuclear sulphonic acid-doped poly(2,5-dimethoxyaniline). Mater. Sci. Forum. 2010, 657, 231–248. [Google Scholar] [CrossRef]
  65. Tovide, O.; Jaheed, N.; Mohamed, N.; Nxusani, E.; Sunday, C.E.; Tsegaye, A.; Ajayi, R.F.; Njomo, N.; Makelane, H.; Bilibana, M.P.; et al. Graphenated polyaniline-doped tungsten oxide nanocomposite sensor for real time determination of phenanthrene. Electrochim. Acta 2014, 128, 138–148. [Google Scholar] [CrossRef]
  66. Huang, L.-M.; Wen, T.-C. One-step synthesis of silver nanoparticles and poly(2,5-dimethoxyaniline) in poly(styrene sulfonic acid). Mater. Sci. Eng. A 2007, 445–446, 7–13. [Google Scholar] [CrossRef]
  67. Molapo, K.M.; Ndangili, P.M.; Ajayi, R.F.; Mbambisa, G.; Mailu, S.M.; Njomo, N.; Masikini, M.; Baker, P.; Iwuoha, E.I. Electronics of Conjugated Polymers (I): Polyaniline. Int. J. Electrochem. Sci. 2012, 7, 11859–11875. [Google Scholar]
  68. Mungkalodom, P.; Paradee, N.; Sirivat, A.; Hormnirun, P. Synthesis of Poly (2,5-dimethoxyaniline) and Electrochromic Properties. Mater. Res. 2015, 18, 669–676. [Google Scholar] [CrossRef] [Green Version]
  69. Afzal, A.B.; Akhtar, M.J.; Nadeem, M.; Hassan, M.M. Investigation of Structural and Electrical Properties of Polyaniline/Gold Nanocomposites. J. Phys. Chem. C 2009, 113, 17560–17565. [Google Scholar] [CrossRef]
  70. Nenkova, R.; Wu, J.; Zhang, Y.; Godjevargova, T. Influence of different nanozeolite particles on the sensitivity of a glucose biosensor. Anal. Biochem. 2013, 439, 65–72. [Google Scholar] [CrossRef]
  71. Yi, X.; Wu, Y.; Tan, G.; Yuxuan, W.; Zhou, L.; Zhou, Z.; Chengyun, N.; Wang, Z.; Pang, J.; Ning, C. Palladium nanoparticles entrapped in a self-supporting nanoporous gold wire as sensitive dopamine biosensor. Sci. Rep. 2017, 7, 1–9. [Google Scholar] [CrossRef] [Green Version]
  72. Lum, J.; Wang, R.; Hargis, B.M.; Tung, S.; Bottje, W.G.; Lu, H.; Li, Y. An Impedance Aptasensor with Microfluidic Chips for Specific Detection of H5N1 Avian Influenza Virus. Sensors 2015, 15, 18565–18578. [Google Scholar] [CrossRef] [PubMed] [Green Version]
  73. Zhang, K.; Dai, K.; Bai, R.; Ma, Y.; Deng, Y.; Li, D.; Zhang, X.; Hu, R.; Yang, Y.-H. A competitive microcystin-LR immunosensor based on Au NPs@metal-organic framework (MIL-101). Chin. Chem. Lett. 2019, 30, 664–667. [Google Scholar] [CrossRef]
  74. Liu, X.; Tang, Y.; Liu, P.; Yang, L.; Li, L.; Zhang, Q.; Zhou, Y.; Khan, Z.H. A highly sensitive electrochemical aptasensor for detection of microcystin-LR based on a dual signal amplification strategy. Analyst 2019, 144, 1671–1678. [Google Scholar] [CrossRef] [PubMed]
  75. Zhang, W.; Dixon, M.B.; Saint, C.P.; Teng, K.S.; Furumai, H. Electrochemical Biosensing of Algal Toxins in Water: The Current State-of-the-Art. ACS Sens. 2018, 3, 1233–1245. [Google Scholar] [CrossRef]
  76. Zhang, Y.; Chen, M.; Li, H.; Yan, F.; Pang, P.; Wang, H.; Wu, Z.; Yangc, W. A molybdenum disulfide/gold nanorod composite-based electrochemical immunosensor for sensitive and quantitative detection of microcystin-LR in environmental samples. Sens. Actuators B Chem. 2017, 244, 606–615. [Google Scholar] [CrossRef]
  77. Zhao, C.; Hu, R.; Liu, T.; Liu, Y.; Bai, R.; Zhang, K.; Yang, Y.-H. A non-enzymatic electrochemical immunosensor for microcystin-LR rapid detection based on Ag@MSN nanoparticles. Colloids Surf. A Physicochem. Eng. Asp. 2016, 490, 336–342. [Google Scholar] [CrossRef]
  78. Chen, K.; Liu, M.; Zhao, G.; Shi, H.; Fan, L.; Zhao, S. Fabrication of a Novel and Simple Microcystin-LR Photoelectrochemical Sensor with High Sensitivity and Selectivity. Environ. Sci. Technol. 2012, 46, 11955–11961. [Google Scholar] [CrossRef]
  79. Liu, M.; Ding, X.; Yang, Q.; Wang, Y.; Zhao, G.; Yang, N. A pM leveled photoelectrochemical sensor for microcystin-LR based on surface molecularly imprinted TiO2 @CNTs nanostructure. J. Hazard. Mater. 2017, 331, 309–320. [Google Scholar] [CrossRef]
Scheme 1. Schematic representation of the aptasensor for MC-LR.
Processes 09 00179 sch001
Figure 1. Cyclic voltammograms of the electropolymerization of (A) poly(2,5-dimethoxyaniline) (PDMA)- poly(vinylsulfonate) (PVS) and (B) PDMA–PVS–Ag0 in 1 M HCl at a scan rate of 40 mV s−1.
Processes 09 00179 g001
Figure 2. UV-vis absorbance spectra of PDMA (black line), PDMA–PVS (red line) and PDMA–PVS- Ag0 (green line).
Processes 09 00179 g002
Figure 3. FT-IR spectra of (A) PDMA (black line), (B) PDMA–PVS (red line) and (C) PDMA–PVS–Ag0 (green line) nanocomposites.
Processes 09 00179 g003
Figure 4. Scan rate dependence of the cyclic voltammetry of PDMA–PVS–Ag0 in 1 M HCl.
Processes 09 00179 g004
Figure 5. SEM images of (A) PDMA, (B) PDMA–PVS and (C) PDMA–PVS–Ag0 nanocomposite.
Processes 09 00179 g005
Figure 6. HRTEM images of (A) PDMA–PVS at 20 nm scale view; and PDMA–PVS–Ag0 nanocomposite at (B) 20 nm and (C) 100 nm scale views.
Processes 09 00179 g006
Figure 7. Atomic force microscope (AFM) images of nanocomposites of (A) PDMA–PVS and (B) glassy carbon electrode (GCE)| PDMA–PVS–Ag0.
Processes 09 00179 g007
Figure 8. Small-angle X-ray scattering (SAXS) spectra of (PDMA–PVS–Ag0) composite materials. (A) Pair-distance distribution function (PDDF) for PDMA (black line), PDMA–PVS (red line) and PDMA–PVS–Ag0 (green line). (B) Number-weighted size distribution function for PDMA (black line), PDMA–PVS (red line) and PDMA–PVS–Ag0 (green line).
Processes 09 00179 g008
Figure 9. Equivalent circuit diagram for the electrode systems. (Rs = solution resistance; Rct = charge transfer resistance; and CPE = constant phase element).
Processes 09 00179 g009
Figure 10. The electrochemical impedance spectroscopy (EIS) Bode phase plots for (a) GCE, (b) GCE|PDMA, (c) GCE|PDMA–PVS, (d) GCE|PDMA–PVS–Ag0 and (e) GCE|PDMA–PVS–Ag0|1 μM 5′-thiol MC-LR-aptamer (SH-Apt).
Processes 09 00179 g010
Figure 11. MC-LR aptasensor (GCE|PDMA–PVS–Ag0|SH-Apt): (A) Bode phase angle response profile, and (B) linear calibration graph (numbers on the plots in graph A are the log(frequency) values corresponding to -Φ(maximum)).
Processes 09 00179 g011
Figure 12. Bar chart of aptasensor (GCE|PDMA–PVS–Ag0|SH-Apt) responses to toxins.
Processes 09 00179 g012
Table 1. Comparison of the parameters of MC-LR sensors.
TechniquesNanomaterialDLR (ng L−1)LOD (ng L−1)References
AptatoxisensorSDD–Co(II)|AgNPs100–1 × 10340[8]
AptasensorAuNP@MoS2–TiONB2–101 × 1020.7[74]
ImmunosensorGraphene films5–10 × 1032.3[75]
ImmunosensorMOF-101|AuNPs50–75 × 10620 [73]
ImmunosensorMoS2|AuNRs10–20 × 1035 [76]
ImmunosensorAg@MSN500–30 × 103200[77]
Molecularly imprinted (MI) polypyrrole TiO2 NTs500–100 × 103100[78]
MI-TiO2CNTs0.4–11000.1[79]
AptasensorPDMA–PVS–Ag00.01–0.100.003This work
Publisher’s Note: MDPI stays neutral with regard to jurisdictional claims in published maps and institutional affiliations.

