Article

Thermal Efficiency, Heat Transfer, and Friction Factor Analyses of MWCNT + Fe3O4/Water Hybrid Nanofluids in a Solar Flat Plate Collector under Thermosyphon Condition

by
Bahaa Saleh
1,2,* and
Lingala Syam Sundar
3
1
Mechanical Engineering Department, College of Engineering, Taif University, P.O. Box 11099, Taif 21944, Saudi Arabia
2
Mechanical Engineering Department, Faculty of Engineering, Assiut University, Assiut 71516, Egypt
3
Centre for Mechanical Technology and Automation (TEMA–UA), Department of Mechanical Engineering, University of Aveiro, 3810-193 Aveiro, Portugal
*
Author to whom correspondence should be addressed.
Submission received: 29 December 2020 / Revised: 12 January 2021 / Accepted: 15 January 2021 / Published: 19 January 2021
(This article belongs to the Section Energy Systems)

Abstract

:
The heat transfer, friction factor, and collector efficiency are estimated experimentally for multi-walled carbon nanotubes+Fe3O4 hybrid nanofluid flows in a solar flat plate collector under thermosyphon circulation. The combined technique of in-situ growth and chemical coprecipitation was utilized to synthesize the multi-walled carbon nanotubes+Fe3O4 hybrid nanoparticles. The experiments were carried out at volume flow rates from 0.1 to 0.75 L/min and various concentrations from 0.05% to 0.3%. The viscosity and thermal conductivity of the hybrid nanofluids were experimentally measured at different temperatures and concentrations. Due to the improved thermophysical properties of the hybrid nanofluids, the collector achieved better thermal efficiency. Results show that the maximum thermal conductivity and viscosity enhancements are 28.46% and 50.4% at 0.3% volume concentration and 60 °C compared to water data. The Nusselt number, heat transfer coefficient, and friction factor are augmented by 18.68%, 39.22%, and 18.91% at 0.3% volume concentration and 60 °C over water data at the maximum solar radiation. The collector thermal efficiency improved by 28.09% at 0.3 vol. % at 13:00 h daytime and a Reynolds number of 1413 over water data. Empirical correlations were developed for friction factor and Nusselt number.

1. Introduction

Energy demand is high all over the world and fossil fuel scarcity is one of the major problems. To meet the energy demand and replacement for fossil fuels, the best source of energy is alternative energy. Sun energy is the best renewable energy, which is available all the days in the year and it is obtainable plenty on the surface of the earth. The best example of solar thermal energy conversion technology is the solar flat plate collector (FPC) which is used for bathing purposes and used in various industrial processes. The convectional fluids are the working fluids in flat plate collectors, because of that, its efficiency is low. To improve the thermal efficiency of the collector, the convectional fluids are replaced with better thermal conductivity nanofluids [1,2].
Some of the literature related to the use of nanofluids in FPCs are mentioned below. Modi et al. [3] enhanced the performance of solar still by 19.40%, 28.53%, and 26.59% utilizing Al2O3 nanoparticles at water depths of 30, 20, and 10 mm. Moreover, the performance improved by 58.25% and 56.31% utilizing CuO nanoparticles at 20 and 10 mm water depth. Hawwash et al. [4] observed enhancement in the collector thermal efficiency by 16.67% utilizing Al2O3/water nanofluids flow in a FPC. Kiliç et al. [5] have noticed 48.67% enhancement of collector efficiency with 2 wt. % of TiO2/water nanofluid. Sundar et al. [6] obtained collector thermal efficiency of 76% with 0.3 vol. % of Al2O3/water nanofluid at a mass flow rate of 0.083 kg/s.
Sharafeldin and Gróf [7] have observed collector efficiency of 10.74% at [(Ti–Ta)/GT] value reached to zero at 0.066 vol. % of CeO2/water in the collector at 0.019 kg s−1 m−2 mass flux rate. Jouybari et al. [8] obtained a collector efficiency of 73% utilizing 0.6 vol. % of SiO2/water nanofluid in a FPC at 1.5 L min−1 volume flow rate. Ziyadanogullari et al. [9] conducted thermal efficiency experiments for TiO2/water, CuO/water, and Al2O3/water nanofluids flow in a FPC at 0.2%, 0.4%, and 0.8% particle concentrations. They obtained improvement in the collector efficiency compared to the base fluid. Rajput et al. [10] have found efficiency of 21.32% at 0.3 vol. % of Al2O3/water flows in a FPC at 1.3 L min−1 volume flow rate.
Stalin et al. [11] attained thermal efficiency and exergy efficiency augmentation of 28.07% and 5.8% using 0.05% concentration of CeO2/water nanofluid flows in a FPC at 3 L min−1 volume flow rate over water data. Choudhary et al. [12] obtained 69.24% collector efficiency utilizing 50:50% water mixture based ZnO nanofluid and ethylene glycol flow in a FPC at 1% concentration and 60 L h−1 volume flow rate.
Tong et al. [13] obtained exergy efficiency improvement of 49.6% and 56.9% using 0.5% concentration of CuO nanofluids and 1.0% of Al2O3 nanofluid in a FPC. Choudhary et al. [14] obtained 69.1% collector efficiency using 50:50% water and ethylene glycol mixture based MgO nanofluid in a FPC at 1% concentration. Anin Vincely and Natarajan [15] conducted an experimental investigation with water based graphene oxide nanofluids in a FPC and attained augmented collector efficiency. Ajiwiguna et al. [16] obtained collector thermal efficiency of 54.6% using TiO2/water nanofluids flow in a FPC. Verma et al. [17] conducted exergy, energy efficiency, and entropy generation experiments utilizing many nanofluids flow in a FPC. The results showed energy efficiency enhancement of 4.1%, 5.1%, 8.3%, 12.6%, 16.9%, and 23.5%, using SiO2/water, TiO2/water Al2O3/water CuO/water, graphene/water, and multi-walled carbon nanotubes (MWCNTs)/water nanofluids at 0.75% particle loading.
The use of hybrid nanofluids in various thermal energy systems is a recently advanced topic and growing area. The hybrid nanofluids are prepared with hybrid nanoparticles dispersed in conventional fluids. Osho et al. [18] prepared Al2O3-ZnO/water hybrid nanofluid and investigated specific heat and viscosity experimentally. The results showed a specific heat decline of 30.1% and viscosity augmentation of 96.4% over the base fluid data. Sundar et al. [19] investigated heat transfer and friction factor for MWCNT-Fe3O4/water hybrid nanofluid circulates in a tube. Giwa et al. [20] experimentally studied heat transfer using 60:40 weight percentages of Al2O3:MWCNT/water hybrid nanofluid circulate in a square cavity. The results showed Nusselt number improvement of 16.2%, over the base fluid.
The use of hybrid nanofluids in solar flat plate collectors and direct absorption collectors are given below. Li et al. [21] examined the optical, stability, and thermal performance of SiC-MWCNT/ethylene glycol nanofluid circulate in a solar collector. The maximum thermal efficiency was 97.3% using 1 wt% SiC-MWCNT nanofluid. It was 48.6% greater than that of pure ethylene glycol data. Farajzadeh et al. [22] studied experimentally the efficiency of a FPC using Al2O3-TiO2, TiO2, and Al2O3 nanofluids. They obtained collector efficiency improvements of 26%, 21%, and 19% nanofluids at 0.1% weight percentage. Verma et al. [23] examined the performance of a FPC using MgO-MWCNT/water and CuO-MWCNT/water hybrid nanofluids. The results showed 71.54% exergetic efficiency and 70.55% energetic efficiency using MgO-MWCNT/water nanofluid. Okonkwo et al. [24] have noticed collector thermal efficiency improvement of 2.16% at 0.1 vol. % of alumina-water while and it is 1.79% at 0.1 vol. % of alumina-iron/water hybrid nanofluids over water data.
Very few research works are available dealing with the FPC thermal efficiency working with hybrid nanofluids. The studied hybrid nanofluids were alumina-iron, MgO-MWCNT/water, Al2O3-TiO2, and CuO-MWCNT/water nanofluids. The experiments were carried out under forced flow conditions in the FPC.
As far as we know, the hybrid nanofluids flow in the solar FPC under natural circulation (thermosyphon phenomenon) and its performance investigation did not present in the literature. Particularly the MWCNT + Fe3O4/water hybrid nanofluids flow in a FPC and their performance is not presented. The hybrid nanoparticles are considered because of their high magnetic property (Fe3O4) and thermal conductivity (MWCNT) and the final MWCNT + Fe3O4 hybrid nanoparticles have magnetic properties.
Accordingly, this study emphases on the experimental estimation of friction factor, heat transfer, and thermal efficiency of MWCNT + Fe3O4 hybrid nanofluids flow in a solar FPC at thermosyphon circulation of nanofluid. The MWCNT + Fe3O4 hybrid nanoparticles were synthesized utilizing the in-situ/chemical co-precipitation method. The hybrid nanofluids water-based with 0.05%, 0.1%, 0.2%, and 0.3% volume concentrations were prepared and utilized in the experiments. The experiments were performed during the daytime, from 09:00 a.m. to 4:00 p.m. The friction factor and Nusselt number correlations were suggested based on the experimental results.

2. Experimental Study

2.1. Materials

The multi-walled carbon nanotubes (MWCNTs) were procured from Nanocyl, Belgium, with a purity of ~95%, a length of 0.5–500 μm, and an outer diameter of 10–30 nm. The chemicals, such as ferric chloride (FeCl36H2O), nitric acid (HNO3), hydrochloric acid (HCL), ferrous chloride (FeCl24H2O), and sodium hydroxide (NaOH) were purchased and without purification from Sigma-Aldrich Chemicals, Burlington, USA.

2.2. Acid Treatment on MWCNT

The proposed procedure by Sundar et al. [19] is followed to synthesize the bulk quantity of MWCNT + Fe3O4 nanoparticles. Preparing hybrid nanoparticles with as purchased MWCNT is a little bit difficult because the attachment covenant bond or carboxyl (–COOH) bond is required. The purchased MWCNT does not contain –COOH bonding on the surface. In order to obtain the –COOH bonding, a strong acid treatment technique is used. The MWCNT was dispersed in strong chemicals of 1:3 M of hydrochloric acid and nitric acid up to 3 days under very speed with a magnetic stirrer at 60 °C. After that, the acid-treated, MWCNT was washed with a distilled water several times then dried at 80 °C for 24 h. This method provides the formation of –COOH bond on the surface of MWCNT, through the –COOH layer, the Fe3O4 nanoparticles attached to MWCNT.

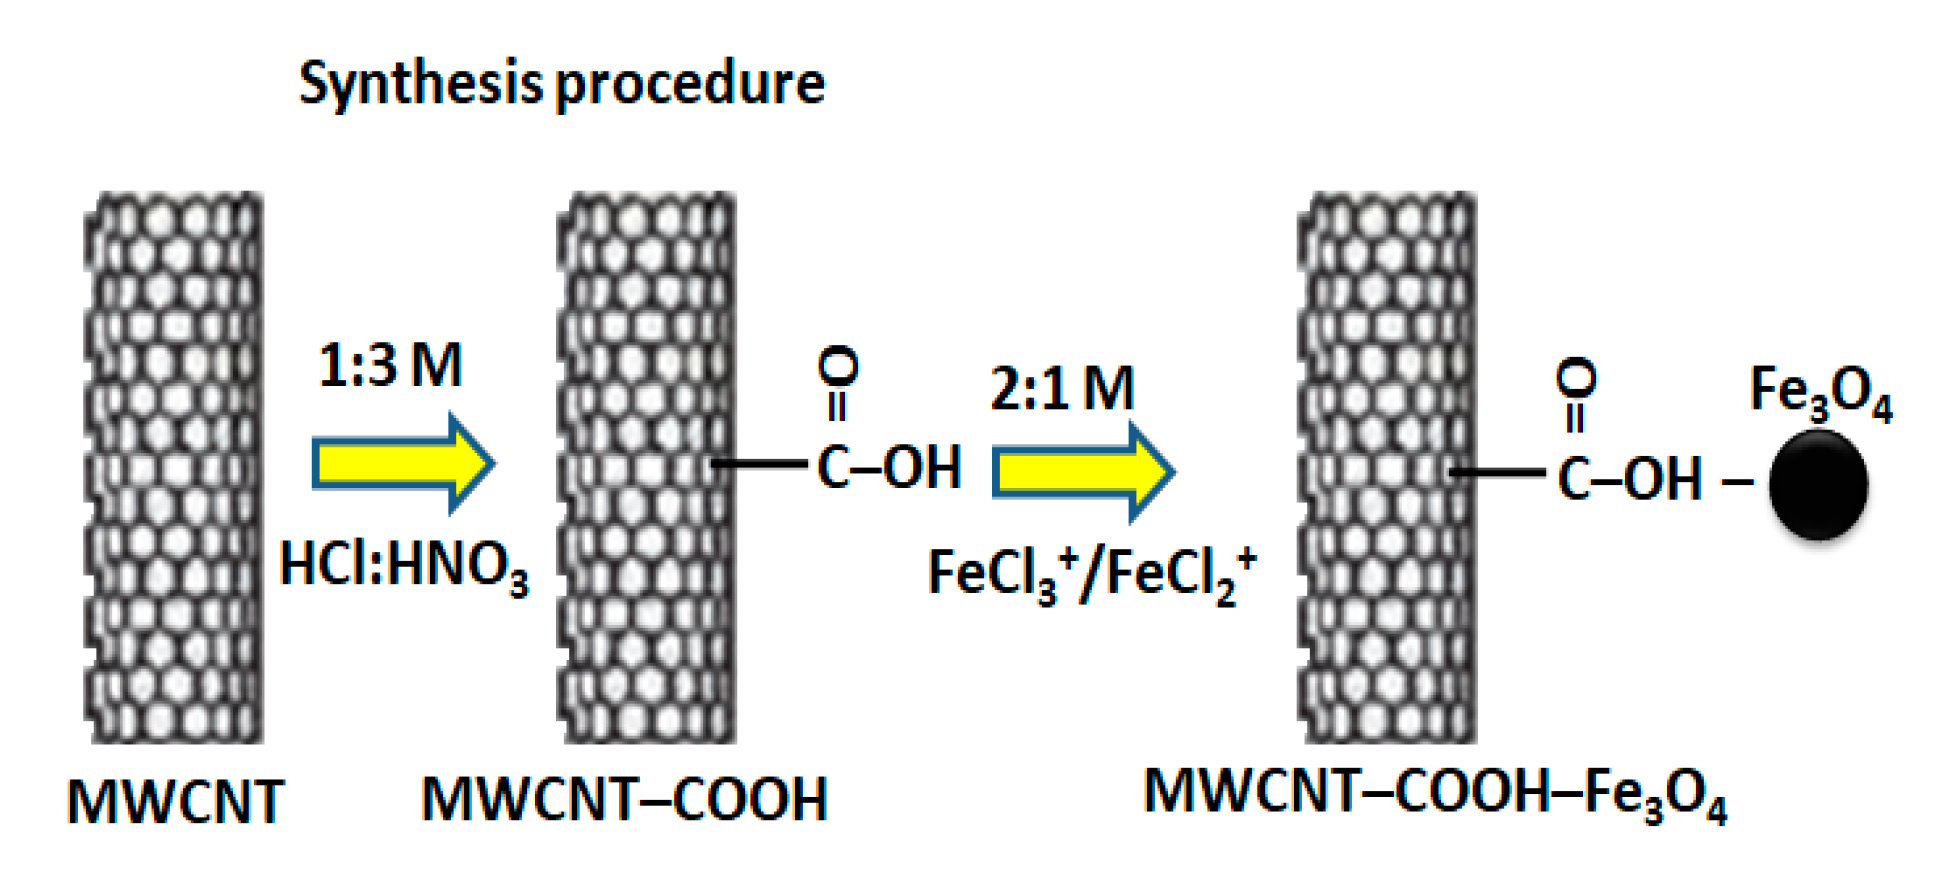
2.3. Synthesis of MWCNT + Fe3O4 Hybrid Nanoparticles

The method of in-situ growth and chemical coprecipitation was adopted for MWCNT + Fe3O4 hybrid nanoparticles. The synthesis procedure is indicated in Figure 1. The MWCNT-–COOH of 0.35 g was diluted in 100 mL of water and then stirred for 1 h, later added 2:1 M ratio of FeCl3+/FeCl2+ iron salts and stirs continuously. Once the iron salts are fully diluted in MWCNT solution, the solution becomes a light orange color, then add water-diluted NaOH slowly and maintain the solution pH to 12. After 10 min, observe the formation of black colored precipitation, which indicates the reaction is completed. During the chemical reaction for the conversion of iron salts to magnetite (Fe3O4), the Fe3O4 nanoparticles are attached to the MWCNT through the –COOH layer. This –COOH is very thin and it will no effect the properties and heat transfer characteristics of the fluid, while they dispersed in water. The chloride, sodium, and hydrogen impurities are removed by washing precipitate several times with water. The washed precipitate was dried at 80 °C for 24 h. The pure Fe3O4 nanoparticles were also prepared for comparison purpose based on the same procedure, but without adding the MWCNT to the distilled water.

2.4. Characterization of MWCNT + Fe3O4 Hybrid Nanoparticles

The prepared MWCNT + Fe3O4 hybrid nanoparticles were characterized with x-ray diffractometer, XRD, (Siemens D-500, 40 mA, 45 kV), and scanning electron microscopy, SEM, (Hitachi; SU-70). The magnetic property of MWCNT + Fe3O4 hybrid nanoparticles was measured with a vibrating sample magnetometer (VSM, Cryogenic, UK).
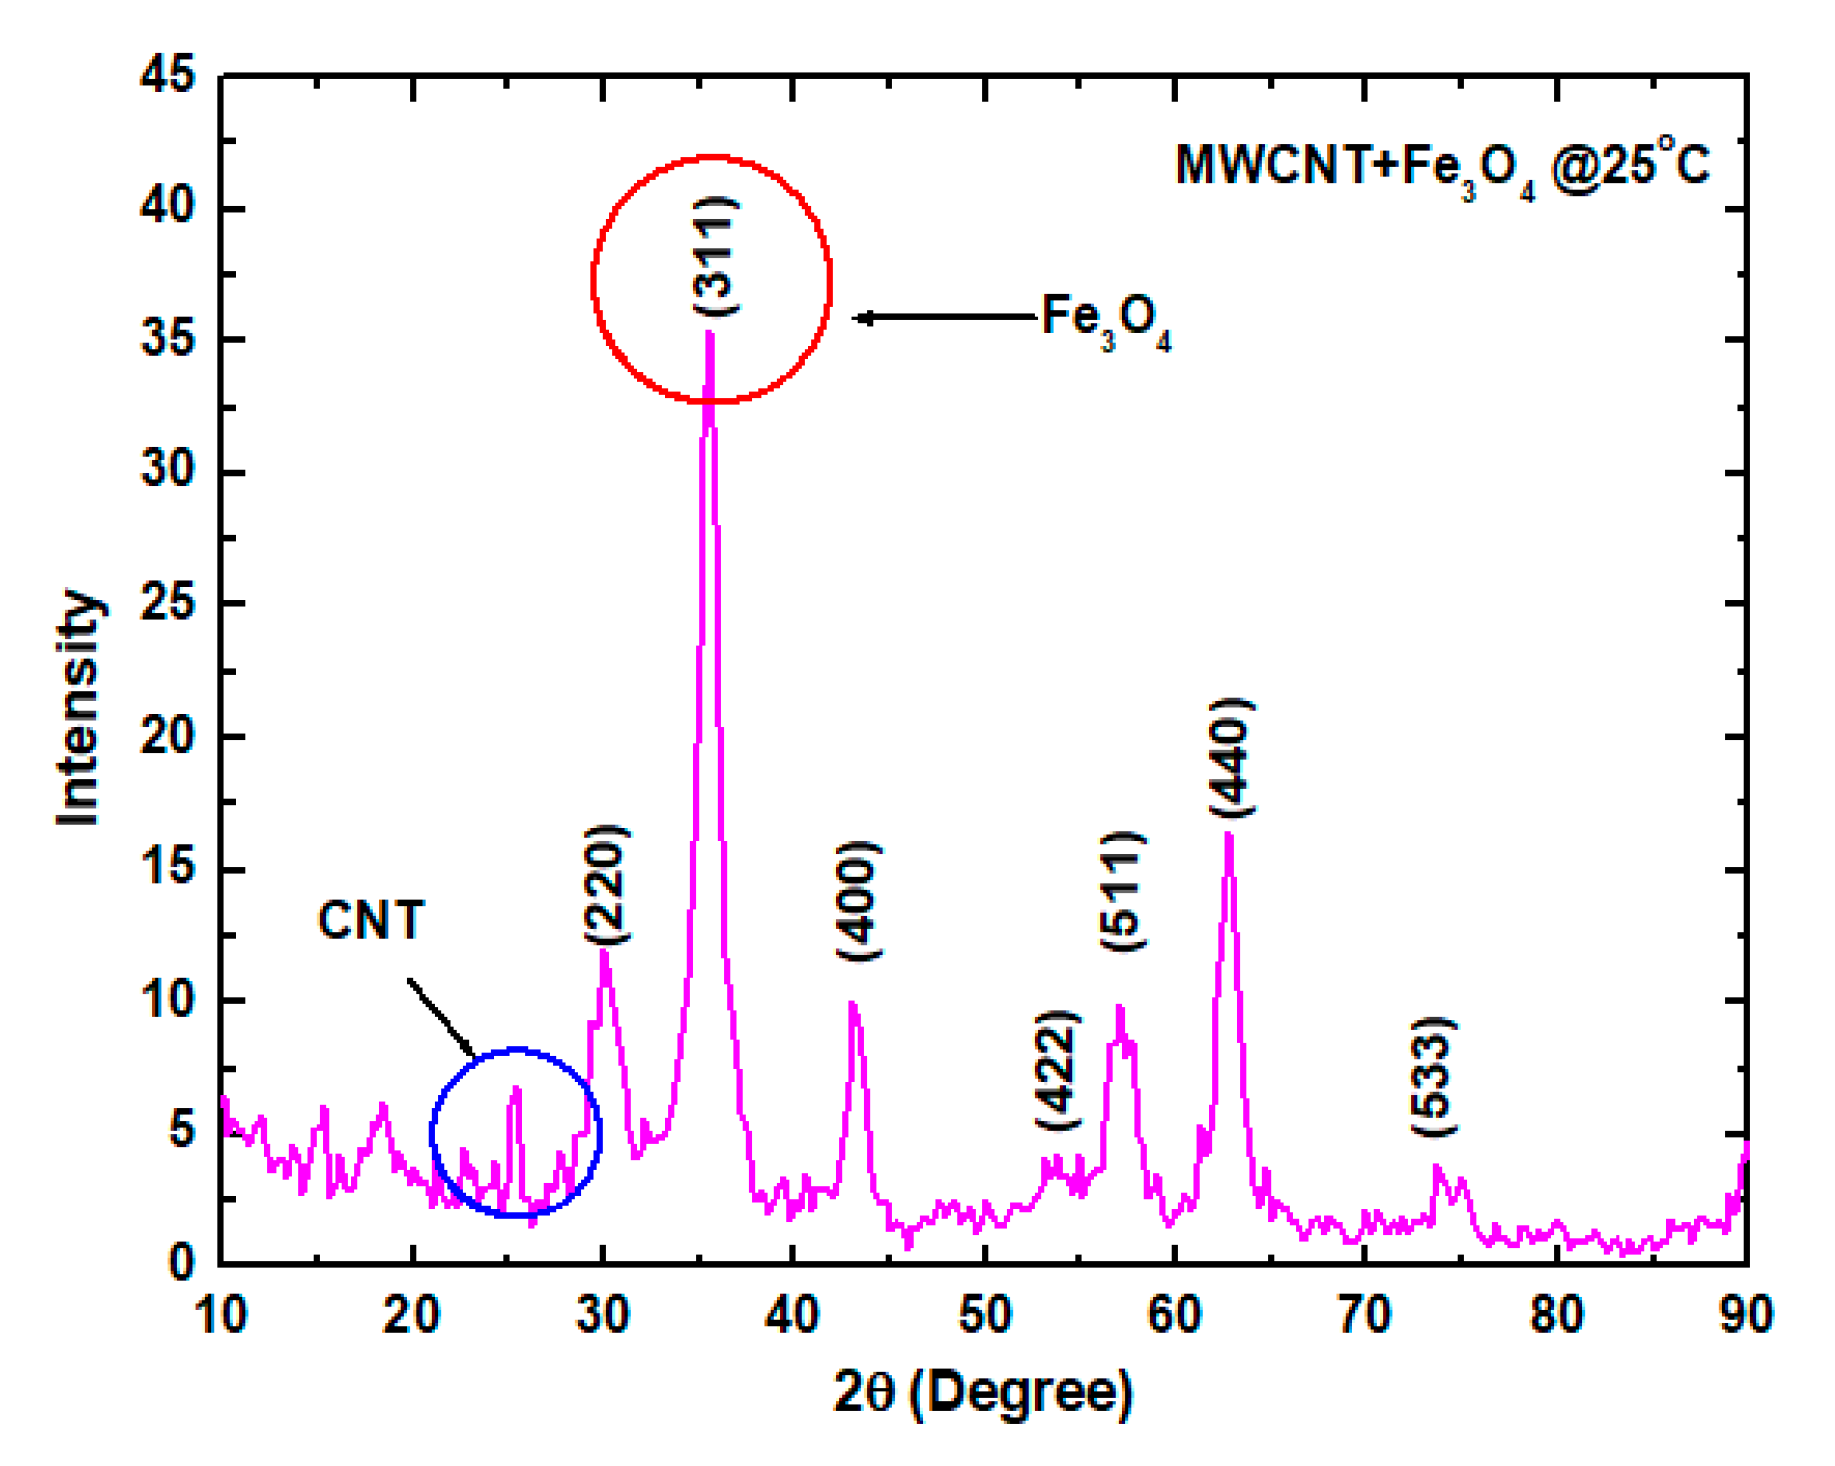
The MWCNT + Fe3O4 nanocomposite XRD patterns is presented in Figure 2 Sundar et al. [19]. The diffraction peak, 2θ = 34.5° that could be (3 1 1) reflected to magnetite (Fe3O4) nanoparticles. Likewise the diffraction peak, 2θ = 26° that could be (0 0 2) reflected to MWCNT. The analysis indicates that the samples contains two phases of MWCNT and cubic Fe3O4. The other peaks with comparatively high peak intensity can be classified as face-centered cubic Fe3O4. There is no noticeable peaks from other phases. The core peaks of Fe3O4 in the XRD pattern are widened, demonstrating that the crystalline sizes of Fe3O4 nanoparticles are too small.
The SEM results for synthesized MWCNT + Fe3O4 nanocomposite are displayed in Figure 3 Sundar et al. [19]. It can be concluded from the figure that the particles are in cubic shape and the Fe3O4 nanoparticles are attached to the MWCNT surface.
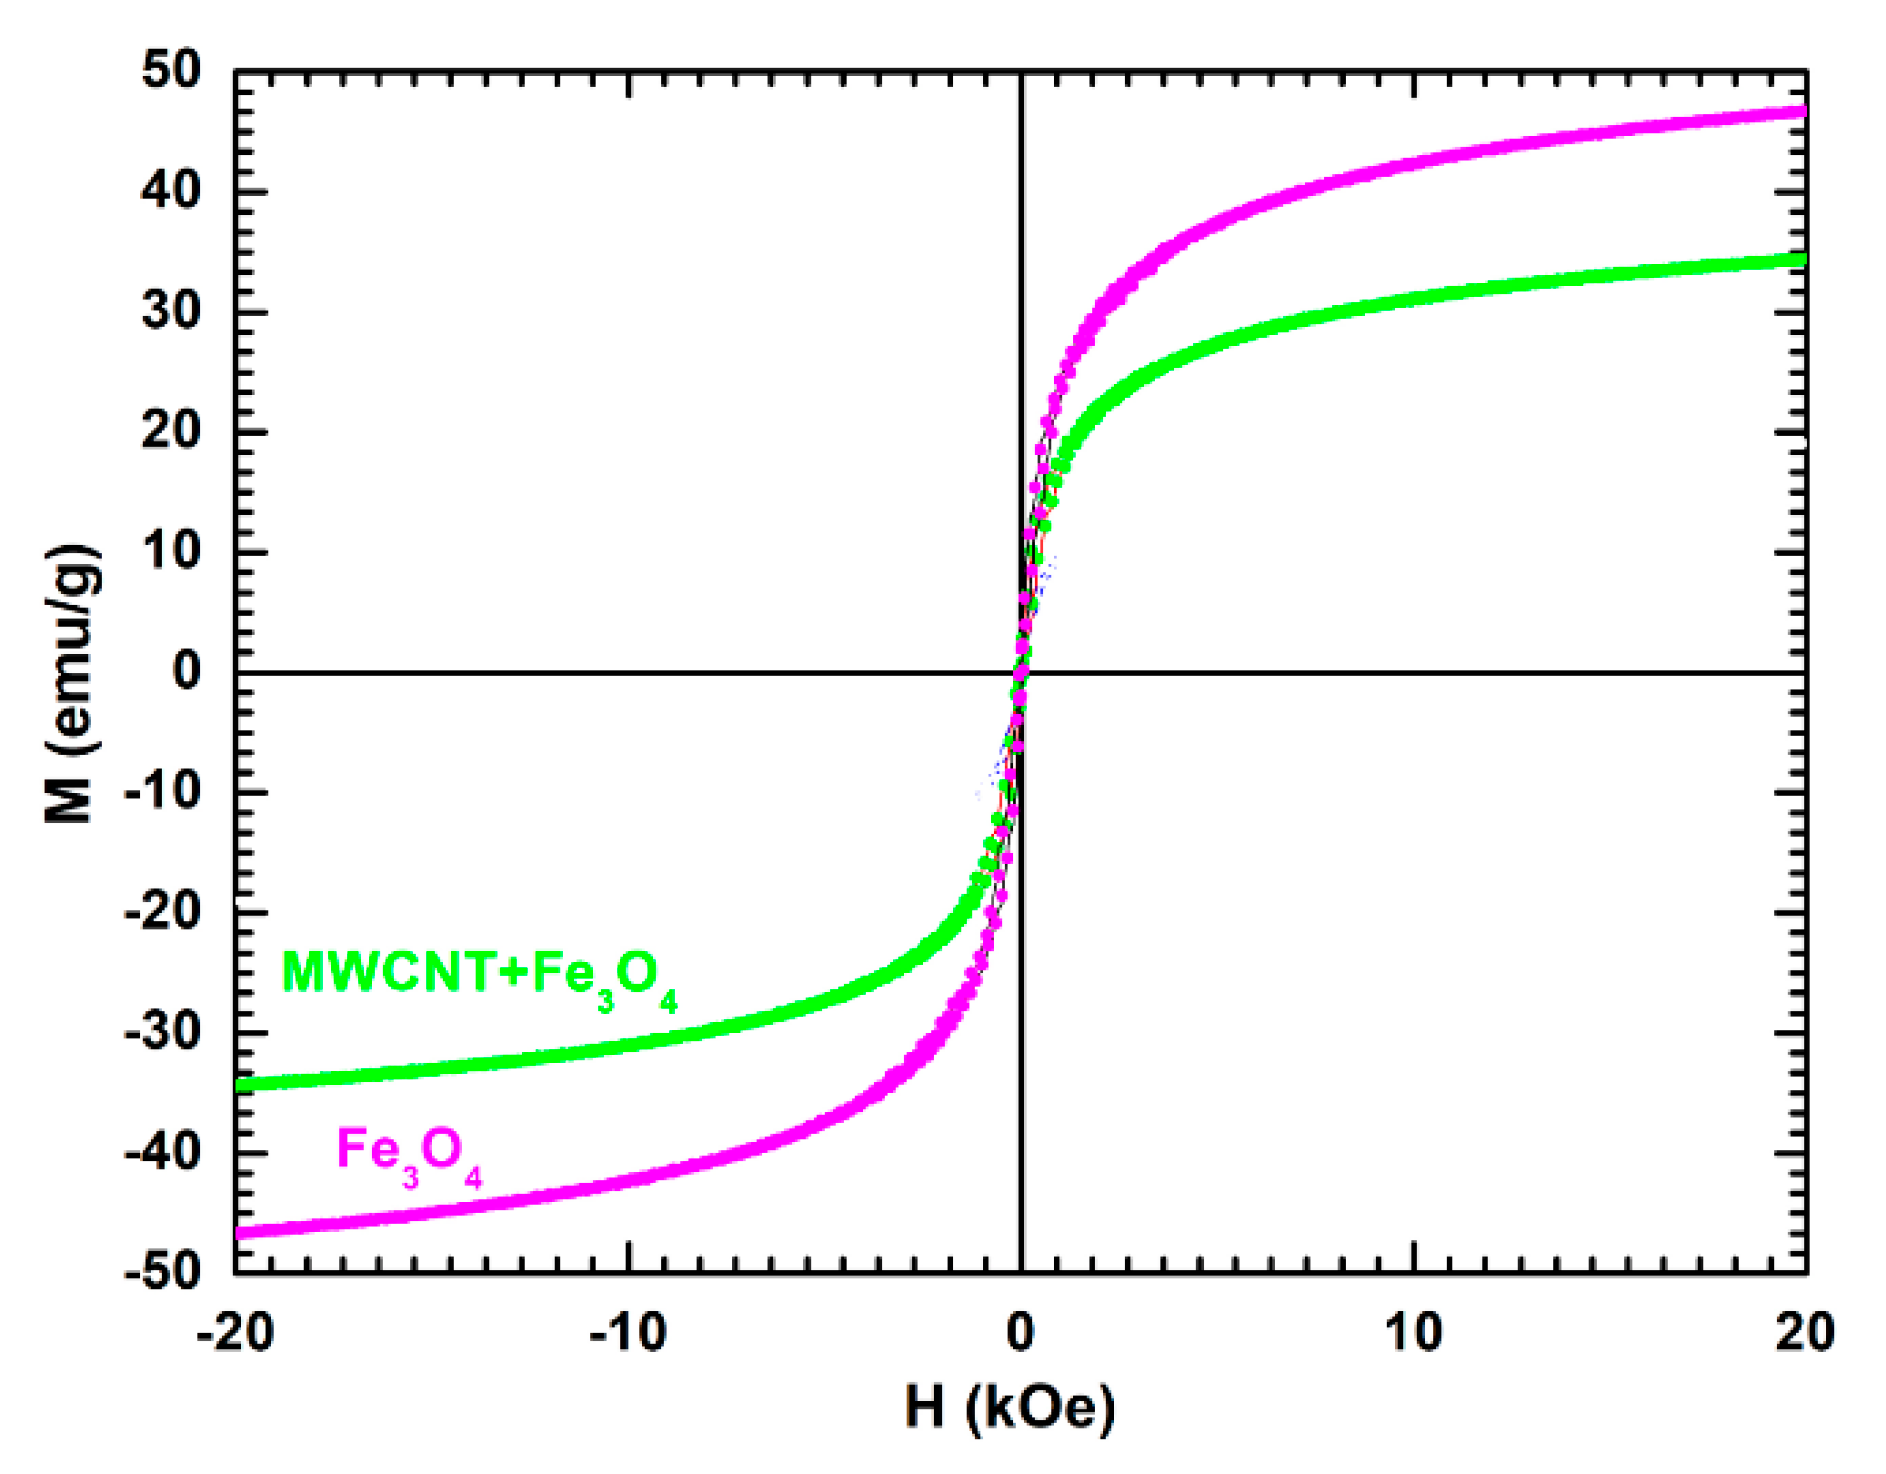
The pure Fe3O4 and MWCNT + Fe3O4 nanocomposite magnetic properties were examined by measuring their magnetization–magnetic field (M–H) hysteresis loops with a VSM. The ferromagnetic behavior of the MWCNT–Fe3O4 sample as well as Fe3O4 are shown in Figure 4. The saturation magnetization for Fe3O4 nanoparticles and MWCNT + Fe3O4 nanocomposite is 47, and 34.5 emu/g, respectively. The decrease in the nanocomposite magnetization because of the huge non-magnetic MWCNT in the matrix of MWCNT + Fe3O4. In the existence of the magnetic field, the nonmagnetic particle act as a void, which break the magnetic circuit. This leads to the decrease of magnetization with the growth of void concentration.

2.5. Physical Properties of MWCNT + Fe3O4 Nanoparticles

According to the total sum rule of composites, the individual weights of MWCNT, Fe3O4 are estimated. The below equations are used for the weight percentage calculations.
MWCNT   ( wt .   % )   =   s a t u r a t o n   m a g n e t i z a t i o n   o f   M W C N T s a t u r a t i o n   m a g n e t i z a t i o n   o f   F e 3 O 4 × 100 = 12.5   emu / g 47   emu / g × 100 = 26 %
F e 3 O 4   ( wt .   % )   =   s a t u r a t o n   m a g n e t i z a t i o n   o f   M W C N T + F e 3 O 4 s a t u r a t i o n   m a g n e t i z a t i o n   o f   F e 3 O 4 × 100 = 34.5   emu / g 47   emu / g × 100 = 74 %
From the calculations, it is noticed that the MWCNT + Fe3O4 sample contains 26% MWCNT and 74% Fe3O4. It means that each 1 g sample of MWCNT–Fe3O4 contains 0.74 g Fe3O4 and 0.26 g MWCNT, These weight percentages are used for further calculations.
The physical properties such as specific heat, thermal conductivity, and density of MWCNT–Fe3O4 were calculated based on the law of mixtures as follows:
k ( M W C N T   +   F e 3 O 4 ) p = k M W C N T × W M W C N T + k F e 3 O 4 × W F e 3 O 4 W M W C N T + W C o 3 O 4
ρ ( M W C N T   +   F e 3 O 4 ) p = ρ M W C N T × W M W C N T + ρ F e 3 O 4 × W F e 3 O 4 W M W C N T + W F e 3 O 4
C p ( M W C N T   +   F e 3 O 4 ) p = C p M W C N T × W M W C N T + C p F e 3 O 4 × W F e 3 O 4 W M W C N T + W F e 3 O 4
where, k M W C N T ,   ρ M W C N T ,   C p M W C N T and k W F e 3 O 4 ,   ρ W F e 3 O 4 , C p W F e 3 O 4 are the thermal conductivity, density, and specific heat of MWNCT and Fe3O4, respectively. W M W C N T and W F e 3 O 4 are the weights of MWCNT and Fe3O4, respectively.
The calculated thermal conductivity, density, and specific heat of MWCNTFe3O4 nanomaterial are shown in Table 1.

2.6. Preparation of MWCNT + Fe3O4 Hybrid Nanofluids

A quantity of 10 l hybrid nanofluids prepared in volume concentrations of 0.05%, 0.1%, 0.2, and 0.15%. The required hybrid nanoparticles are calculated by Equation (6).
ϕ × 100 = [ W M W C N T + F e 3 O 4 ρ M W C N T + F e 3 O 4 ] [ W M W C N T + F e 3 O 4 ρ M W C N T + F e 3 O 4 ] + [ W b f ρ b f ]
Here, ϕ is % of volume concentration, ρ M W C N T + F e 3 O 4 = 4845.4 kg/m3, Wbf = 10,000 g, W M W C N T   +   F e 3 O 4 is the weight of hybrid nanoparticles and ρ b f = 998.5 kg/m3.
The quantities of 24.2 g, 48.5 g, 97.2 g, and 146 g of hybrid nanoparticles were dispersed in 10 kg of distilled water to prepare 0.05%, 0.1%, 0.2%, and 0.3% volume concentrations. For, ϕ = 0.05%, 24.2 g of synthesized MWCNT + Fe3O4 is directly dispersed in 10 l of distilled water and then stirred with a mechanical stirrer at low speed for 2 h. The same technique was used for the other nanofluid concentrations.

2.7. Properties of MWCNT + Fe3O4 Hybrid Nanofluids

To estimate the hybrid nanofluids heat transfer coefficient, the properties such as specific heat, viscosity, thermal conductivity, and density are significant. The hybrid nanofluids viscosity and thermal conductivity are experimentally assessed, while the hybrid nanofluids density and specific are assessed based on the mixtures law.
The KD-2 pro thermal properties analyzer (Decagon Devices Inc., Pullman, WA, USA) used to measure the thermal conductivity. The Vibro Viscometer (A&D Vibro Viscometer, SV-10, Tokyo, Japan) used to measure the viscosity. The measured thermal conductivity is presented in Figure 5, along with the base fluid data. Thermal conductivity of hybrid nanofluid increased with the increase of particle volume concentrations and temperatures. With the particle volume loadings of 0.05%, 0.1%, 0.2%, and 0.3% the thermal conductivity enhancement is 5.93%, 11.86%, 12.87%, and 13.88% at 20 °C, however it further enhanced by 10.42%, 20.84%, 24.65%, and 28.46% at 60 °C, respectively, over the base fluid.
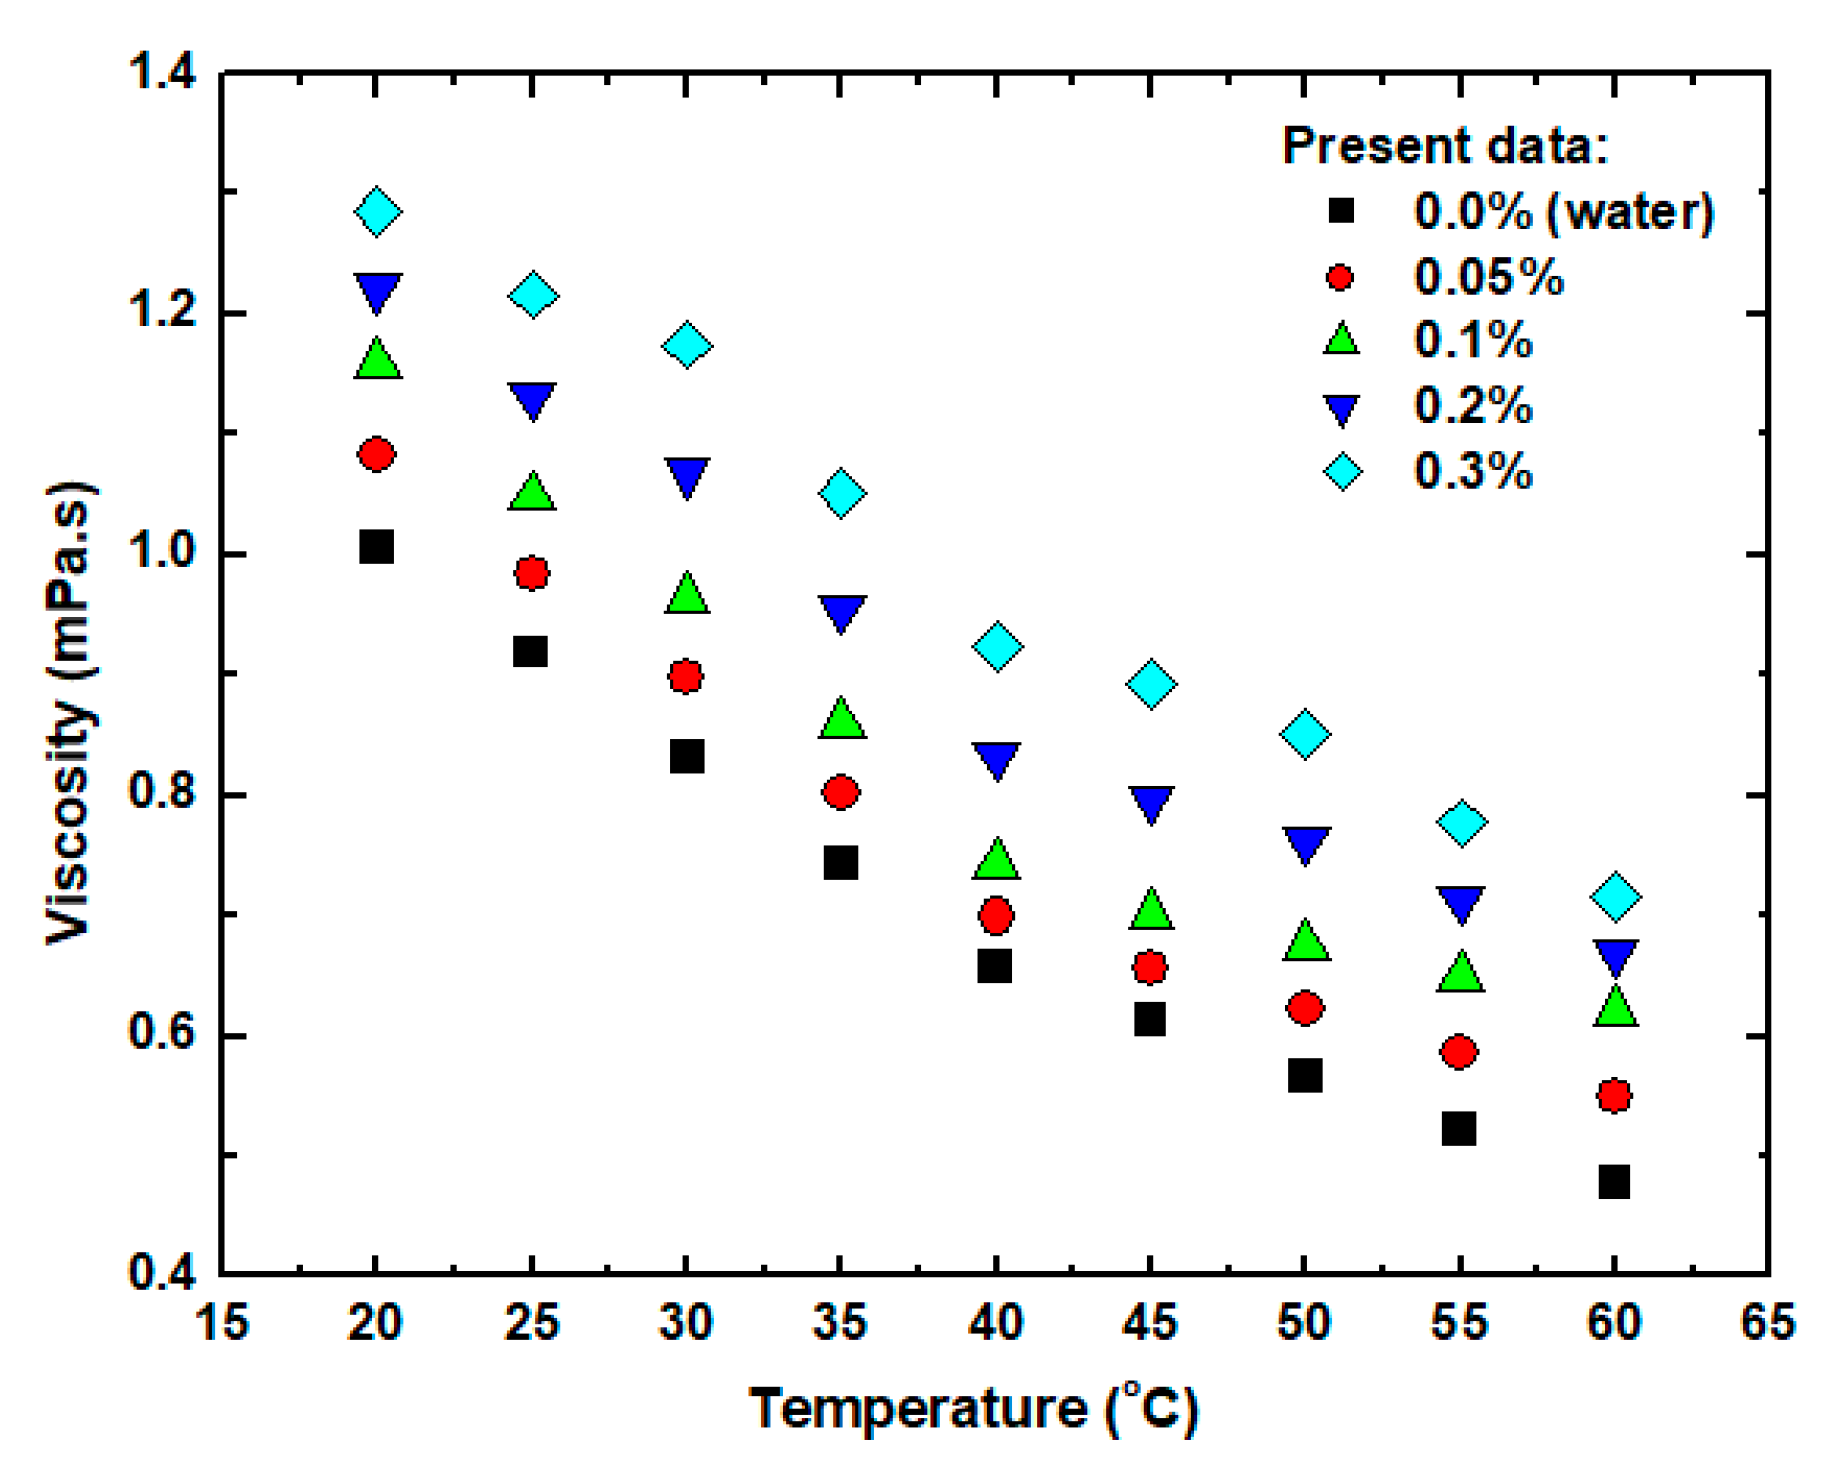
The measured viscosity is presented in Figure 6 along with the base fluid data. Hybrid nanofluid viscosity increased with the increase of particle volume concentrations and temperatures. With the particle volume loadings of 0.05%, 0.1%, 0.2%, and 0.3%, the viscosity enhancement is 7.59%, 15.18%, 21.51%, and 27.84% at 20 °C, however it is further enhanced to 15.1%, 29.8%, 40.3%, and 50.4% at 60 °C, respectively, over the base fluid data.
The hybrid nanoparticles specific heat and density were calculated by Equations (4) and (5) and substituted in Equations (7) and (8) to get the hybrid nanofluids specific heat and density.
C p , h n f = ( 1 ϕ ) C p , w a t e r +   ϕ C p , M W C N T   +     F e 3 O 4
where, C p , h n f is the hybrid nanofluids specific heat (J kg−1 K−1), C p , w a t e r is water specific heat (4178 J kg−1 K−1), and C p , M W C N T   +   F e 3 O 4 is the MWCNT + Fe3O4 nanoparticles specific heat (680.66 J kg−1 K−1).
The MWCNT + Fe3O4 hybrid nanofluids density is calculated by Equation (8).
ρ p , n f = ( 1 ϕ ) ρ p , w a t e r +   ϕ ρ p , M W C N T + F e 3 O 4
where, ρ p , h n f is the density of hybrid nanofluid (kg m−3), ρ p , w a t e r is the density of water (997.5 kg m−3), and ρ p ,   M W C N T + F e 3 O 4 is the density of the MWCNT + Fe3O4 nanoparticles (4845.4 kg m−3).
The measured and calculated thermophysical properties of hybrid nanofluids are provided in Table 2, Table 3, Table 4 and Table 5. The hybrid nanofluids thermophysical properties are utilized to calculate the efficiency, friction factor, and heat transfer.

2.8. Flat Plate Collector

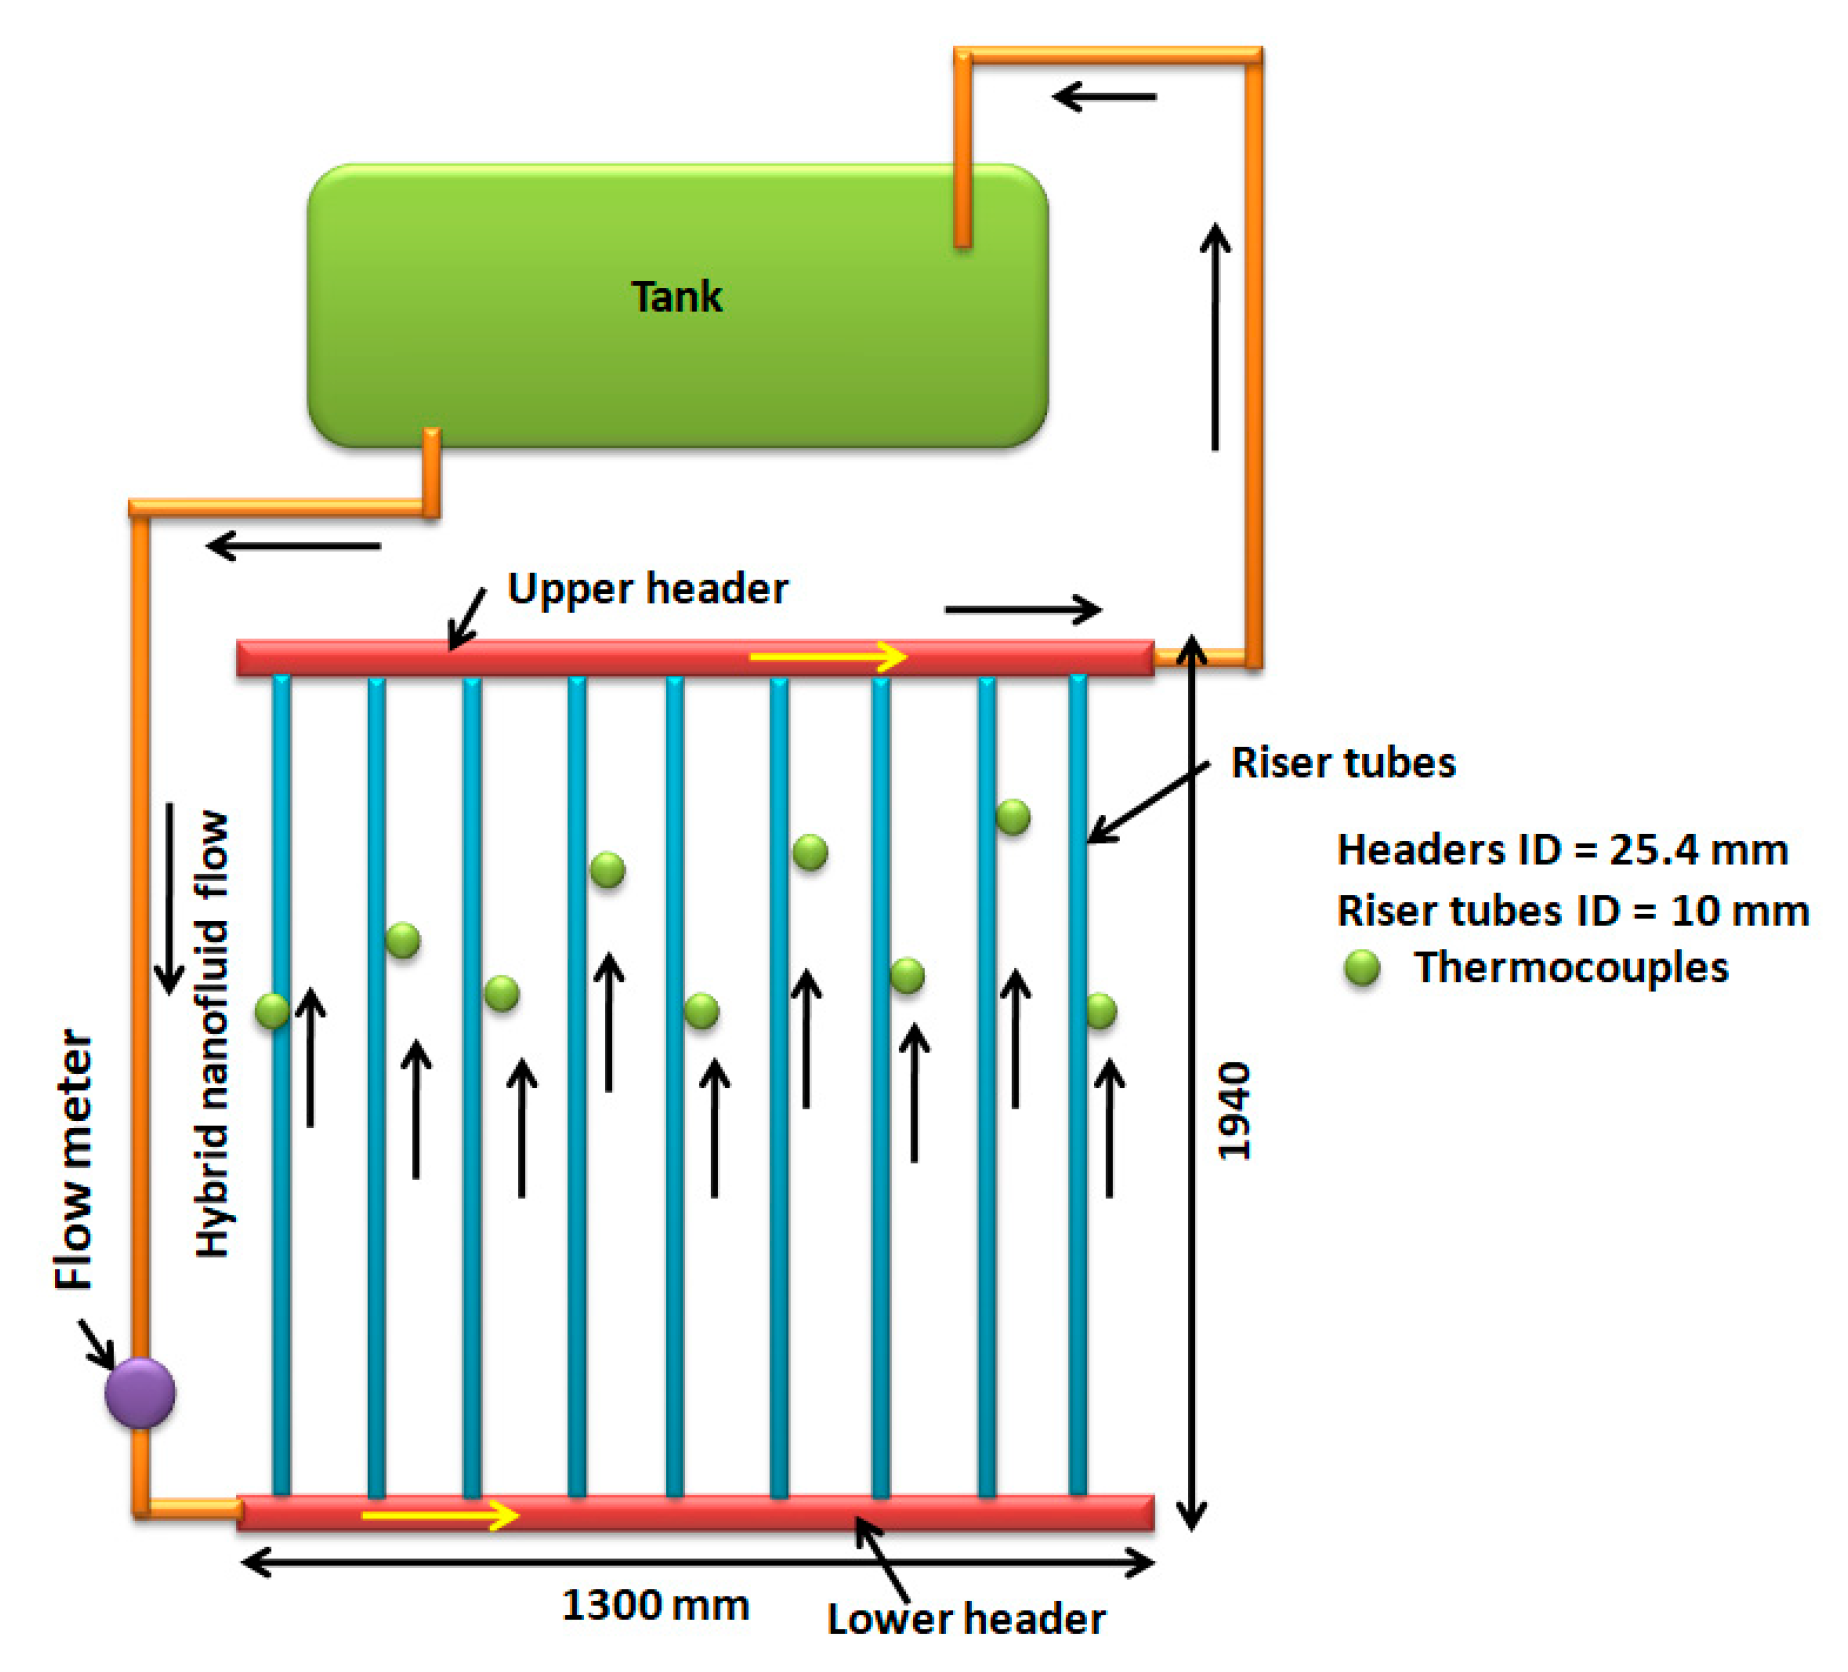
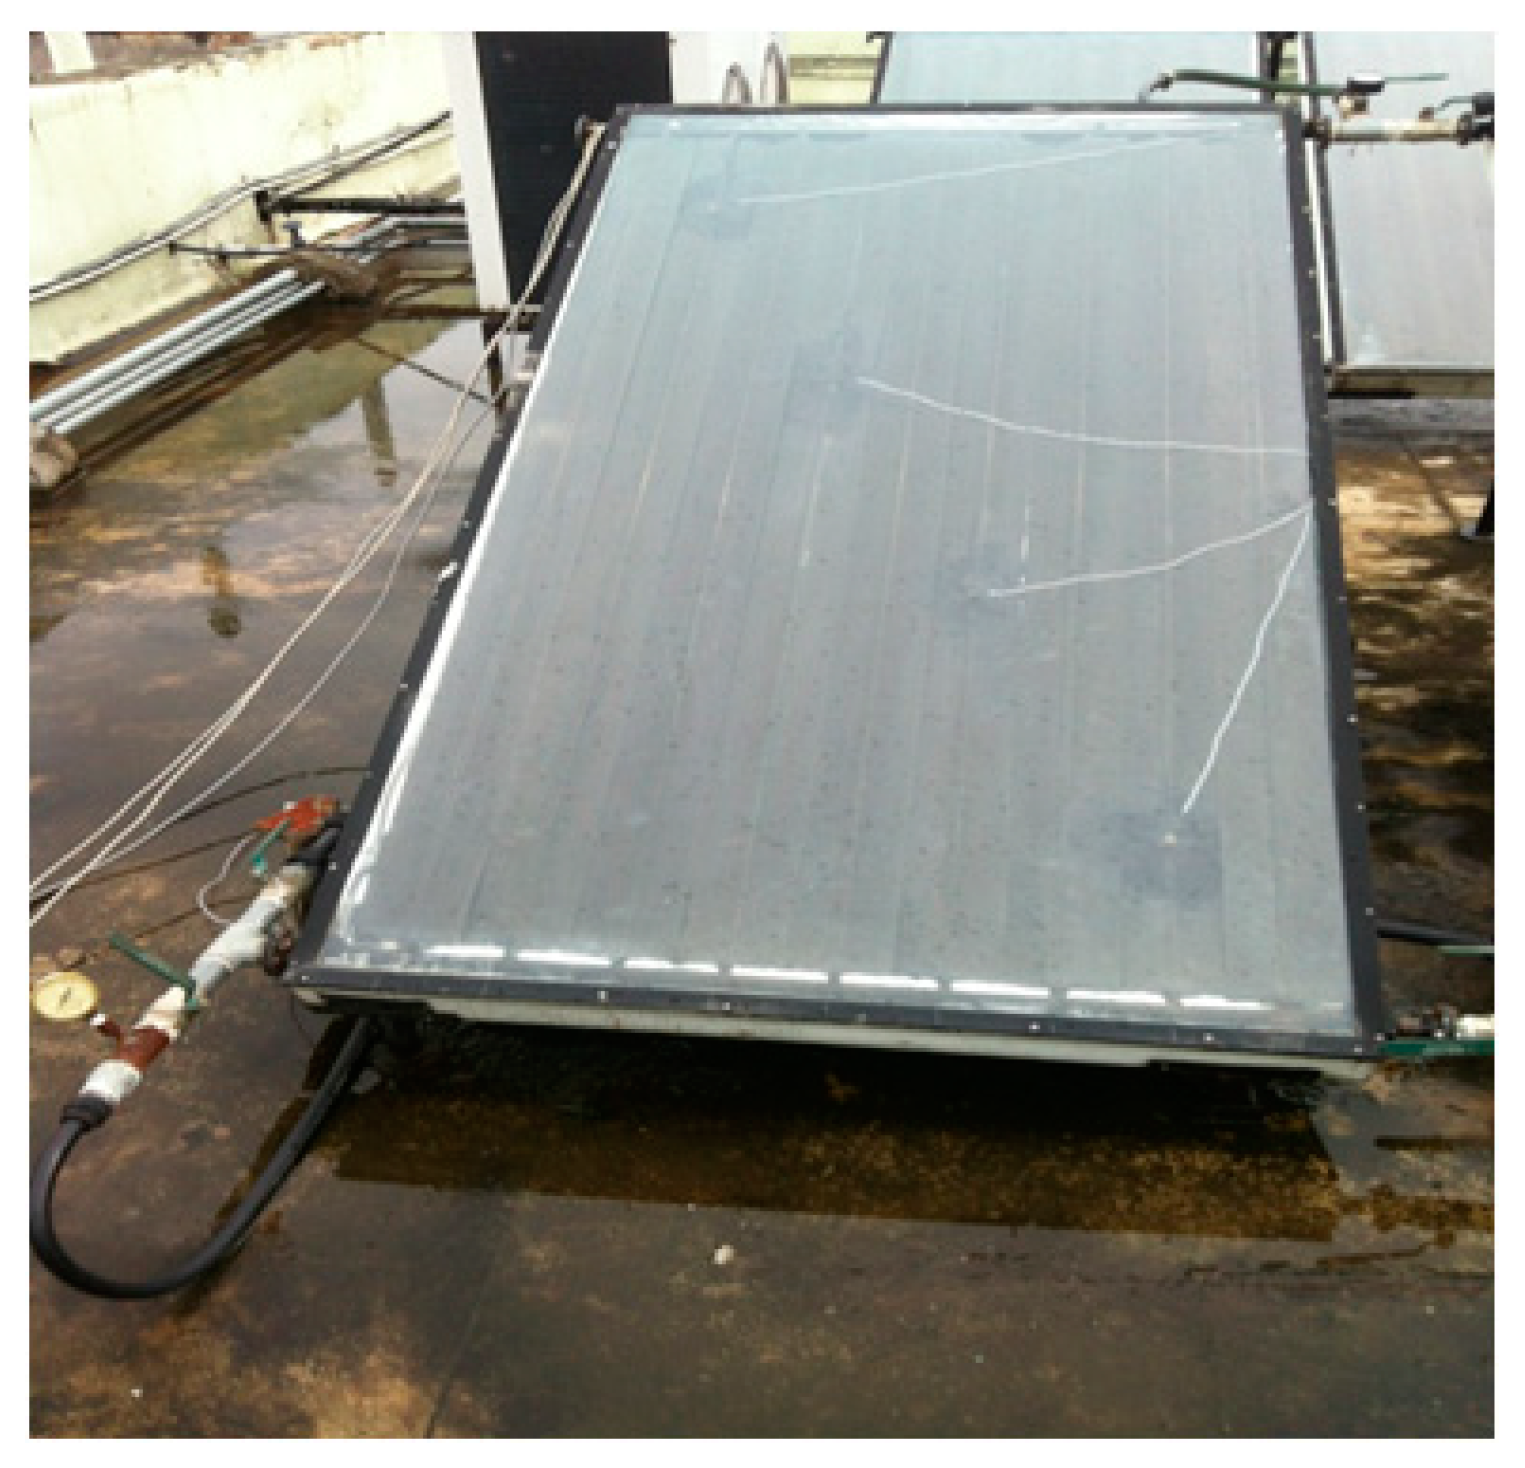
A schematic diagram of the solar FPC is illustrated in Figure 7 and a photo is displayed in Figure 8. The FPC characterizations are presented in Table 6. The core parts are the inlet and outlet headers, insulated tank, and flow meter. Twenty-kilogram hybrid nanofluids or water circulates in the FPC and the collector placed at a tilt of 20°. The hybrid nanofluids or water flow rate is measured by a flow meter. The absorber fluid first enters the inlet header of 25.4 mm diameter, and then flows into the riser tubes with 10 mm inner diameter and 12 mm outer diameter. After that enters the insulated tank across 25.4 mm outlet header diameter. The headers and riser tubes are made of copper material. Twelve J-type thermocouples were used to measure the temperatures. Nine thermocouples were utilized for surface temperature measurements ( T 1 T 9 ) , one thermocouple ( T 10 ) was utilized for the ambient temperature measurement, and two thermocouples were utilized for the inlet and outlet temperatures measurement. The thermocouples needles are connected to a computer across a data logger. An aluminum sheet black-coated was utilized to cover the tubes of the riser and over it a cover glass is used. The fluid flows in the tubes under the buoyancy force. To decrease heat loss, the right, left sides, and the bottom of the collector is insulated with glass wool. Solar radiation was measured by a pyranometer. Yokogawa differential pressure transducer was utilized to measure the pressure drop. The experiments carried out from 09:00 a.m. to 4:00 p.m. in May 2019.
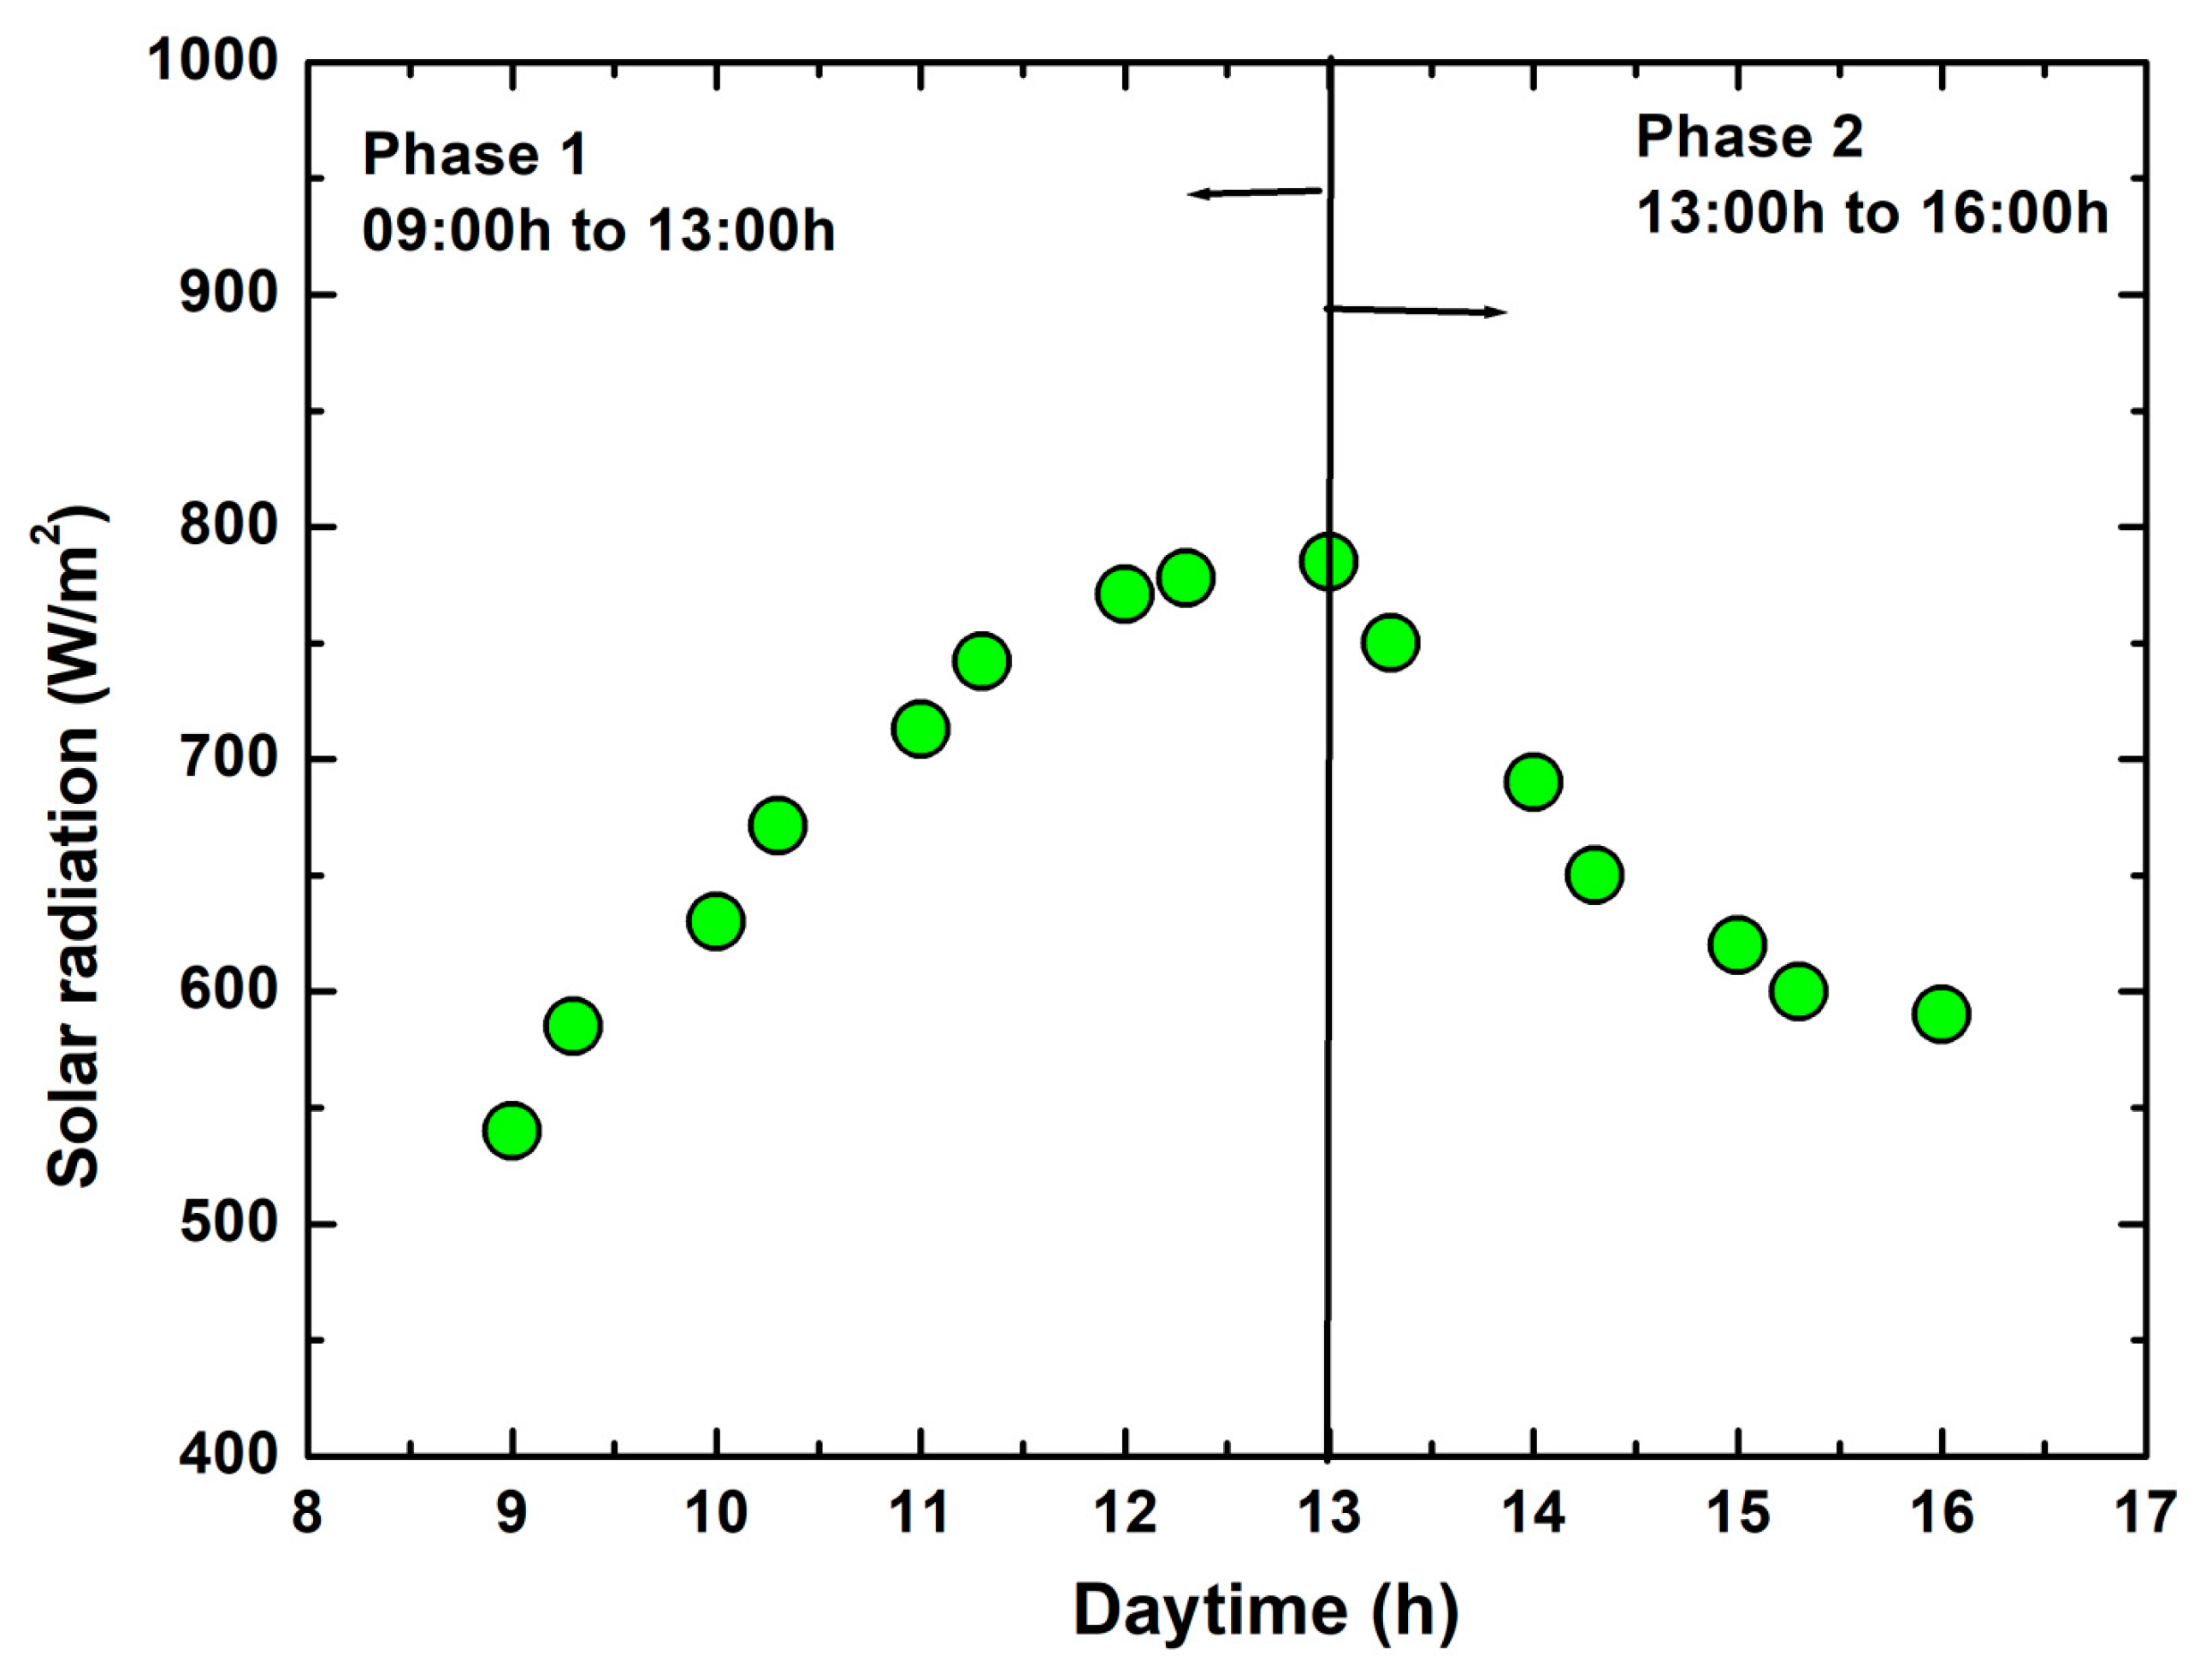
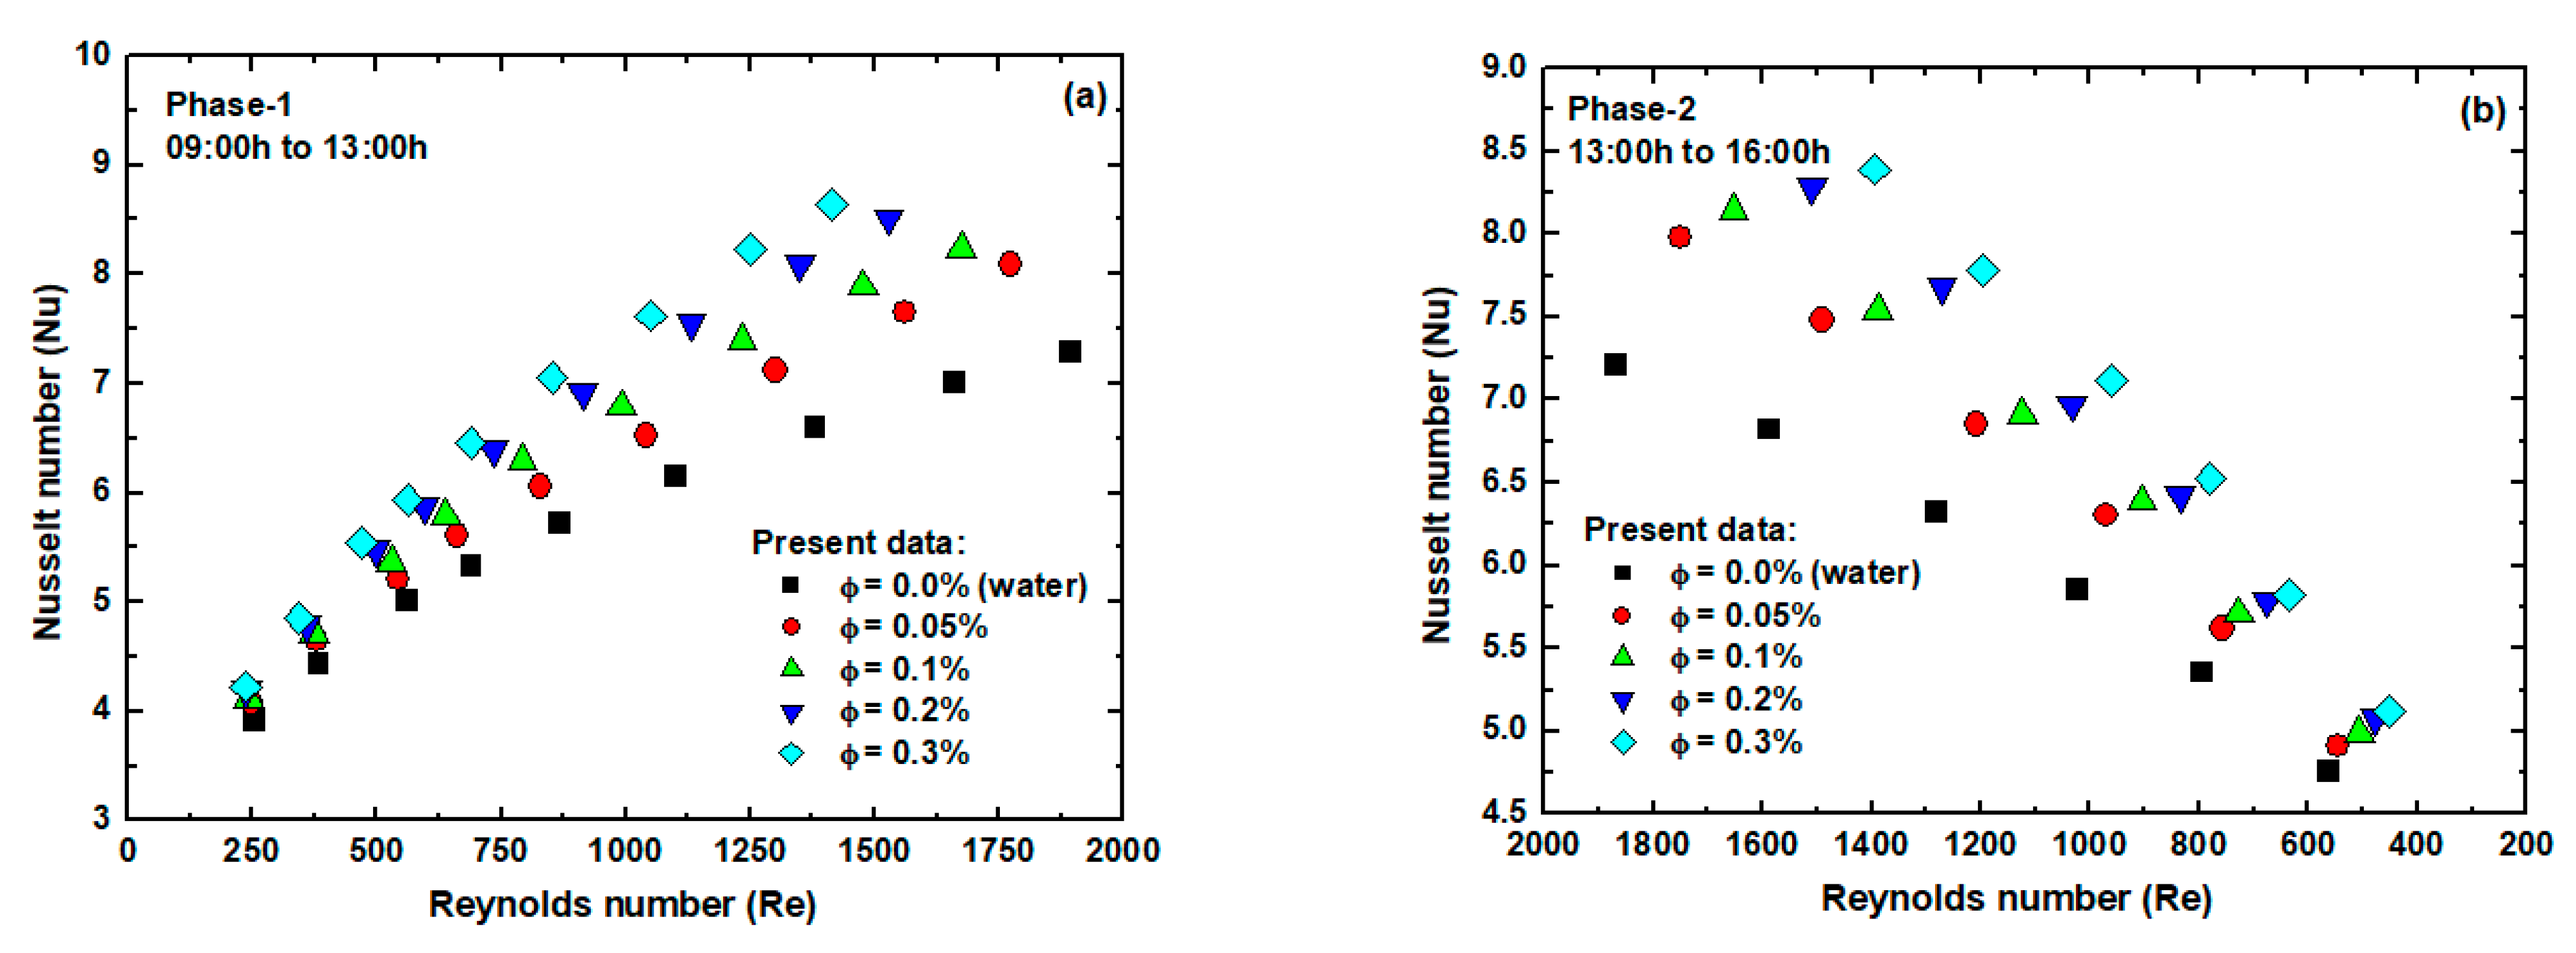
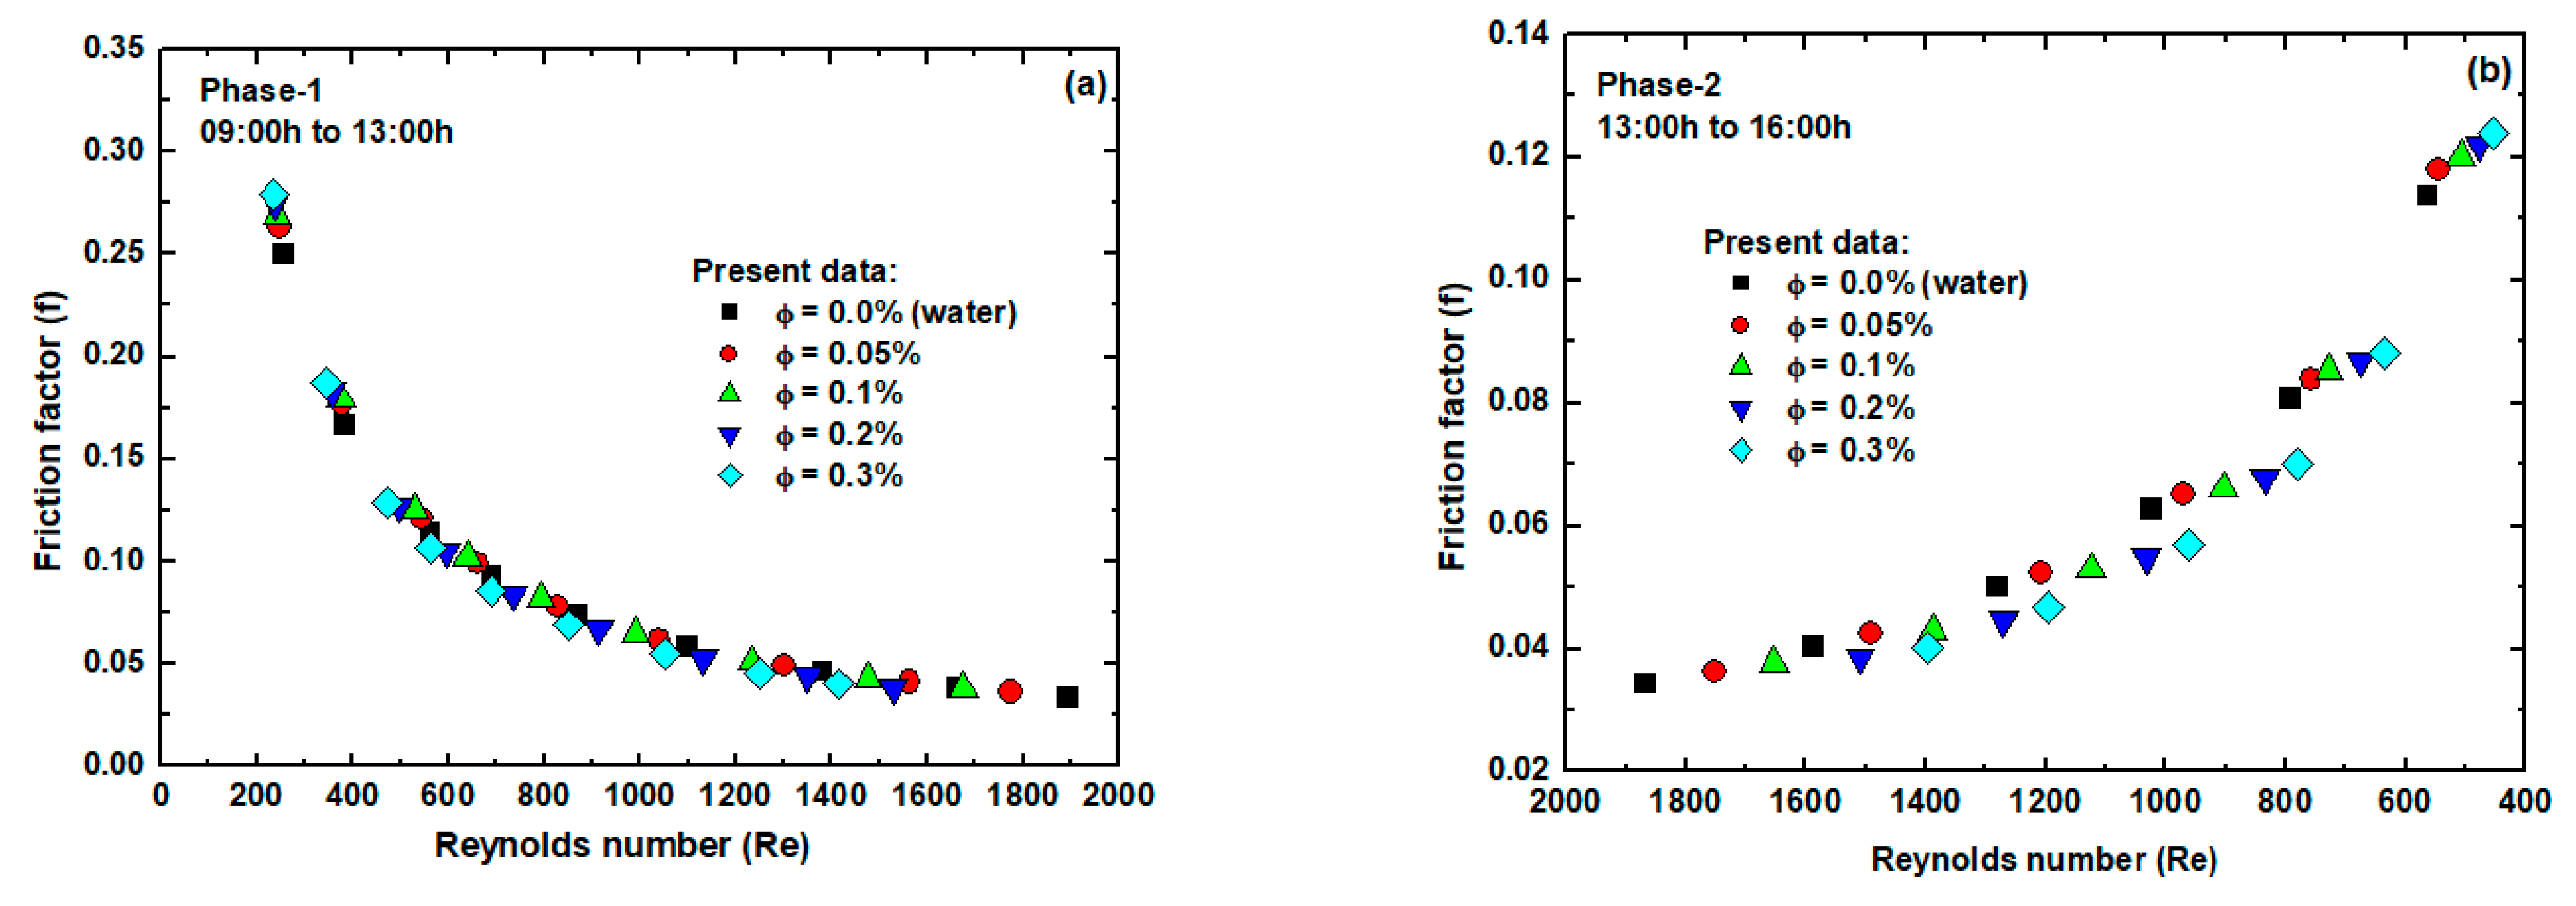
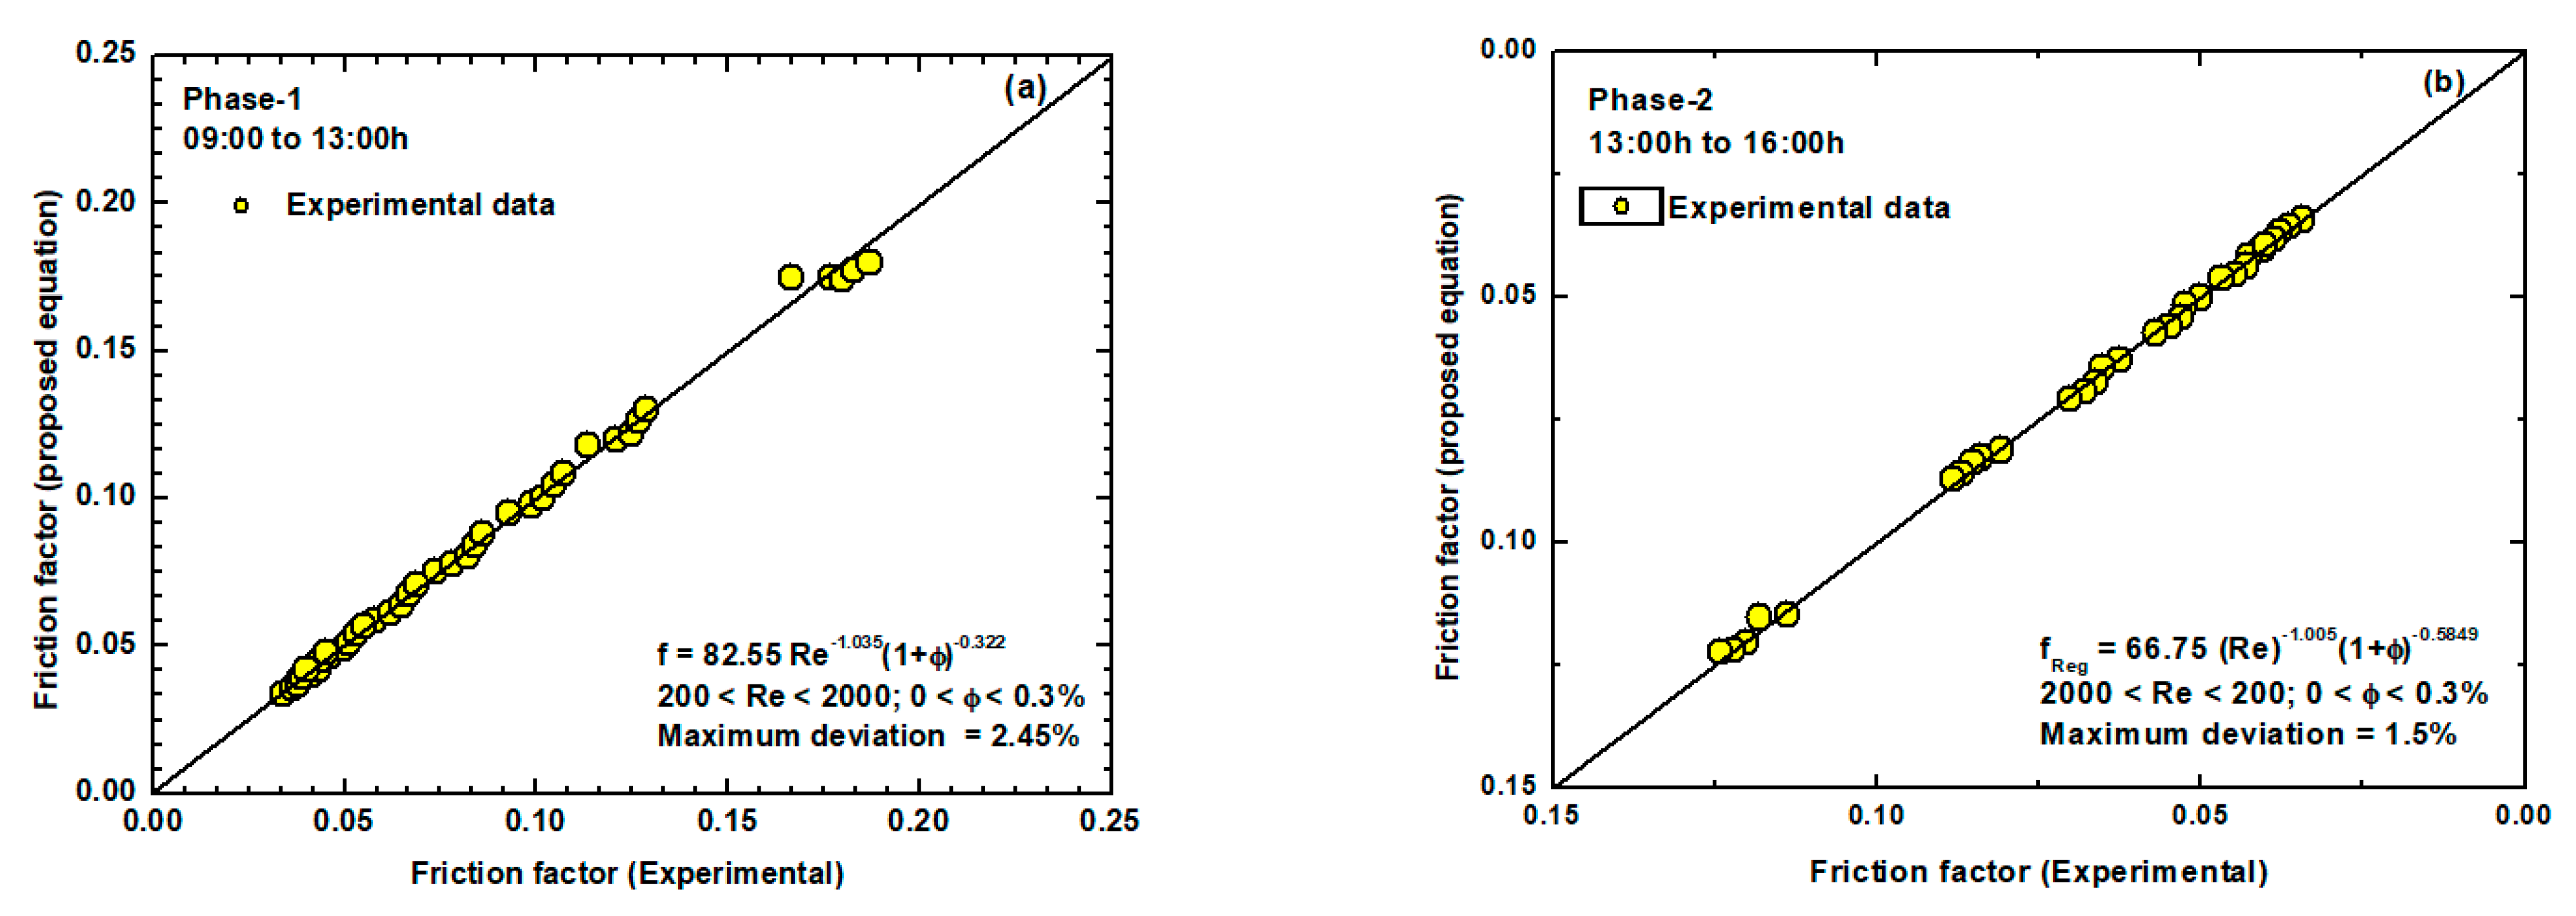
Solar radiation at different intervals of time from 09:00 a.m. to 4:00 p.m. is illustrated in 
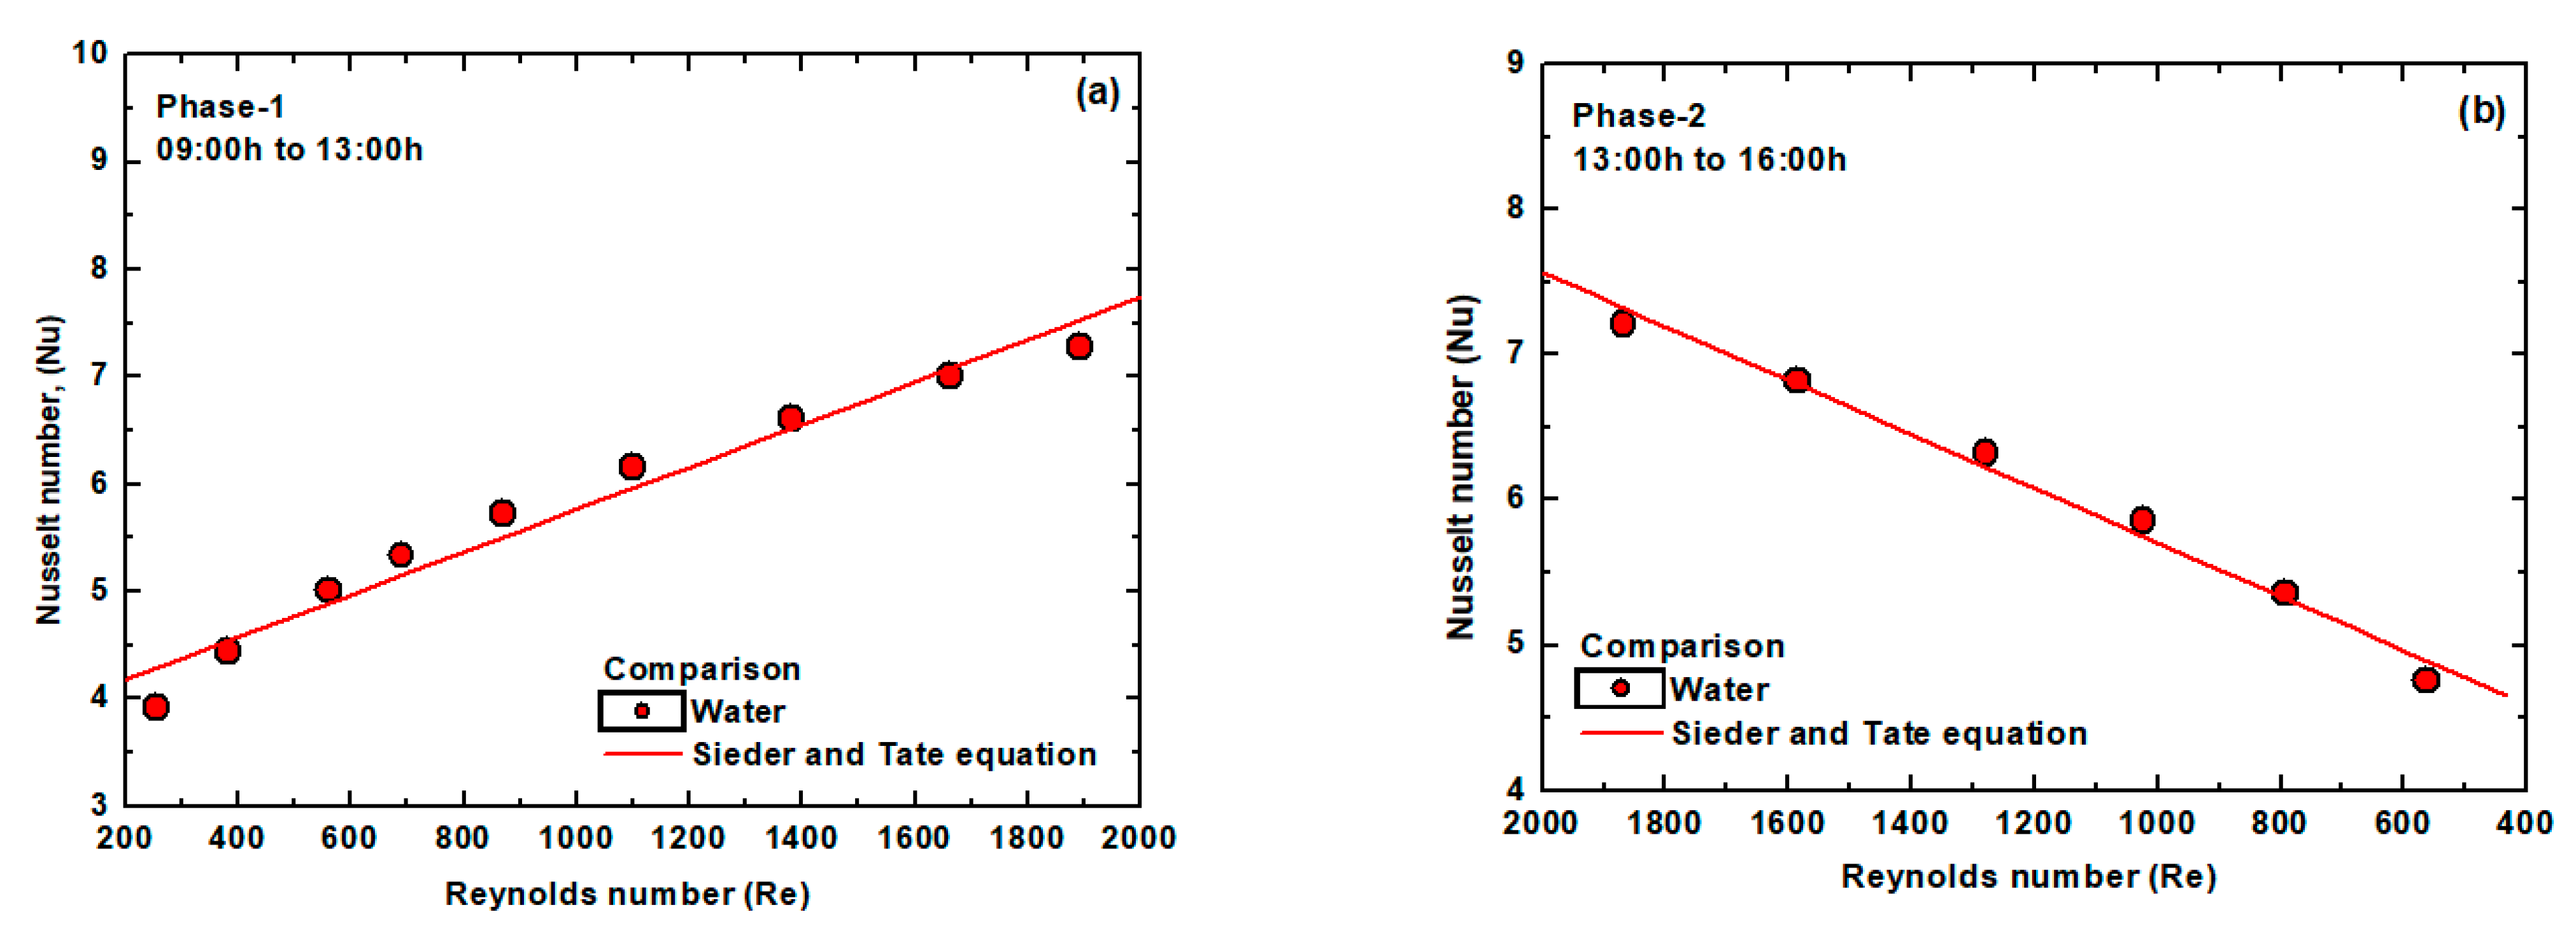
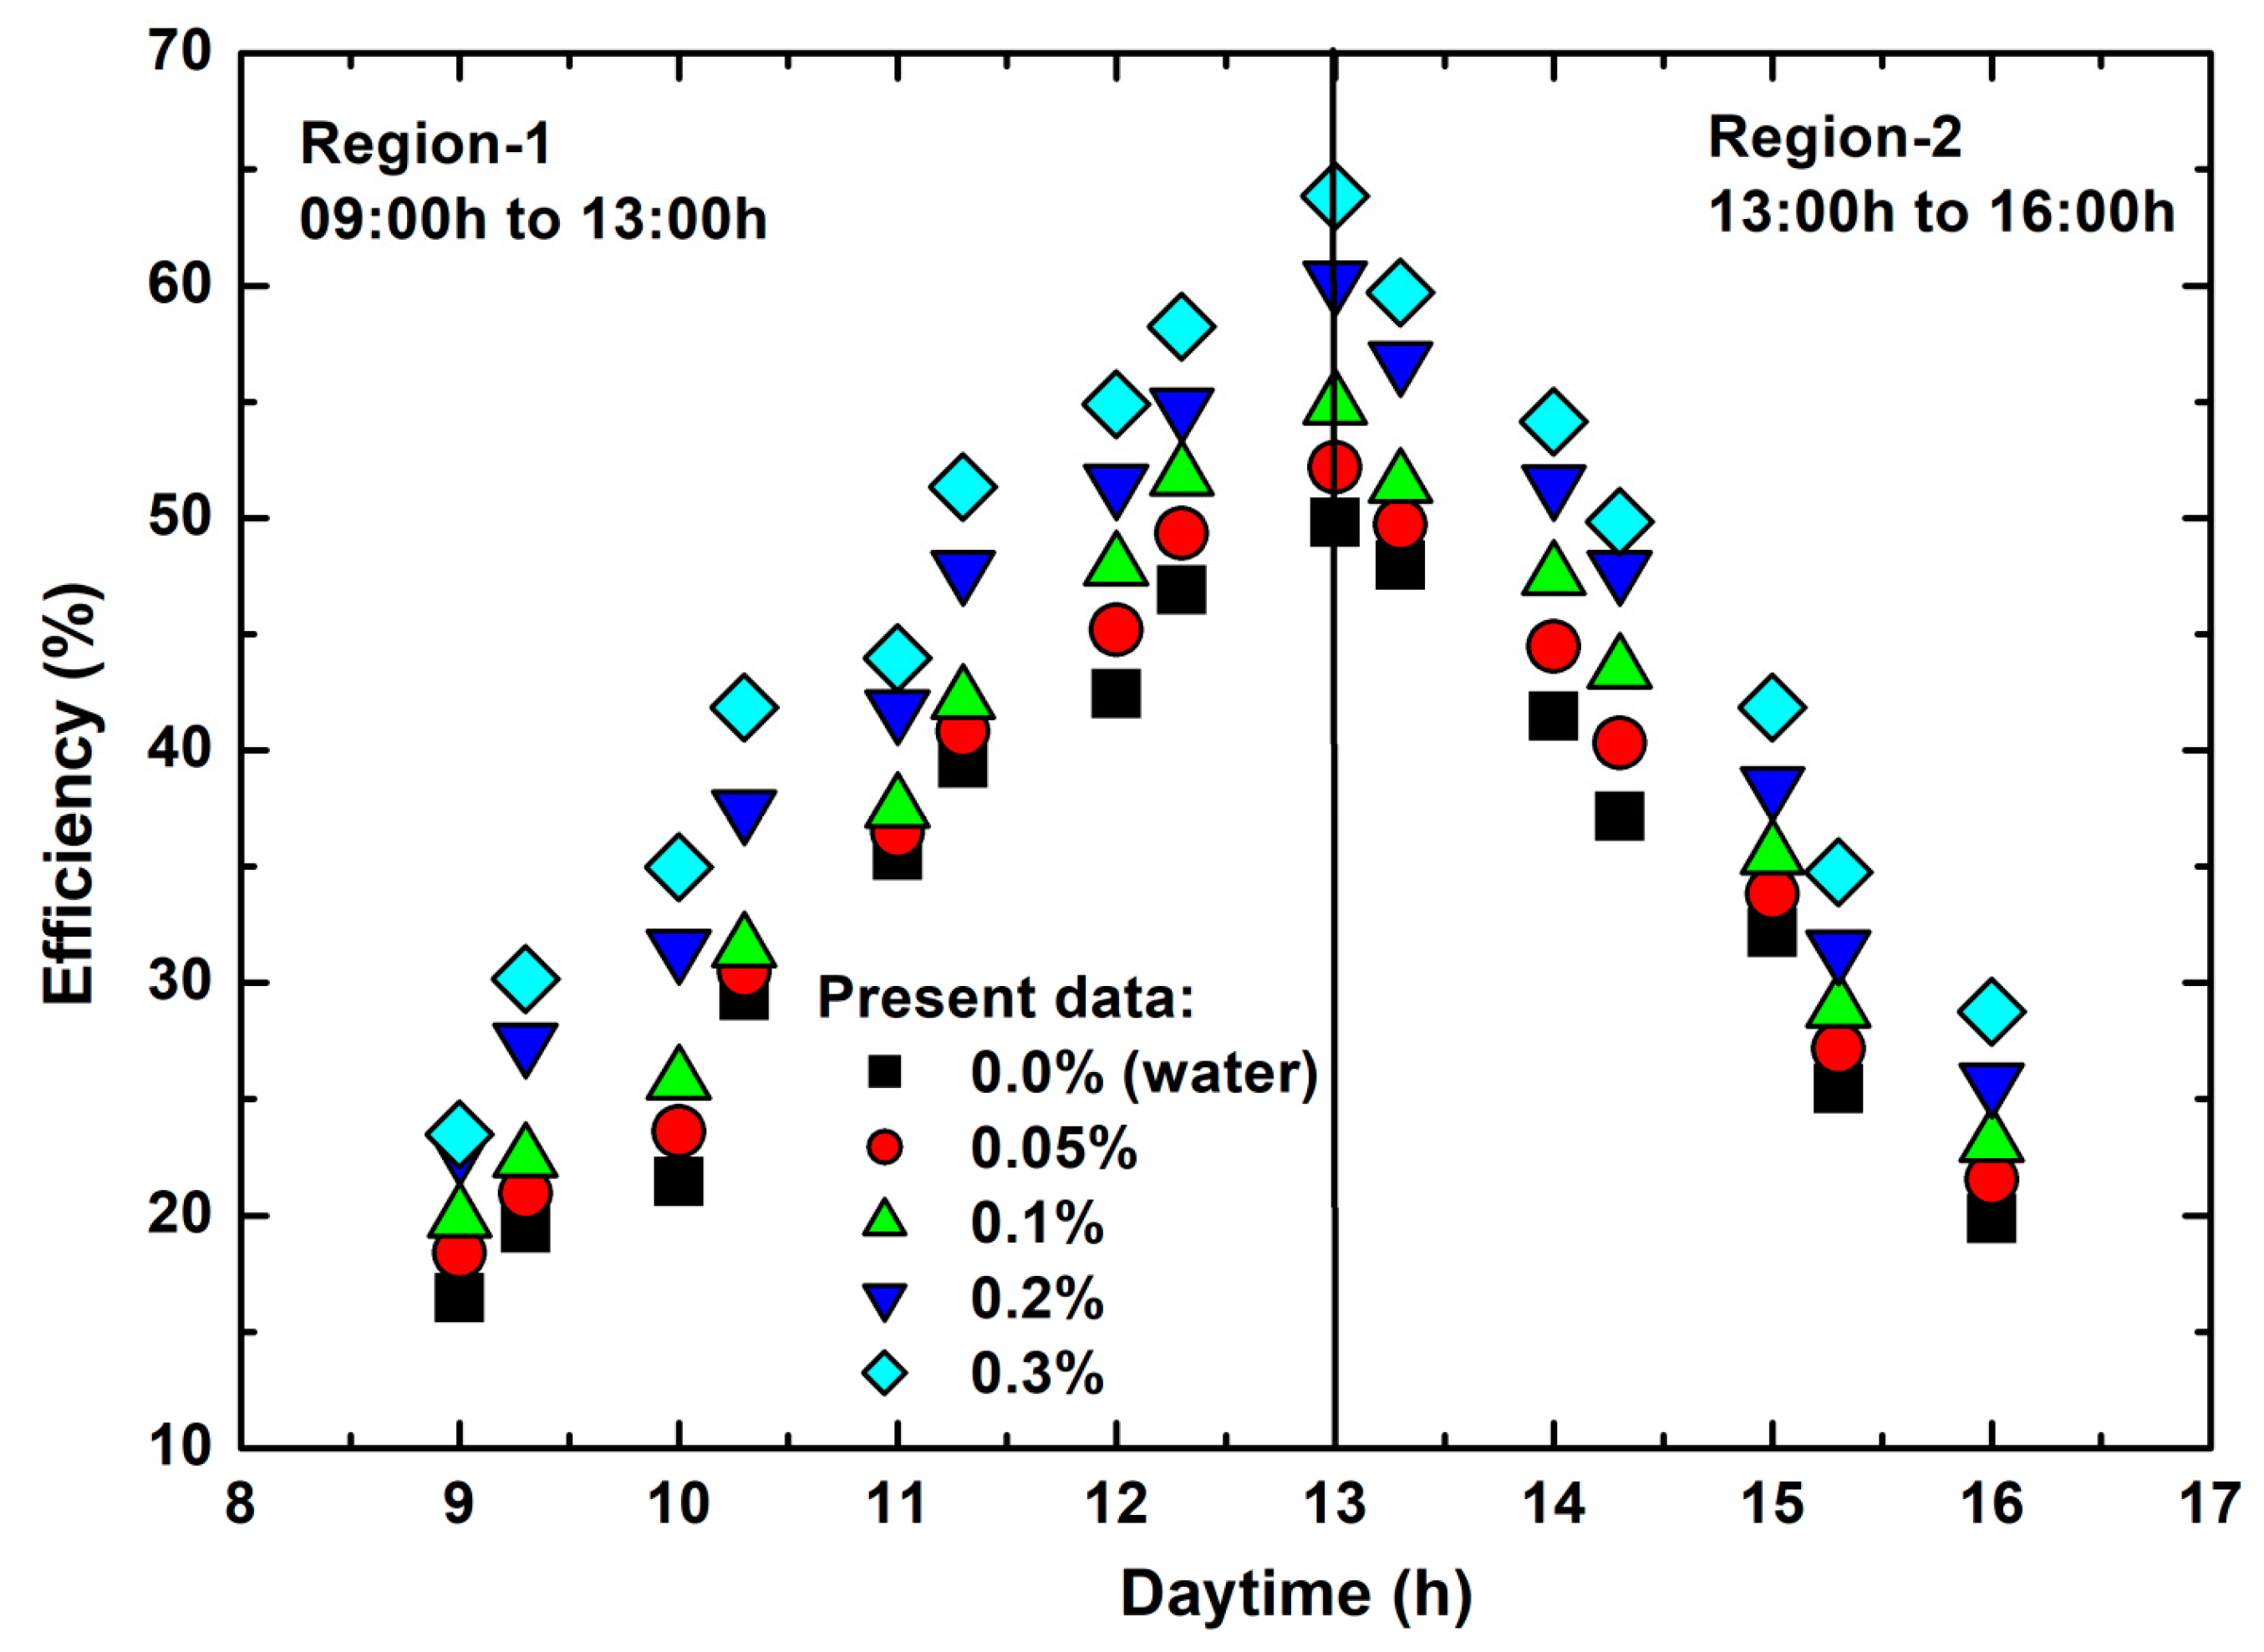
Figure 9. It is observed that the solar radiation increased first from 09:00 a.m. to 13:00 p.m. and then decreased from 1:00 a.m. to 4:00 p.m., this tendency is divided into two phases. Phase-1 is from 09:00 a.m. to 1:00 p.m. and Phase-2 is from 1:00 p.m. to 4:00 p.m. The heat transfer, friction factor, and efficiency are calculated in the two phases.

3. Data Analysis

3.1. Nusselt Number

The absorbed heat rate by water or hybrid nanofluids is calculated by Equation (9).
Q ˙ = m ˙ C p   ( T o u t   T i n ) =   U o   A o ( T s   T m )
1 U o   A o =   1 h i   A i +   ln ( D o D i ) 2 π k L
where, Q ˙ is the absorbed heat rate (W), C p is the specific heat (J kg−1 K−1), m ˙ is the mass flow rate, U o is the outside overall heat transfer coefficient (W m−2 K−1), h i is tube-side convective heat transfer coefficient (W m−2 K−1), k is the thermal conductivity (W m−1 K−1), D o and D i are the tube outside and inside diameters (m), respectively, A i and A o are the tubes inside and outside areas (m2), respectively, L is the tube length (m); T s and T m are surface and mean fluid temperatures (K), respectively.
Equations (9) and (10) are used to estimate the heat transfer coefficient ( h i ) . While Equations (11) and (12) are utilized to evaluate the Nusselt number and Prandtl number of water and hybrid nanofluids.
N u = h i D i k
P r = μ C p k
where, μ is the fluid viscosity (mPa.s).

3.2. Friction Factor

The friction factor ( f ) is calculated by Equation (13).
f = ( P ) ( L D i ) ( ρ v 2 2 )
where, P is the pressure drop, v is the fluid velocity in the riser tube, and D i is the riser tube inner diameter.

3.3. Collector Thermal Efficiency

The Hottel–Whillier–Bliss [25,26,27] equation is given below.
Q ˙ = A c F R [ G T τ α U L ( T i T a ) ]
where Q ˙ is the heat gain (W), A c is the solar collector surface area ( m 2 ) , F R is the heat removal factor, τ α is the absorptance–transmittance product, G T is the global solar radiation (W m−2), U L is the solar collector overall loss coefficient, T i is the inlet temperature (K), and T a is the ambient temperature (K).
Equation (15) is used to estimate the collector thermal efficiency ( η i ) .
η i = Q ˙ A c G T = m ˙ C p ( T o T i ) G T
By substituting the values from Equation (15) into Equation (16), the F R τ α (heat removal factor and absorptance–transmittance) and F R U L (heat removal factor and overall loss coefficient) values are evaluated. A graph is drawn between instantaneous efficiency ( η i ) verses T i T a / G T , the F R U L term is the curve slope and F R τ α term is constant.
η i = F R τ α F R U L ( T i T a G T )

4. Results and Discussion

4.1. Nusselt Number of Hybrid Nanofluids

Equation (11) is utilized to estimate the Nusselt number. The data for both Phase-1 and Phase-2 are shown in Figure 10a,b along with the data from Sieder and Tate equation [28] calculated by Equation (17). It is observed from the figure that the deviation between the present results and literature data is within ±2.5%.
Nu = 1.86 ( RePrD i / L ) 1 / 3 ( μ w μ b ) 0.14       for   RePrD i / L > 10
Figure 11a represents the Nusselt number of hybrid nanofluids at different Reynolds number ( 4 m ˙ / π D i μ ) in Phase-1. It is detected that Nusselt number is increased with the increase of volume concentration and Re. The Nusselt number is enhanced by 4.38%, 5.4%, 7.45%, and 8.22% at ϕ equal to 0.05%, 0.1%, 0.2%, and 0.3%, and Re of 248, 242, 238, and 235, respectively compared to water data. The Nusselt number is further enhanced by 11.13%, 13%, 16.9% and 18.68% at ϕ = 0.05%, 0.1%, 0.2%, and 0.3%, and Re of 1774, 1674, 1528, and 1413, respectively, over water data. Figure 11b shows the Nusselt number of hybrid nanofluids at different Reynolds number (Re) in Phase-2. It is noticed from the figure that Nusselt number enhances with the decrease of Re and the increase of particle concentration. The Nusselt number augmented by 10.6%, 12.8%, 14.8%, and 16.35% at ϕ of 0.05%, 0.1%, 0.2%, and 0.3%, and Re of 1867, 1750, 1652, and 1395, respectively, compared to water data. The Nusselt number further increases by 3.28%, 4.96%, 6.85%, and 7.69% at ϕ = 0.05%, 0.1%, 0.2%, and 0.3%, and Re of 562, 544, 506, 476, and 435, respectively, over water data.
Figure 12a displays the heat transfer coefficient of hybrid nanofluids at different Reynolds number in Phase-1. It is noticed that the heat transfer coefficient boosts with the increase of Reynolds number and volume concentration. The heat transfer coefficient enhances by 11.34%, 19.42%, 23.92%, and 26.95% at 0.05%, 0.1%, 0.2%, and 0.3% volume concentrations and Re of 248, 242, 238, and 235, respectively, compared to water data. The heat transfer coefficient is further enhanced by 18.54%, 28.09%, 34.82%, and 39.22% at 0.05%, 0.1%, 0.2%, and 0.3% volume concentrations and Re of 1774, 1674, 1528, and 1413, respectively with respect to water data. Figure 12b displays the heat transfer coefficient of hybrid nanofluids at different Reynolds number in Phase-2. The heat transfer coefficient augmented with the decrease of Re and the increase of particle concentration. The heat transfer coefficient improves by 18.04%, 27.9%, 32.42%, and 36.49% at 0.05%, 0.1%, 0.2%, and 0.3% volume concentrations and Re of 1867, 1750, 1652, and 1395, respectively, over water data.
The heat transfer coefficient is further improved by 10.16%, 18.92%, 23.23%, and 26.33% at 0.05%, 0.1%, 0.2%, and 0.3% volume concentrations and Re of 562, 544, 506, 476, and 435, respectively over water data.
The next correlations were developed for Nusselt number.
Phase-1 :   Nu = 0.1015 Re 0.5 Pr 0.4 ( 1 + ϕ ) 0.761
200 < Re < 2000 ;   0 < ϕ < 0.3 % ;   5 < Pr < 6.5
Phase-2 :   Nu = 0.09769 Re 0.5 Pr 0.4 ( 1 + ϕ ) 0.7883
2000 < Re < 200 ;   0 < ϕ < 0.3 % ;   5 < Pr < 6.5
The Nusselt number calculated by the proposed equations for hybrid nanofluids and water for the two phases is shown in Figure 13a,b against experimental data. The deviations between the experimental and calculated Nusselt number values are within ±7.71% and ±5.18% for Phase-1 and Phase-2, respectively.

4.2. Friction Factor of Hybrid Nanofluids

The friction factor of each riser tube over the length was estimated depending on the pressure difference between the differential pressure transducer. The friction factor in the case of water is calculated with Equation (20) Hagen–Poiseuille law [29] for the two phases.
Hagen Poiseuille   law ,   f = 64 Re
The experimental friction factor in the case of water versus the calculated values by Equation (20) for Phase-1 and Phase-2 is displayed in Figure 14a,b. The deviations between the experimental and calculated values are within ±2.5%.
The friction factor of hybrid nanofluids at different Reynolds number in Phase-1 is illustrated in Figure 15a. The friction factor is increased with the increase of Re and volume concentration. The friction factor increases by 5.11%, 7.51%, 9.91%, and 11.51% at 0.05%, 0.1%, 0.2%, and 0.3% volume concentrations and Re of 248, 242, 238, and 235, respectively compared to water data. The friction factor is further increases by 7.65%, 11.8%, 14.46%, and 18.91% at 0.05%, 0.1%, 0.2%, and 0.3% volume concentrations and Re of 1774, 1674, 1528, and 1413, respectively, over water data.
Figure 15b represents the friction factor of hybrid nanofluids at different Re in Phase-2. The friction factor is increased with the decrease of Re and the increase of volume concentration. The friction factor is increased by 5.91%, 9.99%, 12.62%, and 17% at 0.05%, 0.1%, 0.2%, and 0.3% volume concentrations and Re of 1867, 1750, 1652, and 1395, respectively compared to water data. The friction factor is further increased by 3.75%, 5.51%, 7.27%, and 9.03% at 0.05%, 0.1%, 0.2%, and 0.3% volume concentrations and Re of 562, 544, 506, 476, and 435, respectively over water data.
The next correlations were established for the friction factor.
Phase-1 :   f =   82.55   Re 1.035 ( 1 + ϕ ) 0.322
200 < Re < 2000 ; 0 < ϕ < 0.3 %
Phase-2 :   f =   50.74   Re 0.957 ( 1 + ϕ ) 0.961
384 < Re < 206 ; 0 < ϕ < 0.3 %
The experimental friction factor in the case of hybrid nanofluids along with water data in comparison with the calculated values by Equations (21) and (22) for Phase-1 and Phase-2 are exhibited in Figure 16a,b. The deviations between the experimental and calculated values are within ±1.5%.

4.3. Collector Efficiency

The instantaneous collector efficiency using water and MWCNT + Fe3O4 hybrid nanofluids is shown in Figure 17 at various daytime hours. Because of the increase in solar radiation and the temperature of the collector surface, the collector efficiency improves from 09:00 a.m. to 1:00 p.m. Then, due to the decline in solar radiation and the temperature of the collector surface; the collector efficiency declines from 1:00 p.m. to 4:00 p.m. At 09:00 a.m. daytime, the collector efficiency using water, 0.05%, 0.1%, 0.2%, and 0.3 vol. % of nanofluids is 16.44%, 18.4%, 19.87%, 22.85%, and 23.47%, respectively. While at the midday (1:00 p.m.), the collector efficiency is 49.81%, 52.17%, 54.84%, 60.24%, and 63.85% for water, 0.05%, 0.1%, 0.2%, and 0.3 vol. % of nanofluid, respectively. Moreover when the daytime approaches to 16:00 h, the collector efficiency reaches to 19.87%, 21.56%, 23.12%, 25.74%, and 28.75% for water, 0.05%, 0.1%, 0.2%, and 0.3 vol. % of nanofluid. The maximum enhancement in the collector efficiency was 28.19% at midday using 0.3 vol. % volume concentration.
The collector thermal efficiency versus ( T i T a / G T ) parameter at different hybrid nanofluids concentrations is displayed in Figure 18. At midday (13:00 h), the collector efficiency is high for all working fluids compared to those at 09:00 a.m. and 4:00 p.m., hence the graph is drawn by considering the data from 09:00 a.m. to 1:00 p.m. The collector thermal efficiency is 49.81%, 52.17%, 54.84%, 60.24%, and 63.85% for water, 0.05%, 0.1%, 0.2%, and 0.3 vol. % of nanofluids and Re values of 1892, 1774, 1674, 1528, 1413, respectively. At the fixed solar radiation and collector area, the heat gain by MWCNT + Fe3O4 hybrid nanofluids in the riser tubes is higher than those absorbed by water, resulting in elevated collector efficiencies.
The data in Figure 18 are fitted linearly to obtain the slope ( F R U L ) and the intersection point ( F R τ α ) . These two parameters have a significant effect on the collector efficiency. The fitted data of F R τ α , F R U L , and their coefficients of determination (R2) at each measurement condition of water and hybrid nanofluids MWCNT + Fe3O4 are presented in Table 7. The efficiency enhancement for 0.05%, 0.1%, 0.2%, and 0.3 vol. % of nanofluid, when the reduced temperature ( T i T a / G T ) reached 0.0029, is about 4.61%, 9.96%, 20.79%, and 28.09% at Re of 1774, 1674, 1528, 1413, respectively over water data. The slope ( F R U L ) is found to be 2.26, 2.72, 3.42, 3.30, and 3.71 for water, 0.05%, 0.1%, 0.2%, and 0.3 vol. % of nanofluid.

4.4. Thermoeconomic Analysis

The thermoeconomic analysis is conducted based on the procedure given by Lucia and Grisolia [30] and Grisolia et al. [31]. From the experimental results, it is noticed that the thermal efficiency of the collector is maximum when the daytime reached 13:00 h compared to the daytime at 09:00 a.m. and 4:00 p.m., respectively. Hence, the thermoeconomic analysis was performed at the mid-daytime of 1:00 p.m., because of the maximum collector efficiency. Hence, the increased thermal efficiency is converted into useful cost and area saving of the collector. The collector thermal efficiency is 49.81%, 52.17%, 54.84%, 60.24%, and 63.85% for water, 0.05%, 0.1%, 0.2%, and 0.3 vol. % of nanofluid, respectively at the midday of 13:00 h. The purchased FPC area is 3 m2 and its cost is $223.88. For water and water-based hybrid nanofluids, the same FPC is used. The collector area is decreased to 2.86, 2.72, 2.48, 2.34 m2 for 0.05%, 0.1%, 0.2%, and 0.3 vol. % of nanofluid, respectively. With the use of hybrid nanofluids in the collector, the collector cost is decreased to 213.75, 203.35, 185.12, and 174.65$ for 0.05%, 0.1%, 0.2%, and 0.3 vol. % of nanofluid, respectively, whereas it is $223.88 using water in the collector.
The uncertainties of various instruments used in the present study are calculated from the procedure of Coleman and Steel [32]. Table 8 indicates the measured parameters, their maximum values, and the uncertainty of the measurements. The calculated uncertainty values are presented in Table 9.

5. Conclusions

Water and water based MWCNT + Fe3O4 hybrid nanofluids are used as working fluids in a flat plate solar collector, and the thermal efficiency, heat transfer, and friction factor characteristics are experimentally investigated. The fluids circulate naturally (thermosyphon) in the collector. The viscosity and thermal conductivity of hybrid nanofluids MWCNT + Fe3O4 are augmented as the particle concentrations and temperatures increase.
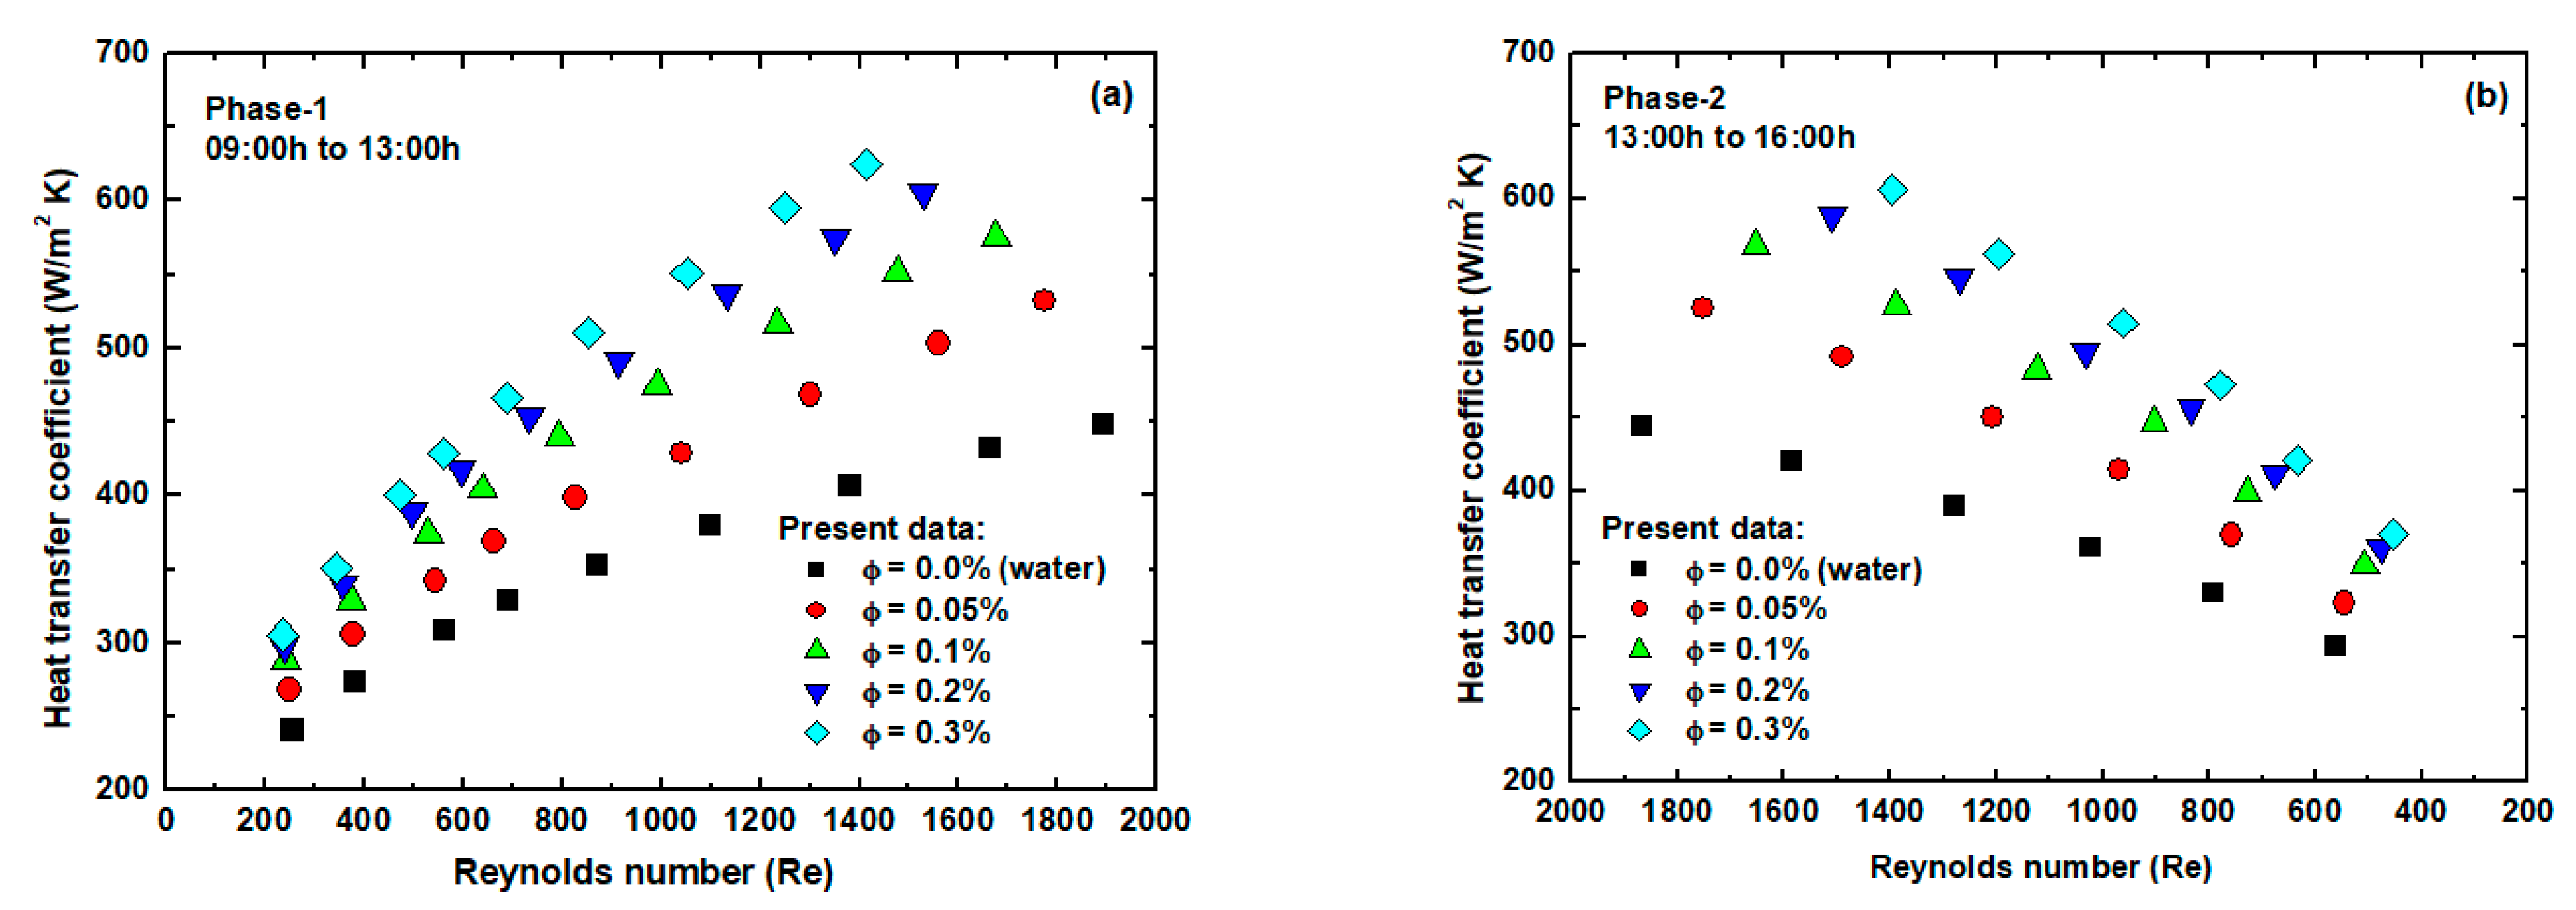
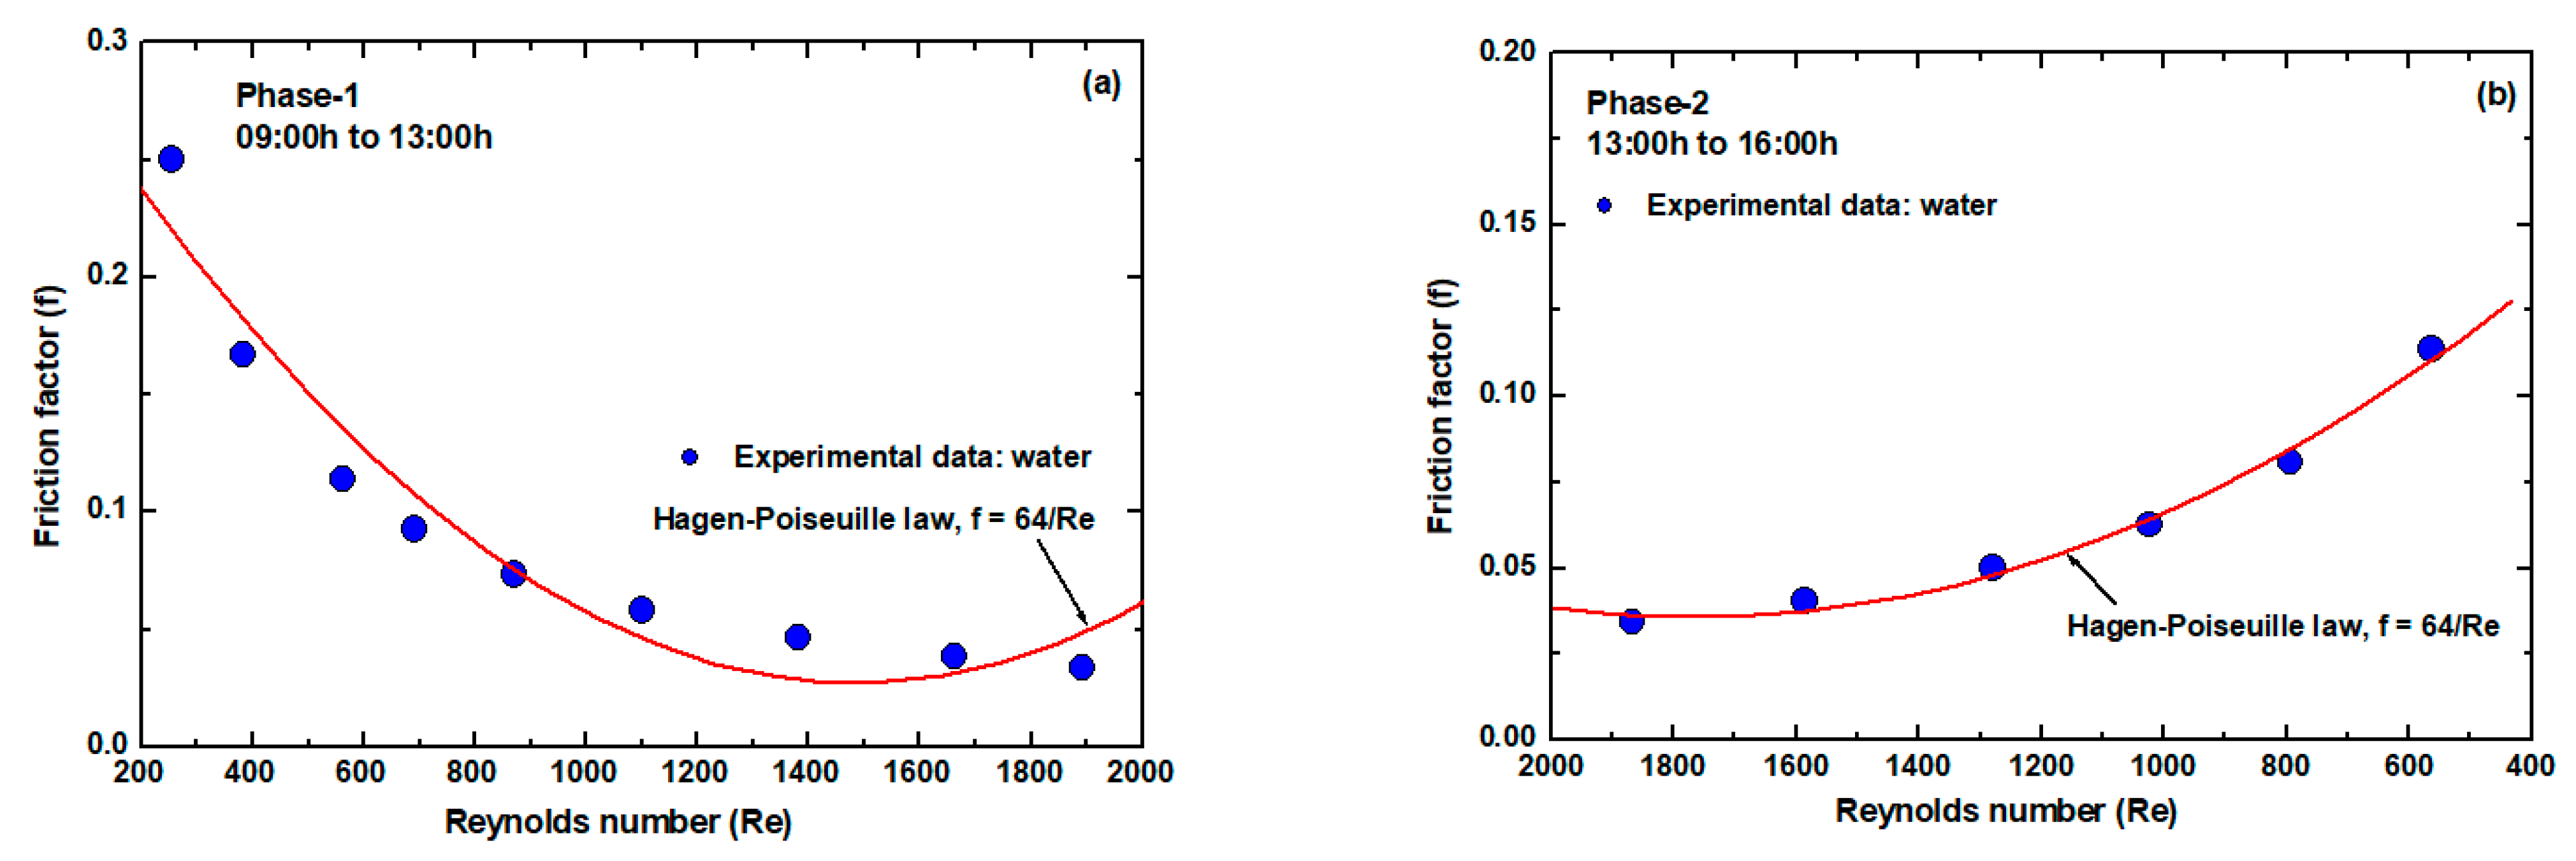
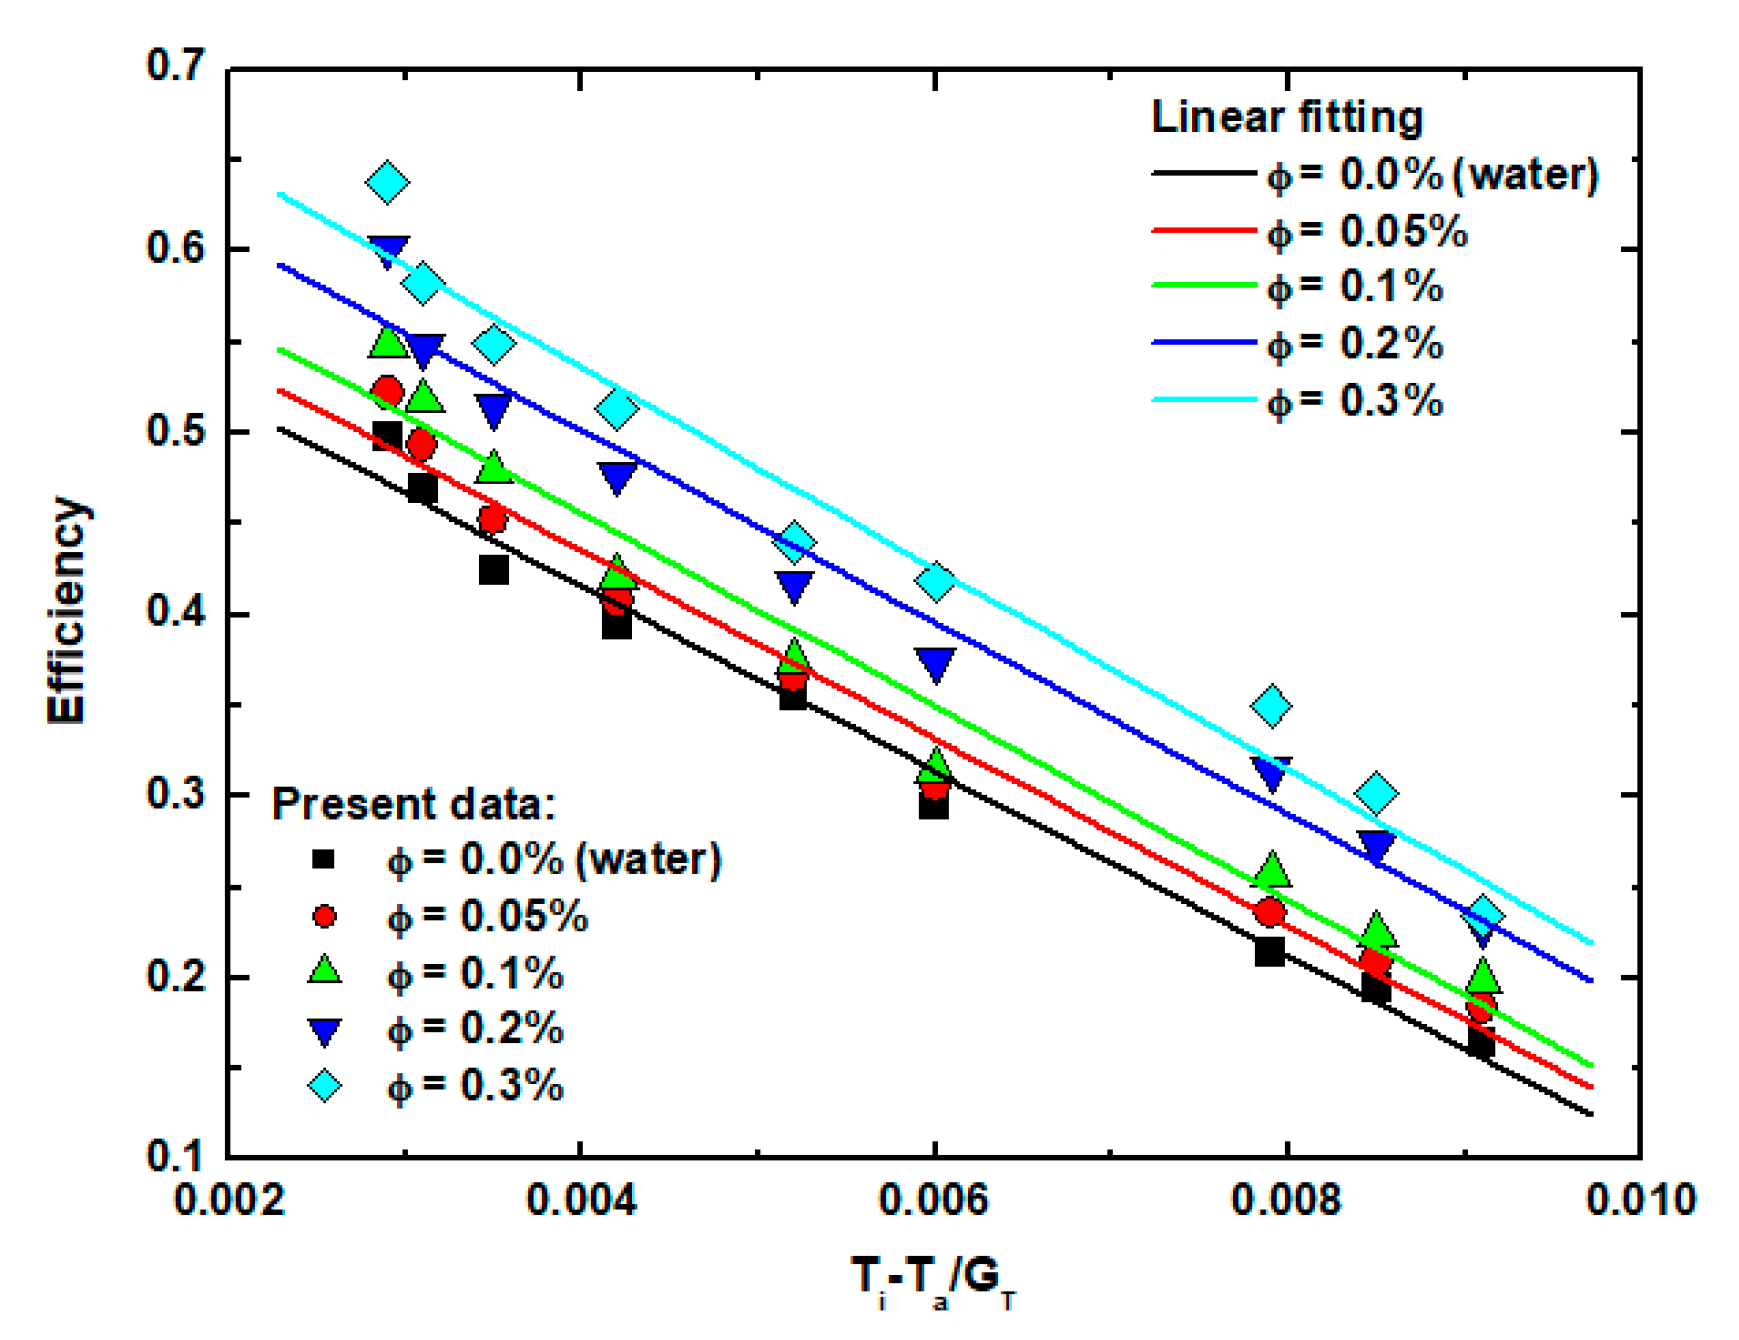
The maximum obtained viscosity and thermal conductivity improvements are 50.4% and 28.46%, respectively at 0.3 vol. % of nanofluid and at a temperature of 60 °C. The Nusselt number was enhanced with the increase of particle volume concentrations. At daytime 13:00 h, the Nusselt number and friction factor are increased by 18.68% and 18.91% at 0.3 vol. % and Reynolds number of 1413 over water data. The collector thermal efficiency is boosted by 28.09% with the utilization of 0.3% volume concentration of MWCNT + Fe3O4 hybrid nanofluids and Reynolds number of 1413 over water data.
Finally, it was confirmed that the utilization of MWCNT + Fe3O4 hybrid nanofluids in the solar flat plate collector leads to improve collector heat transfer and thermal efficiency compared to water data. Due to the enhanced hybrid nanofluids thermal conductivity, its heat-absorbing capacity is higher than that of water. Consequently, the hybrid nanofluids are advantageous in the solar flat plate collector under thermosyphon conditions.

Author Contributions

Conceptualization, B.S.; data curation, L.S.S.; formal analysis, B.S. and L.S.S.; funding acquisition, B.S.; investigation, B.S.; methodology, B.S.; project administration, B.S.; resources, B.S.; software, B.S.; supervision, B.S.; validation, L.S.S.; visualization, B.S. and L.S.S.; writing—original draft, L.S.S.; writing—review and editing, B.S. All authors have read and agreed to the published version of the manuscript.

Funding

This research was funded by Taif University Researchers Supporting Project number (TURSP-2020/49).

Informed Consent Statement

Not applicable.

Data Availability Statement

The data presented in this study are available on request from the corresponding author.

Acknowledgments

The authors would like to thank Taif University for the financial support.

Conflicts of Interest

The authors declare no conflict of interest.

References

  1. Choi, S.U.S. Enhancing thermal conductivity of fluids with nanoparticles. In Proceedings of the 1995 ASME International Mechanical Engineering Congress and Exposition, San Francisco, CA, USA, 12–17 November 1995; pp. 1–6. [Google Scholar]
  2. Sundar, L.S.; Mesfin, M.; Ramana, E.V.; Said, Z.; Sousa, A.C.M. Experimental investigation of thermo-physical properties, heat transfer, pumping power, entropy generation, and exergy efficiency of nanodiamond + Fe3O4/60:40% water-ethylene glycol hybrid nanofluid flow in a tube. Therm. Sci. Eng. Progress 2021, 21, 100799. [Google Scholar] [CrossRef]
  3. Modi, K.V.; Jani, H.K.; Gamit, I.D. Impact of orientation and water depth on productivity of single-basin dual-slope solar still with Al2O3 and CuO nanoparticles. J. Therm. Anal. Calorim. 2020, 1–15. [Google Scholar] [CrossRef]
  4. Hawwash, A.A.; Abdel Rahman, A.K.; Nada, S.A.; Ookawara, S. Numerical investigation and experimental verification of performance enhancement of flat plate solar collector using nanofluids. Appl. Therm. Eng. 2018, 130, 363–374. [Google Scholar] [CrossRef]
  5. Kiliç, F.; Menlik, T.; Sözen, A. Effect of titanium dioxide/water nanofluid use on thermal performance of the flat plate solar collector. Sol. Energy 2018, 164, 101–108. [Google Scholar] [CrossRef]
  6. Sundar, L.S.; Singh, M.K.; Sousa, A.C.M. Experimental investigation of Al2O3/water nanofluids on the effectiveness of solar flat-plate collectors with and without twisted tape inserts. Renew. Energy 2018, 119, 820–833. [Google Scholar] [CrossRef]
  7. Sharafeldin, M.A.; Gróf, G. Experimental investigation of flat plate solar collector using CeO2-water nanofluid. Energy Convers. Manag. 2018, 155, 32–41. [Google Scholar] [CrossRef]
  8. Jouybari, H.J.; Saedodin, S.; Zamzamian, A.; Nimvari, M.E.; Wongwises, S. Effects of porous material and nanoparticles on the thermal performance of a flat plate solar collector: An experimental study. Renew. Energy 2017, 114 Pt B, 1407–1418. [Google Scholar] [CrossRef]
  9. Ziyadanogullari, N.B.; Yucel, H.L.; Yildiz, C. Thermal performance enhancement of flat-plate solar collectors by means of three different nanofluids. Therm. Sci. Eng. Prog. 2018, 8, 55–65. [Google Scholar] [CrossRef]
  10. Rajput, N.S.; Shukla, D.D.; Rajput, D.; Sharma, S.K. Performance analysis of flat plate solar collector using Al2O3/distilled water nanofluid: An experimental investigation. Mater. Today Proc. 2019, 10, 52–59. [Google Scholar] [CrossRef]
  11. Stalin, P.M.J.; Arjunan, T.V.; Matheswaran, M.M.; Dolli, H.; Sadanandam, N. Energy, economic and environmental investigation of a flat plate solar collector with CeO2/water nanofluid. J. Therm. Anal. Calorim. 2020, 139, 3219–3233. [Google Scholar] [CrossRef]
  12. Choudhary, S.; Sachdeva, S.; Kumar, P. Influence of stable zinc oxide nanofluid on thermal characteristics of flat plate solar collector. Renew. Energy 2020, 152, 1160–1170. [Google Scholar] [CrossRef]
  13. Tong, Y.; Lee, H.; Kang, W.; Cho, H. Energy and exergy comparison of a flat-plate solar collector using water, Al2O3 nanofluid, and CuO nanofluid. Appl. Therm. Eng. 2019, 159, 113959. [Google Scholar] [CrossRef]
  14. Choudhary, S.; Sachdeva, A.; Kumar, P. Investigation of the stability of MgO nanofluid and its effect on the thermal performance of flat plate solar collector. Renew. Energy 2020, 147, 1801–1814. [Google Scholar] [CrossRef]
  15. Anin Vincely, D.; Natarajan, E. Experimental investigation of the solar FPC performance using graphene oxide nanofluid under forced circulation. Energy Conversat. Manag. 2016, 117, 1–11. [Google Scholar] [CrossRef]
  16. Ajiwiguna, T.A.; Hamonangan, T.; Kirom, M.R. Experimental study of thermal efficiency on plate-fin solar thermal collector. ARPN J. Eng. Appl. Sci. 2016, 11, 809–811. [Google Scholar]
  17. Verma, S.K.; Tiwari, A.K.; Chauhan, D.S. Experimental evaluation of flat plate solar collector using nanofluids. Energy Convers. Manag. 2017, 134, 103–115. [Google Scholar] [CrossRef]
  18. Osho, I.W.; Okonkwo, E.C.; Kavaz, D.; Abbasoglu, S. An experimental investigation into the effect of particle mixture ratio on specific heat capacity and dynamic viscosity of Al2O3-ZnO hybrid nanofluids. Powder Technol. 2020, 363, 699–716. [Google Scholar] [CrossRef]
  19. Sundar, L.S.; Singh, M.K.; Sousa, A.C.M. Enhanced heat transfer and friction factor of MWCNT–Fe3O4/water hybrid nanofluids. Int. Commun. Heat Mass Transfer. 2014, 52, 73–83. [Google Scholar] [CrossRef]
  20. Giwa, S.O.; Sharifpur, M.; Meyer, J.P. Experimental study of thermo-convection performance of hybrid nanofluids of Al2O3-MWCNT/water in a differentially heated square cavity. Int. J. Heat Mass Transfer. 2020, 148, 119072. [Google Scholar] [CrossRef]
  21. Li, X.; Zeng, G.; Lei, X. The stability, optical properties and solar-thermal conversion performance of SiC-MWCNTs hybrid nanofluids for the direct absorption solar collector (DASC) application. Sol. Energy Mater. Sol. Cells 2020, 206, 110323. [Google Scholar] [CrossRef]
  22. Farajzadeh, E.; Movahed, S.; Hosseini, R. Experimental and numerical investigations on the effect of Al2O3/TiO2-H2O nanofluids on thermal efficiency of the flat plate solar collector. Renew. Energy 2018, 118, 122–130. [Google Scholar] [CrossRef]
  23. Verma, S.K.; Tiwari, S.K.; Tiwari, A.K.; Chauhan, D.S. Performance analysis of hybrid nanofluids in flat plate solar collector as an advanced working fluid. Sol. Energy 2018, 67, 231–241. [Google Scholar] [CrossRef]
  24. Okonkwo, E.C.; Wole-Osho, I.; Kavaz, D.; Abidb, M.; Al-Ansari, T. Thermodynamic evaluation and optimization of a flat plate collector operating with alumina and iron mono and hybrid nanofluids. Sustain. Energy Technol. Assess. 2020, 37, 100636. [Google Scholar] [CrossRef]
  25. Whillier, A. Design factors influencing collector performance, low temperature engineering. In Application of Solar Energy; ASHRAE: New York, NY, USA, 1967. [Google Scholar]
  26. Hottel, H.C.; Whillier, A. Evaluation of fat plate collector performance. In Translation Conference on the Use of Solar Energy; University of Arizona Press: Tucson, AZ, USA, 1958. [Google Scholar]
  27. Bliss, R.W. The derivation of several plate effectiveness factors useful in the design of flat plate solar heat collectors. Sol. Energy 1959, 3, 55–64. [Google Scholar] [CrossRef]
  28. Sieder, E.N.; Tate, G.E. Heat transfer and pressure drop of liquids in tubes. Ind. Eng. Chem. 1936, 28, 1429–1439. [Google Scholar] [CrossRef]
  29. Incropera, F.P.; DeWitt, D.P.; Bergman, T.L.; Lavine, A.S. Fundamentals of Heat and Mass Transfer, 6th ed.; John Wiley & Sons: Hoboken, NJ, USA, 2006. [Google Scholar]
  30. Lucia, U.; Grisolia, G. Exergy inefficiency: An indicator for sustainable development analysis. Energy Rep. 2019, 5, 62–69. [Google Scholar] [CrossRef]
  31. Grisolia, G.; Fino, D.; Lucia, U. Thermodynamic optimisation of the biofuel production based on mutualism. Energy Rep. 2020, 6, 1561–1571. [Google Scholar] [CrossRef]
  32. Coleman, H.W.; Steel, W.G. Experimental and Uncertainty Analysis for Engineers; Wiley Interscience: New York, NY, USA, 1989. [Google Scholar]
Figure 1. Synthesis procedure of multi-walled carbon nanotubes (MWCNTs) + Fe3O4 hybrid nanoparticles.
Processes 09 00180 g001
Figure 2. XRD patterns of MWCNT + Fe3O4 hybrid nanoparticles.
Processes 09 00180 g002
Figure 3. SEM image synthesis MWCNT + Fe3O4 hybrid nanoparticles.
Processes 09 00180 g003
Figure 4. Magnetic results of the synthesis MWCNT + Fe3O4 hybrid nanoparticles.
Processes 09 00180 g004
Figure 5. Thermal conductivity of hybrid nanofluids.
Processes 09 00180 g005
Figure 6. Variations of hybrid nanofluids viscosity versus temperature.
Processes 09 00180 g006
Figure 7. Schematic diagram of thermosyphon solar FPC.
Processes 09 00180 g007
Figure 8. Photograph of thermosyphon solar FPC.
Processes 09 00180 g008
Figure 9. Solar radiation with respect to daytime.
Processes 09 00180 g009
Figure 10. The Nusselt number validation with literature data; Phase-1 (a) and Phase-2 (b).
Processes 09 00180 g010
Figure 11. The hybrid nanofluids Nusselt number; Phase-1 (a), and Phase-2 (b).
Processes 09 00180 g011
Figure 12. The hybrid nanofluids heat transfer coefficient; Phase-1 (a), and Phase-2 (b).
Processes 09 00180 g012
Figure 13. Experimental Nusselt number against proposed equation; Phase-1 (a), and Phase-2 (b).
Processes 09 00180 g013
Figure 14. Experimental friction factor validation with literature values; Phase-1 (a), and Phase-2 (b).
Processes 09 00180 g014
Figure 15. The hybrid nanofluids experimental friction factor; Phase-1 (a), and Phase-2 (b).
Processes 09 00180 g015
Figure 16. Experimental friction factor against suggested equation (a) Phase-1 and (b) Phase-2.
Processes 09 00180 g016
Figure 17. Variation of collector efficiency using water and hybrid nanofluids against daytime.
Processes 09 00180 g017
Figure 18. Instantaneous collector efficiency versus ( T i T a / G T ) parameter.
Processes 09 00180 g018
Table 1. Physical property of water, MWCNT, Fe3O4, and MWCNT + Fe3O4 at 20 °C.
Substance ρ , (kg/m3)k, (W/m K) C p ,   ( J / kg   K ) μ , (mPa.s)
Water998.50.60241780.89
MWCNT21002800710----
Fe3O4581080.1670----
MWCNT + Fe3O44845.4787.27680.66----
Table 2. Thermal conductivity of hybrid nanofluids.
T, (°C) ϕ = 0.0% ϕ = 0.05% ϕ = 0.1% ϕ = 0.2% ϕ = 0.3%
200.6020.6370.6730.6790.6856
250.6090.6440.6800.6910.7034
300.6160.6570.6980.7110.7236
350.6240.6660.7090.7270.7456
400.6310.6750.7200.7420.7656
450.6370.6870.7380.7580.7789
500.6420.6980.7540.7750.7956
550.6470.7060.7640.7890.8145
600.6530.7210.7890.8140.8389
Table 3. Viscosity of hybrid nanofluids.
T, (°C) ϕ = 0.0% ϕ = 0.05% ϕ = 0.1% ϕ = 0.2% ϕ = 0.3%
201.0061.0821.1581.2221.286
250.9180.9831.0481.1321.216
300.8310.8970.9631.0691.174
350.7440.8010.8590.9551.052
400.6570.6990.7420.8330.924
450.6120.6560.7010.7970.892
500.5670.6210.6750.7630.851
550.5220.5860.6490.7130.777
600.4780.5490.6210.6690.717
Table 4. Density of hybrid nanofluids.
T, (°C) ϕ = 0.0% ϕ = 0.05% ϕ = 0.1% ϕ = 0.2% ϕ = 0.3%
2010001001.921003.841007.691011.5
259981000.621002.541006.391010.2
30997999.421001.341005.191009.0
35996998.171000.01003.941007.7
40995996.92998.851002.71006.5
45992994.42996.351000.21004.0
50990991.92993.85997.711001.5
55987989.42991.35995.21999.07
60985986.93988.86992.72996.58
Table 5. Specific heat of hybrid nanofluids.
T, (°C) ϕ = 0.0% ϕ = 0.05% ϕ = 0.1% ϕ = 0.2% ϕ = 0.3%
2041784176.244174.484170.974167.45
2541784176.244174.484170.974167.45
3041784176.244174.484170.974167.45
3541784176.244174.484170.974167.45
4041794177.244175.484171.964168.44
4541804178.244176.484172.964169.44
5041814179.244177.484173.964170.44
5541824180.244178.484174.964171.44
6041834181.244179.484175.964172.43
Table 6. Specifications of the solar flat plate collector (FPC).
ParameterValues or Characterization
Area of the collector (m2)3.0
Thickness of the absorber plate (mm)0.6
Absorber tubes outer and inner diameter (mm)11 and 10
Tube spacing (mm)0.15
Outlet temperature (°C)60
Riser, header, and absorber fin materialsCopper
Box dimensions (mm)2300 × 1300 × 100
Risers number9.0
Header inner diameter (mm)25.4
Protrusion inside the header (mm)2.0
hot water storage tank capacity (liters)100
Thickness of the frame1.2
Density of the tank insulation material (kg/m3)48.0
Thickness of the insulation (mm)100
Table 7. The F R τ α , F R U L parameters and their coefficients of determination (R2).
Fluid F R τ α F R U L R2
ϕ = 0.0%−50.932.260.993
ϕ = 0.05%−51.772.720991
ϕ = 0.1%−53.173.420.985
ϕ = 0.2%−52.903.300.986
ϕ = 0.3%−55.433.710.984
Table 8. The measured parameters, their maximum values, and their uncertainties.
S. No.ParameterMaximum ValuesUncertainty, [ X ]
1 D i 0.01 m0.00007 m
2 D o 0.012 m0.00007 m
3 L 2.3 m0.001 m
4 m ˙ 0.0225 kg/s0.000740 kg/s
5 T s 88.5 °C0.1 °C
6 T i 47.5 °C0.1 °C
7 T o 61.81 °C0.1 °C
8 T a 41.9 °C0.1 °C
9 T m 54.65 °C0.1 °C
10 G T 785 W/m20.03 W/m2
11∆P1441.7 Pa1 Pa
Table 9. Different parameters uncertainties.
S. No.ParameterUncertainty
1Reynolds number3.36%
2Pressure drop 6.94 × 10 4 %
3Friction factor 7.40 %
4Heat flow rate 3.29 %
5Nusselt number3.36%
6Thermal efficiency3.36%
Publisher’s Note: MDPI stays neutral with regard to jurisdictional claims in published maps and institutional affiliations.

