
Development of a Digital Twin for Enzymatic Hydrolysis Processes


1
Faculty of Medical and Life Sciences, Furtwangen University, 78054 VS-Schwenningen, Germany
2
Department of Biochemical Engineering, University College London, London WC1H 0AH, UK
*
Authors to whom correspondence should be addressed.
Processes 2021, 9(10), 1734; https://0-doi-org.brum.beds.ac.uk/10.3390/pr9101734
Submission received: 17 August 2021
/
Revised: 16 September 2021
/
Accepted: 23 September 2021
/
Published: 28 September 2021
(This article belongs to the Special Issue Knowledge-Based Control and Modelling of Bioprocesses)
Abstract
:Enzymatic hydrolysis processes can be used to produce organic nutrient media from renewable raw materials. However, many of these processes are not optimally designed, so expensive enzymes and substrates are wasted. Mathematical models and Digital Twins (DTs) are powerful tools, which can be used to optimize bioprocesses and, thus, increase the yield of the desired products. Individual enzymatic hydrolysis processes have already been modeled, but models for the combined starch hydrolysis and proteolysis, or DTs, are not available yet. Therefore, an easily adaptable, dynamic, and mechanistic mathematical model representing the kinetics of the enzymatic hydrolysis process of the combined starch hydrolysis and proteolysis was developed and parameterized using experimental data. The model can simulate the starch hydrolysis process with an agreement of over 90% and the proteolysis process with an agreement of over 85%. Subsequently, this model was implemented into an existing DT of a 20 L stirred tank reactor (STR). Since the DT cannot only map the kinetics of the enzymatic process, but also the STR with the associated periphery (pumps, heating jacket, etc.), it is ideally suited for future process control strategy development and thus for the optimization of enzymatic hydrolysis processes.
1. Introduction
Enzymatic hydrolysis processes, such as starch hydrolysis and proteolysis, play a key role in the production of organic nutrient media, as no toxic chemicals or other additives are needed in these processes. Renewable raw materials containing starch or proteins are split into their main components (e.g., glucose, free amino acids (fAA)) by the enzymes and can then be used by various microorganisms as the basis for their growth and product formation. However, there is still room for optimization of many enzymatic hydrolysis processes due to high enzyme consumption or low substrate conversion. Seasonal fluctuations in the quality of the organic raw materials may also make it necessary to regularly adjust the process conditions and control to achieve the optimal result.
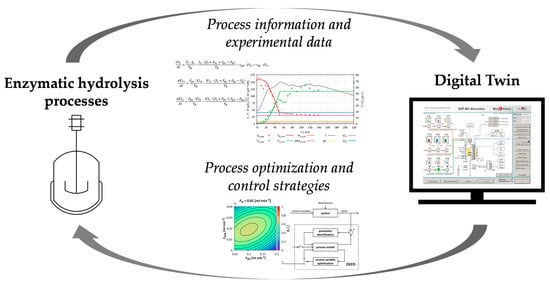
Mathematical models can be used to support the optimization of bioprocesses. Usually, these models represent the micro-kinetics of the reactions under consideration. However, it is beneficial to integrate these kinetic models into a Digital Twin (DT). In many application areas, DTs are becoming more important. Especially in “Industry 4.0”, DTs are becoming increasingly valuable and their application is being studied frequently [1,2,3]. DTs also may represent the reactor macro-kinetics and the dynamics of the system. They are thus ideally suited for systematic optimization of dynamic processes [4,5].
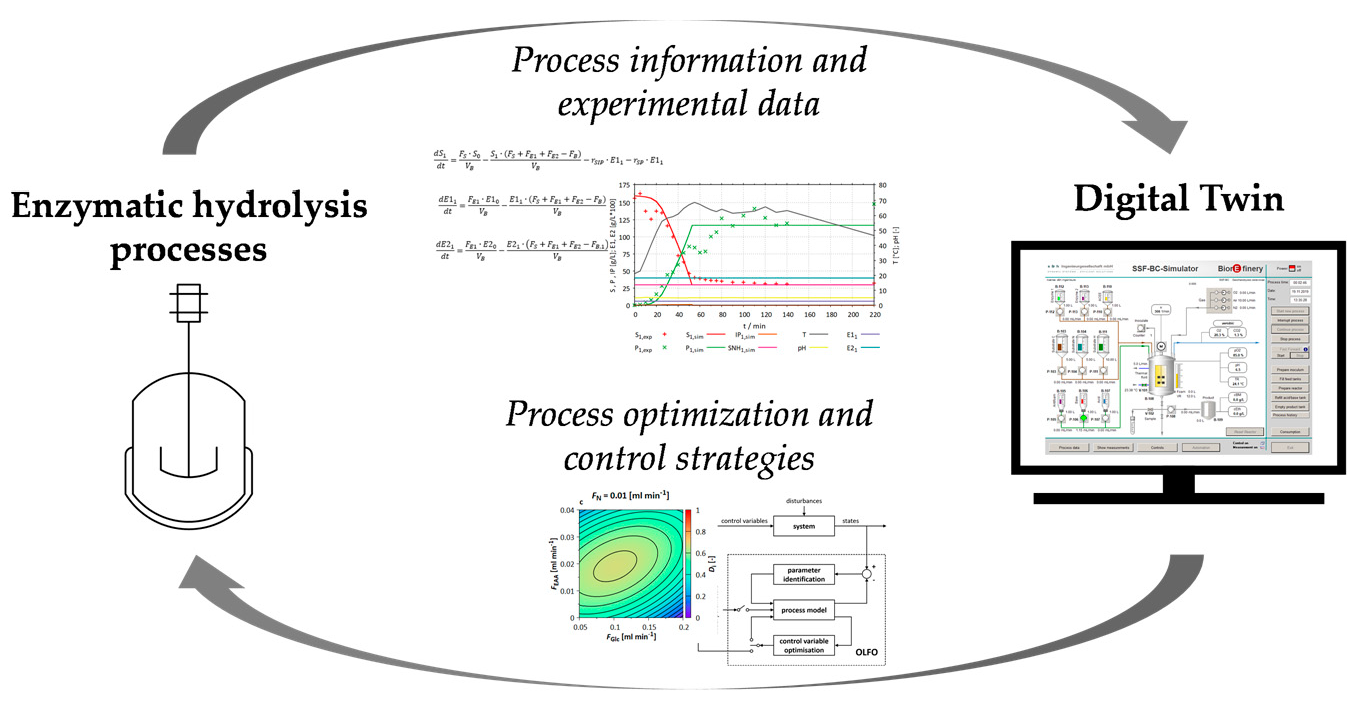
DTs are digital representatives of material or immaterial objects or processes. It is irrelevant whether the counterpart already exists in the real world or will exist in the future. They consist of models of the represented object or process and can also contain algorithms and services that describe or influence the properties or behavior of the represented object or process. The coupling between the real process and the associated DT can take place directly on the running process (process accompanying) or cyclically after the execution of the real process [6,7,8,9,10]. DTs for bioprocesses may be designed, using a shell structure [11,12] (Figure 1), including a biological, a physicochemical, a reactor, a plant and periphery as well as a control and automation sub-model. To facilitate the operation of DTs, they can be equipped with graphical user interfaces (GUIs). These GUIs are designed similarly to the user interfaces of the reactors’ process control systems.
Within the scope of this work, a DT for enzymatic hydrolysis processes was developed. To achieve this, a generic, dynamic, and mechanistic mathematical model for the combined enzymatic starch hydrolysis and proteolysis was developed and integrated with an existing stirred tank reactor (STR) model. During the enzymatic starch hydrolysis, α-amylase splits starch into oligosaccharides, which are subsequently converted into glucose by glucoamylases. In the first step of the enzymatic proteolysis, proteins are converted into peptides by endopeptidases; these peptides are subsequently split into fAA using exopeptidases. Models already exist for the individual hydrolysis processes [13,14,15], but a generic model for the combined process has not yet been developed. The model was designed in such a way that it can be easily adapted to changes in enzyme or substrate properties.
Subsequently, the developed mathematical model for the combined starch hydrolysis and proteolysis was integrated into an existing DT developed by our group [3,16,17,18,19,20,21,22]. This DT has been shown to simulate the cultivation of S. cerevisiae and the whole-cell biocatalysis of ethyl-3-hydroxy-butyrate (E3HB) from the substrate ethyl acetoacetate in a 20 L STR under aerobic and anaerobic conditions [23]. Instead of developing a completely new DT, this DT was used as a basis, because of its ability to represent the characteristics of the STR in which the enzymatic hydrolysis processes are carried out and its associated equipment. Furthermore, once the new process model has been integrated, the entire production cycle, from nutrient media production and cultivation (S. cerevisiae) to the generation of the products ethanol and E3HB can be simulated.
The new DT is intended to provide a tool for the systematic optimization of enzymatic hydrolysis processes.
The materials and methods used for modeling the DT for enzymatic hydrolysis processes, as well as for the experimental realization and the analysis of the enzymatic starch hydrolysis and proteolysis are presented in Section 2. The developed dynamic, mechanistic, mathematical model for the enzymatic hydrolysis processes (combined enzymatic starch hydrolysis and proteolysis) is presented in Section 3 and it is shown how it was combined with an already existing DT. In addition, the comparison between simulation results with the new DT and real experiments is made. Furthermore, it is shown how control strategies can be developed with the new DT for enzymatic hydrolysis processes. Section 4 concludes with a discussion of the results and an outlook.
2. Materials and Methods
This section describes how the dynamic and mechanistic mathematical model of the combined enzymatic starch hydrolysis and proteolysis was created. This model was then implemented into an existing DT representing a 20 L STR. For the generation and validation of the model, experiments of the enzymatic starch hydrolysis and proteolysis were carried out at a small scale (5–10 mL) as well as in STRs (6 L and 20 L).
2.1. Development of the Enzymatic Hydrolysis Process Model
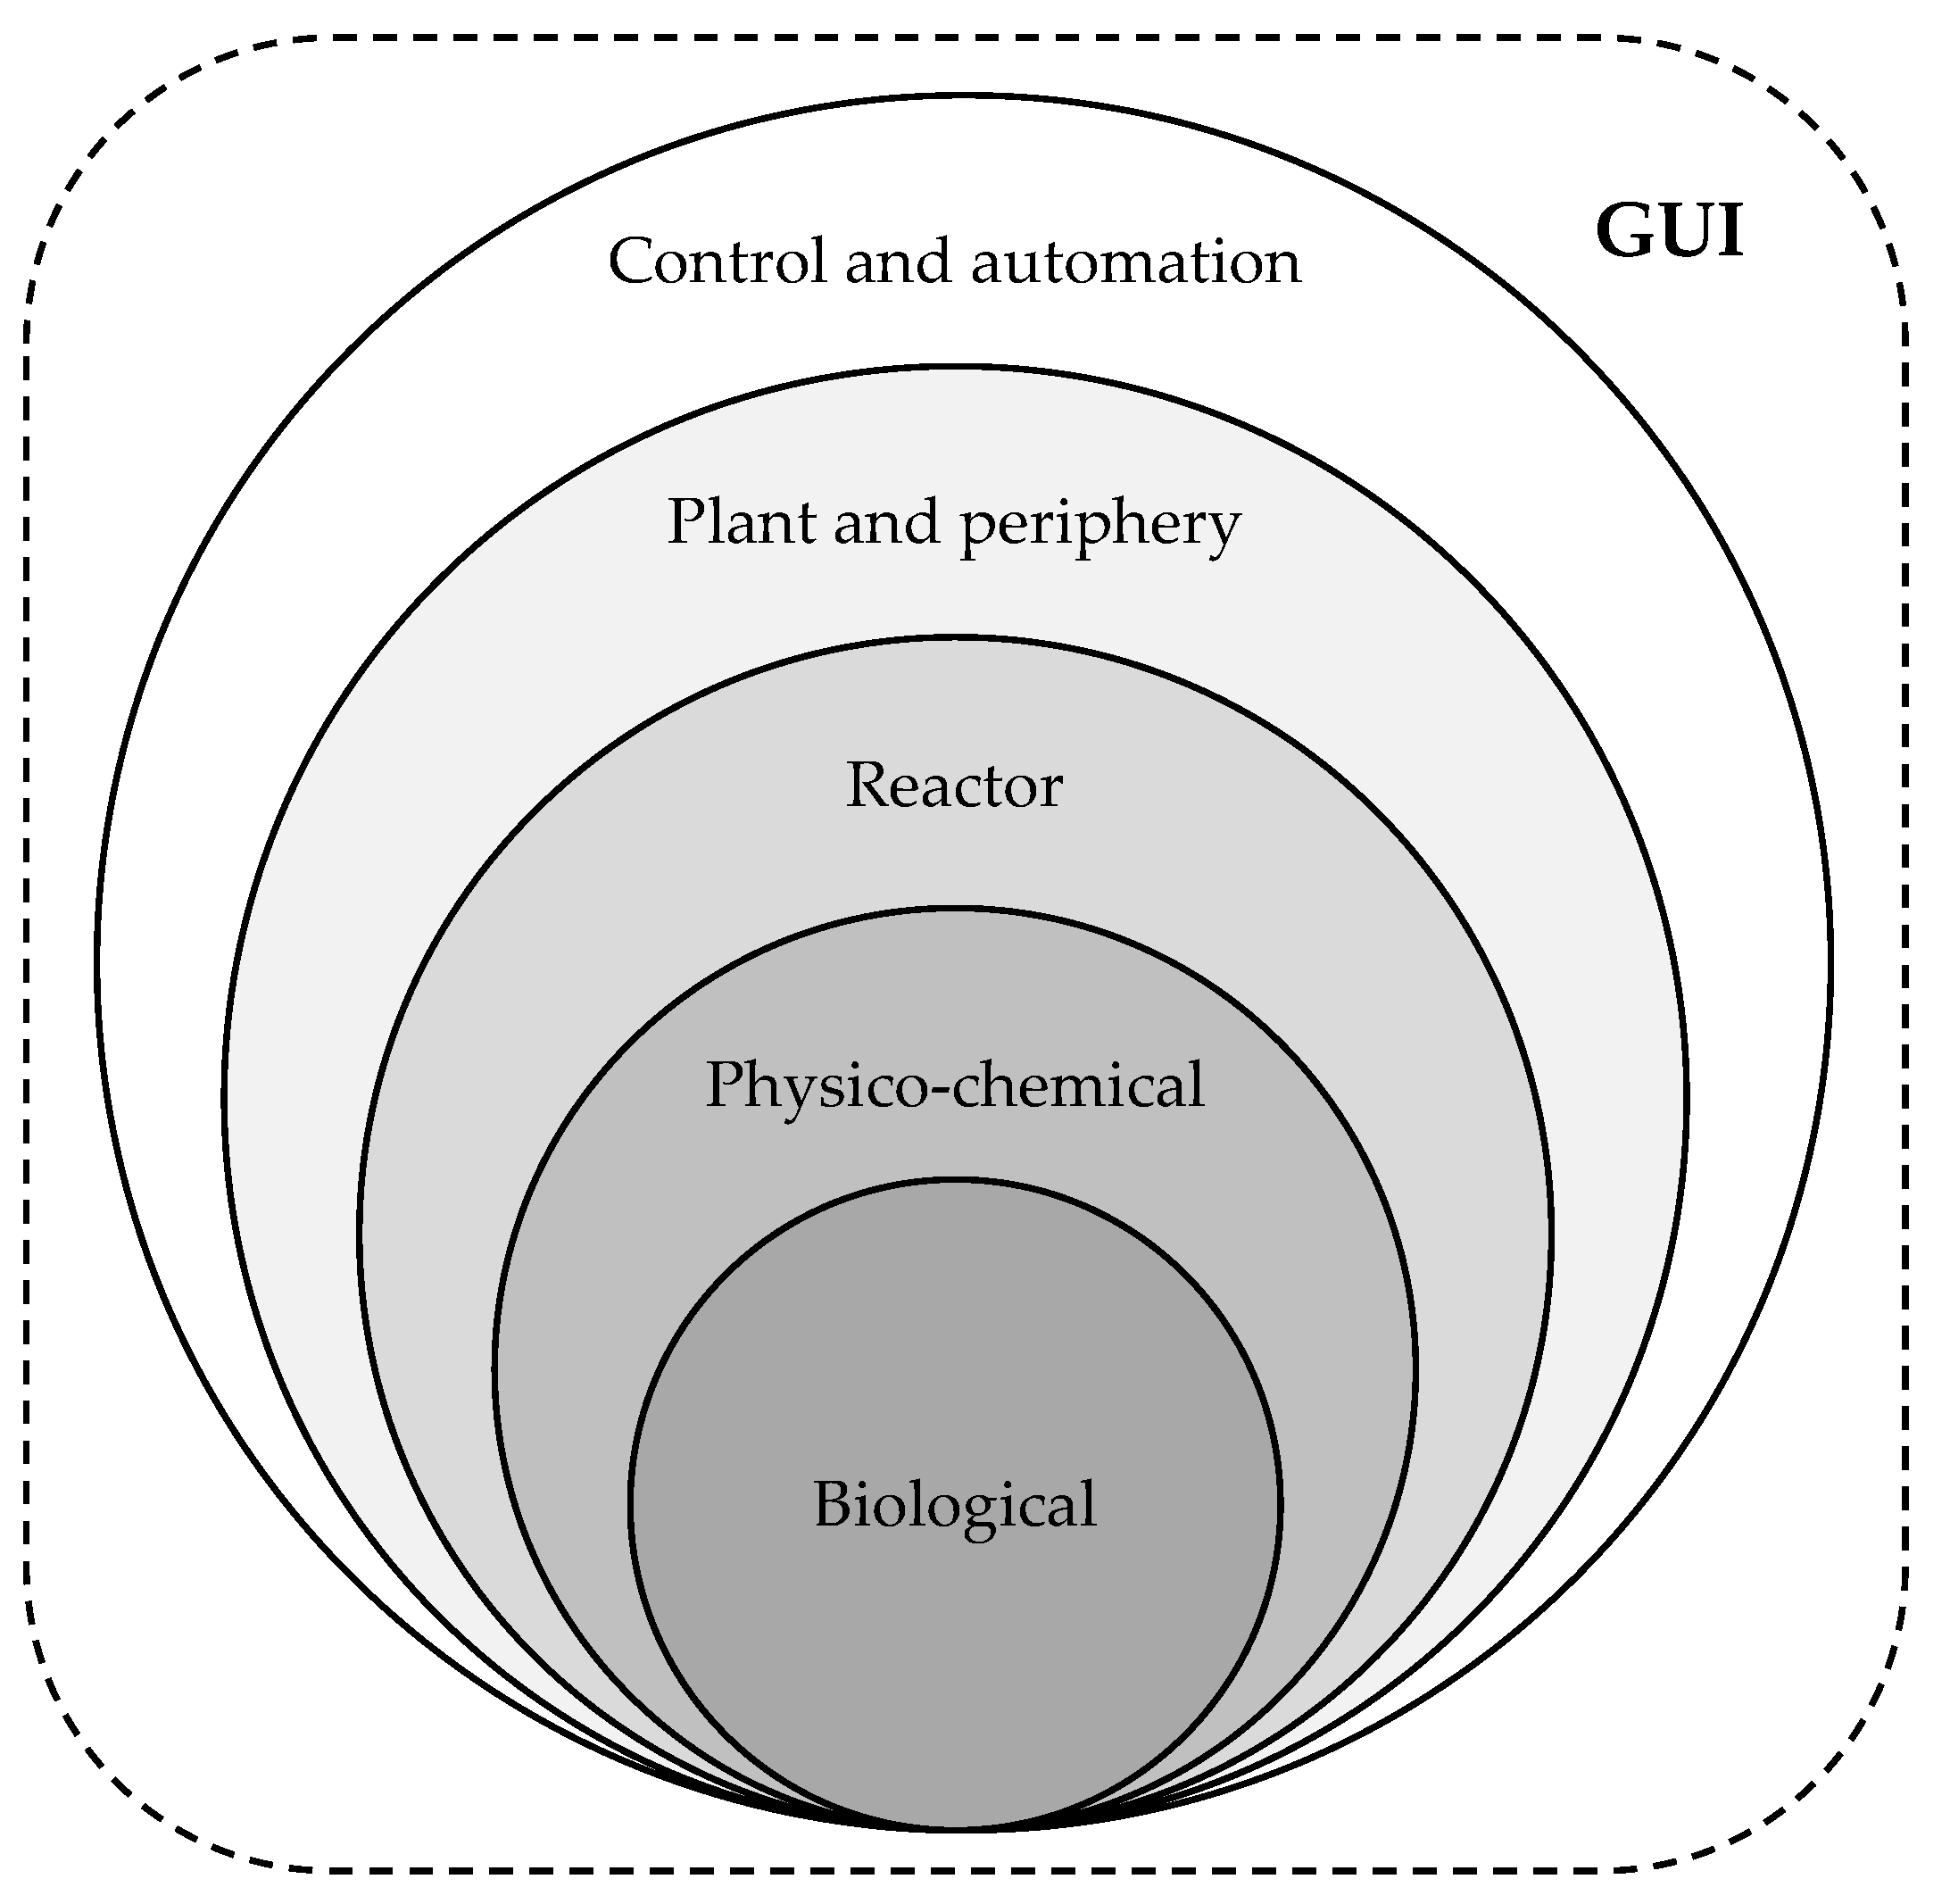
The dynamic and mechanistic mathematical model for the enzymatic hydrolysis processes was developed, applying the modeling cycle [12] shown in Figure 2.
In the first step a dynamic and mechanistic mathematical model [12] representing the kinetics of the enzymatic hydrolysis processes (combined starch hydrolysis and proteolysis) derived from appropriate process descriptions and the knowledge gained from small scale characterization experiments, was developed in the C++-based modeling environment C-eStIM [24]. Subsequently, the model was first parameterized using the experimental data from the characterization experiments.
The model was then used to predict further batch experiments in STRs. After conducting and evaluating these batch experiments for starch hydrolysis and proteolysis, the measured data were compared to the data simulated by the model. Finally, the model was integrated into the existing DT for a 20 L STR with peripheral equipment, mentioned before.
To determine the accuracy of the fit of the model after its parametrization, the coefficient of determination (R2) was calculated by dividing the difference between experimental yi and simulated data ys,i with the difference between the experimental data and their mean value ӯ [25] (Equation (1)).
R2 can take on values between minus infinity and one. An R2 close to one signifies a good fit of the model to the experimental data. If R2 is less than zero, the mean of the measured data points is closer to the mean value than the simulated results.
Initially, the mathematical model was written in C-eStIM, and its parameters were adjusted manually to approximate the measured data. For further parameterization, the model parameters were adapted by minimizing the weighted mean-square deviation (wMSD) using the Nelder–Mead algorithm [25,26]. The Nelder–Mead algorithm was selected because the method is effective and computationally efficient [26]. In addition, the programming environments C-eStIM [24] and R [27] used for this work, offer special Nelder–Mead packages. The wMSD was calculated from the squared difference between the measured value ym and the simulated value ys, divided by the number of data points n in the data set and multiplied by a factor for weighting individual data points kweighting [25] (Equation (2)).
2.2. Integration of the Mathematical Model for the Combined Starch Hydrolysis and Proteolysis into an Existing DT of a 20 L STR
The DT, which was presented in the introduction, consists of four sub-models representing the biological and physical-chemical processes in the reactor and the interactions with associated equipment (plant and periphery). The sub-models were written in the C++-based modeling and simulation environment C-eStIM [24]. The C++ models were implemented in the modular process control and automation system WinErs [28] using C-eStIM-DLL interfaces. In addition, the DT is equipped with a control and automation sub-model as well as the GUI, also created using WinErs.
In the biological sub-model of the DT, the kinetics for the growth of S. cerevisiae, as well as the kinetics of the whole-cell biocatalysis of E3HB are described. The developed mathematical model of the enzymatic hydrolysis processes was embedded in the source code of the biological sub-model. Subsequently, the adapted C-eStIM [24] model was implemented in WinErs [28] using a C-eStIM-DLL interface.
2.3. Enzymatic Hydrolysis Processes (Starch Hydrolysis and Proteolysis)
The experiments of the enzymatic hydrolysis processes (starch hydrolysis and proteolysis) were carried out in small-scale test tubes (V = 1–5 mL) as well as in 6–20 L STRs.
2.3.1. Starch Hydrolysis
For the characterization of the enzymes used in the starch hydrolysis process, 5 mL buffer (pH 2–4 (phosphate citrate buffer), pH 5–8 (phosphate buffer, pH 9–10 (Tris-HCl buffer)), containing 20 g L−1 soluble potato starch (substrate, Carl Roth, Karlsruhe, Germany), 0.05 mg L−1 Termamyl SC (α-amylase, Novozymes, Bagsværd, Denmark) or 0.01 mg L−1 Spirizyme Ultra (glucoamylase, Novozymes, Bagsværd, Denmark) and 0.02 g L−1 calcium chloride dihydrate (CaCl2·2H2O, Merck, Darmstadt, Germany) was added to a 15 mL test tube (VWR, Darmstadt, Germany), mixed and placed in a water bath (T = 0–100 °C). After 10 min, 90 µL of sample was drawn and the reaction was stopped by adding 600 µL of 5 molar hydrochloric acid and heating the sample for 5 min at 80 °C in a heating block (VWR). For the investigation of the pH dependency, the temperature was set to 60 °C. For investigation of the temperature dependency, the pH was set to 5.
The batch starch hydrolysis experiment for the parameterization of the model was performed in a 20 L STR (Biostat C, B. Braun, Melsungen, Germany). Therefore, 13.5 L phosphate citrate buffer (pH = 5), with 160 g L−1 soluble potato starch (substrate, Carl Roth, Karlsruhe, Germany), 0.006 g L−1 Termamyl SC (α-amylase, Novozymes, Bagsværd, Denmark), 0.4 g L−1 Spirizyme Ultra (glucoamylase, Novozymes, Bagsværd, Denmark), and 0.02 g L−1 calcium chloride dihydrate (CaCl2·2H2O, Merck, Darmstadt, Germany) was added to the reactor. The temperature was set to 60 °C and the stirrer speed to 300 rpm. Every 5–10 min, 90 µL of sample were drawn from the reactor. The reaction was stopped by adding 600 µL 5 molar hydrochloric acid, and heating the sample for 5 min at 80 °C in a heating block (VWR, Darmstadt, Germany).
Starch concentrations were determined using the potassium iodide method [29]. A potassium iodide solution was prepared, containing 20 g L−1 potassium iodide (Carl Roth, Karlsruhe, Germany) and 2 g L−1 iodine (Riedel-de Haën, Honeywell, Seelze, Germany), dissolved in H2O. Moreover, 50 µL of potassium iodide solution was added to each sample and hydrochloric acid mixture (690 µL). After that, the absorbance of each sample was measured in a UV–visible spectrophotometer (UV mini 1240, Shimadzu, Nakagyo-ku, Kyoto, Japan) at 623 nm. A calibration line was determined to calculate the concentration of starch in the samples, using standards with a defined amount of soluble potato starch (Carl Roth, Karlsruhe, Germany).
The concentrations of glucose (product), maltose, and sucrose (intermediate products) were determined using an enzymatic assay kit (Maltose/Sucrose/D-Glucose, UV-method, R-Biopharm, Darmstadt, Germany).
2.3.2. Proteolysis
For the characterization of the enzymes used in the proteolysis process, 1 mL buffer (pH 4 (phosphate citrate buffer), pH 5–8 (phosphate buffer, pH 9 (Tris-HCl buffer)) with 2 g L−1 casein powder (substrate, Carl Roth, Karlsruhe, Germany), 0.2 mg L−1 EnerZyme® P7 (endopeptidase, Erbslöh, Geisenheim, Germany) or 0.2 mg L−1 Flavourzyme™ (exopeptidase, Novozymes, Bagsværd, Denmark) was added to a 2 mL test tube (VWR, Darmstadt, Germany), mixed and placed in a water bath (T = 25, 35, 45, 55, 65, 70 °C). After 30 min, 100 µL of sample was drawn and the reaction was stopped by heating the sample for 5 min at 95 °C in a heating block (VWR, Darmstadt, Germany). For the investigation of the pH dependency, the temperature was set to 50 °C. For investigation of the temperature dependency, the pH was set to 7.
The batch proteolysis experiment for the parameterization of the model was performed in a 6 L STR (BioFlo 3000, New Brunswick Scientific, Eppendorf, Hamburg, Germany). Therefore, 3 L phosphate buffer (pH 7.5) with 40 g L−1 organic sunflower seed meal (substrate, All Organic Treasures, Wiggensbach, Germany) containing 14 g L−1 protein, 0.2 g L−1 EnerZyme® P7 (endopeptidase, Erbslöh, Geisenheim, Germany) and 0.2 g L−1 Flavourzyme™ (exopeptidase, Novozymes, Bagsværd, Denmark) were added to the STR. The temperature was set to 50 °C and the stirrer speed to 300 rpm. Every 15 min, samples (2 mL) were drawn from the reactor. The reaction was stopped by heating the sample for 5 min at 95 °C in a heating block (VWR, Darmstadt, Germany).
The fAA (product) concentration was determined using the ninhydrin method [30]. The ninhydrin solution, prepared, was a 1:1 mixture of a solution containing 1.6 g L−1 tin chloride dihydrate (Carl Roth, Karlsruhe, Germany) in citrate-phosphate buffer (pH 5.2) and a solution containing 40 g L−1 ninhydrin (Carl Roth, Karlsruhe, Germany) in ethylene glycol (Carl Roth, Karlsruhe, Germany). 1 mL of ninhydrin solution was added to 100 µL of sample solution and incubated at 80 °C for 20 min in a water bath (WBT 12, Carl Roth, Karlsruhe, Germany). After the addition of 5 mL of isopropyl alcohol (Carl Roth, Karlsruhe, Germany), the absorbance of the mixture was measured in a UV–visible spectrophotometer (UV mini 1240, Shimadzu, Nakagyo-ku, Kyoto, Japan) at 570 nm. Using standards with defined L-glutamic acid (Fluka, Honeywell, Seelze, Germany) concentrations, a calibration curve was determined to calculate the concentration of fAA in the samples.
3. Results
In the subsequent section, brief process descriptions of the enzymatic hydrolysis processes (starch hydrolysis and proteolysis), from which the corresponding mathematical model was derived are presented. In addition, data from experimental studies concerning the reaction rate dependency on temperature and pH value are shown, serving as a basis for the calibration of the corresponding part of the kinetic model. For the parameterization of the model, reactor experiments were pre-simulated and then carried out. After successful reparameterization of the model, the model was embedded into the existing DT. Finally, a simulation study on the interaction between temperature and pro-duct concentrations of starch hydrolysis in a continuously operated STR using the DT is shown.
3.1. Process Description of the Enzymatic Hydrolysis Processes (Starch Hydrolysis and Proteolysis)
In starch hydrolysis, starch is converted into glucose molecules using α- and glucoamylases. α-amylase (α-1,4 glucan glucanohydrolase, EC. 3.2.1.1) catalyzes the hydrolysis of 1,4-α-D-glucosidic linkages in polysaccharides, containing three or more 1,4-α-linked D-glucose units randomly. Starch is degraded to low molecular weight dextrin, limited by α-1,6 bonds in a way that a-amylase is unable to hydrolyze. Glucoamylase (1,4-α-D-glucan glucohydrolase, EC 3.2.1.3) is a multi-domain exo-glycosidase that catalyzes the hydrolysis of α-1,4 and α-1,6 glucosidic linkages of starch and related polysaccharides to release β-D-glucose from the non-reducing ends [31,32,33].
During proteolysis, proteins are split into fAA and di- and tripeptides using endo- and exopeptidases. Peptidases split proteins by hydrolysis of the peptide bonds. Endopeptidases enzymatically split peptide bonds within the protein. In contrast to the endopeptidases, the exopeptidases only split terminal peptide bonds of the amino acid sequence [34].
For starch hydrolysis and proteolysis, reaction rates can be calculated using Michaelis–Menten kinetics, with maximal reaction rates (rmax), half-saturation constants (KS) and the substrate concentration (csubstrate) (Equation (3)).
Michaelis–Menten kinetics was chosen because it has already been successfully applied by other research groups for the modeling of the enzymatic hydrolysis processes under investigation [13,14,15,35]. In addition, the relatively simple structure of the kinetics offers rapid adaptability, which supports the generic approach of the model.
3.2. Mathematical Modeling of the Enzymatic Hydrolysis Process Combining Starch Hydrolysis and Proteolysis
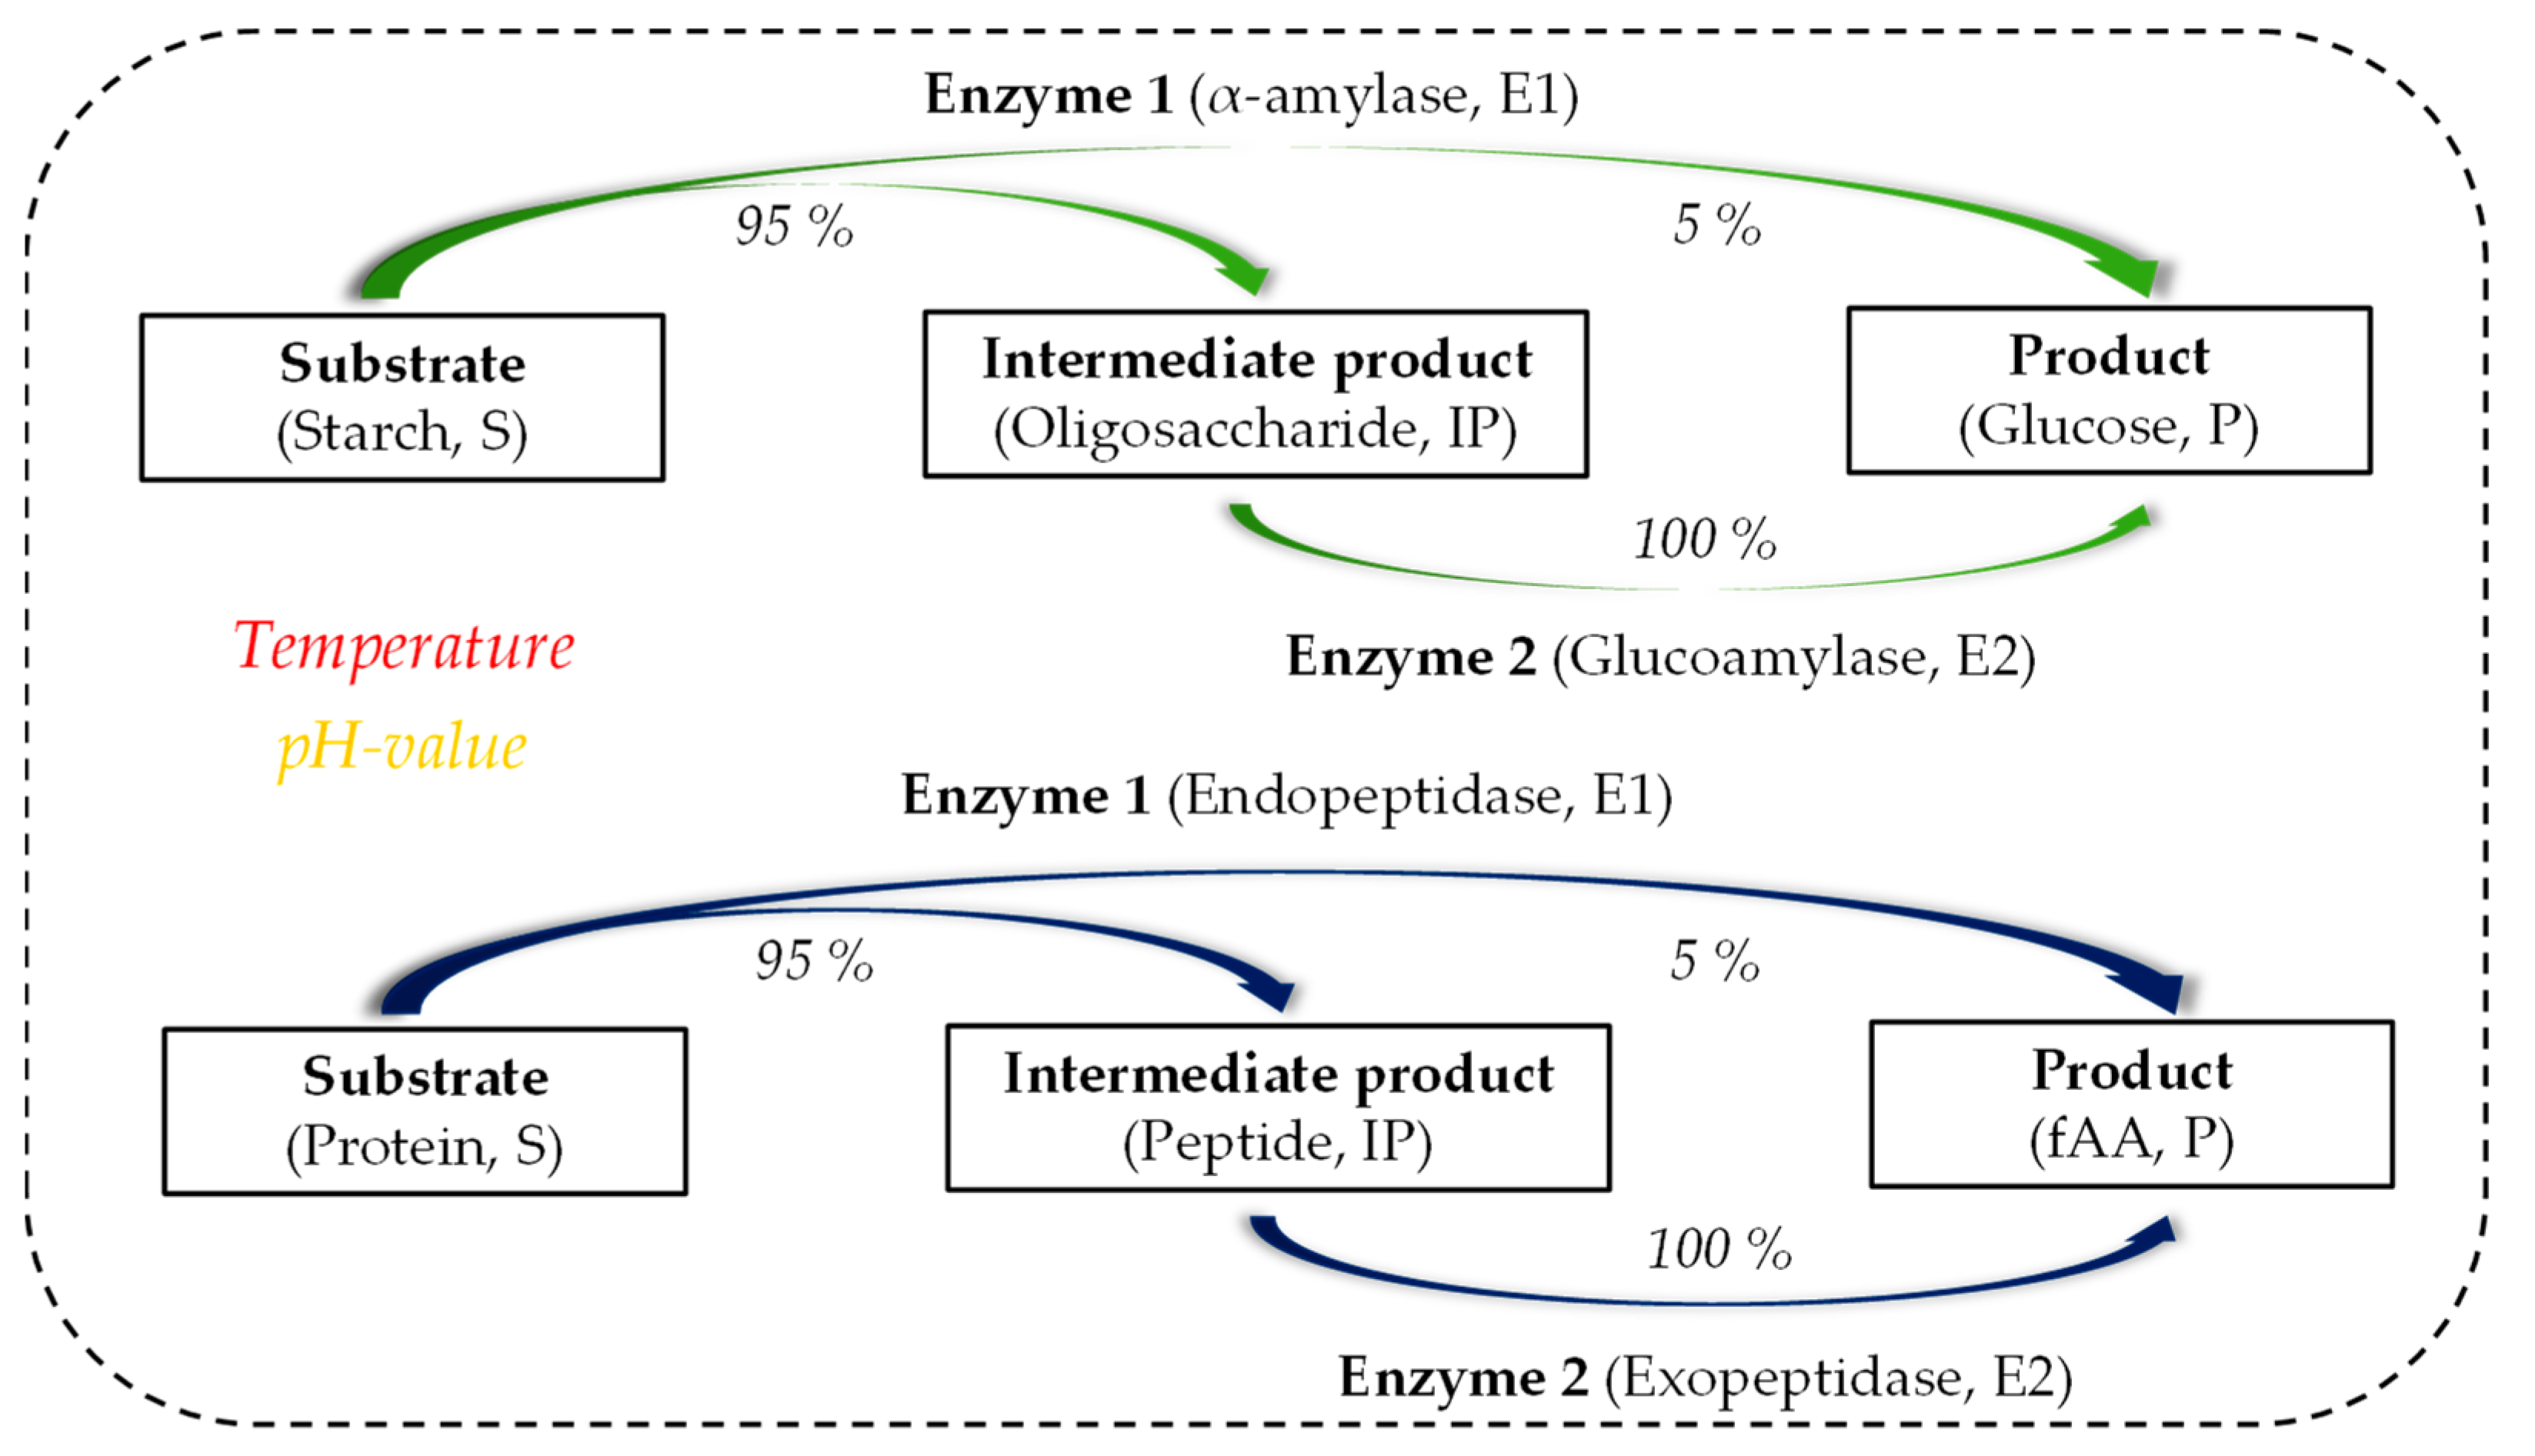
The structure of the mathematical model is illustrated in Figure 3.
It is assumed that the substrates for starch hydrolysis and proteolysis are composed of hydrolysable and non-hydrolysable components. Depending on the substrate used, the ratio must be set before the simulation experiment. The yield coefficients (YIPS,E1, YPS,E1, YPIP,E2) used in the model were based on assumptions derived from literature data [31,32,33,34].
During starch hydrolysis, 95% of the hydrolysable components of the substrate are converted by α-amylase into the intermediate product and 5% directly into glucose. The intermediate product formed is then converted by glucoamylase to 100% into glucose. Similarly, in proteolysis, 95% of the hydrolysable components of the substrate are converted by endopeptidase into the intermediate product and 5% directly into fAA. The intermediate product formed is then converted by exopeptidase to 100% into fAA.
The model equations for starch hydrolysis and proteolysis have a similar structure and are indicated by suffixes P1 (starch hydrolysis) and P2 (proteolysis). In the interest of simplicity, the general equations are presented below without the suffixes (Equations (4)–(20). The abbreviations used in the model are shown in Table 1.
Michaelis–Menten kinetics were implemented in the model for the calculation of the reaction rates, where the maximum reaction rates were modulated with functions describing the influence of temperature and pH (Equations (4)–(6)). Equations (7)–(9) representing the conversation rates. The denaturation rates of the enzymes are calculated using Equations (10) and (11).
The differential equations in the model were created using the general dynamic mass balance (Equation (12)).
The reactor model of an ideally mixed STR consists of seven differential equations (Equations (13)–(19)). The influence of temperature and pressure on the differential equations is neglected in the model. In addition, the overall substrate concentration is given by Equation (20).
3.3. Temperature- and pH-Dependency of the Enzymes Used in Starch Hydrolysis and Proteolysis
The results of the enzyme characterization experiments were normalized to values between 0 and 1 for the individual temperatures or pH values. A value of 1 corresponds to the temperature or pH value at which the highest concentration of product was formed. Furthermore, double sigmoidal (DSig) equations (Equation (21)) [36,37] were fitted to the experimental data.
The value of a state variable is described by x. YLS is the value at low x, YRS is the value at high x, Ymid is the value between rmax,low and rmax,high, which are location parameters of the low/high side of the function, KLS determines the slope on the low side and KRS determines the slope on the high side of the function.
These DSig equations are used in the mathematical model of the enzymatic hydrolysis processes to fit the temperature and pH dependency of the enzymes. In the model, the factors (fDSig(x)) resulting from the double sigmoidal equations are multiplied by the maximum reaction rates (rmax).
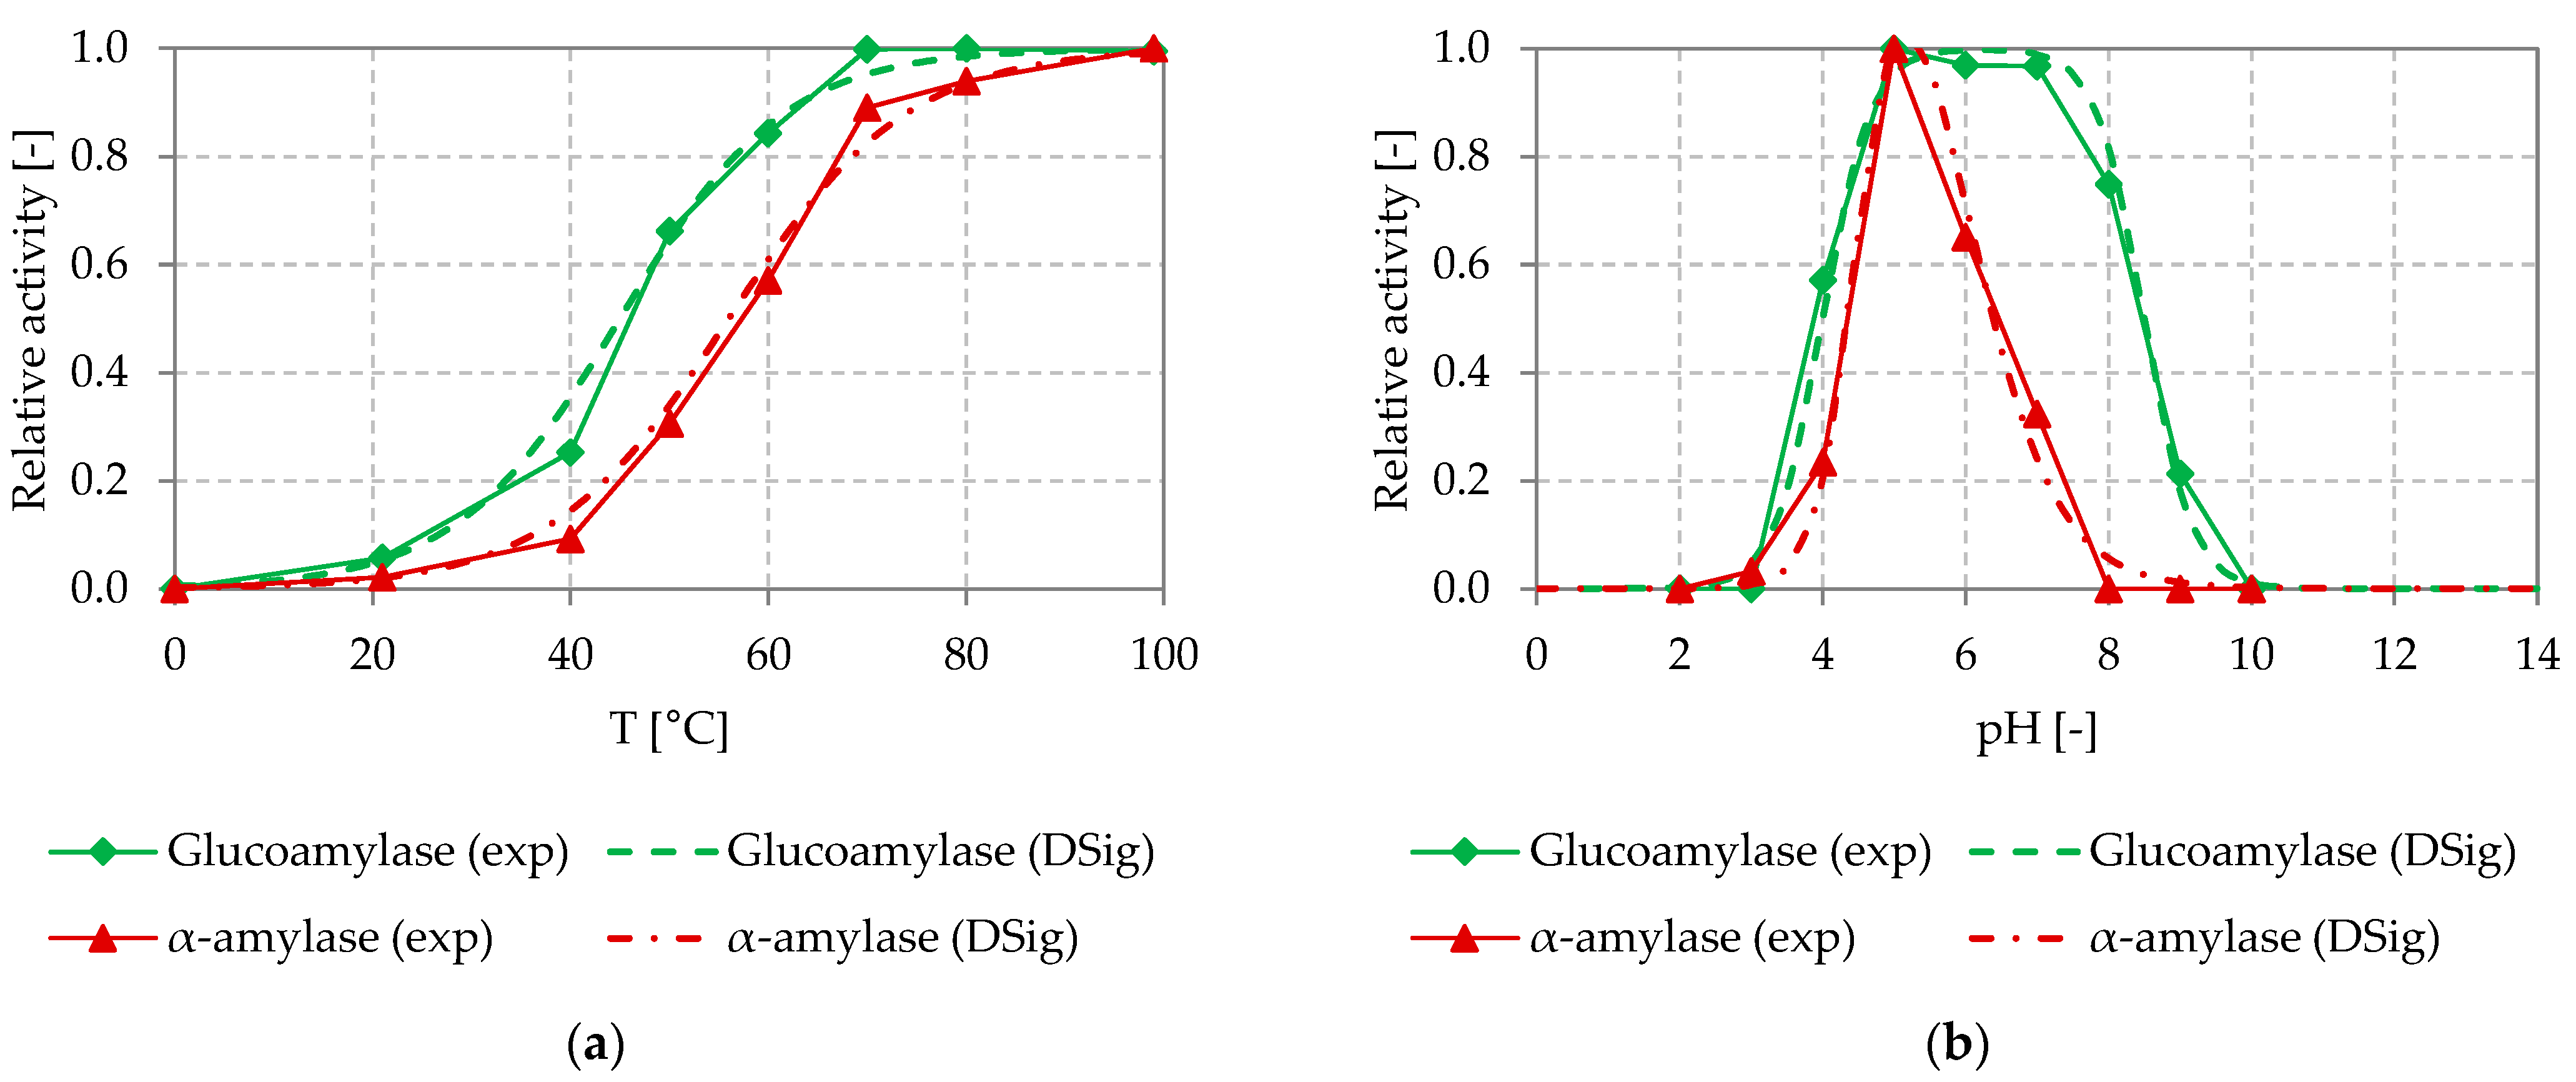
Figure 4 shows the experimentally determined temperature and pH dependency of the α-amylase and glucoamylase used in the starch hydrolysis process, as well as the DSig equations adapted to it (temperature (a) and pH (b)).
For the α-amylase and the glucoamylase, almost no activity could be determined at temperatures below 20 °C. The activity of the α-amylase increased at the highest rate between 40 and 70 °C. The maximal activity was reached at 100 °C. Similarly, the highest increase in activity of the glucoamylase was found between 40 and 60 °C. The maximum activity was reached at 70 °C and above. The results correspond to the manufacturer’s specifications for these thermostable enzymes [38,39]. At temperatures between 40 and 80 °C, varying temperatures lead to clear changes of enzymatic activity. Here, good temperature control is required to achieve a stable process performance.
The α-amylase shows almost no activity at pH-values below 3 and above 8. The maximum activity was reached at a pH of around 5. For the glucoamylase, almost no activity could be determined at pH-values below 3 and above 10. The highest activity was found in a pH range between 5 and 7. At pH values between 3 and 8 (10), varying pH values lead to clear changes of enzymatic activity. Thus, in this range, good pH control is required to achieve a stable process performance.
The DSig functions could be fitted to the experimentally determined temperature and pH dependency of the glucoamylase and α-amylase investigated, by setting the parameters of the DSig equations as shown in Table 2.
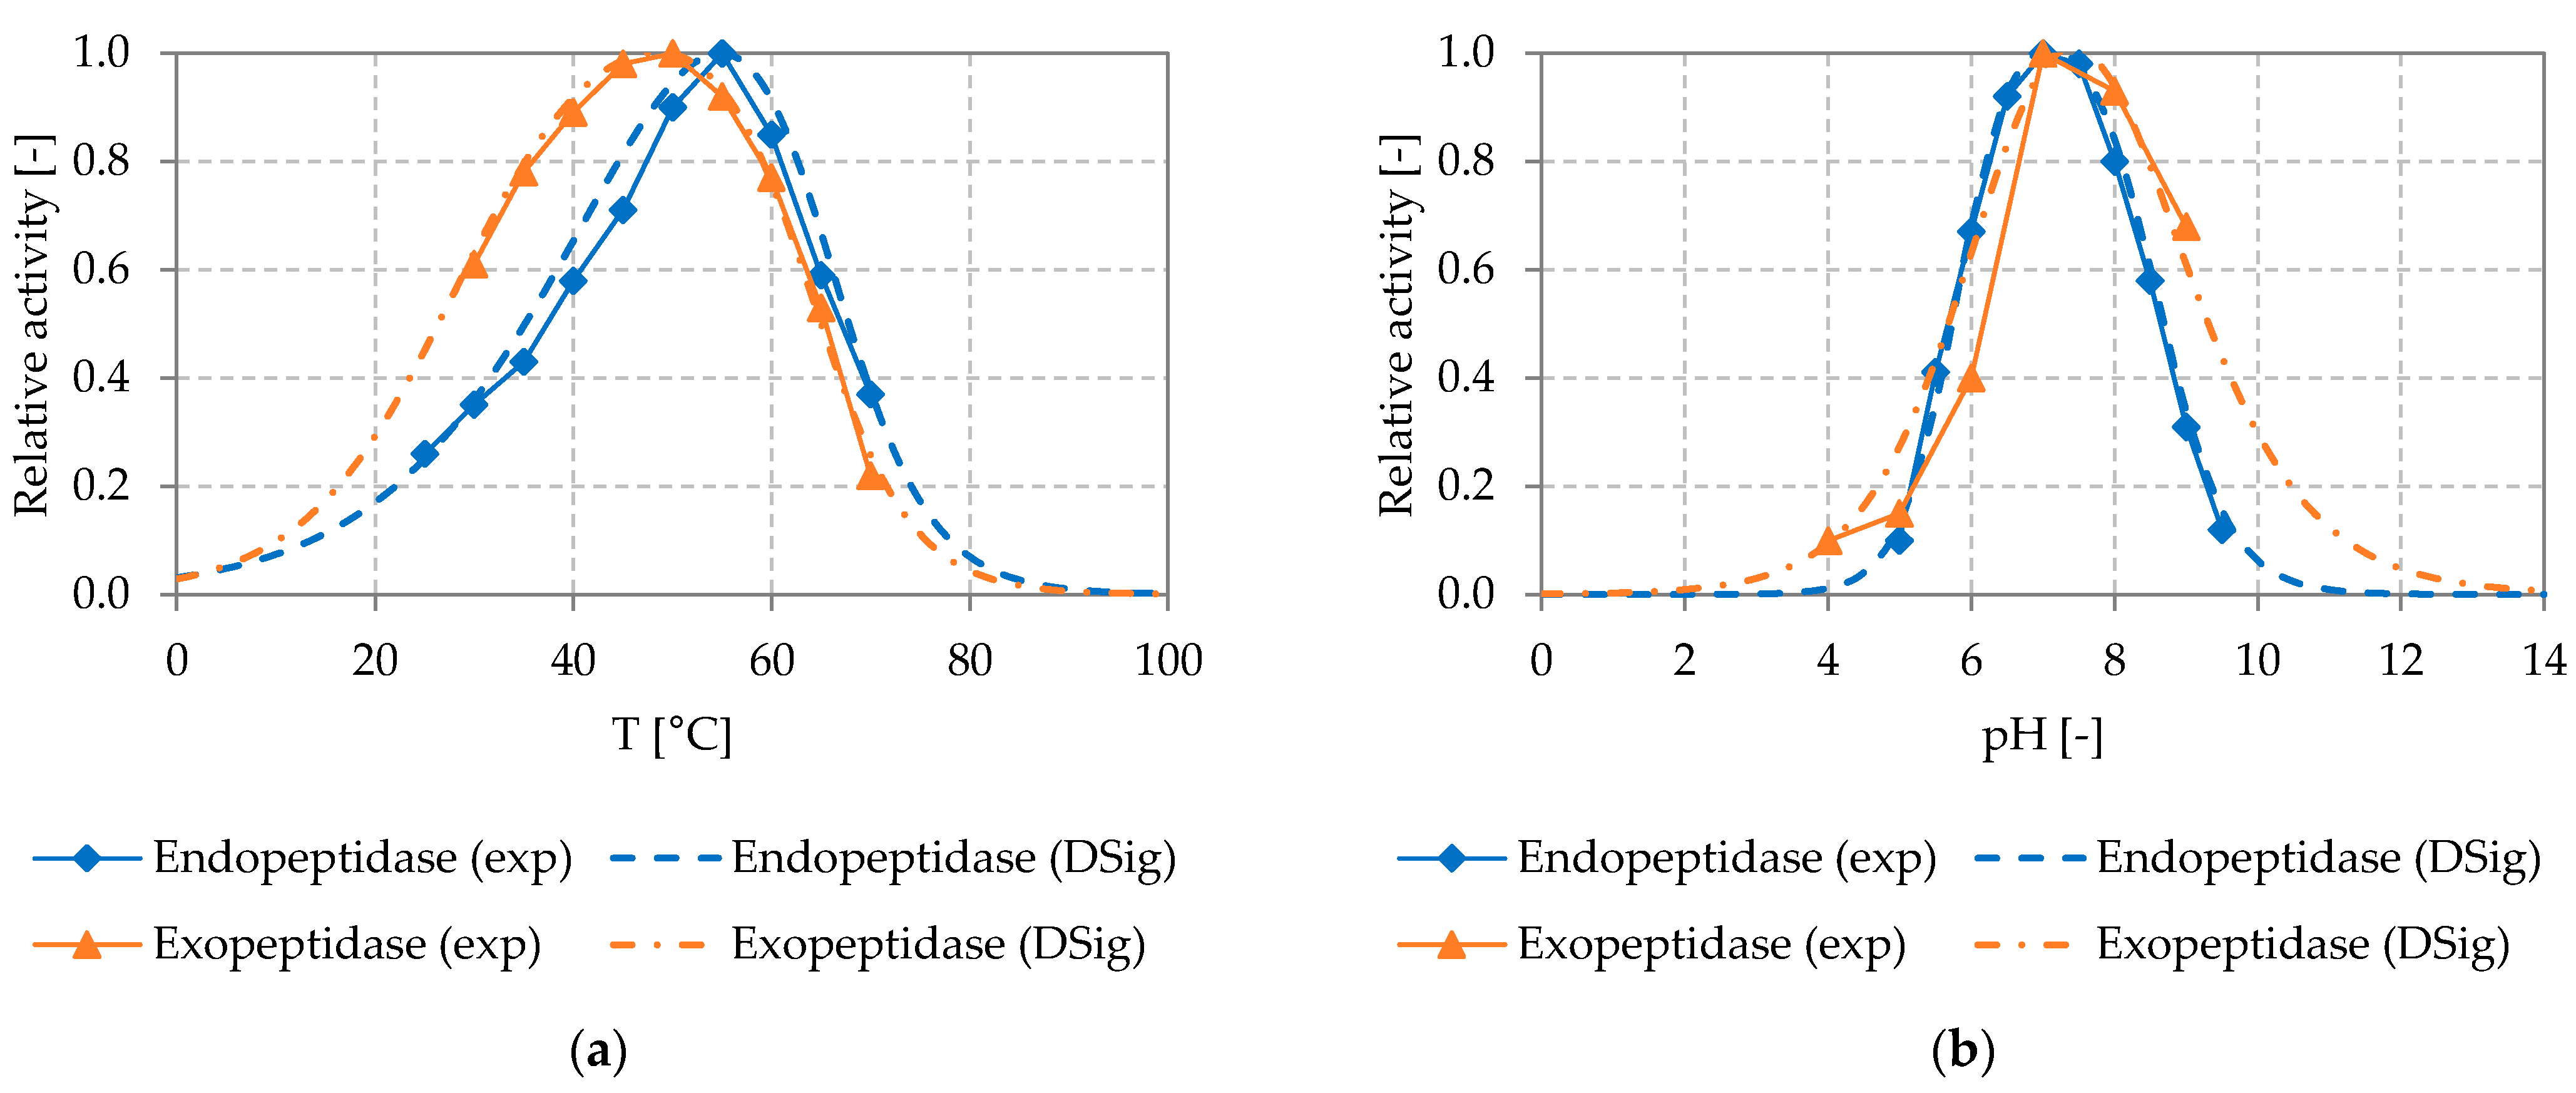
Figure 5 shows the experimentally determined temperature and pH dependency of the relative activity of the endo- and exopeptidase used in the proteolysis process, as well as the DSig equations adapted to it (temperature (a) and pH (b)).
For the endopeptidase and exopeptidase, only low activities could be determined at temperatures below 30 °C and above 70 °C and at pH values below 5 and above 10. The endopeptidase showed the highest activity at a temperature of around 55 °C and a pH of about 7. Similarly, the exopeptidase showed the highest activity at a temperature of about 50 °C and a pH value of about 7. At temperatures between 40 and 80 °C and pH values between 5 and 9, varying temperatures and pH values lead to clear changes of enzymatic activity. Here, good temperature and pH control is required to achieve a stable process performance.
The DSig functions could be fitted to the experimentally determined temperature and pH dependency of the endo- and exopeptidase investigated, by setting the parameters of the DSig equations as shown in Table 3.
Due to the detailed representation of the temperature and pH dependency of the enzymes, the model can be used to find the temperature and pH values at which the two enzymatic processes run best in combination. It is of major importance that the subsequent DT can reproduce the properties of the enzymes, to predict the optimal process settings.
3.4. Designing Experiments Using the Model of the Enzymatic Hydrolysis Processes
To ensure the usability of the subsequent DT, the accuracy of the developed model for enzymatic hydrolysis processes was investigated. Therefore, batch experiments for starch hydrolysis and proteolysis in the STR were planned and simulated with the developed model. The preliminary parametrization was derived from the characterization experiments described before. Subsequently, the experiments were carried out and the model parameterization was adjusted if necessary.
3.4.1. Starch Hydrolysis
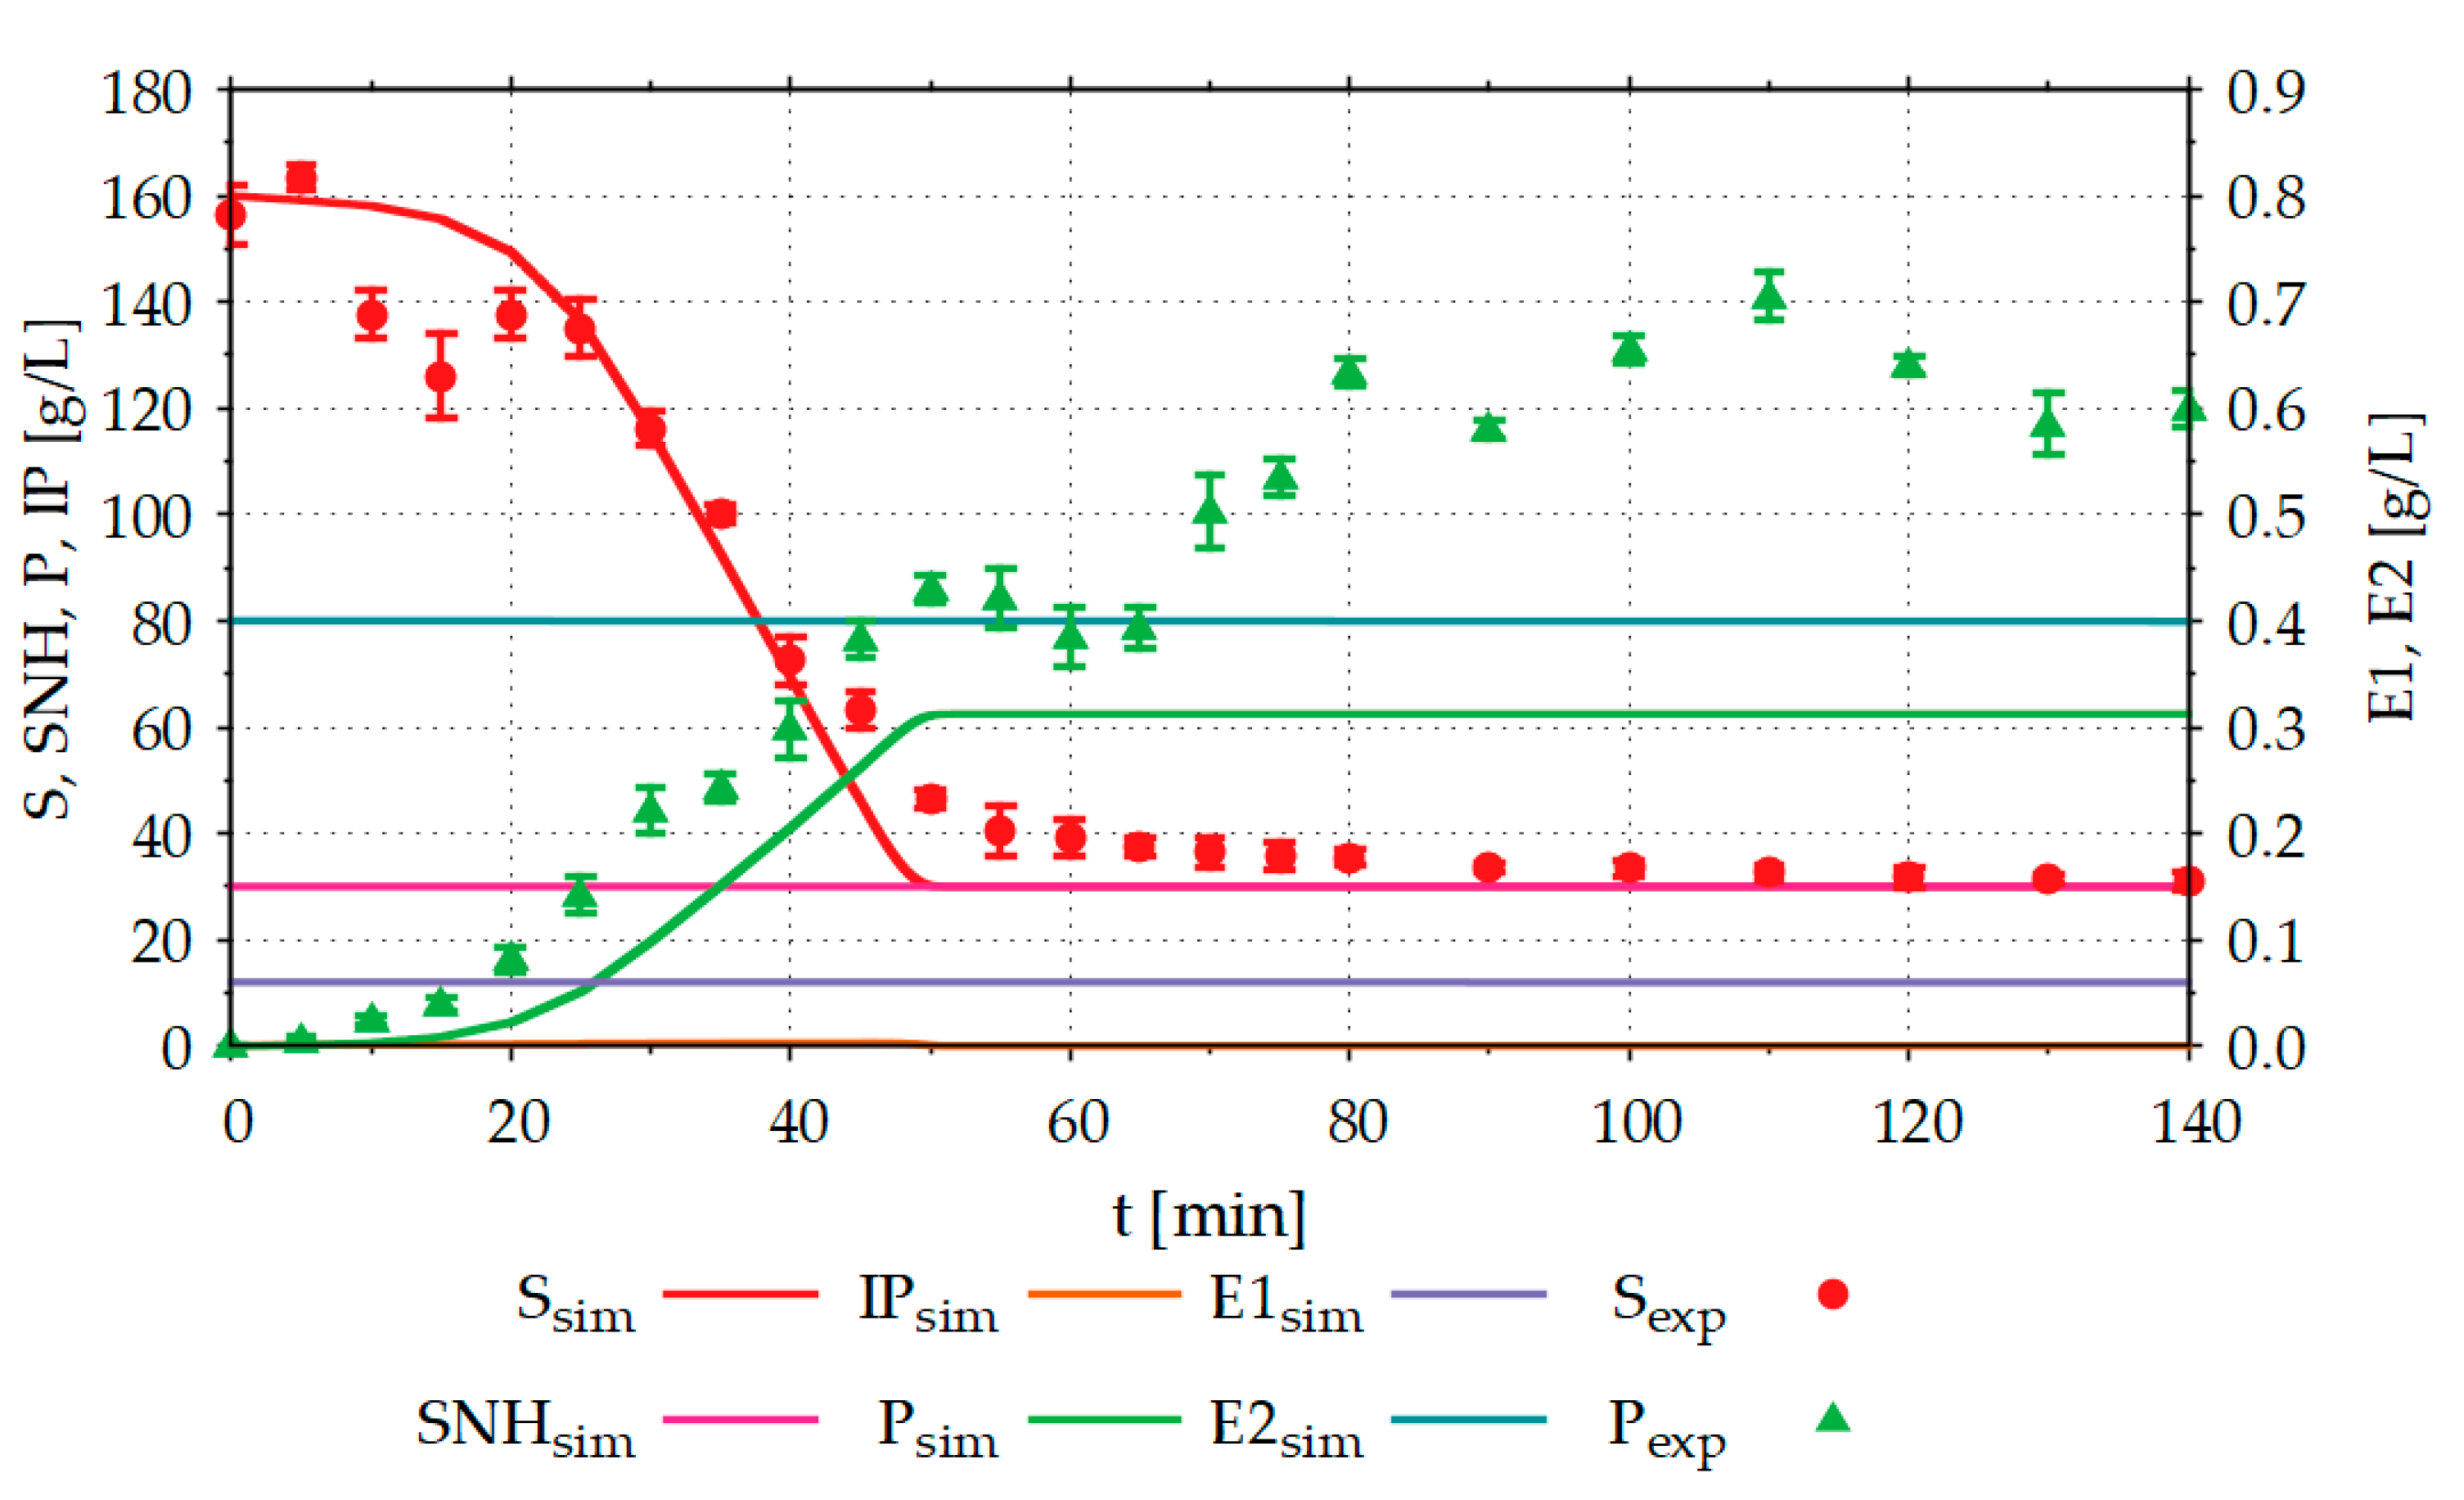
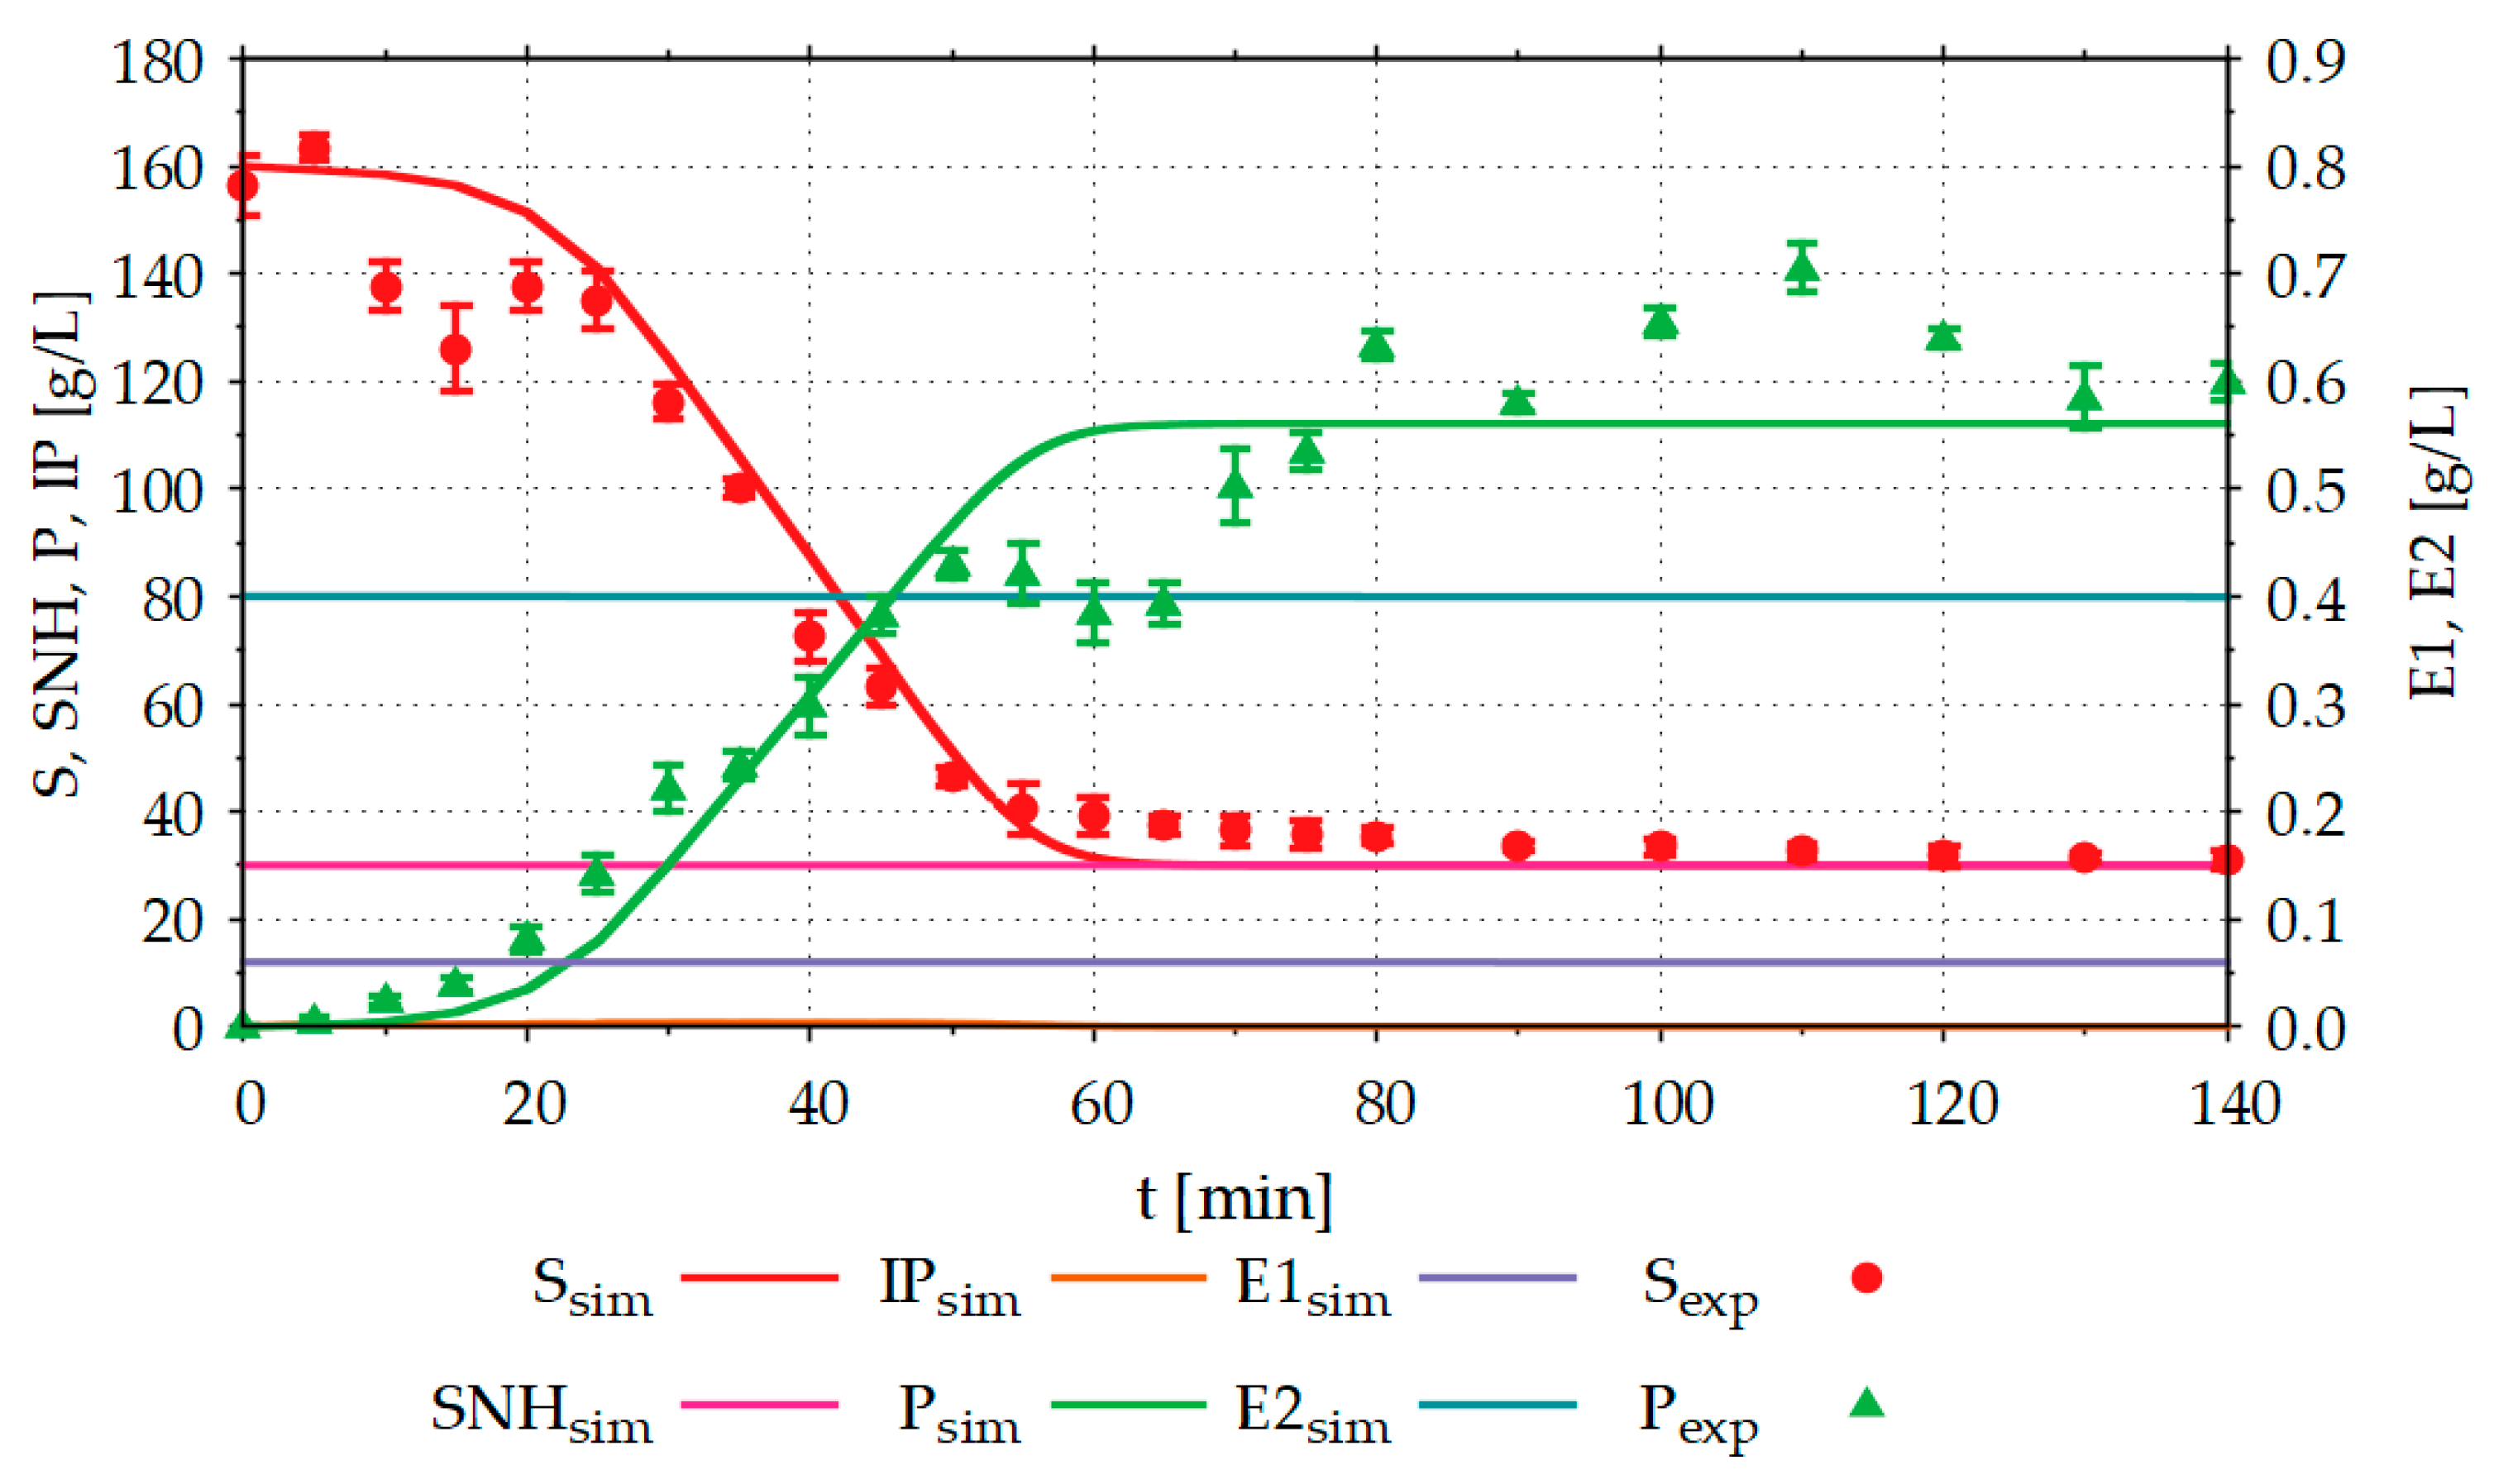
Figure 6 compares the results of the starch hydrolysis experiments in the STR with the results simulated in advance with the model.
About 120 g L−1 of the product (glucose) was formed from 125 g L−1 hydrolysable substrate (starch) in a processing time of 140 min. The results simulated in advance with the model, deviate from the experimentally determined results particularly for the product formed. In the simulation, the product concentration (Psim) reaches a maximum value of around 60 g L−1 and is, thus, only half as large as the experimentally determined product concentration of around 120 g L−1. In addition to the substrate (Ssim), intermediate product (IPsim) and product (Psim) concentrations, the model also calculates the concentrations of non-hydrolysable components of the substrate (SNHsim) and the two enzymes (E1sim, E2sim) used. E1sim and E2sim show slight decreases due to enzyme denaturation. Since the experiment shown was carried out close to the temperature and pH optimum of the enzymes, this denaturation is very low. To investigate the critical process areas with the model or the DT, it is necessary to be able to simulate the concentrations of the enzymes. In the batch experiment shown, SNHsim is constant. However, if the model or the DT is used to simulate fed-batch experiments, it is important to know the concentration of the non-hydrolysable components of the substrate to avoid accumulation in the reactor.
For higher accuracy of the model, it was reparametrized using the new measurement data. For reparameterization, the maximum reaction rates (rmax), as well as the half-saturation constants (KM), were adjusted according to Table 4.
After reparameterization, rmax,SIP,E1,P1 was increased from 1.10 s−1 to 2.00 s−1, rmax,SP,E1,P1 was lowered from 1.30 s−1 to 0.10 s−1, rmax,IPP,E2,P1 was increased from 1.80 s−1 to 1.99 s−1, KM,SIP,E1,P was increased from 1.40 g L−1 to 15.04 g L−1, KM,SP,E1,P1 was increased from 9.00 g L−1 to 20.00 g L−1 and KM,IPP,E2,P1 was lowered from 9.00 g L−1 to 8.32 g L−1. Figure 7 shows the comparison between the simulated and the experimental results after reparameterization of the model.
After adjustment of the model parameters, the simulated trajectories fit the experimental data much better than before. Reparameterization increased the coefficient of determination (R2) for the substrate from 0.95 to 0.96, and for the product from 0.20 to 0.88.
3.4.2. Proteolysis
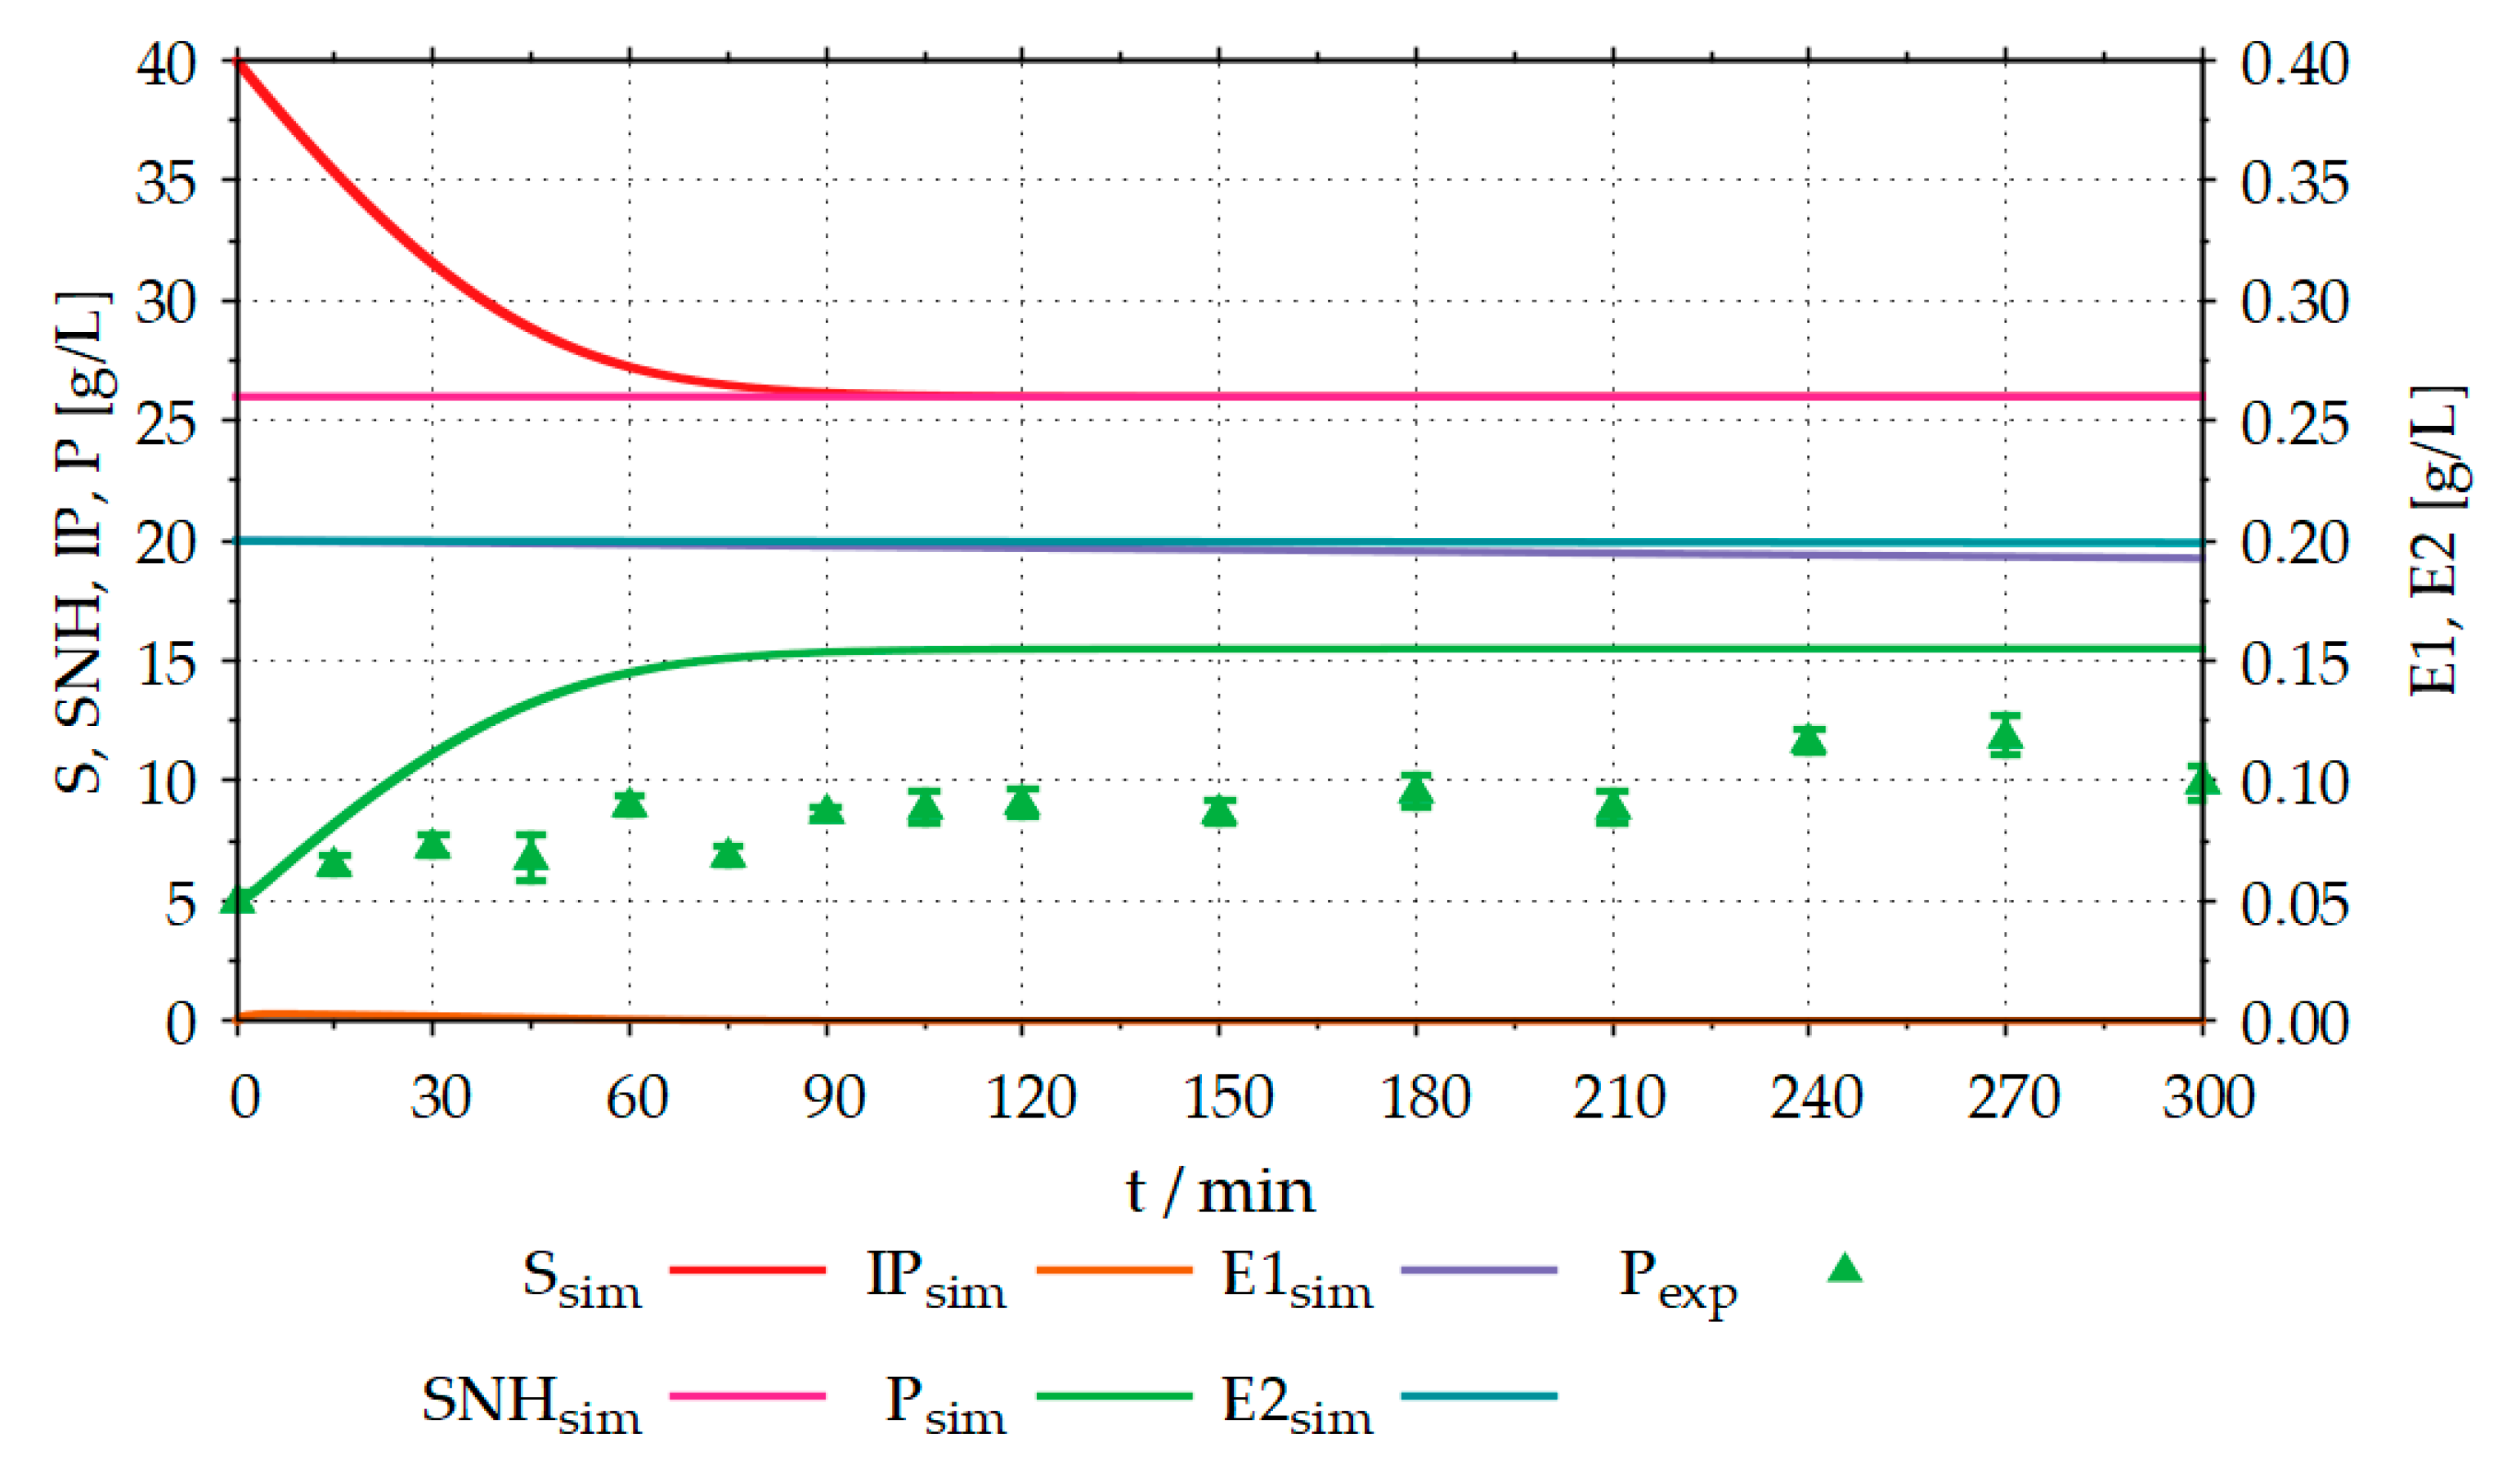
Figure 8 compares the results of the proteolysis experiment in the STR with the results simulated by the model.
About 5–6 g L−1 of product (fAA) were formed from, approximately, an estimated 14 g L−1 hydrolysable substrate (protein) in a processing time of 300 min. The results simulated in advance with the model, deviate from the experimentally determined results. In the simulation, the product concentration (Psim) reaches a maximum value of around 15 g L−1 and is thus approximately 3 g L−1 higher than the experimentally determined product concentration of around 12 g L−1. In addition to the substrate (Ssim), intermediate product (IPsim) and product (Psim) concentrations, the model also calculates the concentrations of non-hydrolysable components of the substrate (SNHsim) and the two enzymes (E1sim, E2sim) used. E1sim and E2sim show slight decreases due to enzyme denaturation. Since the experiment shown was carried out close to the temperature and pH optimum of the enzymes, this denaturation is very low. Moreover, in proteolysis, it is necessary to be able to simulate the concentrations of the enzymes and the non-hydrolysable components of the substrate. The reasons for this correspond to those described in the previous section.
For higher accuracy of the model, it was reparametrized using the new measurement data. Reparameterization led to new values of the maximum reaction rates (rmax), as well as the half-saturation constants (KM) that were adjusted according to Table 5.
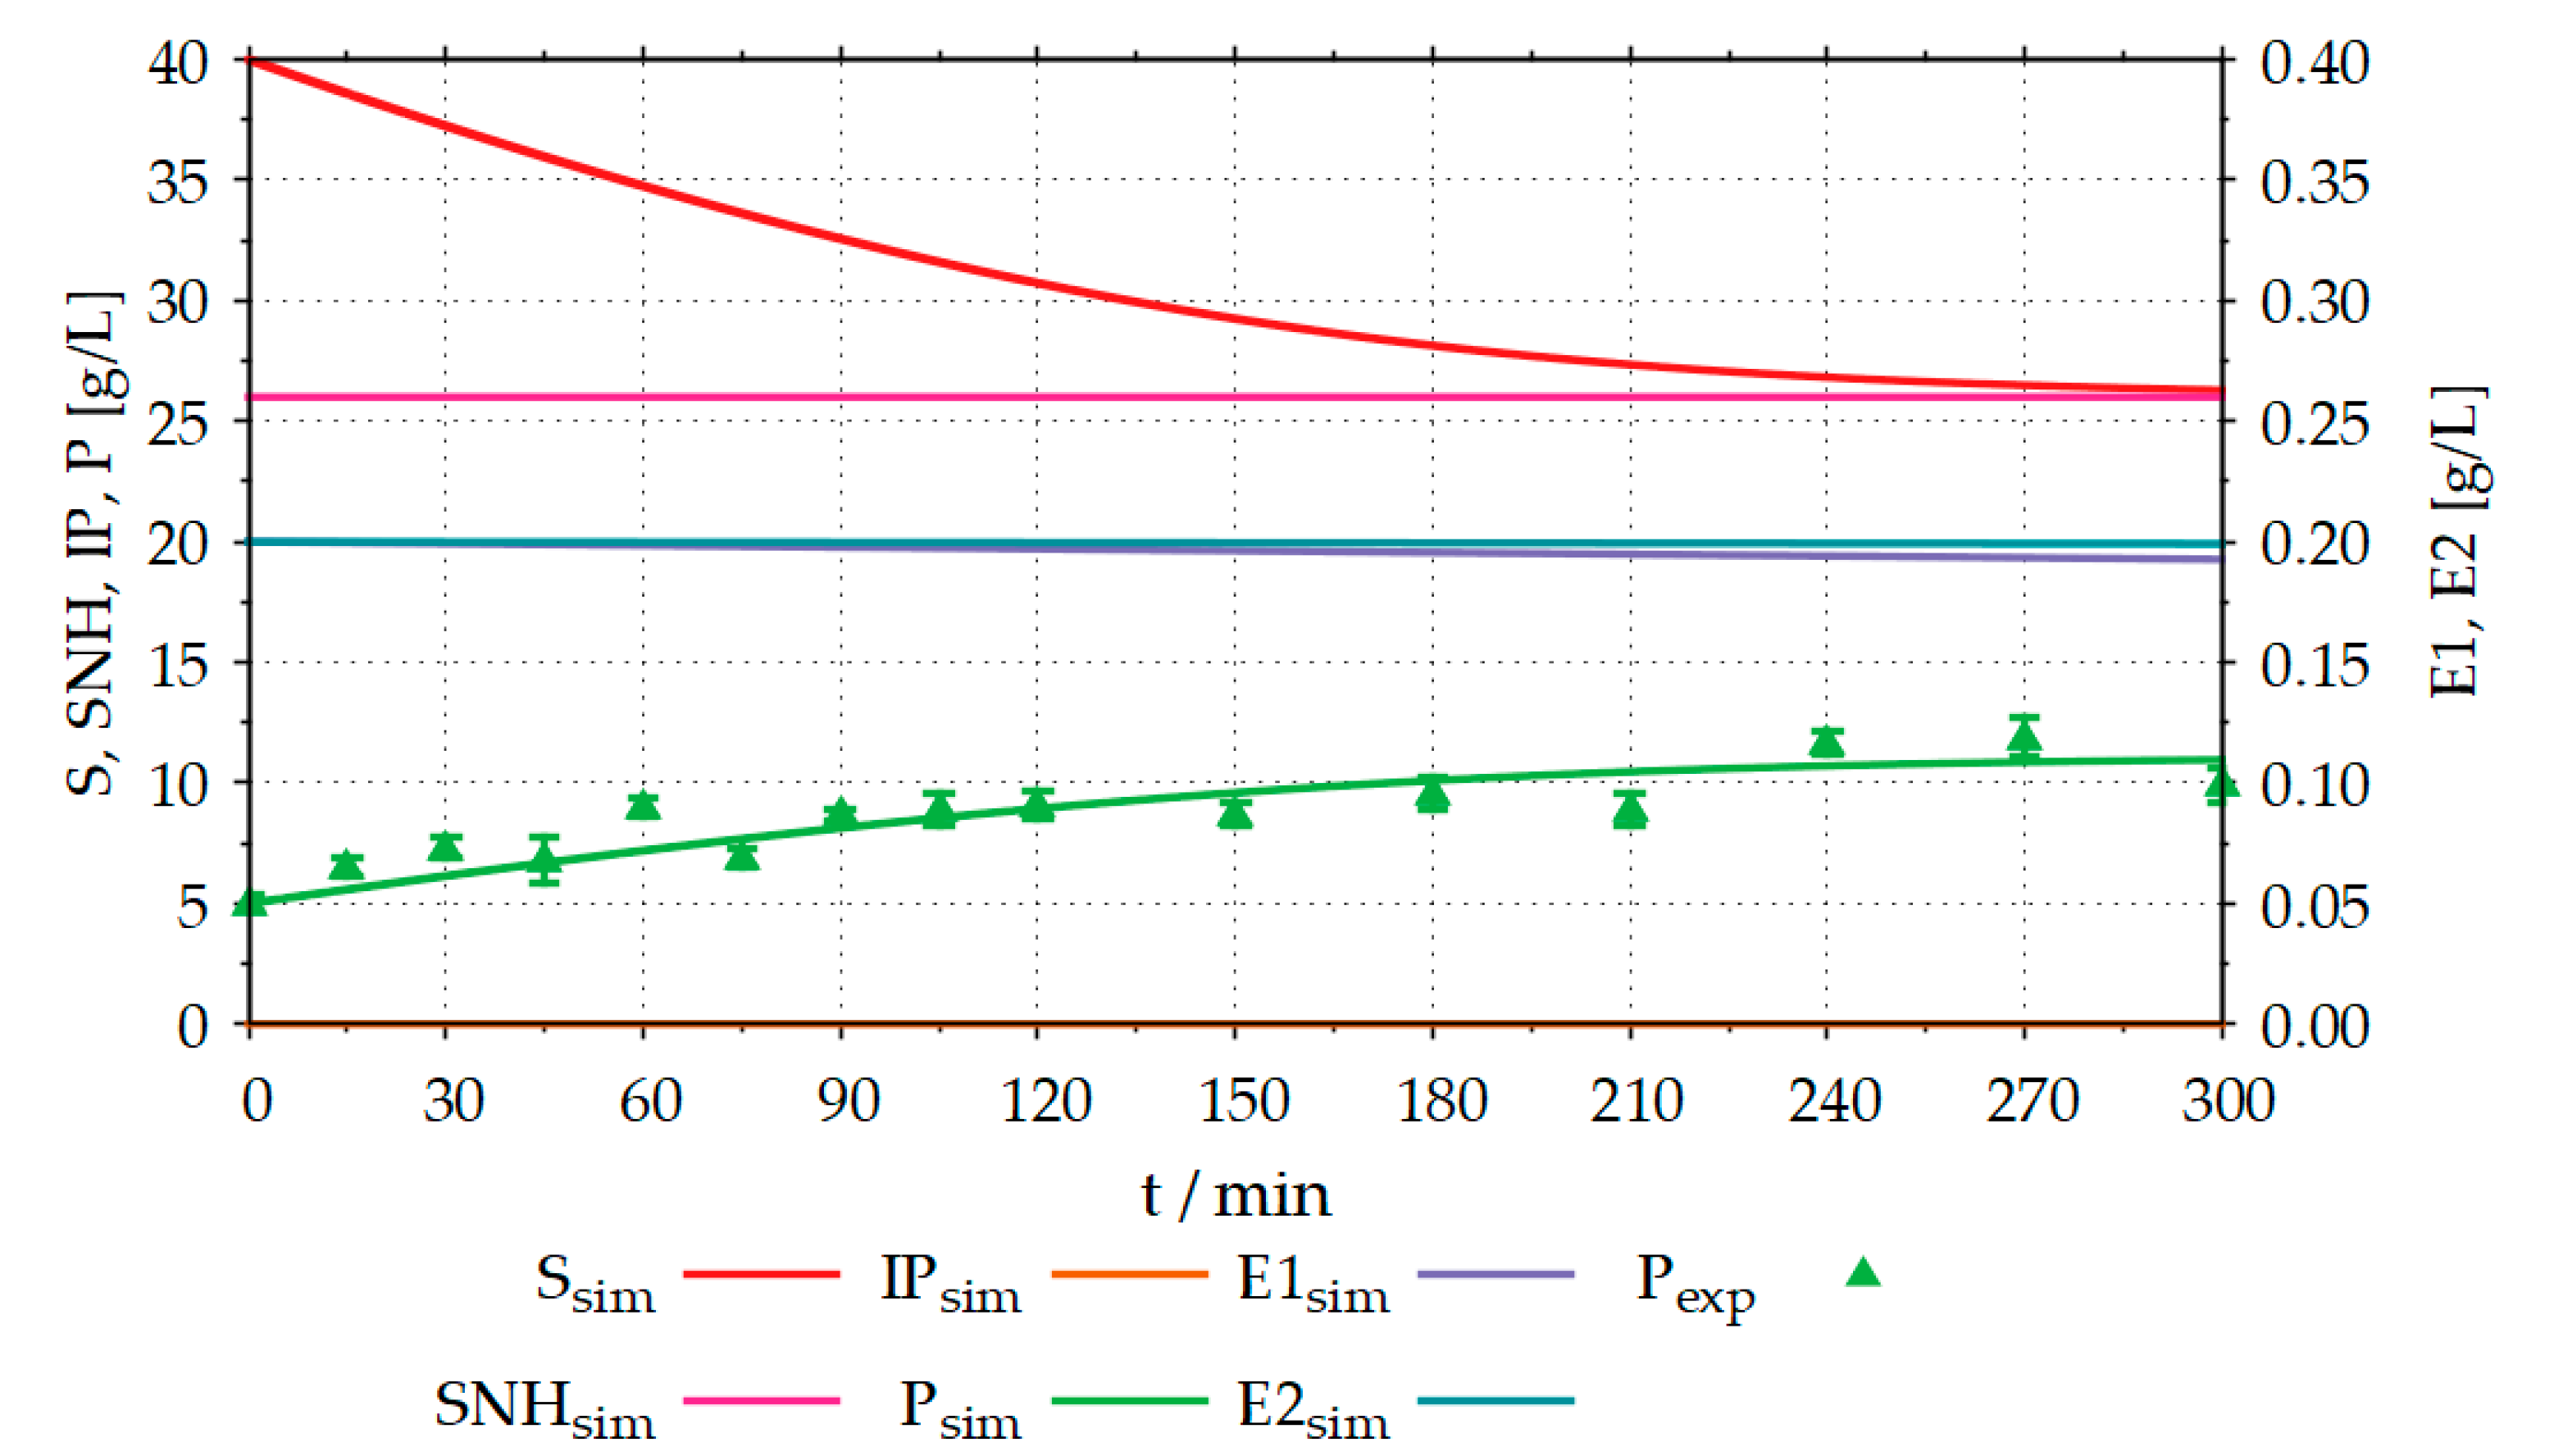
During reparameterization, rmax,SIP,E1,P2 was lowered from 0.70 s−1 to 0.10 s−1, KM,SIP,E1,P2 was lowered from 6.94 g L−1 to 5.94 g L−1, KM,SP,E1,P2 was increased from 7.80 g L−1 to 9.80 g L−1, and KM,IPP,E2,P2 was lowered from 2.10 g L−1 to 0.10 g L−1. No changes were made to any other model parameters. Figure 9 shows the comparison between the simulated and the experimental results after reparameterization of the model.
After adjustment of the model parameters, the simulated trajectories for the product concentration show a much better fit to the experimental data than before. No experimental data were available for the substrate concentration. Thus, the initial value of the simulation was set to 40 g L−1, as in the experiment. The course of the simulated substrate concentration is plausible, as it is strongly related to the increase of the product. Reparameterization of the model increased the coefficient of determination (R2) for the product concentration from −6.76 to 0.76.
3.5. Application of the DT for Enzymatic Hydrolysis Processes
Once the mathematical model of the enzymatic hydrolysis processes was able to satisfactorily represent the enzymatic processes of starch hydrolysis and proteolysis, the model was implemented into the existing DT described before. Using the DT for the enzymatic hydrolysis processes, it is possible to accelerate the simulation of the enzymatic hydrolysis processes in a 20 L STR up to 100-fold.
For the process of the enzymatic starch hydrolysis in the DT, PID controls for temperature and product (glucose) concentration were implemented using WinErs. The temperature in the reactor is controlled via the temperature of the heating fluid in the inflow to the heating jacket, while the product concentration is controlled via the inflows of the two enzymes (α-amylase and glucoamylase) into the reactor. For simplification, it was assumed in the study that continuous glucose measurement was available in the DT.
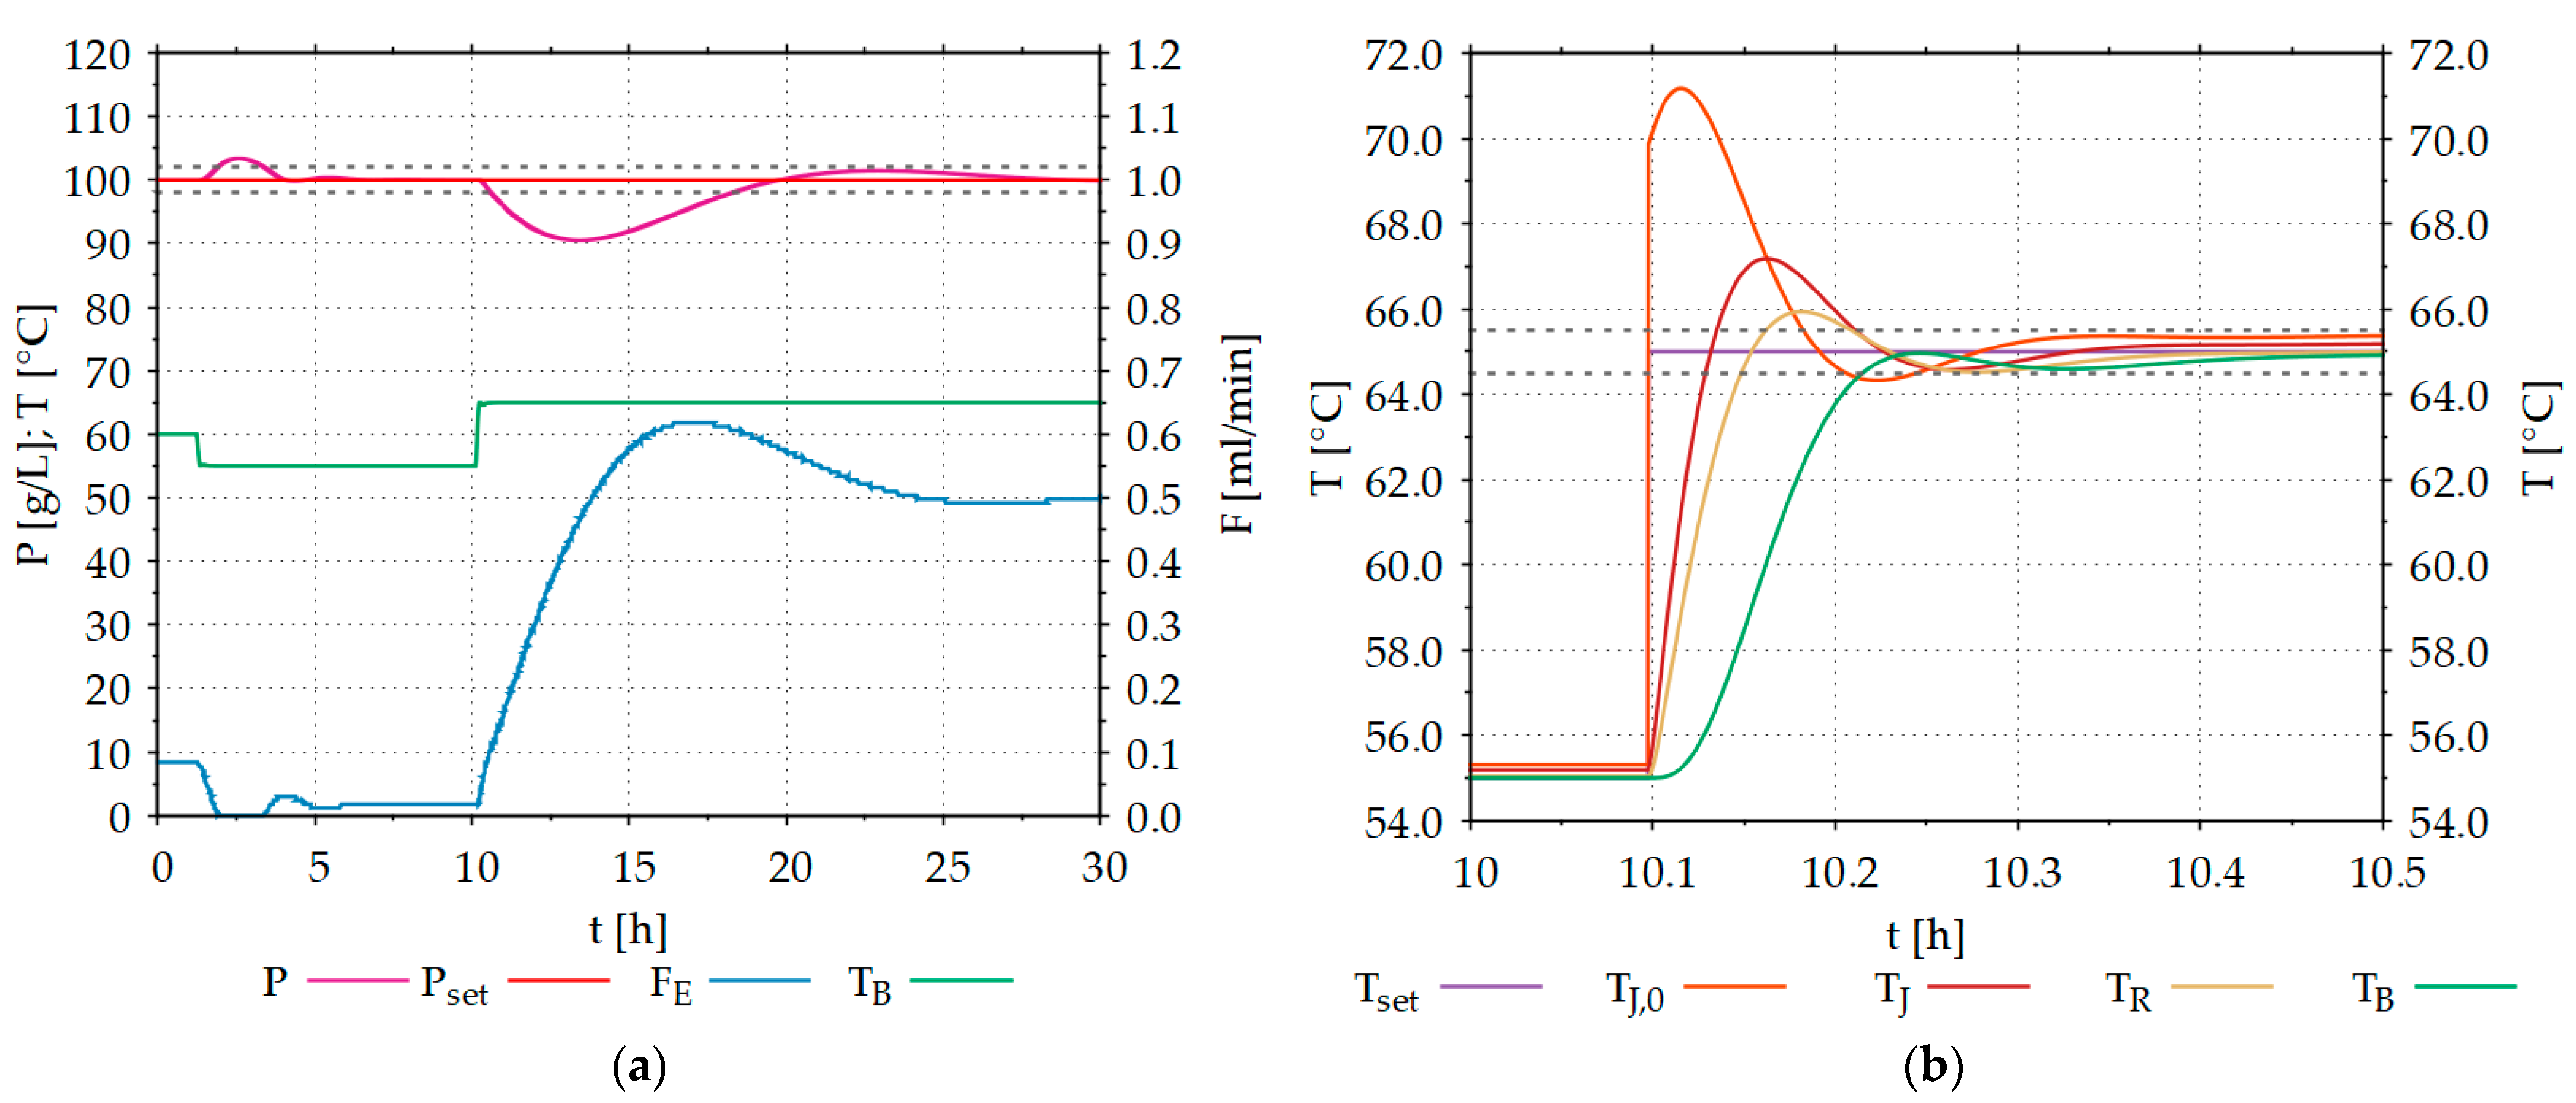
In the first step, the parameters of the PID controllers were determined using the methods developed by Ziegler and Nichols [40]. Then, the controller parameters were adjusted manually and the control result was examined with the help of simulations in WinErs. During manual PID tuning, special care was taken to ensure that the state variable does not leave the specified tolerance range and that the settling time is kept as short as possible. A tolerance range of ±2 g L−1 was specified for product concentration control and ±0.5 °C for temperature control. For initial investigations, the manual PID tuning procedure was applied. In the future, it is planned to determine the controller parameters using automated optimization algorithms, such as, e.g., Nelder–Mead [26]. Figure 10 shows the simulation results of the developed control strategies.
Initially, the process was in a steady-state condition. At a temperature of 60 °C, the product concentration could be maintained at the setpoint of 100 g/L. After a processing time of approximately 1.5 h, the temperature was lowered to 55 °C. This led to an increase in product concentration to approximately 105 g/L. After a processing time of about 6 h, the inflow of enzymes could be adjusted by the controller so that the product concentration approached the setpoint of 100 g/L again. After a processing time of 10 h, the temperature in the reactor was increased from 55 °C to 65 °C, which resulted in the product concentration dropping to near 90 g/L. The PID controller thereafter increased the inflow of enzymes from 0.04 mL/min to over 0.6 mL/min to get the product concentration back to 100 g/L.
The process of starch hydrolysis is strongly dependent on the temperature of the broth in the reactor. Changes of only 5 °C led to strong changes in the enzyme characteristics, to which the control must respond. Figure 10b shows how the developed DT for enzymatic hydrolysis processes can simulate the temperature behavior of the represented STR. When the setpoint increases from 55 °C to 65 °C, the temperature of the broth in the reactor does not rise abruptly to 65 °C. First, the heating jacket is heated by the heating fluid, which then heats the reactor wall, which in turn heats the broth in the reactor. In all these heat transfer steps, as in reality, there are heat losses to the environment (T = 25 °C).
For the development of efficient controls for enzymatic hydrolysis processes, it is therefore necessary that not only the reaction kinetics (micro-kinetics), but also the dynamic behavior (macro-kinetics) of the STR and its periphery can be simulated in detail. For this reason, the use of the developed DT is beneficial for process development.
4. Discussion and Outlook
Within the scope of this work, a dynamic and mechanistic mathematical model for enzymatic hydrolysis processes, which is easily adaptable (generic), has been developed. It could be shown that the model can be adapted to experimental data by adjusting the parameters of the Michaelis–Menten kinetics and the DSig equations used. As a result, the model can simulate the starch hydrolysis and proteolysis process with an agreement of over 90% and over 85%, respectively. Since the model is adaptable, it is possible to respond to changes in enzyme and substrate properties. Due to the model structure used, it is also possible to replace the Michaelis–Menten kinetics with other enzyme kinetics.
The model could successfully be integrated into a DT of a 20 L STR. Through this integration, not only the reaction kinetics of the enzymatic hydrolysis processes (micro-kinetics) can be simulated, but also the macro-kinetics of the STR and its periphery (e.g., pumps, heating jacket, etc.). It could be shown that the temperature behavior of the STR can affect the reaction kinetics (starch hydrolysis). Thus, the developed DT is beneficial for the design of control and automation strategies since it can realistically reproduce the interaction between micro- and macro-kinetics.
Process control strategies developed with the new DT for enzymatic hydrolysis processes in the STR can be transferred to the real process quickly and with a high probability of success. This has already been demonstrated for the cultivation process of S. cerevisiae [4].
In the future, it is planned to further develop the coupling of the real process and the DT. Currently, the DT is being adapted to the real process after the experiments have been carried out. In the future, it is planned that the DT will continuously adapt to the running process.
By combining the newly developed DT and model-based tools for process optimization [25,41], the enzymatic hydrolysis process to produce organic nutrient media can be systematically improved. Since both the model of the enzymatic hydrolysis processes and the DT were built generically, the DT for the enzymatic hydrolysis processes can be quickly and easily adapted to other enzymatic processes as well as other reactor configurations.
Author Contributions
Conceptualization, C.A., F.B., and V.C.H.; methodology, C.A., F.B., and V.C.H.; software, C.A.; validation, C.A., F.B., and V.C.H.; formal analysis, C.A.; investigation, C.A.; resources, C.A.; data curation, C.A., F.B., and V.C.H.; writing—original draft preparation, C.A.; writing—review and editing, C.A., F.B., and V.C.H.; visualization, C.A.; supervision, F.B. and V.C.H.; project administration, F.B. and V.C.H.; funding acquisition, C.A. and V.C.H. All authors have read and agreed to the published version of the manuscript.
Funding
Parts of this research were funded by the Federal Ministry of Education and Research, Germany; grant number: BMBF 031B0405C.
Institutional Review Board Statement
Not applicable.
Informed Consent Statement
Not applicable.
Data Availability Statement
Not applicable.
Conflicts of Interest
The authors declare no conflict of interest. The funders had no role in the design of the study, in the collection, analyses, or interpretation of data, in the writing of the manuscript, or in the decision to publish the results.
References
- Vaccari, M.; Di Bacci Capaci, R.; Brunazzi, E.; Tognotti, L.; Pierno, P.; Vagheggi, R.; Pannocchia, G. Optimally Managing Chemical Plant Operations: An Example Oriented by Industry 4.0 Paradigms. Ind. Eng. Chem. Res. 2021, 60, 7853–7867. [Google Scholar] [CrossRef]
- Liu, M.; Fang, S.; Dong, H.; Xu, C. Review of digital twin about concepts, technologies, and industrial applications. J. Manuf. Syst. 2021, 58, 346–361. [Google Scholar] [CrossRef]
- Tao, F.; Zhang, H.; Liu, A.; Nee, A.Y.C. Digital Twin in Industry: State-of-the-Art. IEEE Trans. Ind. Inf. 2019, 15, 2405–2415. [Google Scholar] [CrossRef]
- Appl, C.; Moser, A.; Baganz, F.; Hass, V.C. Digital Twins for Bioprocess Control Strategy Development and Realisation. Adv. Biochem. Eng. Biotechnol. 2021, 177, 63–94. [Google Scholar] [CrossRef] [PubMed]
- Narayanan, H.; Luna, M.F.; von Stosch, M.; Cruz Bournazou, M.N.; Polotti, G.; Morbidelli, M.; Butté, A.; Sokolov, M. Bioprocessing in the Digital Age: The Role of Process Models. Biotechnol. J. 2020, 15, e1900172. [Google Scholar] [CrossRef] [PubMed]
- Grieves, M. Origins of the Digital Twin Concept. Available online: https://www.researchgate.net/publication/307509727_Origins_of_the_Digital_Twin_Concept (accessed on 27 September 2021).
- Glaessgen, E.; Stargel, D. The Digital Twin Paradigm for Future NASA and U.S. Air Force Vehicles. AIAA Meet. Pap. 2012, 22267B. [Google Scholar] [CrossRef] [Green Version]
- El Saddik, A. Digital Twins: The Convergence of Multimedia Technologies. IEEE MultiMedia 2018, 25, 87–92. [Google Scholar] [CrossRef]
- He, R.; Chen, G.; Dong, C.; Sun, S.; Shen, X. Data-driven digital twin technology for optimized control in process systems. ISA Trans. 2019, 95, 221–234. [Google Scholar] [CrossRef]
- Zobel-Roos, S.; Schmidt, A.; Mestmäcker, F.; Mouellef, M.; Huter, M.; Uhlenbrock, L.; Kornecki, M.; Lohmann, L.; Ditz, R.; Strube, J. Accelerating Biologics Manufacturing by Modeling or: Is Approval under the QbD and PAT Approaches Demanded by Authorities Acceptable Without a Digital-Twin? Processes 2019, 7, 94. [Google Scholar] [CrossRef] [Green Version]
- Blesgen, A.; Hass, V.C. Efficient Biogas Production through Process Simulation. Energy Fuels 2010, 24, 4721–4727. [Google Scholar] [CrossRef]
- Moser, A.; Appl, C.; Brüning, S.; Hass, V.C. Mechanistic Mathematical Models as a Basis for Digital Twins. Adv. Biochem. Eng. Biotechnol. 2021, 176, 133–180. [Google Scholar] [CrossRef]
- Beschkov, V.; Marc, A.; Engasser, J.M. A kinetic model for the hydrolysis and synthesis of maltose, isomaltose, and maltotriose by glucoamylase. Biotechnol. Bioeng. 1984, 26, 22–26. [Google Scholar] [CrossRef] [PubMed]
- Kusunoki, K.; Kawakami, K.; Shiraishi, F.; Kato, K.; Kai, M. A kinetic expression for hydrolysis of soluble starch by glucoamylase. Biotechnol. Bioeng. 1982, 24, 347–354. [Google Scholar] [CrossRef] [PubMed]
- Beaubier, S.; Framboisier, X.; Fournier, F.; Galet, O.; Kapel, R. A new approach for modelling and optimizing batch enzymatic proteolysis. Chem. Eng. J. 2021, 405, 126871. [Google Scholar] [CrossRef]
- Hass, V.C. Verbesserung der bioverfahrenstechnischen Ausbildung durch einen “Virtuellen Bioreaktor”. Chem. Ing. Tech. 2005, 77, 161–167. [Google Scholar] [CrossRef]
- Hass, V.C.; Knutzsch, S.; Gerlach, I.; Kühn, K.; Winterhalter, M. Towards the Development of a Training Simulator for Biorefineries. Chem. Eng. Trans. 2012, 247–252. [Google Scholar] [CrossRef]
- Gerlach, I.; Hass, V.C.; Brüning, S.; Mandenius, C.-F. Virtual bioreactor cultivation for operator training and simulation: Application to ethanol and protein production. J. Chem. Technol. Biotechnol. 2013, 88, 2159–2168. [Google Scholar] [CrossRef]
- Gerlach, I.; Hass, V.; Mandenius, C.-F. Conceptual Design of an Operator Training Simulator for a Bio-Ethanol Plant. Processes 2015, 3, 664–683. [Google Scholar] [CrossRef] [Green Version]
- Hass, V.C.; Kuhnen, F.; Schoop, K.-M. Rapid Design of interactive operator-training simulators for training and education. In Proceedings of the 7th World Congress of Chemical Engineering, WCCE, Glasgow, Scotland, 10–14 July 2005. [Google Scholar]
- Hass, V.C. Operator Training Simulators for Bioreactors. In Bioreactors: Design, Operation and Novel Applications; Mandenius, C.-F., Ed.; Wiley: Weinheim, Germany, 2016; pp. 453–486. ISBN 9783527683369. [Google Scholar]
- Isimite, J.; Baganz, F.; Hass, V.C. Operator training simulators for biorefineries: Current position and future directions. J. Chem. Technol. Biotechnol. 2018, 93, 1529–1541. [Google Scholar] [CrossRef]
- Hirschmann, R.; Borodkin, N.; Baganz, F.; Hass, V.C. Towards the Integration of the Anaerobic Ethyl (S)-3-Hydroxybutyrate Production Process into a Biorefinery Concept. Chem. Eng. Trans. 2018, 70, 559–564. [Google Scholar]
- Hass, V.C.; Kuhnen, F.; Schoop, K.-M. An environment for the development of operator training systems (OTS) from chemical engineering models. Comput. Aided Chem. Eng. 2005, 289–293. [Google Scholar] [CrossRef]
- Moser, A.; Kuchemüller, K.B.; Deppe, S.; Hernández Rodríguez, T.; Frahm, B.; Pörtner, R.; Hass, V.C.; Möller, J. Model-assisted DoE software: Optimization of growth and biocatalysis in Saccharomyces cerevisiae bioprocesses. Bioprocess Biosyst. Eng. 2021, 44, 683–700. [Google Scholar] [CrossRef]
- Nelder, J.A.; Mead, R. A Simplex Method for Function Minimization. Comput. J. 1965, 7, 308–313. [Google Scholar] [CrossRef]
- R Core Team. The R Project for Statistical Computing. Available online: www.R-project.org (accessed on 27 September 2021).
- Ingenieurbüro Dr.-Ing.Schoop GmbH. WinErs. Process control and automation system on PC under Windows. Available online: www.schoop.de (accessed on 27 September 2021).
- Illanes, A. Enzyme Biocatalysis: Principles and Applications; Springer: Dordrecht, The Netherlands, 2008; ISBN 1402083610. [Google Scholar]
- Chutipongtanate, S.; Watcharatanyatip, K.; Homvises, T.; Jaturongkakul, K.; Thongboonkerd, V. Systematic comparisons of various spectrophotometric and colorimetric methods to measure concentrations of protein, peptide and amino acid: Detectable limits, linear dynamic ranges, interferences, practicality and unit costs. Talanta 2012, 98, 123–129. [Google Scholar] [CrossRef]
- Buckow, R.; Heinz, V.; Knorr, D. Two Fractional Model for Evaluating the Activity of Glucoamylase from Aspergillus Niger Under Combined Pressure and Temperature Conditions. Food Bioprod. Process. 2005, 83, 220–228. [Google Scholar] [CrossRef]
- Buckow, R.; Weiss, U.; Heinz, V.; Knorr, D. Stability and catalytic activity of alpha-amylase from barley malt at different pressure-temperature conditions. Biotechnol. Bioeng. 2007, 97, 1–11. [Google Scholar] [CrossRef]
- Nebesny, E. Kombinierte enzymatische Stärkehydrolyse. Starch/Stärke 1989, 41, 266–270. [Google Scholar] [CrossRef]
- Rao, M.B.; Tanksale, A.M.; Ghatge, M.S.; Deshpande, V.V. Molecular and biotechnological aspects of microbial proteases. Microbiol. Mol. Biol. Rev. 1998, 62, 597–635. [Google Scholar] [CrossRef] [Green Version]
- Lee, C.-G.; Kim, C.H.; Rhee, S.K. A kinetic model and simulation of starch saccharification and simultaneous ethanol fermentation by amyloglucosidase and Zymomonas mobilis. Bioprocess Eng. 1992, 7, 335–341. [Google Scholar] [CrossRef]
- Kuntzsch, S. Energy Efficiency Investigations with a New Operator Training Simulator for Biorefineries. Ph.D. Thesis, Jacobs University, Bremen, Germany, 2014. [Google Scholar]
- Brüning, S. Development of a Generalized Process Model for Optimization of Biotechnological Processes. Ph.D. Thesis, Jacobs University, Bremen, Germany, 2016. [Google Scholar]
- Novozymes A/S. Novozymes Spirizyme® Products for use in saccharification and fermentation: Application Sheet 2010. Available online: https://docplayer.net/20898529-Application-sheet-novozymes-spirizyme-products-for-use-in-saccharification-and-fermentation.html (accessed on 27 September 2021).
- Novozymes A/S. Product Sheet: Termamyl SC 2004. Available online: http://www.ebiosis.co.kr/Novozymes%20Product%20Sheet/Termamyl%20SC.pdf (accessed on 27 September 2021).
- Ziegler, J.G.; Nichols, N.B. Optimum Settings for Automatic Controllers. J. Dyn. Syst. Meas. Control. 1993, 115, 220–222. [Google Scholar] [CrossRef]
- Witte, V.C.; Munack, A.; Märkl, H. Mathematische Modellierung und Adaptive Prozeßsteuerung der Kultivierung von Cyathus Striatus; Zugl.: Hamburg-Harburg, Techn. Univ., Arbeitsbereich Regelungstechnik und Systemdynamik [i.e. Arbeitsbereich Regelungstechnik] und Arbeitsbereich Bioprozess- und Bioverfahrenstechnik, Diss., Als Ms. gedr; VDI-Verl.: Düsseldorf, Germany, 1996; ISBN 3183144174. [Google Scholar]
Figure 1.
Shell structure of DTs, showing the biological, the physicochemical, the reactor, the plant and periphery and the control and automation sub-models as well as the GUI.
Figure 1.
Shell structure of DTs, showing the biological, the physicochemical, the reactor, the plant and periphery and the control and automation sub-models as well as the GUI.

Figure 2.
Schematic of the modeling cycle.

Figure 3.
Model structure for the enzymatic hydrolysis processes (combined starch hydrolysis (top, green) and proteolysis (bottom, blue)).
Figure 3.
Model structure for the enzymatic hydrolysis processes (combined starch hydrolysis (top, green) and proteolysis (bottom, blue)).

Figure 4.
Experimentally determined temperature (a) and pH (b) dependency of the glucoamylase (Spirizyme Ultra) and α-amylase (Termamyl SC) used in the starch hydrolysis process, with fitted DSig functions. Reactions were performed in 5 mL batch experiments using 20 g L−1 substrate (soluble potato starch) and the concentration of product (glucose) and residual substrate determined after 10 min as described in Section 2.3.1; exp: experimental data, DSig: double sigmoidal functions fitted to the experimental data.

Figure 5.
Experimentally determined temperature (a) and pH (b) dependency of the endopeptidase (EnerZyme® P7) and exopeptidase (Flavourzyme™) used in the proteolysis process, with fitted DSig equations. Reactions were performed in 1 mL batch experiments using 2 g L−1 substrate (casein powder) and the concentration of product (fAA) was determined after 30 min as described in Section 2.3.2; exp: experimental data, DSig: double sigmoidal functions fitted to the experimental data.

Figure 6.
Comparison between simulation (sim) and experimental (exp) starch hydrolysis results, with R2 (substrate) = 0.95 and R2 (product) = 0.20; The experiment was performed in a 20 L STR, with an initial volume of 13.5 L, 160 g L−1 potato starch, 0.006 g L−1 Termamyl SC, 0.4 g L−1 Spirizyme Ultra, 0.02 g L−1 CaCl2·2H2O, T = 60 °C, pH = 5 and stirrer speed = 300 rpm; S: substrate (starch) concentration, IP: intermediate product concentration, P: product (glucose) concentration, SNH: concentration of the non-hydrolysable components of the substrate, E1: α-amylase concentration, E2: glucoamylase concentration, index exp: experimental results, index sim: simulation results; Experiments were performed as described in Section 2.3.1.

Figure 7.
Comparison between simulated (sim) and the experimental (exp) starch hydrolysis results, after reparameterization of the model, with R2 (substrate) = 0.96 and R2 (product) = 0.88; The experiment was performed in a 20 L STR, with an initial volume of 13.5 L, 160 g L−1 potato starch, 0.006 g L−1 Termamyl SC, 0.4 g L−1 Spirizyme Ultra, 0.02 g L−1 CaCl2·2H2O, T = 60 °C, pH = 5 and stirrer speed = 300 rpm; S: substrate (starch) concentration, IP: intermediate product concentration, P: product (glucose) concentration, SNH: concentration of the non-hydrolysable components of the substrate, E1: α-amylase concentration, E2: glucoamylase concentration, index exp: experimental results, index sim: simulation results; The experiment was performed as described in Section 2.3.1.

Figure 8.
Comparison between simulation (sim) and the experimental (exp) proteolysis results, with R2 (product) = −6.76; The experiment was performed in a 6 L STR, with an initial volume of 3 L, 40 g L−1 organic sunflower seed meal containing 14 g L−1 protein, 0.2 g L−1 EnerZyme® P7 (endopeptidase), 0.2 g L−1 Flavourzyme™ (exopeptidase), T = 50 °C, pH = 7.5 and stirrer speed = 300 rpm; S: substrate (protein) concentration, IP: intermediate product concentration, P: product (fAA) concentration, SNH: concentration of the non-hydrolysable components of the substrate, E1: endopeptidase concentration, E2: exopeptidase concentration, index exp: experimental results, index sim: simulation results; The experiment was performed as described in Section 2.3.2.

Figure 9.
Comparison between simulated (sim) and the experimental (exp) proteolysis results, after reparameterization, with R2 (product) = 0.76; The experiment was performed in a 6 L STR, with an initial volume of 3 L, 40 g L−1 organic sunflower seed meal containing 14 g L−1 protein, 0.2 g L−1 EnerZyme® P7 (endopeptidase), 0.2 g L−1 Flavourzyme™ (exopeptidase), T = 50 °C, pH = 7.5 and stirrer speed = 300 rpm; S: substrate (protein) concentration, IP: intermediate product concentration, P: product (fAA) concentration, SNH: concentration of the non-hydrolysable components of the substrate, E1: endopeptidase concentration, E2: exopeptidase concentration, index exp: experimental results, index sim: simulation results; The experiment was performed as described in Section 2.3.2.

Figure 10.
(a) Effects of temperature changes on product concentration during controlled enzymatic starch hydrolysis (micro-kinetics) in the DT, with V = 10 L and pH = 5.0. (b) Temperature characteristics of the STR (macro-kinetics) during a setpoint jump from 55 °C to 65 °C (t = 10.0–10.5 h). P: product (glucose) concentration, Pset: product concentration setpoint, FE: inflow of enzyme solutions to the reactor, TB: temperature of broth in the reactor, Tset: temperature setpoint, Tj,0: temperature of the heating fluid in the inflow to the heating jacket, TJ: temperature of the heating jacket; TR: temperature of the reactor wall.


Table 1.
Abbreviations used in the enzymatic hydrolysis processes model.
| Abbreviations | Description |
|---|---|
| rSIP,E1 | Degradation rate of substrate to intermediate product. |
| rSP,E1 | Degradation rate of substrate to product. |
| rIPP,E2 | Degradation rate of intermediate product to product. |
| rmax,SIP,E1 | Maximum degradation rate of substrate to intermediate product. |
| rmax,SP,E1 | Maximum degradation rate of substrate to product. |
| rmax,IPP,E2 | Maximum degradation rate of intermediate product to product. |
| KM,SIP,E1 | Half-saturation constant for degradation of substrate to intermediate product. |
| KM,SP,E1 | Half-saturation constant for degradation of substrate to product. |
| KM,IPP,E2 | Half-saturation constant for degradation of intermediate product to product. |
| fT,act,E1 | Factor for temperature-dependent activity of enzyme 1. |
| fT,act,E2 | Factor for temperature-dependent activity of enzyme 2. |
| fpH,act,E1 | Factor for pH-dependent activity of enzyme 1. |
| fpH,act,E2 | Factor for pH-dependent activity of enzyme 2. |
| rIPS,E1 | Conversation rate of intermediate product from substrate. |
| rPS,E1 | Conversation rate of product from substrate. |
| rPIP,E2 | Conversation rate of product from intermediate product. |
| YIPS,E1 | Yield coefficient for conversation of intermediate product from substrate. |
| YPS,E1 | Yield coefficient for conversation of product from substrate. |
| YPIP,E2 | Yield coefficient for conversation of product from intermediate product. |
| rden,E1 | Denaturation rate of enzyme 1. |
| rden,E2 | Denaturation rate of enzyme 2. |
| rmax,den,E1 | Maximum denaturation rate of enzyme 1. |
| rmax,den,E2 | Maximum denaturation rate of enzyme 2. |
| fT,sta,E1 | Factor for temperature-dependent stability of enzyme 1. |
| fT,sta,E2 | Factor for temperature-dependent stability of enzyme 2. |
| fpH,sta,E1 | Factor for pH-dependent stability of enzyme 1. |
| fpH,sta,E2 | Factor for pH-dependent stability of enzyme 2. |
| VB | Volume of broth in the reactor. |
| S1 | Concentration of starch in the reactor. |
| SH1 | Concentration of the hydrolysable components of the substrate in the reactor. |
| SNH1 | Concentration of the non-hydrolysable components of the substrate in the reactor. |
| E11 | Concentration of enzyme 1 in the reactor. |
| E21 | Concentration of enzyme 2 in the reactor. |
| IP1 | Concentration of the intermediate product in the reactor. |
| P1 | Concentration of the product in the reactor. |
| FS,0 | Inflow of substrate solution to the reactor. |
| FE1,0 | Inflow of enzyme 1 to the reactor. |
| FE2,0 | Inflow of enzyme 2 to the reactor. |
| SH0 | Concentration of the hydrolysable components of the substrate in FS,0. |
| SNH0 | Concentration of the non-hydrolysable components of the substrate in FS,0. |
| E10 | Concentration of enzyme 1 in FE1,0. |
| E20 | Concentration of enzyme 2 in FE2,0. |
| IP0 | Concentration of the intermediate product in FS,0. |
| P0 | Concentration of the product in FS,0. |
| Fin | Absolute inflow into the reactor. |
| Fout | Absolute outflow from the reactor. |
Table 2.
Parameters of the DSig equations for mapping the temperature (T) and pH dependency of the α-amylase (E1) and glucoamylase (E2) used in starch hydrolysis (P1).
Table 2.
Parameters of the DSig equations for mapping the temperature (T) and pH dependency of the α-amylase (E1) and glucoamylase (E2) used in starch hydrolysis (P1).
| Parameter | Description | Value |
|---|---|---|
| YLS,T,act,E1,P1 | DSig value at low temperature. | 0.0 |
| Ymid,T,act,E1,P1 | DSig value between rmax,Tlow,E1,P1 and rmaxT,high,E1,P1. | 1.0 |
| YRS,T,act,E1,P1 | DSig value at high temperature. | 1.0 |
| KLS,T,act,E1,P1 | Slope on the low side of the DSig function. | 0.1 |
| KRS,T,act,E1,P1 | Slope on the high side of the DSig function. | 0.1 |
| rmax,Tlow,act,E1,P1 | Location parameter of the low side of the DSig function. | 56.0 °C |
| rmax,Thigh,act,E1,P1 | Location parameter of the high side of the DSig function. | 56.0 °C |
| YLS,pH,act,E1,P1 | DSig value at low pH. | 0.0 |
| Ymid,pH,act,E1,P1 | DSig value between rmax,pHlow,act,E1,P1 and rmax,pHhigh,act,E1,P1. | 1.4 |
| YRS,pH,act,E1,P1 | DSig value at high pH. | 0.0 |
| KLS,pH,act,E1,P1 | Slope on the low side of the DSig function. | 3.5 |
| KRS,pH,act,E1,P1 | Slope on the high side of the DSig function. | 1.6 |
| rmax,pHlow,act,E1,P1 | Location parameter of the low side of the DSig function. | 4.5 |
| rmax,pHhigh,act,E1,P1 | Location parameter of the high side of the DSig function. | 6.0 |
| YLS,T,act,E2,P1 | DSig value at low temperature. | 0.0 |
| Ymid,T,act,E2,P1 | DSig value between rmax,Tlow,E2,P1 and rmaxT,high,E2,P1. | 1.0 |
| YRS,T,act,E2,P1 | DSig value at high temperature. | 1.0 |
| KLS,T,act,E2,P1 | Slope on the low side of the DSig function. | 0.1 |
| KRS,T,act,E2,P1 | Slope on the high side of the DSig function. | 0.1 |
| rmax,Tlow,act,E2,P1 | Location parameter of the low side of the DSig function. | 45.0 °C |
| rmax,Thigh,act,E2,P1 | Location parameter of the high side of the DSig function. | 45.0 °C |
| YLS,pH,act,E2,P1 | DSig value at low pH. | 0.0 |
| Ymid,pH,act,E2,P1 | DSig value between rmax,pHlow,act,E2,P1 and rmax,pHhigh,act,E2,P1. | 1.0 |
| YRS,pH,act,E2,P1 | DSig value at high pH. | 0.0 |
| KLS,pH,act,E2,P1 | Slope on the low side of the DSig function. | 3.0 |
| KRS,pH,act,E2,P1 | Slope on the high side of the DSig function. | 3.0 |
| rmax,pHlow,act,E2,P1 | Location parameter of the low side of the DSig function. | 4.0 |
| rmax,pHhigh,act,E2,P1 | Location parameter of the high side of the DSig function. | 8.5 |
Table 3.
Parameters of the DSig equations for mapping the temperature (T) and pH dependency of the endo-(E1) and exopeptidase (E2) used in proteolysis (P2).
Table 3.
Parameters of the DSig equations for mapping the temperature (T) and pH dependency of the endo-(E1) and exopeptidase (E2) used in proteolysis (P2).
| Parameter | Description | Value |
|---|---|---|
| YLS,T,act,E1,P2 | DSig value at low temperature. | 0.0 |
| Ymid,T,act,E1,P2 | DSig value between rmax,Tlow,E1,P2 and rmaxT,high,E1,P2. | 1.5 |
| YRS,T,act,E1,P2 | DSig value at high temperature. | 0.0 |
| KLS,T,act,E1,P2 | Slope on the low side of the DSig function. | 0.1 |
| KRS,T,act,E1,P2 | Slope on the high side of the DSig function. | 0.2 |
| rmax,Tlow,act,E1,P2 | Location parameter of the low side of the DSig function. | 43.0 °C |
| rmax,Thigh,act,E1,P2 | Location parameter of the high side of the DSig function. | 65.0 °C |
| YLS,pH,act,E1,P2 | DSig value at low pH. | 0.0 |
| Ymid,pH,act,E1,P2 | DSig value between rmax,pHlow,act,E1,P2 and rmax,pHhigh,act,E1,P2. | 1.1 |
| YRS,pH,act,E1,P2 | DSig value at high pH. | 0.0 |
| KLS,pH,act,E1,P2 | Slope on the low side of the DSig function. | 2.5 |
| KRS,pH,act,E1,P2 | Slope on the high side of the DSig function. | 2.0 |
| rmax,pHlow,act,E1,P2 | Location parameter of the low side of the DSig function. | 5.8 |
| rmax,pHhigh,act,E1,P2 | Location parameter of the high side of the DSig function. | 8.6 |
| YLS,T,act,E2,P2 | DSig value at low temperature. | 0.0 |
| Ymid,T,act,E2,P2 | DSig value between rmax,Tlow,E2,P2 and rmaxT,high,E2,P2. | 1.1 |
| YRS,T,act,E2,P2 | DSig value at high temperature. | 0.0 |
| KLS,T,act,E2,P2 | Slope on the low side of the DSig function. | 0.1 |
| KRS,T,act,E2,P2 | Slope on the high side of the DSig function. | 0.2 |
| rmax,Tlow,act,E2,P2 | Location parameter of the low side of the DSig function. | 28.0 °C |
| rmax,Thigh,act,E2,P2 | Location parameter of the high side of the DSig function. | 64.0 °C |
| YLS,pH,act,E2,P2 | DSig value at low pH. | 0.0 |
| Ymid,pH,act,E2,P2 | DSig value between rmax,pHlow,act,E2,P2 and rmax,pHhigh,act,E2,P2. | 1.8 |
| YRS,pH,act,E2,P2 | DSig value at high pH. | 0.0 |
| KLS,pH,act,E2,P2 | Slope on the low side of the DSig function. | 1.2 |
| KRS,pH,act,E2,P2 | Slope on the high side of the DSig function. | 1.0 |
| rmax,pHlow,act,E2,P2 | Location parameter of the low side of the DSig function. | 6.4 |
| rmax,pHhigh,act,E2,P2 | Location parameter of the high side of the DSig function. | 8.4 |
Table 4.
Adjustment of starch hydrolysis model parameterization, with α-amylase (E1) and glucoamylase (E2).
Table 4.
Adjustment of starch hydrolysis model parameterization, with α-amylase (E1) and glucoamylase (E2).
| Parameter | Description | Initial | Adjusted |
|---|---|---|---|
| rmax,SIP,E1,P1 | Maximum degradation rate of substrate to intermediate product. | 1.10 s−1 | 2.00 s−1 |
| rmax,SP,E1,P1 | Maximum degradation rate of substrate to product. | 1.30 s−1 | 0.10 s−1 |
| rmax,IPP,E2,P1 | Maximum degradation rate of intermediate product to product. | 1.80 s−1 | 1.99 s−1 |
| KM,SIP,E1,P1 | Half-saturation constant for degradation of substrate to intermediate product. | 1.40 g L−1 | 15.04 g L−1 |
| KM,SP,E1,P1 | Half-saturation constant for degradation of substrate to product. | 9.00 g L−1 | 20.00 g L−1 |
| KM,IPP,E2,P1 | Half-saturation constant for degradation of intermediate product to product. | 9.00 g L−1 | 8.32 g L−1 |
Table 5.
Adjustment of proteolysis model (P2) parameterization with endo- (E1) and exopeptidase (E2).
Table 5.
Adjustment of proteolysis model (P2) parameterization with endo- (E1) and exopeptidase (E2).
| Parameter | Description | Initial | Adjusted |
|---|---|---|---|
| rmax,SIP,E1,P2 | Maximum degradation rate of substrate to intermediate product. | 0.70 s−1 | 0.10 s−1 |
| rmax,SP,E1,P2 | Maximum degradation rate of substrate to product. | 0.16 s−1 | 0.16 s−1 |
| rmax,IPP,E2,P2 | Maximum degradation rate of intermediate product to product. | 0.15 s−1 | 0.15 s−1 |
| KM,SIP,E1,P2 | Half-saturation constant for degradation of substrate to intermediate product. | 6.94 g L−1 | 5.94 g L−1 |
| KM,SP,E1,P2 | Half-saturation constant for degradation of substrate to product. | 7.80 g L−1 | 9.80 g L−1 |
| KM,IPP,E2,P2 | Half-saturation constant for degradation of intermediate product to product. | 2.10 g L−1 | 0.10 g L−1 |
Publisher’s Note: MDPI stays neutral with regard to jurisdictional claims in published maps and institutional affiliations. |
© 2021 by the authors. Licensee MDPI, Basel, Switzerland. This article is an open access article distributed under the terms and conditions of the Creative Commons Attribution (CC BY) license (https://creativecommons.org/licenses/by/4.0/).
Share and Cite
MDPI and ACS Style
Appl, C.; Baganz, F.; Hass, V.C. Development of a Digital Twin for Enzymatic Hydrolysis Processes. Processes 2021, 9, 1734. https://0-doi-org.brum.beds.ac.uk/10.3390/pr9101734
AMA Style
Appl C, Baganz F, Hass VC. Development of a Digital Twin for Enzymatic Hydrolysis Processes. Processes. 2021; 9(10):1734. https://0-doi-org.brum.beds.ac.uk/10.3390/pr9101734
Chicago/Turabian StyleAppl, Christian, Frank Baganz, and Volker C. Hass. 2021. "Development of a Digital Twin for Enzymatic Hydrolysis Processes" Processes 9, no. 10: 1734. https://0-doi-org.brum.beds.ac.uk/10.3390/pr9101734
Note that from the first issue of 2016, this journal uses article numbers instead of page numbers. See further details here.