
Estimation of Gene Regulatory Networks from Cancer Transcriptomics Data

Department of Biomedical Informatics, College of Medicine, Gachon University, Incheon 21565, Korea
Processes 2021, 9(10), 1758; https://0-doi-org.brum.beds.ac.uk/10.3390/pr9101758
Submission received: 23 August 2021
/
Revised: 24 September 2021
/
Accepted: 26 September 2021
/
Published: 30 September 2021
(This article belongs to the Special Issue State-of-the-Art of Gene Regulation for Cancer Cell)
Abstract
:Cancer is a genetic disease in which multiple genes are perturbed. Thus, information about the regulatory relationships between genes is necessary for the identification of biomarkers and therapeutic targets. In this review, methods for inference of gene regulatory networks (GRNs) from transcriptomics data that are used in cancer research are introduced. The methods are classified into three categories according to the analysis model. The first category includes methods that use pair-wise measures between genes, including correlation coefficient and mutual information. The second category includes methods that determine the genetic regulatory relationship using multivariate measures, which consider the expression profiles of all genes concurrently. The third category includes methods using supervised and integrative approaches. The supervised approach estimates the regulatory relationship using a supervised learning method that constructs a regression or classification model for predicting whether there is a regulatory relationship between genes with input data of gene expression profiles and class labels of prior biological knowledge. The integrative method is an expansion of the supervised method and uses more data and biological knowledge for predicting the regulatory relationship. Furthermore, simulation and experimental validation of the estimated GRNs are also discussed in this review. This review identified that most GRN inference methods are not specific for cancer transcriptome data, and such methods are required for better understanding of cancer pathophysiology. In addition, more systematic methods for validation of the estimated GRNs need to be developed in the context of cancer biology.
1. Introduction
Cancer is a genetic disease that involves perturbation of gene regulatory networks (GRNs) caused by various mechanisms, such as copy number alteration, abnormal methylation status, abnormal protein configuration, and post-transcriptional dysregulation [1,2,3,4]. Although driver gene mutation information is crucial for the estimation of the genetic etiology of cancer, it is becoming increasingly evident that many genes are involved in cancer pathophysiology, which appears to disrupt GRNs [5]. In this context, the identification of information regarding gene regulation in cancer tissues is expected to provide invaluable information for the development of anticancer agents or cancer management strategies.
Previously, efforts aimed toward the identification of GRNs focused only on a small number of genes [6]. Currently, with the advent of high-throughput technologies, such as microarray and next-generation sequencing (NGS), tens of thousands of gene expressions are examined simultaneously [7,8]. A microarray is constructed on a slide on which probes for the hybridization of complementary DNAs for whole messenger RNAs (mRNAs) from one type of cell are implanted. The mRNAs obtained from sample tissues are tagged with fluorescent dyes so that a scanner can identify variations in the photosignals of the dyes as the abundance of the mRNAs. After scanning of the signals, gene expressions are summarized into a matrix of expression profiles in which rows and columns indicate genes and samples, respectively. Instead of utilizing hybridization, NGS platforms determine the amount of mRNA through direct sequencing of mRNAs.
After the raw expression signals are generated, appropriate adjustment steps are required to correct any experimental bias, which is known as the process of normalization. Most omics technologies need such normalization steps to avoid artificial results that are not relevant to the underlying biology. The normalization of omics data is beyond the scope of this review, and excellent reviews regarding this issue are available [9,10]. Once the normalization process has removed bias from an experiment or sample preparations, an estimation process for the identification of GRNs can be applied. Here, the concept and implications of the GRN need to be clarified as follows. In many studies, GRN refers to the regulatory relationship between genes that is estimated from experimental data. However, regulation is somewhat ambiguous, and one gene can impact another gene (or genes) in various ways. For example, the protein encoded by one gene can act as a transcription factor (TF) for another gene [11], and a microRNA gene can affect the expression of other genes through the microRNA encoded by it [12]. A more sophisticated mechanism underlies the epigenomic control of gene expression via changes in methylation and various histone modifications [13]. However, most GRNs are inferred from transcriptomics data. Therefore, it is always possible that the GRNs inferred from the transcriptomics data indicate the statistical relationships between genes rather than biological relationships that can be explained. This possibility should be considered in the interpretation of GRNs estimated from gene expression data. Even if there is a positive relationship between genes in a GRN estimated from transcriptomics data, it is possible that the biological mechanism underlying the relationship cannot be explained with the current knowledge. For validation or confirmation of the regulatory relationships, other omics data containing epigenomic or protein expression information or independent experimental procedures, such as gene perturbation, are required.
This review focuses on the methods that estimate GRNs from gene expression data obtained using microarrays or NGS platforms. The methods are classified into the following three categories: (1) pairwise metric method, (2) multivariate method, and (3) integrative approach. Studies using cancer transcriptomics data are mainly surveyed in this review. Furthermore, experimental approaches used for validation of the estimated GRNs are introduced.
2. Estimation of Gene Regulatory Networks Using Pairwise Measures
2.1. Co-Expression Network
With the advent of high-throughput transcriptomics data, a gene co-expression network (GCN) is the most widely used method for inference of the regulatory relationship between genes [14,15,16]. This is based on the assumption that genes showing similar expression patterns have a higher probability of sharing regulatory mechanisms for their expression. In the GCN, nodes represent genes and edges indicate a co-expression relationship defined by statistical inference. Pearson’s correlation coefficient (CC) is used for the construction of a GCN (Equation (1)).
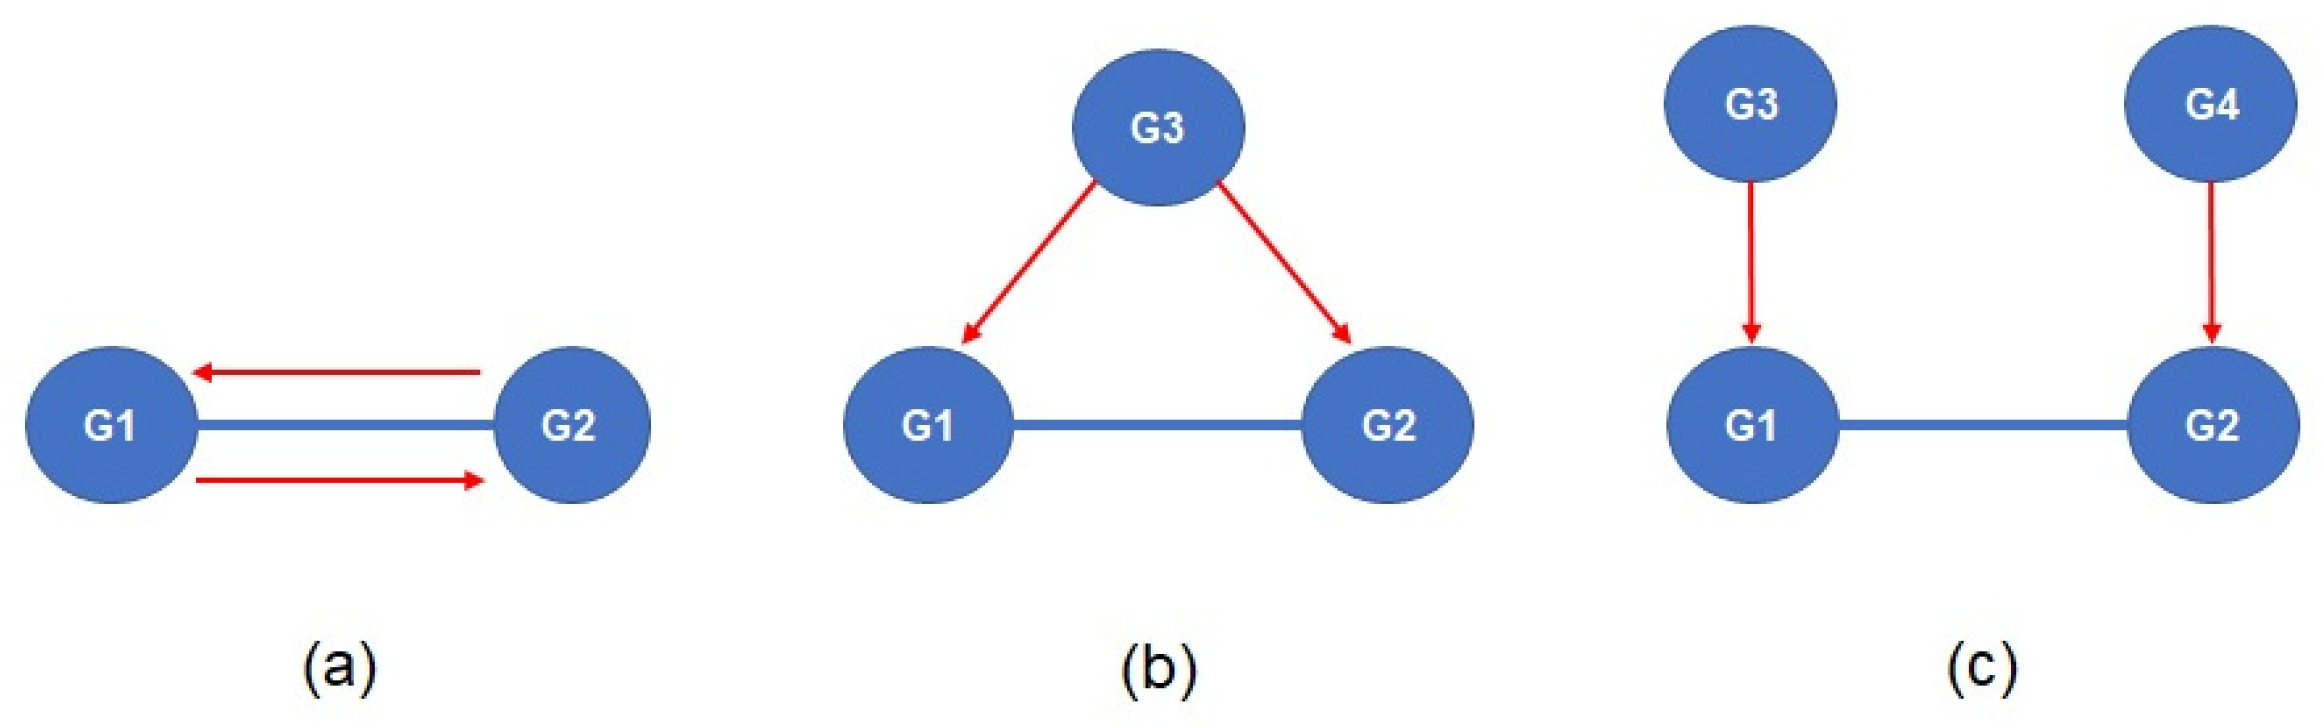
In the above equation, x and y represent expression vectors of different genes in a gene expression matrix of n samples, and and are means of the expression vectors. The significance of the co-expression is measured using the t distribution. The interpretation of significant co-expression includes the following scenarios. First, one gene of the significant co-expression gene pair has a direct effect on the expression of the other gene. Second, both genes of the significant co-expression gene pair have significant interactions with the other gene and the interaction of the co-expression genes is indirect. Third, both genes of the significant co-expression gene pair are regulated by another genes (Figure 1).
GCNs have revealed functional implications of GRNs in cancers. In particular, when combined with an enrichment test using biological knowledge, such as pathway or gene ontology (GO), GCNs enabled identification of essential biological mechanisms that are consistent with the current knowledge about the molecular biology of cancer development and progression [14]. For example, Aggarwal et al. identified a gastrome, which is a functional module defined by meta-analysis of co-expression analysis of four different gastric cancer datasets [15]. In this analysis, they clustered the network of significant co-expressions and identified the functional implications of the clusters using GO enrichment, which is tested based on the hypergeometric distribution. This gastrome consisted of genes that are related to cell proliferation, adhesion, and immune responses, which are closely related to cancer pathophysiology. Moreover, they found a novel interaction between PLA2G2A and EphB2. Although this study identified both functional modules and regulatory relationships between individual gene pairs, most other studies only reported functional modules of cancers using co-expression analysis [17,18,19]. In addition to using the CC for the estimation of GCNs, some modifications are applied for better estimation of co-expression relationships [20,21,22,23,24,25,26,27,28,29,30,31,32,33,34]. Weighted gene co-expression analysis (WGCNA) is one of the most widely used methods. It uses signed co-expression measure between genes x and y using the following equation.
The signed correlations represent the distance between gene pairs, and the adjacency matrix is constructed using the signed correlations with the power of the soft thresholding parameter β.
This produces a weighted adjacency matrix (axy), and the weighted topological overlap measure is applied to define clusters based on the degree of co-expression. In cancer research, WGCNA has been used to identify functional modules that are related to cancer pathophysiology and prognosis. Yang et al. found that prognostic genes of four cancers are enriched in modules identified using WGCNA [34]. In an analysis of large-scale gene expression microarray data of breast cancer, the WGCNA identified gene modules that are related to clinical parameters and found novel prognostic genes [21]. Indeed, most studies that apply WGCNA are aimed at exploring prognostic and biomarker genes. Only a few studies are focused on the identification of gene regulatory relationships that are associated with the pathophysiology of cancer [29].
Information-theoretic measures have been applied in the construction of GCNs. Mutual information (MI) is a measure for the determination of co-expression relationships [35,36]. It represents the mutual dependency between two random variables (Equation (4)). In Equation (4), p(x,y) is the joint distribution of variables x and y, and p(x) and p(y) are the marginal distribution of each variable, respectively. The MI is determined by the ratio of the joint distribution versus product of the marginal distributions. Therefore, zero MI indicates that the two variables are independent, and high MI means strong dependency between the variables.
2.2. Differential Co-Expression Network
Differential co-expression networks identify gene pairs that show significantly different co-expression between conditions, whereas the GCN methods are focused on identifying genes that have similar expression patterns in the gene expression data. The conditions might be different phenotypes or experimental conditions. In many cases, the differential co-expression is measured using Fisher’s Z transformation of the CC. The difference of the statistics between the conditions is tested using the standard normal distribution. The differential co-expression reveals the mechanistic relationship between two gene pairs [37,38]. In cancer research, differential co-expression has been used to identify functional interactions that are conserved in the development of cancers [39], the regulatory mechanism of estrogen receptors in breast cancer [40], and prognostic gene modules in ovarian cancer [41]. For example, differentially co-expressed genes of several ovarian cancer data identified highly interconnected gene modules that showed significant associations with survival [41].
In the estimation of GRNs using pairwise measures, it should be noted that direct estimation of the regulatory relationship between two genes is not possible, and the findings rather provide clues about the regulatory relationship. Therefore, additional steps, such as the application of functional annotation, are required. However, even functional annotation provides the same results for the regulatory relationships. Therefore, post hoc analysis of co-expression appears to be performed more, especially in cancer research.
3. Estimation of Gene Regulatory Networks Using Multivariate Measures
3.1. Estimation of Co-Expression Using the Gaussian Graphical Model
For the inference of GRNs, a partial correlation coefficient (PCC) has been applied for estimation of the causal relationship between two genes [42,43,44,45,46,47,48,49,50,51,52,53,54,55,56,57]. A partial correlation indicates that the relationship between the two variables is influenced by other variables in a dataset. A significant partial correlation, which indicates that the degree of the partial correlation is within the rejection region of the null hypothesis in the statistical testing, indicates that the relationship between the two variables is independent of the other remaining variables. In multivariate data, the PCC is estimated using covariance matrix inversion or the following equation, which uses the regression coefficients of least square regression between the target variables and the remaining variables (Figure 2).
In the above equations, i and j indicate two genes, ω indicates the inverse of the covariance matrix, and β is a vector of regression coefficients of a regression model, where genes except gene i are explanatory variables and gene i is a response variable. The superscripts of β indicate the response variable genes. When the PCCs are estimated between all variables and summarized in a network form, it is also called a Gaussian graphical model (GGM).
In gene expression data, the high-dimensional property of transcriptomics data requires additional remedies. In matrix inversion, Moore–Penrose pseudoinverse and bootstrap aggregation is applied to overcome the shortcomings of a small sample size [56]. The GeneNet package showed a substantial performance in simulation data analysis and identified the genes that are relevant to cancer pathophysiology in an analysis of breast cancer microarray data [56]. In the estimation of PCCs with a linear regression model, gene expression data are problematic because the number of genes is far greater than that of samples, which makes ordinary least-squares estimation for linear regression problematic. To solve this problem, regularized regressions including the partial least square, ridge regression, lasso, and two-stage adaptive lasso methods are applied [55]. In this study, performance was compared in terms of network characteristics rather than biological implications. Although the GGM is applied in cancer research, most studies are focused on modification of the GGM, and cancer data are used for validation of the developed methodologies [43,44,45,47,48,49,50,51,52,53,54,55,56,57]. Modifications of the GGM include identification of multiplicative interaction that hinders inference of partial correlation [48], bootstrapping inference of a network structure with control of the false discovery rate of edges using mixture model [49], fast inference of the GGM using scaled lasso regression [44], and combing a greedy search algorithm to identify the network structure of the GGM in high-dimensional data [57]. Whereas the GGM is inferred without considering the difference in phenotypes, differential networks of the GGM are estimated between conditions [47,52,53]. The methods identify GGM structures that are different between phenotypes or conditions.
3.2. Inference of Gene Regulatory Networks Using the Bayesian Network Model
A Bayesian network (BN) is a graphical model that is used for the inference of causal relationships between variables. Due to its algorithmic characteristics, the BN has been applied to the inference of GRNs from high-throughput transcriptomics data [58]. If the data have K variables, they are represented as K nodes in the BN. In the BN, the joint probability of all variables can be estimated using the following equation.
In Equation (7), pak indicates the parental nodes of node k. The BN has a directed acyclic graph structure: a node is called a child node when the node is pointed to by another node, and the pointing node is called a parent node (Figure 2). As in Equation (7), the probability of the nodes is influenced only by their parent nodes, and the other nodes do not influence the estimation of the joint distribution. This is equivalent to a factorization process of multiple variables. That is, only the parent nodes (variables) are considered in the estimation of the probability of a node, even when many nodes other than the parent nodes are present. For the construction of a BN, the conditional probability should be estimated according to the network structure (parent–child relationship), and inference of the network structure is accomplished with search algorithms.
In cancer research, the BN has been used for the identification of regulatory relationships between genes [58,59,60,61,62,63,64,65,66,67,68,69,70]. Kunkle et al. used the BN to determine the key genes that are critical for the development of astrocytoma [70]. They used 646 differentially expressed genes (DEGs) in astrocytoma from a meta-analysis of 10 microarray datasets. The BN structure was estimated using the DEGs and key genes, which are important genes for predicting the astrocytoma status, using the concept of Markov blanket. The BN was also applied to identify the causal genes that are responsible for the malignant transformation of cancer cells [59]. The DEGs were computed using the microarray data of normal and cancer cells and the BN was constructed using the DEGs. The BN was validated using independent cancer data, which showed consistent GO enrichment in the discovery and validation data. In another study, the BN was used to identify the structure of the GRN in breast cancer metastasis to the bone, brain, and lung using five microarray datasets [68]. Candidate genes for BN construction were selected as the top correlated genes with metastasis status, and the BNs for each metastatic site were inferred. Several genes (POLR2JA, SPTLC1, ILK, ALDH3B1, HEY1, KCNF1, and UVRAG) were found to be causal genes for the metastasis of breast cancer; in particular, estrogen receptor was significantly associated with bone and lung metastasis [68]. Another study using the BN identified 10 genes encoding novel regulators of the G1–S cell cycle transition, which was also validated using small interfering RNA (siRNA) experiments. Moreover, TR1B1 acts on NF-κB and AP-1 sites, which results in cyclin D1 and primes the sensitization of cells to TRAIL-induced apoptosis [64]. In addition to estimation of GRNs between genes, the BN has also been applied to the inference of GRNs related to clinical parameters, such as lymph node metastasis and survival. Gevaert et al. identified network structures having regulatory relationships between genes and clinical outcomes [69]. Of the genes in the BN, the Markov blanket selected those genes that have a causal relationship with the clinical outcomes. Furthermore, the BN showed a better performance in the classification of breast cancer prognosis.
3.3. Estimation of Gene Regulatory Networks Using the Markov Network Model
The Markov network or Markov random field (MRF) is an algorithm for identifying direct relationships between genes [71]. Similar to the BN, a Markov network factorizes the joint distribution p(x) using a subset of genes. However, unlike the BN, it uses an undirected graphical representation (Figure 2). The factorization of the Markov network is represented as follows.
In Equation (8), C indicates cliques of a Markov network and Ψ is a potential function. The joint distribution is a product of potential functions over maximal cliques of the network. Furthermore, Z is a normalization constant estimated by sum of all potential functions.
In cancer research, the Markov network is applied to identify regulatory relationships between genes. Wei et al. proposed a local MRF approach that identifies DEGs and their dependencies [72]. They used the Gamma-Gamma model which is a mixture of gamma distribution for the determination of DEGs, and the local MRF with the selected DEGs was estimated using maximum likelihood estimation. A simulation study revealed that their model outperformed the other benchmark methods in the identification of DEGs. In an analysis of gene expression microarray data of breast cancer, the model found prognosis-associated DEGs, such as CAV1, WNT4, and CCR7. In addition, it found a dependency structure between the DEGs and the other selected genes, which have regulatory potential [72]. In cancer research, the MRF approach is frequently applied to the integration of heterogeneous data, including various omics data from different experimental platforms and prior knowledge that is gathered from publications and databases. These studies are introduced in the following section.
4. Integrative Approach for Estimation of Gene Regulatory Networks
The abovementioned methods estimate regulatory relationships by only using transcriptomics data, which can be classified as unsupervised approaches because any other information is not used except transcriptomics data. In cancer research, supervised methods that integrate information other than transcriptomics data are used for the inference of GRNs. Such information includes epigenomic, TF binding site, and protein–protein interaction information. In this review, these approaches are categorized into two classes. The first approach is a supervised method that uses regression or classification models for the inference of GRNs. The second one is an integrative approach that applies heterogeneous data regardless of whether the inference model for the GRN is supervised or unsupervised.
4.1. Supervised Approach for GRN Estimation
The general framework of the supervised approach used in the estimation of GRNs includes two approaches (Figure 3). First, gene expression profiles are extracted from the transcriptomics data. Second, the expression profiles of one gene (or genes) are regressed on the expression profiles of the other gene (regression approach) or the regulatory relationships between genes are presented as class labels in the supervised classification model (classification approach). In the classification approach, information for regulatory relationships (e.g., TF and its DNA binding site) between genes is integrated in the model, and expression profiles or any information extracted from the profiles, such as distances or correlations, are used as input data for the model.
In the regression approach, tree-based boosting models are applied for the estimation of GRNs [73,74,75,76]. The development of a tree model is equivalent to a feature selection process, and if the selected genes are regressed on the target gene, links between the tree model are regarded as regulatory relationships. As the boosting process generally improves the performance of the tree model, most studies using the tree model adopt such processes. However, the model appears to be applied infrequently to cancer research; thus, relevant publications are hard to find. Another regression approach uses a structural equation model (SEM) [77,78,79,80]. The SEM includes a path analysis model, which uses a directed acyclic graph for the representation of independent variables. Thus, the network structure is determined after application of the path analysis model [80]. Moreover, latent variables are accepted so that any unobservable biological effects can be modeled. Whereas the SEM has been applied for the inference of GRNs in studies on various diseases, it has been less frequently used in cancer research. Considering that the network structure is determined and represented as a regression equation, the result of the SEM is easy to interpret and allows for easy identification of regulatory relationships between genes.
The classification approach is based on the development of a model that predicts whether a regulatory relationship is present between genes [81,82]. For this purpose, gene expression data and other information are used, such as information regarding TF and its binding site, protein–protein interaction, and knockout experiments. Although these methods are validated using non-cancer gene expression datasets, it is worth validating them using cancer transcriptomics data considering their superior performance compared with other methods.
4.2. Integration of Heterogeneous Data Sources for Gene Regulatory Network Estimation
Transcriptional regulation of genes is known to comprise several steps that are involved in various kinds of biological phenomena. Therefore, it is expected that the integration of information regarding the biological processes will be advantageous for the inference of GRNs using gene expression data. Several applications utilize the abovementioned methodologies for the integrative analysis of gene expression data to infer a more accurate GRN by combining heterogeneous biological information and/or multiomics data. Of the methods, the BN is inherently appropriate for the integration of information other than gene expression data because it can be integrated as priors of interaction between genes in the network structure learning [83]. In addition to biological information, multiomics data can also be integrated into the process of GRN structure learning using the BN [84]. The integration of biological knowledge and/or heterogeneous omics data can be applied to the Markov network and GGM. The “gene regulatory network inference accuracy enhancement” algorithm uses the concept of meta-GRNs that pose a weight between genes using prior knowledge, and the weight is integrated into the inference of a Markov network for the GRN [85]. In another study, the Markov network was modified to infer the network structure by combining data having different distributions (FuseNet) [86]. When the FuseNet method was used to perform a combined analysis of RNA sequencing and somatic mutation data for breast cancer, it identified a network structure that was relevant to the pathophysiology of cancer. The GGM has also been modified to integrate biological knowledge. In the modified version of the GGM, lasso is frequently used for the estimation of partial correlations between genes [87,88,89,90]. Most of these methods, including weighted graphical lasso [87], information-incorporated GGM, prior lasso [88], graphical adaptive lasso [89], and fused pathway graphical lasso [90], use a weight matrix that assigns weights to the links between the genes based on prior biological information. These methods have been validated for gene expression data of liver, lung, ovarian, and breast cancers and were found to perform better than the benchmark methods.
5. Evaluation of Inference Methods for Estimation of GRNs and Their Results
5.1. Comparative Analysis Using the Simulation Method
GRNs include over tens of thousands of genes, and a comparative analysis of GRN inference methods needs systematic approaches for unbiased comparison of these methods. Probably the best practical solution is the application of simulation data where a true positive regulatory relationship is already determined. In fact, most studies that develop novel methods use simulation data and compare the preexisting methods and newly developed ones. Whereas ad hoc simulation models have been applied independently across studies, there are computational tools that generate simulation data using statistical or mathematical models for gene expressions. These tools are classified into two categories. First, differential equation models are used, and the data are generated based on predefined parameters [91,92,93,94,95]. GeneNetWeaver and Stochastic Gene Networks Simulator are tools that use differential equation models [91,93], and NetBenchmark provides several different simulation tools for benchmark analysis [92]. Second, specific models are used in the generation of simulation data. For example, in the GeneNet package, a GGM-based function is implemented, and users can generate data using their own parameters, including the number of genes, samples, and regulatory relationships between specific genes [56]. In many studies, simulation data were generated using a GGM or BN model, and several parameters were combined to generate simulation data with different characteristics. SynTReN simulates gene expression data from different types of network topology models [96].
5.2. Application of Prior Biological Knowledge Obtained from External Databases
For faster and more efficient validation of results from GRN analysis, evidence from databases can be applied; one of the most frequently used databases is the GO database. GO is a nomenclature system that provides information about the functions of genes [97]. A GO term is mapped to multiple genes that are associated with the same biological processes, molecular functions, or cellular locations. GO is frequently used for the validation of co-expression modules that are defined using expression similarities between genes. If the genes in the module have similar functions, then certain GO terms linked to the genes are overrepresented in comparison to what would be attributable to random chance alone. The test of significant overrepresentation of GO terms is called an enrichment test, which uses chi-square or hypergeometric distributions for testing the significance of the enrichment of GO terms in the module. The enrichment test can be applied to the validation of a GRN, especially when a gene is linked to multiple genes or to a group of genes interconnected by the regulatory relationship in the estimated GRN. As it is assumed that genes involved in similar biological processes tend to be linked to each other in a GRN [98], the application of an enrichment test can be an efficient strategy for the computational evaluation of a GRN.
Information about intergene regulations from pathway databases, such as KEGG [99], WikiPathways [100], Small Molecule Pathway Database [101], PathBank [102], Pathway Commons [103], Reactome [104], GeneMANIA [105], and MSigDB [106], provides another platform for the evaluation of estimated GRNs. These databases collect information through manual curation of publication data and/or data analysis of open functional genomics data, and they contain regulatory relationships between genes. This information is applied to the validation of GRNs as gold-standard relationships. In cancer, however, it is possible that aberrant genetic circuit information is not included in the pathway databases. Fortunately, information related to cancer-specific pathways is available in KEGG, Reactome, WikiPathways, and MSigDB. This should be considered when the estimated GRN is evaluated using knowledge obtained from external biological databases.
Other databases used in the validation of GRNs provide biological knowledge about TFs and their binding site and epigenomic control of gene expression. TRANSFAC is one of the most popular databases for information regarding TFs and their binding sites [107]. As mentioned earlier, the database is frequently applied for the supervised estimation of GRNs. The JASPAR database has a similar functionality to TRANSFAC, and its data content is limited to six taxonomic groups [108]. Other databases such as hTFtarget [109], TRRUST [110], and TF2DNA [111] provide similar biological knowledge for humans and/or mice. In addition to the TF databases, integrated databases combining heterogeneous information about gene regulation are available. For example, the European Bioinformatics Institute maintains a database of information regarding gene regulation as part of the Ensembl database system [112]. The RegNetwork includes TF–microRNA relationships [113], and the Gene Transcription Regulation Database integrates processed epigenomic data of DNase I hypersensitive site sequencing and chromatin immunoprecipitation sequencing [114]. The dbCoRC database provides information about super-enhancers that are predicted using H3K27ac ChIP-seq data [115].
5.3. Experimental Technologies for the Validation of GRNs
As more than tens of thousands of genes exist in the human genome, experimental validation of the regulatory relationships between all genes is hard to accomplish. Even if fewer genes are selected, it is still difficult to simultaneously validate the regulatory relationships between several genes. For the experimental validation of regulatory relationships, genes that show the most significant results or high connectivity (e.g., measured using CC, PCC, or any other metrics) are selected and analyzed in experiments. Moreover, for this purpose, gene perturbation experiments are used [116]. The basic assumption of such validation is that the genes are estimated to have regulatory relationships if their expressions are changed after the perturbation of a certain gene.
Overexpression of one gene and observation of the other genes that are estimated to have regulatory relationships are widely used methods for the validation of regulatory relationships. DNA transfection and subsequent polymerase chain reaction experiments for the identification of gene expression changes allow researchers to decide whether a gene is indeed related to the changes in expressions of the other genes that are known to be regulated by that gene. Using siRNA is another method for perturbation of gene expression [117]. The length of siRNA ranges from 21 to 23 nucleotides, and it is easy to use compared with the previously mentioned transfection method. If an siRNA acts on one gene, then the expression of other genes that have regulatory relationships with that gene tends to change. Recently, clustered regularly interspaced short palindromic repeats (CRISPR) technology has been applied to gene perturbation experiments. CRISPR technology knocks down gene expression through complementary base-pairing of a single guide RNA. Similar to siRNA experiments, regulatory relationships between genes can be identified by gene perturbation using CRISPR technology [118].
6. Discussion
In this review, GRN inference and validation methods for gene expression data were surveyed. The widely used pairwise measures are CC and MI, and their interpretation is performed with GO in many cases. Since significant co-expression does not guarantee a regulatory relationship, it should be validated with other information. As multivariate measures, the GGM, BN, and MRF are frequently applied. The concepts of the models are different, but they consider multiple variables when determining regulatory relationships between two variables, and inference of regulatory relationships is possible. The supervised approach is performed with the application of linear regression or classification models, and biological knowledge is integrated through weights in the regression model or into a classification model as information for deciding whether genes have a regulatory relationship or not.
Considering the methodologies used in the publications that are reviewed here, there are issues that should be considered in the GRN analysis of cancer transcriptomics data. First, although several GRN inference methods have been developed, few methods that can be used for identifying cancer-specific GRNs are available. Most of the methods are applicable to transcriptomics data regardless of whether the data are generated from cancerous or non-cancerous samples. As the rewiring of GRNs is a characteristic feature of cancer, the deviation from normal GRNs should be estimated in studies on GRNs using cancer transcriptomics data. Second, because canonical knowledge of gene regulatory interactions may not be valid in cancer, it is necessary to provide cancer-specific genetic regulatory evidence, which needs to be collected in databases, and a testing procedure deciding whether the estimated GRN is valid given information from the databases. Third, even cancer of the same type or stage can have a heterogeneous nature, which indicates the necessity of developing methods for the inference of heterogeneous GRNs from cancer transcriptomics data. Finally, more research about integrative methods for multiomics data is required for accurate estimation of GRNs in cancer.
Funding
This research was funded by Gachon University Gil Medical Center, grant numbers FRD2020-04-02 and FRD2020-08.
Conflicts of Interest
The author declares no conflict of interest.
References
- Hastings, P.J.; Lupski, J.R.; Rosenberg, S.M.; Ira, G. Mechanisms of change in gene copy number. Nat. Rev. Genet. 2009, 10, 551–564. [Google Scholar] [CrossRef] [PubMed] [Green Version]
- McCabe, M.T.; Brandes, J.; Vertino, P.M. Cancer DNA Methylation: Molecular Mechanisms and Clinical Implications. Clin. Cancer Res. 2009, 15, 3927–3937. [Google Scholar] [CrossRef] [PubMed] [Green Version]
- Zhang, Y.; Qian, J.; Gu, C.; Yang, Y. Alternative splicing and cancer: A systematic review. Signal Transduct. Target. Ther. 2021, 6, 1–14. [Google Scholar] [CrossRef]
- Audic, Y.; Hartley, R.S. Post-transcriptional regulation in cancer. Biol. Cell 2004, 96, 479–498. [Google Scholar] [CrossRef]
- Bradner, J.E.; Hnisz, D.; Young, R.A. Transcriptional Addiction in Cancer. Cell 2017, 168, 629–643. [Google Scholar] [CrossRef] [PubMed] [Green Version]
- Gardner, T.S.; Cantor, C.R.; Collins, J.J. Construction of a genetic toggle switch in Escherichia coli. Nature 2000, 403, 339–342. [Google Scholar] [CrossRef] [PubMed]
- Jaksik, R.; Iwanaszko, M.; Rzeszowska-Wolny, J.; Kimmel, M. Microarray experiments and factors which affect their reliability. Biol. Direct 2015, 10, 46. [Google Scholar] [CrossRef]
- Slatko, B.E.; Gardner, A.F.; Ausubel, F.M. Overview of Next-Generation Sequencing Technologies. Curr. Protoc. Mol. Biol. 2018, 122, e59. [Google Scholar] [CrossRef]
- Quackenbush, J. Microarray data normalization and transformation. Nat. Genet. 2002, 32, 496–501. [Google Scholar] [CrossRef]
- Evans, C.; Hardin, J.; Stoebel, D. Selecting between-sample RNA-Seq normalization methods from the perspective of their assumptions. Briefings Bioinform. 2017, 19, 776–792. [Google Scholar] [CrossRef]
- Spitz, F.; Furlong, E. Transcription factors: From enhancer binding to developmental control. Nat. Rev. Genet. 2012, 13, 613–626. [Google Scholar] [CrossRef]
- Catalanotto, C.; Cogoni, C.; Zardo, G. MicroRNA in Control of Gene Expression: An Overview of Nuclear Functions. Int. J. Mol. Sci. 2016, 17, 1712. [Google Scholar] [CrossRef] [PubMed] [Green Version]
- Chen, T.; Dent, S.Y.R. Chromatin modifiers and remodellers: Regulators of cellular differentiation. Nat. Rev. Genet. 2014, 15, 93–106. [Google Scholar] [CrossRef] [PubMed] [Green Version]
- Lee, H.K.; Hsu, A.K.; Sajdak, J.; Qin, J.; Pavlidis, P. Coexpression Analysis of Human Genes Across Many Microarray Data Sets. Genome Res. 2004, 14, 1085–1094. [Google Scholar] [CrossRef] [PubMed] [Green Version]
- Aggarwal, A.; Guo, D.L.; Hoshida, Y.; Yuen, S.T.; Chu, K.-M.; So, S.; Boussioutas, A.; Chen, X.; Bowtell, D.; Aburatani, H.; et al. Topological and Functional Discovery in a Gene Coexpression Meta-Network of Gastric Cancer. Cancer Res. 2006, 66, 232–241. [Google Scholar] [CrossRef] [Green Version]
- Slavov, N.; Dawson, K.A. Correlation signature of the macroscopic states of the gene regulatory network in cancer. Proc. Natl. Acad. Sci. USA 2009, 106, 4079–4084. [Google Scholar] [CrossRef] [Green Version]
- Yu, K.; Ganesan, K.; Miller, L.; Tan, P. A Modular Analysis of Breast Cancer Reveals a Novel Low-Grade Molecular Signature in Estrogen Receptor–Positive Tumors. Clin. Cancer Res. 2006, 12, 3288–3296. [Google Scholar] [CrossRef] [Green Version]
- He, D.; Liu, Z.-P.; Honda, M.; Kaneko, S.; Chen, L. Coexpression network analysis in chronic hepatitis B and C hepatic lesions reveals distinct patterns of disease progression to hepatocellular carcinoma. J. Mol. Cell Biol. 2012, 4, 140–152. [Google Scholar] [CrossRef] [Green Version]
- Xu, Y.; Duanmu, H.; Chang, Z.; Zhang, S.; Li, Z.; Li, Z.; Liu, Y.; Li, K.; Qiu, F.; Li, X. The application of gene co-expression network reconstruction based on CNVs and gene expression microarray data in breast cancer. Mol. Biol. Rep. 2011, 39, 1627–1637. [Google Scholar] [CrossRef]
- Yuan, L.; Chen, L.; Qian, K.; Wang, G.; Lu, M.; Qian, G.; Cao, X.; Jiang, W.; Xiao, Y.; Wang, X. A novel correlation between ATP5A1 gene expression and progression of human clear cell renal cell carcinoma identified by co-expression analysis. Oncol. Rep. 2017, 39, 525–536. [Google Scholar] [CrossRef] [Green Version]
- Clarke, C.; Madden, S.; Doolan, P.; Aherne, S.T.; Joyce, H.; O’Driscoll, L.; Gallagher, W.; Hennessy, B.T.; Moriarty, M.; Crown, J.; et al. Correlating transcriptional networks to breast cancer survival: A large-scale coexpression analysis. Carcinogenesis 2013, 34, 2300–2308. [Google Scholar] [CrossRef] [PubMed]
- Jie, Y.; Peng, W.; Li, Y.-Y. Identification of novel candidate biomarkers for pancreatic adenocarcinoma based on TCGA cohort. Aging 2021, 13, 5698–5717. [Google Scholar] [CrossRef] [PubMed]
- Costa, R.L.; Boroni, M.; Soares, M.A. Distinct co-expression networks using multi-omic data reveal novel interventional targets in HPV-positive and negative head-and-neck squamous cell cancer. Sci. Rep. 2018, 8, 15254. [Google Scholar] [CrossRef] [PubMed] [Green Version]
- Liu, C.; Dai, Q.; Ding, Q.; Wei, M.; Kong, X. Identification of key genes in hepatitis B associated hepatocellular carcinoma based on WGCNA. Infect. Agents Cancer 2021, 16, 18. [Google Scholar] [CrossRef]
- Xu, W.; Rao, Q.; An, Y.; Li, M.; Zhang, Z. Identification of biomarkers for Barcelona Clinic Liver Cancer staging and overall survival of patients with hepatocellular carcinoma. PLoS ONE 2018, 13, e0202763. [Google Scholar] [CrossRef]
- Lv, Y.; Xie, B.; Bai, B.; Shan, L.; Zheng, W.; Huang, X.; Zhu, H. Weighted gene coexpression analysis indicates that PLAGL2 and POFUT1 are related to the differential features of proximal and distal colorectal cancer. Oncol. Rep. 2019, 42, 2473–2485. [Google Scholar] [CrossRef]
- Niemira, M.; Collin, F.; Szalkowska, A.; Bielska, A.; Chwialkowska, K.; Reszec, J.; Niklinski, J.; Kwasniewski, M.; Kretowski, A. Molecular Signature of Subtypes of Non-Small-Cell Lung Cancer by Large-Scale Transcriptional Profiling: Identification of Key Modules and Genes by Weighted Gene Co-Expression Network Analysis (WGCNA). Cancers 2019, 12, 37. [Google Scholar] [CrossRef] [Green Version]
- Darzi, M.; Gorgin, S.; Majidzadeh-A, K.; Esmaeili, R. Gene co-expression network analysis reveals immune cell infiltration as a favorable prognostic marker in non-uterine leiomyosarcoma. Sci. Rep. 2021, 11, 15254. [Google Scholar] [CrossRef]
- Zhai, X.; Xue, Q.; Liu, Q.; Guo, Y.; Chen, Z. Colon cancer recurrence-associated genes revealed by WGCNA co-expression network analysis. Mol. Med. Rep. 2017, 16, 6499–6505. [Google Scholar] [CrossRef] [Green Version]
- Liao, Y.; Wang, Y.; Cheng, M.; Huang, C.; Fan, X. Weighted Gene Coexpression Network Analysis of Features That Control Cancer Stem Cells Reveals Prognostic Biomarkers in Lung Adenocarcinoma. Front. Genet. 2020, 11, 311. [Google Scholar] [CrossRef] [Green Version]
- Yang, Y.; Han, L.; Yuan, Y.; Li, J.; Hei, N.; Liang, H. Gene co-expression network analysis reveals common system-level properties of prognostic genes across cancer types. Nat. Commun. 2014, 5, 3231. [Google Scholar] [CrossRef] [Green Version]
- Tang, J.; Kong, D.; Cui, Q.; Wang, K.; Zhang, D.; Gong, Y.; Wu, G. Prognostic Genes of Breast Cancer Identified by Gene Co-expression Network Analysis. Front. Oncol. 2018, 8, 374. [Google Scholar] [CrossRef] [PubMed]
- Yang, L.; Li, X.; Luo, Y.; Yang, T.; Wang, H.; Shi, L.; Feng, M.; Xie, W. Weighted gene co-expression network analysis of the asso-ciation between upregulated AMD1. EN1 and VGLL1 and the progression and poor prognosis of breast cancer. Exp. Ther. Med. 2021, 22, 1030. [Google Scholar] [CrossRef] [PubMed]
- Zhang, L.; Kang, W.; Lu, X.; Ma, S.; Dong, L.; Zou, B. Weighted gene co-expression network analysis and connectivity map identifies lovastatin as a treatment option of gastric cancer by inhibiting HDAC2. Gene 2018, 681, 15–25. [Google Scholar] [CrossRef]
- Raza, K.; Parveen, R. Reconstruction of gene regulatory network of colon cancer using information theoretic approach. In Proceedings of the Confluence 2013: The Next Generation Information Technology Summit (4th International Conference), Noida, India, 26–27 September 2013. [Google Scholar]
- Khosravi, P.; Gazestani, V.H.; Pirhaji, L.; Law, B.; Sadeghi, M.; Goliaei, B.; Bader, G.D. Inferring interaction type in gene regulatory networks using co-expression data. Algorithms Mol. Biol. 2015, 10, 23. [Google Scholar] [CrossRef] [PubMed] [Green Version]
- Savino, A.; Provero, P.; Poli, V. Differential Co-Expression Analyses Allow the Identification of Critical Signalling Pathways Altered during Tumour Transformation and Progression. Int. J. Mol. Sci. 2020, 21, 9461. [Google Scholar] [CrossRef] [PubMed]
- Li, J.; Li, Y.X.; Li, Y.Y. Differential Regulatory Analysis Based on Coexpression Network in Cancer Research. Biomed. Res. Int. 2016, 2016, 4241293. [Google Scholar] [CrossRef] [Green Version]
- Choi, J.K.; Yu, U.; Yoo, O.J.; Kim, S. Differential coexpression analysis using microarray data and its application to human cancer. Bioinformatics 2005, 21, 4348–4355. [Google Scholar] [CrossRef] [Green Version]
- Hsiao, T.-H.; Chiu, Y.-C.; Hsu, P.-Y.; Lu, T.-P.; Lai, L.-C.; Tsai, M.-H.; Huang, T.H.-M.; Chuang, E.Y.; Chen, Y. Differential network analysis reveals the genome-wide landscape of estrogen receptor modulation in hormonal cancers. Sci. Rep. 2016, 6, 23035. [Google Scholar] [CrossRef] [Green Version]
- Gov, E.; Arga, K.Y. Differential co-expression analysis reveals a novel prognostic gene module in ovarian cancer. Sci. Rep. 2017, 7, 4996. [Google Scholar] [CrossRef] [Green Version]
- Wang, Y.; Qian, W.; Yuan, B. A Graphical Model of Smoking-Induced Global Instability in Lung Cancer. IEEE/ACM Trans. Comput. Biol. Bioinform. 2016, 15, 1–14. [Google Scholar] [CrossRef] [PubMed]
- Tu, J.-J.; Ou-Yang, L.; Yan, H.; Zhang, X.-F.; Qin, H. Joint reconstruction of multiple gene networks by simultaneously capturing inter-tumor and intra-tumor heterogeneity. Bioinformatics 2020, 36, 2755–2762. [Google Scholar] [CrossRef] [PubMed]
- Leday, G.G.R.; Richardson, S. Fast Bayesian inference in large Gaussian graphical models. Biometrics 2019, 75, 1288–1298. [Google Scholar] [CrossRef] [PubMed]
- Lyu, Y.; Xue, L.; Zhang, F.; Koch, H.; Saba, L.; Kechris, K.; Li, Q. Condition-adaptive fused graphical lasso (CFGL): An adaptive procedure for inferring condition-specific gene co-expression network. PLoS Comput. Biol. 2018, 14, e1006436. [Google Scholar] [CrossRef] [Green Version]
- Ueda, T.; Honda, M.; Horimoto, K.; Aburatani, S.; Saito, S.; Yamashita, T.; Sakai, Y.; Nakamura, M.; Takatori, H.; Sunagozaka, H.; et al. Gene expression profiling of hepatitis B- and hepatitis C-related hepatocellular carcinoma using graphical Gaussian modeling. Genomics 2013, 101, 238–248. [Google Scholar] [CrossRef]
- Tian, D.; Gu, Q.; Ma, J. Identifying gene regulatory network rewiring using latent differential graphical models. Nucleic Acids Res. 2016, 44, e140. [Google Scholar] [CrossRef]
- Andrei, A.; Kendziorski, C. An efficient method for identifying statistical interactors in gene association networks. Biostatistics 2009, 10, 706–718. [Google Scholar] [CrossRef]
- Li, S.; Hsu, L.; Peng, J.; Wang, P. Bootstrap inference for network construction with an application to a breast cancer microarray study. Ann. Appl. Stat. 2013, 7, 391–417. [Google Scholar] [CrossRef]
- Lee, S.; Liang, F.; Cai, L.; Xiao, G. A two-stage approach of gene network analysis for high-dimensional heterogeneous data. Biostatistics 2017, 19, 216–232. [Google Scholar] [CrossRef]
- Zhang, X.-F.; Ou-Yang, L.; Yan, H. Incorporating prior information into differential network analysis using non-paranormal graphical models. Bioinformatics 2017, 33, 2436–2445. [Google Scholar] [CrossRef] [Green Version]
- Zhang, J.; Liu, J.; Lee, D.; Lou, S.; Chen, Z.; Gürsoy, G.; Gerstein, M. DiNeR: A Differential graphical model for analysis of co-regulation Network Rewiring. BMC Bioinform. 2020, 21, 281. [Google Scholar] [CrossRef] [PubMed]
- He, H.; Cao, S.; Zhang, J.G.; Shen, H.; Wang, Y.P.; Deng, H.W. A Statistical Test for Differential Network Analysis Based on Inference of Gaussian Graphical Model. Sci. Rep. 2019, 9, 10863. [Google Scholar] [CrossRef] [PubMed]
- Zhao, H.; Duan, Z.-H. Cancer Genetic Network Inference Using Gaussian Graphical Models. Bioinform. Biol. Insights 2019, 13, 1177932219839402. [Google Scholar] [CrossRef] [PubMed] [Green Version]
- Krämer, N.; Schäfer, J.; Boulesteix, A.-L. Regularized estimation of large-scale gene association networks using graphical Gaussian models. BMC Bioinform. 2009, 10, 384. [Google Scholar] [CrossRef] [PubMed] [Green Version]
- Schäfer, J.; Strimmer, K. An empirical Bayes approach to inferring large-scale gene association networks. Bioinformatics 2004, 21, 754–764. [Google Scholar] [CrossRef]
- Wang, J.; Cheung, L.W.-K.; Delabie, J. New probabilistic graphical models for genetic regulatory networks studies. J. Biomed. Informatics 2005, 38, 443–455. [Google Scholar] [CrossRef] [Green Version]
- Ni, Y.; Müller, P.; Wei, L.; Ji, Y. Bayesian graphical models for computational network biology. BMC Bioinform. 2018, 19, 63. [Google Scholar] [CrossRef]
- Polanski, A.; Polanska, J.; Jarzab, M.; Wiench, M.; Jarzab, B. Application of Bayesian networks for inferring cause-effect rela-tions from gene expression profiles of cancer versus normal cells. Math. Biosci. 2007, 209, 528–546. [Google Scholar] [CrossRef]
- Prestat, E.; De Morais, S.R.; Vendrell, J.A.; Thollet, A.; Gautier, C.; Cohen, P.; Aussem, A. Learning the local Bayesian network structure around the ZNF217 oncogene in breast tumours. Comput. Biol. Med. 2013, 43, 334–341. [Google Scholar] [CrossRef]
- Fröhlich, H.; Bahamondez, G.; Götschel, F.; Korf, U. Dynamic Bayesian Network Modeling of the Interplay between EGFR and Hedgehog Signaling. PLoS ONE 2015, 10, e0142646. [Google Scholar] [CrossRef] [Green Version]
- Wu, S.; Law, A.; Whipple, M.E. A Bayesian Network Model of Head and Neck Squamous Cell Carcinoma Incorporating Gene Expression Profiles. Stud. Health Technol. Inform. 2017, 245, 634–638. [Google Scholar]
- Iglesias-Martinez, L.F.; Kolch, W.; Santra, T. BGRMI: A method for inferring gene regulatory networks from time-course gene expression data and its application in breast cancer research. Sci. Rep. 2016, 6, 37140. [Google Scholar] [CrossRef]
- Gendelman, R.; Xing, H.; Mirzoeva, O.K.; Sarde, P.; Curtis, C.; Feiler, H.S.; McDonagh, P.; Gray, J.W.; Khalil, I.; Korn, W.M. Bayesian Network Inference Modeling Identifies TRIB1 as a Novel Regulator of Cell-Cycle Progression and Survival in Cancer Cells. Cancer Res. 2017, 77, 1575–1585. [Google Scholar] [CrossRef] [Green Version]
- McGeachie, M.J.; Chang, H.-H.; Weiss, S.T. CGBayesNets: Conditional Gaussian Bayesian network learning and inference with mixed discrete and continuous data. PLoS Comput. Biol. 2014, 10, e1003676. [Google Scholar] [CrossRef] [Green Version]
- Wang, W.H.; Xie, T.Y.; Xie, G.L.; Ren, Z.L.; Li, J.M. An Integrated Approach for Identifying Molecular Subtypes in Human Colon Cancer Using Gene Expression Data. Genes 2018, 9, 397. [Google Scholar] [CrossRef] [Green Version]
- Liu, E.; Li, J.; Kinnebrew, G.H.; Zhang, P.; Zhang, Y.; Cheng, L.; Li, L. A Fast and Furious Bayesian Network and Its Application of Identifying Colon Cancer to Liver Metastasis Gene Regulatory Networks. IEEE/ACM Trans. Comput. Biol. Bioinform. 2019, 18, 1325–1335. [Google Scholar] [CrossRef]
- Park, S.B.; Hwang, K.-T.; Chung, C.K.; Roy, D.; Yoo, C. Causal Bayesian gene networks associated with bone, brain and lung metastasis of breast cancer. Clin. Exp. Metastasis 2020, 37, 657–674. [Google Scholar] [CrossRef]
- Gevaert, O.; De Smet, F.; Timmerman, D.; Moreau, Y.; De Moor, B. Predicting the prognosis of breast cancer by integrating clinical and microarray data with Bayesian networks. Bioinformatics 2006, 22, e184–e190. [Google Scholar] [CrossRef] [Green Version]
- Kunkle, B.W.; Yoo, C.; Roy, D. Reverse engineering of modified genes by Bayesian network analysis defines molecular deter-minants critical to the development of glioblastoma. PLoS ONE 2013, 8, e64140. [Google Scholar] [CrossRef] [Green Version]
- Ma, S.; Jiang, T.; Jiang, R. Constructing tissue-specific transcriptional regulatory networks via a Markov random field. BMC Genom. 2018, 19, 65–77. [Google Scholar] [CrossRef]
- Wei, Z.; Li, H. A Markov random field model for network-based analysis of genomic data. Bioinformatics 2007, 23, 1537–1544. [Google Scholar] [CrossRef] [PubMed]
- Park, S.; Kim, J.M.; Shin, W.; Han, S.W.; Jeon, M.; Jang, H.J.; Jang, I.S.; Kang, J. BTNET: Boosted tree based gene regulatory network inference algorithm using time-course measurement data. BMC Syst. Biol. 2018, 12 (Suppl. 2), 20. [Google Scholar] [CrossRef] [PubMed]
- Iglesias-Martinez, L.F.; De Kegel, B.; Kolch, W. KBoost: A new method to infer gene regulatory networks from gene expression data. Sci. Rep. 2021, 11, 1–13. [Google Scholar] [CrossRef] [PubMed]
- Huynh-Thu, V.A.; Irrthum, A.; Wehenkel, L.; Geurts, P. Inferring regulatory networks from expression data using tree-based methods. PLoS ONE 2010, 5, e12776. [Google Scholar] [CrossRef] [PubMed]
- Petralia, F.; Wang, P.; Yang, J.; Tu, Z. Integrative random forest for gene regulatory network inference. Bioinformatics 2015, 31, i197–i205. [Google Scholar] [CrossRef] [Green Version]
- Zhou, X.; Cai, X. Inference of differential gene regulatory networks based on gene expression and genetic perturbation data. Bioinformatics 2019, 36, 197–204. [Google Scholar] [CrossRef]
- Cai, X.; Bazerque, J.A.; Giannakis, G. Inference of Gene Regulatory Networks with Sparse Structural Equation Models Exploiting Genetic Perturbations. PLoS Comput. Biol. 2013, 9, e1003068. [Google Scholar] [CrossRef]
- Zhou, Y.; Song, P.X.; Wen, X. Structural factor equation models for causal network construction via directed acyclic mixed graphs. Biometrics 2020, 77, 573–586. [Google Scholar] [CrossRef]
- Sun, M.; Mo, W.; Fu, X.; Wu, G.; Huang, Y.; Tang, R.; Guo, Y.; Qiu, M.; Zhao, F.; Li, L.; et al. System biology analysis of cell cycle pathway involved in hepatocellular carcinoma. Front. Biosci. 2010, 2, 1127–1144. [Google Scholar]
- Mordelet, F.; Vert, J.-P. SIRENE: Supervised inference of regulatory networks. Bioinformatics 2008, 24, i76–i82. [Google Scholar] [CrossRef]
- Gillani, Z.; Akash, M.S.H.; Rahaman, M.; Chen, M. CompareSVM: Supervised, Support Vector Machine (SVM) inference of gene regularity networks. BMC Bioinform. 2014, 15, 395. [Google Scholar] [CrossRef] [Green Version]
- Isci, S.; Dogan, H.; Ozturk, C.; Otu, H.H. Bayesian network prior: Network analysis of biological data using external knowledge. Bioinformatics 2013, 30, 860–867. [Google Scholar] [CrossRef] [Green Version]
- Isci, S.; Ozturk, C.; Jones, J.; Otu, H.H. Pathway analysis of high-throughput biological data within a Bayesian network framework. Bioinformatics 2011, 27, 1667–1674. [Google Scholar] [CrossRef] [Green Version]
- Banf, M.; Rhee, S.Y. Enhancing gene regulatory network inference through data integration with markov random fields. Sci. Rep. 2017, 7, 41174. [Google Scholar] [CrossRef] [Green Version]
- Žitnik, M.; Zupan, B. Gene network inference by fusing data from diverse distributions. Bioinformatics 2015, 31, i230–i239. [Google Scholar] [CrossRef] [Green Version]
- Zuo, Y.; Cui, Y.; Yu, G.; Li, R.; Ressom, H.W. Incorporating prior biological knowledge for network-based differential gene expression analysis using differentially weighted graphical LASSO. BMC Bioinform. 2017, 18, 99. [Google Scholar] [CrossRef] [Green Version]
- Wang, Z.; Xu, W.; Lucas, F.A.S.; Liu, Y. Incorporating prior knowledge into Gene Network Study. Bioinformatics 2013, 29, 2633–2640. [Google Scholar] [CrossRef] [Green Version]
- Su, N.; Dai, D.; Deng, C.; Qian, M.; Deng, M. Using graphical adaptive lasso approach to construct transcription factor and microRNA’s combinatorial regulatory network in breast cancer. IET Syst. Biol. 2014, 8, 87–95. [Google Scholar] [CrossRef]
- Wu, N.; Huang, J.; Zhang, X.F.; Ou-Yang, L.; He, S.; Zhu, Z.; Xie, W. Weighted Fused Pathway Graphical Lasso for Joint Estimation of Multiple Gene Networks. Front. Genet. 2019, 10, 623. [Google Scholar] [CrossRef] [Green Version]
- Schaffter, T.; Marbach, D.; Floreano, D. GeneNetWeaver: In silico benchmark generation and performance profiling of network inference methods. Bioinformatics 2011, 27, 2263–2270. [Google Scholar] [CrossRef] [Green Version]
- Bellot, P.; Olsen, C.; Salembier, P.; Oliveras-Vergés, A.; Meyer, P.E. NetBenchmark: A bioconductor package for reproducible benchmarks of gene regulatory network inference. BMC Bioinform. 2015, 16, 312. [Google Scholar] [CrossRef]
- Ribeiro, A.S.; Lloyd-Price, J. SGN Sim. a stochastic genetic networks simulator. Bioinformatics 2007, 23, 777–779. [Google Scholar] [CrossRef] [PubMed] [Green Version]
- Pájaro, M.; Otero-Muras, I.; Vázquez, C.; Alonso, A.A. SELANSI: A toolbox for simulation of stochastic gene regulatory networks. Bioinformatics 2018, 34, 893–895. [Google Scholar] [CrossRef] [PubMed] [Green Version]
- Johannes, H.; Christof, M.G. Computer aided interactive gene network simulations including stochastic molecular kinetics and noise. bioRxiv 2019. [Google Scholar] [CrossRef] [Green Version]
- Bulcke, T.V.D.; Van Leemput, K.; Naudts, B.; van Remortel, P.; Ma, H.; Verschoren, A.; De Moor, B.; Marchal, K. SynTReN: A generator of synthetic gene expression data for design and analysis of structure learning algorithms. BMC Bioinform. 2006, 7, 43. [Google Scholar] [CrossRef] [Green Version]
- Gene Ontology Consortium. The Gene Ontology resource: Enriching a GOld mine. Nucleic Acids Res. 2021, 49, D325–D334. [Google Scholar] [CrossRef]
- Lægreid, A.; Hvidsten, T.R.; Midelfart, H.; Komorowski, J.; Sandvik, A.K. Predicting Gene Ontology Biological Process From Temporal Gene Expression Patterns. Genome Res. 2003, 13, 965–979. [Google Scholar] [CrossRef] [Green Version]
- Kanehisa, M.; Furumichi, M.; Tanabe, M.; Sato, Y.; Morishima, K. KEGG: New perspectives on genomes, pathways, diseases and drugs. Nucleic Acids Res. 2016, 45, D353–D361. [Google Scholar] [CrossRef] [Green Version]
- Martens, M.; Ammar, A.; Riutta, A.; Waagmeester, A.; Slenter, D.N.; Hanspers, K.; Miller, R.A.; Digles, D.; Lopes, E.N.; Ehrhart, F.; et al. WikiPathways: Connecting communities. Nucleic Acids Res. 2020, 49, D613–D621. [Google Scholar] [CrossRef]
- Jewison, T.; Su, Y.; Disfany, F.M.; Liang, Y.; Knox, C.; Maciejewski, A.; Poelzer, J.; Huynh, J.; Zhou, Y.; Arndt, D.; et al. SMPDB 2.0: Big Improvements to the Small Molecule Pathway Database. Nucleic Acids Res. 2013, 42, D478–D484. [Google Scholar] [CrossRef] [Green Version]
- Wishart, D.S.; Li, C.; Marcu, A.; Badran, H.; Pon, A.; Budinski, Z.; Patron, J.; Lipton, D.; Cao, X.; Oler, E.; et al. PathBank: A comprehensive pathway database for model organisms. Nucleic Acids Res. 2020, 48, D470–D478. [Google Scholar] [CrossRef] [PubMed]
- Cerami, E.G.; Gross, B.E.; Demir, E.; Rodchenkov, I.; Babur, O.; Anwar, N.; Schultz, N.; Bader, G.D.; Sander, C. Pathway Commons.; a web resource for biological pathway data. Nucleic Acids Res. 2011, 39, D685–D690. [Google Scholar] [CrossRef] [PubMed]
- Croft, D.; O’Kelly, G.; Wu, G.; Haw, R.; Gillespie, M.; Matthews, L.; Caudy, M.; Garapati, P.; Gopinath, G.; Jassal, B.; et al. Reactome: A database of reactions.; pathways and biological processes. Nucleic Acids Res. 2011, 39, D691–D697. [Google Scholar] [CrossRef]
- Franz, M.; Rodriguez, H.; Lopes, C.; Zuberi, K.; Montojo, J.; Bader, G.D.; Morris, Q. GeneMANIA update 2018. Nucleic Acids Res. 2018, 46, W60–W64. [Google Scholar] [CrossRef] [PubMed] [Green Version]
- Liberzon, A.; Subramanian, A.; Pinchback, R.; Thorvaldsdóttir, H.; Tamayo, P.; Mesirov, J.P. Molecular signatures database (MSigDB) 3.0. Bioinformatics 2011, 27, 1739–1740. [Google Scholar] [CrossRef]
- Matys, V.; Kel-Margoulis, O.V.; Fricke, E.; Liebich, I.; Land, S.; Barre-Dirrie, A.; Reuter, I.; Chekmenev, D.; Krull, M.; Hornischer, K.; et al. TRANSFAC and its module TRANS-Compel: Transcriptional gene regulation in eukaryotes. Nucleic Acids Res. 2006, 34, D108–D110. [Google Scholar] [CrossRef] [Green Version]
- Fornes, O.; Castro-Mondragon, J.A.; Khan, A.; Van Der Lee, R.; Zhang, X.; Richmond, P.A.; Modi, B.; Correard, S.; Gheorghe, M.; Baranašić, D.; et al. JASPAR 2020: Update of the open-access database of transcription factor binding profiles. Nucleic Acids Res. 2019, 48, D87–D92. [Google Scholar] [CrossRef]
- Zhang, Q.; Liu, W.; Zhang, H.M.; Xie, G.Y.; Miao, Y.R.; Xia, M.; Guo, A.Y. hTFtarget: A Comprehensive Database for Regu-lations of Human Transcription Factors and Their Targets. Genom. Proteom. Bioinform. 2020, 18, 120–128. [Google Scholar] [CrossRef]
- Han, H.; Cho, J.-W.; Lee, S.-Y.; Yun, A.; Kim, H.; Bae, D.; Yang, S.; Kim, C.Y.; Lee, M.; Kim, E.; et al. TRRUST v2: An expanded reference database of human and mouse transcriptional regulatory interactions. Nucleic Acids Res. 2017, 46, D380–D386. [Google Scholar] [CrossRef]
- Chen, T.; Yang, S.; Xu, J.; Lu, W.; Xie, X. Transcriptome sequencing profiles of cervical cancer tissues and SiHa cells. Funct. Integr. Genom. 2019, 20, 211–221. [Google Scholar] [CrossRef]
- Zerbino, D.R.; Wilder, S.P.; Johnson, N.; Juettemann, T.; Flicek, P.R. The Ensemble Regulatory Build. Genome Biol. 2015, 16, 1–8. [Google Scholar] [CrossRef] [Green Version]
- Liu, Z.-P.; Wu, C.; Miao, H.; Wu, H. RegNetwork: An integrated database of transcriptional and post-transcriptional regulatory networks in human and mouse. Database 2015, 2015, bav095. [Google Scholar] [CrossRef] [Green Version]
- Kolmykov, S.; Yevshin, I.; Kulyashov, M.; Sharipov, R.; Kondrakhin, Y.; Makeev, V.J.; Kulakovskiy, I.V.; Kel, A.; Kolpakov, F. GTRD: An integrated view of transcription regulation. Nucleic Acids Res. 2020, 49, D104–D111. [Google Scholar] [CrossRef]
- Huang, M.; Chen, Y.; Yang, M.; Guo, A.; Xu, Y.; Xu, L.; Koeffler, H.P. dbCoRC: A database of core transcriptional regulatory circuitries modeled by H3K27ac ChIP-seq signals. Nucleic Acids Res. 2018, 46, D71–D77. [Google Scholar] [CrossRef] [PubMed] [Green Version]
- Fus-Kujawa, A.; Prus, P.; Bajdak-Rusinek, K.; Teper, P.; Gawron, K.; Kowalczuk, A.; Sieron, A.L. An Overview of Methods and Tools for Transfection of Eukaryotic Cells in vitro. Front. Bioeng. Biotechnol. 2021, 9, 701031. [Google Scholar] [CrossRef] [PubMed]
- Fakhr, E.; Zare, F.; Teimoori-Toolabi, L. Precise and efficient siRNA design: A key point in competent gene silencing. Cancer Gene Ther. 2016, 23, 73–82. [Google Scholar] [CrossRef] [PubMed]
- Adli, M. The CRISPR tool kit for genome editing and beyond. Nat. Commun. 2018, 9, 1911. [Google Scholar] [CrossRef] [PubMed]
Figure 1.
Interpretation of significant co-expression between G1 and G2. The figures illustrate possible scenarios of a co-expression relationship. (a) One gene directly regulates the expression of the other gene. (b) G3 is a common gene that regulates the expression of G1 and G2 simultaneously. (c) G1 and G2 are regulated by G3 and G4, respectively. The red lines indicate regulatory relationships.

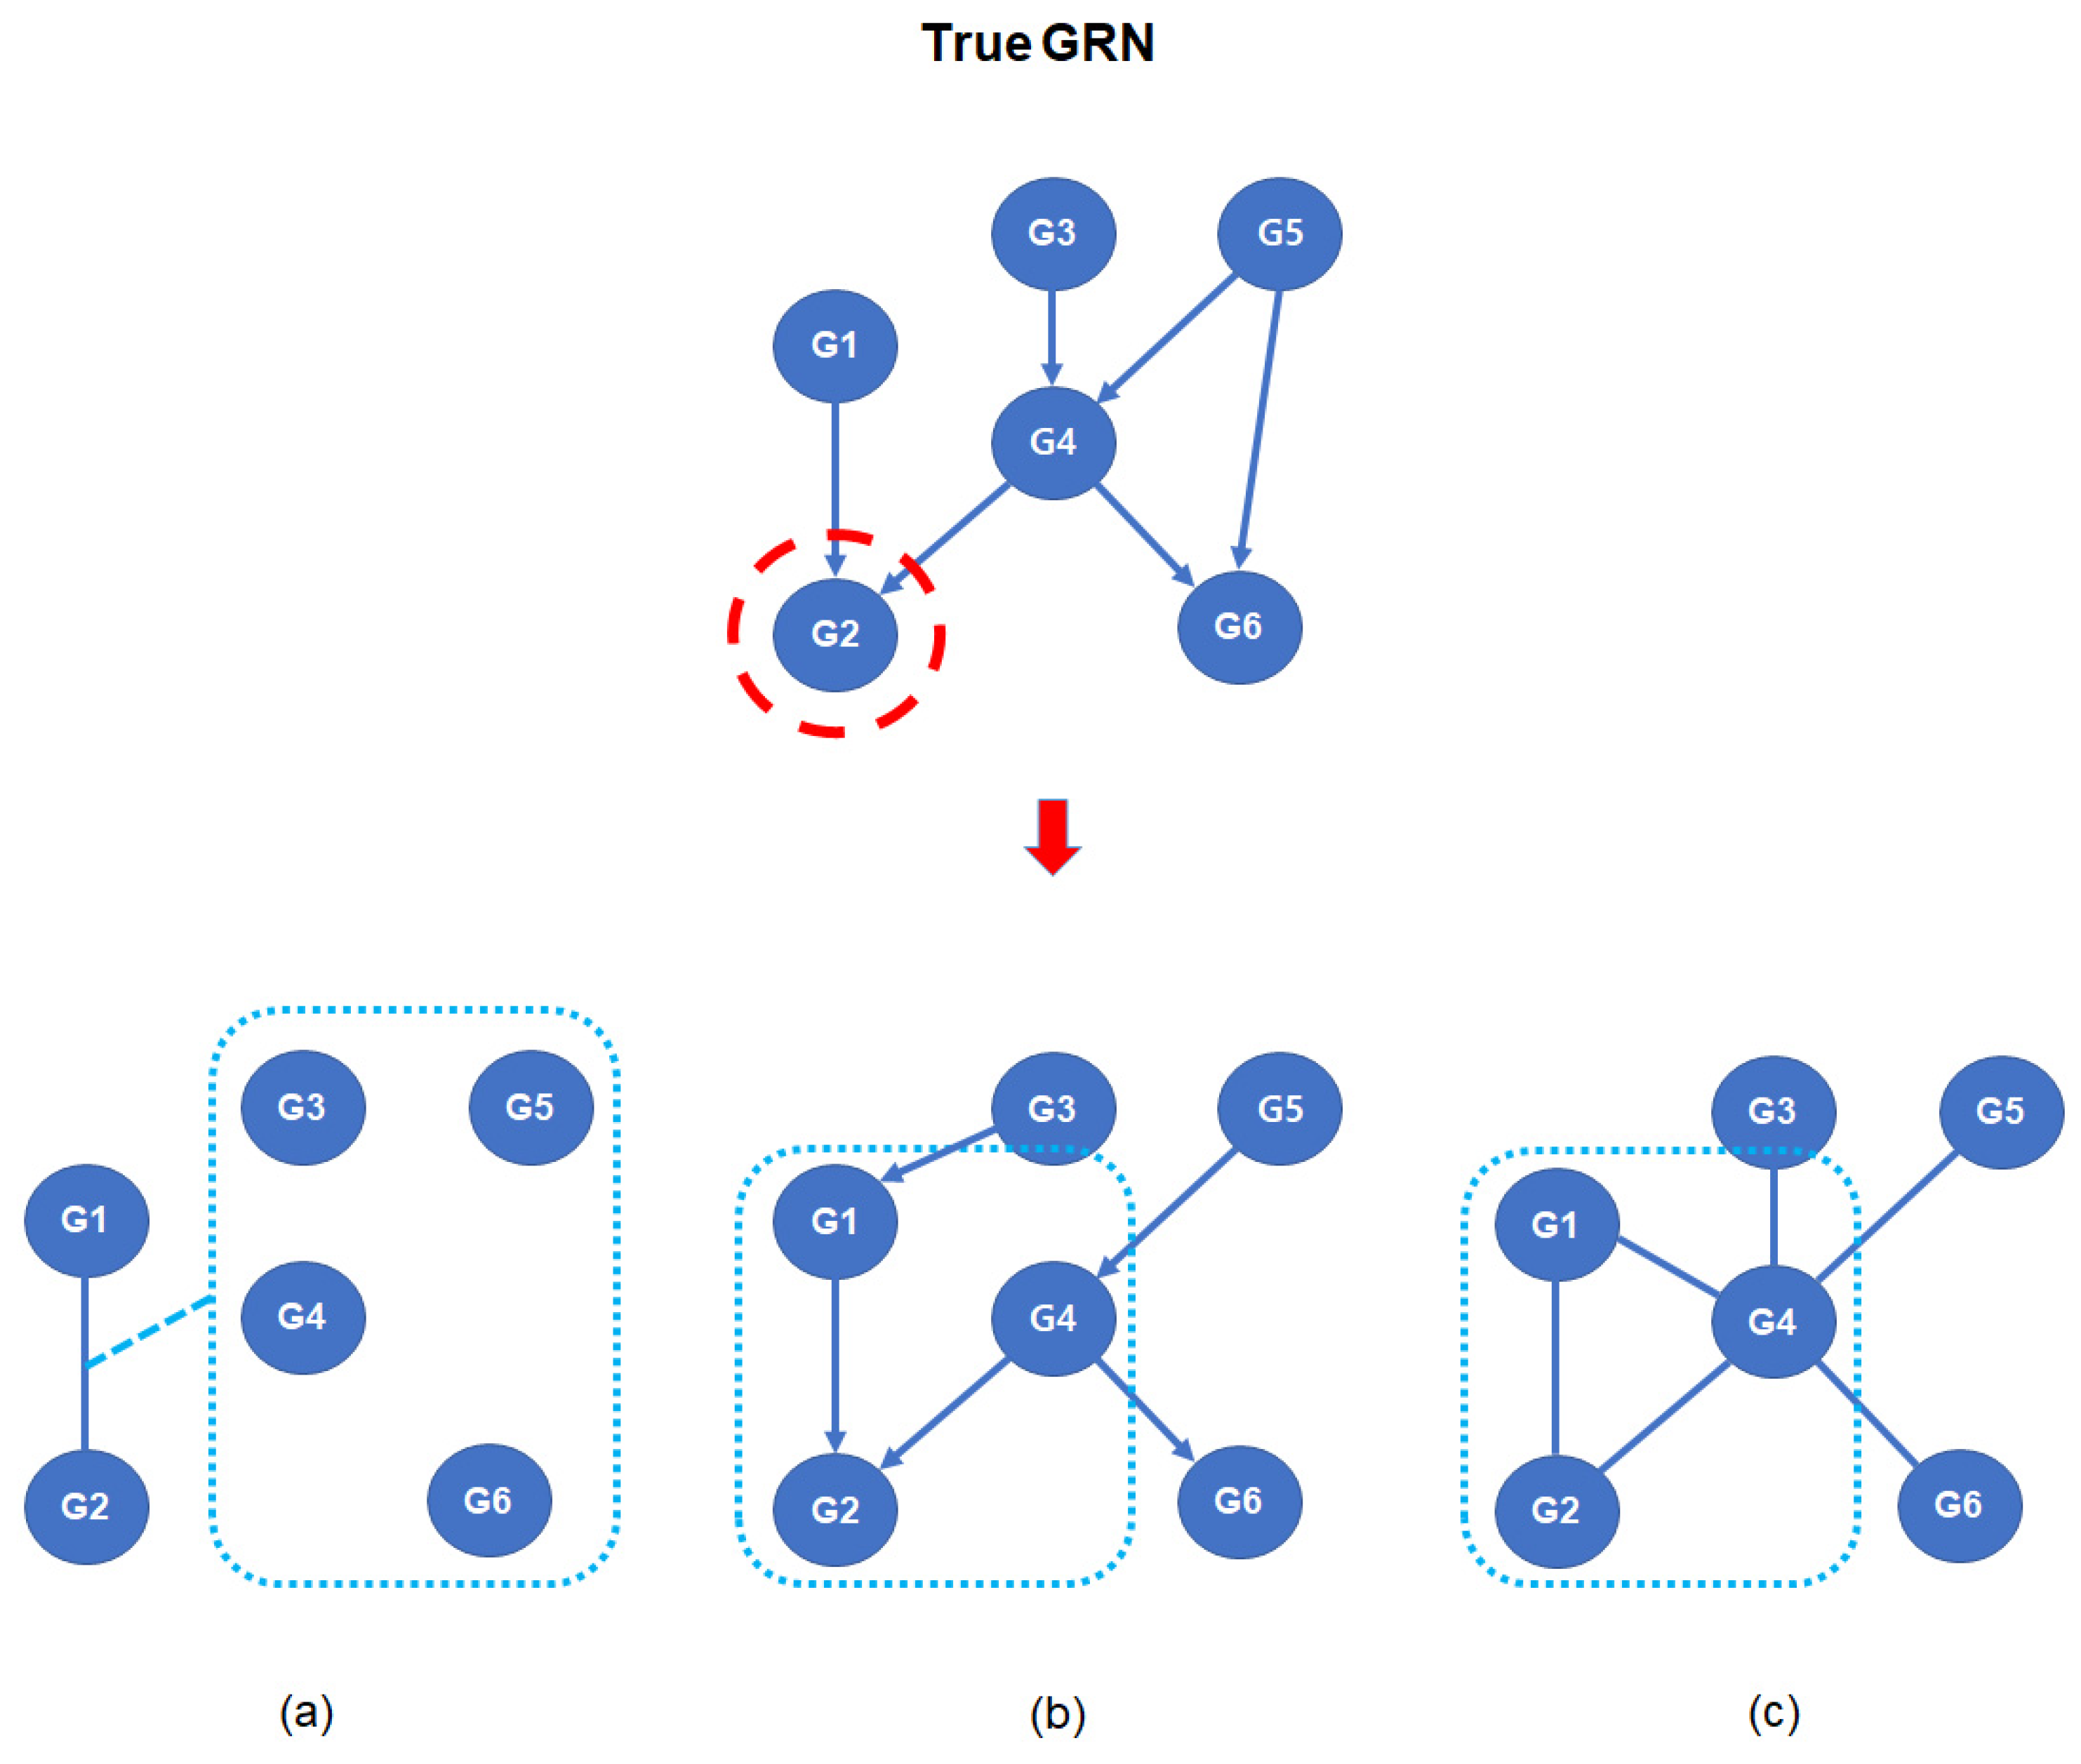
Figure 2.
GRN inference with GGM, BN, and MRF. When G2 is a target gene (red dot circle), (a) GGM estimates the regulatory relationship with G2 using conditioning of other genes, (b) BN infers a directed parent–child structure by assigning conditional probability, and (c) MRF decomposes a multivariate distribution using identification of a dependency structure with potential function. The rounded rectangles of (a–c) indicate the remaining genes, the parent–child relationship, and the dependency structure, respectively. GRN: Genetic Regulatory Network, G: gene, GGM: Gaussian Graphical Model, BN: Bayesian Network, MRF: Markov Random Field.

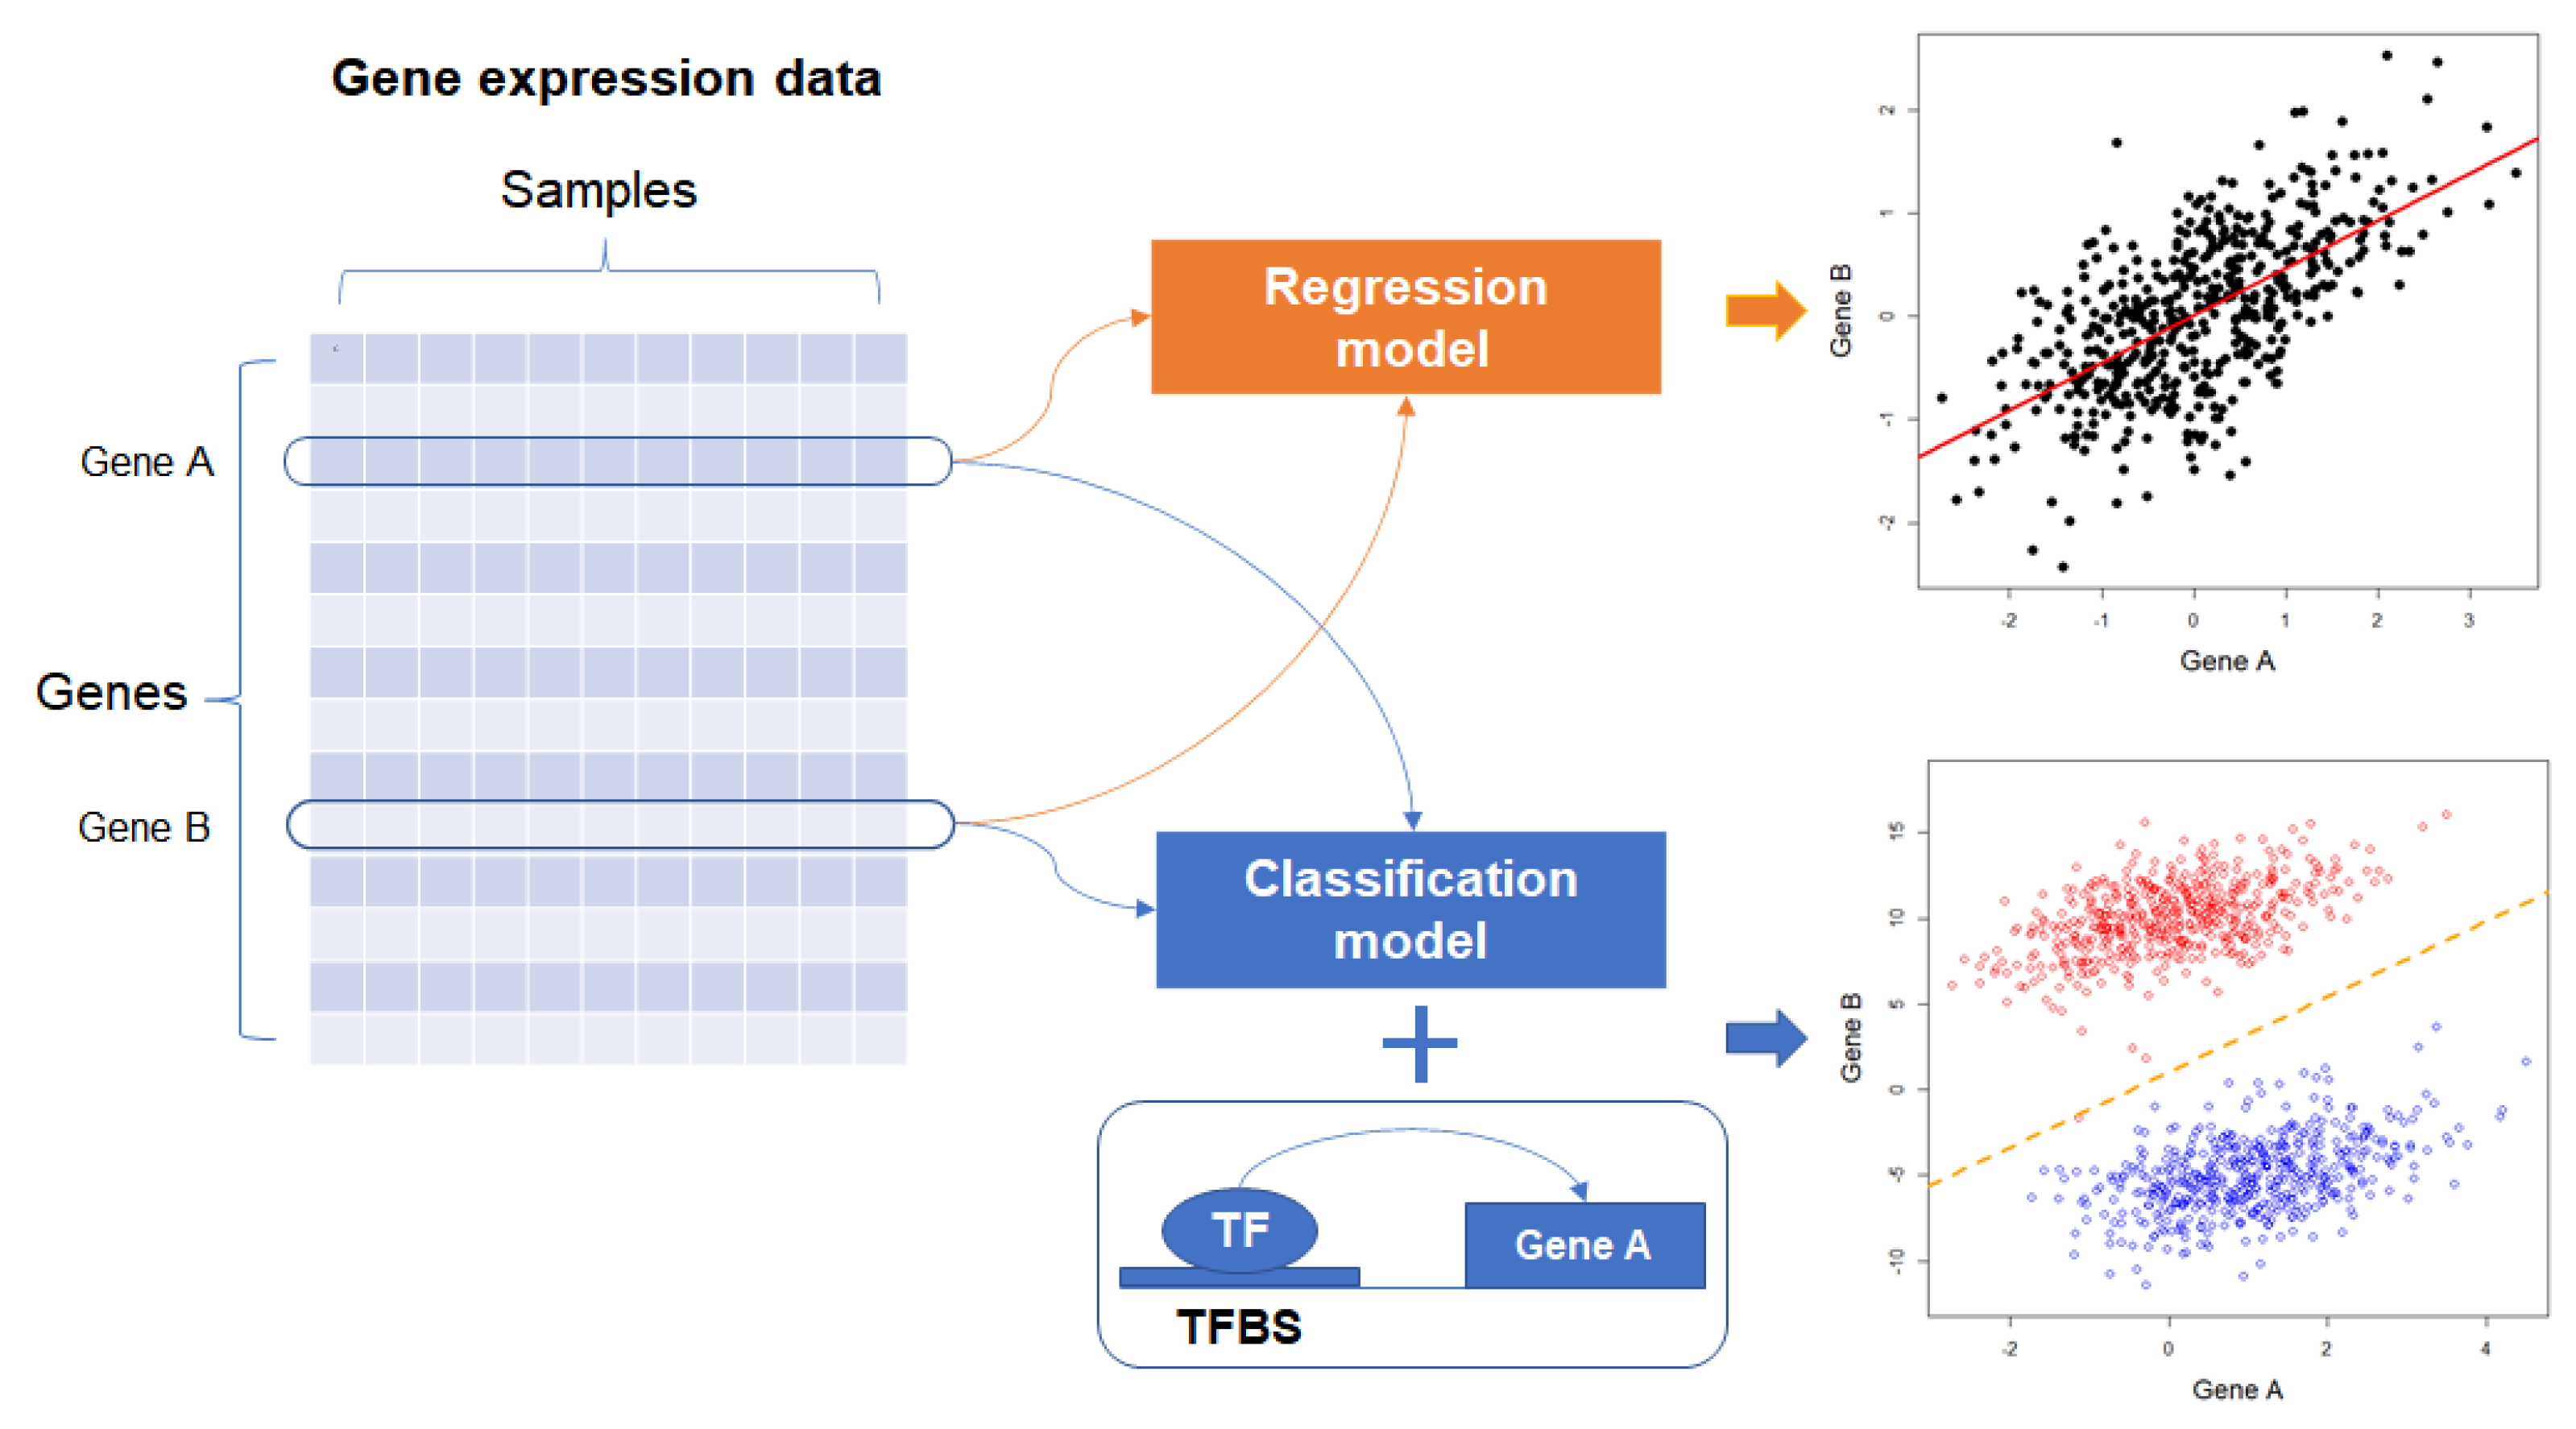
Figure 3.
Inference of GRN with supervised learning model. Expression profiles of genes A and B are used for the inference of regulatory relationships. The upper scatter plot indicates regression line between gene A and gene B, and the lower one shows the decision margin (orange-colored dotted line) for discriminating regulatory relationship between gene A and B, which is estimated with the expression profiles of the genes and prior biological knowledge such as TF and TFBS. TF: transcription factor; TFBS: TF binding site.

Publisher’s Note: MDPI stays neutral with regard to jurisdictional claims in published maps and institutional affiliations. |
© 2021 by the author. Licensee MDPI, Basel, Switzerland. This article is an open access article distributed under the terms and conditions of the Creative Commons Attribution (CC BY) license (https://creativecommons.org/licenses/by/4.0/).
Share and Cite
MDPI and ACS Style
Cho, S.B. Estimation of Gene Regulatory Networks from Cancer Transcriptomics Data. Processes 2021, 9, 1758. https://0-doi-org.brum.beds.ac.uk/10.3390/pr9101758
AMA Style
Cho SB. Estimation of Gene Regulatory Networks from Cancer Transcriptomics Data. Processes. 2021; 9(10):1758. https://0-doi-org.brum.beds.ac.uk/10.3390/pr9101758
Chicago/Turabian StyleCho, Seong Beom. 2021. "Estimation of Gene Regulatory Networks from Cancer Transcriptomics Data" Processes 9, no. 10: 1758. https://0-doi-org.brum.beds.ac.uk/10.3390/pr9101758
Note that from the first issue of 2016, this journal uses article numbers instead of page numbers. See further details here.