
To Advance Industrial Green Technology via Environmental Governance—Evidence from China’s Industrial Sector

School of Business Administration, Zhongnan University of Economics and Law, Wuhan 430074, China
*
Author to whom correspondence should be addressed.
Processes 2021, 9(10), 1797; https://0-doi-org.brum.beds.ac.uk/10.3390/pr9101797
Submission received: 28 July 2021
/
Revised: 25 September 2021
/
Accepted: 27 September 2021
/
Published: 11 October 2021
(This article belongs to the Special Issue Innovative Materials and Processes for Removal of Biopersistent Pollutants)
Abstract
:Industrial green technology progress is an effective way to realize high-quality economic development in China. The different competitive incentives of local governments make a difference in the intensity of environmental regulation between regions. The intensity of environmental regulation is different in different areas of the same industry, leading to the inter-regional transfer of pollution enterprises. The regional distribution of industries is different, which determines the different industries’ needs to coordinate different regions. Only when various industries realize the coordination of regional governance can they jointly promote the progress of industrial green technology. Based on data from 33 industrial sectors in China from 2001 to 2015 and considering the institutional evolution of governance synergy, this study comprehensively investigated the influence mechanism of local government environmental regulation on the industrial green technology progress using the mediating effect model. We found that environmental regulation promoted industrial technological progress through governance synergy and a low degree of inter-regional regulation coordination hindered the industries’ green technology progress. With the change in inter-regional governance synergy levels, we further discovered that the impact of environmental regulation on industrial green technology progress changed substantially. At a low level of governance synergy, environmental regulation inhibited industrial green technology progress. At a high level of governance synergy, environmental regulation promoted industrial green technology progress. While strengthening environmental regulation, we should promote inter-regional cooperation at the industry level. Only by collectively enforcing pollution regulations in industrial level can industrial green technology progress be promoted.
1. Introduction
The extensive development mode with high energy consumption and high emissions in the early Chinese industrial movement created huge economic dividends. However, it also brought severe challenges to environmental governance. In the 19th National Congress of the Communist Party of China (CPC), the party proposed to promote green development and solve environmental problems to realize high-quality economic development. In the long run, whether the existing environmental regulation policy can help to realize the development of the environment and economy depends on whether it can promote the progress of green technology.
The relationship between environmental regulation and green technology progress has been the focus of academic debate for a long time. In China, the research on the relationship has not yet reached a unanimous conclusion. The reason for this lies in the fact that all of this research ignored the governance synergy of local government in the specific national conditions of China. The central government promulgates environmental protection policy to promote green technology based on the regulation of the industrial sector. However, local governments execute this policy at their discretion. Under the administrative decentralization system in China, the different competition incentives of local governments cause the different intensities of inter-regional environmental regulations. The intensity of environmental regulation is different in different areas of the same industry, it easily leads to polluting enterprises avoiding the high cost of local innovation by moving the enterprises to the lax supervision areas. While the regional distribution of different industries is different, it determines that different industries need different areas of co-governance. If local governments do their own thing to manage environmental pollution, not much progress will be made in green technology in the entire industrial sector. Because of the great differences in the industrial structure between each region, there will be great differences in the key areas where each industry needs to be jointly governed if the environmental regulation is carried out at the level of industry. The relevant environmental policies of governance synergy focus on the problem of air pollution and the key cooperation areas of implementing regulations at the industry level are also based on the inherent economic circle of air pollution prevention and control. Without governance synergy, the effect of the environmental policy that is promulgated by the central government will be greatly undermined at the stage of implementation by local governments. It is important to construct industry-level governance synergy to effectively promote industrial green technology and solve China’s environmental problems. However, there is a lack of theoretical and empirical research on the mechanism of how environmental regulation affects green technology progress through governance synergy.
The main contributions of this study are as follows: (1) It constructed the mechanism of how environmental regulation promotes industrial green technology progress through governance synergy at the industry level. This study is different from the previous research on air pollution in urban agglomerations or inter-regional joint prevention. There are regional differences in the distribution of industries, and each industry needs different provinces for co-governance. It is significant whether the co-operation of different local governments in a specific industry can realize the industrial green technology progress. This is highly complementary to existing research. (2) A new measurement of governance synergy is constructed. By using the two-digit industries in a province of industrial gross output value panel data to calculate the weights, two-digit industries in a province of environmental regulation intensity were calculated, and then the inter-regional governance synergy degree of each industry was measured. Different from the previous studies using virtual variable measurement, this study constructed a continuous variable that reflected the collaborative governance level of different regions within a specific industry. (3) Based on the heterogeneity of governance synergy, it was found that the impact of environmental regulation on industrial green technology progress will change substantially at the different levels of governance synergy.
The rest of this paper is arranged as follows: the second part is the literature review, the third part provides the theoretical mechanism and hypothesis, the fourth part provides the research design, the fifth part shows the empirical results and discussions, and the final part provides the summary and policy enlightenment.
2. Review of the Literature
The existing studies were mainly undertaken from the following two perspectives: one was against the Porter hypothesis, arguing that environmental regulation aggravates the production burden of enterprises. It holds that environmental regulation fails to stimulate green technology innovation of enterprises and hinders industrial green technology progress [1,2,3]. Greenstone et al. [4] found that stringent air pollution regulations reduced the green total factor productivity of polluting firms in regulated areas based on data of the U.S. manufacturing plant survey. To avoid the restriction of environmental policies or reduce environmental costs, polluting enterprises transfer production due to regional differences in environmental standards or regulations, leading to the pollution shelter effect [5,6]. Yuan and Xiang [7] employed panel data on Chinese 28 manufacturing industries from 2003 to 2014 to examine the effects of environmental regulation on industrial innovation and green development. They found that the impacts of environmental regulations on green total factor productivity were insignificant over both the short and long term. Some scholars hold that the validity of the Porter hypothesis depends not only on the intensity of environmental regulation but also on the type of environmental regulation [8,9]. The other perspective involved supporting the Porter hypothesis, i.e., strict and appropriate environmental regulation will encourage enterprises to engage in green technology innovation activities and reduce the cost of environmental governance by improving the technological level [10,11,12]. Acemoglu et al. [13] divided the production sector into clean and non-clean sectors, analyzed the impact of environmental policy incentives on technological innovation, and deduced the endogenous process of technological progress by constructing the model of technological progress direction. Ulucak [14] found that environment-related technologies positively contribute to green growth. The strictness of the environmental regulations positively impacts the green innovation of the companies [15]. Some scholars hold that there is a U-shaped threshold effect between environmental regulation and industrial green technology progress [16,17].
Appropriate environmental policies stimulate technological innovation, but the translocation of polluting industries will worsen the environmental quality of the destination, resulting in bottom-up competition between local governments. Wu et al. [18] constructed a spatial Durbin dynamic threshold panel model with provincial-level data to study the nonlinear relationship between environmental regulation and local decentralization. The results showed that there was a significant U-shaped relationship between environmental regulation and green total factor productivity, and a high level of local decentralization inhibited the green technology progress. From the perspective of local decentralization, different competition incentives of local governments lead to different intensities of environmental regulation in different areas. As environmental regulation becomes tighter in one place, polluting enterprises may relocate to nearby regions where environmental regulation is weak [19]. The non-synchronous stimulation of environmental policy among regions will weaken the effect of environmental regulation. It is difficult for environmental policy to stimulate the innovation of industrial green technology.
If local environmental regulation has an impact on green technology progress in neighboring regions [20], will environmental regulation promote green technology progress through inter-regional industrial governance collaboration? Only a few relevant studies have been done on the relationship between governance synergy and environmental pollution. Li et al. [21] constructed a comprehensive index of environmental regulation and the degree of environmental co-governance at the enterprise level. The analysis of the influencing mechanism shows that environmental co-governance can reduce the probability of enterprise migration, inhibit the transfer of pollution to nearby areas, and improve the efficiency of environmental governance. Based on the theory of collective action, Hu et al. [22] put forward the optimal regional control scheme for the governance synergy of air pollution in China and considered that the establishment of inter-regional joint organizations will effectively promote the degree of governance synergy.
There are abundant studies on the influence of environmental regulation on green technology progress. The research on the relationship between governance synergy and environmental pollution has been paid more attention to. However, few studies have combined environmental regulation, governance synergy, and industrial green technology progress for empirical analysis. This study was based on the practical evidence that there were different intensities of environmental regulations in different areas, as well as the unique national conditions of China. It examined how environmental regulation promotes industrial green technology progress through inter-regional governance synergy. Furthermore, if the level of governance synergy is different, how does environmental regulation affect industrial green technology progress? These questions are related to which level of governance synergy is necessary to ensure that environmental policies have a positive effect on green technology progress. The study constructed a governance synergy index, considered how environmental regulation affects industrial green technology progress through governance synergy with the mediating effect model, and investigated the heterogeneity characteristics of the governance synergy degree.
3. System Evolution and Theory Analysis
As early as 1996, the Water Pollution Control Act of China incorporated the water pollution prevention and control planning system for key river basins into the legal framework for the first time, which was essentially the embryonic form of regional joint prevention and control. In May 2015, the State Council issued the Action Plan on Water Pollution Prevention and Control. It suggested that ten key industries, including papermaking and coking, should be cleansed. Furthermore, it proposed the establishment of a governance synergy mechanism for regional water pollution prevention in the Beijing–Tianjin–Hebei region, the Yangtze River Delta, and the Pearl River Delta. In 2017, the Water Pollution Prevention and Control Act was amended with new regulations in the form of a law to ensure the governance synergy mechanism for water pollution prevention in major rivers and lakes. Compared with the water pollution prevention cooperation mechanism, the establishment of the air pollution prevention cooperation mechanism was relatively late.
In 1998, the Ministry of Environmental Protection proposed the Two Control Area Divisions Program for acid rain and SO2. In May 2010, the Ministry of Environmental Protection and nine other departments issued the Guiding Opinions on Promoting Joint Prevention of Air Pollution to Improve Regional Air Quality. It put forward a solution to the problem of regional air pollution with the idea of joint prevention for the first time and strengthened the promotion of cleaner production technology in key industries, such as thermal power, iron, and steel. In September 2013, the State Council issued the Action Plan on Air Pollution Prevention, which proposed the establishment of a regional cooperation mechanism of air pollution prevention in the Beijing–Tianjin–Hebei and Yangtze River delta regions, especially for the waste gas pollution in key industries. The following year, the Working Plan on strengthening air pollution prevention in the energy sector was formulated. It proposed that the local governments of ten provinces and cities, including Beijing, Shanghai, and Guangzhou, were responsible for implementing the tasks of controlling the total amount of energy and coal consumption. A long-term mechanism for joint prevention from the central government to the local authorities should be established. At the same time, the Ministry of Environmental Protection formulated the measures of air pollution prevention in key industries, such as power, steel, cement, and flat glass, for the Yangtze River Delta Economic Zone, the Beijing–Tianjin–Hebei region, and the surrounding areas. In 2015, the air pollution prevention law was amended again to set up new content for the Joint Prevention of Air Pollution in Key Regions, which ensured the joint prevention mechanism of air pollution in key regions from the national legal level. In 2018, the State Council issued the three-year action plan for winning the battle to defend the Blue Sky, which identified 28 cities in the Beijing–Tianjin–Hebei region and its surrounding areas as key areas and reorganized the coordination group into a leading group on air pollution prevention.
No matter the key river basins of water pollution prevention or the three economic circles of air pollution prevention, there is a lack of institutional planning and regulatory rules that consider the coordinated actions of different local governments and governments from industry. This is the defect of the current policy system of governance synergy. At present, the coordination areas of industrial pollution prevention depend on the existing air prevention areas. If such prevention is not implemented in the inter-regional coordination action within specific industrial sectors, environmental regulation will not upgrade the level of green technology of the overall industry, and the environmental policy pollution effect will be greatly compromised. The establishment of the pollution prevention system from the central government to the local governments shows that governance synergy is imminent. Based on the above analysis, hypothesis 1 was proposed.
Hypothesis 1.
Environmental regulation promotes industrial green technology progress through governance synergy to some extent.
The improvement of governance synergy will help enterprises to improve their innovation level and achieve the policy objectives [23]. The higher the level of governance synergy, the smaller the differences in environmental regulation intensity between different provinces in the industry, and the smaller the space for pollution enterprises to reduce the regulation cost via inter-regional transfer. When sustainable economic development is faced with tight environmental regulation constraints, the high level of governance coordination becomes an important way to solve the dilemma of maintaining growth and promoting carbon emissions reduction. However, the current governance synergy lacks intrinsic motivation. There are three reasons why it is difficult for local governments to manage environmental problems in coordination: The first reason is the fiscal incentive. Fiscal decentralization causes local governments to pursue economic development at the expense of environmental governance, resulting in a bottom-up competition effect. In contrast, to compete for the essential resources that favor a high-quality environment, local governments are competing with each other in spending on pollution prevention and forming top-down competition. The second reason is the promotion incentives for officials. Distortions in local government efforts are inevitable because green technology progress indicators are not easy to quantify. Driven by their political achievements, officials may ignore the long-term effects of rapid economic growth, especially those related to environmental pollution, which are not easily assessed, resulting in a bottom-up competition effect. In contrast, to implement the Scientific Outlook on Development, the competition for local government environmental regulation has subsided. Officials have even pursued an achievement project that involves beautifying the environment during their term of office, resulting in a top-down competition effect. The third reason is catching up with and surpassing strategic incentives. Decentralization reform causes local governments to continue to give priority to the development of heavy industries to catch up with the advanced provinces. This lowers the standard of environmental regulation and leads to a bottom-up competition effect. After the reform and opening-up, the rapid economic growth of China expanded the regional differences in development. The differences in the competitive incentives of local governments are likely to lead to differences in behavior and intensity of environmental regulation.
However, the intervention of environmental regulation just makes up the deficiency of this intrinsic incentive and aggravates the regulation cost burden of incomplete implementation by local governments. It ensures that local governments effectively implement environmental protection policies that are related to governance synergy. In 2005, the State Council issued the Decision on Implementing the Scientific Outlook on Development and Strengthening Environmental Protection. It incorporated the performance of environmental protection into the assessment system as the basis of local official selection for the first time. In July 2015, the Environmental Protection Supervision Plan (Trial) was released. In 2016, the State Environmental Protection Supervision Office was set up and the reform on vertical environmental management system was piloted. In June 2020, the State Council General Office issued a reform plan on the division of financial powers and expenditure responsibilities between the central and local governments in the field of ecological environment. It established a fiscal relationship between the central and local governments with clear powers and responsibilities, coordinated financial resources, and balanced regional development. Therefore, a reasonable standard of environmental regulation is helpful for the construction of a regional joint prevention and control system, as well as driving the inter-regional governance coordination and industrial green technology progress to a high level. However, for those regions whose economic development is heavily dependent on a single industry, especially pollution-intensive manufacturing, the tightening of environmental regulation standards will make it difficult to raise the level of governance synergy in the short term. Moreover, it will magnify the costs of regulation such that the level of low-carbon technology in the region may decrease as the intensity of environmental regulation increases. In this case, it is inefficient to promote industrial green technology progress through environmental regulation. Therefore, according to the mechanism of governance synergy, the impact of environmental regulation on the progress of industrial green technology will change with the inter-regional governance synergy level in a specific industry. Moreover, the higher the level of inter-regional governance synergy, the more obvious the industrial green technology progress effect of environmental regulation will be, and vice versa. Based on the above analysis, we proposed hypothesis 2.
Hypothesis 2.
The impact of environmental regulation on the industrial green technology progress will change substantially with the change in the inter-regional governance synergy level. At a low level of governance synergy, environmental regulation is not good for industrial green technology progress, while at a high level of governance synergy, environmental regulation promotes industrial green technology progress.
4. Research Design
4.1. Setting the Empirical Model
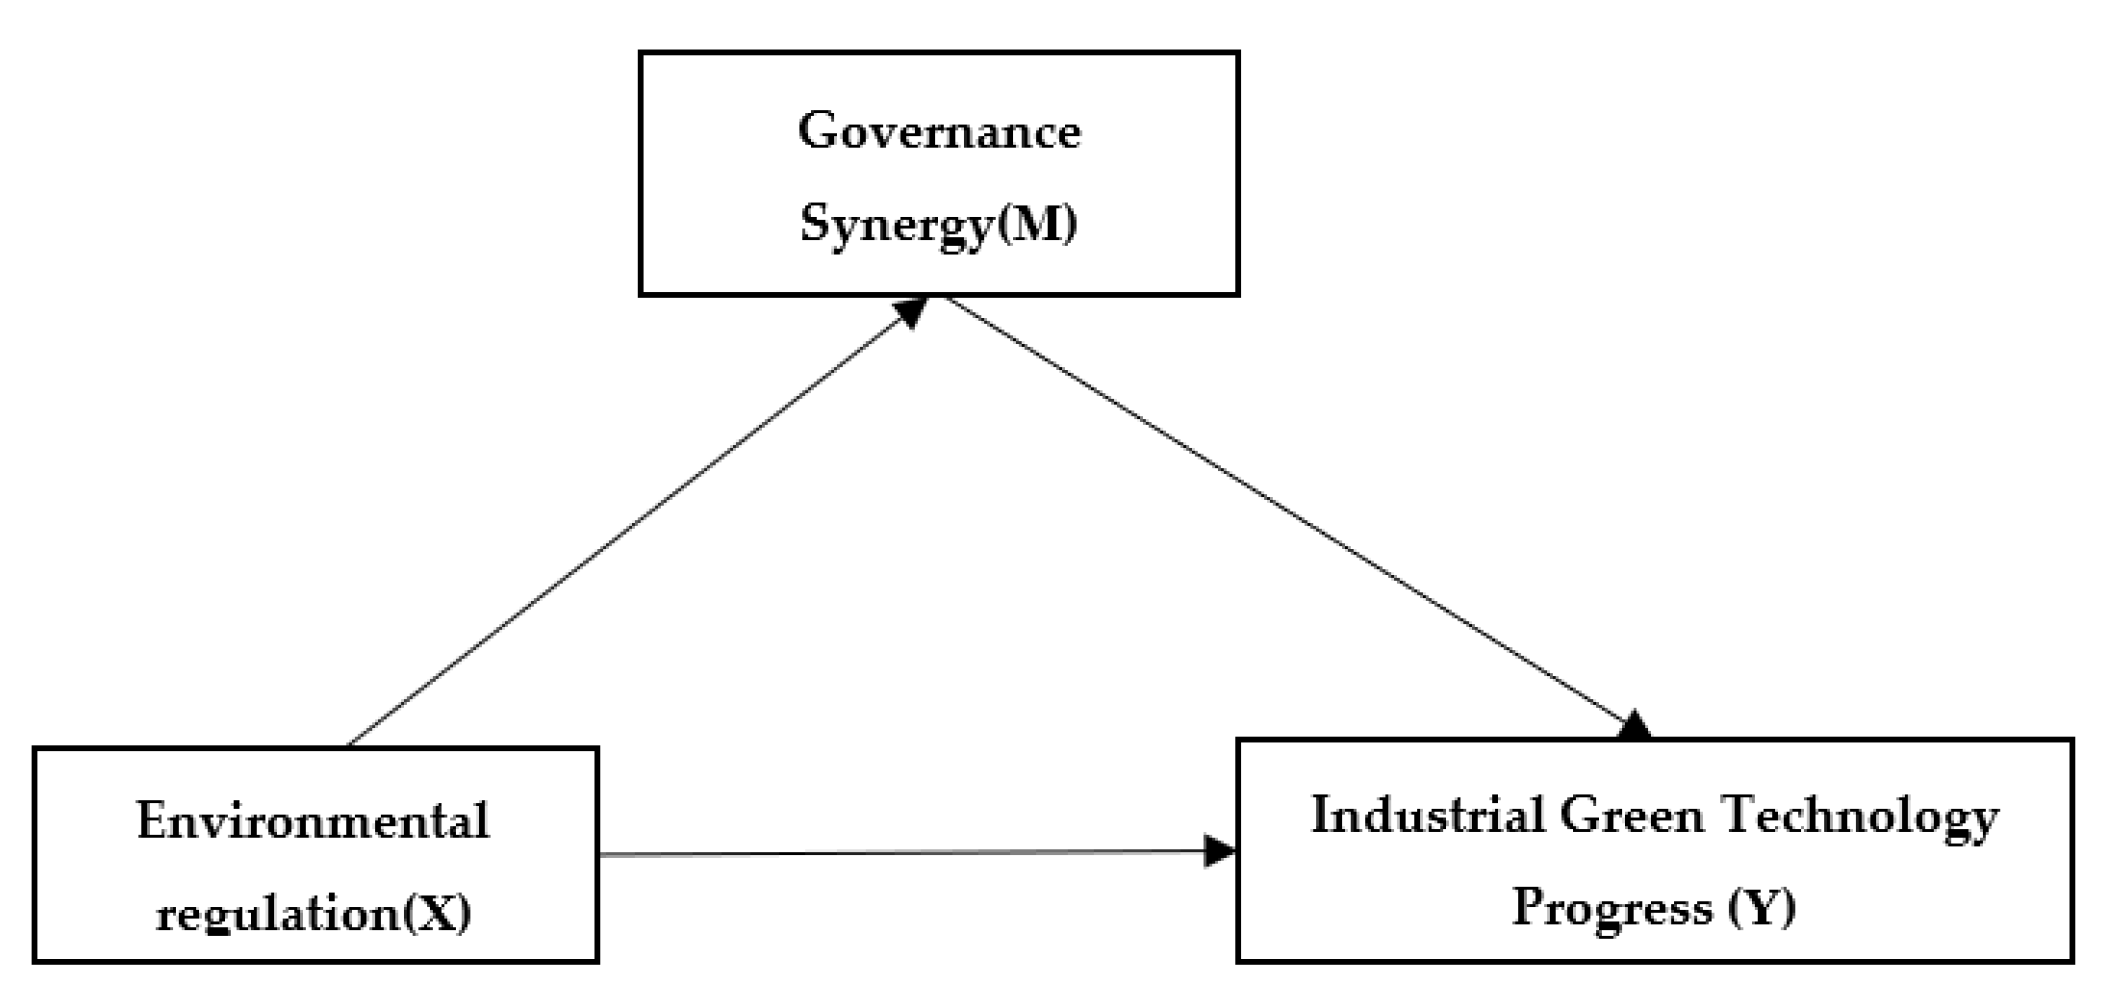
In this study, the mediating effect model was used to examine how environmental regulation affects industrial green technology progress through governance synergy. The mediating effect test is divided into three steps. First, the explanatory variable X has a significant effect on the explained variable Y. If the coefficient of X is significant, the mediating effect is examined. Second, the explanatory variable X has a significant effect on the mediating variable M. Third, M is added to the regression equation of the first step. While the coefficients of M and X are significant, M is considered a partial mediating effect. In this study, the explanatory variable X was environmental regulation, the explained variable Y was industrial green technology progress, and the mediating variable M was governance synergy, as shown in Figure 1. Based on the above analysis, the panel regression model was constructed as follows:
where i indicates the industry number, i = 1, 2, ..., 33. t indicates the year, t = 2001, 2002, ..., 2015. represents industrial green technological progress. represents environmental regulation. represents the control variable, which incorporates the output rate of new products (), the level of capital management (), and the level of urban wages (), the level of industry innovation (). represents the random perturbation term. The θ, γ, β, and η coefficients are values to be determined.
The benchmark of the empirical model equation was the linear model equation of environmental regulation affecting industrial green technology progress. If was significantly positive, then environmental regulation had a significant positive effect on the progress of industrial green technology. If was significantly negative, then environmental regulation had a significant negative effect on governance synergy. The third step can be continued. Based on the benchmark model, the mediating variable was added. If was negative and significant and was significant and had decreased, then the environmental regulation had a partial mediating effect on industrial green technology progress through governance synergy.
4.2. Variable Calculation and Description
(1) Governance Synergy (M)
There are two main methods to measure the degree of governance synergy, including the existence of virtual variables of governance synergy, and the total number of policy joint publications multiplied by the policy intensity. Due to the lack of quantitative research on governance synergy degree, this study needed to create a measure of governance synergy from indicators of environmental regulations intensity. Different from the previous discrete variable measurement of air pollution prevention coordination, the indicator used continuous variables that represent the level of governance synergy of environmental regulation among different local governments in a given industry.
Before measuring the degree of governance synergy, it was necessary to reconstruct the intensity of environmental regulation in different provinces and industries. Industrial structure is an important factor that affects the environmental regulation of local government. Environmental policy is regulated on the basis of industries. Under certain local environmental regulations, due to the different industrial structures in different regions, the intensities of environmental regulations for industries are different in different areas. This results in different effects of environmental regulation. To analyze the intensity of environmental regulation corresponding to the industrial structure in different regions of China, this study reconstructed the environmental regulation intensity of two-digit industries in a province panel data, where ERNI describes the intensity of environmental regulation of industry I in province N, as follows:
where n is the province, n = 1, 2, 3, ..., 30; I is the industry, I = 1, 2, 3, ..., 33.
ERNI = ERN × WNI
WNI represents the proportion of industry I in province N and the adjustment coefficient of the two-digit industries in a province; it was measured using the proportion of industry gross output value ONI of industry I in province N to the total industrial output value of the province ON. It reflected the proportion of an industry in a specific province and was used to calculate the intensity of environmental regulation in that province. The adjustment factor was calculated as follows:
WNI = ONI/ON
From the relation , we can see the rationality of the definition of environmental regulation.
ERN represents the intensity of environmental regulation in each province, which was consistent with the measurement method of environmental regulation intensity in industries. It was measured using the proportion of the operating cost of the administrative facilities in each province to the total industrial output value, indicating the intensity of environmental regulation in province N. Given the lack of data on the operating cost of industrial solid waste treatment facilities in the provinces, the operating cost of treatment facilities included the operating cost of wastewater and waste gas treatment facilities.
If the technology level of a specific industry is constant in a given period, the proportion of each industry is different for a given province; therefore, the intensity of environmental regulation is different for different industries. Taking into account the relevance of data availability and environmental regulation while avoiding the estimation bias caused by the under-representation of indicators, this study adjusted the intensity and weight of environmental regulation in different provinces to reflect the different industries in the province corresponding to the intensity of environmental regulation differences. For example, if the ratio of the industrial output value of industry I in province N is very low, then the corresponding environmental regulation intensity of this industry ERNI is relatively small. ERNI is determined by the environmental regulation intensity of province N and the weight WNI. If the proportion of industrial sectors in two provinces is equal and the intensity of environmental regulation is different, then the environmental regulation of the province with stronger environmental regulation is higher than that of the province with weaker environmental regulation. If the environmental regulation of the two provinces is equal and the proportion of industrial sectors is different, then the provinces with higher weights have higher environmental regulation ERNI in this industry. If the weight is zero, then the province does not have industrial sector I, and the ERNI is 0, that is, province N does not need to implement environmental regulation on industry I. If , then , indicating that different local governments have different intensities of environmental regulation in the industry. Other things being equal, enterprises in province N have the motive to move into province M to avoid the high environmental regulation cost in province N.
Finally, measuring the provinces of governance synergy (GS) within the industry. The calculation was as follows:
represents the standard deviation of the environmental regulation intensity of all provinces in a certain industry, reflecting the degree of regional governance coordination. This measurement shows that the bigger the index is, the higher the governance coordination degree is, as well as the normal distribution of the data. The larger the GSI, the higher the degree of governance synergy, and vice versa. The governance synergy degree of the 15 provinces with a large proportion of each industry (GS2) was tested as a substitution variable.
(2) Dependent Variables: Industrial Green Technology Progress (Y)
The measurement methods of industrial green technology progress are mainly divided into the Solow residual value method and the non-parametric DEA method. The former is measured using Solow residuals and the latter by decomposing technological progress from productivity.
Based on the input and output data of industries from 2000 to 2016, the non-parametric DEA method was used to measure the industrial green technology progress [24,25], and the green total factor productivity was calculated and decomposed into an ML index [26]. The ML index reflects the growth rate of industrial green technological progress. It assumes that the industrial green technological progress in 2001 was 1, then the ML index was multiplied by the industrial green technology progress from 2001 to 2015, reflecting the dynamic change. Given the availability of data, the research object of this study was the industrial enterprises above the scale. Given the lack of the statistical data of industry before 2001 in the Chinese Industrial Economy Statistical Yearbook and Chinese Environmental Statistical Yearbook, this study selected the input–output data of 33 industrial sectors from 2001 to 2015. The input index includes three items, namely labor input, capital input, and energy input. The expected output index is the total industrial output value of industry. Although the selection of the non-expected output index is controversial and has not been unified, considering the various emission of industrial pollutants, two indexes were selected as the non-expected output indexes, namely, the industrial CO2 and SO2 emissions.
The relevant indicators and data processing for inputs, expected outputs, and non-expected outputs are described below:
- (1)
- Labor input: Labor hours provide a better measure than labor force when measuring labor input, but it is hard to obtain. We chose the average number of all employees in industrial enterprises above scale in sector to replace the number of labor hours. The relevant data was from the China Industrial Economic Statistical Yearbook.
- (2)
- Capital investment: The total fixed assets of industrial enterprises above scale in sector were selected as the approximate estimation of the capital stock, and the fixed assets investment price index was converted into the constant price in 2001.
- (3)
- Energy input: This study considered not only the capital input and labor input but also the energy input. Energy consumption is the main source of undesired output. The total energy consumption data of industrial enterprises above scale in sector were converted into 10,000 tons of standard coal according to the conversion coefficient of standard coal, where the conversion coefficient came from the appendix of the China Energy Statistics Yearbook.
- (4)
- Gross industrial output value: By using the ex-factory price index provided by the China Industrial Economic Statistics yearbook, the total industrial output value of each industry was adjusted to the constant price in 2001.
- (5)
- Industrial CO2 emissions: According to the calculation method of carbon emissions in the guidelines of national greenhouse gas inventories, which was compiled by the Intergovernmental Panel on Climate Change (IPCC), CO2 emissions were estimated according to the amount of fuel burned and the emission factors.
- (6)
- Industrial SO2 emissions: Considering that the large amount of industrial SO2 emissions in industrial production is also one of the main sources of air pollution, we chose industrial SO2 emissions as an undesired output index.
(3) Core independent variable: environmental regulation (X)
Scholars mainly measure environmental regulation from four perspectives, namely, the proportion of the total investment of industrial pollution governance in the industrial added value [27], the proportion of operating expenses of pollution facilities in the industrial output value [28], the comprehensive index of pollution emissions [29], and the number of environmental regulation policies or regulatory bodies inspecting polluting enterprises [30].
Considering the availability of industrial panel data, the proportion of the operating cost of each industry’s pollution prevention in the industrial output value (ER) was chosen as the proxy variable of environmental regulation intensity. Due to the fact that the data of the governance operation costs of industrial solid waste in the annual report of China environmental statistics were not collected, the total operating costs of pollution treatment included the operating costs of wastewater and waste gas prevention.
(4) Control variables: The output rate of new product (), expressed as the proportion of new product sales to industry sales; the level of capital management (), expressed as the proportion of main business income to total assets; the level of urban wages (), expressed as the average wages of employees in urban units in logarithms; the level of industry innovation (), expressed as the logarithm of the number of patent applications in industries.
4.3. Descriptive Statistics
The descriptive statistics of the variables are given in Table 1. The correlation coefficients of the variables are given in Table 2. According to the test results, the correlation coefficients between the variables were not large, which indicated that the variables had good independence and no serious multicollinearity problems were present.
4.4. Data Sources
Given the lack of environmental data of 33 industrial sectors in China in other years, this study used panel data of 33 industries in China from 2001 to 2015. The sample size was 495. The sample data came from the China Industrial Economic Statistical Yearbook, the China Environmental Statistical Yearbook, and the China Energy Statistical Yearbook. To eliminate the influence of the price factor, all the price-related data were in the form of a ratio. Due to the differences in the classification of manufacturing sectors in the 2002 and 2011 editions, we made the necessary divisions and combinations of data according to the principle of maximizing the use of data. Thus, 33 manufacturing subsectors were formed.
The industry classification standards for industrial sectors referred to the China Industrial Economic Statistics Yearbook. Five subsectors were excluded because of missing data for some years. That is, the handicraft and other manufacturing industries, the waste resource and waste material recovery and processing industries, other mining industries, the gas production and supply industry, and the water production and supply industry. The missing data of other industry years were made up using the interpolation method. To keep the statistics consistent, the plastics industry and the rubber industry were merged into the plastic and rubber industry, the automobile manufacturing industry and the railway, ship, aerospace, and other transportation equipment manufacturing industries were merged into the transportation equipment manufacturing industry. After the above adjustments, 33 industrial sectors were formed.
5. Empirical Results and Discussion
5.1. Regression Analysis of the Mediating Effect Model
To avoid the problem of endogeneity among the variables, the lag phase of environmental regulation was used as an explanatory variable to estimate the dynamic model. First, we considered the baseline relationship between environmental regulation and industrial green technology progress and used industry-level fixed effects for the regression analysis. The estimated results are shown in Table 3. Model 1 was a regression model of the effect of the control variables on the industrial green technology progress. Model 2 added environmental regulation as an explanatory variable on the basis of model 1. The results showed that the coefficient of environmental regulation intensity was significantly positive, at least at the level of 5%, which indicated that environmental regulation promoted the industrial green technology progress. In model 3, the coefficient of environmental regulation intensity was significantly negative, at least at the level of 5%, which indicated that environmental regulation was becoming tighter and required higher inter-regional governance synergy. Therefore, if the assumption of environmental regulation influencing the green technology progress through governance synergy is established, we will observe that environmental regulation is more obvious under higher governance synergy.
Based on model 2, model 4 added the governance synergy as a mediating variable, improving the explanatory power of the model (ΔR2 = 0.031). The coefficient of environmental regulation was still positive but decreased. The coefficient of governance synergy was significantly negative at the level of 5%. This indicated that there was a partial mediating effect. Environmental regulation had a direct impact on the industrial green technology progress; meanwhile, it promoted industrial green technology progress through the mediating effect of governance synergy. This showed that the decrease in governance synergy weakened the influence of environmental regulation on the industrial green technology progress, which validated hypothesis 1.
To reduce their environmental governance costs, enterprises have two choices: one is to promote green technological progress through local technological innovation, while the other is to migrate to the other regions with lower environmental regulation intensity. For polluting enterprises, local innovation and inter-regional transfer have a substitution effect on reducing the cost of environmental treatment. On the one hand, to maintain and improve the original market advantage, enterprises will try technological innovation, eliminate backward production capacity for pollution prevention, and promote industrial green technology progress. The enterprises hope to eliminate pollution emissions and promote industrial green technology progress. On the other hand, the goal of an enterprise is its profit maximization. They lack environmental awareness because the pressure of environmental regulation will reduce its short-term profits. Even if the local government takes public welfare as its goal, the enterprises may evade the environmental regulation policy in disguise and migrate to the areas where the environmental regulation is weak. As mentioned above, it is not enough to simply rely on local strict and appropriate environmental regulations that encourage enterprises to innovate and promote industrial green technology progress. If environmental regulations in other areas are less stringent, enterprises will migrate to those other areas. The new site provides a refuge for polluters. If there is a small difference in the intensity of environmental regulation between the local governments, the degree of coordination governance is high. When environmental regulation is strengthened in one area, it also means that the intensity of environmental regulation is strengthened in neighboring areas. It is difficult for enterprises to reduce the regulation cost via migration, even if they bear the high cost of technology research and development. Environmental policy can encourage enterprises to carry out green technology innovation locally and promote industrial green technology progress. If the intensity of environmental regulation varies greatly between local governments, then the degree of governance coordination is low. When environmental regulation is strengthened in one area, and environmental regulations in the neighboring areas do not change, the neighboring areas will become the receiving site of pollution industries. The enterprises are likely to shift their strategic investment to a neighboring area because of the high local regulatory costs, which will make the industrial green technology development of the neighboring area lag behind. Then industrial green technology progress will not be improved as a whole.
5.2. Analysis of the Heterogeneity of Governance Synergy
Considering the differences in environmental regulation levels between different regions, this study investigated whether there was heterogeneity in the governance synergy. Defining a scope greater than this governance synergy as a high-level governance synergy, the reverse was defined as low-level governance synergy. Each industry was divided into two sub-samples according to the mean of the governance synergy degree, that is, high-level governance synergy (GSH) and low-level governance synergy (GSL). “High-level governance synergy” meant that the governance synergy of all provinces in the industry was high and there was little difference in the intensity of environmental regulations between regions. “Low-level governance synergy” meant that the governance synergy of all provinces in the industry was low and the intensity of environmental regulation varied greatly between regions. After that, a sample-by-sample verification was performed, where the estimated results are shown in models 5 and 6 in Table 3.
On the basis of model 4, models 5 and 6 divided governance synergy into two cases, namely, low-level governance synergy and high-level governance synergy. The results showed that there was a significant difference in the impact of environmental regulation of green technology progress through different governance synergy levels. The result showed that the coefficient of environmental regulation in model 5 was significantly positive at the level of 1%, which indicated that the intensity of environmental regulation promoted the industrial green technology progress under the high-level governance synergy. This may have been due to the fact that there was little variation in the intensity of environmental regulation in the provinces where environmental policies were implemented. Polluters in the industry could hardly reduce regulatory costs by moving to other areas, which helped to encourage industrial firms to innovate green technologies locally to promote the industrial green technology progress as a whole. For a specific industry, if the governance synergy level of all the provinces was high, environmental regulation is beneficial for promoting industrial green technology progress. In model 6, the coefficient of environmental regulation was not significant, which indicated that with the increase in the intensity of environmental regulation, industrial green technology progress was restrained under the low-level governance synergy. The possible explanation for this was that the level of governance coordination was generally low and the intensity of environmental regulation varied greatly between the provinces in a given industry. This easily led to the opportunistic behavior of polluting enterprises avoiding local innovation by relocating, which was detrimental to the industrial green technology progress. For specific industries, environmental regulation could not promote industrial green technology progress if the coordination level of all provinces was low. Environmental regulation impacted the industrial green technology progress via the restriction of the governance synergy degree, which validated hypothesis 2. The specific impact mechanisms are detailed above and will not be repeated here.
5.3. Robustness Test
To verify the robustness of the above results, a robustness test was performed on the replacement governance synergy metric (GS2), as shown in Table 4. After replacing the governance synergy variable, the estimation results of the two proxy variables were basically the same. This did not change the conclusion that environmental regulation promotes industrial green technology progress through governance synergy. Based on the degree of governance synergy, this study divided industries into those with high-level governance synergy (GSH2) and low-level governance synergy (GSL2). This verified that the impact of environmental regulation on the progress of industrial green technology changed substantially with the change in the inter-regional governance synergy level. This showed that the conclusion of this study has strong robustness and authenticity.
6. Conclusions and Policy Recommendations
Environmental pollution is a worldwide problem. Governance synergy is the key to realizing environmental protection and industry development in China. The relationship between environmental regulation, governance synergy, and industrial green technology progress is important for the design of environmental policy and green economy development. Although the central government has been improving the environmental laws and regulations, the strategic behavior of regional mobility of polluting enterprises makes the effect of environmental governance unsatisfactory. This is due to the lack of mechanism design and regulations at the industry level. This study presented the institutional evolution of environmental governance synergy, constructed a new measure of environmental governance synergy, and used the mediating effect model to investigate the transmission mechanism of environmental regulation on industrial green technology progress through governance synergy. The main conclusions are as follows:
- (1)
- There was a mediating effect in the environmental regulation promoting the industrial green technology progress through inter-regional governance synergy. Inter-regional low-level governance synergy hindered the industrial green technology progress. This was because of the lack of a synergetic governance mechanism, which caused some enterprises to migrate to other regions rather than innovate locally. This weakened the effect of environmental policies on encouraging enterprises to engage in green technology innovation and is not good for the long-term development of industrial green technology.
- (2)
- The impact of environmental regulation on the industrial green technology progress changed substantially with the level of inter-regional governance synergy. At low levels of governance synergy, environmental regulation restrained industrial green technology progress; at high levels of governance synergy, environmental regulation promoted industrial green technology progress.
Based on the above findings, two policy recommendations are made:
- (1)
- The top-level design of governance synergy should be strengthened. Improving the joint prevention system is significant for industrial green technology progress as a whole. The supervision and adaptive incentives to local governments should be strengthened to prevent the enterprises’ migration.
- (2)
- The joint governance capacity of different regions in various industries should be improved. The central government should strengthen punishments for violations of regulations and avoid softening the environmental regulation system.
In conclusion, while strengthening environmental regulation, enterprises should be encouraged to innovate based on industrial governance synergy. Environmental regulation promotes the industrial green technology progress only if governance cooperation in the industry is formed.
Author Contributions
J.S.: conceptualization, formal analysis, methodology. Y.Y.: data collection, writing, review and editing, investigation. All authors have read and agreed to the published version of the manuscript.
Funding
Central University Basic Scientific Research Business Expenses (Scientific Research Cultivation) Project “Environmental Regulation, Technological Progress and Energy-Saving Efficiency” (Grant No. 202011023).
Data Availability Statement
The datasets used and/or analyzed during the current study are available from the corresponding author on reasonable request.
Acknowledgments
Central University Basic Scientific Research Business Expenses (Scientific Research Cultivation) Project Environmental Regulation, Technological Progress and Energy-Saving Efficiency (grant no. 202011023).
Conflicts of Interest
The authors declare that they have no known competing financial interests or personal relationships that could have appeared to influence the work reported in this study.
References
- Gray, W.B.; Shadbegian, R.J. Plant Vintage Technology and Environmental Regulation. J. Environ. Econ. Manag. 2003, 46, 384–402. [Google Scholar] [CrossRef] [Green Version]
- Bartik, T.J. The social value of job loss and its effect on the costs of us environmental regulations. Rev. Environ. Econ. Policy 2015, 9, 179–197. [Google Scholar] [CrossRef]
- Shuai, S.; Fan, Z. Modeling the role of environmental regulations in regional green economy efficiency of China: Empirical evidence from super efficiency DEA-Tobit model. J. Environ. Manag. 2020, 261, 110227. [Google Scholar] [CrossRef] [PubMed]
- Greenstone, M.; List, J.A.; Syverson, C. The Effect of Environmental Regulation on the Competitiveness of U.S. Manufacturing; NBER Working Paper; National Bureau of Economic Research: Cambridge, MA, USA, 2012. [Google Scholar]
- Millimet, D.L.; Jayjit, R. Empirical Tests of the Pollution Haven Hypothesis When Environmental Regulation is Endogenous. J. Appl. Econom. 2016, 31, 652–677. [Google Scholar] [CrossRef]
- Solarin, S.A.; Al-Mulali, U.; Musah, I.; Ozturk, I. Investigating the Pollution Haven Hypothesis in Ghana: An Empirical Investigation. Energy 2017, 124, 706–719. [Google Scholar] [CrossRef]
- Yuan, B.; Xiang, Q. Environmental regulation, industrial innovation and green development of Chinese manufacturing: Based on an extended CDM model. J. Clean. Prod. 2018, 176, 895–908. [Google Scholar] [CrossRef]
- Xie, R.; Yuan, Y.; Huang, J. Different Types of Environmental Regulations and Heterogeneous Influence on Green Productivity: Evidence from China. Ecol. Econ. 2017, 132, 104–112. [Google Scholar] [CrossRef]
- Shen, C.; Li, S.; Wang, X.; Liao, Z. The effect of environmental policy tools on regional green innovation: Evidence from China. J. Clean. Prod. 2020, 254, 120122. [Google Scholar] [CrossRef]
- Porter, M.E.; Van der Linde, C. Toward a new conception of the environment-competitiveness relationship. J. Econ. Perspect. 1995, 9, 97–118. [Google Scholar] [CrossRef]
- Harrison, A.; Hyman, B.; Martin, L.; Nataraj, S. When Do Firms Go Green? Comparing Price Incentives with Command and Control Regulations in India; NBER Working Paper; National Bureau of Economic Research: Cambridge, MA, USA, 2015. [Google Scholar]
- Zhai, X.; An, Y. Analyzing influencing factors of green transformation in China’s manufacturing industry under environmental regulation: A structural equation model. J. Clean. Prod. 2020, 251, 119760. [Google Scholar] [CrossRef]
- Acemoglu, D.; Aghion, P.; Bursztyn, L.; Hemous, D. The Environment and Directed Technical Change. Am. Econ. Rev. 2012, 102, 131–166. [Google Scholar] [CrossRef] [Green Version]
- Ulucak, R. How do environmental technologies affect green growth? Evidence from BRICS economies. Sci. Total Environ. 2020, 712, 136504. [Google Scholar]
- Borsatto, J.M.L.S.; Amui, L.B.L. Green innovation: Unfolding the relation with environmental regulations and competitiveness. Resour. Conserv. Recycl. 2019, 149, 445–454. [Google Scholar] [CrossRef]
- Wang, Y.; Yu, L. Can the current environmental tax rate promote green technology innovation?—Evidence from China’s resource-based industries. J. Clean. Prod. 2021, 278, 123443. [Google Scholar] [CrossRef]
- Song, Y.; Yang, T.; Zhang, M. Research on the impact of environmental regulation on enterprise technology innovation-an empirical analysis based on Chinese provincial panel data. Environ. Sci. Pollut. Res. 2019, 26, 21835–21848. [Google Scholar] [CrossRef] [PubMed]
- Wu, H.T.; Hao, Y.; Ren, S.Y. How do environmental regulation and environmental decentralization affect green total factor energy efficiency: Evidence from China. Energy Econ. 2020, 91, 33–44. [Google Scholar] [CrossRef]
- Bildirici, M.; Gokmenoglu, S.M. The impact of terrorism and FDI on environmental pollution: Evidence from Afghanistan, Iraq, Nigeria, Pakistan, Philippines, Syria, Somalia, Thailand and Yemen. Environ. Impact Assess. Rev. 2020, 81, 12. [Google Scholar] [CrossRef]
- Dong, Z.; Wang, H. The Effect of Environmental Regulation on the Green Technology Progress in ‘Local-Adjacent’. Chinas Ind. Econ. 2019, 1, 100–118. (In Chinese) [Google Scholar]
- Li, M.; Du, W.; Tang, S. Assessing the impact of environmental regulation and environmental co-governance on pollution transfer: Micro-evidence from China. Environ. Impact Assess. Rev. 2021, 86, 106467. [Google Scholar] [CrossRef]
- Hu, Z.; Li, G.; Cao, J. Joint Regional Air Pollution Control from the Perspective of Environmental Regulation: Zoning Scheme Design, Collaborative State Assessment and Impact Factor Analysis. Chinas Ind. Econ. 2019, 5, 24–42. (In Chinese) [Google Scholar]
- Rogge, K.S.; Schleich, J. Do Policy Mix Characteristics Matter for Low-carbon Innovation? A Survey-based Exploration of Renewable Power Generation Technologies in Germany. Res. Policy 2018, 47, 1639–1654. [Google Scholar] [CrossRef]
- Fan, Y.; Bai, B.; Qiao, Q.; Kang, P.; Zhang, Y.; Guo, J. Study on eco-efficiency of industrial parks in China based on data envelopment analysis. J. Environ. Manag. 2017, 192, 107–115. [Google Scholar] [CrossRef] [PubMed]
- Huang, J.; Xia, J.; Yu, Y.; Zhang, N. Composite eco-efficiency indicators for China based on data envelopment analysis. Ecological. Indicators 2018, 85, 674–697. [Google Scholar] [CrossRef]
- Xie, H.; Chen, Q.; Lu, F.; Wang, W.; Yao, G.; Yu, J. Spatial-temporal disparities and influencing factors of total factor green use efficiency of industrial land in China. J. Clean. Prod. 2019, 207, 1047–1058. [Google Scholar] [CrossRef]
- Lanoie, P.; Patry, M.; Lajeunesse, R. Environmental Regulation and Producticvity: Testing the Porter Hypothesis. J. Product. Anal. 2008, 30, 55–66. [Google Scholar] [CrossRef]
- Gray, W.B.; Shadbegian, R.J.; Wang, C. Corrigendum to: Do EPA regulations affect labor demand? Evidence from the pulp and paper industry. J. Environ. Econ. Manag. 2014, 68, 188–202. [Google Scholar] [CrossRef] [Green Version]
- Tang, G.; Li, L.H.; Wu, D. Environmental regulation, industry attributes and corporate environmental investment. J. Account. Res. 2013, 6, 83–89. [Google Scholar]
- Brunnermeier, S.B.; Cohen, M.A. Determinants of Environmental Innovation in US Manufacturing Industries. J. Environ. Econ. Manag. 2003, 45, 278–293. [Google Scholar] [CrossRef]
Figure 1.
The mediating effect mechanism of environmental regulation, governance synergy, and industrial green technology progress.
Figure 1.
The mediating effect mechanism of environmental regulation, governance synergy, and industrial green technology progress.


Table 1.
Descriptive statistics.
| Variable | Mean | Std.Dev. | Min | Max |
|---|---|---|---|---|
| Y | 1.116 | 0.704 | 0 | 5.316 |
| ER | 0.233 | 0.293 | 0.005 | 1.782 |
| CG | 0.614 | 0.768 | 0 | 3.595 |
| innov | 11.681 | 10.418 | 0.004 | 62.941 |
| mngt | 1.22 | 0.466 | 0.352 | 3.11 |
| wage | 9.923 | 0.558 | 6.763 | 11.46 |
| pat | 7.336 | 2.03 | 1.099 | 11.547 |
Table 2.
Matrix of correlations.
| Variables | (1) Y | (2) ER | (3) CG | (4) Innov | (5) Mngt | (6) Wage | (7) Pat |
|---|---|---|---|---|---|---|---|
| (1) Y | 1.000 | ||||||
| (2) ER | −0.295 | 1.000 | |||||
| (3) CG | −0.245 | 0.286 | 1.000 | ||||
| (4) innov | 0.221 | −0.334 | −0.127 | 1.000 | |||
| (5) mngt | 0.181 | −0.414 | −0.308 | 0.137 | 1.000 | ||
| (6) wage | 0.513 | −0.092 | 0.063 | 0.132 | 0.121 | 1.000 | |
| (7) pat | 0.461 | −0.300 | −0.046 | 0.460 | 0.282 | 0.548 | 1.000 |
Table 3.
Model estimation and results.
| (1) | (2) | (3) | (4) | (5) (GSH) | (6) (GSL) | |
|---|---|---|---|---|---|---|
| Variables | Y | Y | GS | Y | Y | Y |
| ER | 0.300 ** | 0.0517 ** | 0.238 * | 0.513 *** | 0.171 | |
| (0.130) | (0.0249) | (0.127) | (0.150) | (0.239) | ||
| GS | 1.195 *** | |||||
| (0.247) | ||||||
| innov | 0.00715 * | 0.00796 ** | −0.000266 | 0.00827 ** | −0.00214 | 0.0270 *** |
| (0.00393) | (0.00384) | (0.000737) | (0.00375) | (0.00392) | (0.00751) | |
| mngt | 0.677 *** | 0.545 *** | −0.129 *** | 0.699 *** | 0.298 ** | 0.814 *** |
| (0.122) | (0.127) | (0.0243) | (0.128) | (0.140) | (0.254) | |
| wage | 0.244 *** | 0.368 *** | 0.0205 | 0.343 *** | 0.570 *** | 0.269 * |
| (0.0695) | (0.104) | (0.0199) | (0.101) | (0.148) | (0.155) | |
| pat | 0.121 *** | 0.0744 ** | −0.00358 | 0.0787 ** | 0.0518 | 0.0931 |
| (0.0290) | (0.0347) | (0.00666) | (0.0338) | (0.0414) | (0.0614) | |
| Constant | −3.100 *** | −3.876 *** | 0.995 *** | −5.065 *** | −5.243 *** | −3.577 *** |
| (0.542) | (0.820) | (0.157) | (0.836) | (1.167) | (1.239) | |
| Observations | 495 | 462 | 462 | 462 | 249 | 213 |
| R-squared | 0.486 | 0.401 | 0.124 | 0.432 | 0.519 | 0.360 |
| Number of ids | 33 | 33 | 33 | 33 | 22 | 23 |
Note: *, **, and *** indicate the significance levels of 10, 5, and 1%, respectively.
Table 4.
Robustness test.
| (1) | (2) | (3) (GSH) | (4) (GSL) | |
|---|---|---|---|---|
| Variables | GS | Y | Y | Y |
| ER | 0.0573 ** | 0.260 ** | 0.645 *** | −0.0653 |
| (0.0289) | (0.129) | (0.143) | (0.248) | |
| GS | 0.697 *** | |||
| (0.216) | ||||
| innov | −0.00198 ** | 0.00934 ** | −0.00222 | 0.0375 *** |
| (0.000856) | (0.00382) | (0.00361) | (0.00852) | |
| mngt | −0.116 *** | 0.625 *** | 0.279 ** | 1.048 *** |
| (0.0282) | (0.128) | (0.131) | (0.276) | |
| wage | 0.132 *** | 0.276 *** | 0.371 *** | 0.215 |
| (0.0232) | (0.107) | (0.140) | (0.162) | |
| pat | 0.0103 | 0.0672 * | 0.121 *** | 0.0634 |
| (0.00773) | (0.0344) | (0.0405) | (0.0640) | |
| Constant | −0.0702 | −3.827 *** | −3.797 *** | −3.082 ** |
| (0.183) | (0.811) | (1.105) | (1.285) | |
| Observations | 462 | 462 | 290 | 172 |
| R-squared | 0.246 | 0.415 | 0.498 | 0.378 |
| Number of ids | 33 | 33 | 27 | 22 |
Note: *, **, and *** indicate the significance levels of 10, 5, and 1%, respectively.
Publisher’s Note: MDPI stays neutral with regard to jurisdictional claims in published maps and institutional affiliations. |
© 2021 by the authors. Licensee MDPI, Basel, Switzerland. This article is an open access article distributed under the terms and conditions of the Creative Commons Attribution (CC BY) license (https://creativecommons.org/licenses/by/4.0/).
Share and Cite
MDPI and ACS Style
Shi, J.; Yu, Y. To Advance Industrial Green Technology via Environmental Governance—Evidence from China’s Industrial Sector. Processes 2021, 9, 1797. https://0-doi-org.brum.beds.ac.uk/10.3390/pr9101797
AMA Style
Shi J, Yu Y. To Advance Industrial Green Technology via Environmental Governance—Evidence from China’s Industrial Sector. Processes. 2021; 9(10):1797. https://0-doi-org.brum.beds.ac.uk/10.3390/pr9101797
Chicago/Turabian StyleShi, Junwei, and Yingjing Yu. 2021. "To Advance Industrial Green Technology via Environmental Governance—Evidence from China’s Industrial Sector" Processes 9, no. 10: 1797. https://0-doi-org.brum.beds.ac.uk/10.3390/pr9101797
Note that from the first issue of 2016, this journal uses article numbers instead of page numbers. See further details here.