Article

Evaluation of Practical Applicability and Synergistic Effects of Bio-Based Food Packaging Materials Combined with Plant-Based Stabilisers

by
Thomas Havelt
1,2,3,*,
Sarah Brettschneider
1 and
Michaela Schmitz
1,2,3,*
1
Department of Natural Sciences, Bonn-Rhein-Sieg University of Applied Sciences, 53359 Rheinbach, Germany
2
Institute of Technology, Resource and Energy-Efficient Engineering (TREE), Bonn-Rhein-Sieg University of Applied Sciences, 53359 Rheinbach, Germany
3
Faculty of Agriculture, University of Bonn, 53115 Bonn, Germany
*
Authors to whom correspondence should be addressed.
Submission received: 23 September 2021 / Revised: 13 October 2021 / Accepted: 14 October 2021 / Published: 15 October 2021

Abstract

:
Different analyses and feasibility studies have been conducted on the plant extracts of thyme (Thymus vulgaris), European horse chestnut (Aesculus hippocastanum), Nordmann fir (Abies nordmanniana), and snowdrop (Galanthus elwesii) to evaluate bio-based alternatives to common petrol-based stabilisers. For this purpose, in this study, plant extracts were incorporated into poly-lactic acid films (PLA) at different concentrations. The films’ UV absorbance and migration into packed food was analysed via photometric assays (ABTS radical cation scavenging capacity assay, β-carotene assay) and GC–MS analysis. Furthermore, the synergistic antioxidant effects of various combinations of extracts and isolated active compounds were determined. This way, antioxidant effects can be increased, allowing for a highly effective use of resources. All extracts were successfully incorporated into PLA films and showed notable photoabsorbing effects, while no migration risk was observed. Depending on extract combinations, high synergistic effects of up to 726% can be utilised to improve the effectiveness of bio-based extracts. This applies particularly to tomato paste and Aesculus hippocastanum extracts, which overall show high synergistic and antioxidant effects in combination with each other and with isolated active compounds. The study shows that it is possible to create safe bio-based antioxidant films which show even improved properties when using highlighted target combinations.

1. Introduction

The need for environmentally friendly solutions to everyday problems is ubiquitous [1]. This particularly applies to products used in large scales, such as plastic packaging materials [2,3,4]. Next to the main plastic material, a variety of different active substances, so-called additives, are processed in food packaging to adjust the properties of the material and create a packaging with the specific attributes needed for their application, including, but not limited to, antioxidant, photostabilising, and antimicrobial activities. As well as most plastics themselves, additives are typically fossil-based and can thus constitute a threat to both human and environmental health [5,6]. Thus, approaches were and are made to provide plant-based, bioactive alternatives to those additives. For those alternatives, bioactive properties such as UV-absorbing and antioxidant effects have been reported in the literature [7,8,9,10,11,12].
In previous works, we identified different local biomasses presenting a particular potential for the preparation of bio-based additives, including common thyme leaves (Thymus vulgaris L.) [7], European horse chestnut seed coats (Aesculus hippocastanum L.) [9], snowdrop leaves (Galanthus elwesii Hook.F.) [11], and aerial parts of Nordmann firs (Abies nordmanniana (Stev.) Spach) [8].
Thymus vulgaris (TV) is an aromatic and medicinal plant, well known for its medical benefits and antimicrobial activities [13,14,15,16,17,18,19,20]. Furthermore, an enormous antioxidant effect of thyme in both hydrophilic and lipophilic surroundings, caused mainly by the active substance, thymol, has been observed in several studies. This can indeed be used, for example, to extend the shelf life of food products by active packaging [7,21,22,23,24,25,26]. Furthermore, a strong UV-absorbing effect of thyme extracts, based particularly on the main component thymol, has been reported [7,11].
The European horse chestnut (Aesculus hippocastanum (AEH)) is a common ornamental tree in Europe. Furthermore, the inner fragments of AEH seeds are used for the extraction of phytochemicals; usually, the remaining seed coats are discarded. As shown in previous works, these seed coats contain macromolecular proanthocyanidins that can be easily extracted [9]. The prepared hydrophilic (water and acetone, 1:1) extracts show strong antioxidant, antimicrobial, and UV-absorbing effects. The possible valorisation of otherwise discarded raw materials and the macromolecular character of the active substances constitute their special potential for use as an ecological food packaging additive.
Snowdrops are widespread ornamental plants and produce different secondary metabolites, including the lipophilic compound α-tocopherol (or vitamin E), which is not only safe but essential for human health in moderation, and shows a high antioxidant potential [27,28,29]. In a previous study, heptane extracts of different snowdrop species were analysed with regard to antioxidant capacity and α-tocopherol content, resulting in Galanthus elwesii (GE) showing a significantly higher antioxidant effect [11]. Our study demonstrates the use of extracts prepared from leaf extracts of the same species as bio-based antioxidants in packaging. This approach is highly promising as experiments using synthetic α tocopherol solutions for active packaging applications have already been successful [30].
Nordmann firs (Abies nordmanniana (AN)) are the most popular Christmas trees in Germany; in 2019, approximately 23–30 million Christmas trees were sold in Germany, and approximately 75% of those were Nordmann firs, followed by blue spruces and other spruces [31,32]. Nordmann fir leaves contain antioxidant compounds such as ascorbate and α-tocopherol; the essential oil prepared from the AN leaves shows considerable antimicrobial effects against different Bacillus cultures, Pseudomonas aeruginosa, Enterobacter aerogenes, and partly against Staphylococcus aureus [13,33,34,35]. Further antioxidant compounds, including flavonoids and phenolic acids, such as catechin isomers and gallic acid, are found in AN bark [36]. Substantial antioxidant and UV-absorbing effects have been confirmed in a recent study on different coniferous wood species and the impact of using different fragments and drying setups before extraction by acetone [8]. The study showed that even used Christmas trees could be utilised to prepare extracts with the previously mentioned properties, making Nordmann firs a valuable resource for sustainable additive production. This could be a further step towards a circular economy.
In the present study, previously analysed biomasses and developed extraction methods were implemented to evaluate the actual possibility, and indicate the potential benefits, of using bio-based additives as packaging stabilisers. For this purpose, the extracts were incorporated into poly-lactic acid films (PLA) in different concentrations, observing the homogeneity and optical properties of the films. For maximum concentrations of extracts with acceptable characteristics, the antioxidant properties of the films were determined. Furthermore, migration studies, as according to EU regulation 10/2011 for food contact materials (FCM) [37], were conducted on those films to ensure the possible application of bio-based additives was in compliance with legislation. To encourage an ideal, efficient use of extracts for specific applications, synergistic effects were analysed. That way, the resulting antioxidant effect could be maximised by combining different extracts or substances that enhance each other’s effects when combined, and thereby exceed the expected effect. For synergistic analysis, GE extract was replaced by an extract prepared from tomato paste to evaluate the interaction of the contained lycopene, a carotenoid with a high antioxidant effect [38,39].

2. Materials and Methods

2.1. Chemicals and Instrumentation

A Perkin Elmer Lambda 25 double-beam spectral photometer was used to conduct ABTS and β-carotene assays for synergistic examinations and an analysis of migrates. For the determination of UV/Vis absorbance and antioxidant capacity of PLA films, an Agilent Cary 60 dual-beam spectral photometer and a fiber optic probe were used. Migrates were analysed using an Agilent 8890 GC system, coupled with an Agilent 5977B MSD mass spectrometer. Gallic acid, quercetin dihydrate, and dipotassium hydrogen phosphate were purchased from Alfa Aesar (Karlsruhe, Germany), whereas 2,2′-azino-bis(3-ethylbenzthiazoline-6-sulphonic acid) (ABTS), acetic acid, and Trolox were purchased from AppliChem GmbH (Darmstadt, Germany), Bernd Kraft (Duisburg, Germany), and Cayman Chemical Company (Ann Arbor, MI, USA), respectively. Virgin native olive oil and tomato paste were obtained from a local distributor. Thymol, L(+)-ascorbic acid, n-heptane, ethanol, methanol, and acetone were obtained from VWR International, Darmstadt, Germany. Hydrogen peroxide, potassium dihydrogen phosphate, sodium acetate, and dichloromethane were purchased from Merck KGaA, Darmstadt, Germany. Linoleic Acid and β-carotene were obtained from Thermo Fisher Scientific (Waltham, MA, USA), while α-tocopherol, polysorbate, and Tenax porous polymer adsorbent were purchased from Sigma Aldrich (St. Louis, MO, USA). Poly-lactic acid pellets (PLA) were provided by Bio-Fed, Cologne, Germany.

2.2. Preparation of Extracts

During the study, different biomasses were extracted. TV and GE biomasses were cultivated and provided by staff of the Faculty of Agriculture, University of Bonn, while AEH seed coats were kindly provided by the company, Finzelberg. AN samples were kindly provided by Hof Große Wöstmann, Rinkerode, Germany, and were approved by staff of the Faculty of Agriculture, University of Bonn.
General extraction methods for AEH [9], GE [11], and AN [8] extracts are described by Havelt et al., but some modifications were made. To ensure better miscibility with other film preparation chemicals, AEH extracts were prepared using methanol instead of a mixture of water and acetone as an extraction solvent. After conducting successful pretests on optimum extraction characteristics, TV extracts were prepared by applying a passive extraction setup inspired by the techniques described by Havelt et al. [8,9]. This setup allowed for a higher throughput of extracts, thus supporting the introduction of bio-based extracts in industrial processes. Dried TV leaves were ground in a cutting mill, infused with 10 mL methanol per g of dried biomass, and the extraction vessel was shaken for four days under the exclusion of light. Tomato paste (TP) extracts were prepared by applying 2.5 mL acetone to 1 g TP. The extraction vessel was then briefly shaken and centrifuged for 10 min before collecting the supernatant and filling it up to a total volume of 10 mL using acetone.

2.3. Preparation of PLA Films

The PLA films were prepared following the solvent cast method ([40], modified). Exactly 0.5 g of PLA pellets were dissolved in 10 mL dichloromethane while stirring. To produce films equipped with plant extracts, such extracts were added to the PLA solution in an appropriate proportion relative to the PLA pellets. Afterwards, the PLA solution was cast on a glass surface, such as petri dishes, and the solvent was fully evaporated at room temperature. This was necessary for the film to gain the desired mechanical properties, and to ensure that no potentially harmful solvent or extractant residues were present.

2.4. Evaluation of Homogeneity via Determination of UV/Vis Absorbance

The UV/Vis absorbance and homogeneity of the prepared PLA films was determined using the Agilent Cary 60 dual-beam spectral photometer, equipped with a Xenon light source, which covers both the visual and the UV range. In contrast to typical photometers, which are equipped with two different light sources for UV and visible range, this allowed for the measurement of samples without ambient light interfering with the measurement. This flexibility made it possible to easily measure bigger and more complex samples such as PLA films. Instead of a cuvette, each PLA film was introduced into the sample beam, while a UV/Vis spectrum in the range of 240–800 nm was recorded. Three films were prepared per extract concentration, with every film being measured at three different positions that were equally spread across the film area. This allowed for the determination of a mean UV/Vis spectrum per extract type and concentration and revealed possible turbidities within the films. For the evaluation of homogeneity, the variance was determined; if the films showed a high inhomogeneity, this would result in a comparatively high variance.

2.5. Preparation of Migration Samples and Migration Analysis via Gas Chromatography Coupled with Mass Spectrometry (GC–MS)

For migration analysis, films with different concentrations of extracts, as well as blank films containing no extract, were cast as described above and transferred into adequate migration vessels. Afterwards, an appropriate amount of different food simulants was filled into the vessels (0.6 mL for liquid simulants, 400 mg for Tenax). Migration analysis was conducted, allowing single-sided migration only. In accordance with [37], a mixture of ethanol and water (1:10, v/v; simulant A), 3% acetic acid (3:100, m/v; simulant B), olive oil (simulant D2), and Tenax (simulant E) were used as food simulants. After applying the food simulants to the films and sealing the vessels, the samples were stored for 10 days at 20 °C, 40 °C, and 60 °C, respectively. These conditions allowed for short-period analysis of long-time storage and of different storage conditions that are considered food-safe when the legal limits are met for corresponding accelerated conditions [37]. For example, successful low-migration storage for 10 days at 60 °C enabled storage for more than 6 months at room temperature or when refrigerated or frozen, while successful migration tests at 20 °C allowed for frozen storage only.
Migration was evaluated using GC–MS and the ABTS assay described below. All Tenax samples (E) were transferred into liquid samples by desorbing the migrated compounds into 2.5 mL of the solvent used for the respective biomass extraction. For GC–MS analysis, 1 µL of sample solution was heated to 250 °C and introduced onto an Agilent HP-5MS UI column (30 m × 320 µm, 0.25 µm film thickness). The temperature of the column oven started at 75 °C and, after 1 min, increased to 325 °C at 7 °C min−1, before holding the final temperature for 15 min (30 min for D2 samples). For aqueous samples A and B, injection was performed in pulsed pressure mode, allowing aqueous samples to be rapidly heated without exceeding the liner volume. This GC–MS setup allowed for a sensitive non-target screening of migration samples. Furthermore, chromatograms were interpreted, paying special attention to significant masses associated with expected main compounds included in extracts, to prevent migrate signals being covered by noise.

2.6. Photometric Assays

The total antioxidant capacity (TAC) in hydrophilic surroundings (hyTAC) was determined via ABTS radical cation (ABTS•+) scavenging capacity assay (ABTS assay, based on [41]) for both raw extracts and PLA films by monitoring the decolourisation reaction of ABTS radical cations. For synergism analysis of extracts, the method was performed according to the literature [8,9] while using the wavelength λ = 734 nm and a classic double beam spectral photometer. Depending on the application, the absorbance was also monitored using a fiber optic probe coupled with a dual-beam spectral photometer, allowing for a more flexible measurement protocol.
The method to determine the TAC in lipophilic surroundings (liTAC) for synergism analysis via β-carotene assay (λ = 470 nm) was performed according to the literature [11]. If applicable, the fibre optic probe could be used again to profit from a more flexible experiment design.

2.7. Determination of Synergistic Effects

Synergistic effects are a substantial part of overall antioxidant effects observed for natural samples [42]; thus, their analysis is necessary to allow effective applications of plant-based stabilisers. As described in the literature [43], synergistic effects are defined as effects that are higher when combining different active agents in comparison to the sum of the effects of those different agents applied separately; a negative synergistic effect is defined as an antagonistic effect. Thus, the extracts and isolated active compounds (IACs) used in this study were measured separately and in varying concentrations (to take dose–response relationships into account) using hyTAC and liTAC assays. Furthermore, the extracts and/or IACs were measured in the same concentrations but combined with each other to determine whether synergistic or antagonistic effects were observable. To analyse both, synergisms between different extracts (cross-extract synergism, Section 3.2.1) and between extracts and IACs (IAC–extract synergism, Section 3.2.2) that are well-known for their antioxidant effect were analysed.
The extracts covered in the present synergism study were AEH, TV, AN, and commercial tomato paste (TP) extracts, which include carotenoids such as the highly antioxidant compounds lycopene and β-carotene [38,39,44]. Ascorbic acid (AA), gallic acid (GA), quercetin (Qu), thymol (Th), and α-tocopherol (To) were used for IAC–extract synergism analysis, expanding the analysed range of natural antioxidants. For evaluation, the anticipated value or “base value” is defined as the calculated sum of the effect of two individual active components or extracts. Those base values are corrected by the positive (synergistic) or negative (antagonistic) effects observed via measurement.

3. Results and Discussion

3.1. Formulation and Analysis of Enriched PLA Films

To evaluate the practical potential of bio-based enrichment of PLA films, exemplar films were produced with different types (TV, AEH, GE, AN) and amounts of extracts before analysing homogeneity, UV/Vis absorbance, and the antioxidant capacity of the films. The five different concentrations applied were 0.2, 0.3, 0.4, 0.6, and 1.0 mL extract per g PLA, corresponding to 1%, 1.5%, 2%, 3%, and 5% (v/v) during film preparation. To clarify further discussions, the films are described as F1 (1%), F2 (1.5%), F3 (2%), F4 (3%), and F5 (5%). As the density of the used organic extractants was approximately 0.7–0.8 g mL−1, the applied extract concentrations ranged from approximately 0.15% to 0.8% (w/w). This reflects the proportion of antioxidants of approximately 0.05–1.0% (w/w) typically incorporated into polymers [45].
UV/Vis absorbance was used to evaluate whether the UV absorbance determined for pure extracts could still be observed after incorporating those extracts into PLA films, thus pointing out whether a transition of desired properties from the extracts to the films was successful. Additionally, UV/Vis spectra of PLA films include information on whether visible light transmission is generally hindered, such as by turbidities, by showing a high absorbance in the whole visible range. Furthermore, UV/Vis absorbance can be used to determine film homogeneity, which is a key characteristic for chemical and mechanical applications. If stabilisers accumulate in a distinct area of the film, a shortage of stabilisers is thus caused in other film areas. In the areas lacking stabilisers, oxidative stress or UV light can easily cause material deterioration, which then affects the whole film [46,47,48]. Such inhomogeneous films can thus lead to cosmetic changes or even the mechanical failure of plastic components. Homogeneous film preparation was thus considered an important parameter. The homogeneity was determined using the variance of maximum UV absorbances within replicate films to measure whether UV absorbance (caused by the added stabilising extracts) is evenly distributed within the film.
For food contact materials, migration studies are substantial as no relevant transition of packaging components, such as stabilisers, into packed foodstuff must be observed. Thus, migration studies according to EU regulations [37,49] were followed to evaluate the suitability of those extracts in PLA systems for food contact applications. For this purpose, the stabilised PLA films were brought into contact with different food simulants as required by law [37,49]. As migration is more likely to happen for small volatile compounds [50,51], it was monitored using GC–MS to detect and identify migrating compounds. While the migration of compounds with a higher molecular weight (which evade detection via GC–MS) was unlikely, hyTAC assays (ABTS radical cation scavenging capacity assays) were further conducted for food simulants to determine the antioxidant potential of food simulants, and thus ensure that no relevant migration of high-molecular active substances, e.g., proanthocyanidins, which are included in AN and AEH extracts [8,9], occurred.

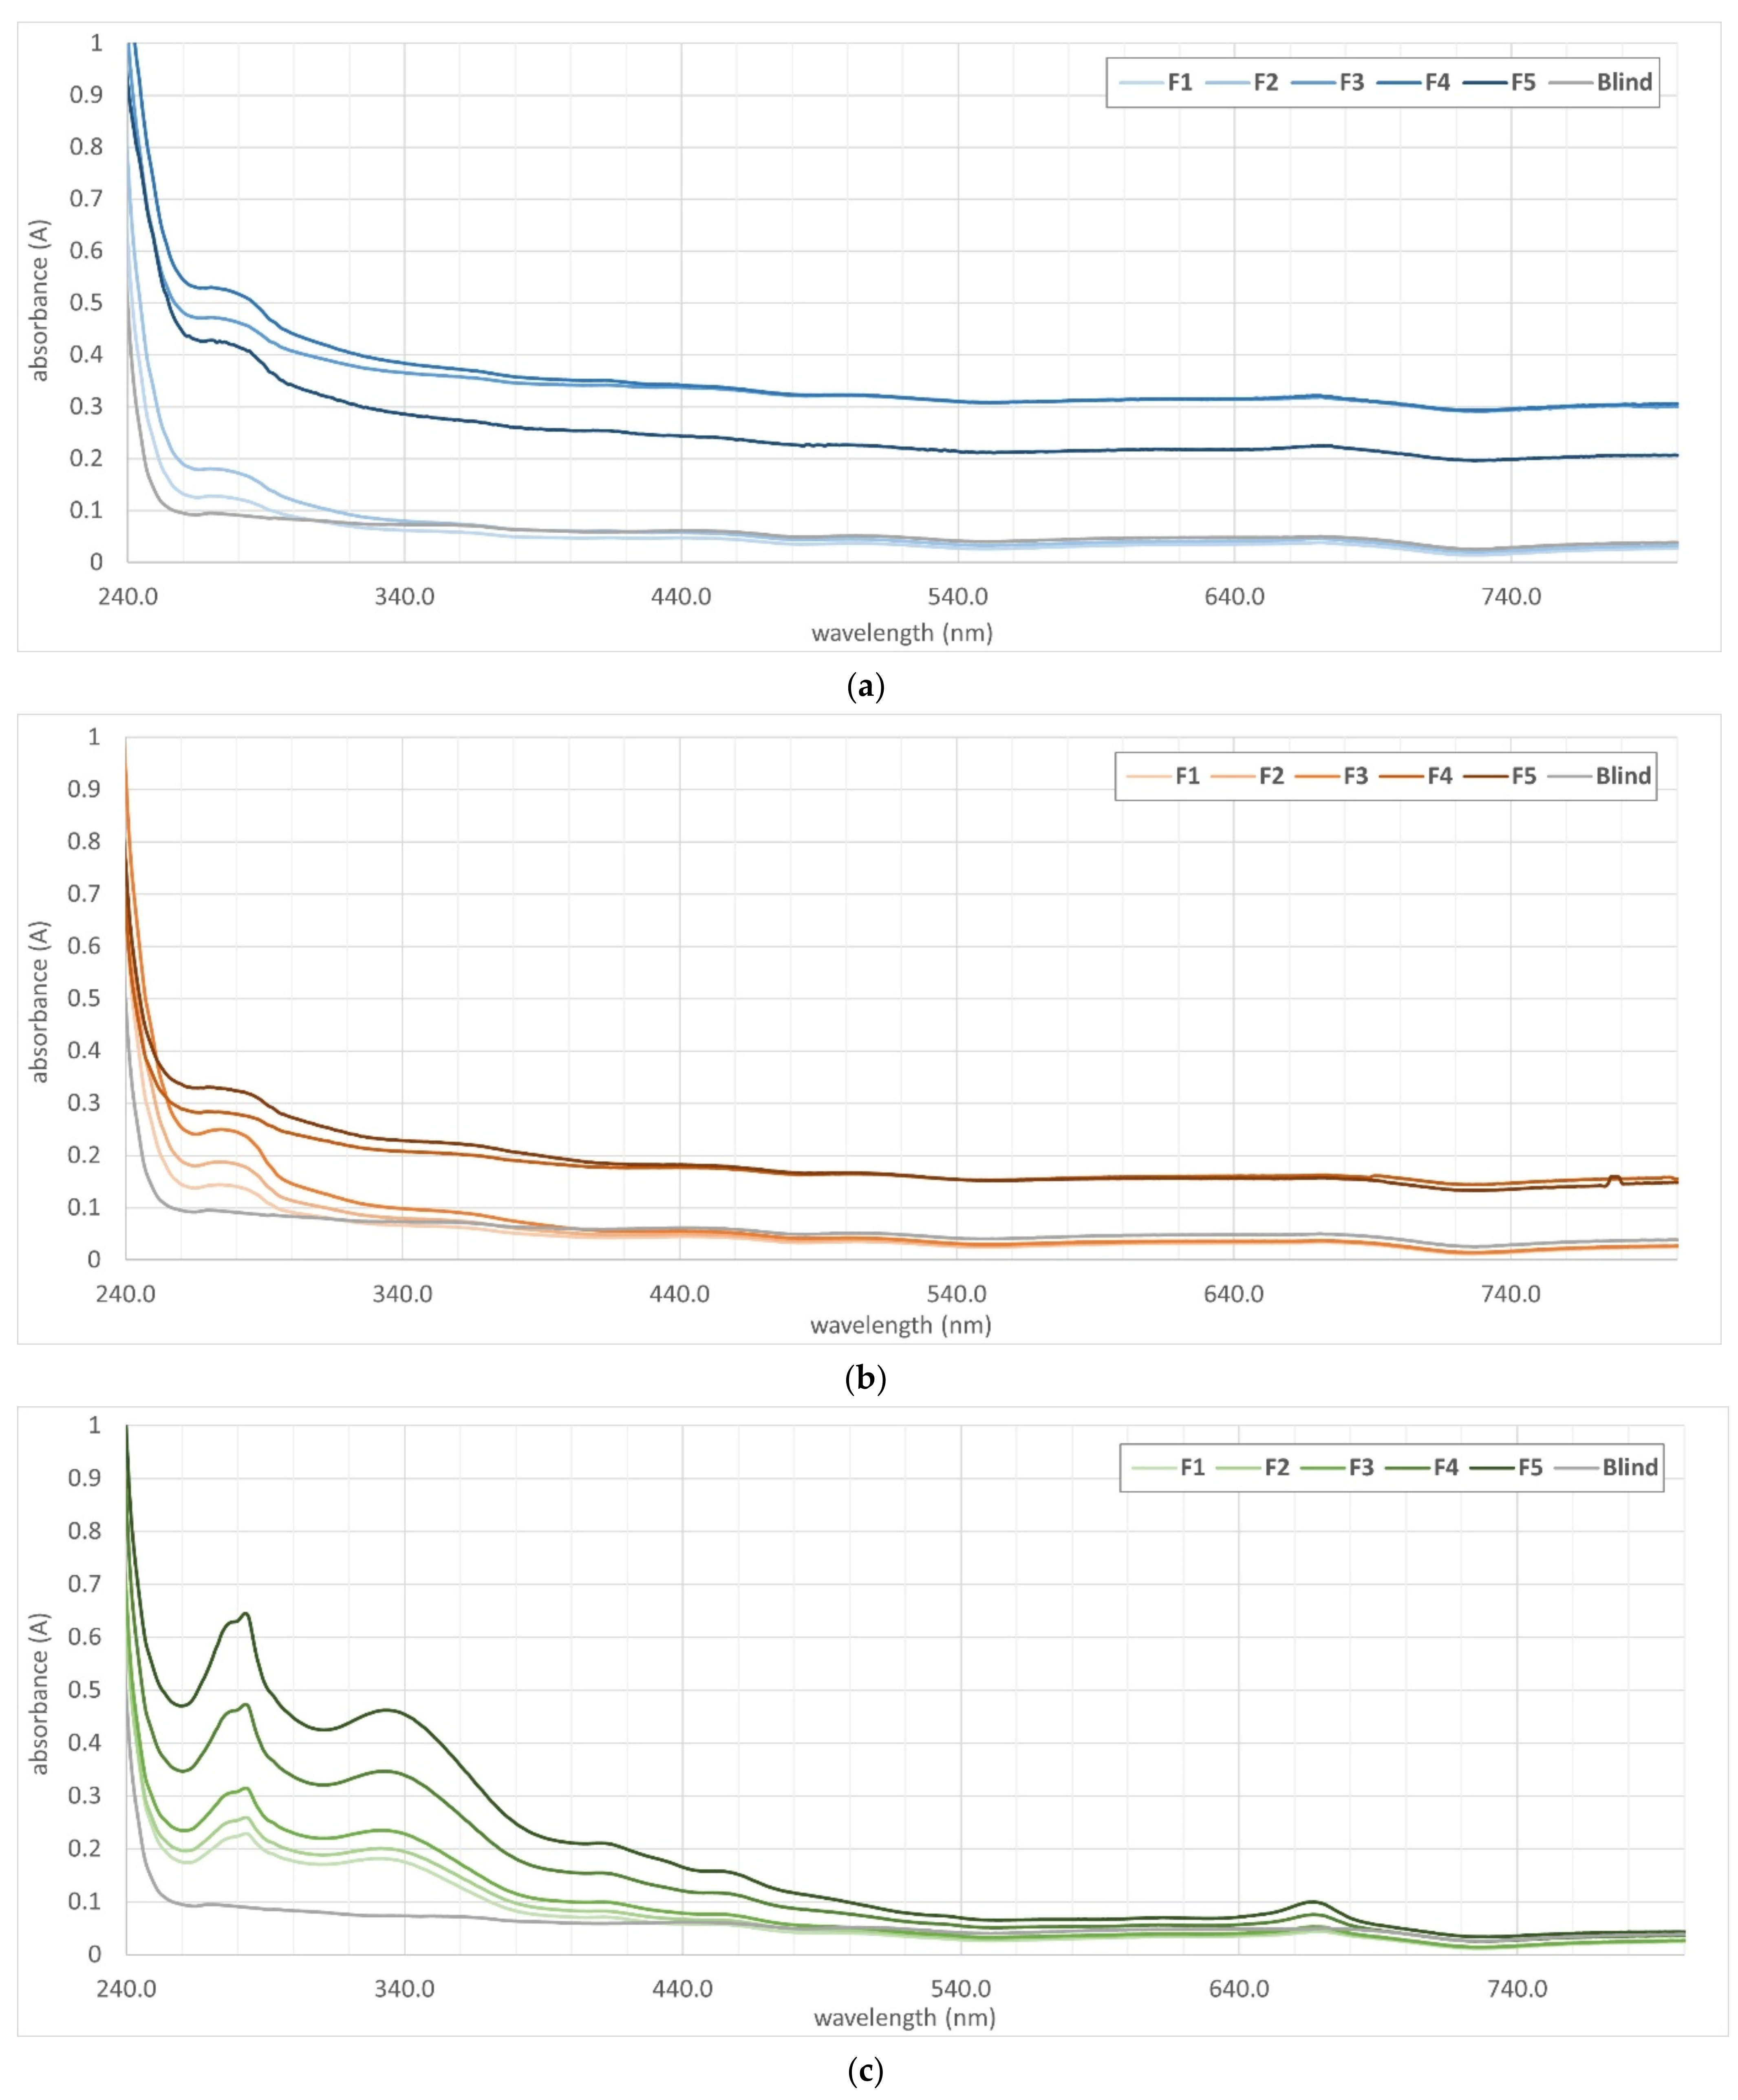
3.1.1. UV/Vis Absorbance

As depicted in Figure 1, TV, AEH, and AN films show a relevant absorbance in the UV range, while GE films do not show interpretable absorbances, which is supported by the results of previous experiments [11]; thus, GE results are not shown. AN films showed peak absorbances of approximately 0.18 A (F2) and 0.12 A (F1) below circa 280 nm; non-enriched films reached approximately 0.1 A. For higher wavelengths, particularly higher than 340 nm, no difference to non-enriched PLA films was observed. Films with higher AN extract concentrations showed a much higher peak absorbance of up to 0.53 A; however, the absorbance in the visible range increased as well, indicating typically unwanted turbidity. This could also indicate a radical change in material properties, supporting the maximum ideal concentration for F2 found in 3.1.1. For AEH films, a higher peak absorbance of approximately 0.14 A (F1) to 0.25 A (F3) was reached up to approximately 295 nm, with the absorbance decreasing up to a wavelength of 400 nm. No relevant absorbance was observed in the visual range for F1–F3 films. For F4 and F5, a further increase in UV absorbance was detected (up to 0.32 A), accompanied by an absorbance of approximately. 0.15–0.2 A in the whole visible range, again indicating turbidity and possible drastic material changes. As described by Havelt et al. [8,9], both AN and AEH extracts include proanthocyanidins, which are macromolecular polyphenols and presumably cause the UV absorbance in both extracts’ films surpassing the blind film absorbance. TV films generally showed a broader and higher UV absorbance with approximately 0.23 A (F1)–0.64 A (F5) at its first maximum (280 nm), and approximately 0.18 A (F1)–0.46 A (F5) at its second maximum (335 nm); the determined maximum ideal formulation for F3 showed an absorbance of approximately 0.32 A and 0.23 A at both maxima. The increased absorbance was primarily caused by thymol and carvacrol [7,52,53] and, presumably, by other included terpenoids. For all concentrations, absorbance in the visible range was detected, particularly at approximately 670 nm and below approximately 520 nm, while no strict turbidity was observed.
In general, the formation of turbidity can be assumed when the absorbance over the whole analysed range, particularly in the visible range where analytes usually show limited absorbance only, is disproportionately increased when compared to known absorbances, such as in UV range. This is the case when the polymeric system is disrupted due to interferences caused by high concentrations of foreign substances, in this case, extracts.
The threshold of visible disturbance is dependent on the type of foreign substances; therefore, the observed differences between the different extracts are plausible.
The results suggest maximum ideal formulations of F2 for GE and AN extracts (0.3 mL extract per g PLA), and F3 for TV and AEH extracts (0.4 mL extract per g PLA), as turbidities can occur when applying higher concentrations of extracts for all except TV extracts. Due to only limited turbidites observed for all TV extract concentrations, an application of higher TV extract concentrations might be possible and worthwhile. All determined UV/Vis spectra closely resembled the ones of the sole respective extracts presented in the literature [7,8,9,11], showing that the incorporation of extracts successfully introduced the property of UV absorbance into PLA films.

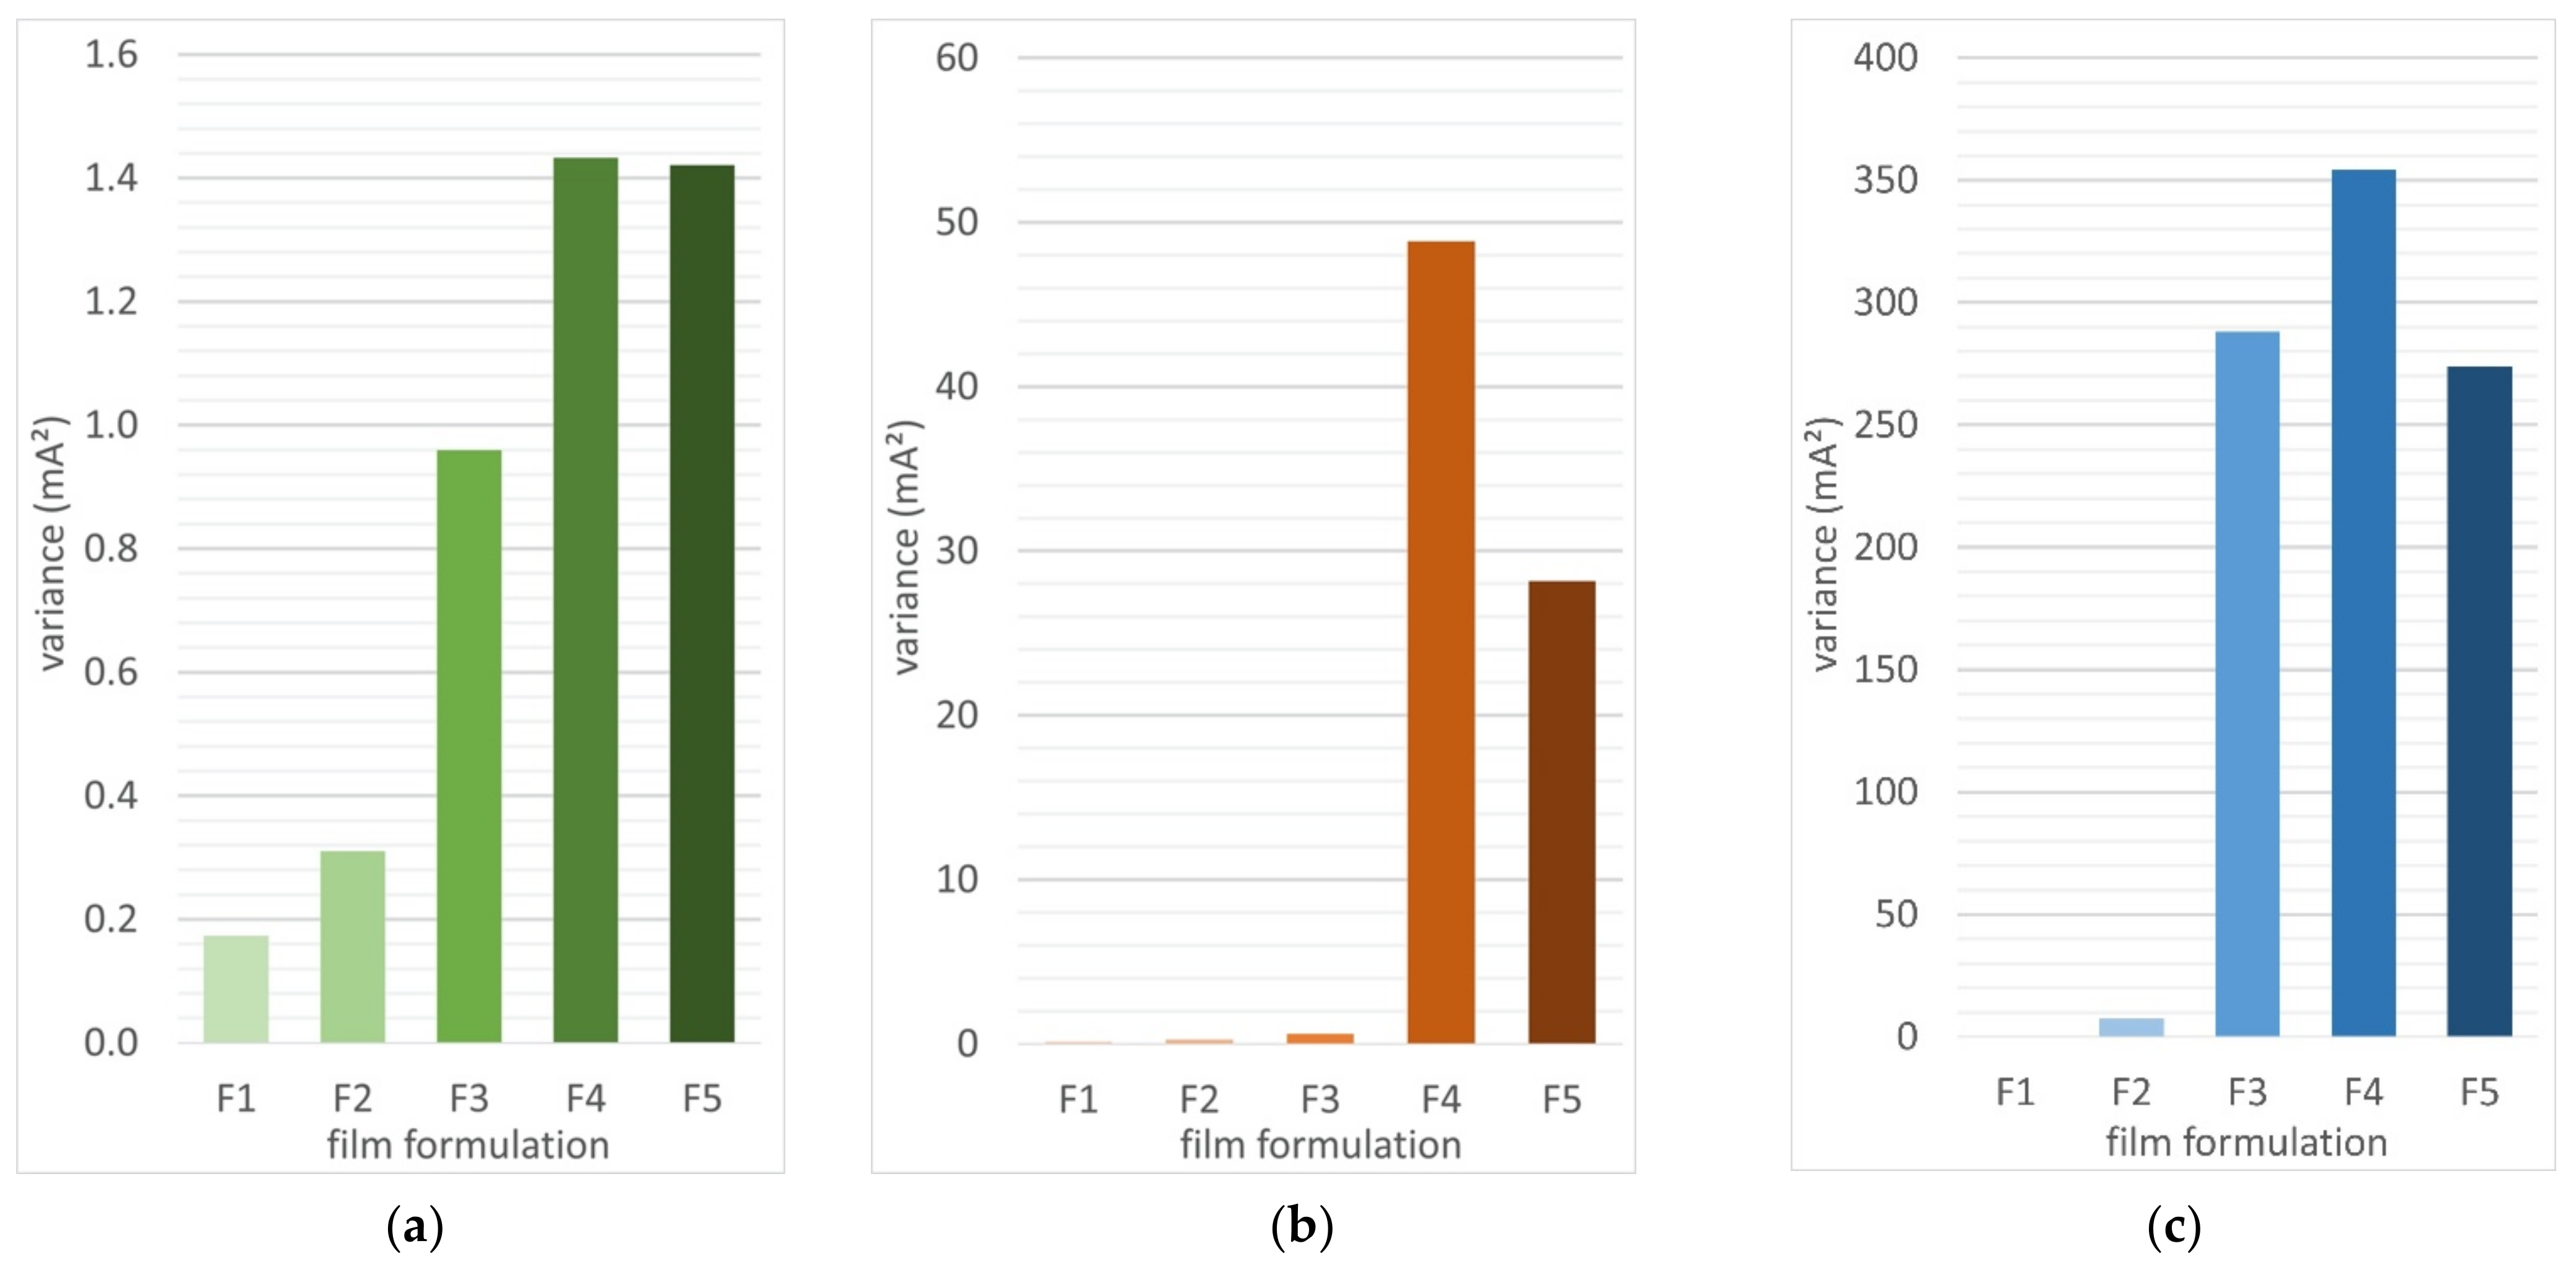
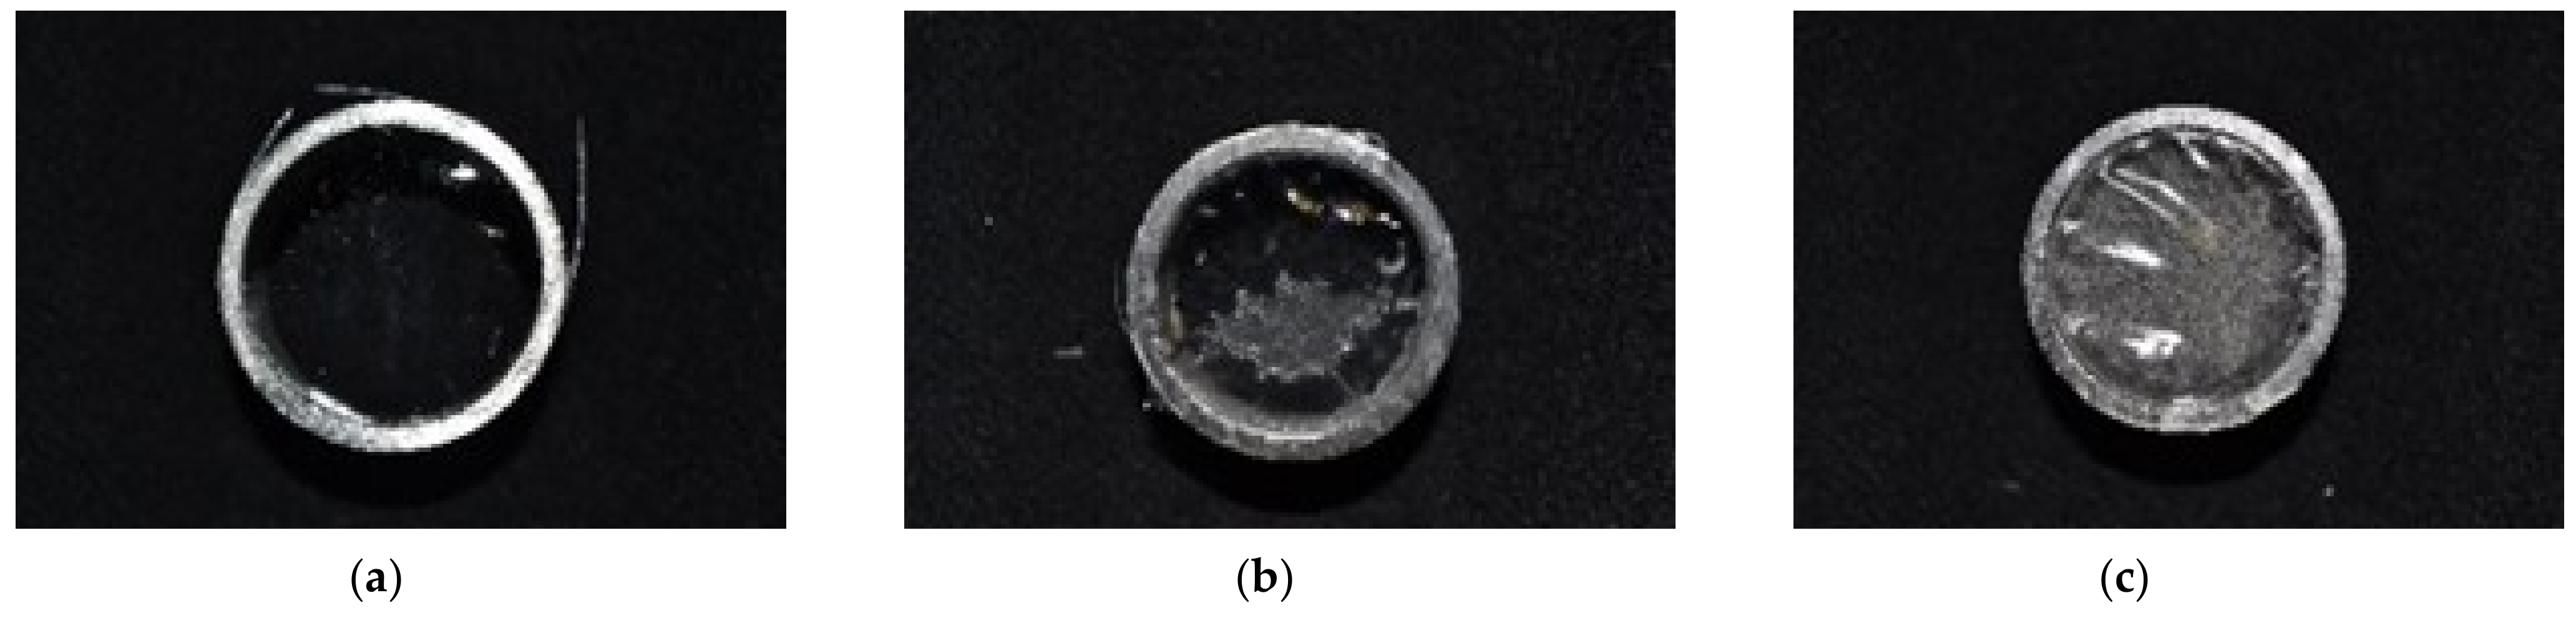
3.1.2. Film Homogeneity Analysis

To evaluate the highest possible concentration of extracts while maintaining homogeneous film properties, the produced films were assessed regarding their homogeneity by determining the UV/Vis spectra of three replicate films at three random positions of the film. The variances (squared standard deviation) of those measurements were determined by measuring the maximum UV absorbances of the different samples, as displayed in Figure 2. In general, the variance increases alongside the concentration of the incorporated extract. However, the variance of TV films increased until F4, while showing no further increase after F4. In contrast, a low variance was observed for AEH films F1–F3, rapidly increasing for F4 and F5. AN films presented a similar course with F1 and F2 showing a comparably low variation which increases for F3–F5. For GE films, no satisfactory data were obtained as GE films generally show very little UV absorbance. However, F2 was deemed the GE film with the highest extract concentration while maintaining homogeneity based on visual evaluation. Examples of films showing different stages of homogeneity are depicted in Figure 3, and photographs for all films are displayed in Table S1.
Following the approach of determining the highest possible extract concentration to conduct further analysis on without considerably affecting homogeneity, F2 films (1.5% v/v during preparation, 0.3 mL extract per g PLA) were considered the maximum ideal formulation for GE and AN films, while the maximum ideal formulation for films enriched with TV and AEH extracts was deemed F3 (2% v/v during preparation, 0.4 mL extract per g PLA), as justified by the contextual variance. These results are supported by the results presented in Section 3.1.1, in which turbidities were observed for extract concentrations exceeding the determined maximum ideal formulations. However, the variance observed for TV films was particularly low in comparison to other extracts, again possibly allowing for an incorporation of higher extract concentrations as well.
The investigated extracts were applied in comparable dimensions with other plant-based extracts discussed in the literature, such as olive leaf extracts applied at approximately 3 g extract per g PLA, or horseradish extract incorporated with approximately 2 g per g PLA [45,54,55].

3.1.3. Migration Analysis

In the following section, film analysis following EU regulations 10/2011 and 1935/2004 on food contact materials is evaluated. After selecting the ideal formulation (F2 for GE and AN extracts, F3 for TV and AEH extracts), bringing the dried films into contact with food simulants, and storing the sealed film samples for 10 days at different temperatures, the food simulants were removed from the film samples and analysed via GC–MS to evaluate the possible migration of extract components during storage. GC–MS methods appropriate for analysis of expected compounds were modified to improve higher sensitivity. Furthermore, as GC–MS was not suitable for detecting all extract components including macromolecular AEH and AN constituents [8,9], the samples were analysed by the photometric hyTAC method to determine whether antioxidants migrated into food simulants regardless of molecular weight. This method was capable of quantifying 17 mg Trolox equivalents per L, resembling the minimal contents of AEH or AN extracts. In the case of solid food simulant E, tenax, a solvent desorption method, was developed during pretests. Both analysis methods did not show any signals indicating migration, suggesting that no relevant migration has occurred. This is particularly reasonable for AEH and AN extracts as small molecules in general tend to diffuse more than molecules with a higher molecular weight; thus, a notably low migration is expected for AEH and AN extracts. Depending on their interactions with the PLA matrix, a higher migration rate could have been possible for TV and GE extracts. The findings are supported by the formulation experiments on TV extracts, which show that the limit of TV incorporation (based on optical properties) might not even be reached yet. Low migration of plant-based materials in PLA matrices, excluding highly concentrated essential oils, are observed in the literature as well [56,57]. Following the obtained results, all extracts are considered safe for food packaging when applied in the given dosage and matrix [37]. This does not only apply to short-term storage or storage at low temperatures, but also covers long-term storage at room temperature, considerably expanding the possible range of applications for bio-based stabilisers. As various studies report the good active packaging properties (the controlled release of active substances into packed foodstuff) of, for example, TV essential oils or GE extracts [30,58,59], the actions of plant-based stabilisers are highly dependent on the type of incorporation within the material. Typically, extracts or essential oils are not directly incorporated into macroscopic plastic materials but are applied, for example, as parts of nanocomposites, nanofibers, or similar structures, thus promoting a release of the substances into the foodstuff instead of binding them within the packaging material [30,58]. Furthermore, higher proportions of extracts or highly concentrated essential oils are used [59], again resulting in a higher migration as intended for active packaging applications.

3.2. Analysis of Extract Synergism

For practical applications, it is crucial to examine the interactions of stabilisers to avoid antagonistic effects in which the combination of two active substances results in an (partly) inhibition and an effect smaller than anticipated. Ideally, synergistic effects can be observed and utilised in which two active substances or extracts interact positively, resulting in observed effects that surpass the ones anticipated [43]. Thus, synergism analysis displays whether the combination of active substances shows the same quantifiable effect as the sum of effects observed for the individual active substances suggests.
Section 3.2 focuses on the combination of extracts of different biomasses (cross-extract synergism, Section 3.2.1), and on the combination of extracts with different isolated active compounds (IAC) (IAC–extract synergism, Section 3.2.2). Each experiment was conducted by applying the different constituents in different relations to include dose–response variations. For evaluation, the anticipated value or “base value” (the calculated sum of the effect of two IACs or extracts) is shown and corrected by the positive (synergistic) or negative (antagonistic) effects observed in measurements.

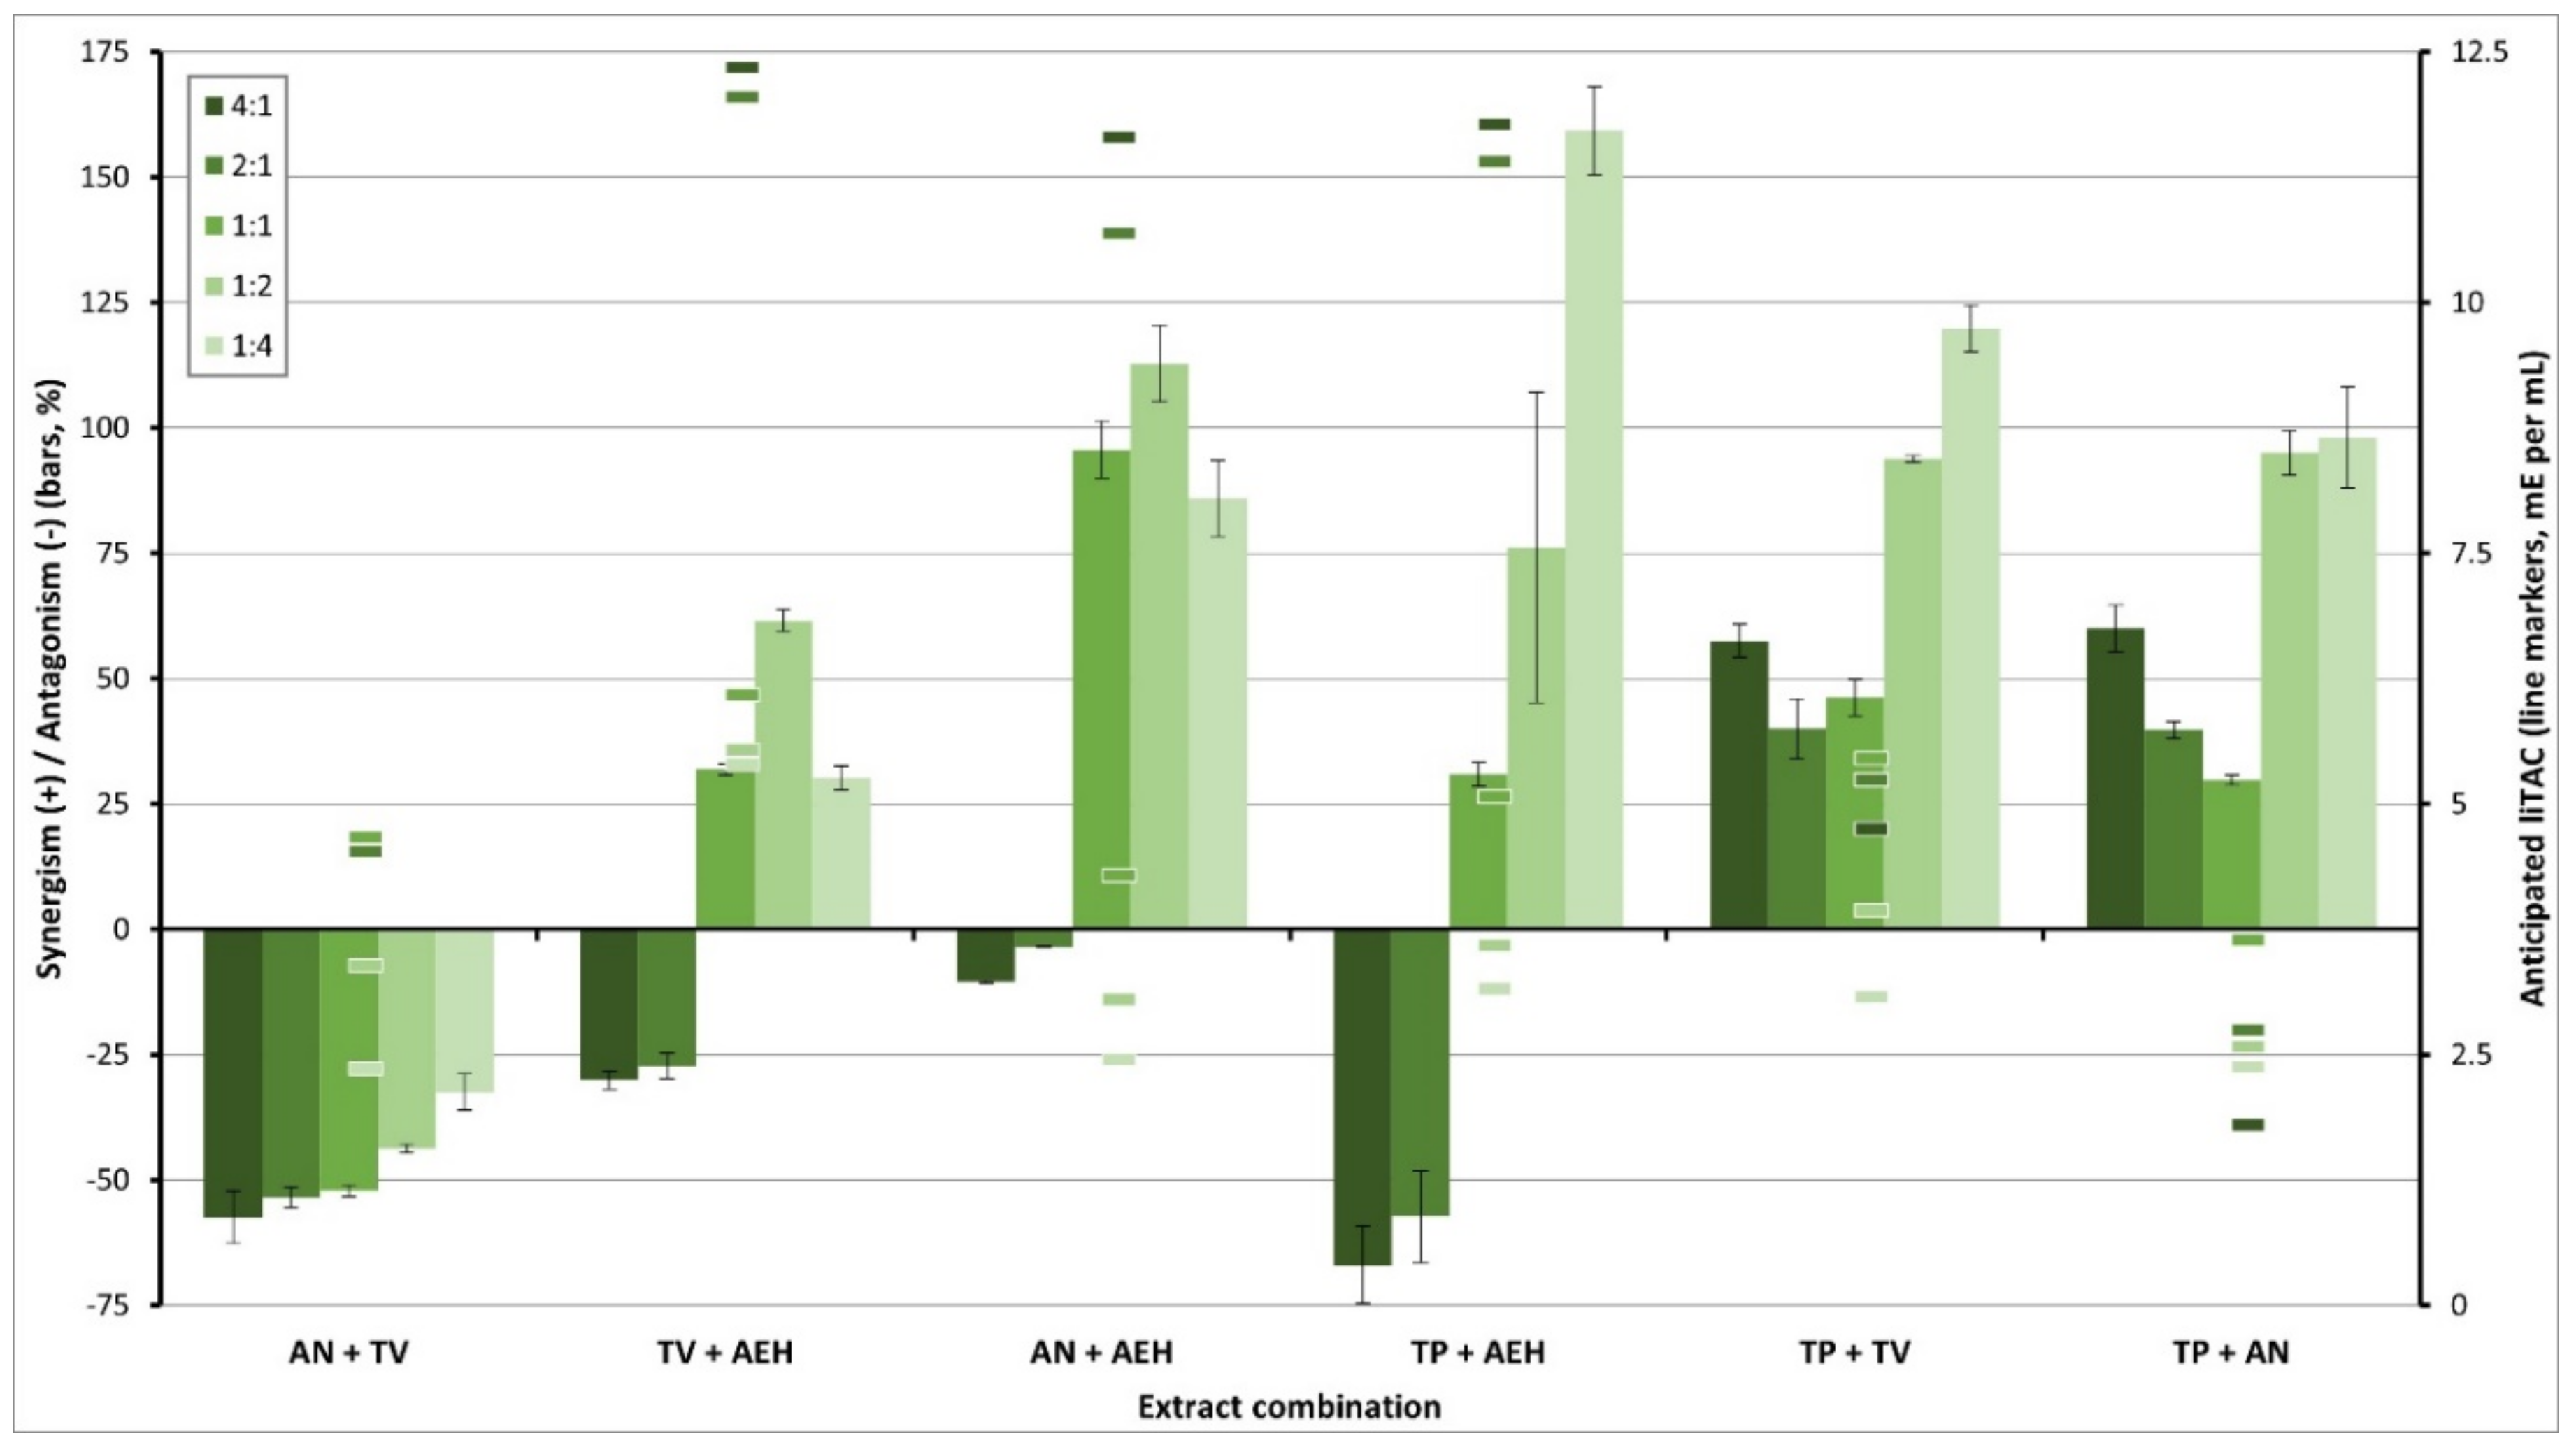
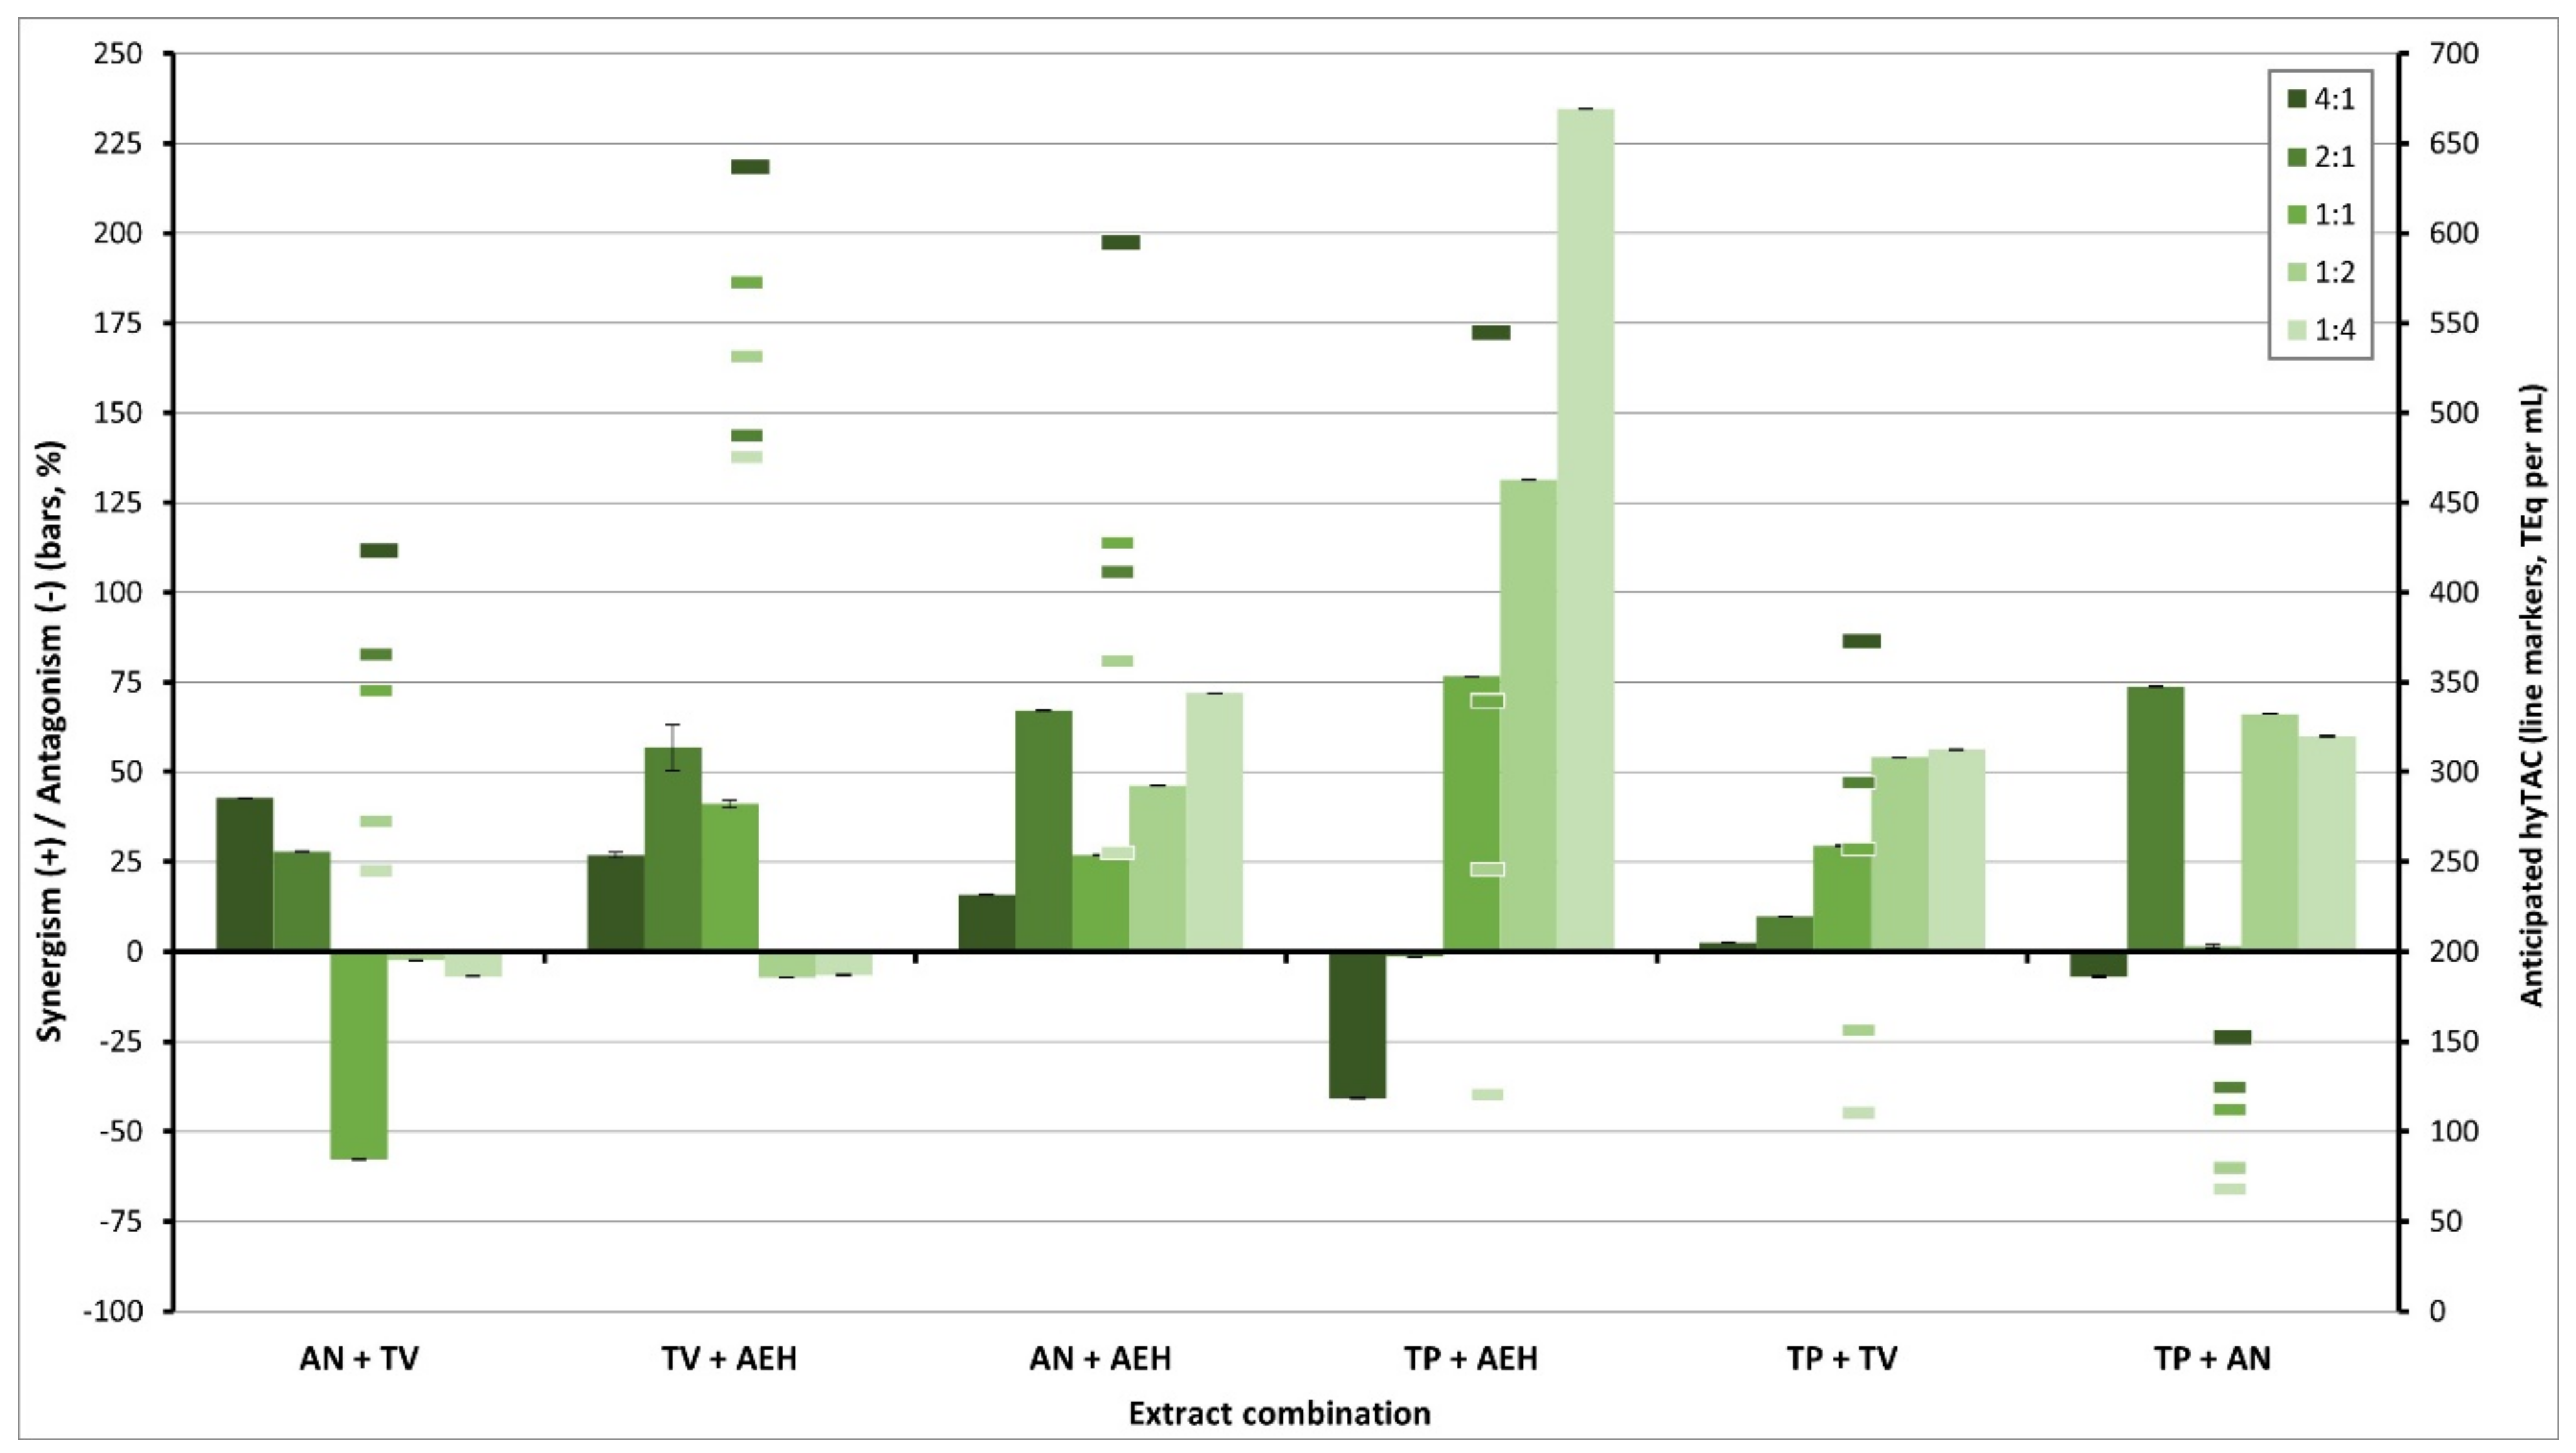
3.2.1. Synergism of Extracts of Different Biomasses (Cross-Extract Synergism)

The combination of different extracts typically results in an altered TAC in both lipophilic and hydrophilic surroundings. Figure 4 presents the measured liTAC values for different extracts combined in different concentrations while contrasting the results with the theoretical values obtained by mathematically adding up the relevant extracts’ results.
For all ratios of the AN/TV combination, antagonistic effects were observed; however, an increasing share of TV extracts lowers the extent of antagonistic effects (−32.5% instead of −57.5%). This effect roughly sets all combinations to a similar TAC of approximately 2–2.5 mE mL−1.
For TV/AEH combinations, both synergistic and antagonistic effects occurred, depending on the ratio of extracts. When AEH extracts overrode TV extracts, a synergistic effect of up to 61.5% was observed. Due to the high liTAC of sole TV extracts, combinations with high shares of TV extracts were still more antioxidant than the ones with low shares, even when being lowered by antagonistic effects of approximately −30.5%.
A comparable situation is observed when interpreting the results for AN/AEH combinations as quite high synergistic effects were measured for high ratios of AEH extracts, but these high synergistic effects were still exceeded by combinations with high shares of AN extracts despite its base values being lowered by approximately 10%.
The trend of antagonistic effects rising to synergistic effects is continued for TP/AEH extracts. However, for this combination, such high antagonistic and synergistic effects (−67% to 159%) were met that the extracts with the highest base TAC (high TP combinations) were exceeded by high AEH combinations due to the high synergistic effect.
For TP/TV combinations, synergistic effects were observed for all combinations, with the effects increasing for higher shares of TV extracts. However, those combinations also show slightly lower base values, thus showing an aligning effect and resulting in approximately 6.5–7.5 mE mL−1 for all ratios.
For TP/AN combinations, synergistic effects were again found for all ratios, ranging from 30% to 98%. This resulted in an aligning effect for all high AN combinations at approximately 4.5–5.0 mE mL−1.
In most cases, so-called aligning effects were observed during which high base values were lowered by antagonistic effects while low base values were raised by synergistic effects, resulting in roughly comparable absolute values after all. Occasionally, however, such as for TP/AEH, synergistic effects changed the base liTAC to an extent that influenced the order of the highest liTAC results, making combinations more desirable which have not been expected as such. The highest absolute liTAC, including antagonistic and synergistic effects, was reached by high AN combinations of AN/AEH extracts, resulting in approximately 10.3 mE mL−1.
As the main constituents of AN and TV extracts are medium-weight proanthocyanidins and thymol, respectively [7,8,60,61], it is plausible to assume that those substances are the main contributors to the observed antagonistic effects. The combination of TV and AEH extracts (which again include proanthocyanidins, but with a much higher molecular mass [9]), however, can result in synergistic effects when AEH extracts are included in even or higher shares. This applies to all AEH combinations. As AEH extracts are the only ones including high-molecular compounds, it is plausible to assume that high-molecular and low-molecular substances tend to produce synergistic effects when combined, as long as high-molecular compounds are added in excess. In other contexts, such synergistic effects of substances with different molecular weights have been discussed in the literature [62].
Furthermore, it was observed that it is possible, or even granted, for most combinations to create desired synergistic effects, particularly for combinations including TP extracts with its main constituents, lycopene and β-carotene [44,63,64]. Generally, lycopene and β-carotene seem to be the most potent low-molecular active compounds observed in this experiment. Thus, it is plausible to see the highest synergistic effect observed at all for TP/AEH extracts where both observed positive relations (presence of lycopene; contrast of high-molecular and low-molecular compounds with high-molecular compounds in excess) are applied.
The synergisms determined in hydrophilic surroundings, as depicted in Figure 5, substantially deviate from the ones observed in lipophilic surroundings. However, as the behaviour of antioxidants is dependent on the surroundings, changes in synergism are expected.
For AN/TV, only limited synergistic effects were observed for high-AN combinations, while a 1:1 mixture of both extracts resulted in a comparably high antagonistic effect. High-TV combinations roughly resemble the base antioxidant capacity already anticipated. The highest synergistic effect was thus reached by the combination with the already highest base antioxidant effect, resulting in a maximum observed TAC of approximately 600 µg TEq mL−1. TV/AEH combinations showed a synergistic effect of up to +57% for 1:1 and high-TV combinations, while showing negligible antagonistic effects (approximately −7%) for high-AEH combinations. Including synergistic effects, 1:1 and high-TV mixtures thus showed maximum TAC values of 760 to 807 µg TEq mL−1. AN/AEH combinations showed synergistic effects only, reaching up to +72%. The combination of high synergistic effects and/or absolute TAC values of single components resulted in maximum TAC values of approximately 680 µg TEq mL−1 for high-AN mixtures. Roughly comparable to liTAC results, TP/AEH combinations show a rising synergistic effect with increasing shares of AEH extracts, ranging from −41% to +235%, which is the highest cross-extract synergistic effect in hydrophilic surroundings. Due to comparably low absolute TAC values of those high-AEH combinations, a 1:1 mixture was preferred, resulting in nearly 600 mg TEq mL−1. For TP/TV combinations, only synergistic effects were observed, ranging from +3% to +56% and increasing with a rising share of TV extract. However, as the base TAC values decreased with an increasing amount of included TV extract, an aligning effect was created. The high base TAC value of the combination with the highest share of TP extract was preferred over the synergistic effects of other combinations in this case, resulting in a maximum TAC of approximately 380 µg TEq mL−1. For TP/AN combinations, both neglectable effects (for 1:1 and (TP) 4:1 (AN)) and synergistic effects (for other combinations) of approximately +60% to +73% were observed. Due to comparably low absolute TAC values, only a maximum TAC of 215 µg TEq mL−1 was reached by (TP) 2:1 (AN) mixture.
Generally, high antioxidant capacity values of up to 600–800 µg TEq mL−1 were observed, particularly reached by combinations with AEH extracts and the AN/TV combination. In this experiment, even higher synergistic effects have been observed than in lipophilic surroundings; however, these effects could not always overcome smaller absolute TAC values. Fortunately, antagonistic effects occur at a very low rate.
In both lipophilic and hydrophilic surroundings, maximum synergistic effects were observed for AEH/TP combinations, especially when AEH extracts were included in equal or higher shares than TP extracts. AEH extracts contain hydrophilic active substances (proanthocyanidins) [9], and thus show a much higher antioxidant potential in hydrophilic surroundings, while TP extracts are particularly effective in lipophilic surroundings due to the included lipophilic active compound lycopene, as determined in pretests and as discussed in the literature as well [38,39]. Thus, it can be concluded that synergistic effects are increased or are more likely to occur when active substances with opposite mechanisms of action are combined. Such an assumption is supported by Graßmann, where the synergistic effects, especially of combinations of hydrophilic and lipophilic compounds, are observed [65]. Furthermore, the suggestion of molecular weight having an impact on synergistic effects is plausible as it would again show that different types of antioxidant mechanisms tend to enhance each other. However, there are much more influential factors determining whether a synergistic effect is observed which are partly presented, including, but not limited to, the ratio of extracts and the type of reaction surroundings.

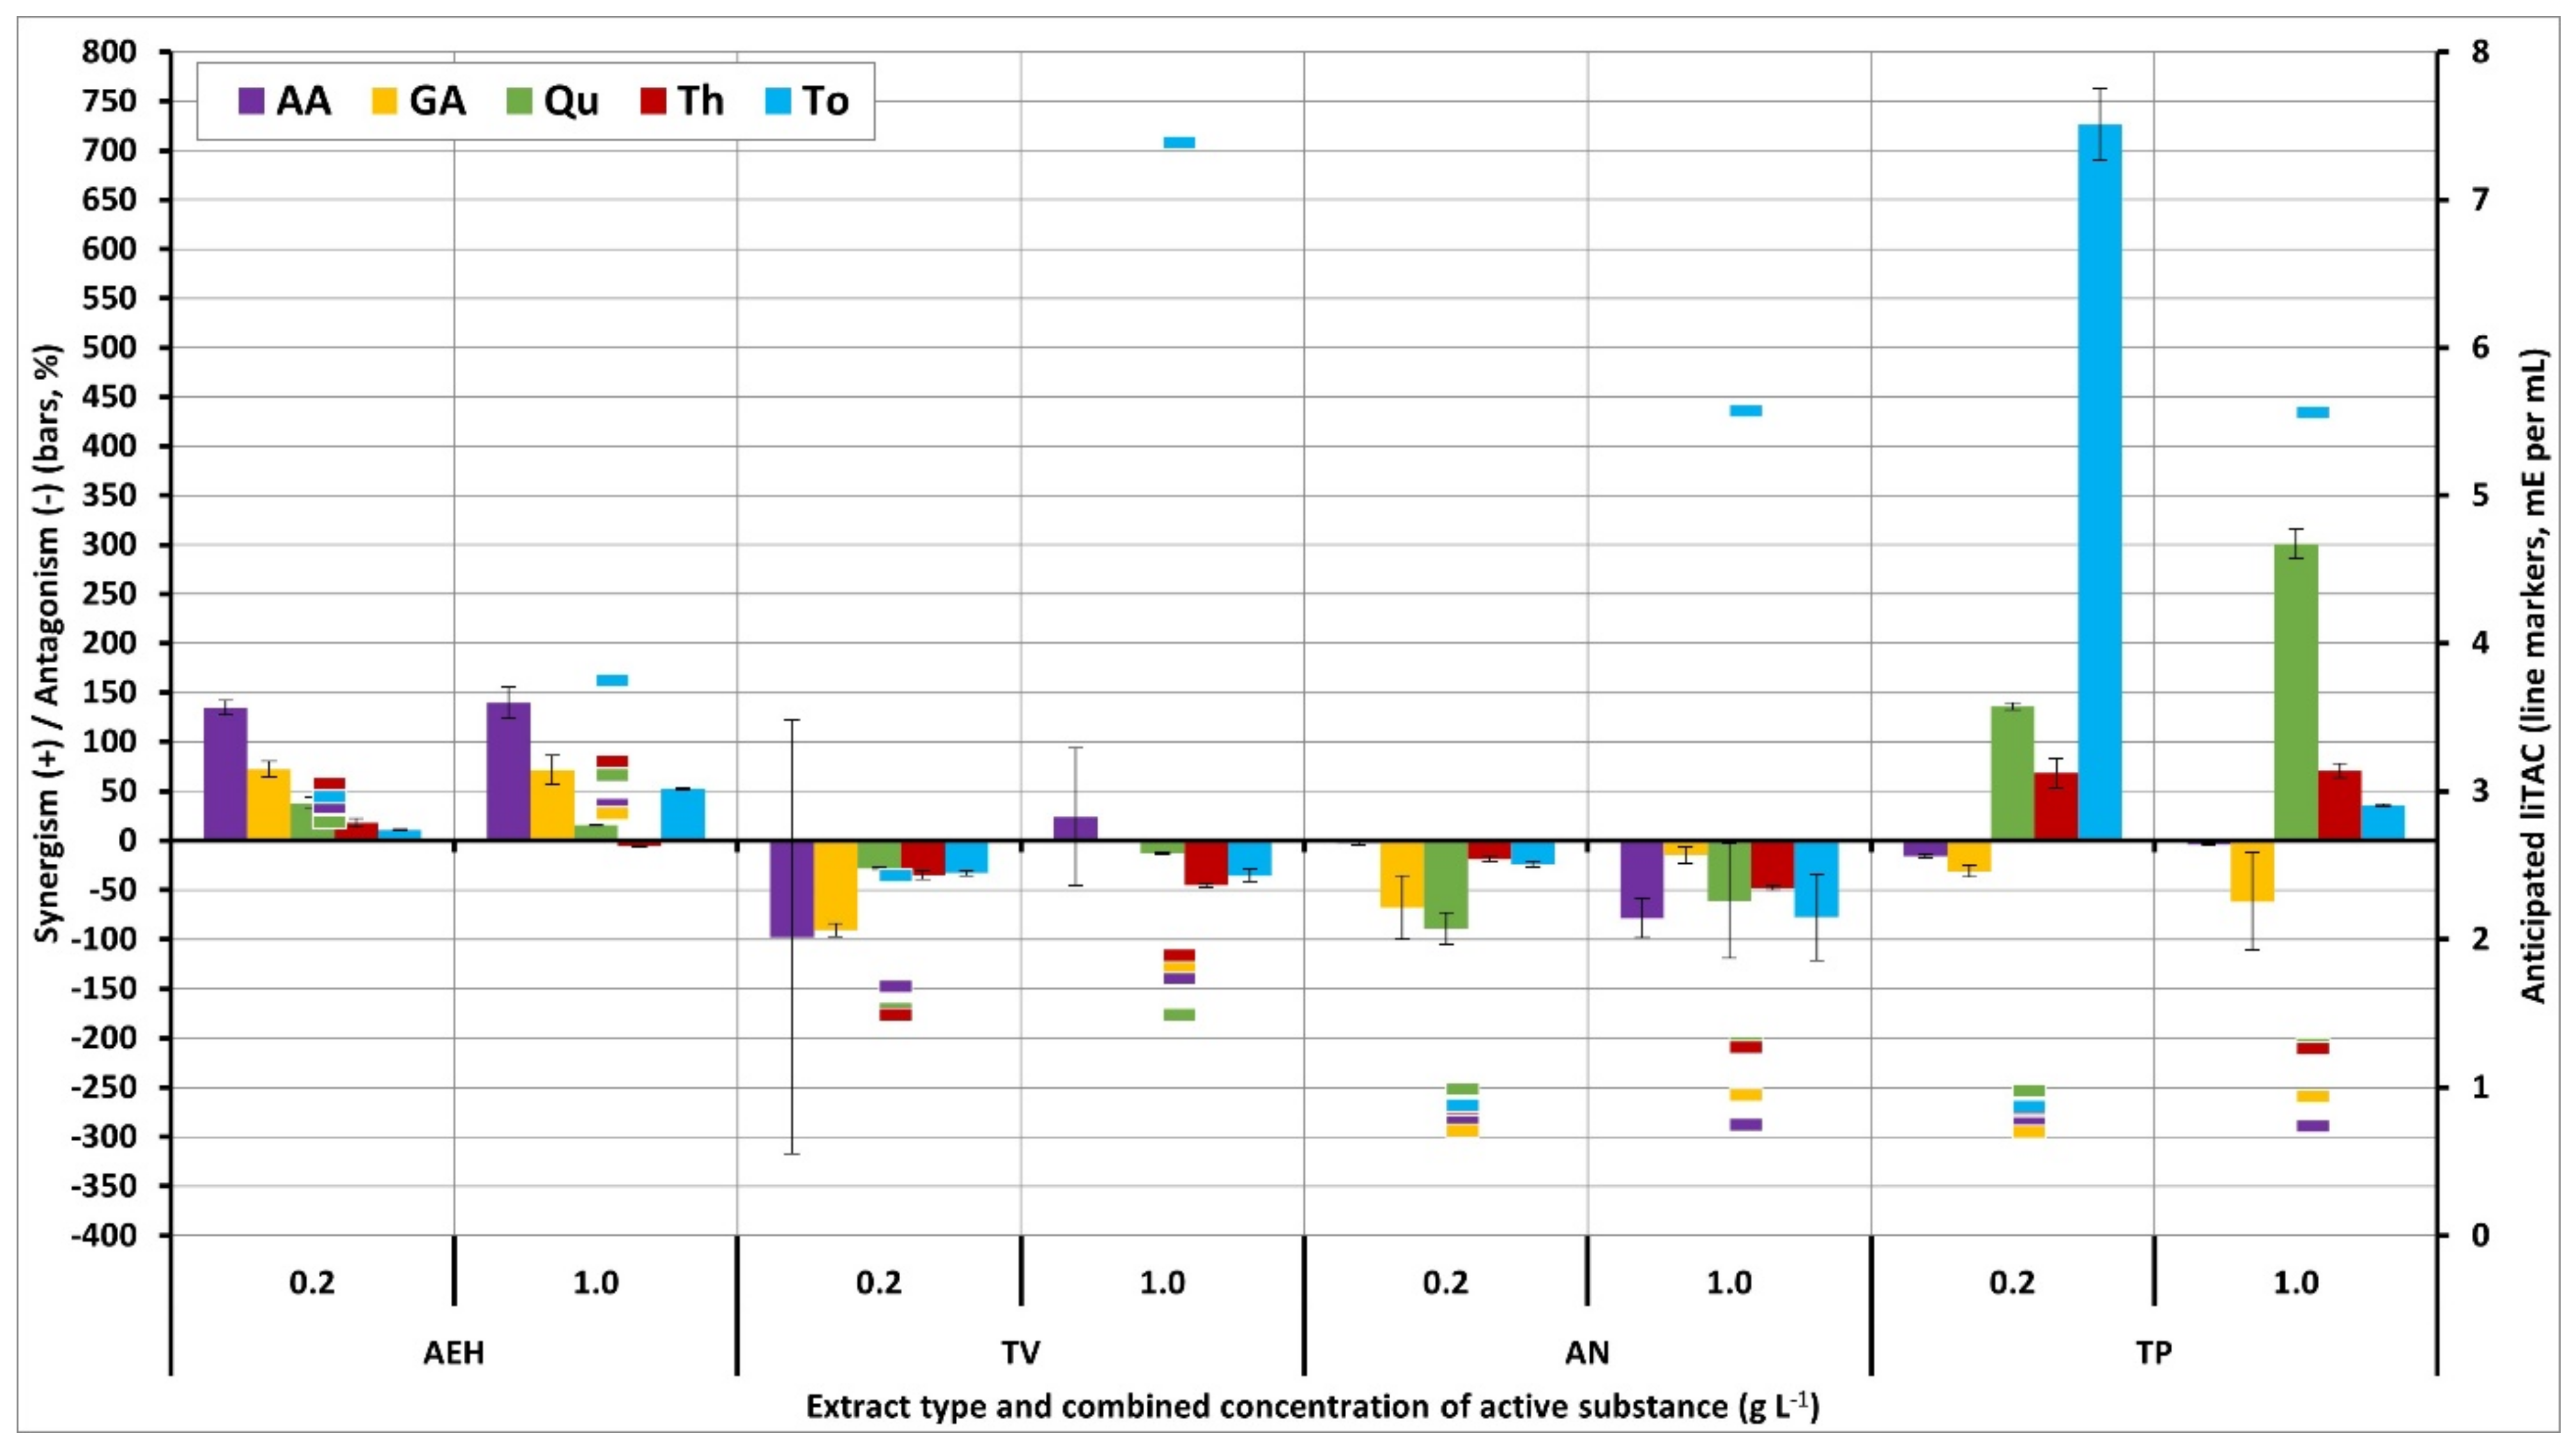
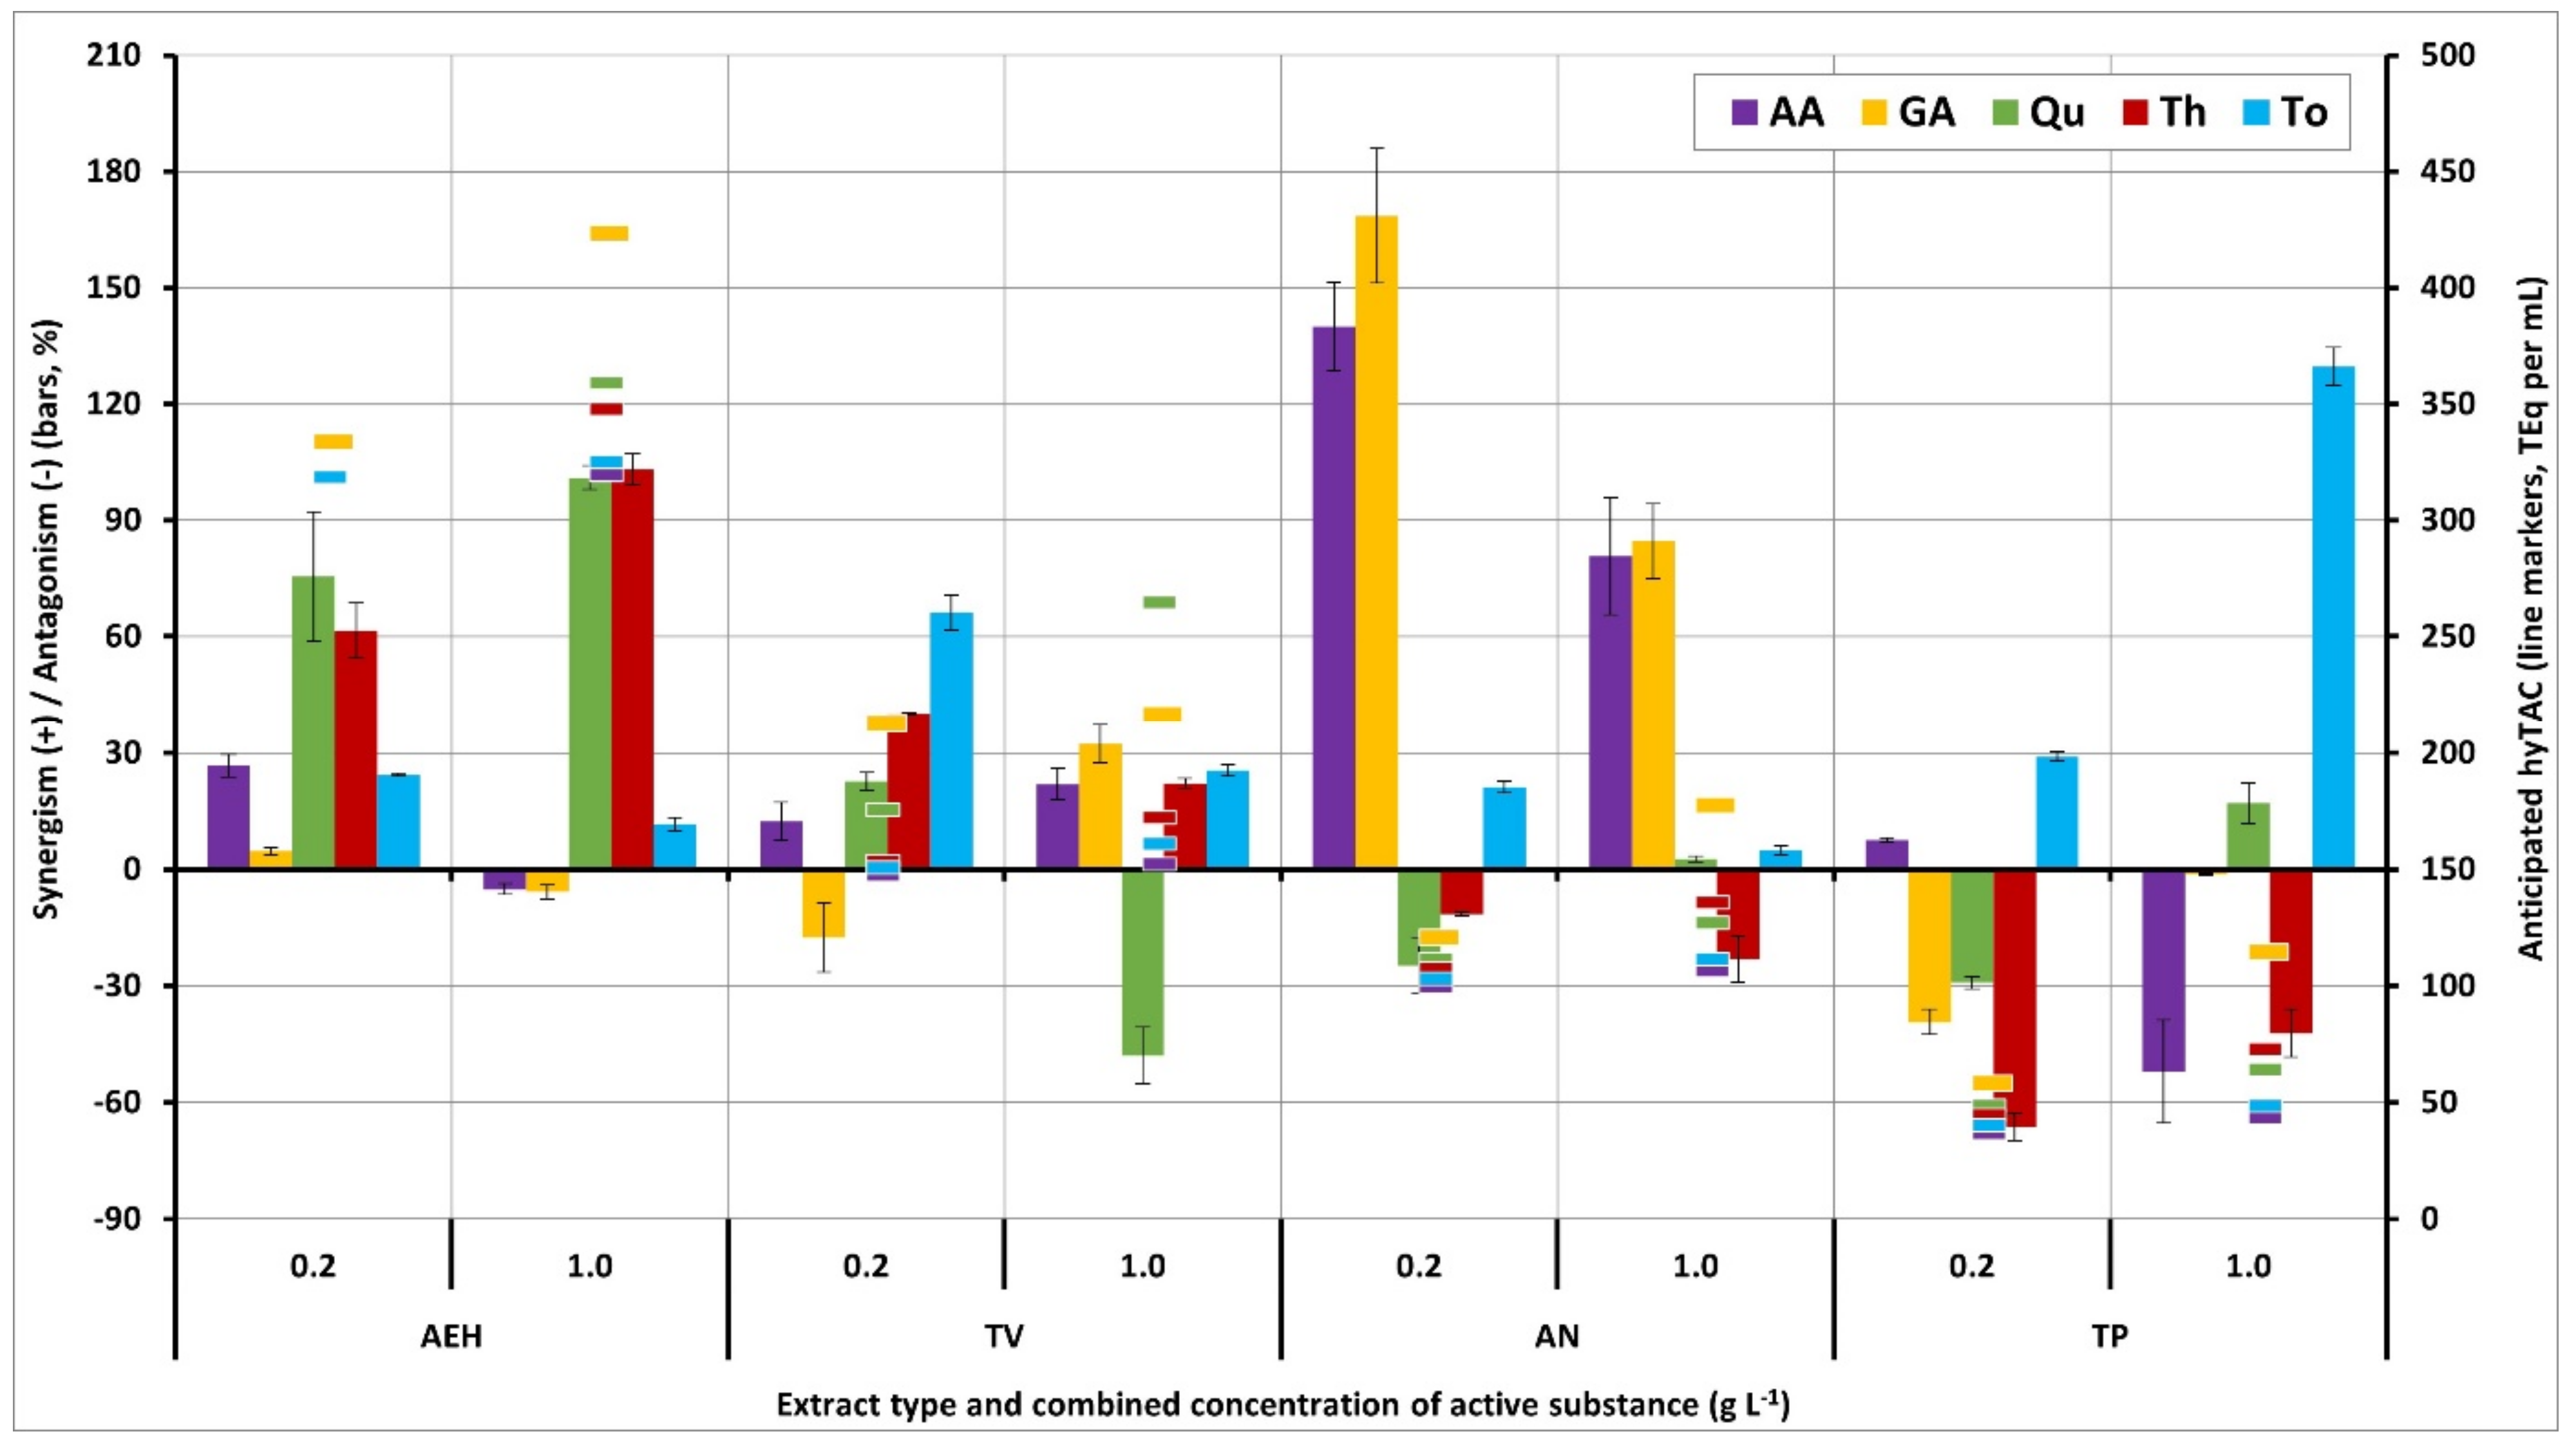
3.2.2. Synergism of Extracts Combined with Isolated Active Compounds (IAC–Extract Synergism)

In addition to different bio-based extracts analysed in combination to reveal potential synergistic effects, the same extracts were combined with active substances with antioxidant effects but different chemical properties, as displayed in Figure 6 and Figure 7. In the experiment setup, all four extracts (AEH, TV, AN, and TP) were crossed with the active compounds ascorbic acid (AA), gallic acid (GA), quercetin (Qu), thymol (Th) and α-tocopherol (To) in two different concentrations. Synergistic effects observed in this context could result in new insights on how different groups of chemicals interact in regard to antioxidant properties, they could hint at extract optimisation (particularly in Th and To combinations as both compounds are found in analysed extracts as well), and they could indicate further worthwhile opportunities of bio-based antioxidant extraction. In general, the influence of IACs is small for low concentrations, and naturally increases with adding higher concentrations (without considering synergistic and antagonistic effects). Thus, synergistic effects observed for lower concentrations of IACs are of a higher direct relevance as the base values show a limited distribution. For higher concentrations, the distribution of base values typically increases, resulting in a more complex situation for synergism interpretation.
Figure 6 shows the observed and anticipated antioxidant effects in lipophilic surroundings. AEH extracts in general did not show relevant antagonistic effects (maximum −6.0% for the high-concentrated (hc) Th combination), while synergistic effects of up to +139.5% were reached for combinations with low concentrations (lc) of AA, GA, and Qu as well as for AA-hc, GA-hc, and To-hc. The synergism observed for To combinations hints at a linear correlation, as the synergistic effect increases by the factor of approximately 5 when increasing the concentration of To by the same factor. For both high and low concentrations, ascorbic acid proved the highest synergistic effect, which is comparable for both concentrations. A maximum liTAC of ca. 6.7 to 6.9 mE mL−1 was reached by AEH/AA combinations for both high and low concentrations.
For TV extracts, high and medium antagonistic effects were observed for most combinations. However, TV/AA-hc showed a limited synergistic effect of +23.6%. Due to this synergistic effect, TV/AA-hc reached the maximum TV–liTAC value of approximately 2.2 mE mL−1, while other combinations, especially with low concentrations of AA and GA, should be avoided as they lead to a high-grade reduction in liTAC. However, TV/AA combinations are subject to comparably high scattering.
AN extract combinations show antagonistic effects only. The best effect is obtained by combining AN and AA-lc, resulting in an antagonistic effect of −2.6%. For other combinations, especially for Qu-lc, AA-hc, To-hc, GA-lc, and Qu-hc, antagonistic effects from circa −60% to −88.9% were observed. Thus, the highest lc-liTAC value of approximately 0.75 mE mL−1 was reached by AN/AA-lc, with other values being even more neglectable. For high concentrations, the highest liTAC was observed for AN/To due to its high base value of 5.6 mE mL−1; however, this value decreased to approximately 1.3 mE mL−1 due to high antagonistic effects.
For TP extracts, most combinations resulted in synergistic effects with relevant antagonistic effects observed for AA and GA only (up to −61.7%). However, the synergistic effects reached remarkably high quantities with +726.4% (To-lc), followed by +300.8% (Qu-hc), +231.4% (GA-lc), and +135.7% (Qu-lc). These extraordinary synergistic effects resulted in record liTAC values of up to 8.1 mE mL−1 (TP/To-lc) for low IAC concentrations, while the highest absolute liTAC for high concentrations was reached by TP/To-hc (7.6 mE mL−1), which showed a comparably low synergistic effect of +35.8%, but an already high base value of 5.6 mg mE−1.
In general, TP and AEH extracts are thus preferred in lipophilic surroundings, while TV and AN extracts show a high risk of showing unintended antagonistic effects. When applying targeted combinations of, for example, TP extracts and α-tocopherol or AEH extracts and ascorbic acid, both exceptionally high synergistic effects and absolute antioxidant potentials can be reached. High synergistic effects in combinations of α-tocopherol and lycopene, which is found in tomato paste [38,39], are confirmed by Zanfini et al. and Shi et al. [66,67]. Furthermore, β-carotene (which is also a constituent of tomato paste [44]) is known to show synergistic effects when combined with α-tocopherol in lipophilic surroundings and thus contributing to the observed synergism [68]. The determined synergistic effect of tomato extracts and quercetin increasing with rising quercetin concentrations is supported by Graßmann as well [65]. The observed antagonistic effects cannot be explained in detail, but are supported by the literature, for example, Hras et al. and Yin et al. reported antagonistic effects for combinations of α-tocopherol and some (poly)phenols (as included in TV, AN and AEH extracts) [69,70]. However, a comprehensive explanation for the antagonistic effect of some, but not all, polyphenols has not yet been found despite both synergistic and antagonistic effects of combined plant extracts being observed frequently, as disclosing the underlying mechanisms is particularly challenging [71].
Figure 7 shows the synergistic and antagonistic effects observed for extract/IAC combinations in hydrophilic surroundings. As in lipophilic surroundings, synergistic effects are predominant for AEH combinations as antagonistic effects were observed at −5.8% at maximum (To-hc), while synergistic effects reached from +101.0 to +103.0% for Qu-hc and Th-hc combinations; both combinations showed comparably high synergistic effects in low concentrations as well (+75.4%; +61.4%), which resulted in a maximum hyTAC value of approximately 556 µg TEq mL−1 (Qu-lc). For high concentrations, both quercetin and thymol showed comparably high hyTAC values of approximately 721 and 706 µg TEq mL−1.
TV extract combinations show lower synergistic, and increased, but still low, antagonistic effects. The synergistic effects still clearly dominate the results, with up to +66.2% (To-lc), while GA-lc and Qu-hc combinations resulted in antagonistic effects from −17.6 to −48.0%. Overall, a slight aligning effect was observed. Due to its comparably high synergistic effect, TV/To-lc resulted in the maximum hyTAC of approximately 250 µg TEq mL−1 for low IAC concentrations, while high concentration combinations resulted in maximum 286 µg TEq mL−1 for TV/GA-hc.
For AN extract combinations, low synergistic and antagonistic effects between −24.8 and +21.1% were observed for quercetin, thymol, and α-tocopherol in both concentrations. For ascorbic acid and gallic acid, high synergistic effects were measured in both concentrations with lc-synergisms reaching the highest observed values observed in the hyTAC-experiment (AA-lc: +140.0%; GA-lc: +168.6%; AA-hc: +80.7%; GA-hc: +84.6%). Thus, the maximum hyTAC-values reached by AN/GA combinations for both concentrations were similar, resulting in approximately 325 µg TEq mL−1 for low and approximately 328 µg TEq mL−1 for high concentrations.
TP extract combinations showed a prevalence for strong antagonistic effects of up to −66.3% (Th-lc). As in lipophilic surroundings, the highest synergistic effects for TP combinations were reached by introducing α-tocopherol, resulting in +29.0% (lc) and +129.7% (hc). The maximum hyTAC reached for low concentrations was approximately 52 µg TEq mL−1 (To-lc), while hc combinations obtained up to approximately 113 µg TEq mL−1 by applying GA without utilising relevant synergistic effects or approximately 112 µg TEq mL−1 by taking advantage of high synergistic effects of α-tocopherol.
Overall hyTAC evaluation showed that individual AN extract combinations show the highest synergistic effects, followed by TP and AEH extract combinations. It is remarkable that AN and AEH extracts, which have comparable ingredients, both consistently and highly constructively interact with two IACs each when both pairs of IACs are different. However, when evaluating the overall hyTAC results, AEH extract combinations show the highest hyTAC values by far, approximately doubling the second-best values reached by AN and TV extracts. Outstandingly, α-tocopherol interacts with the extracts and results in positive synergistic effects for all tested combinations in hydrophilic surroundings, making it a promising all-rounder to add to the formulation. This is supported by the literature in which, in the context of in vivo antioxidant efficacy, the combined use of vitamins and phenolic acids is recommended by Wang et al. [72]. Comparable antagonistic effects have been reported by Becker et al. [73] who observed antagonistic effects for combinations of quercetin and astaxanthin, a carotenoid with structural similarities to lycopene and β-carotene, which are included in TP extracts [38,39,44].
It is also notable that the results seem to be highly dependent on the properties of the surroundings as the IAC/extract synergism results highly deviate from each other when changing from lipophilic to hydrophilic surroundings; this effect is less striking for cross-extract synergism. However, depending on the added IAC, AEH extracts are a potent base for combinations in both surroundings. The observed synergistic effects of AEH and AN extracts in combination with AA are supported by the literature, as synergistic effects for combinations of different polyphenols and ascorbic acid are described by Murakami et al. [74]. It is also observed that the addition of quercetin (Qu) can lead to synergistic effects, as observed in the literature [75]. In agreement with previous proposals, the effect is observed particularly in combination with AEH extract (combining high-molecular and low molecular compounds) or with TP extract (combining different polarities of active compounds).

4. Conclusions

In general, plant materials are complex samples that are subject to fluctuations resulting from, for example, different environmental influences on individual plants, causing altered chemical interactions within the plants. Nevertheless, this study successfully demonstrated the feasibility of producing bio-based alternatives to common petrol-based antioxidants and photostabilisers, and effectively incorporating them into plastic packaging. The tests also showed that the stabilisers are still effective when added to their required surroundings. All four analysed plant extracts can be incorporated into PLA packaging films at different concentrations with the obtained films showing different stabilising effects. Furthermore, concerns regarding health and safety of the films are rebutted as migration studies did not show any anomalies. It is nevertheless recommended for further studies to evaluate the use of food-safe solvents and extractants, such as water and ethanol instead of methanol and heptane, to fully eliminate a possible health risk. Furthermore, the conducted synergism analyses successfully highlighted several possibilities to increase antioxidant effects, some of which are already showing high synergistic effects for cross-extract synergism or IAC/extract synergism, with only low concentrations of active substances added. This allows for a further optimisation of environmentally friendly solutions for biobased stabilisers. However, the entire underlying mechanisms of synergisms still need to be uncovered. In addition to the findings already discussed, it is worth noting that an addition of thymol to thyme extracts can synergistically improve the antioxidant effects, suggesting that an upconcentration of thyme extracts could be a worthwhile approach to disproportionately increase the antioxidant effect. However, this approach needs to be verified, as cross-extract synergism analysis shows divergent results, thus suggesting that thyme extracts act notably different than the IAC thymol, regardless of thymol being the main ingredient [7]. Furthermore, synergism analysis clearly indicates that tomato paste extracts could be a promising renewable resource for antioxidants as TP combinations show remarkable overall synergistic effects. Based on the results of TP combined with α-tocopherol, the combination of TP and GE extracts could be of special interest as GE extracts serve as a renewable source of α-tocopherol [11]. The present study successfully provides important impulses for proceeding works, especially for those pursuing comparative industrial implementation and synergism mechanism break down. For this purpose, promising combinations should be analysed in various concentrations to receive a more detailed view.

Supplementary Materials

The following are available online at www.mdpi.com/2227-9717/9/10/1838/s1, Table S1: Photographs of different PLA films, including up to 0.8% (w/w) antioxidant plant extracts, as described in Section 3.1.

Author Contributions

Conceptualization, M.S. and T.H.; methodology, T.H., S.B. and M.S.; resources, M.S.; writing—original draft preparation, T.H.; writing—review and editing, T.H., S.B. and M.S.; visualization, T.H.; supervision, M.S.; project administration, M.S.; funding acquisition, M.S. All authors have read and agreed to the published version of the manuscript.

Funding

This research was funded by the European Union via the European Regional Development Fund EFRE.NRW, grant number EFRE 0500035. The APC was funded by the Institute of Technology, Resource and Energy-Efficient Engineering (TREE) of Bonn-Rhein-Sieg University of Applied Sciences, and the Graduate Institute of Bonn-Rhein-Sieg University of Applied Sciences.

Acknowledgments

The authors wish to thank Christian Wever, the company, Finzelberg (Martin Bauer Group, Andernach, Germany), and Hof Große Wöstmann (Rinkerode, Germany), who kindly provided sample materials, and Josephine Rattunde and Pia Klimpel for their highly appreciated, continous assistance. The authors also express their gratitude to Bonn-Rhein-Sieg University, particularly including the Graduate Institute, the Department of Natural Sciences, and the Institute of Technology, Resource and Energy-Efficient Engineering (TREE), for financial support.

Conflicts of Interest

The authors declare no conflict of interest. The funders had no role in the design of the study, in the collection, analyses, or interpretation of data, in the writing of the manuscript, or in the decision to publish the results.

References

  1. German Environment Agency. Umweltbewusstsein und Umweltverhalten. Available online: https://www.umweltbundesamt.de/daten/private-haushalte-konsum/umweltbewusstsein-umweltverhalten#textpart-7 (accessed on 24 May 2019).
  2. European Parliament. Directive (EU) 2019/904 on the Reduction of the Impact of Certain Plastic Products on the Environment: EU 2019/904; European Parliament: Brussels, Belgium, 2019. [Google Scholar]
  3. PlasticsEurope. Anteile der Verwendung von Kunststoff nach Einsatzgebieten in Deutschland im Jahr 2019. Available online: https://de.statista.com/statistik/daten/studie/226759/umfrage/verwendung-von-kunststoff-in-deutschland-nach-einsatzgebieten/ (accessed on 4 May 2018).
  4. PlasticsEurope. Anteile an der Verwendung von Kunststoff in Europa nach Einsatzgebieten in den Jahren 2017 bis 2019. Available online: https://de.statista.com/statistik/daten/studie/206528/umfrage/verwendung-von-kunststoff-in-europa-nach-einsatzgebieten/ (accessed on 4 May 2018).
  5. Ito, N.; Fukushima, S.; Tsuda, H. Carcinogenicity and modification of the carcinogenic response by BHA, BHT, and other antioxidants. Crit. Rev. Toxicol. 1985, 15, 109–150. [Google Scholar] [CrossRef]
  6. Kahl, R.; Kappus, H. Toxikologie der synthetischen Antioxidantien BHA und BHT im Vergleich mit dem natürlichen Antioxidans Vitamin E. Z. Lebensm. Unters. Forsch. 1993, 196, 329–338. [Google Scholar] [CrossRef] [PubMed]
  7. Havelt, T.; Schmitz, M. Identifizierung und Charakterisierung bioaktiver Inhaltsstoffe in Thymian. In Proceedings of the 8. Tagung Arznei- und Gewürzpflanzenforschung, Bonn, Germany, 10–13 September 2018 (Poster Presentation). Julius-Kühn-Archiv 2018, 460, 112–114. [Google Scholar] [CrossRef]
  8. Havelt, T.; Frase, J.N.; Pude, R.; Schmitz, M. Characterisation of Bioactive Ingredients in Extracts of Fresh and Dried Coniferous Trees for the Development of Sustainable Packaging Materials. Processes 2020, 8, 1366. [Google Scholar] [CrossRef]
  9. Havelt, T.; Brettschneider, S.; Do, X.T.; Korte, I.; Kreyenschmidt, J.; Schmitz, M. Sustainable Extraction and Characterisation of Bioactive Compounds from Horse Chestnut Seed Coats for the Development of Bio-Based Additives. Resources 2019, 8, 114. [Google Scholar] [CrossRef] [Green Version]
  10. Götz, B.; Hounsou, M.; Dabadé, S.; Havelt, T.; Schmitz, M.; Hounhouigan, D.J.; Kreyenschmidt, J. The Potential of Sustainable Antimicrobial Additives for Food Packaging from Native Plants in Benin. In Proceedings of the Tropentag 2019: Filling Gaps and Removing Traps for Sustainable Resource Management, Kassel, Germany, 17–19 September 2019. [Google Scholar]
  11. Havelt, T.; Brettschneider, S.; Schmitz, M. Plant-based Bioactive Compounds for Substitution of Petrol-based Stabilisers in Packaging Materials: 8th International Symposium on Human Health Effects of Fruits and Vegetables (Oral Presentation). Acta Hortic. 2021, in press. [Google Scholar]
  12. Korte, I.; Kreyenschmidt, J.; Wensing, J.; Bröring, S.; Frase, J.N.; Pude, R.; Konow, C.; Havelt, T.; Rumpf, J.; Schmitz, M.; et al. Can Sustainable Packaging Help to Reduce Food Waste? A Status Quo Focusing Plant-Derived Polymers and Additives. Appl. Sci. 2021, 11, 5307. [Google Scholar] [CrossRef]
  13. Charles, D.J. Natural Antioxidants. In Antioxidant Properties of Spices, Herbs and Other Sources; Charles, D.J., Ed.; Springer: New York, NY, USA, 2013; pp. 39–64. ISBN 978-1-4614-4309-4. [Google Scholar]
  14. Deans, S.G.; Ritchie, G. Antibacterial properties of plant essential oils. Int. J. Food Microbiol. 1987, 5, 165–180. [Google Scholar] [CrossRef]
  15. Tantaoui-Elaraki, A.; Beraoud, L. Inhibition of growth and aflatoxin production in Aspergillus parasiticus by essential oils of selected plant materials. J. Environ. Pathol. Tox. 1994, 13, 67–72. [Google Scholar]
  16. Nelson, R.R.S. In-vitro activities of five plant essential oils against methicillin-resistant Staphylococcus aureus and vancomycin-resistant Enterococcus faecium. J. Antimicrob. Chemother. 1997, 40, 305–306. [Google Scholar] [CrossRef] [Green Version]
  17. Smith-Palmer, A.; Stewart, J.; Fyfe, L. Antimicrobial properties of plant essential oils and essences against five important food-borne pathogens. Lett. Appl. Microbiol. 1998, 26, 118–122. [Google Scholar] [CrossRef] [PubMed]
  18. Tornuk, F.; Cankurt, H.; Ozturk, I.; Sagdic, O.; Bayram, O.; Yetim, H. Efficacy of various plant hydrosols as natural food sanitizers in reducing Escherichia coli O157:H7 and Salmonella Typhimurium on fresh cut carrots and apples. Int. J. Food Microbiol. 2011, 148, 30–35. [Google Scholar] [CrossRef] [PubMed]
  19. European Directorate for the Quality of Medicines and Healthcare. Thyme (Thymi herba). In Pharmacopoea Europaea; European Directorate for the Quality of Medicines and Healthcare: Strasbourg, France, 2001. [Google Scholar]
  20. European Directorate for the Quality of Medicines and Healthcare. Thyme oil (Thymi aetheroleum). In Pharmacopoea Europaea; European Directorate for the Quality of Medicines and Healthcare: Strasbourg, France, 2001. [Google Scholar]
  21. Zeid, A.; Karabagias, I.K.; Nassif, M.; Kontominas, M.G. Preparation and evaluation of antioxidant packaging films made of polylactic acid containing thyme, rosemary, and oregano essential oils. J. Food Process. Preserv. 2019, 83, 1299. [Google Scholar] [CrossRef]
  22. Erkan, N. The Effect of Thyme and Garlic Oil on the Preservation of Vacuum-Packaged Hot Smoked Rainbow Trout (Oncorhynchus mykiss). Food Bioprocess Technol. 2012, 5, 1246–1254. [Google Scholar] [CrossRef]
  23. Jang, S.-H.; Jang, S.-R.; Lee, G.-M.; Ryu, J.-H.; Park, S.-I.; Park, N.-H. Halloysite Nanocapsules Containing Thyme Essential Oil: Preparation, Characterization, and Application in Packaging Materials. J. Food Sci. 2017, 82, 2113–2120. [Google Scholar] [CrossRef] [PubMed]
  24. Karabagias, I.; Badeka, A.; Kontominas, M.G. Shelf life extension of lamb meat using thyme or oregano essential oils and modified atmosphere packaging. Meat Sci. 2011, 88, 109–116. [Google Scholar] [CrossRef]
  25. Lee, M.H.; Seo, H.-S.; Park, H.J. Thyme Oil Encapsulated in Halloysite Nanotubes for Antimicrobial Packaging System. J. Food Sci. 2017, 82, 922–932. [Google Scholar] [CrossRef]
  26. El-Obeid, T.; Yehia, H.M.; Sakkas, H.; Lambrianidi, L.; Tsiraki, M.I.; Savvaidis, I.N. Shelf-life of smoked eel fillets treated with chitosan or thyme oil. Int. J. Biol. Macromol. 2018, 114, 578–583. [Google Scholar] [CrossRef] [Green Version]
  27. Stanciu, G.; Chirila, E.; Dobrinas, S.; Negreanu-Pirjol, T. Studies Regarding the Determination of Antioxidant Properties of New Plant Extracts for Cosmetic Purposes. Rev. Chim. 2010, 41–44. [Google Scholar]
  28. Karimi, E.; Mehrabanjoubani, P.; Homayouni-Tabrizi, M.; Abdolzadeh, A.; Soltani, M. Phytochemical evaluation, antioxidant properties and antibacterial activity of Iranian medicinal herb Galanthus transcaucasicus Fomin. J. Food Meas. Charact. 2018, 12, 433–440. [Google Scholar] [CrossRef]
  29. Domke, A.; Großklaus, R.; Niemann, B.; Przyrembel, H.; Richter, K.; Schmidt, E.; Weißenborn, A.; Wörner, B.; Ziegenhagen, R. Use of Vitamins in Foods: Toxicological and Nutritional-Physiological Aspects—Part 1; Bundesinstitut für Risikobewertung: Berlin, Germany, 2005; ISBN 3938163100.
  30. Vasile, C.; Darie, R.N.; Cheaburu-Yilmaz, C.N.; Pricope, G.-M.; Bračič, M.; Pamfil, D.; Hitruc, G.E.; Duraccio, D. Low density polyethylene—Chitosan composites. Compos. Part B Eng. 2013, 55, 314–323. [Google Scholar] [CrossRef]
  31. Schutzgemeinschaft Deutscher Wald. Weihnachtsbaum in Zahlen und Fakten: Daten zum Weihnachtsbaum 2019. Available online: https://www.sdw.de/waldwissen/weihnachtsbaum/ (accessed on 22 January 2020).
  32. Hauptverband der Deutschen Holzindustrie e.V. Deutsche Kaufen in Diesem Jahr 29,8 Millionen Weihnachtsbäume: Weihnachtsbaum 2019: Stabile Stückzahlen, Stabile Preise; HDH/VDM: Bad Honnef, Germany, 2019. [Google Scholar]
  33. Bağcı, E.; Dığrak, M. Antimicrobial Activity of Essential Oils of some Abies (Fir) Species from Turkey. Flavour Frag. J. 1996, 11, 251–256. [Google Scholar] [CrossRef]
  34. Öncel, I.; Yurdakulol, E.; Keleş, Y.; Kurt, L.; Yıldız, A. Role of antioxidant defense system and biochemical adaptation on stress tolerance of high mountain and steppe plants. Acta Oecol. 2004, 26, 211–218. [Google Scholar] [CrossRef]
  35. Weber, P.; Bendich, A.; Schalch, W. Vitamin C and human health-a review of recent data relevant to human requirements. Int. J. Vitam. Nutr. Res. 1996, 66, 19–30. [Google Scholar]
  36. Hafizoglu, H.; Holmbom, B. Chemical composition of extractives from Abies nordmanniana. Holz. Roh. Werkst. 1995, 53, 273–275. [Google Scholar] [CrossRef]
  37. European Commission. Commission Regulation (EU) No 10/2011 of 14 January 2011 on Plastic Materials and Articles Intended to Come into Contact with Food: EU 10/2011; European Commission: Brussels, Belgium, 2011. [Google Scholar]
  38. Rao, A.V. Processed tomato products as a source of dietary lycopene: Bioavailability and antioxidant properties. Can. J. Diet. Pract. Res. 2004, 65, 161–165. [Google Scholar] [CrossRef] [PubMed]
  39. Giovannucci, E. Tomatoes, tomato-based products, lycopene, and cancer: Review of the epidemiologic literature. J. Natl. Cancer Inst. 1999, 91, 317–331. [Google Scholar] [CrossRef] [PubMed]
  40. Ahmed, J.; Mulla, M.; Arfat, Y.A. Application of high-pressure processing and polylactide/cinnamon oil packaging on chicken sample for inactivation and inhibition of Listeria monocytogenes and Salmonella Typhimurium, and post-processing film properties. Food Control 2017, 78, 160–168. [Google Scholar] [CrossRef]
  41. Erel, O. A novel automated direct measurement method for total antioxidant capacity using a new generation, more stable ABTS radical cation. Clin. Biochem. 2004, 37, 277–285. [Google Scholar] [CrossRef] [PubMed]
  42. Schmitz-Eiberger, M.A.; Blanke, M.M. Bioactive components in forced sweet cherry fruit (Prunus avium L.), antioxidative capacity and allergenic potential as dependent on cultivation under cover. LWT Food Sci. Technol. 2012, 46, 388–392. [Google Scholar] [CrossRef]
  43. Tsao, R. Synergistic interactions between antioxidants used in food preservation. In Handbook of Antioxidants for Food Preservation; Shahidi, F., Ed.; Woodhead Publishing: Cambridge, UK, 2015; pp. 335–347. [Google Scholar]
  44. Baysal, T.; Ersus, S.; Starmans, D.A. Supercritical CO2 extraction of beta-carotene and lycopene from tomato paste waste. J. Agric. Food Chem. 2000, 48, 5507–5511. [Google Scholar] [CrossRef]
  45. Wegmann, A.; Le Gal, A.; Müller, D. Antioxidantien. In Handbuch Kunststoff-Additive, 4th ed.; vollständig neu bearbeitete Auflage; Maier, R.-D., Schiller, M., Eds.; Hanser: München, Germany, 2016; ISBN 978-3-446-22352-3. [Google Scholar]
  46. Altaf, U.; Kanojia, V.; Rouf, A. Novel packaging technology for food industry. J. Pharmoacognosy Phytochem. 2018, 7, 1618–1625. [Google Scholar]
  47. Rasselet, D.; Ruellan, A.; Guinault, A.; Miquelard-Garnier, G.; Sollogoub, C.; Fayolle, B. Oxidative degradation of polylactide (PLA) and its effects on physical and mechanical properties. Eur. Polym. J. 2014, 50, 109–116. [Google Scholar] [CrossRef] [Green Version]
  48. Rabek, J.F. Physical Aspects of the Photodegradation of Polymers. In Polymer Photodegradation: Mechanisms and Experimental Methods; Rabek, J.F., Ed.; Springer: Dordrecht, The Netherlands, 2012; pp. 1–23. ISBN 978-94-011-1274-1. [Google Scholar]
  49. European Commission. Regulation (EC) No 1935/2004 of the European Parliament and of the Council of 27 October 2004 on materials and articles intended to come into contact with food and repealing Directives 80/590/EEC and 89/109/EEC; European Commission: Brussels, Belgium, 2004. [Google Scholar]
  50. Choi, S.-S.; Im, S.-H.; Park, J.-H.; Kim, J.S. Analysis of wax solubility of rubber vulcanizates using wax solution in toluene and molten wax. Polym. Test. 2009, 28, 696–701. [Google Scholar] [CrossRef]
  51. Cataldo, F. On the ozone protection of polymers having non-conjugated unsaturation. Polym. Degrad. Stabil. 2001, 72, 287–296. [Google Scholar] [CrossRef]
  52. UV Spectrum of Thymol; John Wiley & Sons, Inc.: Hoboken, NJ, USA, 2008; Available online: https://spectrabase.com/spectrum/32Hmd4OFCpI (accessed on 11 October 2021).
  53. UV Spectrum of Carvacrol; John Wiley & Sons, Inc.: Hoboken, NJ, USA, 2008; Available online: https://spectrabase.com/spectrum/1zFrwZ5GI2Z (accessed on 11 October 2021).
  54. Tesfay, S.Z.; Magwaza, L.S. Evaluating the efficacy of moringa leaf extract, chitosan and carboxymethyl cellulose as edible coatings for enhancing quality and extending postharvest life of avocado (Persea americana Mill.) fruit. Food Packag. Shelf Life 2017, 11, 40–48. [Google Scholar] [CrossRef]
  55. Erdohan, Z.Ö.; Çam, B.; Turhan, K.N. Characterization of antimicrobial polylactic acid based films. J. Food Eng. 2013, 119, 308–315. [Google Scholar] [CrossRef]
  56. Gavril, G.-L.; Wrona, M.; Bertella, A.; Świeca, M.; Râpă, M.; Salafranca, J.; Nerín, C. Influence of medicinal and aromatic plants into risk assessment of a new bioactive packaging based on polylactic acid (PLA). Food Chem. Toxicol. 2019, 132, 110662. [Google Scholar] [CrossRef]
  57. Souza, V.G.L.; Rodrigues, P.F.; Duarte, M.P.; Fernando, A.L. Antioxidant Migration Studies in Chitosan Films Incorporated with Plant Extracts. J. Renew. Mater. 2018, 6, 548–558. [Google Scholar] [CrossRef]
  58. Min, T.; Sun, X.; Yuan, Z.; Zhou, L.; Jiao, X.; Zha, J.; Zhu, Z.; Wen, Y. Novel antimicrobial packaging film based on porous poly(lactic acid) nanofiber and polymeric coating for humidity-controlled release of thyme essential oil. LWT Food Sci Technol 2021, 135, 110034. [Google Scholar] [CrossRef]
  59. Sharma, S.; Barkauskaite, S.; Duffy, B.; Jaiswal, A.K.; Jaiswal, S. Characterization and Antimicrobial Activity of Biodegradable Active Packaging Enriched with Clove and Thyme Essential Oil for Food Packaging Application. Foods 2020, 9, 1117. [Google Scholar] [CrossRef]
  60. Kowalczyk, A.; Przychodna, M.; Sopata, S.; Bodalska, A.; Fecka, I. Thymol and Thyme Essential Oil-New Insights into Selected Therapeutic Applications. Molecules 2020, 25, 4125. [Google Scholar] [CrossRef]
  61. Basch, E.; Ulbricht, C.; Hammerness, P.; Bevins, A.; Sollars, D. Thyme (Thymus vulgaris L.), Thymol. J. Herb. Pharmacother. 2004, 4, 49–67. [Google Scholar] [CrossRef] [PubMed]
  62. Coelho, E.; Reis, A.; Domingues, M.R.M.; Rocha, S.M.; Coimbra, M.A. Synergistic effect of high and low molecular weight molecules in the foamability and foam stability of sparkling wines. J. Agric. Food Chem. 2011, 59, 3168–3179. [Google Scholar] [CrossRef]
  63. Periago, M.J.; Rincón, F.; Agüera, M.D.; Ros, G. Mixture approach for optimizing lycopene extraction from tomato and tomato products. J. Agric. Food Chem. 2004, 52, 5796–5802. [Google Scholar] [CrossRef] [PubMed]
  64. Choksi, P.M.; Joshi, V.Y. A Review on Lycopene—Extraction, Purification, Stability and Applications. Int. J. Food Prop. 2007, 10, 289–298. [Google Scholar] [CrossRef]
  65. Graßmann, J. Terpenoids as Plant Antioxidants. In Vitamins and Hormones; Elsevier: Amsterdam, The Netherlands, 2005; pp. 505–535. ISBN 9780127098722. [Google Scholar]
  66. Zanfini, A.; Corbini, G.; La Rosa, C.; Dreassi, E. Antioxidant activity of tomato lipophilic extracts and interactions between carotenoids and α-tocopherol in synthetic mixtures. LWT Food Sci. Technol. 2010, 43, 67–72. [Google Scholar] [CrossRef]
  67. Shi, J.; Kakuda, Y.; Yeung, D. Antioxidative Properties of Lycopene and Other Carotenoids from Tomatoes: Synergistic Effects. BioFactors 2004, 21, 203–210. [Google Scholar] [CrossRef] [PubMed]
  68. Palozza, P.; Krinsky, N.I. Beta-Carotene and Alpha-Tocopherol Are Synergistic Antioxidants. Arch. Biochem. Biophys. 1992, 297, 184–187. [Google Scholar] [CrossRef]
  69. Hras, A.R.; Hadolin, M.; Knez, Z.; Bauman, D. Comparison of antioxidative and synergistic effects of rosemary extract with α-tocopherol, ascorbyl palmitate and citric acid in sunflower oil. Food Chem. 2000, 71, 229–233. [Google Scholar] [CrossRef]
  70. Yin, J.; Becker, E.M.; Andersen, M.L.; Skibsted, L.H. Green tea extract as food antioxidant. Synergism and antagonism with α-tocopherol in vegetable oils and their colloidal systems. Food Chem. 2012, 135, 2195–2202. [Google Scholar] [CrossRef]
  71. Wang, S.; Meckling, K.A.; Marcone, M.F.; Kakuda, Y.; Tsao, R. Synergistic, additive, and antagonistic effects of food mixtures on total antioxidant capacities. J. Agric. Food Chem. 2011, 59, 960–968. [Google Scholar] [CrossRef] [PubMed]
  72. Wang, S.; Melnyk, J.P.; Tsao, R.; Marcone, M.F. How natural dietary antioxidants in fruits, vegetables and legumes promote vascular health. Food Res. Int. 2011, 44, 14–22. [Google Scholar] [CrossRef]
  73. Becker, E.M.; Ntouma, G.; Skibsted, L.H. Synergism and antagonism between quercetin and other chain-breaking antioxidants in lipid systems of increasing structural organisation. Food Chem. 2007, 103, 1288–1296. [Google Scholar] [CrossRef]
  74. Murakami, M.; Yamaguchi, T.; Takamura, H.; Matoba, T. Effects of Ascorbic Acid and α-Tocopherol on Antioxidant Activity of Polyphenolic Compounds. J. Food Sci. 2003, 68, 1622–1625. [Google Scholar] [CrossRef]
  75. Heo, H.J.; Kim, Y.J.; Chung, D.; Kim, D.-O. Antioxidant capacities of individual and combined phenolics in a model system. Food Chem. 2007, 104, 87–92. [Google Scholar] [CrossRef]
Figure 1. UV/Vis absorbance spectra of three different plant-based extracts. Ninefold determination (three films with three measurements conducted at random locations of each film). (a): Abies nordmanniana (AN) extract; (b): Aesculus hippocastanum (AEH) extract; (c): Thymus vulgaris (TV) extract.
Processes 09 01838 g001
Figure 2. Variance within the UV absorbance of three different plant-based extracts at peak maximum. Ninefold determination (three films with three measurements conducted at random locations of each film). mA: milli absorbance units. (a): Thymus vulgaris (TV) extract; peak maximum at λ = 283 nm; (b): Aesculus hippocastanum (AEH) extract; peak maximum at λ = 274 nm; (c): Abies nordmanniana (AN) extract; peak maximum at λ = 275 nm.
Processes 09 01838 g002
Figure 3. Examples of cast PLA films including different concentrations of Abies nordmanniana extract, resulting in varying degrees of inhomogeneity and turbidity. (a): F1 (0.2 mL extract per g PLA); (b): F4 (0.6 mL extract per g PLA); (c): F5 (1.0 mL extract per g PLA).
Processes 09 01838 g003
Figure 4. Base total antioxidant capacity (TAC) and determined synergistic effects of different plant-based extracts in combination, analysed via liTAC Assay. Primary ordinate (bars): synergistic (+) or antagonistic (−) effect of extract combinations (n = 3; standard deviation indicated via error bars). Secondary ordinate (horizontal markers): absolute base TAC, based on TAC determination of pure extracts (n = 6) and subsequent mathematical accumulation. AN: Abies nordmanniana extract; TV: Thymus vulgaris extract; AEH: Aesculus hippocastanum extract; TP: tomato paste extract; mE: milli extinction units.
Processes 09 01838 g004
Figure 5. Base total antioxidant capacity (TAC) and determined synergistic effects of different plant-based extracts in combination, analysed via hyTAC Assay. Primary ordinate (bars): synergistic (+) or antagonistic (−) effect of extract combinations (n = 3; standard deviation indicated via error bars). Secondary ordinate (line markers): absolute base TAC, based on TAC determination of pure extracts (n = 6) and subsequent mathematical accumulation. AN: Abies nordmanniana extract; TV: Thymus vulgaris extract; AEH: Aesculus hippocastanum extract; TP: tomato paste extract; TEq: Trolox equivalents.
Processes 09 01838 g005
Figure 6. Base total antioxidant capacity (TAC) and determined synergistic effects of different plant-based extracts in combination with active standard substances, analysed via liTAC Assay. Primary ordinate (bars): synergistic (+) or antagonistic (−) effect of extract combinations (n = 3; standard deviation indicated via error bars). Secondary ordinate (line markers): absolute base TAC, based on TAC determination of pure extracts/standard solutions (n = 6) and subsequent mathematical accumulation. AA: ascorbic acid; GA: gallic acid; Qu: quercetin; Th: thymol; To: α-tocopherol; AN: Abies nordmanniana extract; TV: Thymus vulgaris extract; AEH: Aesculus hippocastanum extract; TP: tomato paste extract; mE: milli extinction units.
Processes 09 01838 g006
Figure 7. Base total antioxidant capacity (TAC) and determined synergistic effects of different plant-based extracts in combination with active standard substances, analysed via hyTAC Assay. Primary ordinate (bars): synergistic (+) or antagonistic (−) effect of extract combinations (n = 3; standard deviation indicated via error bars). Secondary ordinate (line markers): absolute base TAC, based on TAC determination of pure extracts/standard solutions (n = 6) and subsequent mathematical accumulation. AA: ascorbic acid; GA: gallic acid; Qu: quercetin; Th: thymol; To: α-tocopherol; AN: Abies nordmanniana extract; TV: Thymus vulgaris extract; AEH: Aesculus hippocastanum extract; TP: tomato paste extract; TEq: Trolox equivalents.
Processes 09 01838 g007
Publisher’s Note: MDPI stays neutral with regard to jurisdictional claims in published maps and institutional affiliations.

