Article

Optimization of Compression Molding Process Parameters for NFPC Manufacturing Using Taguchi Design of Experiment and Moldflow Analysis

Department of Mechanical Engineering, LUT University, 53851 Lappeenranta, Finland
*
Author to whom correspondence should be addressed.
Submission received: 26 September 2021 / Revised: 13 October 2021 / Accepted: 18 October 2021 / Published: 19 October 2021

Abstract

:
This paper presents the application of Taguchi design of experiment and Autodesk Moldflow® simulation in finding the optimal processing parameters for the manufacturing of natural fiber–polymer composite products. The material used in the study is a composite of recycled thermoplastic reinforced with 10% wood fibers. For the study, four critical processing parameters, namely compression time, mold temperature, melt temperate, and pressure, were selected for optimization. Process analysis was carried out in Moldflow® utilizing a combination of process parameters based on an L9 orthogonal array. Later, the warpage output from Moldflow® simulation was converted into a signal-to-noise (S/N) ratio response, and the optimum values of each processing parameter were obtained using the smaller-the-better quality characteristic. The results show that the optimum values were 60 °C, 40 s, 210 °C, and 600 kN for the mold temperature, compression time, melt temperature, and pressure, respectively. Afterward, a confirmation test was performed to test the optimum parameters. Using analysis of variance (ANOVA), melt temperature was found to be the most significant processing parameter, followed by mold temperature, compression time, and pressure.

1. Introduction

The popularity of natural fiber–polymer composite (NFPC) as a primary construction material in various applications has been increasing rapidly. NFPCs are not limited to basic household and construction applications; they are rapidly gaining a market share in various other engineering fields, such as automotive, electronic, and aerospace applications [1]. The main reason for this growth is the demand for lightweight and robust components [2,3]. NFPCs are relatively lightweight due to the low density of natural fibers and offer good mechanical and dielectric properties. Additional benefits include their low cost, good specific strength, recyclability, carbon neutrality, biodegradability, and ease of disposal [4]. Furthermore, environmental concerns and strict government regulations are also a driving force in the shift towards more sustainable materials [3,5]. Therefore, incorporating NFPCs as a material not only enables manufacturers to save costs by using low-cost and easily available material but also increases their brand image as compared to their competitors.
The polymer matrices in NFPCs are divided into thermoplastics such as polypropylene (PP), acrylonitrile-butadiene-styrene (ABS), and polyamide (PA); and thermosetting, such as epoxy and polyester. The polymer material in the composites is usually virgin, however, recycled polymer material is also receiving increasing interest from researchers and manufacturers [6,7]. NFPCs are fabricated using various manufacturing techniques, including injection molding, compression molding, extrusion, and resin transfer molding [2,8,9]. Compression molding is widely used for the fabrication of NFPCs due to its high-volume productivity, simplicity, and low-cost operation [2,10]. The low cost of operation of compression molding perfectly complements the low cost of NFPC materials, which can be further reduced when using recycled polymer materials. In comparison, injection molding, which is also a high-volume operation, requires complex and expensive tooling systems [10]. This is usually good for the processing of polymer material alone because with NFPCs there is always a possibility of fibers becoming stuck at the gate or runner due to their small size [9]. Meanwhile, compression molding requires the composite charge to be placed in between male and female tools, and the material is formed by the application of pressure and heat [8,10,11].
Previous studies have found that temperature, time, and pressure (compression force) are crucial parameters when processing NFPCs via compression molding [12,13]. From an industrial point of view, it is important to optimize these parameters in order to achieve the maximum efficiency from the production line while maintaining the desired quality and making sure all cost-saving measures are incorporated in the production of the final product. During optimization, it is vital to focus on reducing the processing time, since that will contribute directly to higher productivity and lower production costs. Meanwhile, it is also important to ensure that excessive reductions in processing time do not cause any defect risks in the final product [14].
Few studies have focused on optimizing the compression molding process parameters of NFPCs manufacturing [11,15,16,17,18]. Taguchi design of experiment (DOE) is the most commonly used method for optimizing the processing parameters of both compression molding [11,17] and injection molding [19,20]. Selmat et al. [11] determined the optimum compression molding parameters for obtaining the highest tensile strength from a pineapple leaf fiber–PP composite. They found that 30 kg/cm2 pressure, 175 °C temperature, 6 min preheating, and 4 min compression duration yielded the desired output. Similarly, Shekeil et al. [17] optimized the processing temperature, time, speed, and fiber size using the Taguchi method to determine the highest tensile strength of a kenaf-reinforced polyurethane composite. The reported optimum parameters were 180 °C temperature, 50 rpm speed, 13 min time, and 125–300 µm fiber size. Ibrahim et al. [20] employed the Taguchi approach to find the best combination of processing parameters using orthogonal array (OA) and signal-to-noise (S/N) ratio.
At present, Autodesk Moldflow® software is also widely used in the optimization of injection or compression molding processes by simulating the flow, cooling, and warpage. It aids in resolving the challenges in injection and compression molding and aids in optimizing the part, mold, and process to reduce delays. Numerous studies related to process optimization using Moldflow® simulation combined with Taguchi DOE have been conducted; however, most of them are limited to the injection molding of polymer material and polymer composites [14,21,22,23,24,25,26]. These studies primarily focus on finding optimum injection molding processing parameters by reducing cycle time, warpage, or shrinkage. Even though there are not many studies related to the use of Moldflow® as an optimization tool for the compression molding of NFPCs, the software can simulate the compression molding process with fiber-based material, and the setup is relatively easier than that for injection molding.
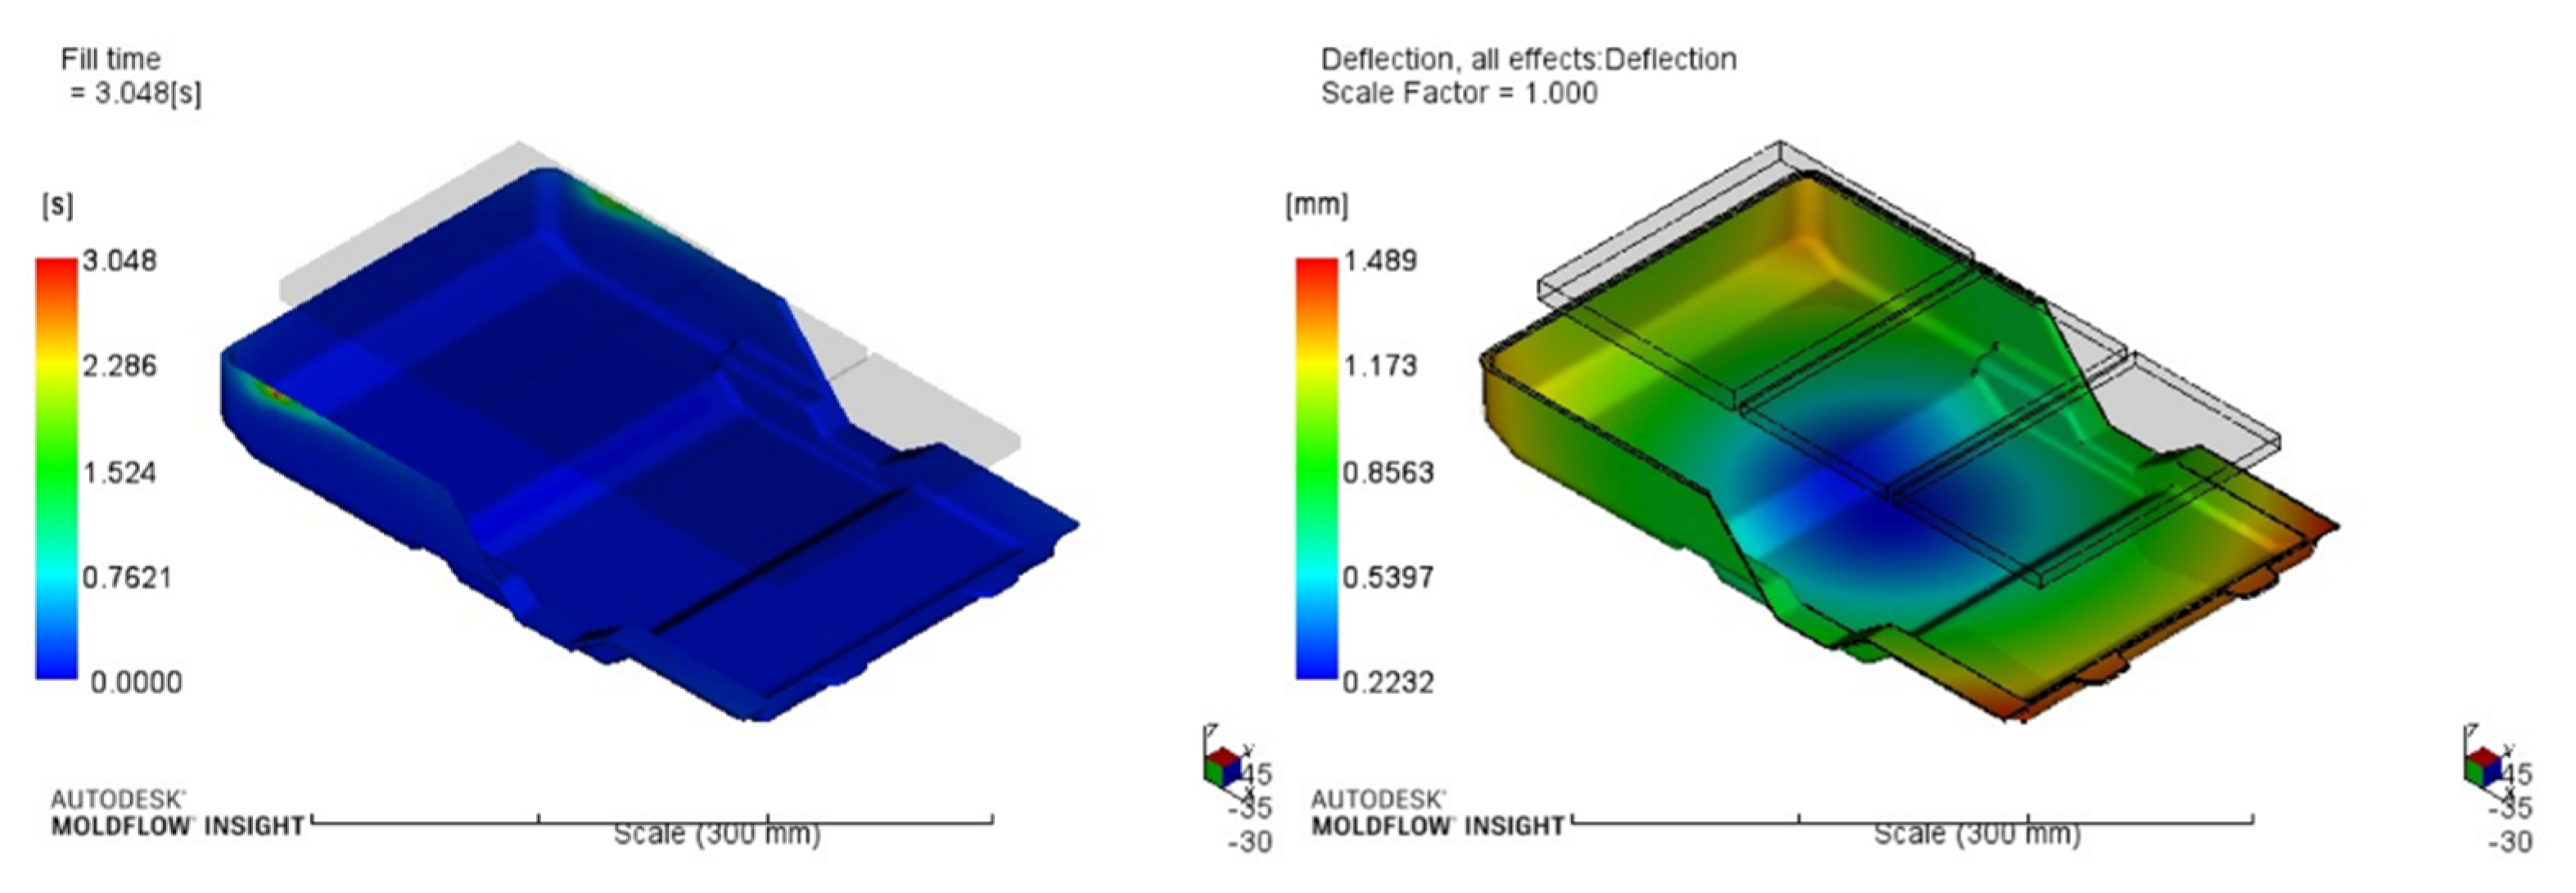
In this study, an alternative approach based on a combination of Taguchi DOE and Autodesk Moldflow® simulation is implemented to optimize the compression molding process for the fabrication of NFPCs with the aim of minimizing warpage and achieving the desired product quality. The S/N ratio of the warpage value was selected as the objective function of the DOE. Furthermore, the significance of the processing parameters’ influence on the warpage value was determined using analysis of variance (ANOVA). Therefore, with S/N ratio and ANOVA, the optimal combination of process parameters could be determined.

2. Material and Methods

2.1. Material Composition and Properties

The polymer material used in the study was waste polymer extracted from various automotive, motorbike, and truck parts. The waste polymer was mostly composed of ABS (80.77%) and other styrene-based polymer blends such as ABS–Polystyrene (3.59%), ABS–Styrene acrylonitrile (1.75%), ABS–Acrylonitrile styrene acrylate (4.61%), ABS–Acrylonitrile ethylene styrene (1.59%), and ABS–Polymethyl methacrylate (7.69%). The polymer waste was crushed in a granulator, and material properties testing was performed later in the laboratory. Material properties such as melt density, solid density, mechanical properties, and melt flow rate were calculated, and the values were added to the Moldflow® Insight material database. Thermal properties were taken from a generic ABS material present in the Moldflow® material database. The polymer data used in the simulation are shown in Table 1.
The material properties for coniferous wood were already present in the database. Exact® elastomer and STRUKTOL® TPW 113 lubricant were added to improve the material flowability in the mold and ease of part removal from the mold, respectively. The properties of the elastomer and lubricant were available from the supplier and were also added to the database. The composite material composition is shown in Table 2.

2.2. Test Model

In this work, an automotive car battery cover was used as an example for the optimization process. The battery cover was designed in-house as a replacement for the polymer-based battery cover for an existing automobile. The designed automotive cover is suitable for NFPC material consisting of recycled plastics and is a viable replacement for its virgin counterpart. The modeling of the battery cover was done in Solidworks 2017 and then it was imported to Autodesk Moldflow® Insight 2021 for meshing and analysis. The modeled and meshed part is shown in Figure 1. The dimensions are 340 mm × 170 mm. The thickness of the part varies from 2.5 to 4 mm. For meshing, Moldflow® has three mesh types, including Midplane, 3D, and Dual Domain. Due to the complex shape of the test model and its varying thickness, we selected 3D meshing, which in turn led to a greater meshing duration and in the end generated 1,179,779 mesh elements for the analysis.

2.3. Taguchi Design of Experiment

The Taguchi approach has been widely used in engineering analysis to optimize the performance characteristics within the combination of design parameters [27]. The Taguchi approach employs three stages: system design, parameter design, and tolerance design. The main objective of Taguchi parameter design is to establish the optimal combination of design parameters and reduce variations in the product quality [27,28]. DOE is a scientific method used for multi-factor experiments, where some representative samples with uniform characteristics from a comprehensive test are selected to conduct experiments by means of probability, mathematical statistics, and orthogonal principle [21,24,26]. Taguchi DOE helps to study the effect of several variables on the desired quality characteristic and analyzes the effect of the degree of variables on the quality characteristics; using this approach, the best combination of variables can be determined [29]. Taguchi DOE minimizes the number of experiments for the optimization process and thus saves both cost and time [11,28,30]. In this study, the melt temperature, mold temperature, compression time, and pressure were selected as the process parameters (factors) for DOE analysis. The factors and their levels are given in Table 3.
Taguchi DOE employs a specially constructed OA, which helps to decrease the required number of experimental trials to study the entire parameter space [27,29]. The OA table is used as a tool to arrange the experiments reasonably and conduct an analysis of the results. Taguchi DOE with a L9 (34) orthogonal array was used in this study, consisting of four factors with three levels (Table 4).
The warpage experimental results were transformed into S/N ratios. Taguchi employs the S/N ratio as one of the measurement indexes to measure the deviation in the quality characteristics from the desired value. The S/N ratio characteristics are further divided into three categories: the larger-the-better, nominal-the-better, and smaller-the-better [27,28,29,31]. Since the purpose of this study is to minimize warpage by optimizing the process parameters, the smaller-the-better quality characteristic was selected. The S/N ratio for each level of process parameters was analyzed based on S/N analysis, where higher S/N ratios correspond to better quality characteristics [29]. For the smaller-the-better quality characteristics,
S N = log ( MSD ) ,
where MSD is the mean-square deviation for the output quality characteristic. For smaller-the-better quality characteristics, MSD can be expressed as:
MSD = 1 N ( i = 1 n Y i 2 ) ,
where Yi is the value of warpage for the ith test, n is the number of tests, and N is the total number of data points.
ANOVA has been used to determine which parameters significantly affect quality characteristics [27,29]. Therefore, ANOVA was used in this study to evaluate the effect of the process parameters on warpage. The percentage contribution of the given process parameter was calculated using the following equations:
SST = SSB + SSW,
where SST is the total sum of squares, SSB is the sum of squares between the groups, and SSW is the sum of squares within the groups.
  SST = i = 1 n ( x i x ¯ ) 2 ,
where n is the number of experiments in the orthogonal array, x is the S/N ratio for the ith experiment, and x ¯ is the mean S/N ratio. The percentage of contribution P can be calculated as follows:
  P = SSB SST × 100 %

3. Results

3.1. Taguchi DOE

The results from the Taguchi DOE for the warpage response and product quality are shown in Table 5. According to Moldflow®, “good quality” means that the final product produced using the given combination of process parameters meets the production standards in terms of material properties and appearance, while “bad quality” means that the final product quality was not sound due to a short shot. A “short shot” is defined as an incomplete filling of the mold, resulting in the production of an incomplete product.

3.2. S/N Ratio

As stated previously, the experimental results for the warpage response were transformed into S/N ratios. The warpage responses and the corresponding S/N ratios are shown in Table 6. The smaller-the-better quality characteristic was used to obtain the S/N ratios.
The significance of each process parameter’s influence on the quality characteristic (warpage) was evaluated according to the maximum and minimum S/N ratio response of each parameter at different levels. The average responses were determined from the S/N rations in Table 6 and are shown in Table 7. An example of the average response calculation is shown below, for the mold temperature:
Level 1 = ((−3.556) + (−3.499) + (−3.643))/3 = −3.566
Level 2 = ((−3.591) + (−3.694) + (−3.620))/3 = −3.635
Level 3 = ((−3.946) + (−3.533) + (−3.671))/3 = −3.717
The delta value for any process parameter is calculated by subtracting the lowest value from the highest value. Based on the delta value, from highest to lowest, a significance ranking was given to each parameter. Rank 1 indicates the most significant parameter while rank 4 indicates the least significant parameter.
Figure 2 shows the S/N ratio response diagram for warpage. The optimum parameter settings to minimize warpage can be easily identified based on the response diagram. The highest value from each parameter represents the best level. Based on Figure 2, the optimum process parameters were obtained by a combination of A1, B2, C1, and D3, as shown in Table 8. Thus, the optimum process parameters are mold temperature 60 °C, compression time 40 s, melt temperature 210 °C, and pressure 600 kN.

3.3. Confirmation Test

Based on the optimum parameters obtained from the Taguchi DOE and S/N ratio, a confirmation test simulation was run to check the product quality, fill time, and warpage for the optimum parameters. Fill, pack, and warp analyses were performed in Moldflow® for the optimum parameters. Figure 3 shows the fill time and warpage values of the component produced using optimum parameters.

3.4. ANOVA

ANOVA was used here to evaluate the percentage significance of the process parameters on the warpage value. ANOVA results include the sum of squares (SS), degrees of freedom (DOFs), variance (V), F-ratio, and the percentage contribution of each parameter (P%). They are summarized in Table 9. The F-ratio and P% are critical for interpretation. If the F-ratio is large, then the p-value is small, which means that the results are statistically significant. A high value of P% indicates a highly influential parameter. From Table 9, it can be observed that melt temperature (C) had the highest contribution among all factors, with a 48.12% contribution to the warpage value. This was followed by mold temperature (A, 24.73%), compression time (B, 16.33%), and pressure (D, 10.82%) as the factors influencing warpage. Similar observations were found by Hussain et al. [31] in their work optimizing the injection molding parameters by minimizing warpage using the Taguchi method and process simulation software. They also found that the melt temperature had the most significant impact on the warpage value.

4. Conclusions

This study was focused on optimizing the compression molding processing parameters for the manufacture of an NFPC part by utilizing Taguchi DOE and Moldflow® simulation. In finding the optimal parameters using an orthogonal L9 array, the S/N ratio and ANOVA were implemented in an integrated manner. Moldflow® simulation generated the warpage values for the set of parameters described in the L9 orthogonal array. Then, the S/N ratio response for each parameter was generated from the corresponding warpage values. Based on the S/N ratio response, the optimum process parameters were found to be a mold temperature of 60 °C, a compression time of 40 s, a melt temperature of 210 °C, and a pressure of 600 kN. Using the optimal parameters, a confirmation test was performed in Moldflow®, and the resulting warpage and fill time were obtained for the composite part. Then, the influence of each processing parameter on the warpage value was calculated using ANOVA. Based on the ANOVA results, it was observed that the melt temperature was the most influential parameter, with a percent contribution of 48.12%; this was followed by the mold temperature (24.73%), compression time (16.33%), and finally pressure (10.82%).

Author Contributions

Conceptualization, V.C., T.K. and J.V.; methodology, V.C.; software, V.C.; validation, V.C.; formal analysis, V.C.; data curation, V.C.; writing—original draft preparation, V.C.; writing—review and editing, V.C., T.K. and J.V.; visualization, V.C.; supervision, T.K. and J.V. All authors have read and agreed to the published version of the manuscript.

Funding

This research received no external funding.

Conflicts of Interest

The authors declare no conflict of interest.

References

  1. Mohammed, L.; Ansari, M.N.M.; Pua, G.; Jawaid, M.; Islam, M.S. A Review on Natural Fiber Reinforced Polymer Composite and Its Applications. Int. J. Polym. Sci. 2015, 2015, 243947. [Google Scholar] [CrossRef] [Green Version]
  2. Zhao, D.; Zhou, Z. Applications of lightweight composites in automotive industries. ACS Symp. Ser. 2014, 1175, 143–158. [Google Scholar]
  3. Holbery, J.; Houston, D. Natural-fiber-reinforced polymer composites in automotive applications. J. Miner. Met. Mater. Soc. 2006, 58, 80–86. [Google Scholar] [CrossRef]
  4. Chauhan, V.; Kärki, T.; Varis, J. Review of natural fiber-reinforced engineering plastic composites, their applications in the transportation sector and processing techniques. J. Thermoplast. Compos. Mater. 2019, 1–41. [Google Scholar] [CrossRef]
  5. Anandjiwala, R.D.; Blouw, S. Composites from bast fibres—Prospects and potential in the changing market environment. J. Nat. Fibers 2007, 4, 91–109. [Google Scholar] [CrossRef]
  6. Milosevic, M.; Stoof, D.; Pickering, K.L. Characterizing the Mechanical Properties of Fused Deposition Modelling Natural Fiber Recycled Polypropylene Composites. J. Compos. Sci. 2017, 1, 7. [Google Scholar] [CrossRef] [Green Version]
  7. Yu, M.; Mao, H.; Huang, R.; Zhenghao, G.; Pujian, T.; Lixin, S.; Qinglin, W.; Kai, S. Mechanical and Thermal Properties of R-High Density Polyethylene Composites Reinforced with Wheat Straw Particleboard Dust and Basalt Fiber. Int. J. Polym. Sci. 2018, 2018, 5101937. [Google Scholar] [CrossRef] [Green Version]
  8. Kim, H.S.; Lee, W.G.; Lee, C.H.; Lee, K.D. Optimization for the prepreg compression molding of notebook computer cover using design of experiment and finite element method. SN Appl. Sci. 2020, 2, 1619. [Google Scholar] [CrossRef]
  9. Chauhan, V.; Kärki, T.; Varis, J. Design of Tooling System and Identifying Crucial Processing Parameters for NFPC Manufacturing in Automotive Applications. J. Compos. Sci. 2021, 5, 169. [Google Scholar] [CrossRef]
  10. Kalpakjian, S.; Schmid, S.R. Plastics and Composite Materials: Forming and Shaping. In Manufacturing Engineering and Technology, 6th ed.; Kalpakjian, S., Schmid, S.R., Eds.; Prentice Hall: Singapore, 2010; pp. 484–524. [Google Scholar]
  11. Selamat, M.Z.; Kasim, A.N.; Malingam, S.D.; Daud, M.A.M. Optimization of Compression Molding Parameters for Pineapple Leaf Fiber Reinforced Polypropylene Composites Using Taguchi Method. In Proceedings of the 6th International Conference and Exhibition on Sustainable Energy and Advanced Materials, Surakarta, Indonesia, 16–17 October 2019; pp. 129–140. [Google Scholar]
  12. Yallew, T.B.; Kassegn, E.; Aregawi, S.; Gebresias, A. Study on effect of process parameters on tensile properties of compression molded natural fiber reinforced polymer composites. SN Appl. Sci. 2020, 2, 338. [Google Scholar] [CrossRef] [Green Version]
  13. Saravanan, K.; Dhurai, B. Effect of process parameters on impact strength of short jute fibre reinforced polypropylene composite board. Indian J. Fibre Text. Res. 2013, 38, 92–95. [Google Scholar]
  14. Martowibowo, S.Y.; Kaswadi, A. Optimization and Simulation of Plastic Injection Process using Genetic Algorithm and Moldflow. Chin. J. Mech. Eng. 2017, 30, 398–406. [Google Scholar] [CrossRef]
  15. Kandar, M.I.M.; Akil, H.M. Application of Design of Experiment (DoE) for Parameters Optimization in Compression Moulding for Flax Reinforced Biocomposites. Procedia Chem. 2016, 19, 433–440. [Google Scholar] [CrossRef] [Green Version]
  16. Govindaraju, R.; Jagannathan, S.; Chinnasamy, M.; Kandhavadivu, P. Optimization of Process Parameters for Fabrication of Wool Fiber-Reinforced Polypropylene Composites with Respect to Mechanical Properties. J. Eng. Fiber Fabr. 2014, 9, 126–133. [Google Scholar] [CrossRef]
  17. El-Shekeil, Y.A.; Sapuan, S.M.; Azaman, M.D.; Jawaid, M. Optimization of Blending Parameters and Fiber Size of Kenaf-Bast-Fiber-Reinforced the Thermoplastic Polyurethane Composites by Taguchi Method. Adv. Mater. Sci. Eng. 2013, 2013, 686452. [Google Scholar] [CrossRef] [Green Version]
  18. El-Shekeil, Y.A.; Salit, M.S.; Abdan, K.; Zainudin, E.S. Development of a New Kenaf Bast Fiber-Reinforced Thermoplastic Polyurethane Composite. Bioresource 2011, 6, 4662–4672. [Google Scholar]
  19. KC, B.; Faruk, O.; Agnelli, J.A.M.; Leao, A.L.; Tjong, J.; Sain, M. Sisal-glass fiber hybrid biocomposite: Optimization of injection molding parameters using Taguchi method for reducing shrinkage. Compos. Part A Appl. Sci. Manuf. 2016, 83, 152–159. [Google Scholar] [CrossRef] [Green Version]
  20. Ibrahim, M.; Zainol, M.Z.R.; Othman, M.H.; Amin, A.M.; Aswari, R.; Saude, N. Optimisation of Processing Condition Using Taguchi Method on Strength of HDPE-Natural Fibres Micro Composite. Appl. Mech. Mater. 2014, 660, 33–37. [Google Scholar] [CrossRef] [Green Version]
  21. Li, X.; Liu, H. Optimization of Injection Molding Process Parameters Based on Taguchi Design of Experiment. Appl. Mech. Mater. 2012, 233, 335–338. [Google Scholar] [CrossRef]
  22. Oliaei, E.; Heidari, B.S.; Davachi, S.M.; Bahrami, M.; Davoodi, S.; Hejazi, I.; Seyfi, I. Warpage and Shrinkage Optimization of Injection-Molded Plastic Spoon Parts for Biodegradable Polymers Using Taguchi, ANOVA and Artificial Neural Network Methods. J. Mater. Sci. Technol. 2016, 32, 710–720. [Google Scholar] [CrossRef]
  23. Hakimian, E.; Sulong, A.B. Analysis of warpage and shrinkage properties of injection-molded micro gears polymer composites using numerical simulations assisted by the Taguchi method. Mater. Des. 2012, 42, 62–71. [Google Scholar] [CrossRef]
  24. Nie, Y.; Zhang, H.; Niu, J. Optimization of the Injection Molding Process Parameters Based on Moldflow and Orthogonal Experiment. Key Eng. Mater. 2013, 561, 239–243. [Google Scholar] [CrossRef]
  25. Yang, J.; Xu, Y. Warpage Analysis of Injection Molding Based on Mold Flow. Adv. Mater. Res. 2012, 538–541, 1192–1196. [Google Scholar] [CrossRef]
  26. Vishnuvarthanan, M.; Panda, R.; Ilangovan, S. Optimization of Injection Molding Cycle Time Using Moldflow Analysis. Middle East J. Sci. Res. 2013, 13, 944–946. [Google Scholar]
  27. Oktem, H.; Erzurumlu, T.; Uzman, I. Application of Taguchi optimization technique in determining plastic injection molding process parameters for a thin-shell part. Mater. Des. 2007, 28, 1271–1278. [Google Scholar] [CrossRef]
  28. Selamat, M.Z.; Sahari, J.; Muhamad, N.; Muchtar, A. Simultaneous optimization for multiple responses on the compression moulding parameters of composite graphite—Polypropylene using taguchi method. Key Eng. Mater. 2011, 2, 471–472. [Google Scholar] [CrossRef]
  29. Kamaruddin, S.; Khan, Z.A.; Foong, S.H. Application of Taguchi Method in the Optimization of Injection Moulding Parameters for Manufacturing Products from Plastic Blend. Int. J. Web. Eng. Technol. 2010, 2, 574–580. [Google Scholar] [CrossRef] [Green Version]
  30. Jamil, N.A.; Selamat, M.Z.; Hasan, R. Optimization of compression moulding parameters for multi filler polymer composite using Taguchi method. J. Adv. Manuf. Technol. 2018, 12, 1–10. [Google Scholar]
  31. Hussin, R.; Saad, R.M.; Hussin, R.; Dawi, M.S.I.M.; Dawi, I.M. An Optimization of Plastic Injection Molding Parameters Using Taguchi Optimization Method. Asian Trans. Eng. 2012, 2, 75–80. [Google Scholar]
Figure 1. Modeled and meshed part used in the simulation.
Processes 09 01853 g001
Figure 2. S/N ratio response graph.
Processes 09 01853 g002
Figure 3. Result of fill time and warpage value for optimal process parameters.
Processes 09 01853 g003
Table 1. ABS blend data table.
DescriptionUnitValue
Melt densityKg/m3960
Solid densityKg/m31050
Melt mass-flow rateg/10 min30.864
Transition temperature°C100
Elastic modulusMPa1780
Poisson ratio 0.39
Shear modulusMPa992.8
Specific heatJ/kg °C2399
Thermal conductivityW/m °C0.18
Table 2. Simulation material composition.
Polymer (%)Fiber (%)Lubricant (%)Plasticizer (%)
821035
Table 3. Level of factors affecting the compression molding process.
SymbolFactorUnitValues
123
AMold temperature°C607080
BCompression times304050
CMelt temperature°C210220230
DPressurekN400500600
Table 4. The LP orthogonal array (34).
Exp. No.ABCD
11111
21222
31333
42123
52231
62312
73132
83213
93321
Table 5. Quality and warpage results of the simulation.
Exp. No.ABCDResults
QualityWarpage (mm)
11111Bad1.506
21222Good1.496
31333Good1.521
42123Good1.512
52231Good1.530
62312Good1.517
73132Good1.575
83213Good1.502
93321Good1.526
Table 6. Warpage results and corresponding S/N ratios.
Exp. No.ABCDWarpage (mm)S/N
111111.506−3.556
212221.496−3.499
313331.521−3.643
421231.512−3.591
522311.530−3.694
623121.517−3.620
731321.575−3.946
832131.502−3.533
933211.526−3.671
Table 7. Average responses of S/N ratio and delta.
Level123DeltaRank
1−3.566−3.635−3.7170.1512
2−3.698−3.575−3.6440.1223
3−3.570−3.587−3.7610.1911
4−3.640−3.688−3.5890.0994
Table 8. Average responses of S/N ratio and delta.
ParameterValue
Mold temperature (A1)60 °C
Compression time (B2)40 s
Melt temperature (C1)210 °C
Pressure (D3)600 kN
Table 9. ANOVA results for warpage.
ParameterDOFSSVF-RatioP%
A20.001070.0005350.98547224.73
B20.000710.0003530.58560416.33
C20.002080.0010412.78295748.12
D20.000470.0002340.36390310.82
Publisher’s Note: MDPI stays neutral with regard to jurisdictional claims in published maps and institutional affiliations.

