Article

Study on the Effect of Hole Size of Trombe Wall in the Presence of Phase Change Material for Different Times of a Day in Winter and Summer

by
Yacine Khetib
1,2,
Abdullah Alhumaidi Alotaibi
3,
Abdullah H. Alshahri
4,
Goshtasp Cheraghan
5,*,
Mohsen Sharifpur
6,7,* and
Josua P. Meyer
6
1
Mechanical Engineering Department, Faculty of Engineering, King Abdulaziz University, Jeddah 80204, Saudi Arabia
2
Center of Research Excellence in Renewable Energy and Power Systems, King Abdulaziz University, Jeddah 80204, Saudi Arabia
3
Department of Science and Technology, College of Ranyah, Taif University, P.O. Box 11099, Taif 21944, Saudi Arabia
4
Civil Engineering Department, College of Engineering, Taif University, Taif 21099, Saudi Arabia
5
Independent Researcher, 38106 Braunschweig, Germany
6
Department of Mechanical and Aeronautical Engineering, University of Pretoria, Pretoria 0002, South Africa
7
Department of Medical Research, China Medical University Hospital, China Medical University, Taichung 404, Taiwan
*
Authors to whom correspondence should be addressed.
Submission received: 26 August 2021 / Revised: 26 September 2021 / Accepted: 30 September 2021 / Published: 22 October 2021
(This article belongs to the Section Materials Processes)

Abstract

:
In this article, a numerical study is performed on a Trobme wall in a tropical city for two seasons, summer and winter. A 1 × 1.5   m Trobme wall with a thickness of 15 cm is designed and analyzed. A 1-inch-diameter tube filled with PCM is used to enhance efficiency. The wall is analyzed at different times of the day for the two cold and hot seasons for different sizes of wall holes in the range of 70 to 17.5 cm when the wall height is 20 cm. A fluid simulation software is employed for the simulations. The problem variables include different hours of the day in the two cold and hot seasons, the presence or absence of PCM, as well as the size of the wall hole. The results of this simulation demonstrate that the maximum outlet temperature of the Trobme wall occurs at 2 P.M. Using PCM on the wall can allow the wall to operate for longer hours in the afternoon. However, the use of PCM reduces the outlet wall temperature in the morning. The smaller the size of the wall hole, the more air can be expelled from the wall.

1. Introduction

One of the most significant problems facing humanity in the future is energy challenges [1,2]. In the past, numerous researchers have looked into various options for reducing human energy usage [3,4,5,6,7]. With regard to the use of nanofluids, optimizations have been made, and some examples are given in references [8,9,10,11,12,13]. Some investigators analyzed the effect of using different fins to enhance the equipment efficiency. Many academics have regarded solar energy as one of the possible renewable energy sources [14,15,16,17,18]. One of the most important energy consumers is in buildings, where the researchers have aimed to reduce their energy consumption [19,20,21,22,23]. One approach to minimize energy usage in buildings is to employ solar energy. A Trobme wall (Tr-W) is a type of thermal storage wall that consists of a dark wall made of building materials and is covered with vertical glass. It is known as a storage and solar heating wall [24,25]. The Tr-W provides solar energy application, ventilation, and thermal comfort in buildings for different climatic regions [26]. The Tr-W’s role is to absorb the solar beam and transform it into energy, allowing it to capture surplus energy during peak periods and return the stored energy when the building’s inhabitants require it [27,28]. The design of the classic Tr-W is based on the use of materials with high heat storage capacity. These materials include bricks, concrete, stone, and adobe. The outer surface of the wall is black to reinforce absorption. Moreover, the surface of the Tr-W is walled, and he gap among the glass and consequently the wall is filled with air. The wall absorbs direct sunlight at some point of the day and heat transfers in the dead of night through the wall to the building interior way to convection and conduction heat transfer. The distance between the glass and the wall usually ranges from 3 cm to 10 cm [29]. The stored heat gradually dissipates as heat mass. Jaber et al. [30] examined the performance of the ratio of the area of a Tr-W to the area of a wall in a house in Jordan. Their results indicated that this ratio has a direct effect on thermal efficiency. Ballcombe and McFarland [31] studied the effect of the Trobme wall with and without a valve in different climatic conditions in the United States and demonstrated that during the night, there is a decrease in the Tr-W performance due to the creation of a reverse flow of valve. A simulation was investigated using Energy plus software and computer code by Ferreira and Pinheiro [32] in three completely different environmental condition regions of the Portuguese Republic. This study aimed to see the result of valves on Tr-W performance, which was positive for the Portuguese climate. Sebald and Phillips [33] performed a simulation study on the performance of a fan-equipped Tr-W and discovered that the fan improves the performance of the Tr-W by up to eight.
Thermal energy can be stored in materials in the form of sensible and latent energy. In sensible energy storage, the temperature (TEM) of a solid or liquid body is enhanced. The amount of sensible energy stored in the body is a function of TEM, specific heat capacity, and the mass of the body. The latent energy is stored in the object as its phase changes from solid to liquid or liquid to gas or solid to solid [34,35]. PCMs store energy as latent heat (L-H) of fusion. As mentioned above, heat storage is done through three change phases. In the first case, the phase changes from solid to gas and is not suitable because the heat transfer is very slow. The second case, i.e., the change in phase from liquid to gas, is not practical due to the need for a high amount of heat and also the creation of high-pressure gas. However, it is more appropriate to change the phase solid to liquid, which is a characteristic of PCMs. Their phase is converted from solid to liquid at a constant TEM by absorbing heat. These materials release energy at almost the same TEM as they absorb. It should be noted that these materials are solid at room TEM. Due to the importance of PCMs in different fields to store energy, many researchers have used them in buildings to store energy [36,37,38]. Some other researchers have used PCMs in Tr-Ws [39,40,41,42,43]. In one of these studies, Bordeaux [44] conducted an experimental study on a Tr-W using a PCM. The wall was made of polyethylene containers against inside wood double walls. The results showed that L-H is stored during the saturation process, and a Tr-W is more efficient than a concrete one by storing L-H. A group of Japanese researchers, Onishi et al. [45], simulated the thermal behavior of a Tr-W containing PCMs in a room. This group analyzed three PCMs and found that their use in the wall reduces energy consumption in the building.
Due to the importance of energy consumption in buildings and also the ability of PCMs to store energy, a Tr-W containing PCM is simulated in this paper. This study is conducted for the weather, for two days in summer and winter. For this purpose, the outlet TEM of the Tr-W at different times of the day is studied in these two seasons considering a tube filled with PCM. The effect of different sizes of Tr-W holes, including 17.5, 35, and 70 cm, on wall TEM, is also evaluated. The innovation of the present work can be expressed as the study of a Tr-W with PCM for its specific data, including TEM and heat flux.

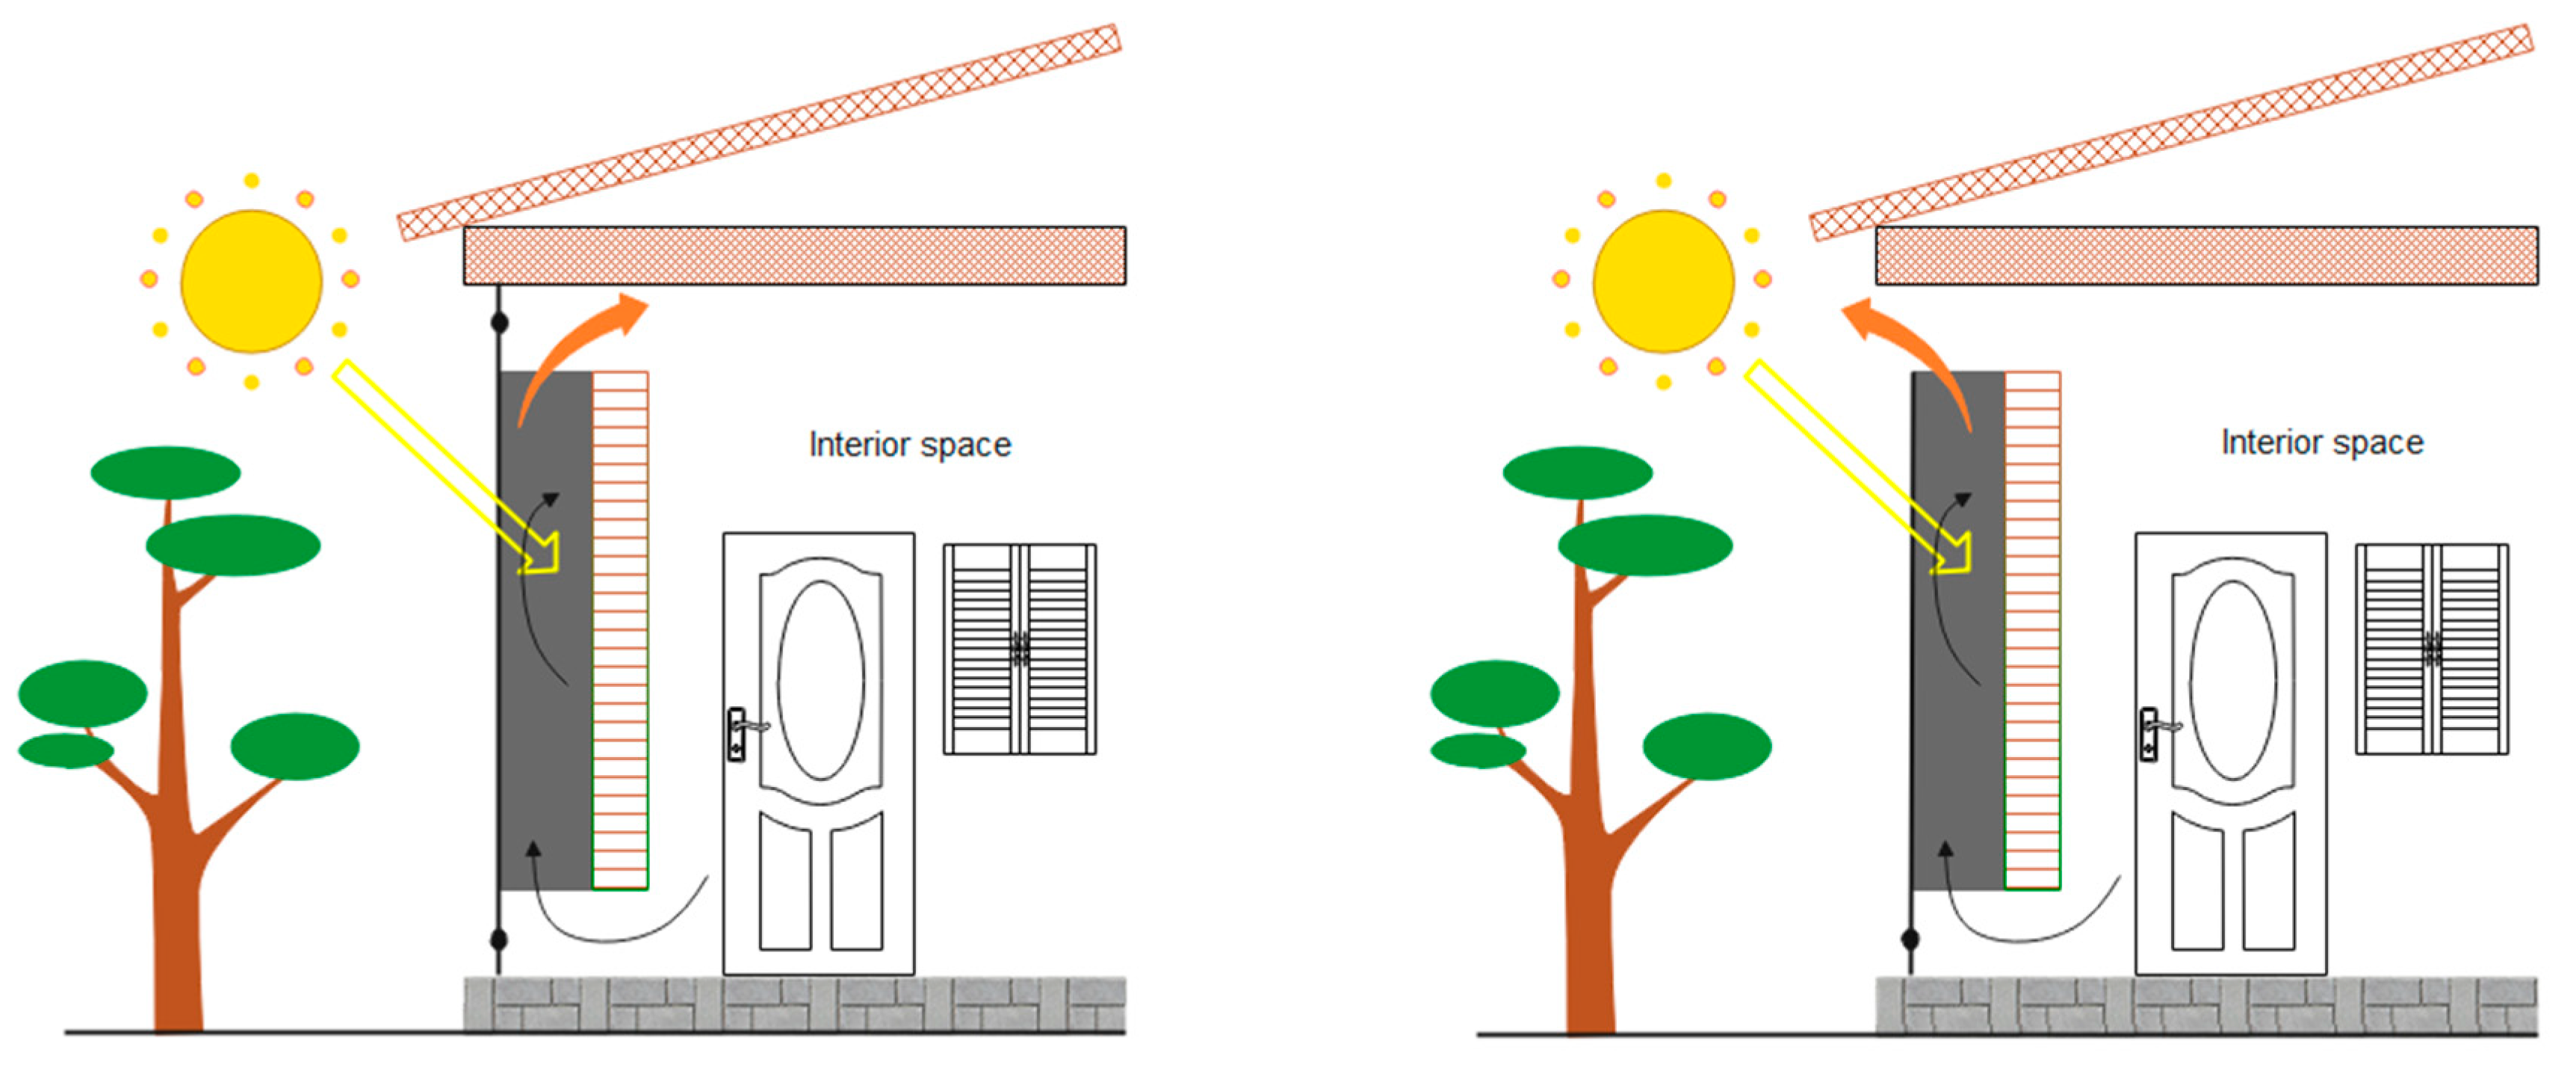
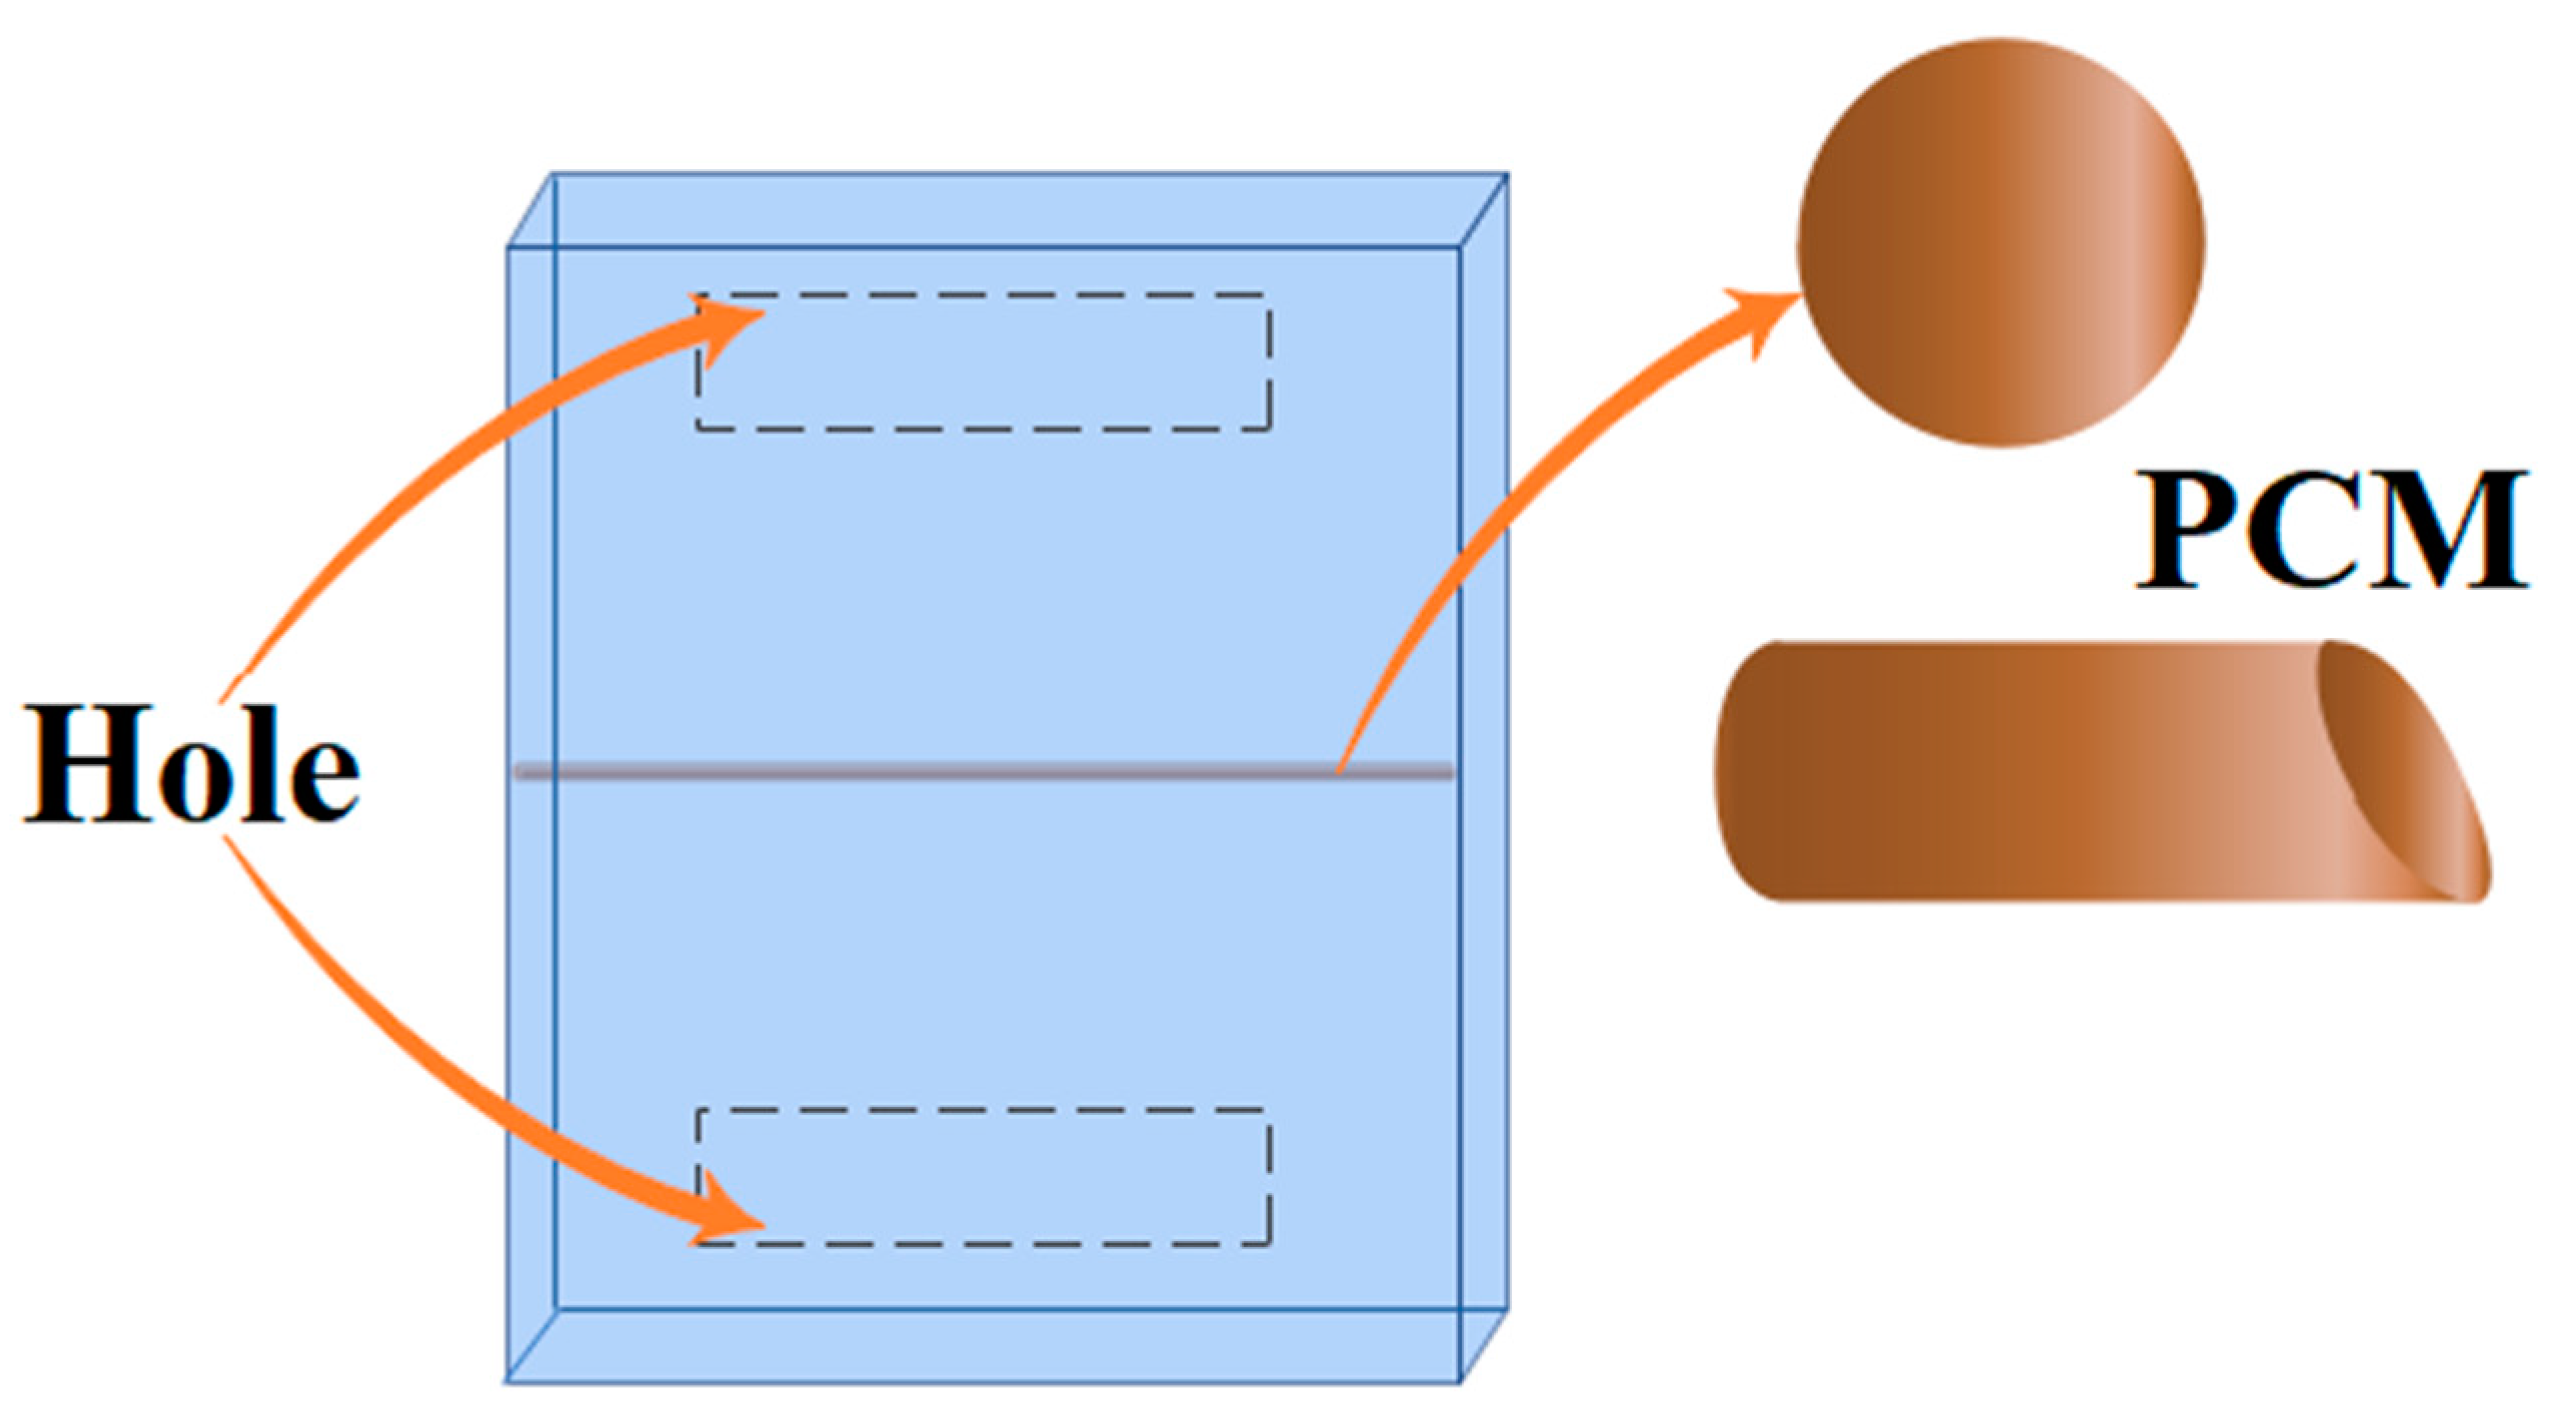
2. Problem Statement

The Tr-W studied in the present study is shown in Figure 1 for winter (left) and summer (right).
The different parts of the Tr-W, including their thickness and dimensions, are presented in Table 1. There is an air passage hole at the top and bottom of the Tr-W, where its height is 20 cm (Figure 2). The width of the hole has three different sizes of 17.5, 35, and 70 cm (Figure 3). Heat flux is applied to the back of the wall due to sunlight. Due to the natural convection, the air inside the wall moves. A tube with 1 inch in diameter filled with PCM is placed in the middle of the Tr-W horizontally. The wall of the tube is made of aluminum. Table 2 presents the properties of the PCM.

3. Governing Equations

Due to the high cost of experimental measurements, it is preferable to perform experiments on a model with a smaller scale than the original version. The most basic equations governing the fluid flow are conservation equations, including mass, momentum, and energy equations. The basis of the CFD technique is the use of numerical methods to solve conservation equations in the geometric domain of the flow system and to find the flow characteristics including velocity, pressure, TEM, concentration, and other flow properties.

3.1. Airflow and Wall Equations
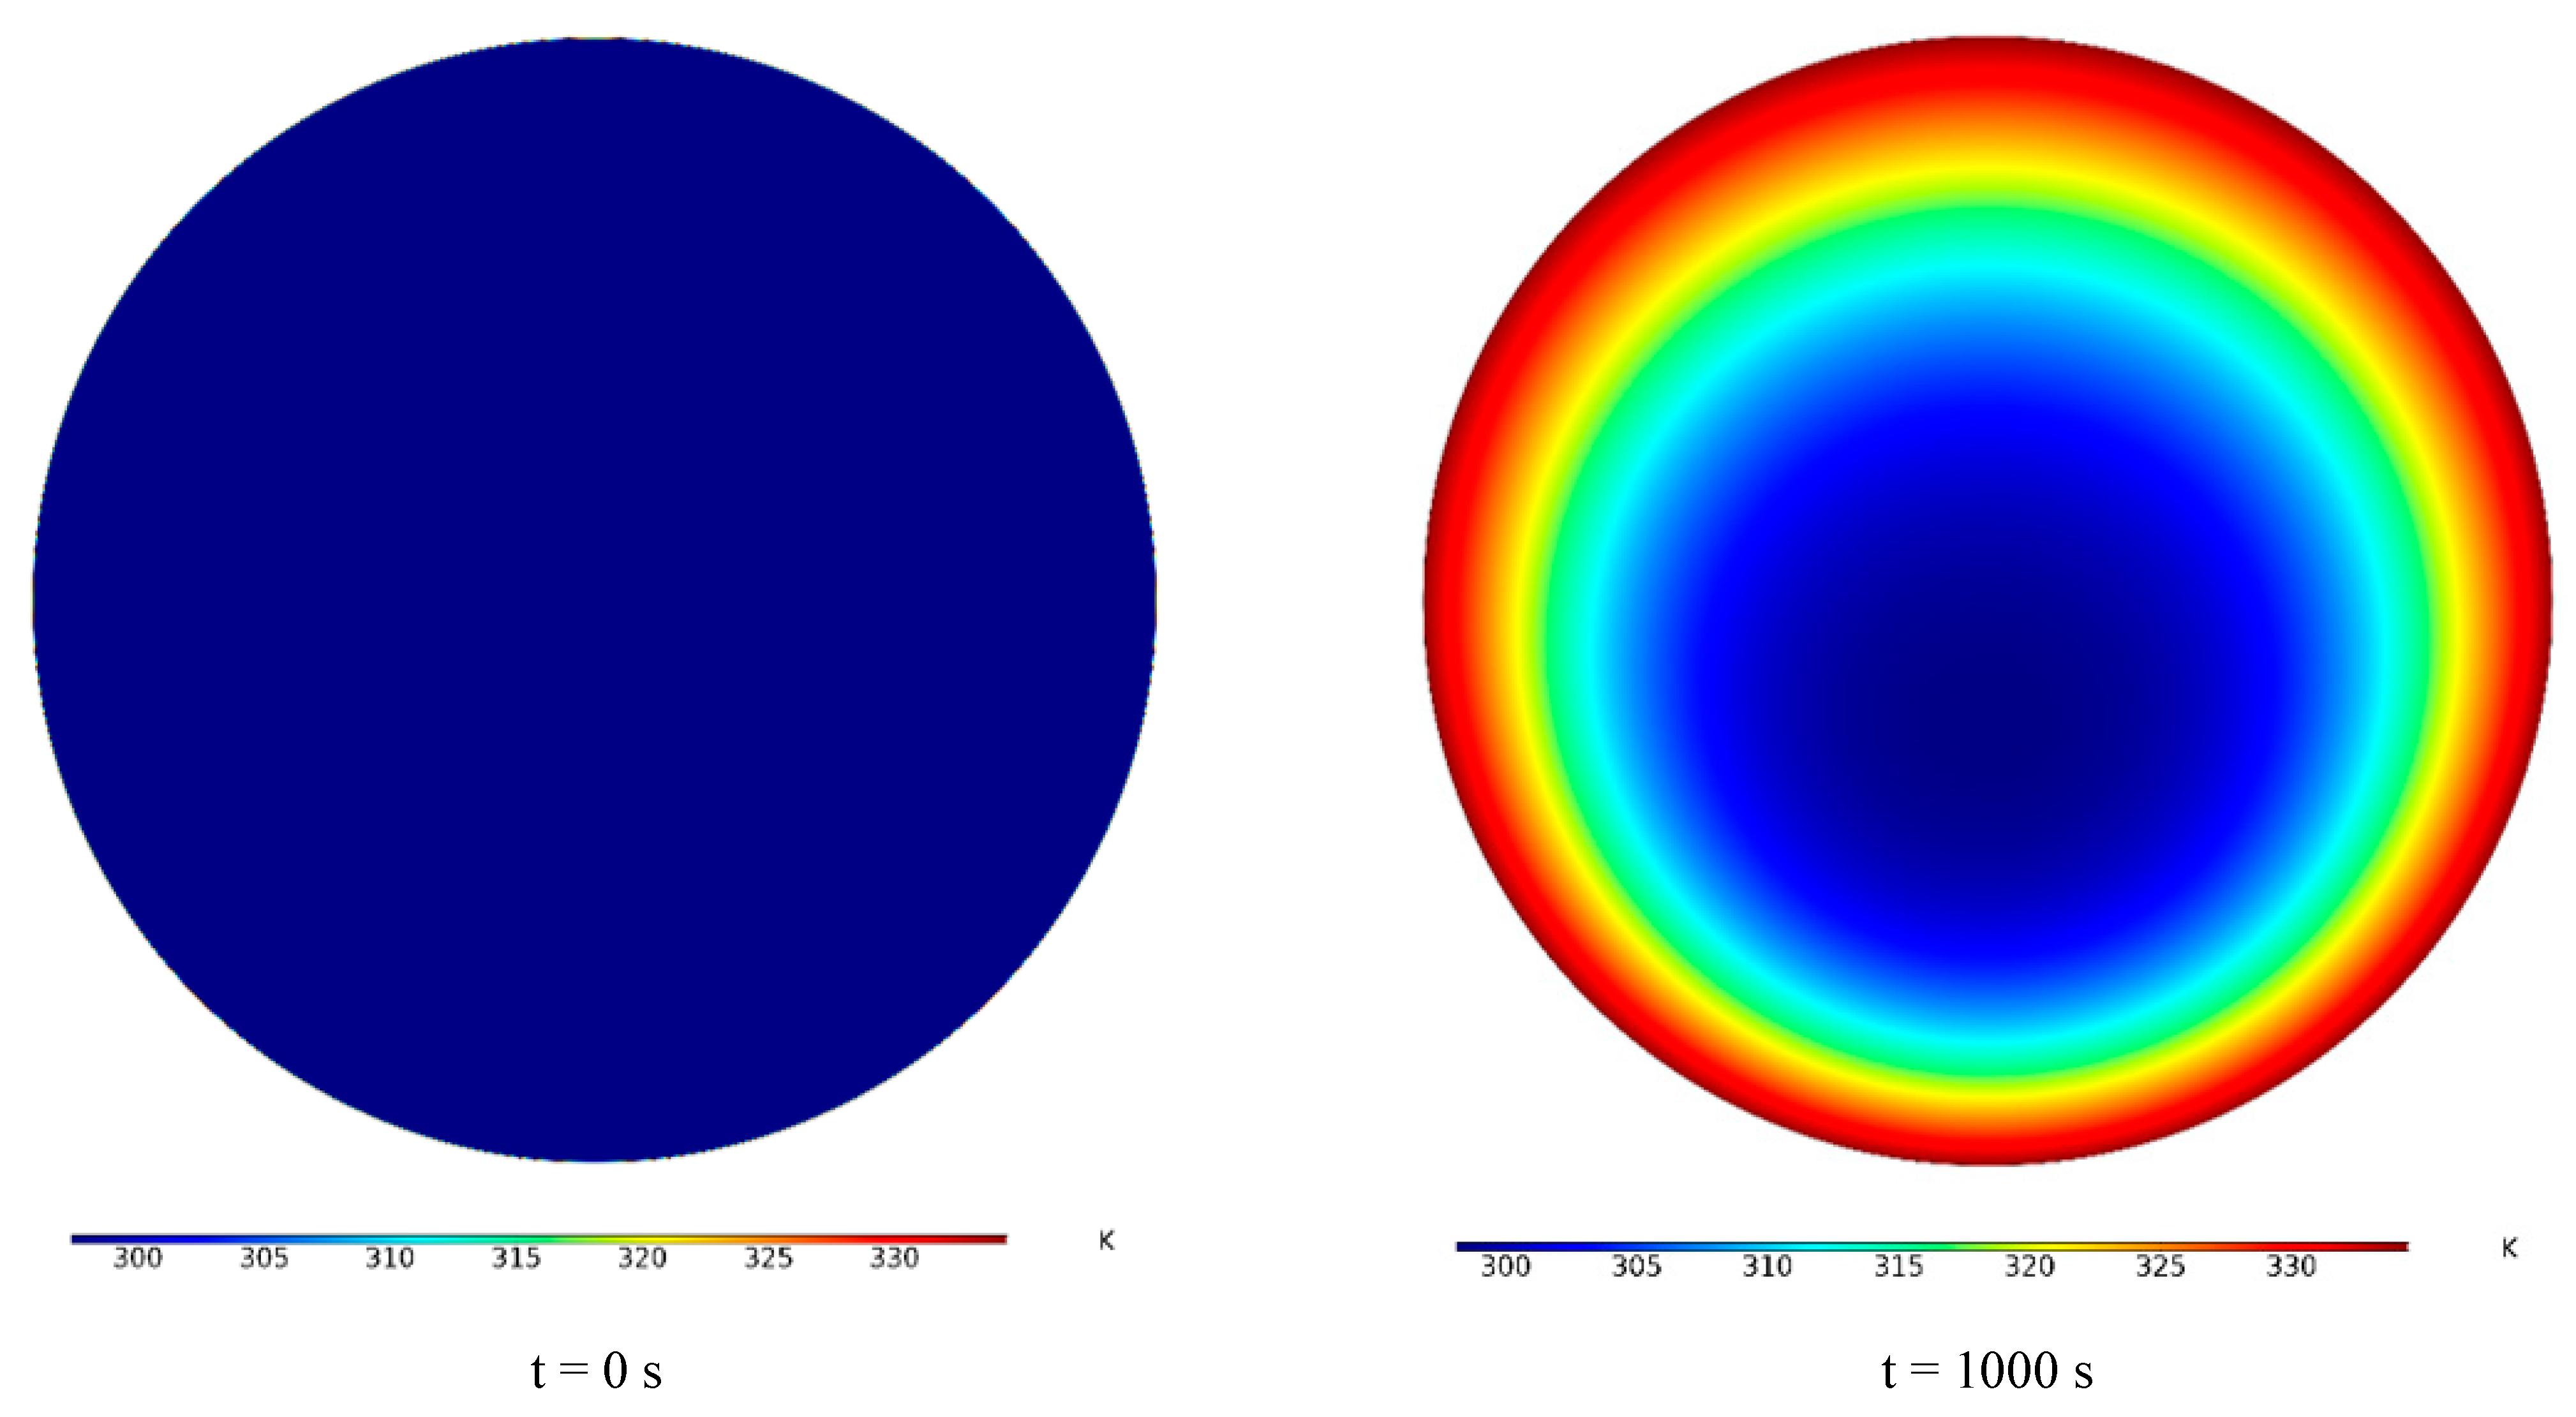
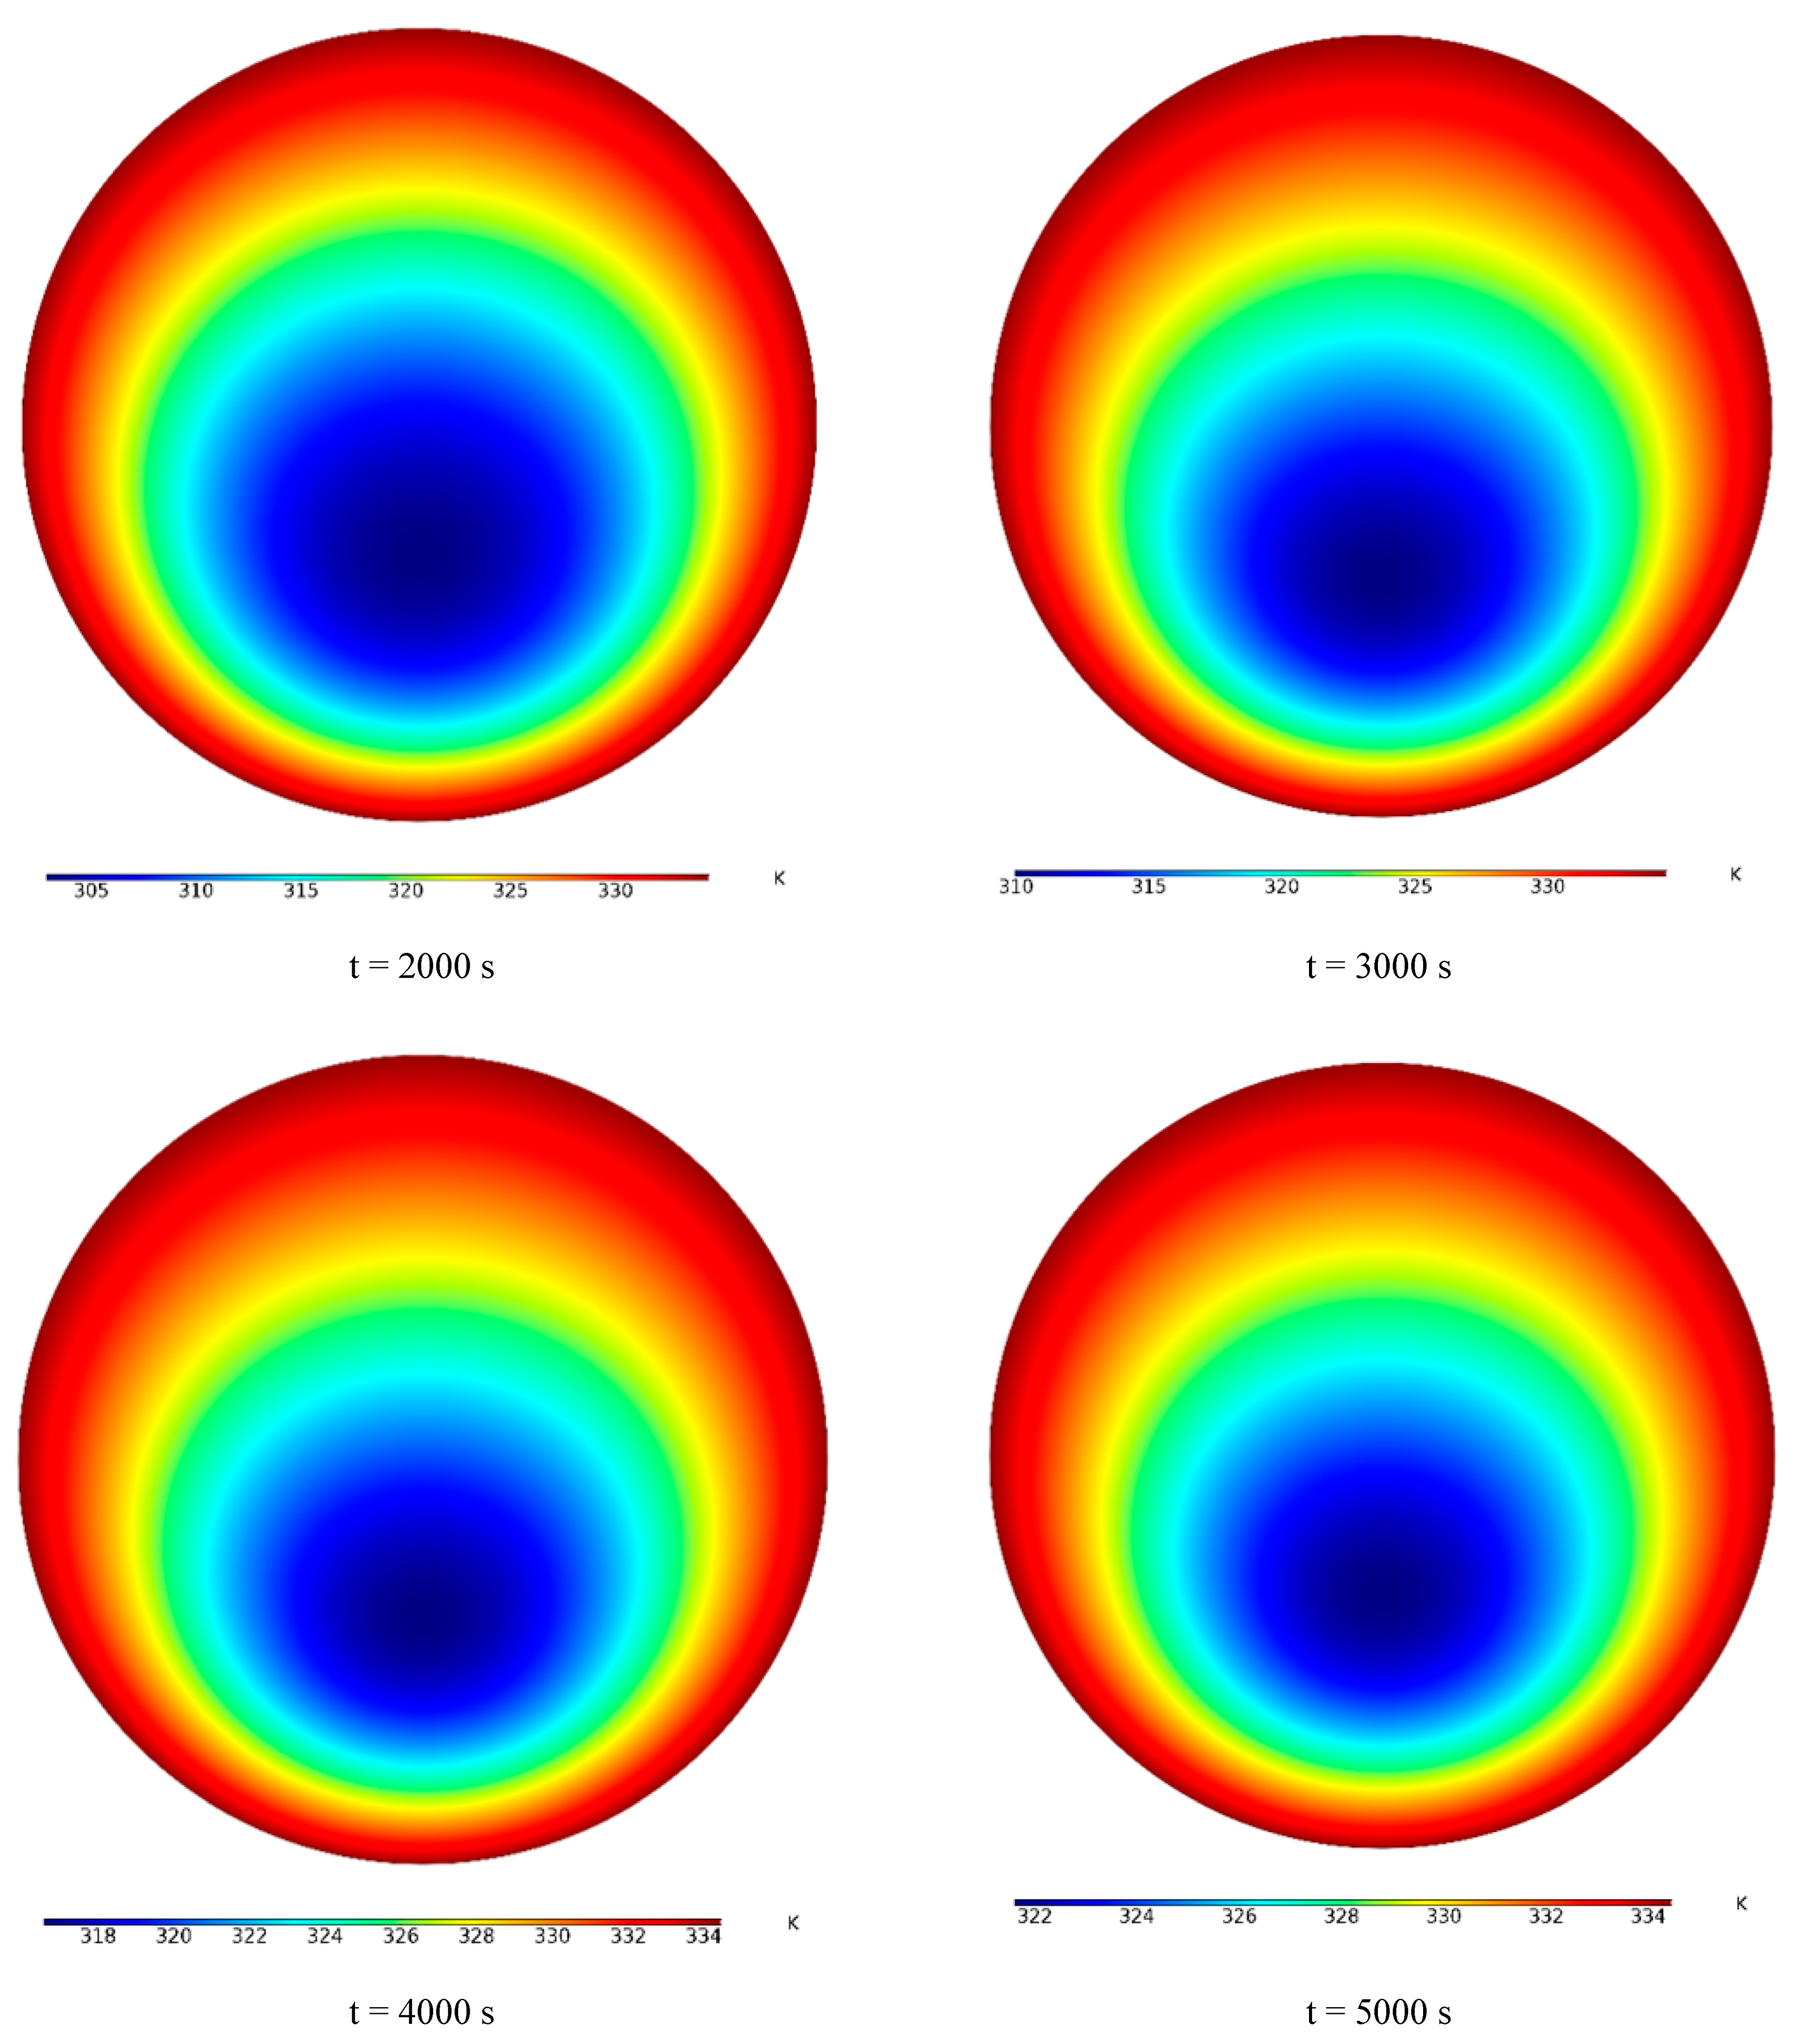
In the present study, the Rayleigh number is 5.3 × 10⁸, indicating the turbulence flow regime. Thus, the k-ε realizable model is used. The continuity, momentum, and energy equations are as follows, respectively.
ρ t + x i ( ρ u i ) = 0
t ( ρ u i ) + x i ( ρ u i u i ) = p x i + x i [ μ ( 2 S i j 2 3 δ i j u k x k ) ] + x k ( ρ u i u j ¯ )
ρ c p T t + x i [ u i ( ρ E + p ) ] = x j [ k e f f T x i + u i ( τ i j ) e f f ]
where k e f f (W/mK) is the effective thermal conductivity, ( τ i j ) e f f (N/m2) is the effective stress tensor, and μ e f f (Pa.s) is the effective viscosity. The fluid motion is due to natural convection due to the body force applied on the fluid and the creation of a density gradient, resulting in the buoyancy force. The gradient of density is due to the gradient of TEM, and the body force is due to the gravitational acceleration. Because convective flow velocities are generally slower than forced convection, the convection heat transfer rate is also lower. The boundary layer of free convection is not limited to a laminar flow. Free convection flow is generally due to thermal instability, meaning that the warmer and lighter fluid moves upward and the colder and heavier fluid moves downward. However, hydrodynamic instability occurs in the flow similar to forced convection. Hence, small disturbances in the flow may be amplified, and the flow regime changes to a turbulent one. The conversion of the flow regime in the boundary layer of free convection depends on the ratio of the buoyancy force to the viscose force. The conversion of the flow regime is usually related to the Rayleigh number, which is defined as the product of the Grashof number and the Prandtl number [46].

3.2. PCM Equations

The three-dimensional thermal conductivity equation in PCM can be expressed as follows:
ρ ( c p T ) t = x ( k T x ) + y ( k T y ) + z ( k T z )
where c p = c e f f (T) (J/kg·K).
In this scheme, the L-H in the energy equation is modelled as an artificial behavior of specific heat within, where phase transition happens [47]. This amount of c e f f prevents the TEM from rising or lessening during the phase transition. Due to the nature of the artificial behavior, special attention should be paid to c e f f (T) to accurately predict the phase change kinetics and to accurately quantify the energy stored/released during charge/discharge (CHA/DCHA) cycles. The c e f f (T) CHA/DCHA curves empirically obtained for the PCM-based product have been measured in the imitations [48].
Equations (5) and (6) express the EHC method, respectively. The c m , K * and c m , K represent the maximum amounts of c e f f (T) due to L-H during melting, respectively. They also show that the c e f f (T) of PCM is directly proportional to the L-H of melting and inversely related to the melting TEM range, Δ T k during the phase change period. T 1 K is the starting melting TEM of PCM, and T 2 K is the TEM at which PCM is completely melted while CHA.
c e f f ( T ) = c m , K *   ,   T 1 K < T < T 2 K   ;   K = m , s
c e f f ( T ) = { c p , s + c m , K c p , s T K T 1 K ( T T 1 K ) ,     T 1 K < T < T K ; c m , K + c p , l c m , K T 2 K T K ( T T K ) ,     T K < T < T 2 K ;                 K = m , s
c m , K * = L K Δ T K + c p , s + c p , l 2 ;   c m , K = L K , Δ T K + c p , s + c p , l 2 ;   Δ T K = T 2 K T 1 K ;   K = m , s .
Equation (6) is used to simulate CHA and DCHA modes. Equation (7) is replaced by Equation (8).
c m , K = 2 L K + c p , s   Δ T 2 K + c p , l   Δ T 1 K   Δ T K ;   K = m , s
According to Liu et al. [35], the EHC method does not work well in solving phase-change problems that have a very low phase change TEM range and cannot be used for the cases where phase change occurs at a constant TEM. Saadi and Zhai [19] also stated that to ensure accuracy and consider the L-H, fine-grid and small-time steps are needed. Time steps must be limited to ensure the accuracy of the simulation, because due to the low-TEM range of the phase change, the c e f f changes rapidly. Another important aspect of this method is its flexibility in defining the c e f f only by changing the values of c p , s , c p , l , T K , T 1 K , T 2 K , and L K during CHA and c p , s , c p , l , T s , T 1 s , T 2 s , and L s during DCHA. Finally, the TEM is the only dependent variable that is solved in the EHC method. This method allows using the same governing equations (Equation (4)) for liquid and solid phases apart from tracking the position of the melting zone. In fact, the melted PCM fraction is explicitly the average calculated for each time step as a function of the calculated TEM T as follows:
f ( T ) = { 0 ,   T T 1 K f K ( T T 1 K Δ T 1 K ) , T 1 K < T < T K   f K + ( 1 f K ) ( T T 1 K Δ T 2 K ) , T K T < T 2 K 1 ,   T T 2 K                                 K = m , s .
f K = Δ T 1 K Δ T K ;   K = m , s .
Equation (9) is used for the CHA and DCHA processes of EHC using artificial profiles of c e f f ( T ) and AHS. At the time of determining f k and f s using Equation (10), the results are reported as a downward deviation of f(T) in the two-phase region. However, this two-part equation is retained for more general reasons. For example, in cases where the PCMs have different values of f K and f s , the model maker may want to specify such maximum values, especially of the melt fraction.
The value of c e f f is known for each TEM at any time in the simulations by using c e f f ( T ) obtained from the experimental measurements. Therefore, for a given TEM range of T 2 T 1 that is small enough to consider a constant average value of c e f f in the molten PCM during CHA mode, the following relation can be obtained:
f 2 = f 1 + 1 L m ( c e f f 1 + c e f f 2 2 )   ( T 2 T 1 )
When the PCM is in solid phase T T 1 K ، f(T) = 0. When T T 2 K (molten state), f(T) = 1. To simulate PCM CHA and DCHA processes at the TEM range of T 1 s , T 2 s , the term L m in Equation (11) must be replaced by the terms L s and f(T) = 0 (when T T 1 s ) and f(T) = 1 (when T T 2 s ).
The values of heat flux applied on the Tr-W are given in Table 3 at different hours of the day in winter and summer.

4. Numerical Method, Boundary Conditions, Validation, and Grid Study

Since in any numerical analysis, grid independence is necessary, the simulations are first performed for different grid resolutions. Then, the grid with 1,675,460 nodes is selected for the solutions. Table 4 shows an example of studies performed on the number of grid points for the outlet TEM of the Tr-W to clarify the accuracy of the selected mesh in the presence of PCM at noon in the summer when the size of the hole is 17.5 cm.
After generating the grid and applying the boundary conditions on the geometric surfaces using the software, the grid is imported by industry-leading fluid simulation software. Then, the problem is simulated by solving the governing equations (Equations (1)–(3)), applying the boundary conditions, and employing the Boussinesq approximation. The control volume method is used to solve the equations. There is also a separate solution on the geometry of the PCM-filled tube for a more accurate solution. To solve the problem for each different hour of the day, the amount of heat flux and other boundary conditions are imposed on the wall, and the results are obtained. One of the boundary conditions used for the wall is a constant thermal flux. Additionally, the TEM of the air entering the Tr-W is always considered to be 23.5 °C. The boundary condition of the exit from the Tr-W hole is also considered to be a constant pressure equal to the amount of room air pressure, i.e., 1 atm. The tube that is filled with PCM is placed in the wall, and the process is simulated separately using a constant TEM boundary condition.
In this paper, the volume control method is used to algebraize the differential equations. In this method, different terms of the differential equation are written algebraically at different points of the solution domain. For this purpose, the solution field is first divided into a number of control volumes in such a way that each node is surrounded by a control volume, and at the same time, the control volumes do not have common volumes with each other. The differential equation is then integrated into each volume control. To calculate integrals, it is sometimes necessary to assume functions for dependent variables. Thus, algebraic equations created satisfy the conservation of mass, energy, and momentum and are consistent with the physics of the problem. The advantage of using the control volume method is that the conservation law is established for quantities such as mass, momentum, and energy in each control volume. This is valid for all nodes and even when the number of nodes decreases. Therefore, even the answer for the large grid leads to the exact balance. Thus, the solution domain is of particular importance. The algebraic steps in the control volume method are as follows:
  • Selection of the appropriate control volume;
  • Integration of the equation on the control volume;
  • Selection of the appropriate profile on the control volume;
  • Extraction of an algebraic equation.
The simulations are verified by comparing the present results with the experimental results of Attalla et al. [49] who studied a Tr-W. To compare two works, the amount of wall TEM in the middle of the wall is compared at different times of the day (Table 5). It can be seen that the wall TEM results are close to each other under constant conditions.

5. Results and Discussion

Initially, PCM melting contours in the tube are presented. Figure 4 shows the PCM melting contours at different times from 0 to 5000 s. It can be seen that the PCM inside the tube begins to melt over time. Melting starts from the outer surface of the tube and moves inwards. First, the upper parts of the pipe are melted, and then, parts of solid PCM are melted at the bottom of the tube due to free convection in the PCM. It can be seen that the entire PCM is not melted after 5000 s from the beginning of the process, which is due to the large diameter and volume of the PCM inside the tube. This can cause the freezing time to be longer. Hence, the heat is transferred from the tube to the air inside the wall for a longer time.
Figure 5 demonstrates the TEM contours of a PCM-filled tube from 0 to 5000 s with a time interval of 1000 s. It is seen that the tube is full of cold PCM, and its TEM is uniformly cold. In this case, all PCM inside the tube is solid. It can be seen that the outer wall is heated due to solar radiation, leading to that the PCM is melted. The hot TEM created in the wall of the tube enters the tube over time and heats all the PCM inside it. Then, more of the tube space is marked by the red-color contour. Additionally, the middle parts of the PCM inside the tube remain solid and not melted over time. In this area, the tube is still cold and the PCM is solid.
Figure 6 shows the TEM in three parts of the wall, including the outlet, the absorber plate, and the glass at different times of the day with and without PCM in the summer. Since radiation is directly related to the TEM of different points, the amount of TEM during the day is enhanced with the radiation. As time passes and the amount of solar radiation is reduced, the amount of wall TEM decreases. Another important point is the strong dependence of the outlet TEM on the absorber plate TEM. Therefore, as the TEM of the adsorbent plate is enhanced, the outlet TEM increases. Additionally, since the PCM is used on the back of the absorber plate, the TEM of the absorber plate has the highest value for all cases. Therefore, the output TEM is in the best condition. It can be seen that the use of PCM causes the TEM to reduce in the morning, but on the other hand, the outlet TEM as well as the TEM of the absorber plate and glass increase in the afternoon. Especially, the increment in the outlet TEM in summer makes the airflow in the Tr-W faster, and as a result, more airflow exits from the house.
Figure 7 illustrates the TEM in three parts of the wall, including the outlet, the absorber plate, and the glass at different times of the day with and without PCM in the winter. It can be seen that all TEMs are reduced due to the reduction in solar radiation. The presence of PCM causes the wall TEMs, especially the outlet TEM in the afternoon, to rise, and the wall is able to heat the house for more hours. Since the PCM is located in the tube inside the Tr-W and the solar heat flux is reduced in winter, the PCM reaches the threshold of a melting point later. The operation of the Tr-W with PCM is a function of the radiation intensity of the region. Thus, the PCM used in the wall should be selected based on the radiation intensity and TEM to employ the maximum L-H energy of the PCM.
Figure 8 shows the outlet TEM variations of the Tr-W for different dimensions of the wall hole without PCM at different times of the day in summer. The size of the hole is such that both valves become equally smaller in both cases. In the first case, the length of the inlet and outlet valves is 70 cm. In the next two cases, the length is 35 cm and 17.5 cm. For all cases, the width is kept constant as 20 cm. In each case, the size of the hole is halved compared to the previous case. As can be seen, the smaller the outlet valve, the higher the TEM. At 2 P.M., the rate of TEM enhancement from a 70 cm hole to a 35 cm hole is 3.7% and from a 35 cm hole to a 17.5 cm hole is 3.2%. The reason for this is the reduction in pressure at the outlet section. Additionally, the enhancement in the velocity accelerates the vortices, which improves the heat transfer.
Figure 9 depicts the effect of the size of the outlet and inlet valve on the outlet TEM of the wall at different times of the day in the presence of PCM. The presence of PCM enhances the velocity in this region and improves heat transfer, leading to an increase in the outlet TEM of the fluid. It should be noted that a reduction in the valve size reduces the minimum velocity of vortices, which can be a reason for an increment in the outlet TEM in smaller valves. It can be observed that the decrease in the size of the hole leads to an increase in the outlet TEM.
Figure 10 illustrates the outlet TEM variations from the Tr-W for different dimensions of the wall hole in the presence of PCM at different times of the day in winter. The TEM at the wall outlet is reduced due to the reduction in solar radiation in winter. In the middle hours of the day, the amount of radiation is higher, and therefore, the output TEM is higher. It is seen that the smaller the hole in the wall, the higher the outlet TEM of the air from the wall.
The effect of the size of the outlet and inlet valve on the outlet TEM of the wall is presented in Figure 11 for different times of the day in the presence of PCM. Adding PCM to the wall reduces the amount of output TEM in the morning but increases the amount of output TEM in the afternoon. It can be seen that the shrinkage of the air outlet hole also enhances the amount of TEM in the outlet of the wall. At 2 P.M., the increment in the TEM from a 70 cm hole to a 35 cm hole is 4.5% and from a 35 cm hole to a 17.5 cm hole is 3.7%.

6. Conclusions

In this paper, a Tr-W is simulated in winter and summer with a tube filled with a PCM. The analysis is done for the climate. The effective parameters include the size of the Tr-W holes, as well as the presence or absence of PCM in winter and summer days at different times of the day. The results of this study are as follows:
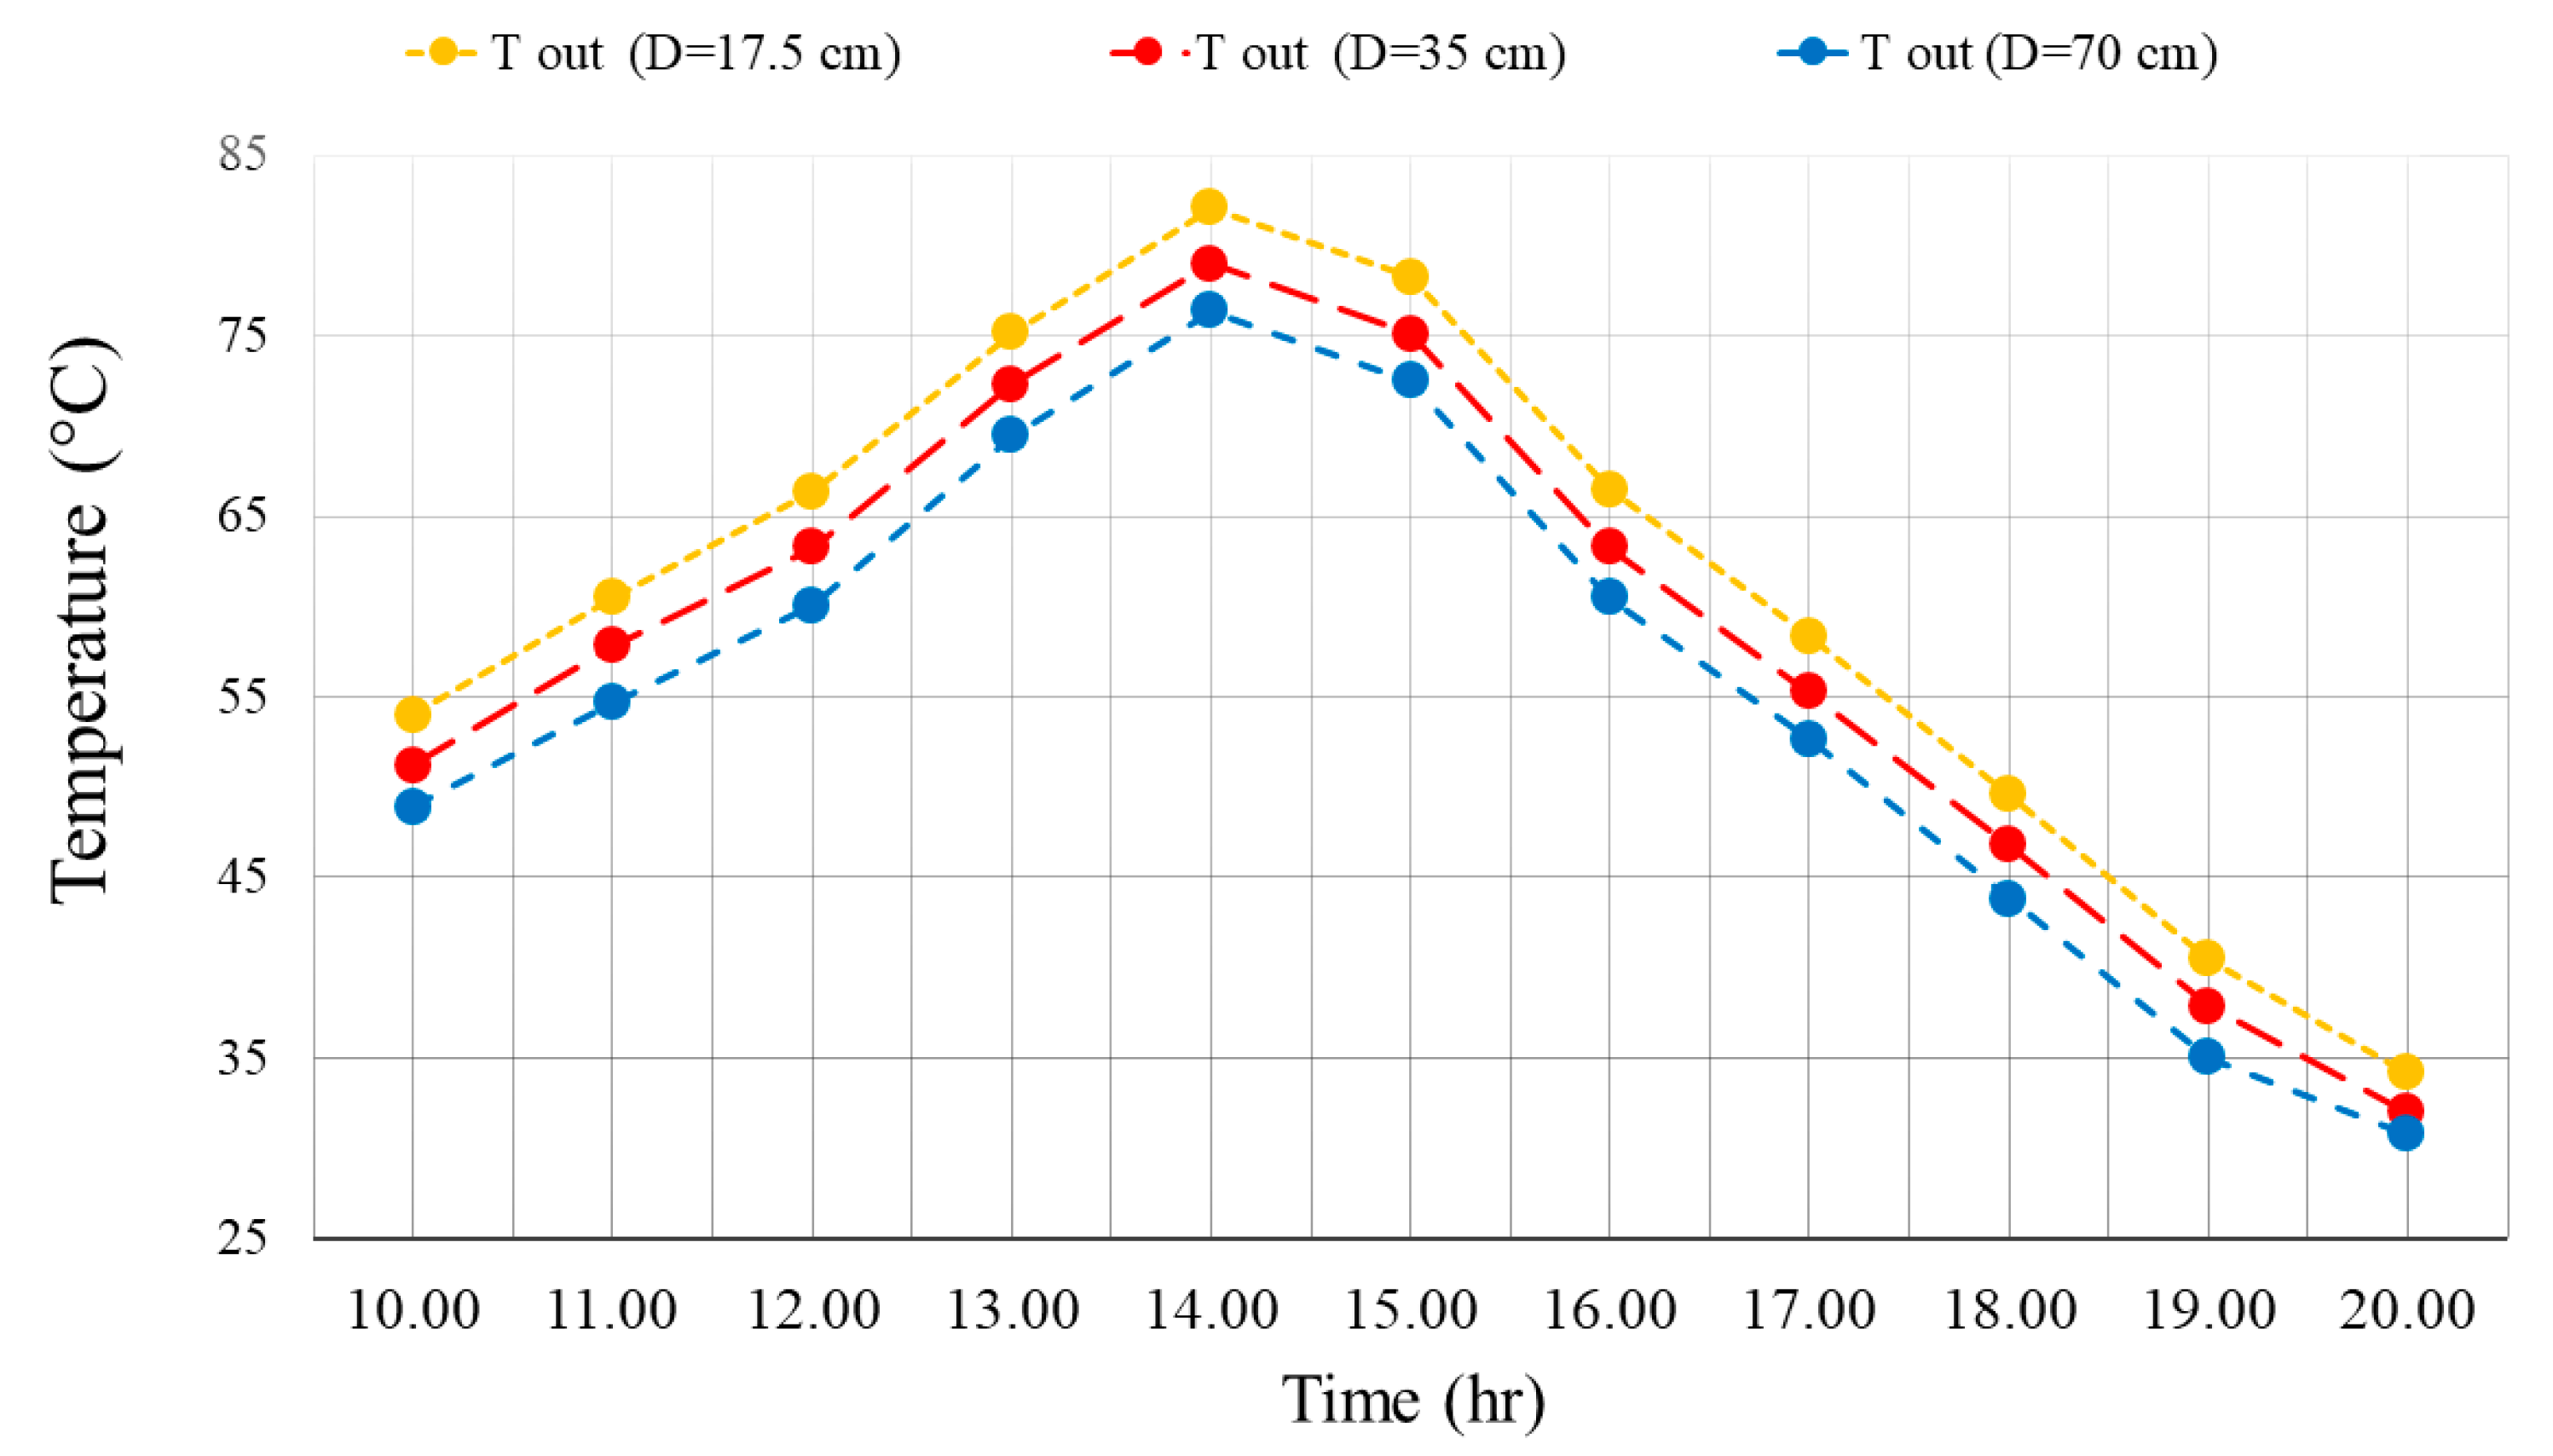
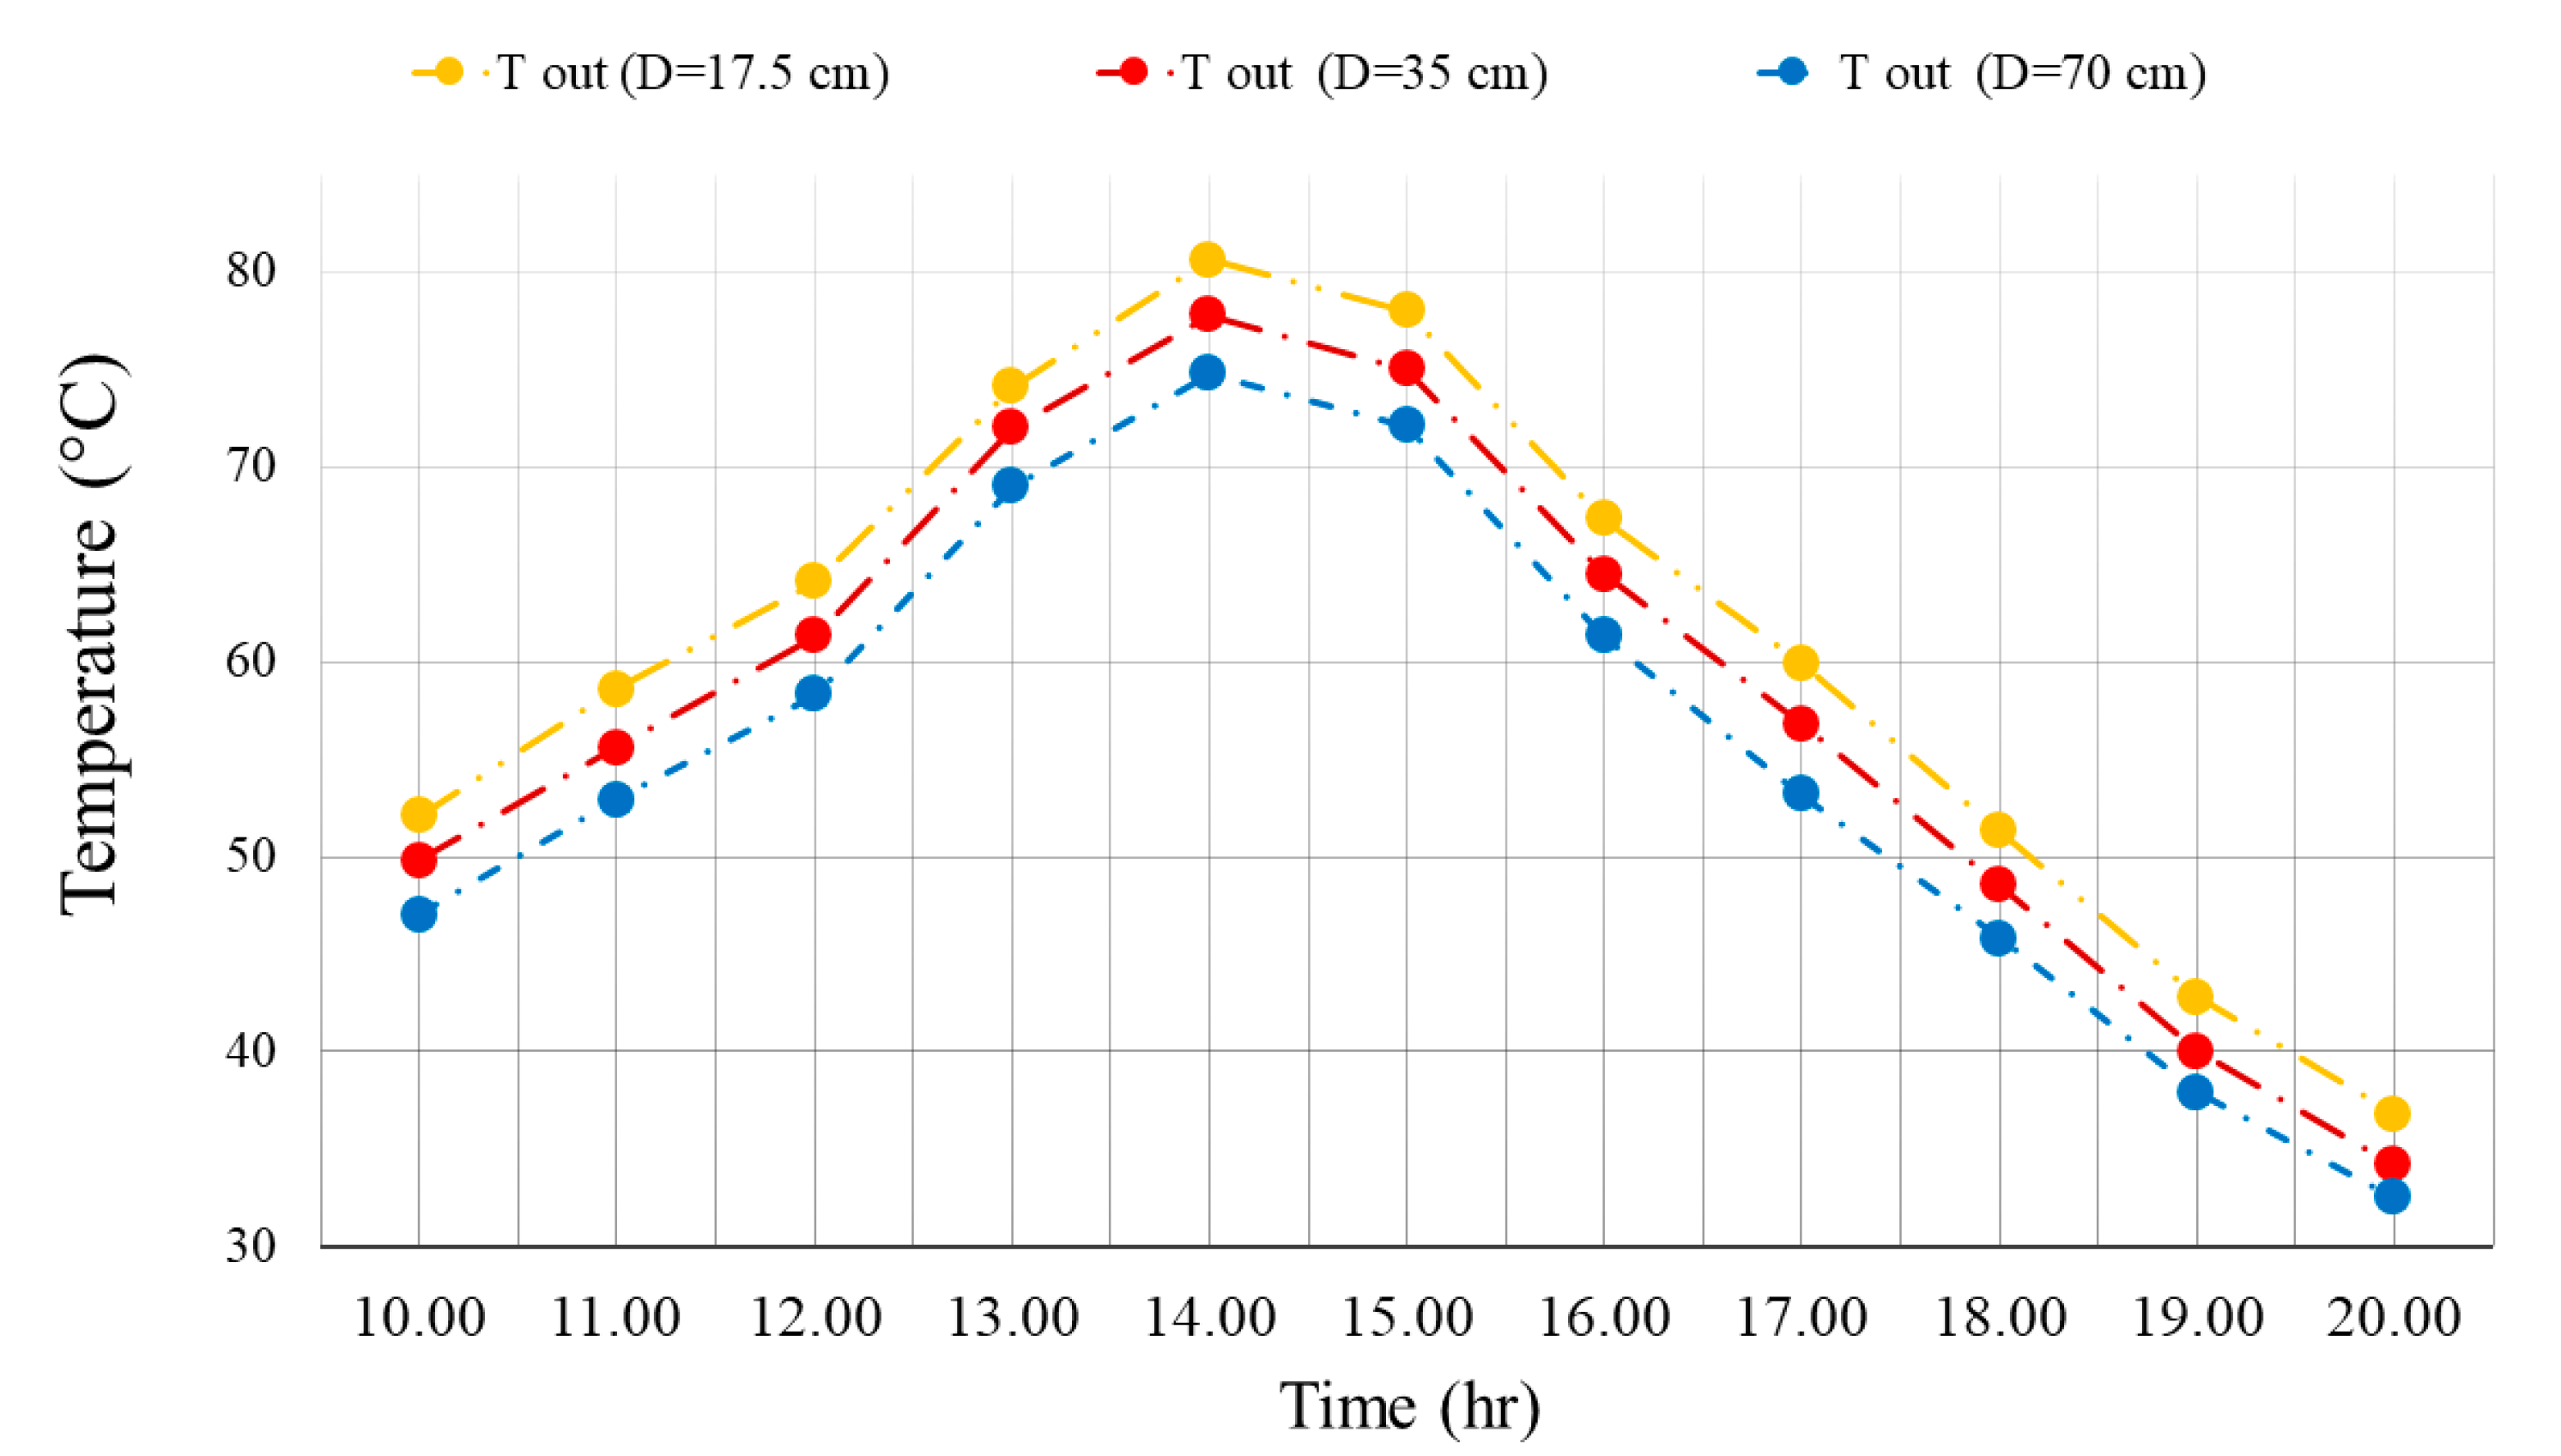
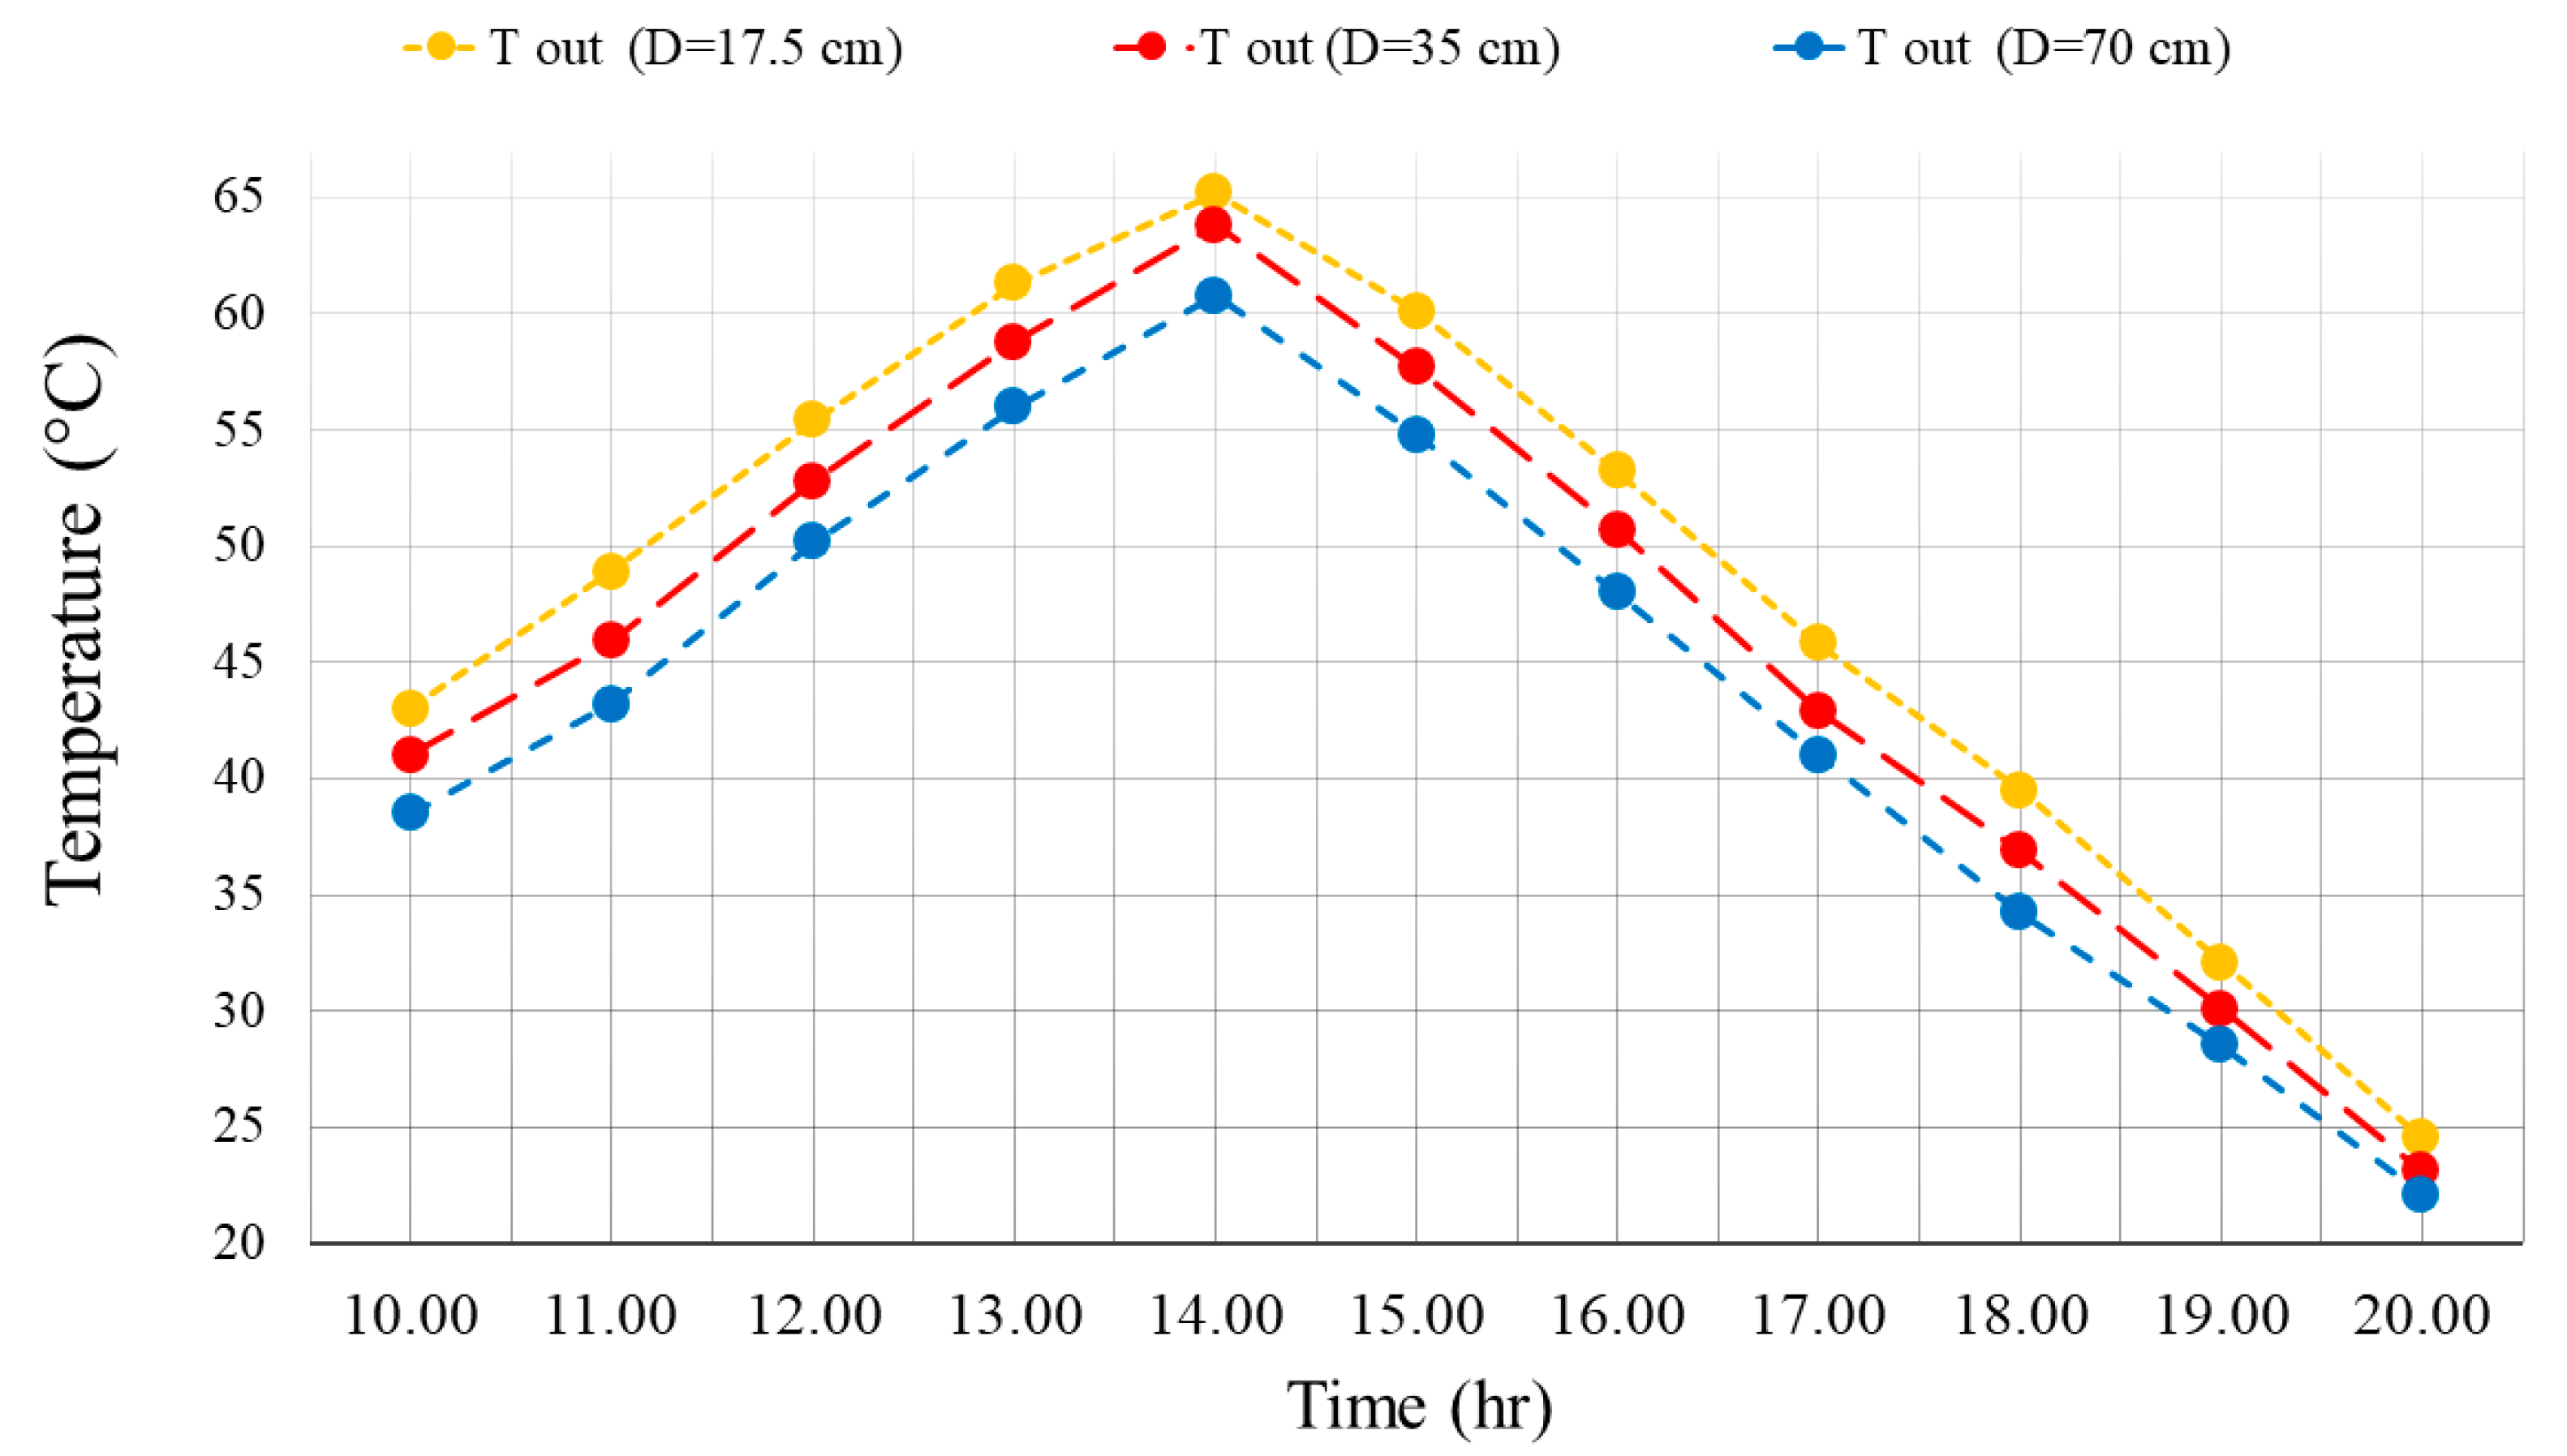
  • The Tr-W can provide air with maximum TEM s of 82.1 and 65.2 in summer and winter, respectively.
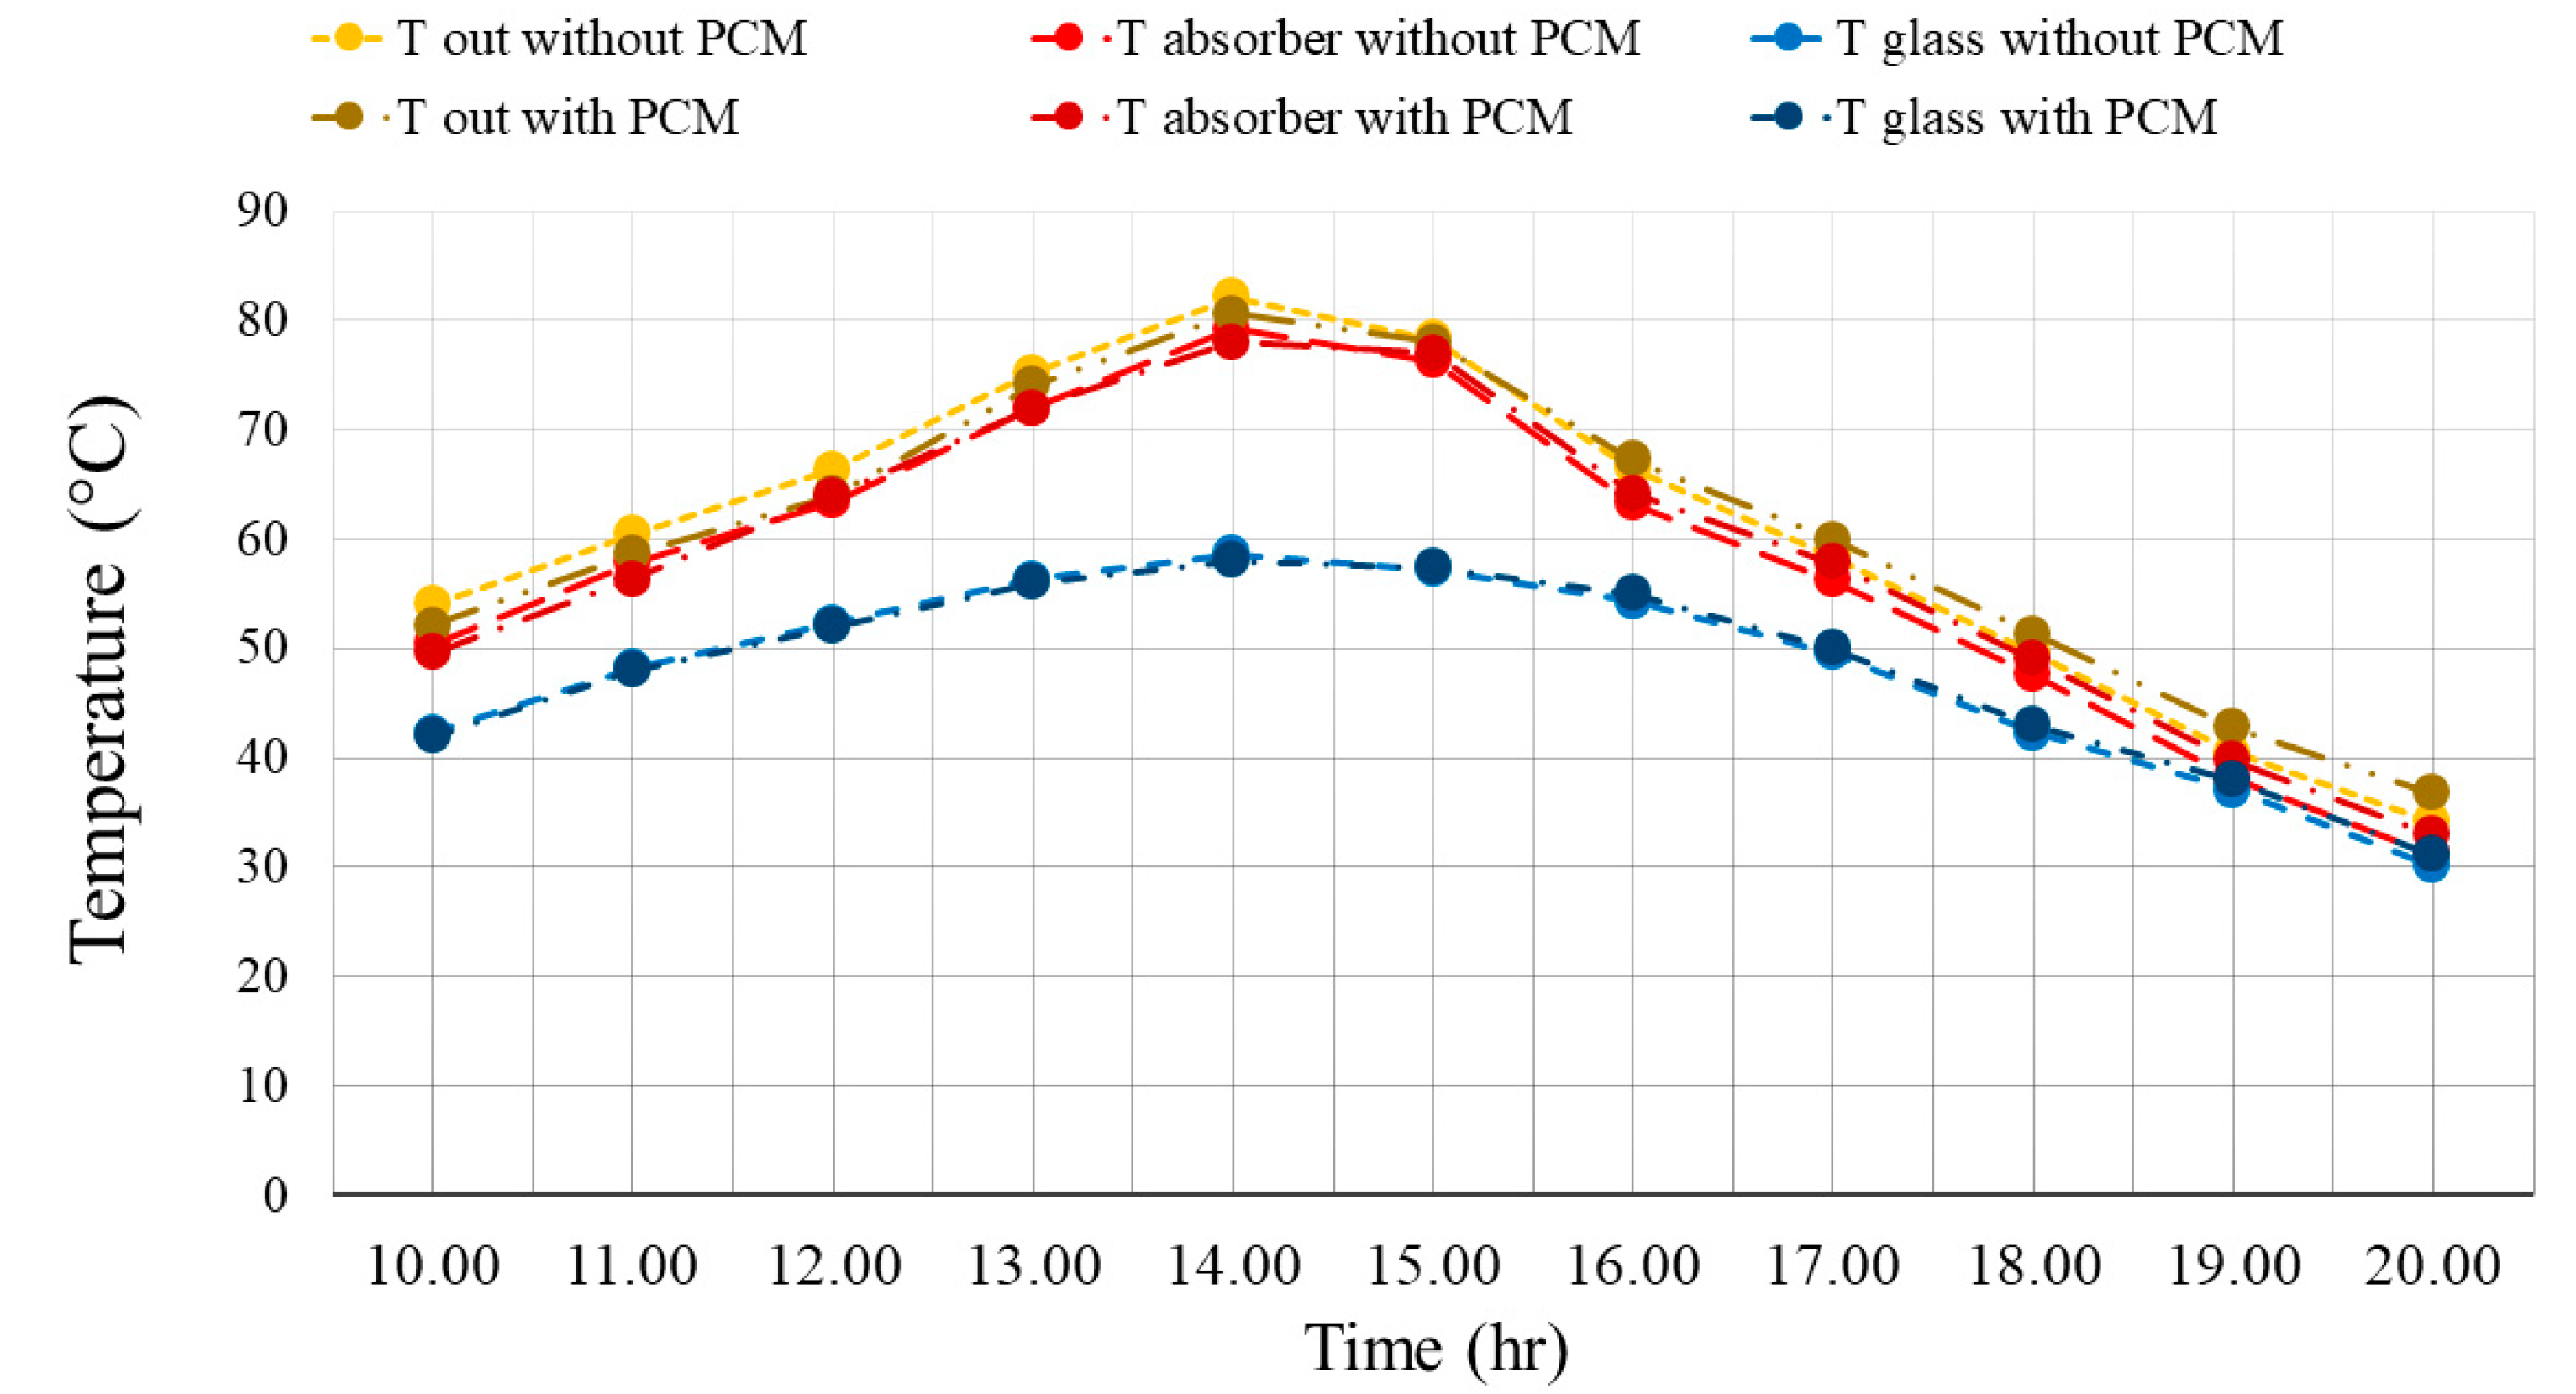
  • The use of PCM in a tube placed in the wall of the Tr-W causes the TEM of the absorber plate and the outlet air to reduce before noon, but these TEM s are enhanced in the afternoon.
  • Maximum TEM of the absorber plate, glass on the Tr-W, and the outlet air takes place at 2:00 P.M. in winter and summer.
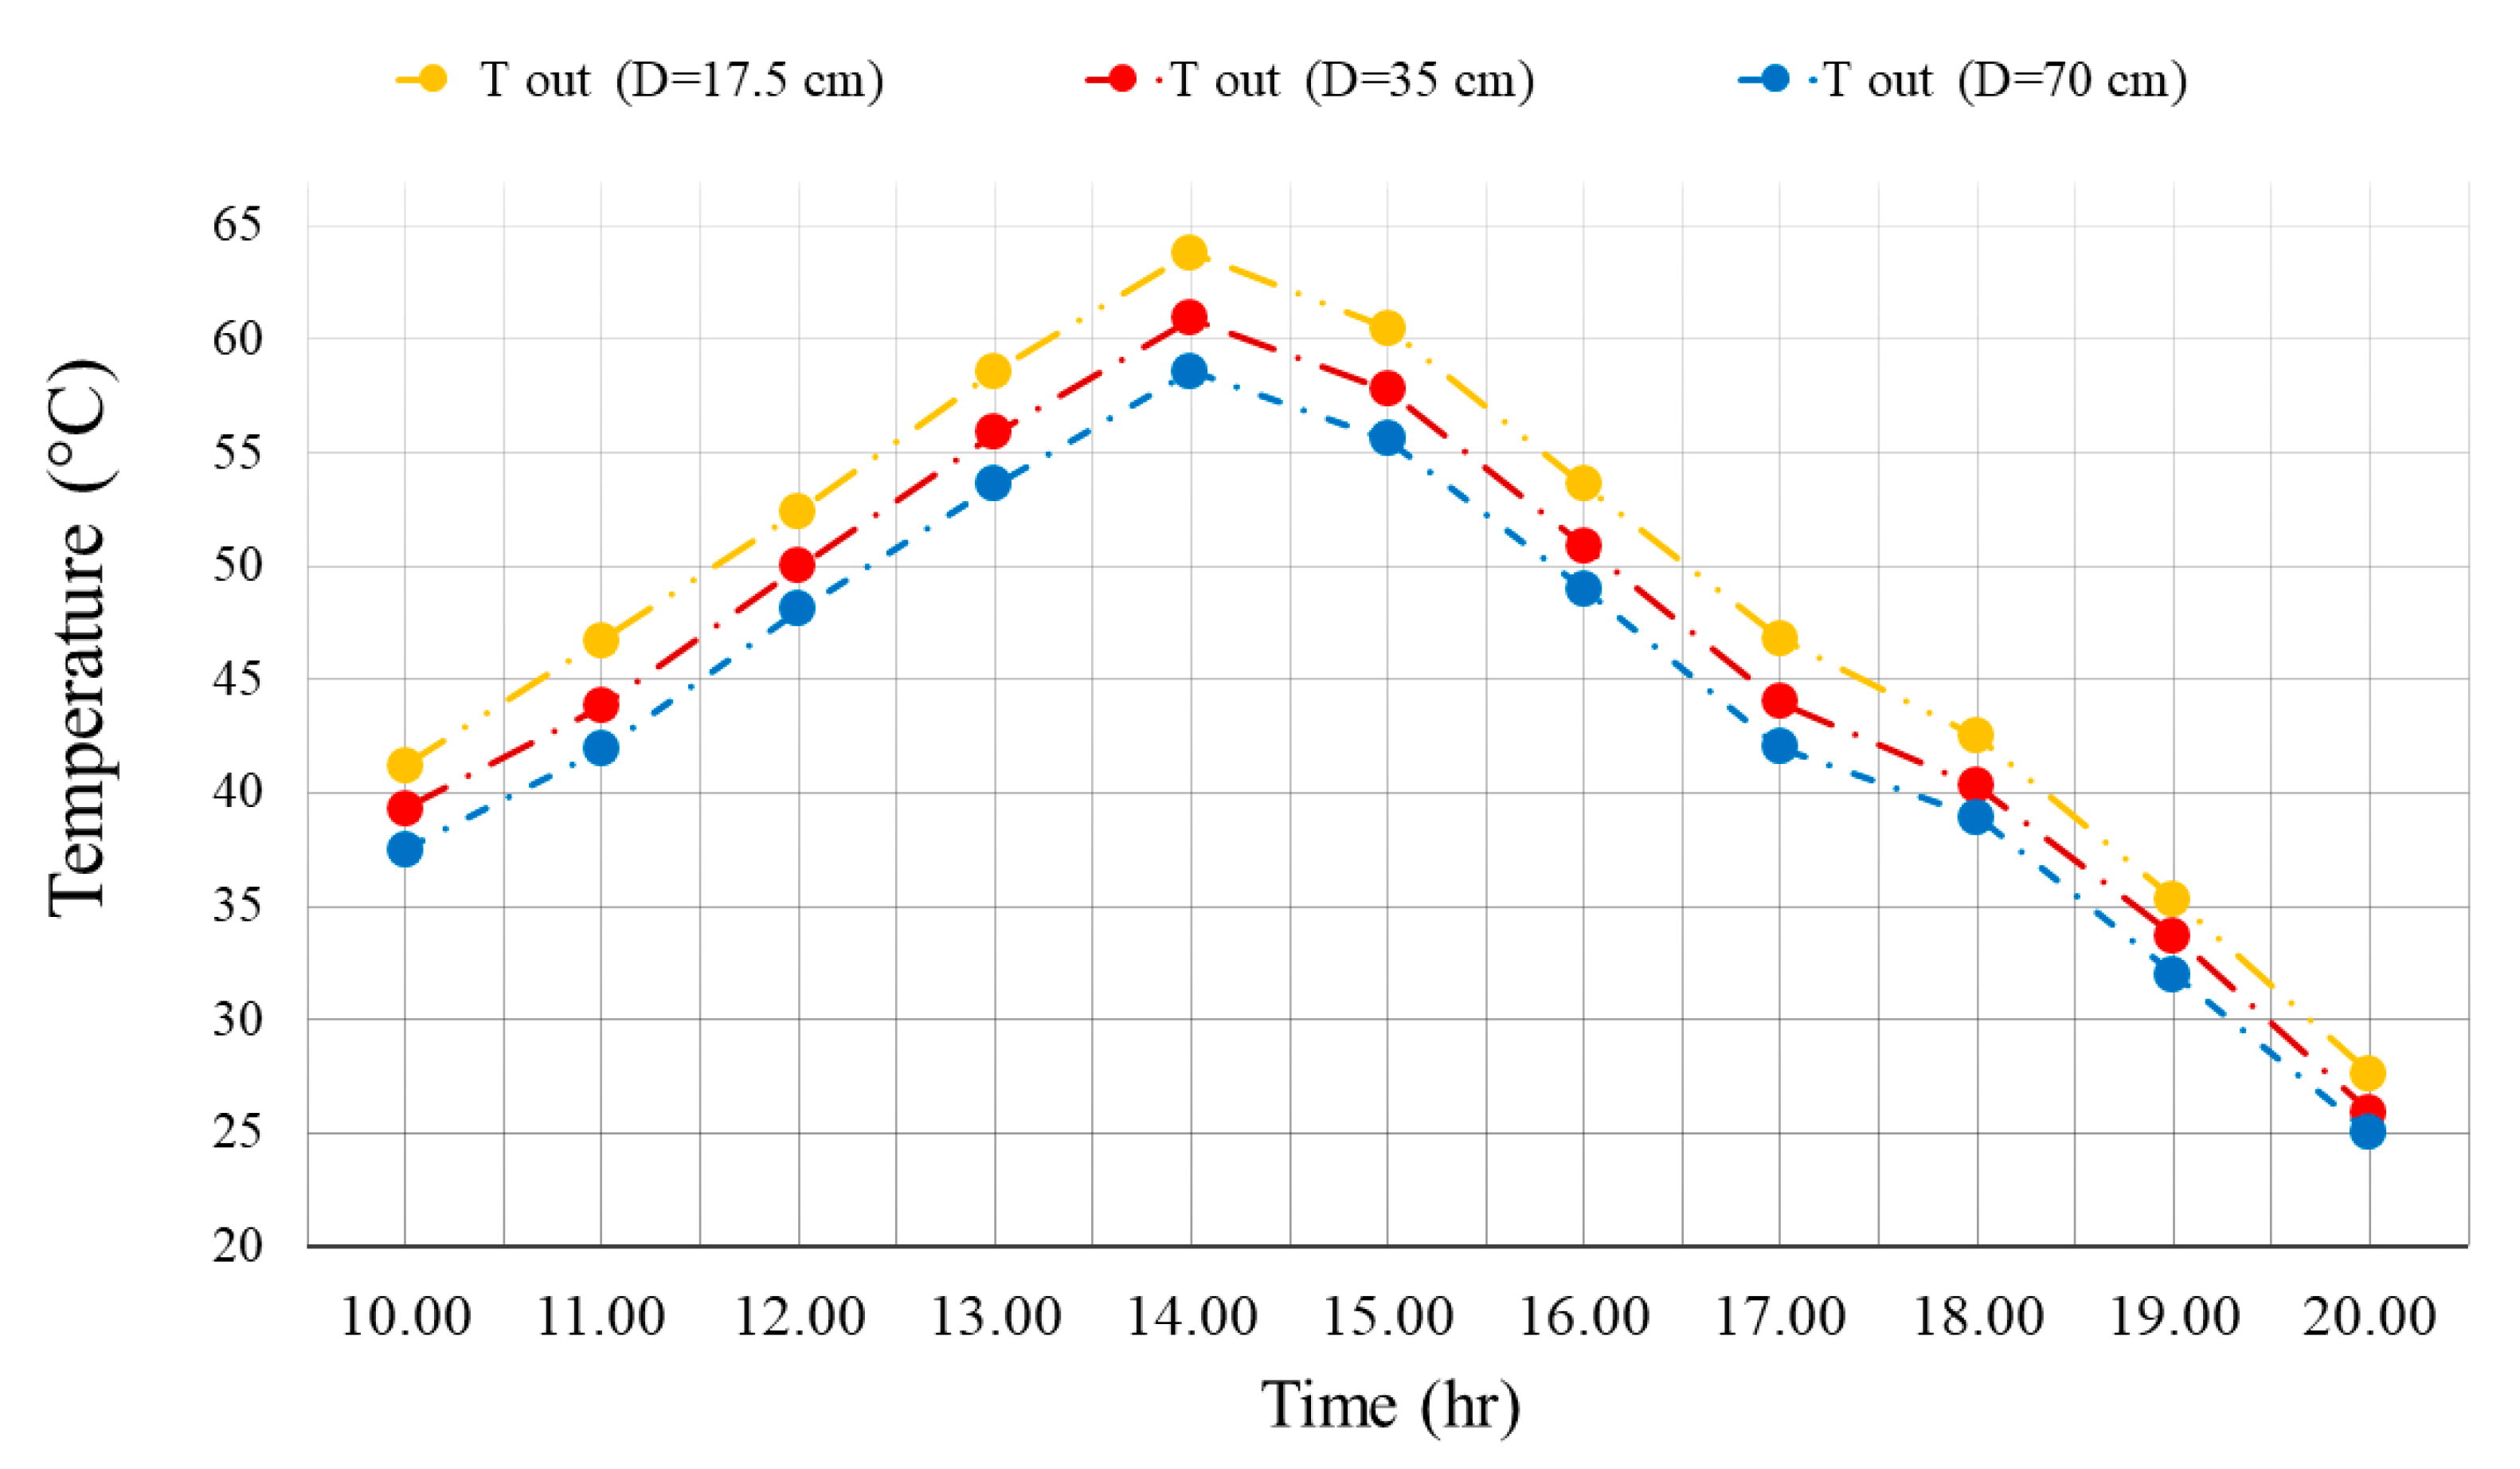
  • Reduction in the size of the hole in the Tr-W enhances the amount of outlet TEM of the wall. The increment in wall size from 70 to 17.5 cm is 8.1% and 6.7% with and without PCM, respectively, for the peak of solar radiation in summer. This enhancement is 7.2% and 6.9% with and without PCM, respectively, in winter.

Author Contributions

Conceptualization, Y.K.; Data curation, Y.K. and A.A.A., A.H.A.; Formal analysis, Y.K., A.A.A., A.H.A.; Investigation, Y.K.; Methodology, Y.K., A.A.A., A.H.A.; Supervision, Y.K., M.S., J.P.M. and G.C.; Writing—original draft, Y.K., A.A.A., A.H.A.; Writing—review & editing, M.S., J.P.M. and G.C. All authors have read and agreed to the published version of the manuscript.

Funding

This research received no external funding.

Institutional Review Board Statement

Not applicable.

Informed Consent Statement

Not applicable.

Data Availability Statement

Not applicable.

Acknowledgments

The authors would like to thank the Taif University for funding this work through Taif University Research Supporting, Project number. (TURSP-2020/277), Taif University, Taif, Saudi Arabia.

Conflicts of Interest

The authors declare no conflict of interest.

References

  1. Pordanjani, A.H.; Aghakhani, S.; Afrand, M.; Mahmoudi, B.; Mahian, O.; Wongwises, S. An updated review on application of nanofluids in heat exchangers for saving energy. Energy Convers. Manag. 2019, 198, 111886. [Google Scholar] [CrossRef]
  2. Pordanjani, A.H.; Aghakhani, S.; Afrand, M.; Sharifpur, M.; Meyer, J.P.; Xu, H.; Ali, H.M.; Karimi, N.; Cheraghian, G. Nanofluids: Physical phenomena, applications in thermal systems and the environment effects- A critical review. J. Clean. Prod. 2021, 320, 128573. [Google Scholar] [CrossRef]
  3. Aghakhani, S.; Pordanjani, A.H.; Afrand, M.; Sharifpur, M.; Meyer, J.P. Natural convective heat transfer and entropy generation of alumina/water nanofluid in a tilted enclosure with an elliptic constant temperature: Applying magnetic field and radiation effects. Int. J. Mech. Sci. 2020, 174, 105470. [Google Scholar] [CrossRef]
  4. Yan, S.-R.; Aghakhani, S.; Karimipour, A. Influence of a membrane on nanofluid heat transfer and irreversibilities inside a cavity with two constant-temperature semicircular sources on the lower wall: Applicable to solar collectors. Phys. Scr. 2020, 95, 085702. [Google Scholar] [CrossRef]
  5. Li, X.; Yang, H.; Zhang, J.; Qian, G.; Yu, H.; Cai, J. Time-Domain Analysis of Tamper Displacement during Dynamic Compaction Based on Automatic Control. Coatings 2021, 11, 1092. [Google Scholar] [CrossRef]
  6. Qin, P.; Wang, M.; Li, N.; Zhu, H.; Ding, X.; Tang, Y. Bubble-Sheet-Like Interface Design with an Ultrastable Solid Electrolyte Layer for High-Performance Dual-Ion Batteries. Adv. Mater. 2017, 29, 1606805. [Google Scholar] [CrossRef] [PubMed]
  7. Chen, G.; Zhang, F.; Zhou, Z.; Li, J.; Tang, Y. A Flexible Dual-Ion Battery Based on PVDF-HFP-Modified Gel Polymer Electrolyte with Excellent Cycling Performance and Superior Rate Capability. Adv. Energy Mater. 2018, 8, 1801219. [Google Scholar] [CrossRef]
  8. Aghakhani, S.; Ghasemi, B.; Pordanjani, A.H.; Wongwises, S.; Afrand, M. Effect of replacing nanofluid instead of water on heat transfer in a channel with extended surfaces under a magnetic field. Int. J. Numer. Methods Heat Fluid Flow 2019, 29, 1249–1271. [Google Scholar] [CrossRef]
  9. Pordanjani, A.H.; Aghakhani, S. Numerical Investigation of Natural Convection and Irreversibilities between Two In-clined Concentric Cylinders in Presence of Uniform Magnetic Field and Radiation. Heat Transf. Eng. 2021, 1–21. [Google Scholar] [CrossRef]
  10. Tian, M.-W.; Rostami, S.; Aghakhani, S.; Goldanlou, A.S.; Qi, C. A techno-economic investigation of 2D and 3D configu-rations of fins and their effects on heat sink efficiency of MHD hybrid nanofluid with slip and non-slip flow. Int. J. Mech. Sci. 2021, 189, 105975. [Google Scholar] [CrossRef]
  11. Xiang, G.; Zhang, Y.; Gao, X.; Li, H.; Huang, X. Oblique detonation waves induced by two symmetrical wedges in hydrogen-air mixtures. Fuel 2021, 295, 120615. [Google Scholar] [CrossRef]
  12. Chu, Y.M.; Ibrahim, M.; Saeed, T.; Berrouk, A.S.; Algehyne, E.A.; Kalbasi, R. Examining rheological behavior of MWCNT-TiO2/5W40 hybrid nanofluid based on experiments and RSM/ANN modeling. J. Mol. Liq. 2021, 333, 115969. [Google Scholar] [CrossRef]
  13. Li, X.; Sheng, X.; Guo, Y.; Lu, X.; Wu, H.; Chen, Y.; Zhang, L.; Gu, J. Multifunctional HDPE/CNTs/PW composite phase change materials with excellent thermal and electrical conductivities. J. Mater. Sci. Technol. 2021, 86, 171–179. [Google Scholar] [CrossRef]
  14. He, W.; Namar, M.M.; Li, Z.; Maleki, A.; Tlili, I.; Shadloo, M.S. Thermodynamic analysis of a solar-driven high-temperature steam electrolyzer for clean hydrogen production. Appl. Therm. Eng. 2020, 172, 115152. [Google Scholar] [CrossRef]
  15. Ghalandari, M.; Maleki, A.; Haghighi, A.; Shadloo, M.S.; Nazari, M.A.; Tlili, I. Applications of nanofluids containing carbon nanotubes in solar energy systems: A review. J. Mol. Liq. 2020, 313, 113476. [Google Scholar] [CrossRef]
  16. Toghyani, S.; Afshari, E.; Baniasadi, E.; Shadloo, M. Energy and exergy analyses of a nanofluid based solar cooling and hydrogen production combined system. Renew. Energy 2019, 141, 1013–1025. [Google Scholar] [CrossRef]
  17. Parsa, S.M.; Yazdani, A.; Dhahad, H.; Alawee, W.H.; Hesabi, S.; Norozpour, F.; Javadi, D.; Ali, H.M.; Afrand, M. Effect of Ag, Au, TiO2 metallic/metal oxide nanoparticles in double-slope solar stills via thermodynamic and environmental analysis. J. Clean. Prod. 2021, 311, 127689. [Google Scholar] [CrossRef]
  18. Mustafa, J.; Alqaed, S.; Kalbasi, R. Challenging of using CuO nanoparticles in a flat plate solar collector- Energy saving in a solar-assisted hot process stream. J. Taiwan Inst. Chem. Eng. 2021, 124, 258–265. [Google Scholar] [CrossRef]
  19. Al-Saadi, S.N.; Zhai, Z.J. Modeling phase change materials embedded in building enclosure: A review. Renew. Sustain. Energy Rev. 2013, 21, 659–673. [Google Scholar] [CrossRef]
  20. Izadi, M.; El Haj Assad, M. Chapter 15-Use of nanofluids in solar energy systems. In Design and Performance Optimization of Renewable Energy Systems; Assad, M.E.H., Rosen, M.A., Eds.; Academic Press: Cambridge, MA, USA, 2021; pp. 221–250. [Google Scholar]
  21. Wang, P.; Liu, Z.; Zhang, L. Sustainability of compact cities: A review of Inter-Building Effect on building energy and solar energy use. Sustain. Cities Soc. 2021, 72, 103035. [Google Scholar] [CrossRef]
  22. Wong, C.H.H.; Cai, M.; Ren, C.; Huang, Y.; Liao, C.; Yin, S. Modelling building energy use at urban scale: A review on their account for the urban environment. Build. Environ. 2021, 205, 108235. [Google Scholar] [CrossRef]
  23. Tian, G.; Fan, Y.; Gao, M.; Wang, H.; Zheng, H.; Liu, J.; Liu, C. Indoor thermal environment of thin membrane structure Buildings: A review. Energy Build. 2021, 234, 110704. [Google Scholar] [CrossRef]
  24. Oluah, C.K.; Akinlabi, E.T.; Njoku, H.O.; Jen, T.C. Development of software codes and system architecture for optimum performance Trombe wall system in buildings using IoT devices. Mater. Today Proc. 2021, 44, 1185–1189. [Google Scholar] [CrossRef]
  25. Hu, Z.; He, W.; Ji, J.; Zhang, S. A review on the application of Trombe wall system in buildings. Renew. Sustain. Energy Rev. 2017, 70, 976–987. [Google Scholar] [CrossRef]
  26. Zamora, B.; Kaiser, A.S. Thermal and dynamic optimization of the convective flow in Trombe Wall shaped channels by numerical investigation. Heat Mass Transf. 2009, 45, 1393–1407. [Google Scholar] [CrossRef]
  27. Llovera, J.; Potau, X.; Medrano, M.; Cabeza, L.F. Design and performance of energy-efficient solar residential house in Andorra. Appl. Energy 2011, 88, 1343–1353. [Google Scholar] [CrossRef]
  28. Koyunbaba, B.K.; Yilmaz, Z.; Ülgen, K. An approach for energy modeling of a building integrated photovoltaic (BIPV) Trombe wall system. Energy Build. 2013, 67, 680–688. [Google Scholar] [CrossRef]
  29. Hordeski, M.F. Dictionary of Energy Efficiency Technologies; Routledge: Oxford, UK, 2004. [Google Scholar]
  30. Jaber, S.; Ajib, S. Optimum design of Trombe wall system in mediterranean region. Sol. Energy 2011, 85, 1891–1898. [Google Scholar] [CrossRef]
  31. Balcomb, J.D.; McFarland, R.D. Simple empirical method for estimating the performance of a passive solar heated building of the thermal storage wall type. In Proceedings of the 2nd National Passive Solar Conference, Philadelphia, PA, USA, 15 March 1978. [Google Scholar]
  32. Ferreira, J.; Pinheiro, M. In search of better energy performance in the Portuguese buildings—The case of the Portuguese regulation. Energy Policy 2011, 39, 7666–7683. [Google Scholar] [CrossRef]
  33. Sebald, A.; Clinton, J.; Langenbacher, F. Performance effects of Trombe wall control strategies. Sol. Energy 1979, 23, 479–487. [Google Scholar] [CrossRef]
  34. Ali, H.M. Recent advancements in PV cooling and efficiency enhancement integrating phase change materials based systems–A comprehensive review. Sol. Energy 2020, 197, 163–198. [Google Scholar]
  35. Liu, S.; Li, Y.; Zhang, Y. Review on Heat Transfer Mechanisms and Characteristics in Encapsulated PCMs. Heat Transf. Eng. 2014, 36, 880–901. [Google Scholar] [CrossRef]
  36. Dutil, Y.; Rousse, D.; Lassue, S.; Zalewski, L.; Joulin, A.; Virgone, J.; Kuznik, F.; Johannes, K.; Dumas, J.-P.; Bédécarrats, J.-P.; et al. Modeling phase change materials behavior in building applications: Comments on material characterization and model validation. Renew. Energy 2014, 61, 132–135. [Google Scholar] [CrossRef] [Green Version]
  37. Soares, N.; Costa, J.J.; Gaspar, A.R.; Santos, P. Review of passive PCM latent heat thermal energy storage systems towards buildings’ energy efficiency. Energy Build. 2013, 59, 82–103. [Google Scholar] [CrossRef]
  38. Soares, N.M.L. Thermal Energy Storage with Phase Change Materials (PCMs) for the Improvement of the Energy Performance of Buildings 2016. Tese de Doutoramento. Disponível na. Available online: http://hdl.handle.net/10316/29306 (accessed on 20 August 2021).
  39. Lin, Y.; Zhong, S.; Yang, W.; Hao, X.; Li, C.-Q. Multi-objective design optimization on building integrated photovoltaic with Trombe wall and phase change material based on life cycle cost and thermal comfort. Sustain. Energy Technol. Assess. 2021, 46, 101277. [Google Scholar] [CrossRef]
  40. Zhu, N.; Deng, R.; Hu, P.; Lei, F.; Xu, L.; Jiang, Z. Coupling optimization study of key influencing factors on PCM trombe wall for year thermal management. Energy 2021, 236, 121470. [Google Scholar] [CrossRef]
  41. Duan, S.; Wang, L.; Zhao, Z.; Zhang, C. Experimental study on thermal performance of an integrated PCM Trombe wall. Renew. Energy 2021, 163, 1932–1941. [Google Scholar] [CrossRef]
  42. Zhu, N.; Li, S.; Hu, P.; Lei, F.; Deng, R. Numerical investigations on performance of phase change material Trombe wall in building. Energy 2019, 187, 116057. [Google Scholar] [CrossRef]
  43. Li, S.; Zhu, N.; Hu, P.; Lei, F.; Deng, R. Numerical study on thermal performance of PCM Trombe Wall. Energy Procedia 2019, 158, 2441–2447. [Google Scholar] [CrossRef]
  44. Bourdeau, L.E. Study of two passive solar systems containing phase change materials for thermal storage 1980. Presented at the 5th National Passive Solar Conference. Amherst, MA, USA, 19–26 October 1980; pp. 19–26. [Google Scholar]
  45. Onishi, J.; Soeda, H.; Mizuno, M. Numerical study on a low energy architecture based upon distributed heat storage system. Renew. Energy 2001, 22, 61–66. [Google Scholar] [CrossRef]
  46. Turcotte, D.L.; Schubert, G. Geodynamics; Cambridge University Press: Cambridge, UK, 2002. [Google Scholar]
  47. Chen, C.; Guo, H.; Liu, Y.; Yue, H.; Wang, C. A new kind of phase change material (PCM) for energy-storing wallboard. Energy Build. 2008, 40, 882–890. [Google Scholar] [CrossRef]
  48. Soares, N.; Rosa, N.; Costa, J.J.; Lopes, A.G.; Matias, T.; Simões, P.N.; Durães, L. Validation of different numerical models with benchmark experiments for modelling microencapsulated-PCM-based applications for buildings. Int. J. Therm. Sci. 2021, 159, 106565. [Google Scholar] [CrossRef]
  49. Ahmed, M.S.; Attalla, M. Experimental Studyof Passive Solar Cooling in Hot Arid Regions Using Trombe Walls with Humidification. Advances in Fluid Mechanics and Heat & Mass Transfer. Available online: http://www.wseas.us/e-library/conferences/2012/Istanbul/FLUHE/FLUHE-01.pdf (accessed on 20 August 2021).
Figure 1. Tr-W for winter (left) and summer (right).
Processes 09 01886 g001
Figure 2. Schematic Tr-W under study.
Processes 09 01886 g002
Figure 3. Three type holes on Tr-W.
Processes 09 01886 g003
Figure 4. PCM melting contours in a tube filled with PCM from 0 to 5000 s with a time interval of 1000 s.
Processes 09 01886 g004aProcesses 09 01886 g004b
Figure 5. The TEM contours of a PCM-filled tube from 0 to 5000 s with a time interval of 1000 s.
Processes 09 01886 g005aProcesses 09 01886 g005b
Figure 6. The TEM in three parts of the wall, including the outlet, the absorber plate, and the glass at different times of the day with and without PCM in the summer.
Processes 09 01886 g006
Figure 7. The TEM in three parts of the wall, including the outlet, the absorber plate, and the glass at different times of the day with and without PCM in the winter.
Processes 09 01886 g007
Figure 8. Outlet TEM variations of the Tr-W for different dimensions of the wall hole without PCM at different times of the day in summer.
Processes 09 01886 g008
Figure 9. The effect of the size of the outlet and inlet valve on the outlet TEM of the wall at different times of the day in the presence of PCM.
Processes 09 01886 g009
Figure 10. The outlet TEM variations from the Tr-W for different dimensions of the wall hole in the presence of PCM at different times of the day in winter.
Processes 09 01886 g010
Figure 11. The effect of the size of the outlet and inlet valve on the outlet TEM of the wall for different times of the day in the presence of PCM.
Processes 09 01886 g011
Table 1. Characteristics of the Tr-W.
ComponentsMaterialThickness (cm)Width (m)Length (m)
Tr-WHybrid151.51
Absorber plateAluminum0.11.51
GlassGlass0.41.51
The plate behind the frameGalvanized0.11.51
ContainerGalvanized51.50.6
Table 2. Properties of PCM used in the present study.
CaCl2.6H2O
Kinematic viscosity m2/s3 × 10−6
Thermal expansion coefficient 1/°C1 × 10−3
Thermal conductivity (solid)W/m·k1.008
Thermal conductivity (liquid)W/m·k0.561
Density (solid)kg/m31802
Density (liquid)kg/m31562
Specific heat (solid)kJ/kg K1.4
Specific heat (liquid)kJ/kg K2.1
Melting point °C29
L-H of fusion kJ/kg192
Table 3. The values of heat flux applied on the Tr-W at different hours of the day in winter and summer.
Time1011121314151617181920
q ´ ´ W/m2 (summer)4506007008501000850650550400250100
q ´ ´ W/m2 (winter)3004005006007006004503001508020
Table 4. The outlet TEM of the Tr-W in the presence of PCM at noon in the summer, when the size of the hole is 17.5 cm.
Mesh102351012530401473050167546018562002015340
Tout54.553.652.852.452.452.4
Table 5. The wall TEM in the middle obtained from the present work and experimental results.
Time (h)8101214161820
Reference306.26310.25312.95315.83315.78312.04308.35
This work306.89312.56314.56317.89318.05314.23310.11
Publisher’s Note: MDPI stays neutral with regard to jurisdictional claims in published maps and institutional affiliations.

