Article

One-Pot Synthesis of Ni0.05Ce0.95O2−δ Catalysts with Nanocubes and Nanorods Morphology for CO2 Methanation Reaction and in Operando DRIFT Analysis of Intermediate Species

by
Igor Luisetto
1,*,
Stefano Stendardo
1,*,
Sakkarapalayam Murugesan Senthil Kumar
2,
Karuppiah Selvakumar
2,
Jagadesh Kopula Kesavan
3,
Giovanna Iucci
3,
Umberto Pasqual Laverdura
3 and
Simonetta Tuti
3
1
Italian National Agency for New Technologies, Energy and Sustainable Economic Development (ENEA), Via Anguillarese 301, 00123 Rome, Italy
2
Materials Electrochemistry Division, CSIR—Central Electrochemical Research Institute, Karaikudi 630003, India
3
Department of Science, Roma Tre University, Via della Vasca Navale 79, 00146 Rome, Italy
*
Authors to whom correspondence should be addressed.
Submission received: 9 September 2021 / Revised: 21 October 2021 / Accepted: 21 October 2021 / Published: 25 October 2021
(This article belongs to the Special Issue Heterogeneous Catalysts for CO2 Valorisation)

Abstract

:
The valorization of CO2 via renewable energy sources allows one to obtain carbon-neutral fuels through its hydrogenation, like methane. In this study, Ni0.05Ce0.95O2−δ catalysts were prepared using a simple one-pot hydrothermal method yielding nanorod and nanocube particles to be used for the methanation reaction. Samples were characterized by XRD, BET, TEM, H2-TPR, and H2-TPD experiments. The catalytic activity tests revealed that the best performing catalyst was Ni0.05Ce0.95O2−δ, with nanorod morphology, which gave a CO2 conversion of 40% with a selectivity of CH4 as high as 93%, operating at 325 °C and a GHSV of 240,000 cm3 h−1 g−1. However, the lower activation energy was found for Ni0.05Ce0.95O2−δ catalysts with nanocube morphology. Furthermore, an in operando diffuse reflectance infrared Fourier transform spectroscopy (DRIFTS) analysis was performed flowing CO2:H2 or CO:H2 mixture, showing that the main reaction pathway, for the CO2 methanation, is the direct hydrogenation of formate intermediate.

1. Introduction

A reduction of carbon emissions from industry and energy production by avoiding, capturing, or recycling carbon is urgently needed to limit the ever-increasing concentration of CO2 in the atmosphere, the leading cause of global warming. The utilization of CO2 as a C1 building block in organic synthesis to produce chemicals is limited to the production of urea, salicylic acid, and polycarbonates, and utilizes only a small percentage of the largely available feedstock [1]. Recycling CO2 to produce fuels such as methane, methanol, dimethyl ether, or higher alcohols could be a convenient alternative that has not been thoroughly investigated yet. Research in this field may leads to reduced consumption of carbon-based fossil fuels, avoiding the introduction of new CO2 to the atmosphere [2,3]. The hydrogenation of CO2 to produce methane and water, (CO2 + 4H2 → CH4 + 2H2O), known as Sabatier reaction or methanation, is exothermic (ΔH° = –164 kJ mol1), and thermodynamically favored (ΔG0 = –131 kJ/mol), but with kinetic barriers that require the presence of a catalyst. CO2 methanation is currently attracting much attention due to its potential application in the power to gas process (PtG), where the intermittent excess electricity, generated from renewable sources, can be used for the sustainable production of synthetic natural gas (SNG), which contributes to the reduction of greenhouse gas emissions by replacing natural fossil methane [4,5].
In the presence of a catalyst, CO2 methanation occurs above 200 °C, and is generally exploited below 400 °C, to limit the endothermic side reactions that occur at high temperatures: the reverse-water-gas shift (RWGS: CO2 + H2 → CO + H2O, ΔH° = 41 kJ mol−1), which produces CO instead of methane, and the reforming of methane with CO2 (CH4 + CO2 → 2CO + 2H2, ΔH° = 247 kJ mol−1). Noble and transition metals of the VIII-X groups (Ru, Rh, Ir, Pd, Ni, Fe, Co), are active and selective for methanation. They have been supported on oxides (γ-Al2O3, TiO2, SiO2, ZrO2, CeO2), and extensively studied, as summarized in some recent reviews [2,4,6,7,8,9,10,11]. The order of the metal elements for the specific activity or selectivity may differ in published papers, depending on the methanation conditions and on the metal/support interactions; anyhow, ruthenium is generally the most active. Nonetheless, Ni metal is the most commonly used for commercial applications, due to its high activity, high selectivity, and very low cost. However, Ni-based catalysts are more active at higher temperatures than noble metal, and are prone to deactivation by carbon deposition due to the Boudouard reaction and the reduction by H2 of CO2 and CO to carbon. The catalytic performances of Ni-based catalysts depend markedly on the properties of the support, which affect the dispersion of the catalytic phase, the reducibility of the metal, and the metal-support interactions.
The mechanism of CO2 methanation over nickel-based catalysts has been extensively studied using theoretical and experimental approaches, but many aspects of the mechanism remain controversial, and are still debated among researchers. Three main possible reaction mechanisms have been proposed [11,12,13]: the first pathway involves the associative adsorption of CO2 with a surface H*, forming a formate intermediate (CHOO*), which is subsequently hydrogenated to CH*, and then to CH4 (formate pathway). The other mechanisms both start with the dissociative adsorption of CO2 onto CO* and O*, followed by the hydrogenation of COad to form methane after direct cleavage of the C-O bond, or via an HCO* intermediate. However, in the last two routes, the intermediate is the adsorbed CO. The properties of the support and the operating conditions appear to influence the preferred reaction pathway and the rate-determining step. The methanation mechanisms on Ni supported on CeO2 catalysts are still under investigation and can be deepened by analyzing the involved intermediates, using in operando DRIFT experiments [12,14]
CeO2 is one of the most studied catalyst carriers, due to its redox properties, and to its ability to store and release oxygen (oxygen storage capacity, OSC) through the Ce3+/Ce4+ couple on the surface, and due to its oxygen vacancies. CeO2-based catalysts showed excellent performances in the oxidation of CO [15] or alcohols [16], combustion of methane in the lean state [17], dry reforming [18,19,20], hydrogenation [21], and CO2 methanation [14,22]. The redox properties and the ability to highly disperse Ni have been suggested as responsible for the excellent catalytic activity and stability for CO2 methanation [23,24].
CeO2 can be prepared in different nano-shapes, such as nano-rod, nano-cubic or nano-octahedra. The morphology affects the catalytic performances of Me/CeO2 catalysts for various reactions: i.e., CO2 methanation over Ni [3,25], methane combustion over Pd [17], water gas shift reaction over Cu [26], dry reforming of methane or methanol over Ni [27,28], hydrogenation of ethyl levulinate over Ru [21]. The nano-rod morphology appears the most active and stable for all these reactions, whereas the order of activity for nano-cubes and nano-octahedra may be reversed.
The difference in activity of Me/CeO2 catalysts with different nano-shapes is ascribed to differences in the specific exposed crystallographic facets that affect the metal/support interactions [3,27,29], the amount of oxygen vacancies [3,17,21,25,27,28,29], or acid-basic sites [28]. Experimental and theoretical studies on well-defined nanocrystals have established that the control of exposed facets in ceria is a promising way to direct the activity and selectivity of many reactions [29].
In light of these considerations and perspectives, it is interesting to further investigate the role of most active nanoshapes for the CO2 methanation, i.e., rods and cubes.
Recently, we studied a series of Ni/nanorod-CeO2 catalysts with different Ni loading (2–13 wt%) [22] and a Pd (2 wt%)/nanorod-CeO2 [16], prepared by one-pot hydrothermal synthesis, founding that this preparation method allows one to obtain the high and homogeneous dispersion of supported metals, good stability of metal dispersion and support morphology after treatments at high temperatures.
In this work, we investigated the influence of morphology on catalytic activity for the CO2 methanation of samples Ce0.95Ni0.05O2−d, with nanorod or nanocube shape prepared by one-pot hydrothermal synthesis. This rapid and straightforward method ensures a high dispersion of nickel and a strong Ni-support interaction. The central core of this research is the study of the nature of reaction intermediates, and the dependence of their nature on the specific ceria nano-shape, through in operando DRIFT analysis.

2. Materials and Methods

2.1. Catalysts Synthesis

Ce0.95Ni0.05O1.95 nanorods (Ni-nR): 2.97 g of Ce(NO3)3 × 6H2O and 0.10 g of Ni(NO3)2 × 6H2O were dissolved in 20 mL of distilled water. A NaOH solution (48 g of NaOH in 100 mL of distilled water) was added dropwise, with vigorous stirring for 30 min. After precipitation, the suspension was transferred to a Teflon-lined cylinder and kept in a hot oven for 24 h at 100 °C. The precipitate was washed to neutral pH, dried overnight at 80 °C, and ground in an agate mortar; the powder thus obtained was calcined at 500 °C for 5 h. CeO2 nanorods (nR) were synthesized in the same way without a Ni reagent.
Ce0.95Ni0.05O1.95 nanocubes (Ni-nC): 3.56 g of Ce(NO3)3 × 6H2O and 0.13 g of Ni(NO3)2 × 6H2O were dissolved in 20 mL of distilled water. A NaOH solution (29 g of NaOH in 100 mL of distilled water) was added dropwise with vigorous stirring for 30 min. After precipitation, the suspension was transferred to a Teflon-lined cylinder and kept in a hot oven for 24 h at 180 °C. The precipitate was washed to neutral pH, dried overnight at 80 °C, and ground in an agate mortar; the powder thus obtained was calcined at 500 °C for 5 h. CeO2 nanocubes (nC) were synthesized in the same way without Ni reagent.
The chemical composition was checked using the EDAX technique integrated with the device TEM. The nominal composition was guaranteed with an error of ±5% regarding the different areas studied, confirming the nominal nickel content and, therefore, the accuracy of the hydrothermal synthesis method.

2.2. Catalysts Characterization

Powder X-ray diffraction patterns were recorded using a Scintag X1 diffractometer equipped, with a Cu Kα (λ = 1.5418 Å) source and the Brag-Brentano θ–θ configuration in the 2θ range 20–80°, with 0.05 step size and 3 s acquisition time. The NiO crystallite sizes were estimated by Scherrer Equation (1), where: D is the crystallite size in nm, K is the crystallite-shape factor, λ is the X-ray wavelength, βD is the full-width at half maximum in radians, and ϑ is the Bragg angle.
D = K λ β D c o s   θ  
The lattice constant (α) of CeO2 was calculated by the following Equation (2):
α = λ 2 s i n   θ   h 2 + k 2 + l 2
The supports and catalysts XRD patterns were further elaborated by the Williamson plot to obtain the effects of size and strain in the CeO2 crystals. The full width at half maximum β T of the diffraction peak is ascribed to the broadening effect of both the crystallite size β D and the lattice strain β s , arising from strain-induced broadening ε, according to the following Equations (3) and (4)
β T = β D + β S = K λ D c o s   θ   + 4 ε   t a n   θ  
β T c o s   θ = K λ D + 4 ε   s i n   θ  
The N2 adsorption-desorption isotherms of the samples were obtained at −196.1 °C using a Micromeritics Gemini V apparatus. Prior to measurement, the samples were heated at 300 °C for 4 h in He. The specific surface area (SSA) was calculated by the Brunauer–Emmet–Teller (BET) method in the equilibrium pressure range of 0.05 < p/p° < 0.3. The pore size distribution was obtained from the branch of the desorption isotherm using the Barrett–Halenda (BJH) method. The total pore volume was calculated from the maximum adsorption point at p/p° = 0.98.
Temperature-programmed reduction (TPR) and temperature-programmed desorption (TPD) of H2 were performed using a Thermo Scientific TPDRO1100 flow-through apparatus. Before the experiments, the calcined sample was placed into a quartz reactor, and pre-treated flowing 20 cm3 min−1 of 5% O2/He gas mixture at 500 °C for 1 h, and cooled down to 50 °C. TPR was conducted by flowing 30 cm3 min−1 of 5% H2/Ar gas mixture, raising the temperature up to 1000 °C, with a heating rate of 10 °C min−1. For TPD experiment, the calcined sample was pre-reduced flowing 30 cm3 min−1 of 5% H2/Ar gas mixture up to 500 °C for 1 h, then cooled down to 50 °C. The H2 physisorbed was removed flowing 30 cm3 min−1 of Ar for 1 h, then the temperature was increased up to 500 °C, with a heating rate of 10 °C min−1. The H2 consumption/chemisorption was measured by a TCD detector, calibrated by reducing a known amount of CuO (99.99% purity from Sigma Aldrich). A trap removed the H2O generated in the reduction before flowing into the TCD detector. The Ni dispersion (D%) and the particle size of Ni (d) were calculated by Equations (5) and (6), respectively:
D ( % ) = η S M W × 10 2
d ( nm ) = f W ρ η N A S A × 10 5
in these equations, f is the geometric shape factor (6 for spherical particles), W is the weight percentage of Ni (1.75%), ρ is the density of Ni (8.9 g/cm3); η is the desorbed H2 (mol/g), NA is the Avogadro number (6.023 × 10²³), S is the stoichiometric factor for H2 chemisorption (metal mole/gas mole = 2), A is the area occupied by the Ni surface atom (6.51 × 10⁻¹⁶ cm2), M is the atomic mass of Ni (58.69 g/mol).
For the calculations of the theoretical hydrogen consumption to be compared with the experimental, the oxidation state of Ni = +2 and that of Ce = +4, was assumed. From the reaction: 20Ni0.05Ce0.95O1.95 + 10.5H2(g) = Ni0 + 9.5Ce2O3 + 10.5H2O(g), per gram of catalyst, the mmol of H2 consumed for Ni is 0.30 mmol H2/g, while that required for the reduction of CeO2 to Ce2O3 is 2.84 mmol H2/g.
A Tecnai G2 F20 s-twin instrument operating at 200 kV performed transmission electron microscopy (TEM) analysis.
Diffuse reflectance infrared Fourier transform spectroscopy (DRIFT) analysis was carried out using a Thermo-electron Corporation Nicolet 4700-FTIR spectrometer coupled to a reaction cell. The reactor unit was embedded with two 6 × 90° off-axis ellipsoidal mirrors arranged to discriminate specularly reflected radiation. Spectra were acquired with 256 scans in the flow of gases controlled by mass flow controllers. The sample was reduced in situ by flowing 50 cm3 min−1 of 50% H2/He gas mixture, heating up to 500 °C at a rate of 10 °C min−1, and maintaining this temperature for 30 min. The DRIFT spectra of the reduced samples were acquired as background in the 100‒500 °C temperature range at intervals of 100 °C. The methanation reaction mixture CO2:H2:He = 5:20:25 cm3 min−1 or CO:H2:He = 5:15:30 cm3 min−1 flowed on the sample, and the spectra were recorded in the same temperature range of the backgrounds.

2.3. Fixed-Bed Catalytic Test

The CO2 methanation reaction was performed in a fixed-bed quartz reactor, with an internal diameter of 6 mm and a length of 300 mm, inserted into a cylindrical oven. The reactive mixture was fed by three independent mass flow controllers with a CO2:H2:N2 ratio of 1:4:5 and a total flow of 100 cm3 min−1, and a weight hourly space velocity (WHSV) of 60,000 cm3g−1h−1. Before the catalytic test, the sample was reduced in situ with a 50% H2/N2 stream (50 cm3 min−1), raising the temperature from RT to 500 °C, and held isothermally at this temperature for 60 min. The catalytic test was performed in the temperature range from 500 °C to 250 °C, with 25 °C decrements. A cold trap and a dryer removed H2O from the flow before the analysis. The dry gas was analyzed by Agilent 7820 gas chromatograph. The conversion of CO2    ( X C O 2 ) the selectivity of CH4    ( S C H 4 )   and the yields of CH4  ( Y C H 4 )   and CO ( Y C O )   were calculated by Equations (7)–(9), where C O 2 ,   o u t , C H 4 ,   o u t   and C O o u t are the gas volume concentrations in the effluent:
X C O 2 ( % ) = C H 4 ,   o u t + C O o u t C O 2 ,   o u t + C H 4 ,   o u t + C O o u t × 10 2
S C H 4 ( % ) = C H 4 ,   o u t C H 4 ,   o u t + C O o u t × 10 2
Y C H 4   o r   Y   C O ( % ) = C H 4 ,   o u t   o r   C O o u t C O 2 ,   o u t + C H 4 ,   o u t + C O o u t × 10 2
The turn over frequency TOF (s−1) was calculated using Equation (10), where: F C O 2 ,   i n is the CO2 flux in the reactor, X C O 2 ( % ) is the CO2 conversion, M N i is the Ni molar mass, m c a t is the catalyst mass, W N i ( % ) is the Ni weight percentage, D ( % ) is the Ni dispersion obtained by the H2-TPD technique.
T O F C O 2   ( s 1 ) = F C O 2 ,   i n     X C O 2 ( % ) M N i m c a t W N i ( % ) D ( % ) = r C O 2 M N i W N i ( % ) D ( % )

3. Results

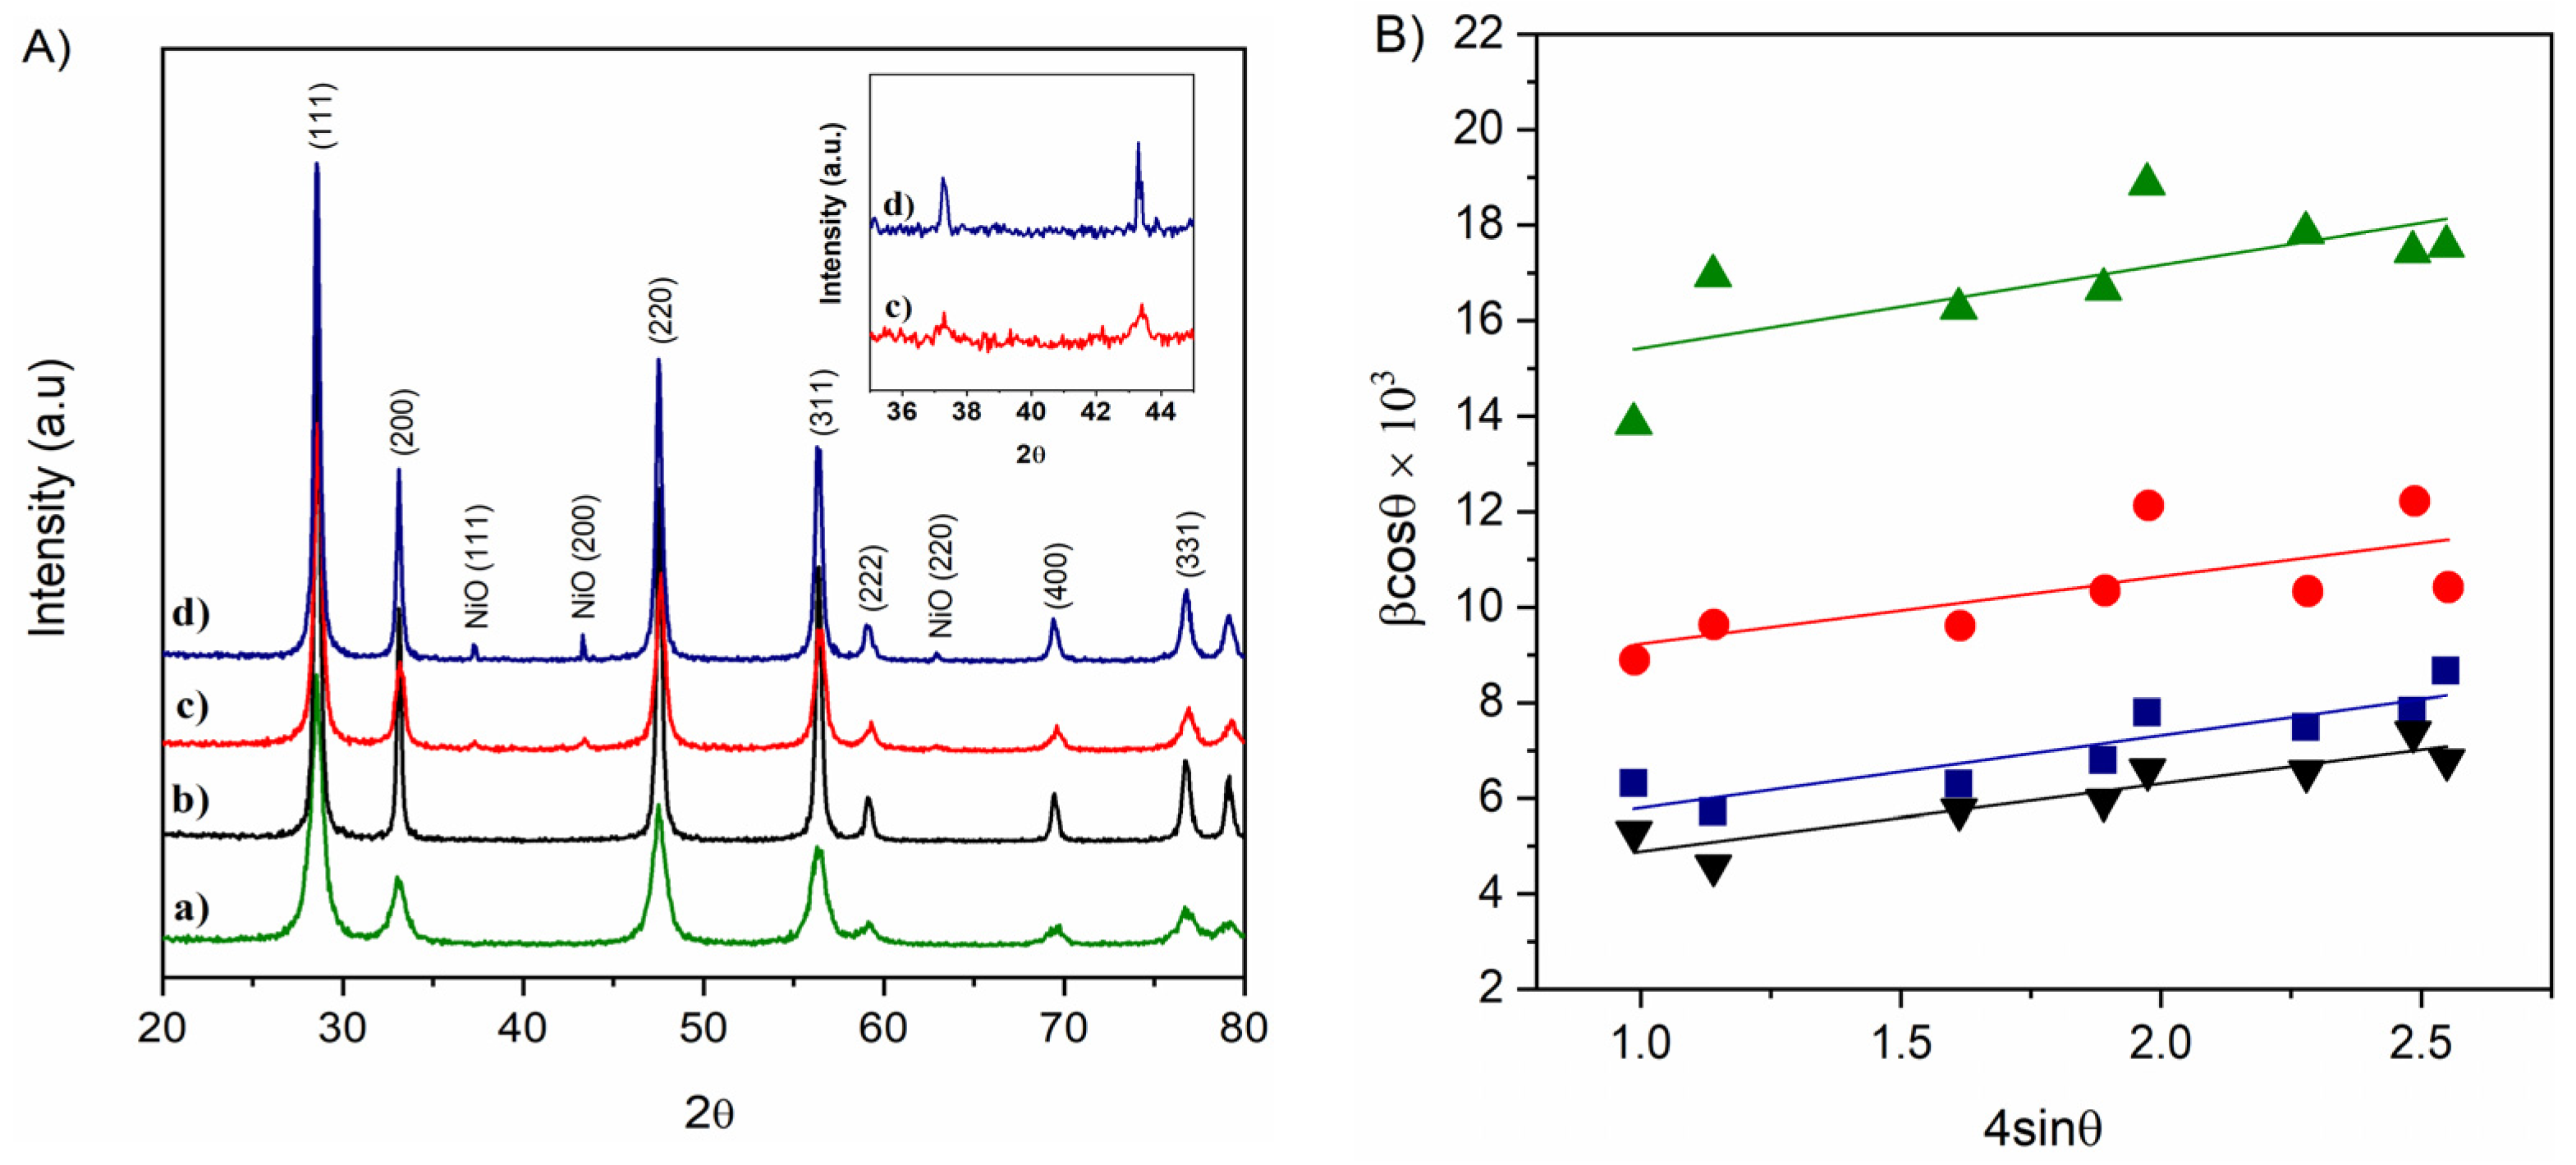
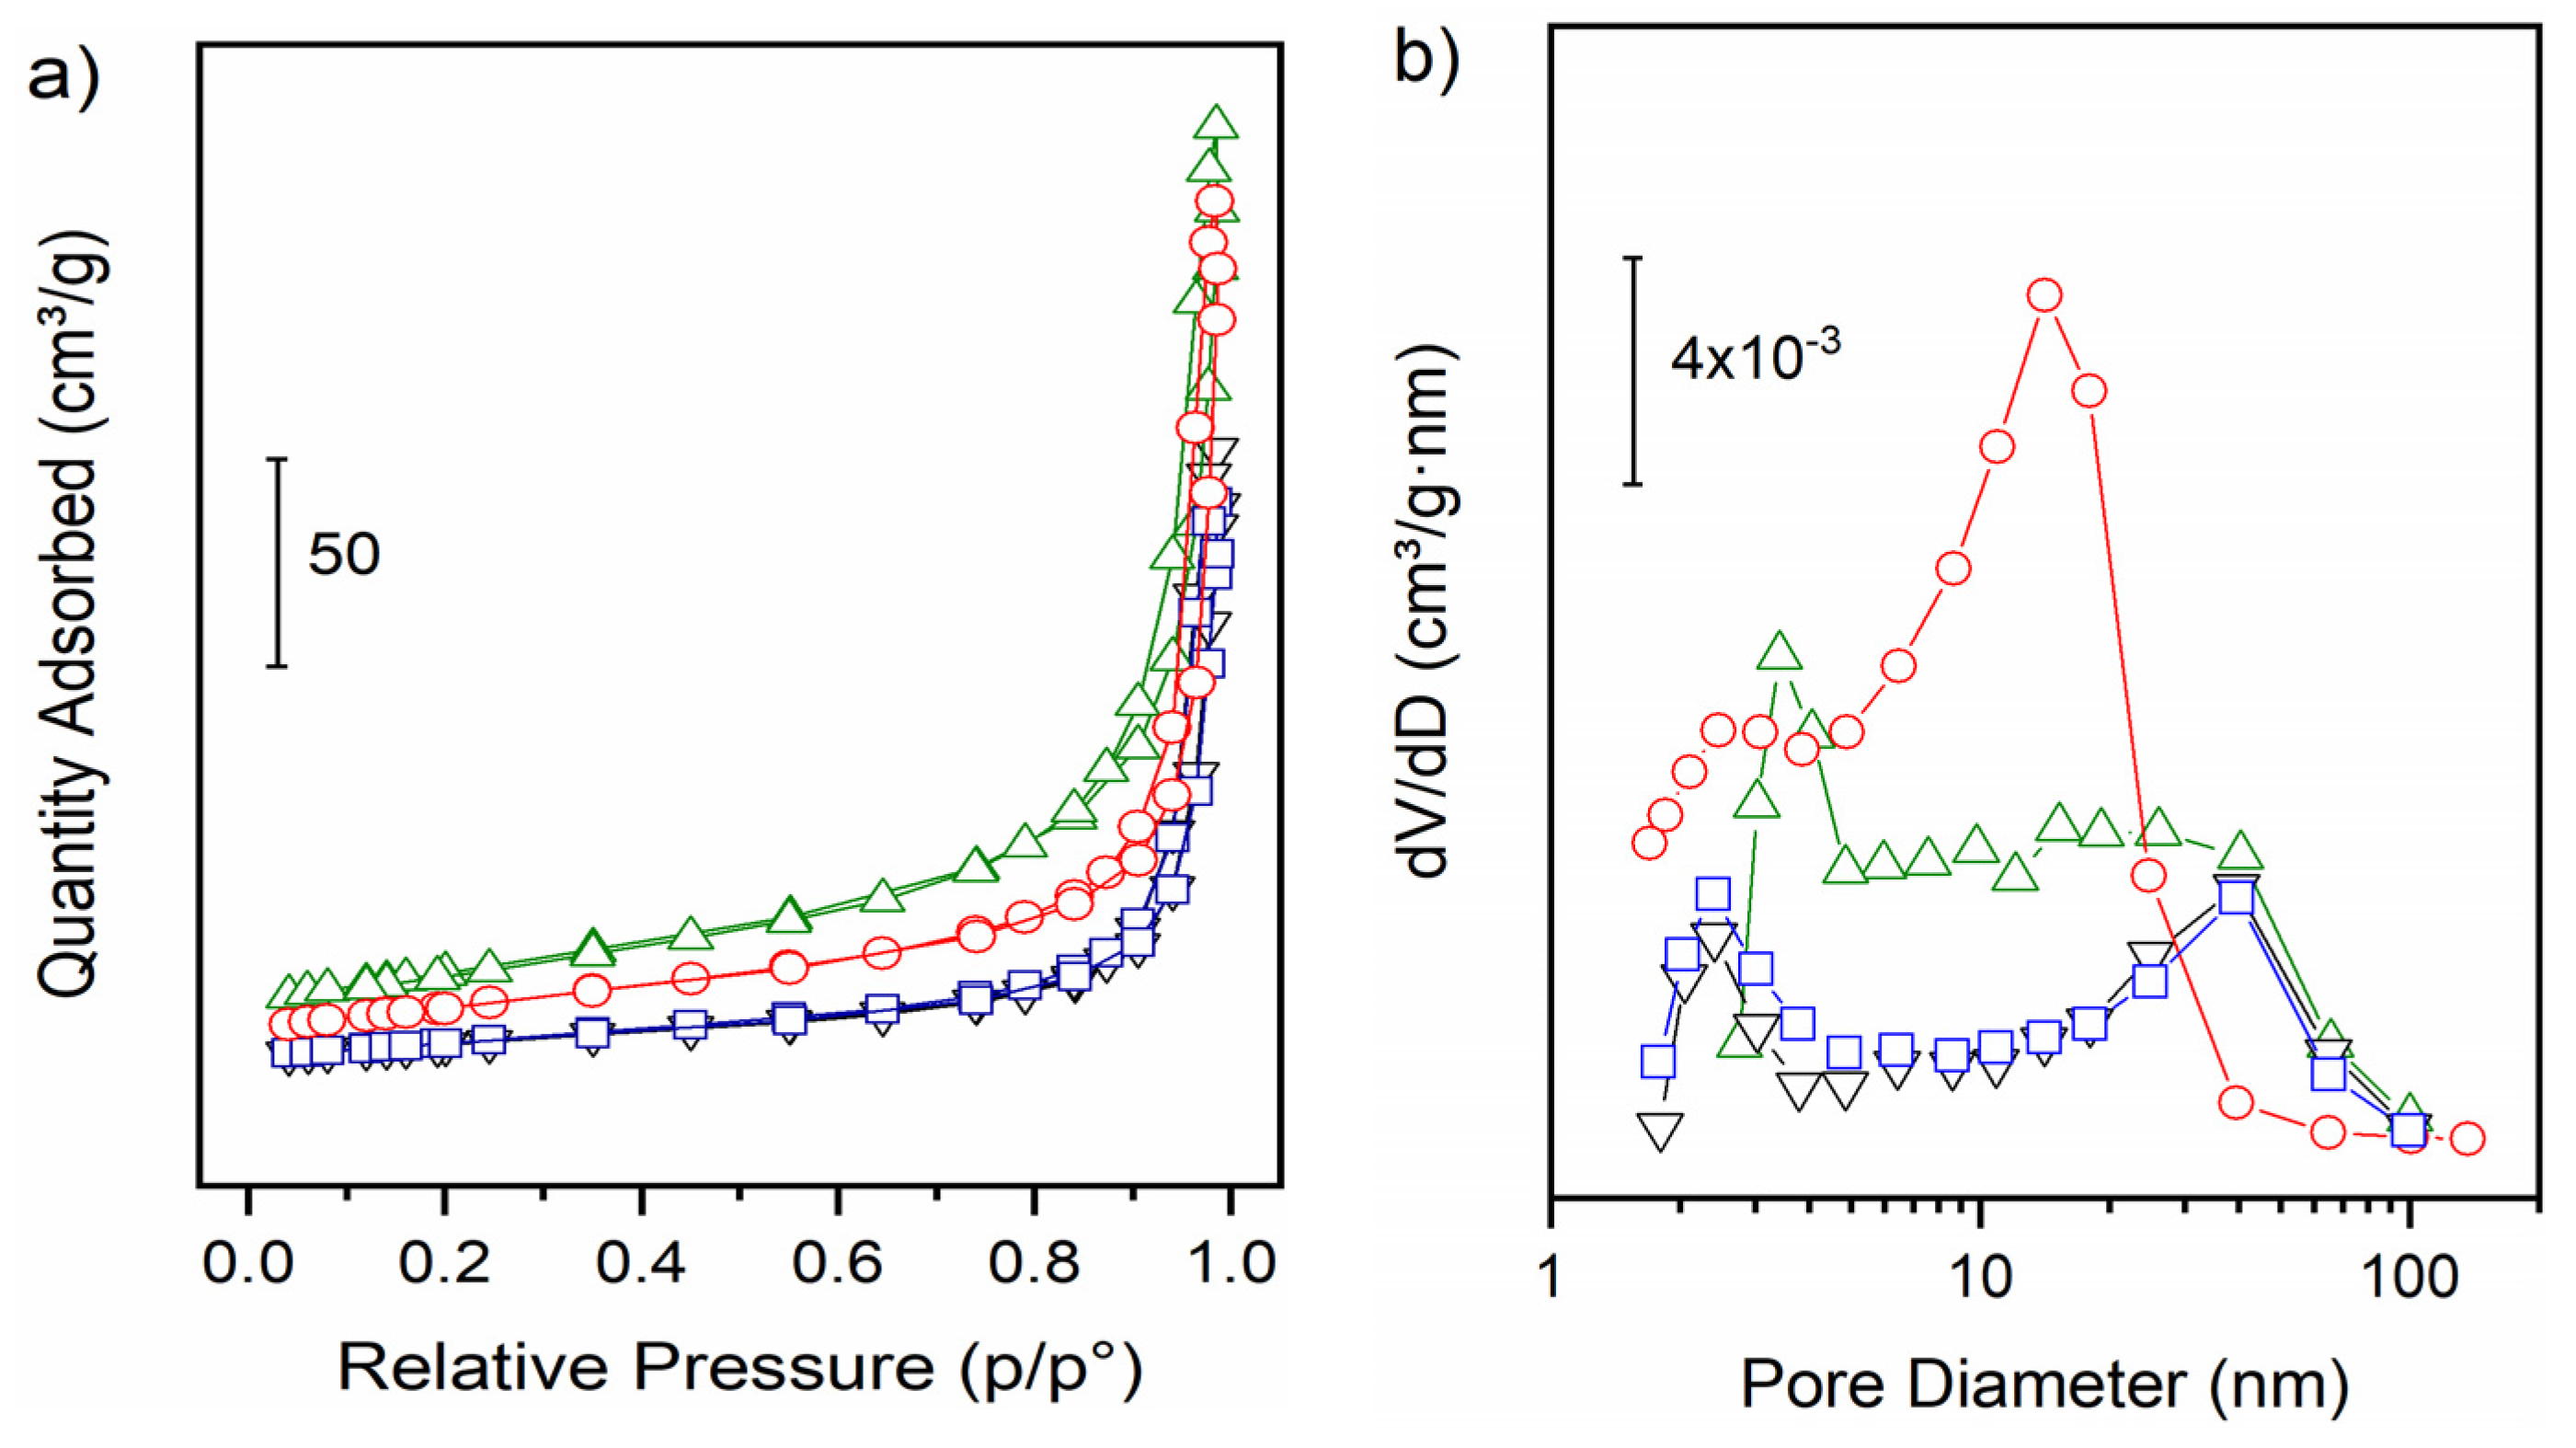
3.1. Structural and Morphological Characterization

The XRD patterns of the nR and nC supports and the Ni-nR and Ni-nC catalysts are shown in Figure 1A, and the corresponding Williamson–Hall (W-H) plots are given in Figure 1B. The main structural features are listed in Table 1. After calcination at 550 °C, the nR and nC supports showed the peaks corresponding to the diffraction planes (111), (200), (220), (311), (400), and (331) of the cubic structure with Fm3-3m space group (JCPDS 34-0394). The diffraction angle of these peaks was similar for both samples. However, the FWHM was much larger in the nR support, indicating a smaller crystallites size. In fact, from the intercept with the y-axis of the W-H plot, a crystallite size of 10 nm was calculated for the nR, compared to a much larger size, of 40 nm, obtained for the nC. The ε strain, resulting from the slope of the line, was also slightly different, being 1.7 × 10⁻³ and 1.4 × 10⁻³ for the nR and nC supports, respectively. Confirming a larger crystalline imperfection for the nanorod morphology, even if these defects did not change the lattice parameter, which was equal to 5.41 Å in both supports.
Introducing Ni during the synthesis significantly changed the crystallographic patterns of the catalysts calcined at 550 °C. Peaks at 2θ angles 37.3°, 43.3°, and 62.9° corresponding to diffraction planes (111), (200), and (220) of the cubic NiO phase with space group Fm3-3m (JCPDS 47-1049) were clearly visible, albeit with very low intensity due to the small amount of Ni in the catalysts (1.75 wt%). The width of these peaks was much larger in Ni-nR than in Ni-nC, and the crystallite sizes, estimated by the Scherrer equation, were 20 and 71 nm, respectively. From W–H diagrams of CeO2 phase, crystallites of 18 nm and 32 nm with the strain of 1.4 ×10⁻³ and 1.5 ×10⁻³ were obtained for the Ni-nR and Ni-nC catalysts, respectively. The Ni-nR lattice parameter of 5.40 Å was slightly lower than that of Ni-nC, which was 5.41 Å. Thus, the introduction of Ni seems to reduce the crystallographic differences between the two morphologies. However, as reported by several authors [30,31], it cannot be ruled out that some of the Ni has been incorporated into the CeO2 lattice to form a solid Ce-O-Ni solution.
The N2 adsorption/desorption isotherms and the corresponding pore size distributions of the materials are shown in Figure 2, and the main textural properties are summarized in Table 2. All samples showed II-type adsorption–desorption curves, with H2-type hysteresis loop (IUPAC classification [32]), characteristic of macroporous materials. The specific surface area (SSA) of pure ceria was 32 m2g−1 for nC morphology, and 92 m2g−1 for nR morphology, agreeing with the different crystallite dimensions measured by XRD analysis. The addition of nickel led to a decrease in SSA of about 30% (62 m2g−1) only for the nR morphology, whereas it did not affect the surface area for the nanocube morphology. Bare nC and nR supports showed a Barrett–Joyner–Halenda (BJH) total pore volume equal to 0.24 and 0.36 cm3 g−1, respectively. The addition of nickel caused an identical slight pore volume decrease of 8.3% in both samples (Table 2). The pore size distributions (PSD) for both structures showed a bimodal distribution with two maxima; one in the mesopores region (<10 nm), and another in the meso-macropores region (>50 nm). For the nC morphology, the maximum of the mesopores was centered at 2.5 nm, and that of the meso-macropores maximum at around 40 nm. The addition of nickel did not affect the overall distribution, probably due to a lower interaction between the metal and the support. Quite the opposite was true for the nR morphology, where the introduction of nickel drastically changed the pore size distribution. In the as-is support, the mesopores maximum was at 3.5 nm. A much broader distribution of meso-macropores, between 10 nm and 70 nm, was detected, whereas, in the Ni-nR sample, the PSD of the small mesopores moved at a slightly smaller size of about 2.5 nm but, significantly, a narrower distribution of mesopores with a center around 14 nm was detected; additionally, few pores with sizes larger than 30 nm were found.

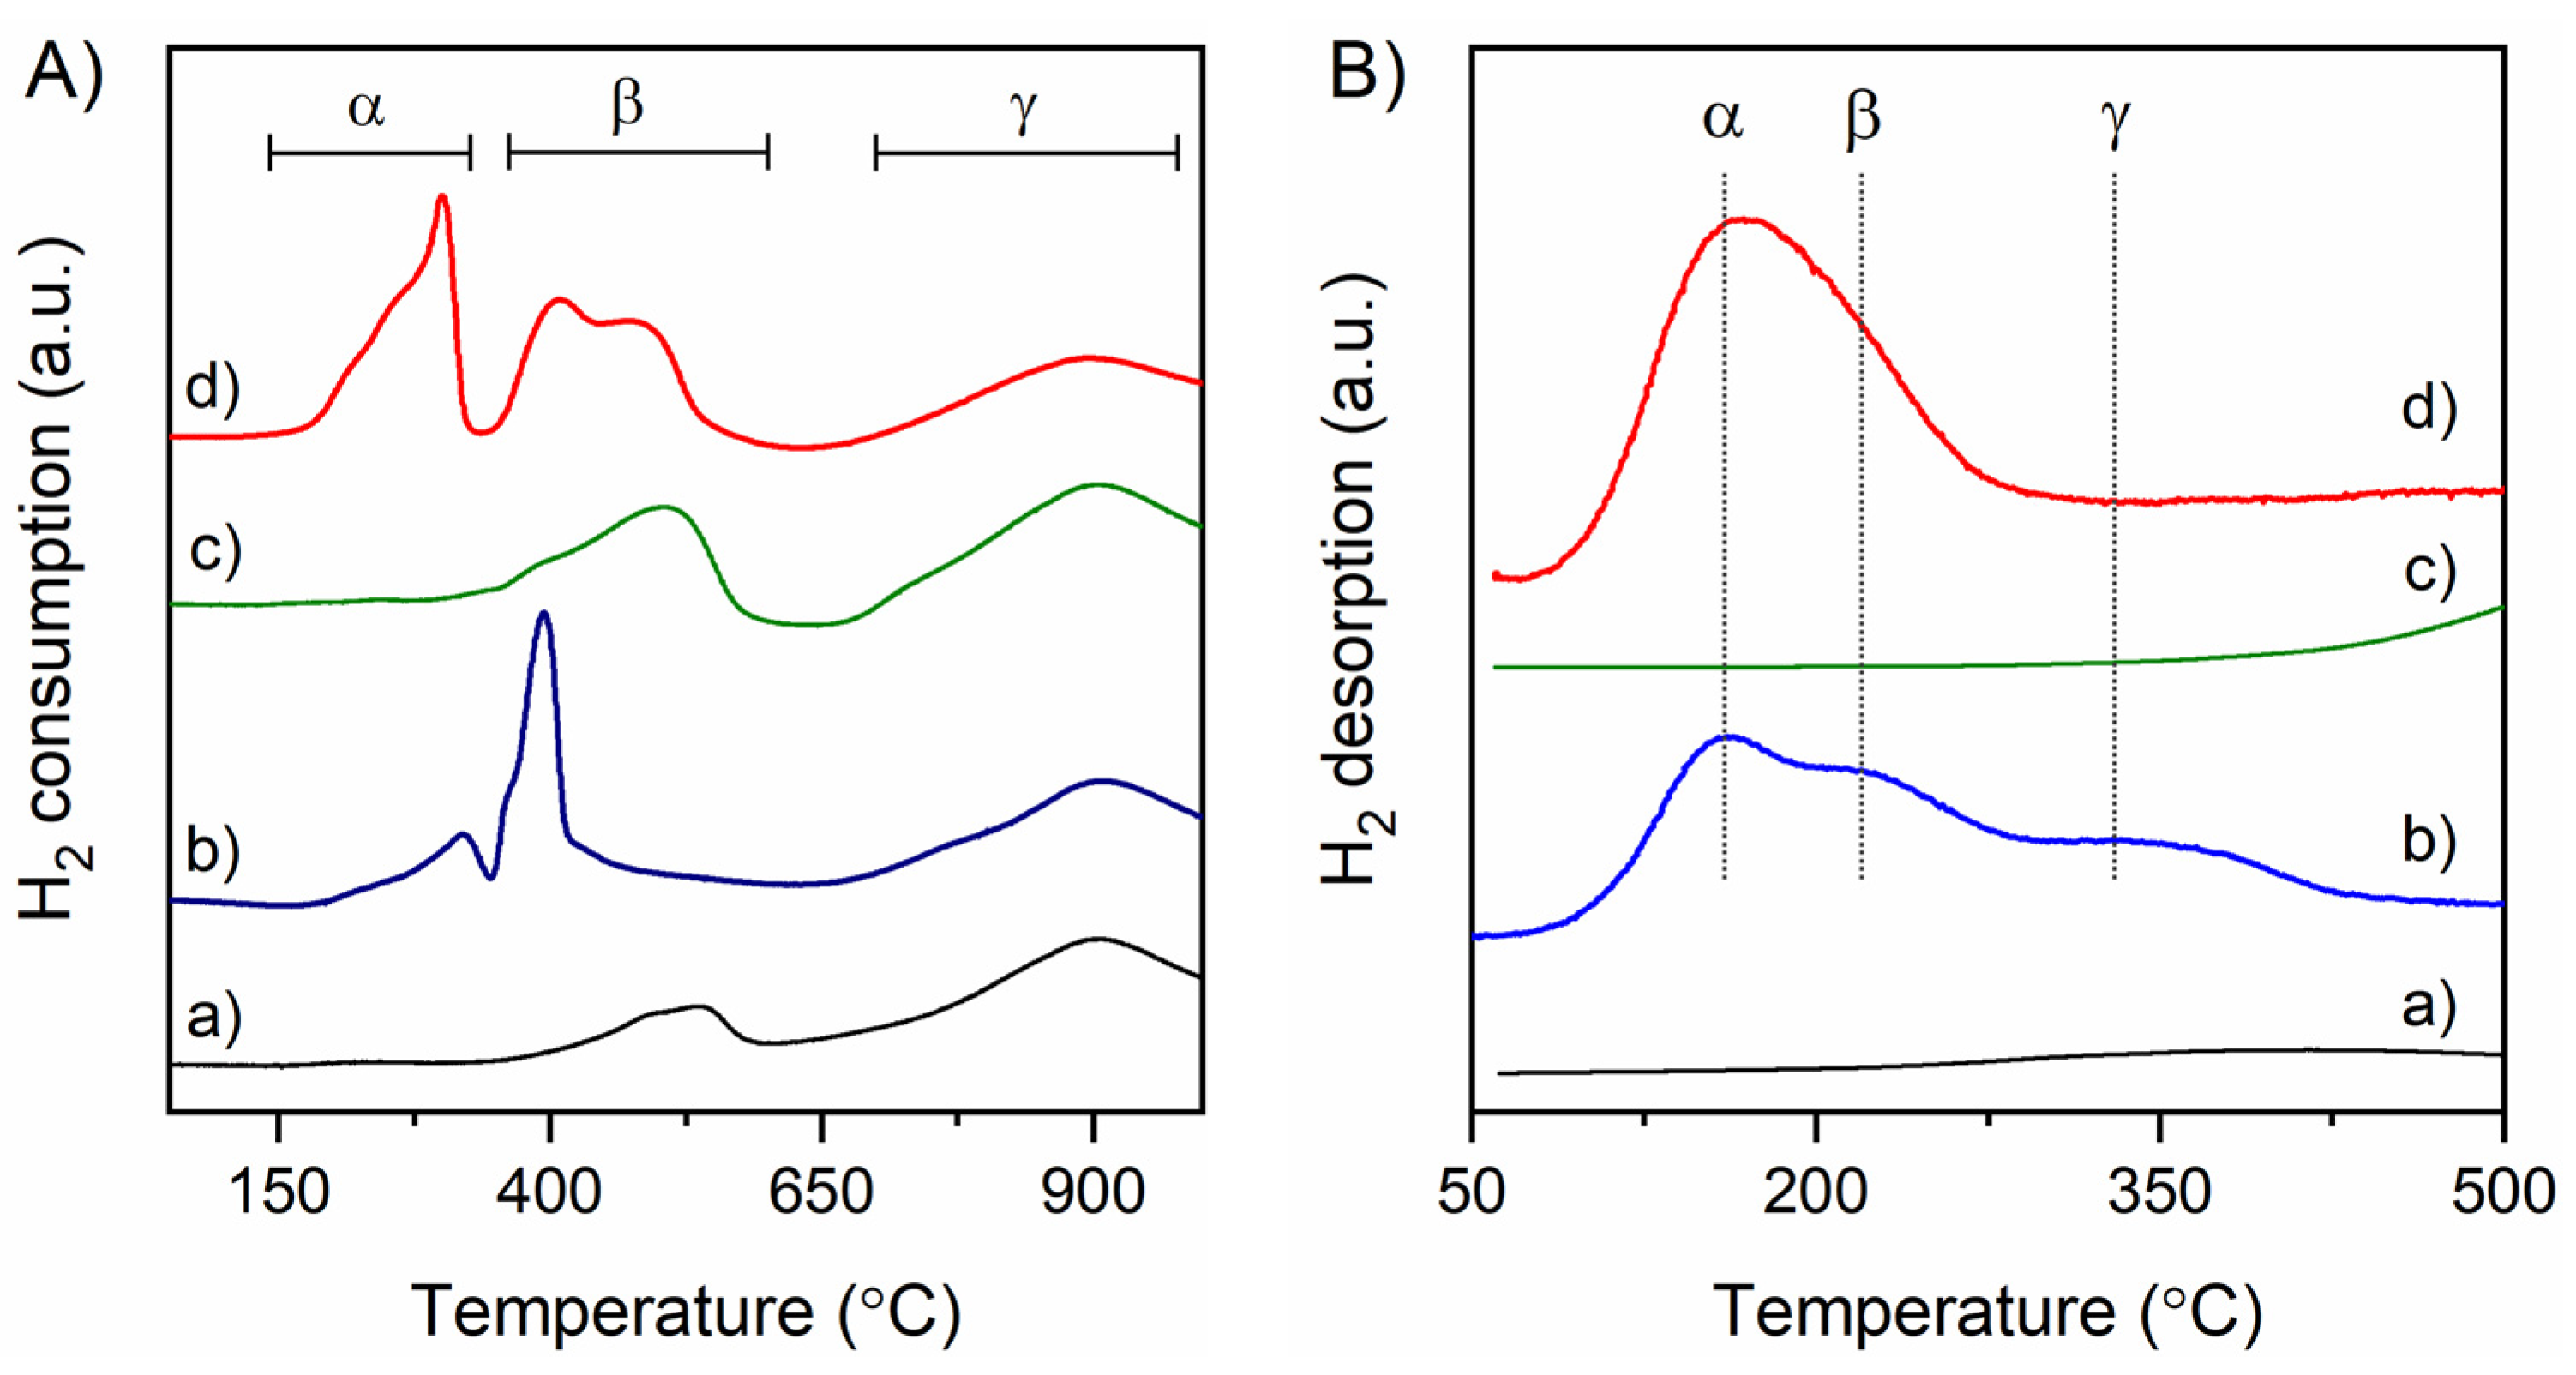
3.2. Temperature-Programmed Reduction (TPR) and Desorption (TPD) Characterization

The reducibility of the supports and associated Ni catalysts at increasing temperature (TPR) is shown in Figure 3A and the measured hydrogen consumption is listed in Table 3. The nC and nR carriers had two reduction regions labeled β and γ, respectively. The β region of the nC support (Figure 3A(a)) was characterized by two overlapping peaks, with the maximum at temperatures of 495 and 538 °C. For the nR support (Figure 3A(c)), the reduction occurred at lower temperatures and showed a much more intense peak, with the maximum at 507 °C, and a weak shoulder at 400 °C. Besides, a slightly negative signal was highlighted at about 620 °C due to the concomitant reduction of carbonates that were not removed with the pretreatment. The measured hydrogen consumption was proportional to the specific surface area, i.e., nR > nC. According to the literature, these peaks are attributable to the reduction in the first layers of the ceria surface [33]. It also depends on the exposed crystallographic planes [34], which are different for cubic and nanorod morphology. In the γ region, reduction began with a remarkably similar trend for both supports; a single large peak with the maximum at about 900 °C was evident, which did not go up to the highest temperature of 1000 °C. This peak was due to the reduction in the bulk of ceria, which was similar for both supports, not depending on the exposed surface. The intensity was lower in the nR than in the nC, due to a more significant proportion of ceria being reduced at lower temperatures [35].
The TPR profiles of the Ni-catalysts depended on the morphology of the CeO2 support. The reduction of Ni2+ occurred in two temperature ranges, between 130–340 °C, called the α region, and between 350–450 °C, i.e., superimposed on the reduction temperature of the bare CeO2 surface in the β region. The α region of the Ni-nC catalyst (Figure 3A(b)) consisted of two weak overlapping peaks at 280 °C, while the Ni-nR one (Figure 3A(d)) showed three more intense and overlapping peaks with a maximum at 270 °C. According to the literature, the α peaks corresponded to the reduction of O22−chemisorbed on the vacancies formed by some Ni2+ ions in solid solution with CeO2 [36]. However, a high hydrogen consumption was evident in the Ni-nR sample (0.44 mmol·g−1), which was more significant than the reduction of Ni loading itself (0.30 mmol·g−1), suggesting a remarkable reduction of the CeO2 surface, as previously reported in the literature [37]. Peaks in the β region were assigned to the simultaneous reduction of NiO and the CeO2 surface, the latter in a temperature range not different from that observed in the bare support. The hydrogen consumption of the Ni-nC sample (0.44 mmol·g−1) in the α and β regions was very similar to what would be expected from the reduction of NiO and the CeO2 surface of the bare support, indicating a lower interaction of NiO, with CeO2 having a nanocube morphology. Instead, in the case of Ni-nR the consumption was significantly higher (0.97 mmol·g−1), confirming a strong interaction of NiO with the CeO2 surface with nanorod morphology, favouring the Ce4+ → Ce3+ reduction. Indeed, the percentage of Ce3+ of the Ni-nR catalyst was about 23%, much higher than that of the nR support, which was about 13%, while, for the Ni-nC catalyst and the nC support, the percentage of Ce3+ was essentially the same, about 5%. On the other hand, the reduction of ceria bulk was not significantly affected by the introduction of Ni, and it occurred in the same temperature range (γ region).
The temperature-programmed desorption trend of chemisorbed hydrogen (TPD) with respect to the supports and the Ni catalysts are shown in Figure 3. From this analysis, the dispersion D (%) and the particle size d (nm) of the active Ni sites was determined, and reported in Table 3. The TPD profile of the nC support showed a very weak peak at about 400 °C, while the nR one revealed a more intense peak that started at temperatures higher than 400 °C without ending until 500 °C. These labile peaks were due to the release of chemisorbed H2 from the CeO2 surface. The TPD of the Ni-nC catalyst showed three peaks at about 160, 220, and 330 °C, which were due to the desorption of H2 from the Ni0 surface with different H-binding strength. From the peak area, the D (%) was 14%, and the dimension of the catalytically active Ni sites was d (nm) = 7. The Ni-nR catalyst exhibited a different TPD profile, with a single large peak, which was much more intense with a maximum at about 165 °C, indicating a more homogeneous H-binding strength over the Ni active surface; the D (%) was 20%, and the size of the active sites was d (nm) = 5.

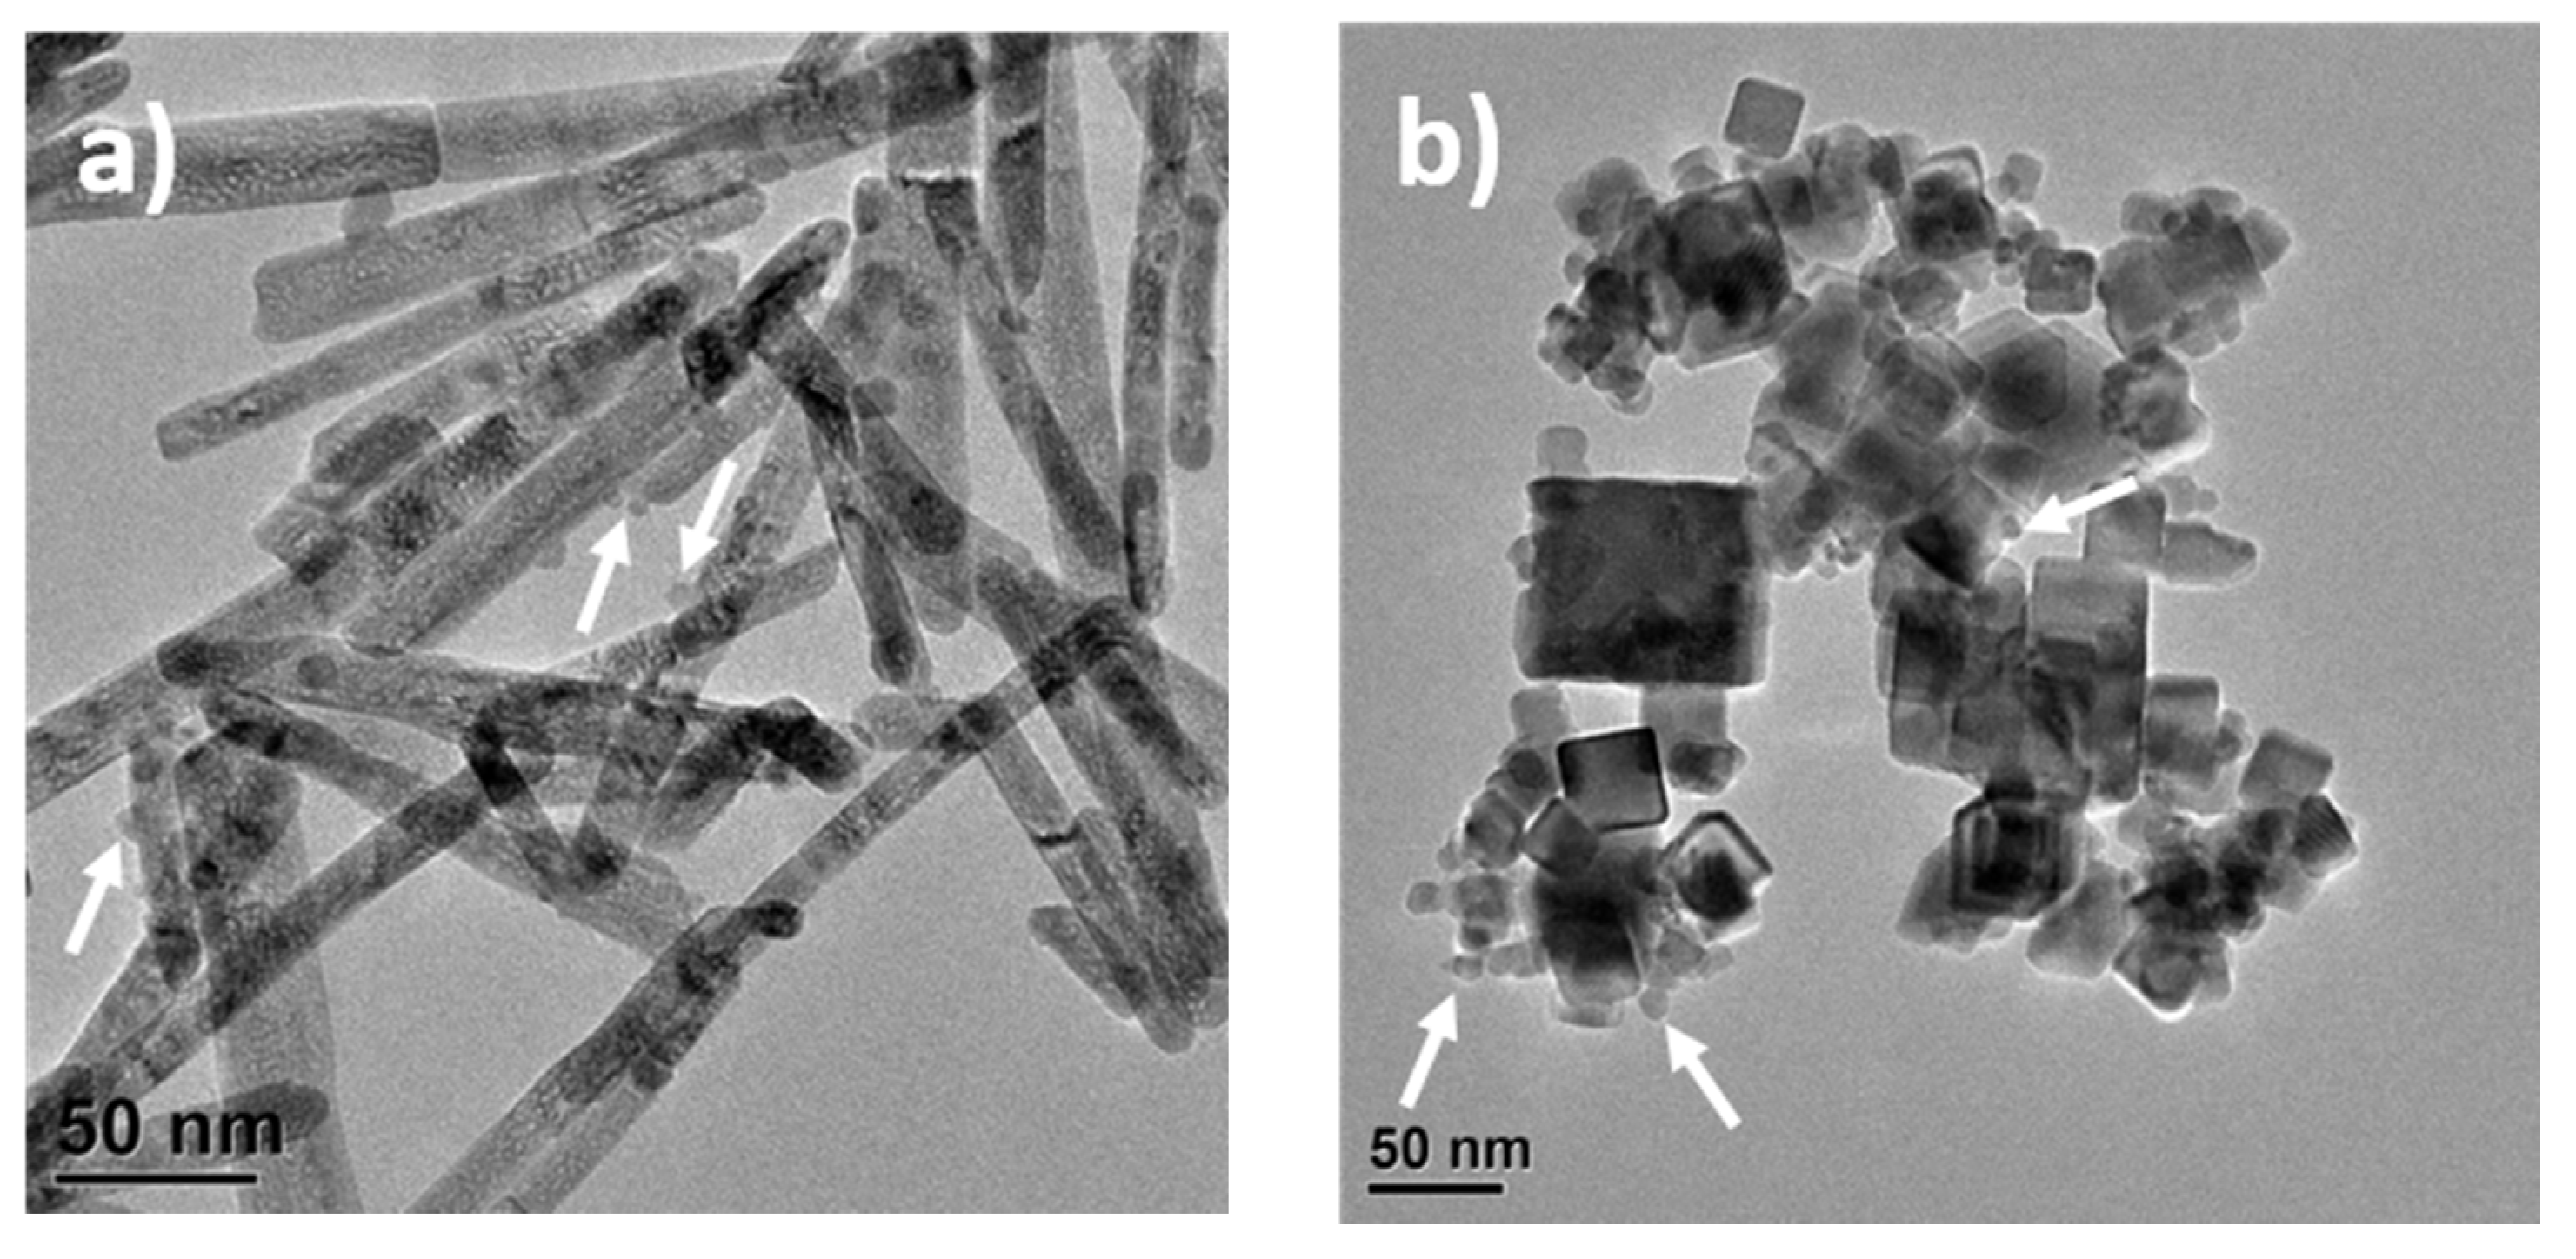
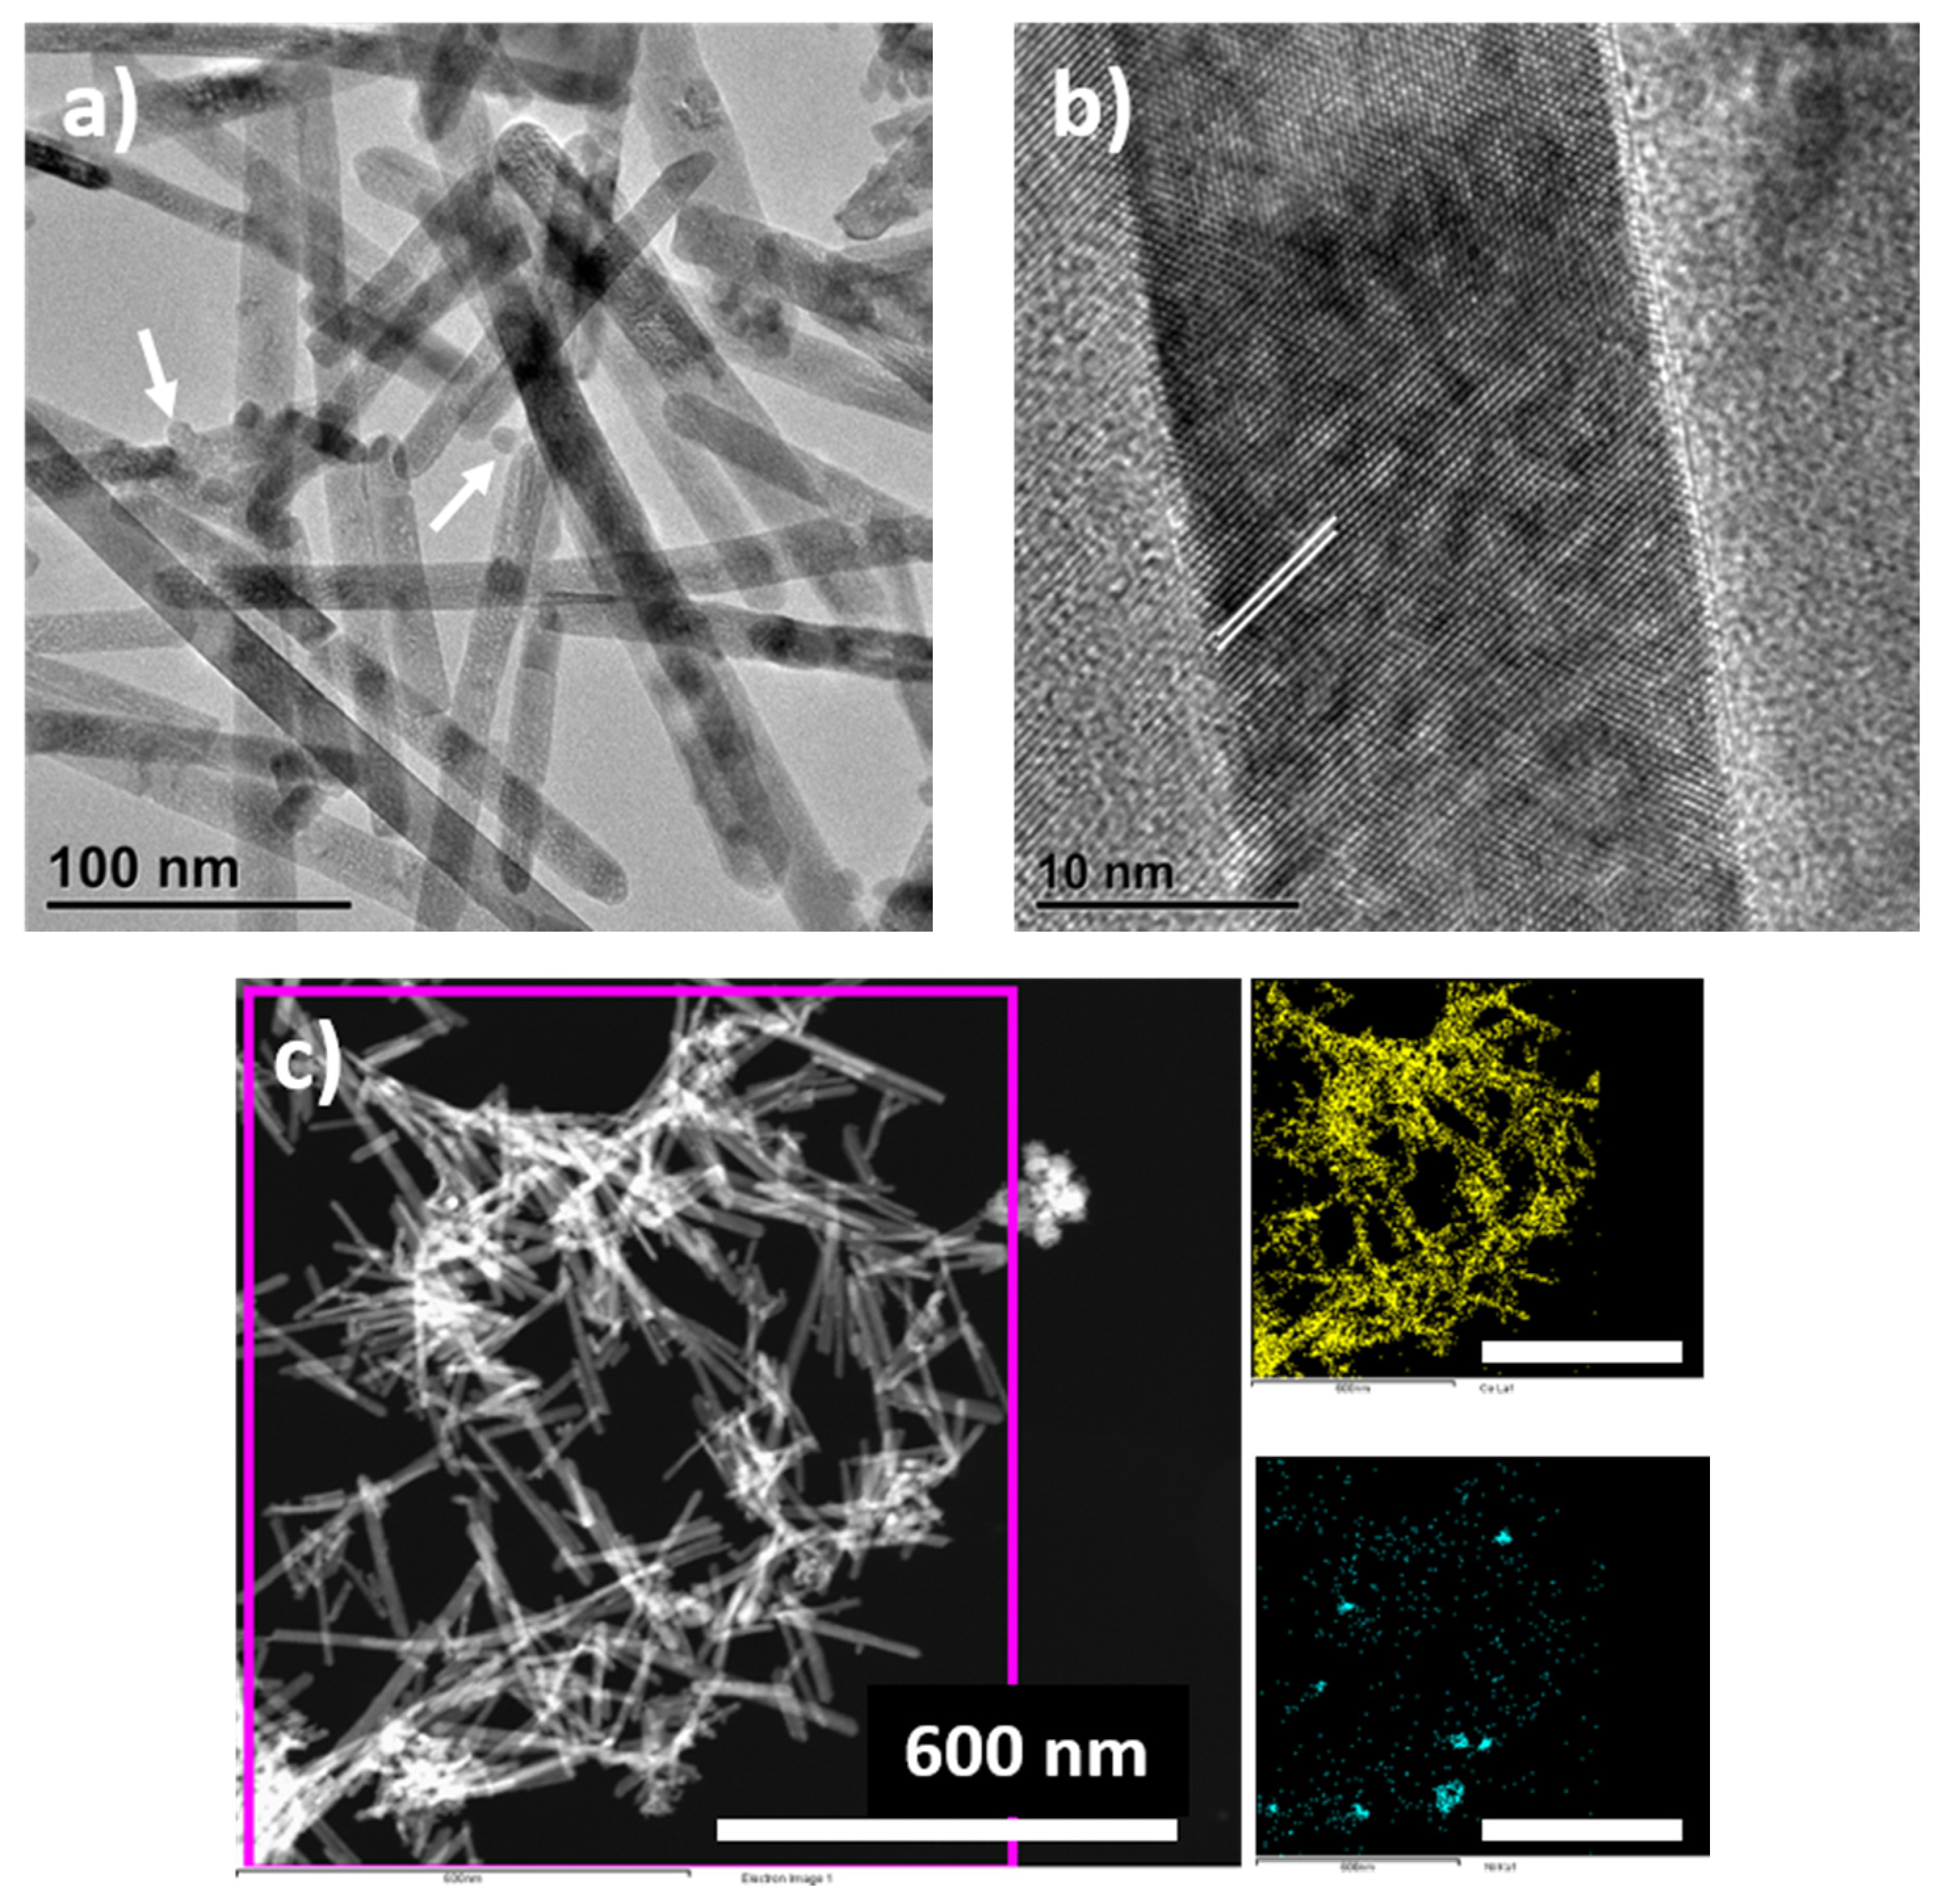
3.3. TEM Characterization of the Synthesized Catalysts

TEM images of the synthesized catalysts are shown in Figure 4, and the size distributions are shown in Figure S1. Ni-nR showed the characteristic morphology of the nanorods, with mean CeO2 width and length values of 14 ± 4 and 169 ± 68 nm, respectively. Some NiO particles with spherical morphology and an average size of 7 ± 4 nm were observed. Ni-nC showed CeO2 particles with nanocube morphology, with quite heterogeneous dimensions of 27 ± 12 nm. Moreover, significantly smaller NiO particles were seen with an average dimension of 10 ± 3 nm, larger than those observed for Ni-nR. The NiO particle size distribution was in agreement with the crystallite size determined by XRD analysis using the Scherrer equation.
These results are consistent with the reports of several authors. The morphology of CeO2 varies from nanorods to nanocubes, as the temperature increases in the hydrothermal process [38]. For NiO, a strong effect of the temperature used in the hydrothermal process on the morphology and particles size was also demonstrated. In general, an increase in the nanoparticles size was obtained at higher temperatures [39,40].

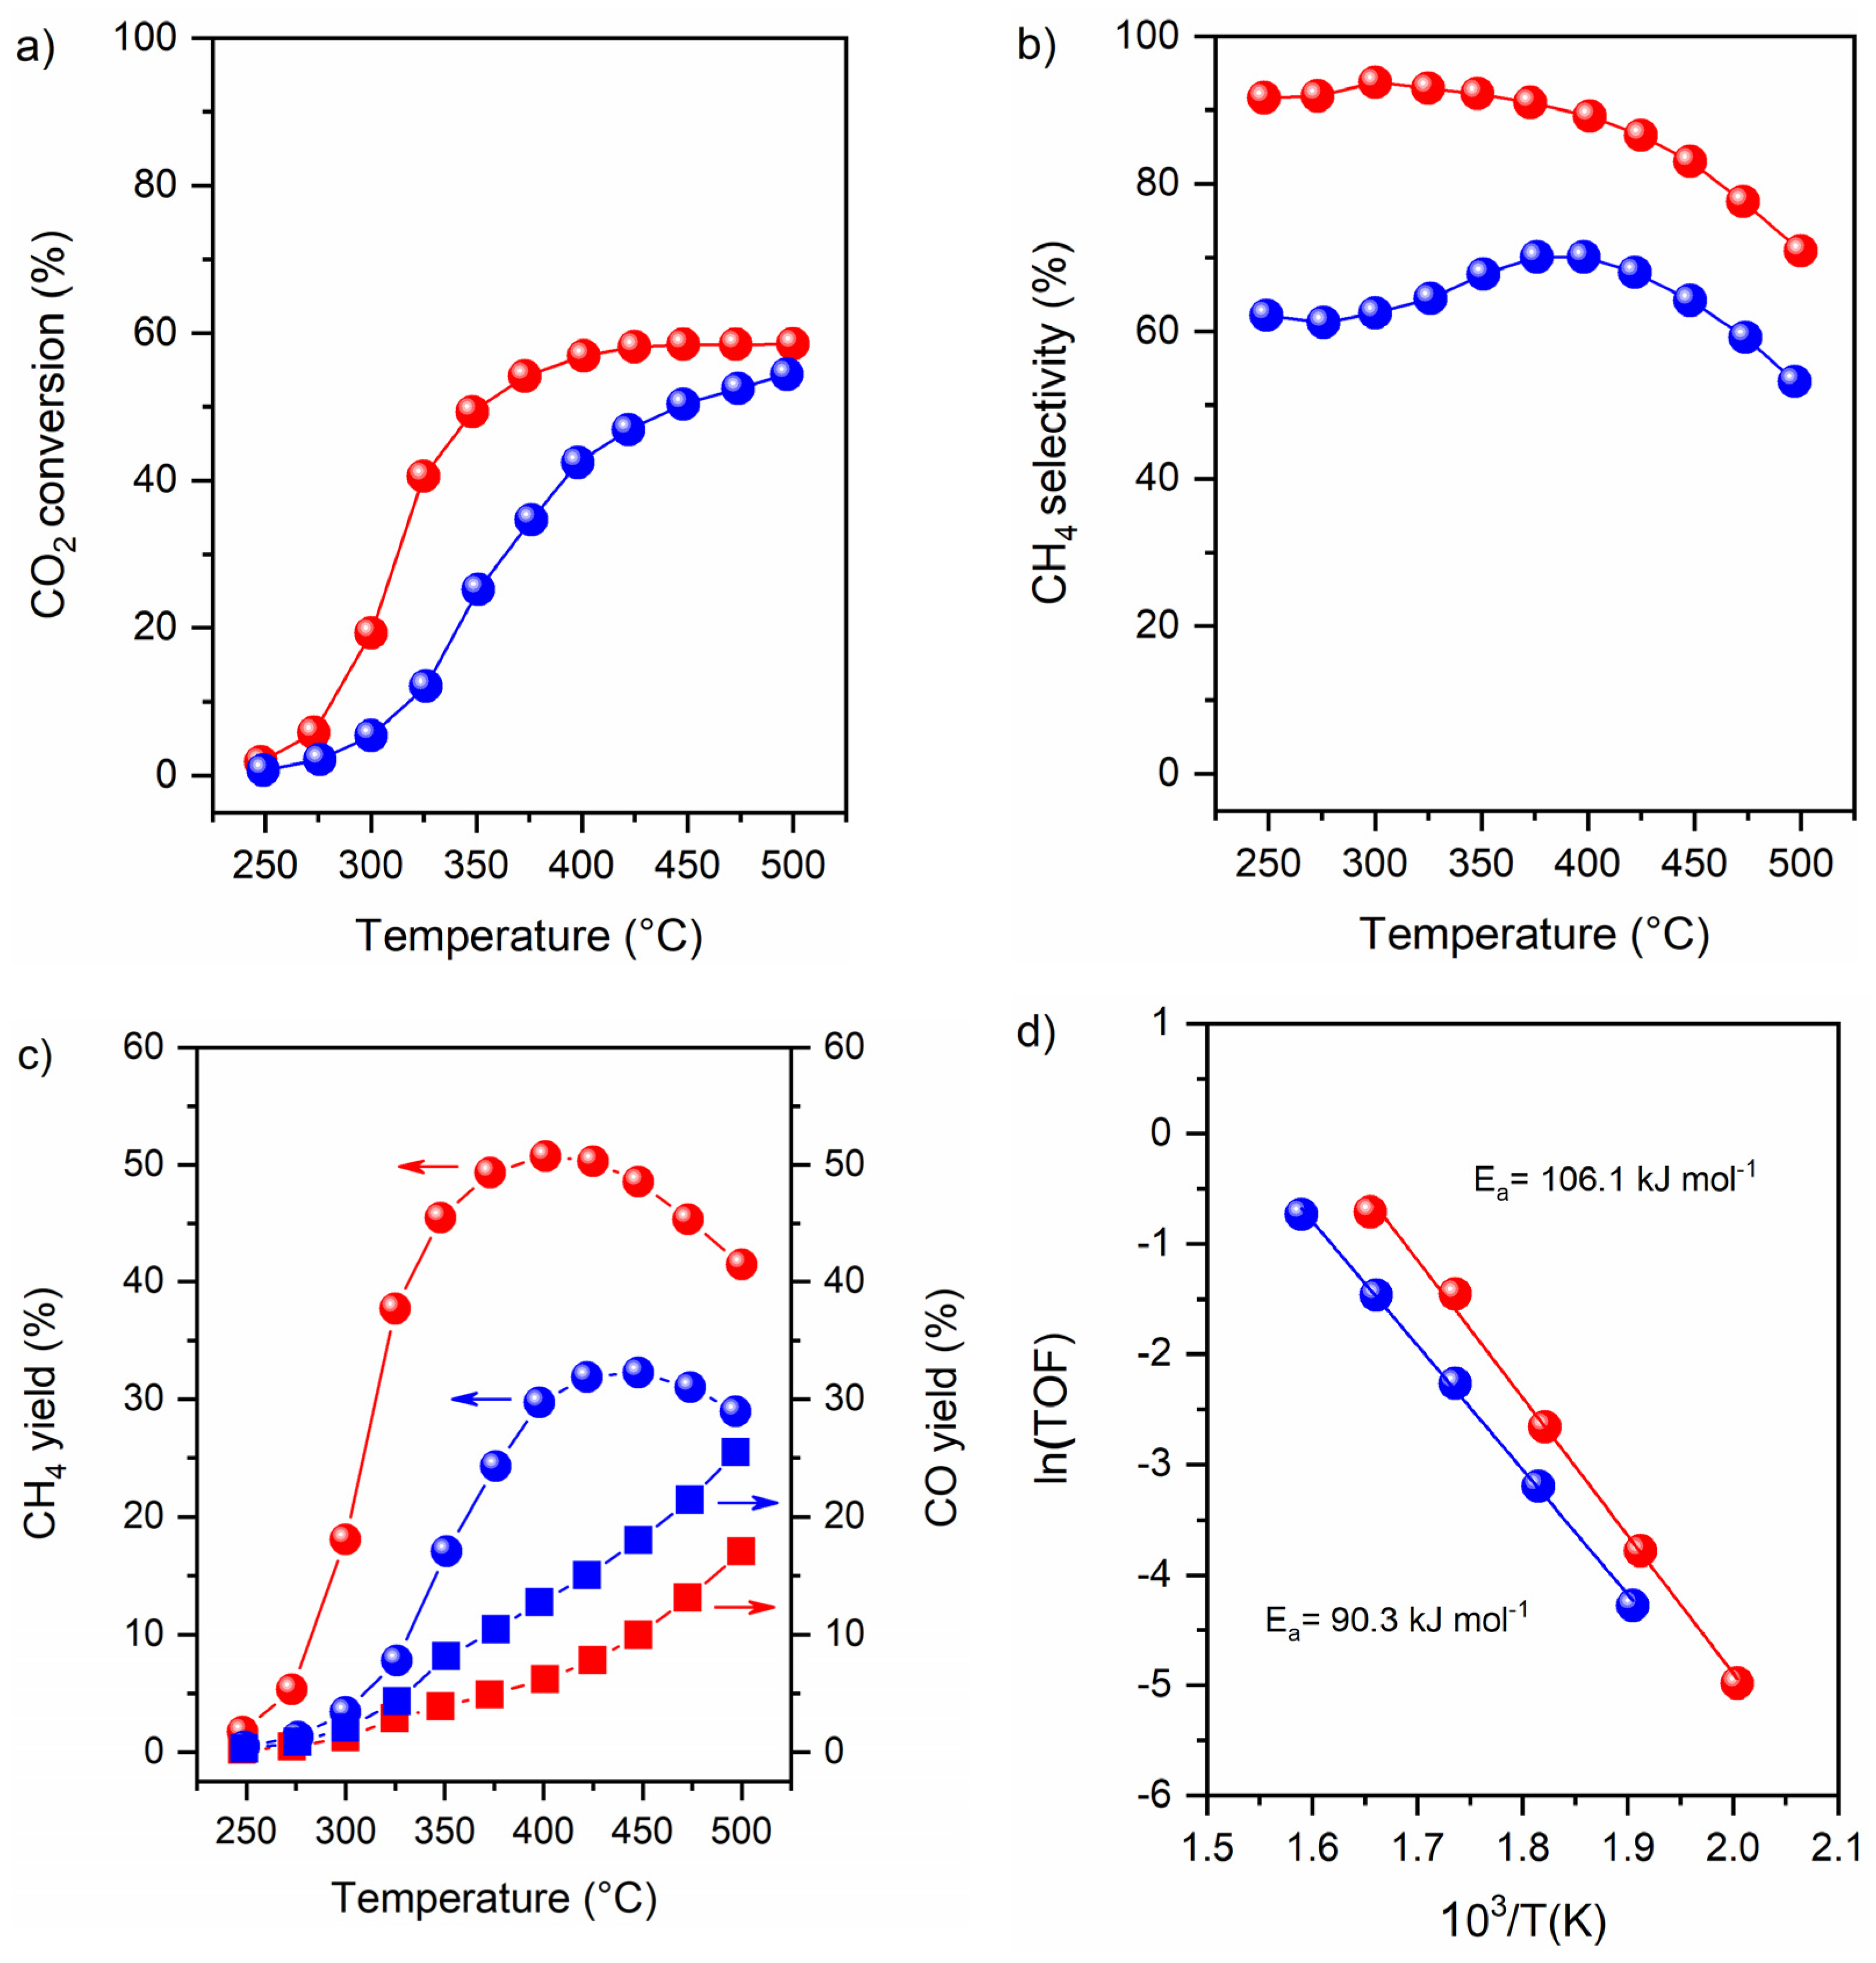
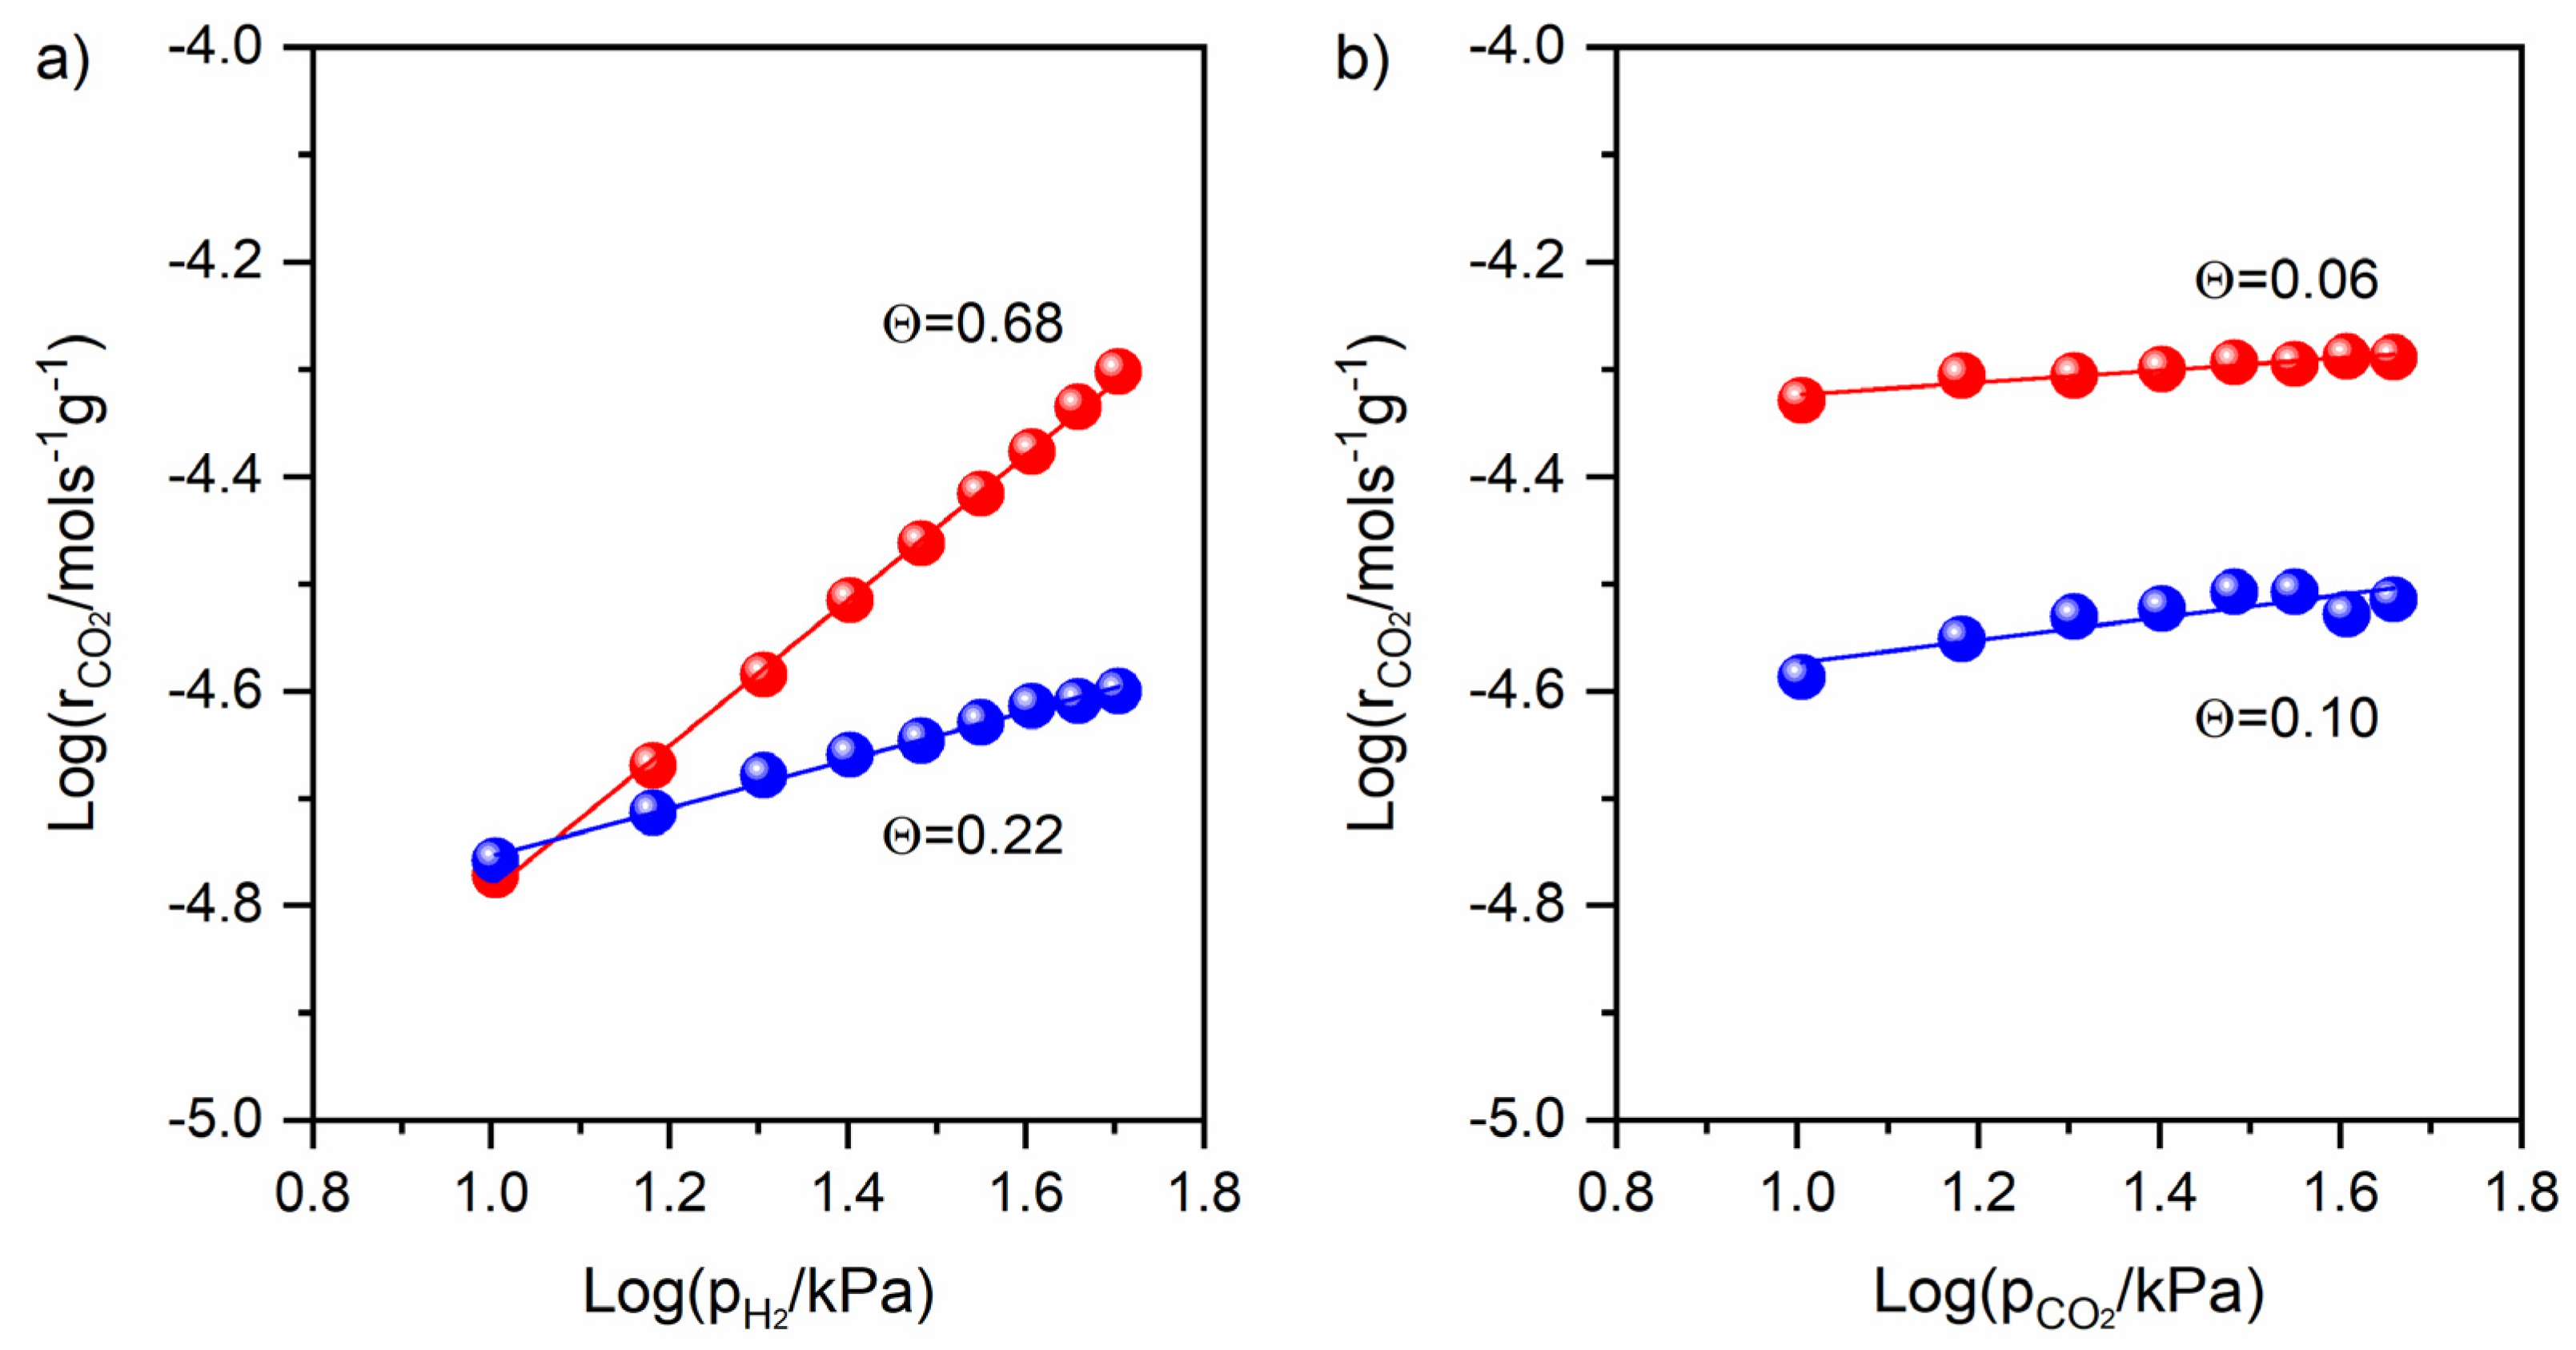
3.4. Catalytic Activity
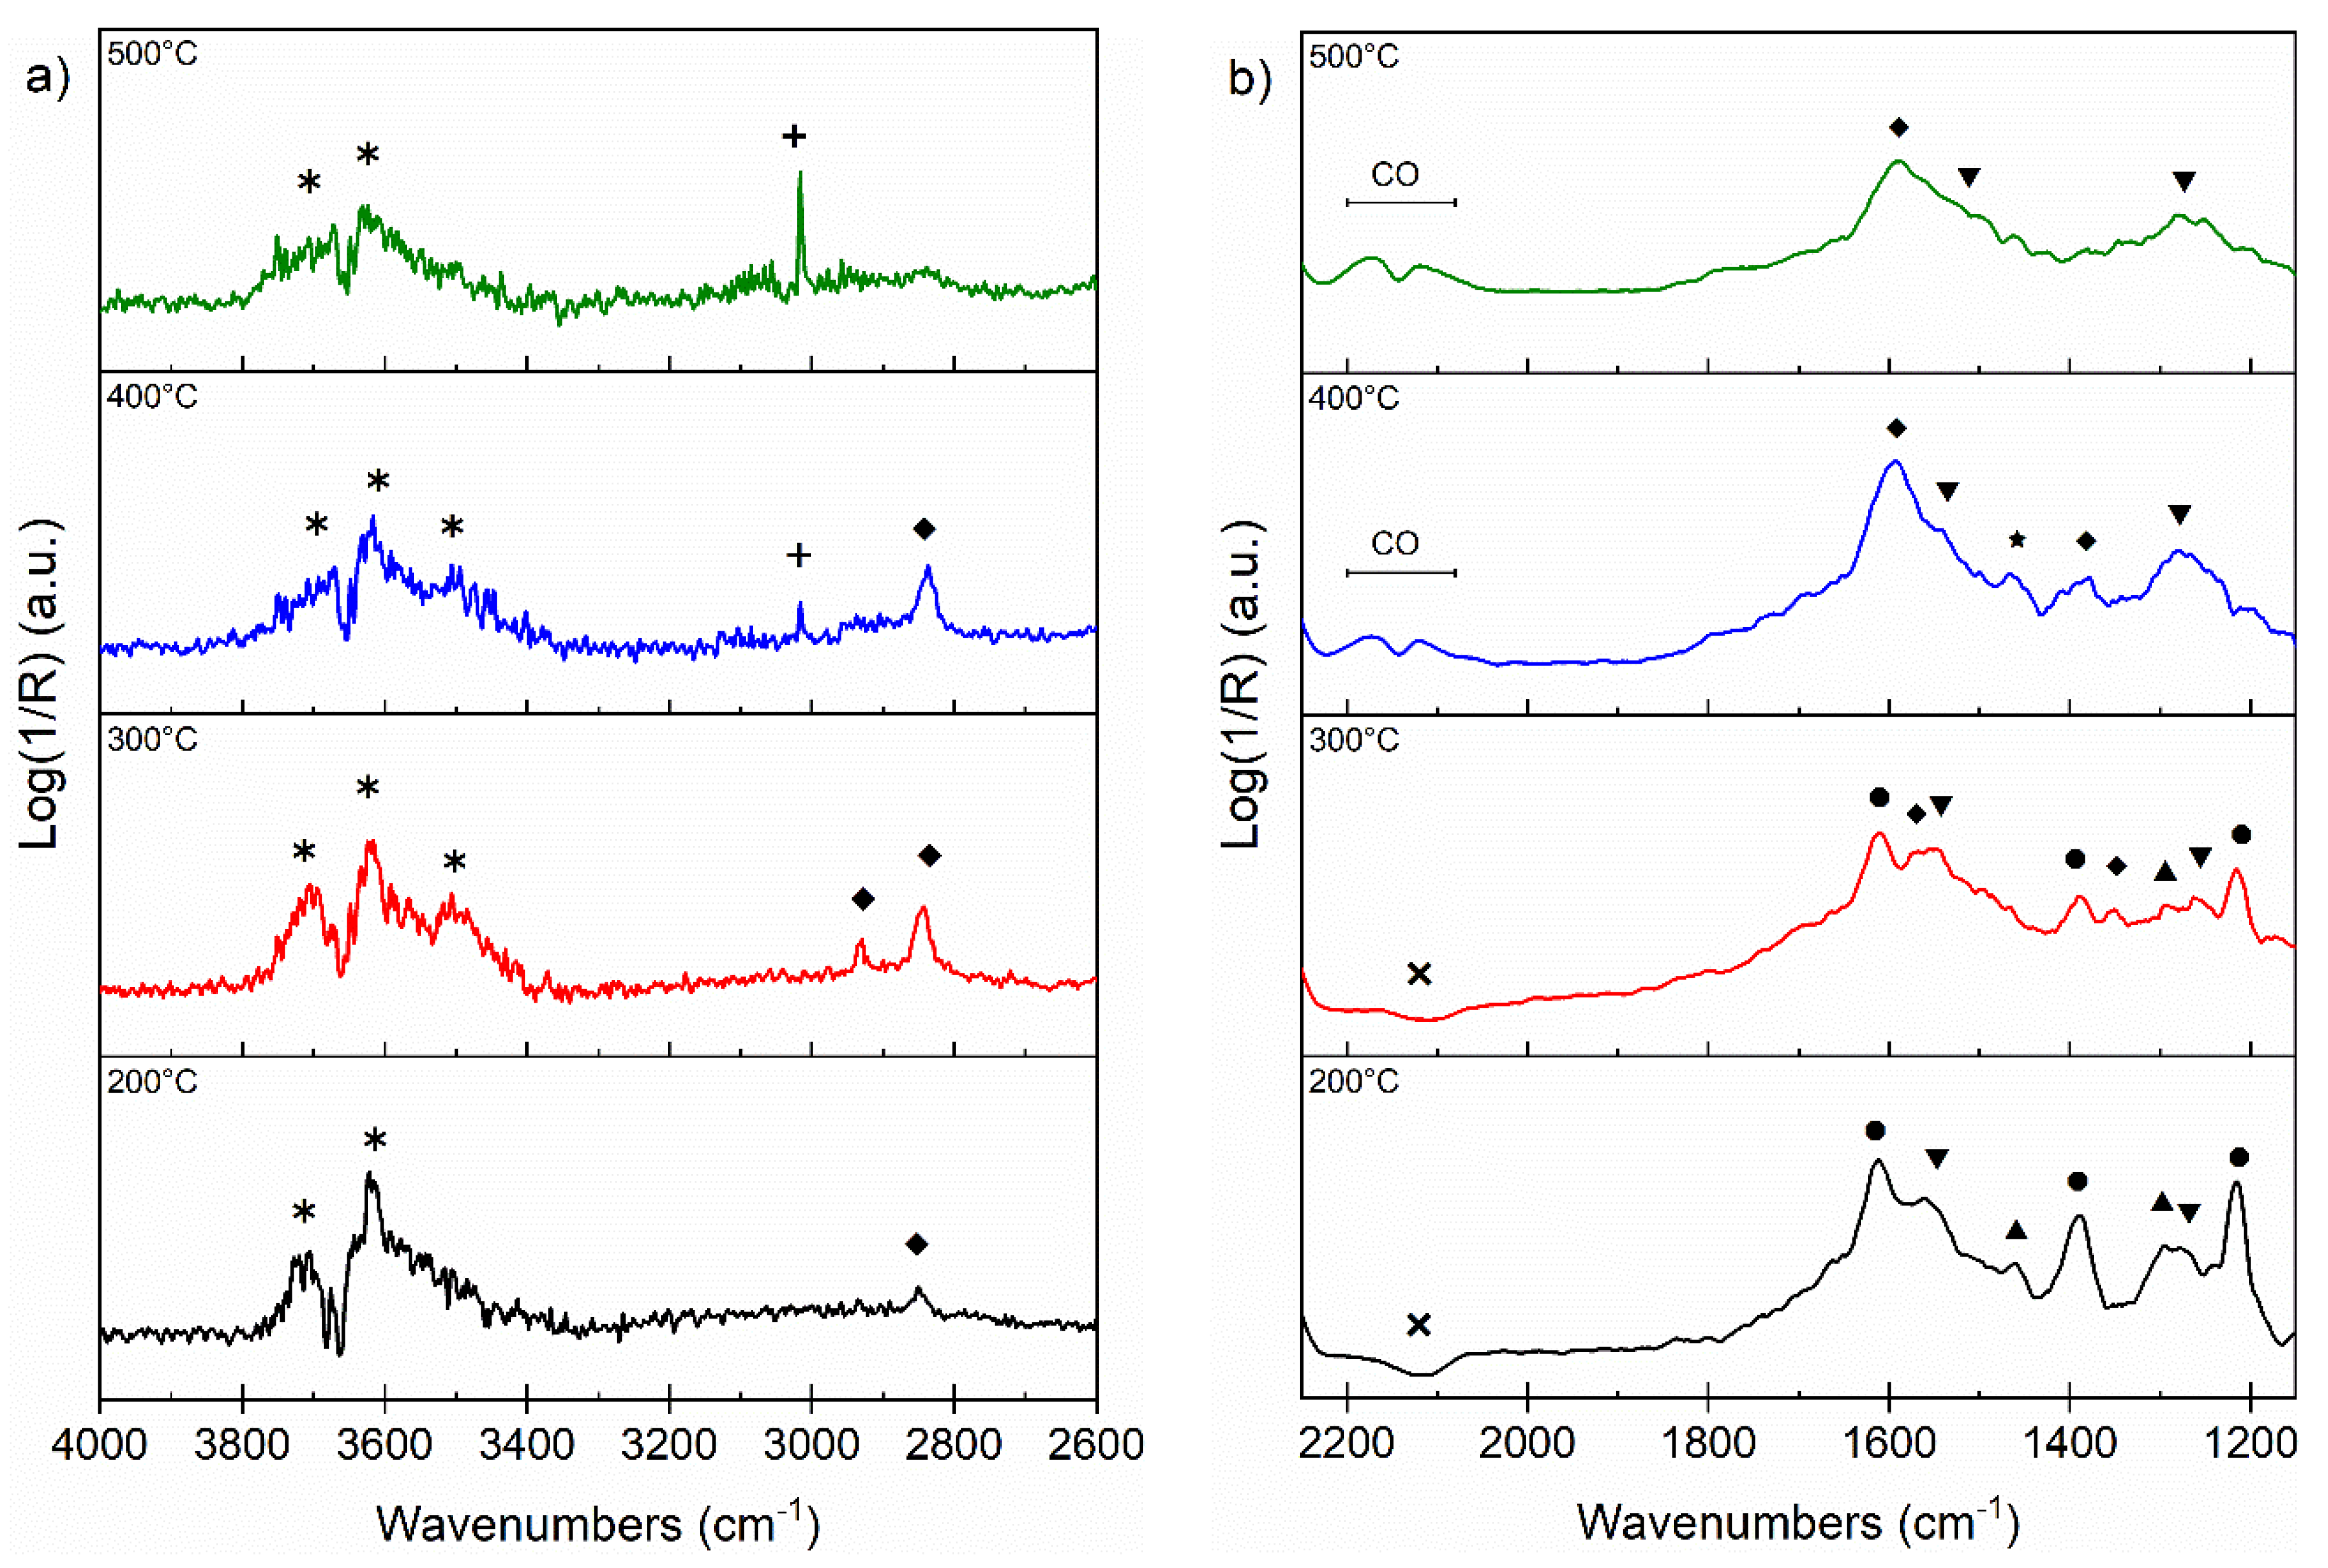
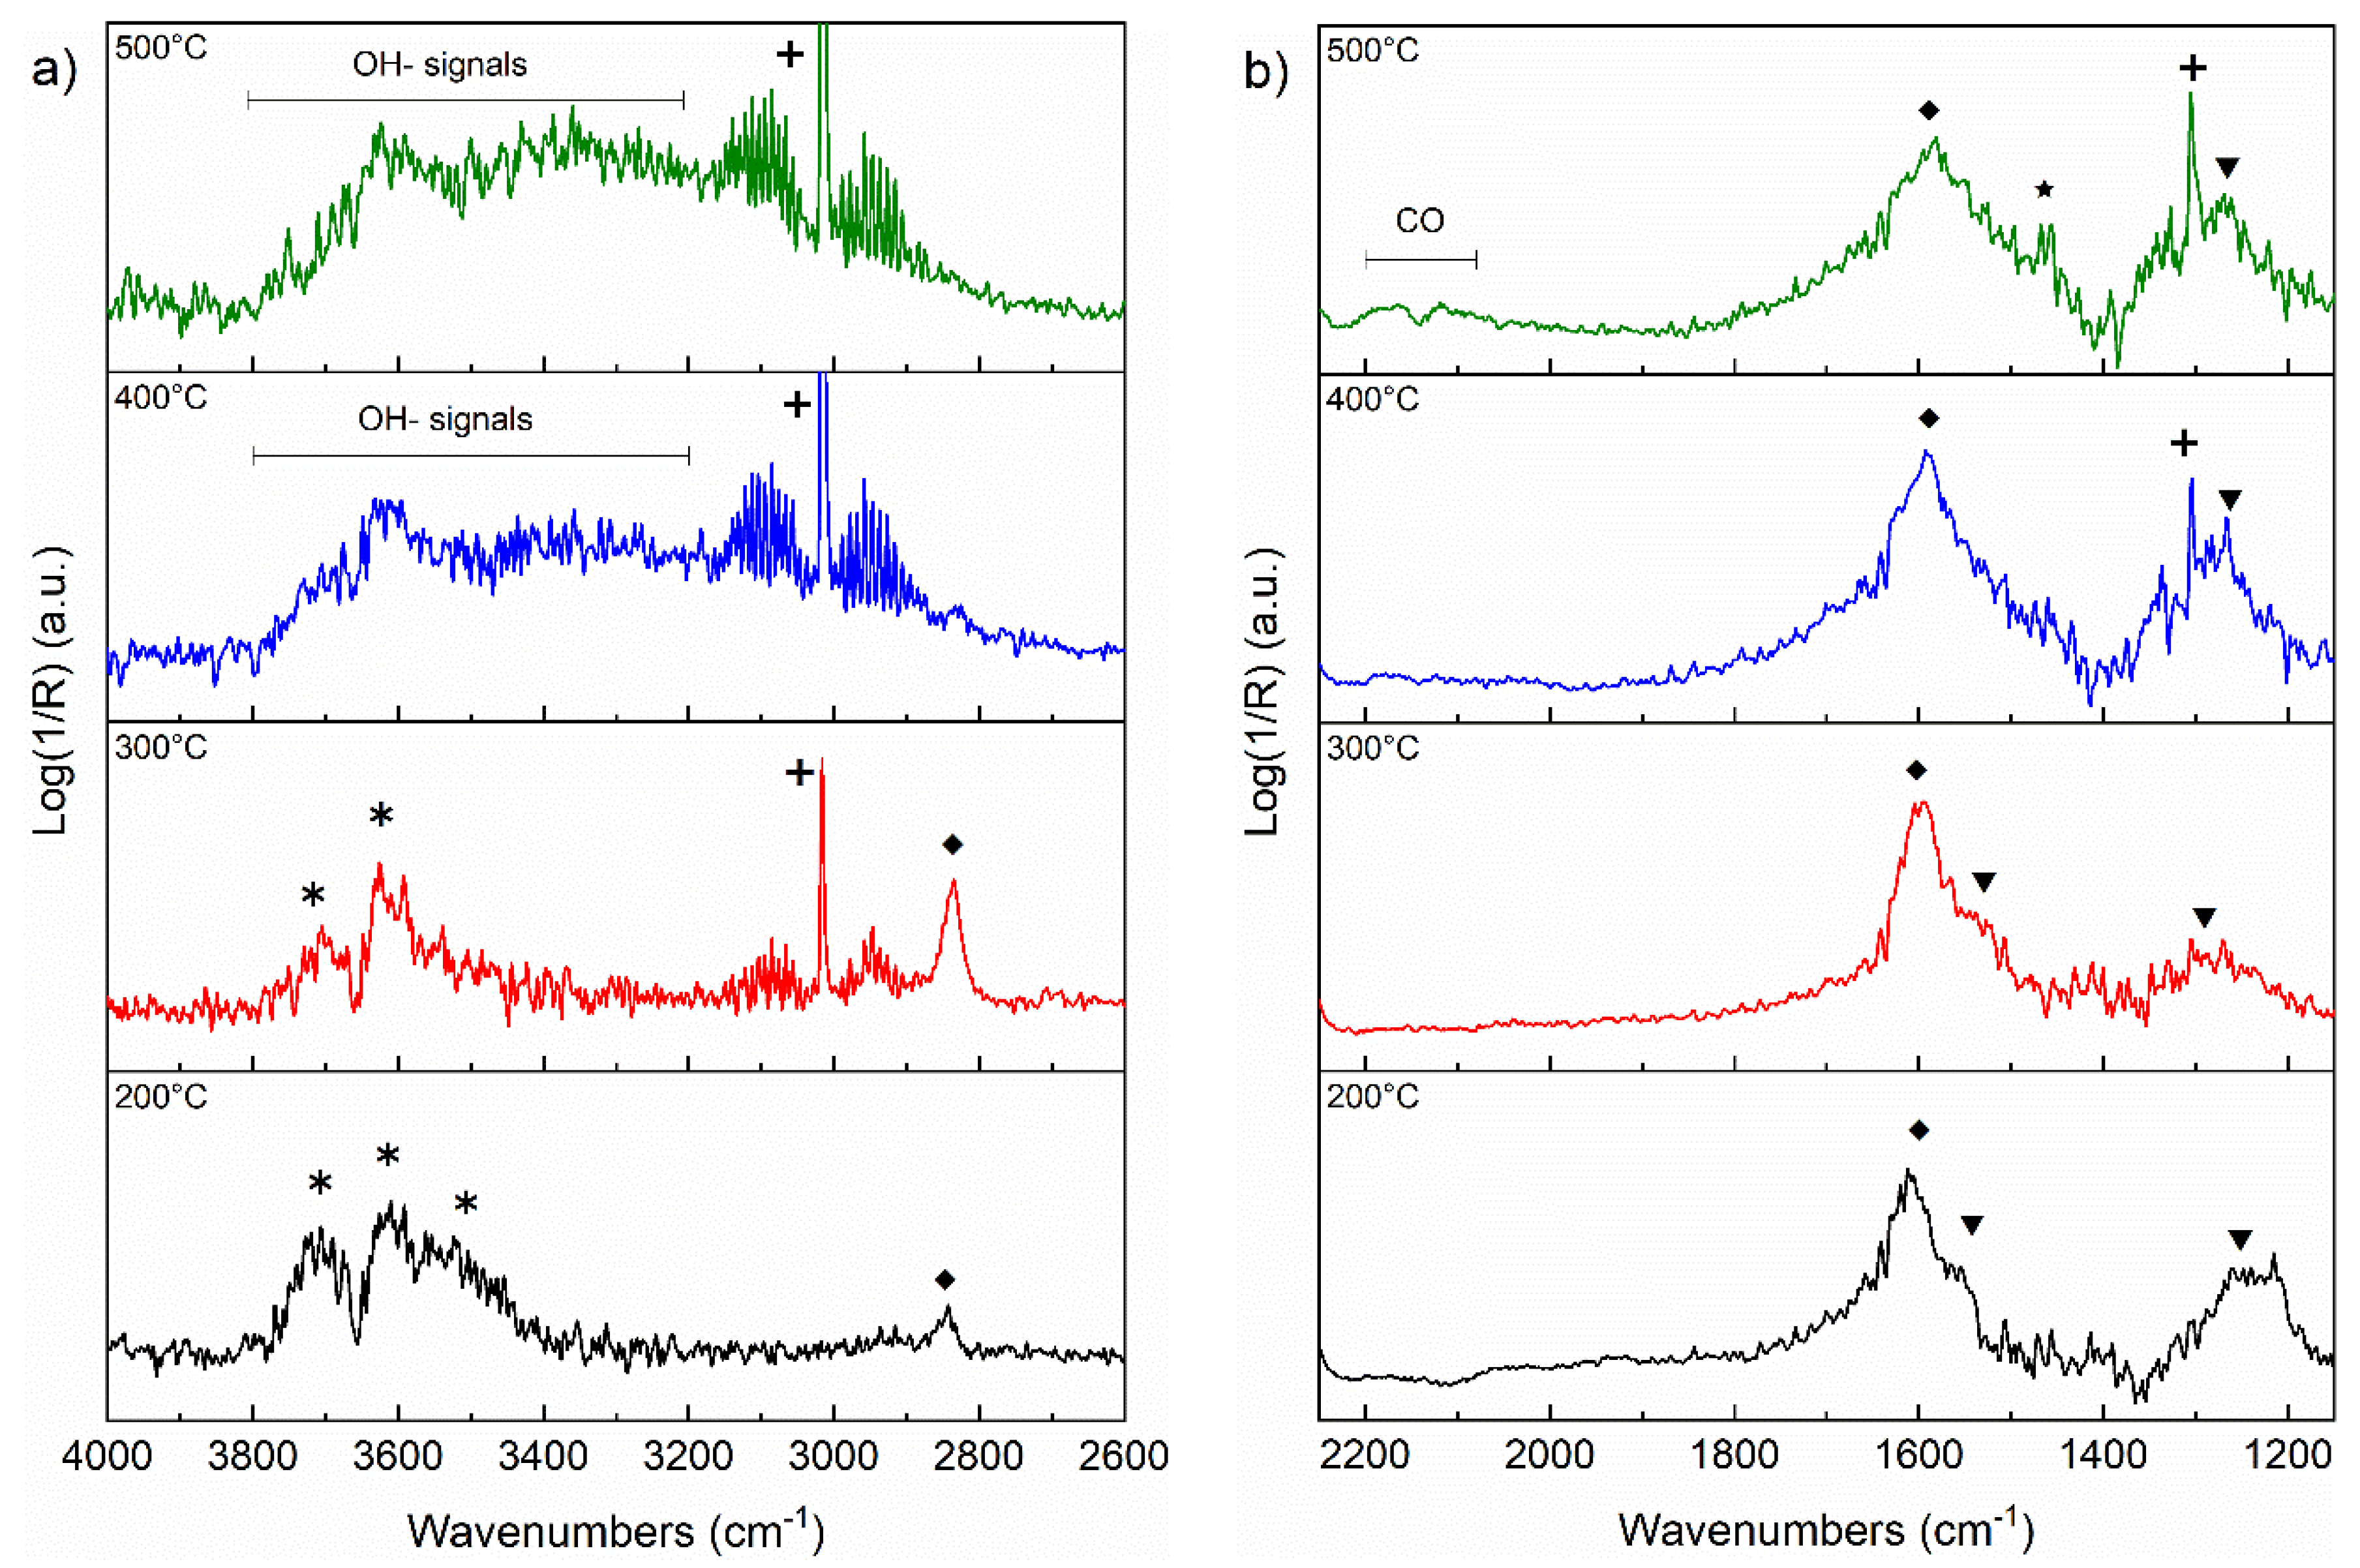
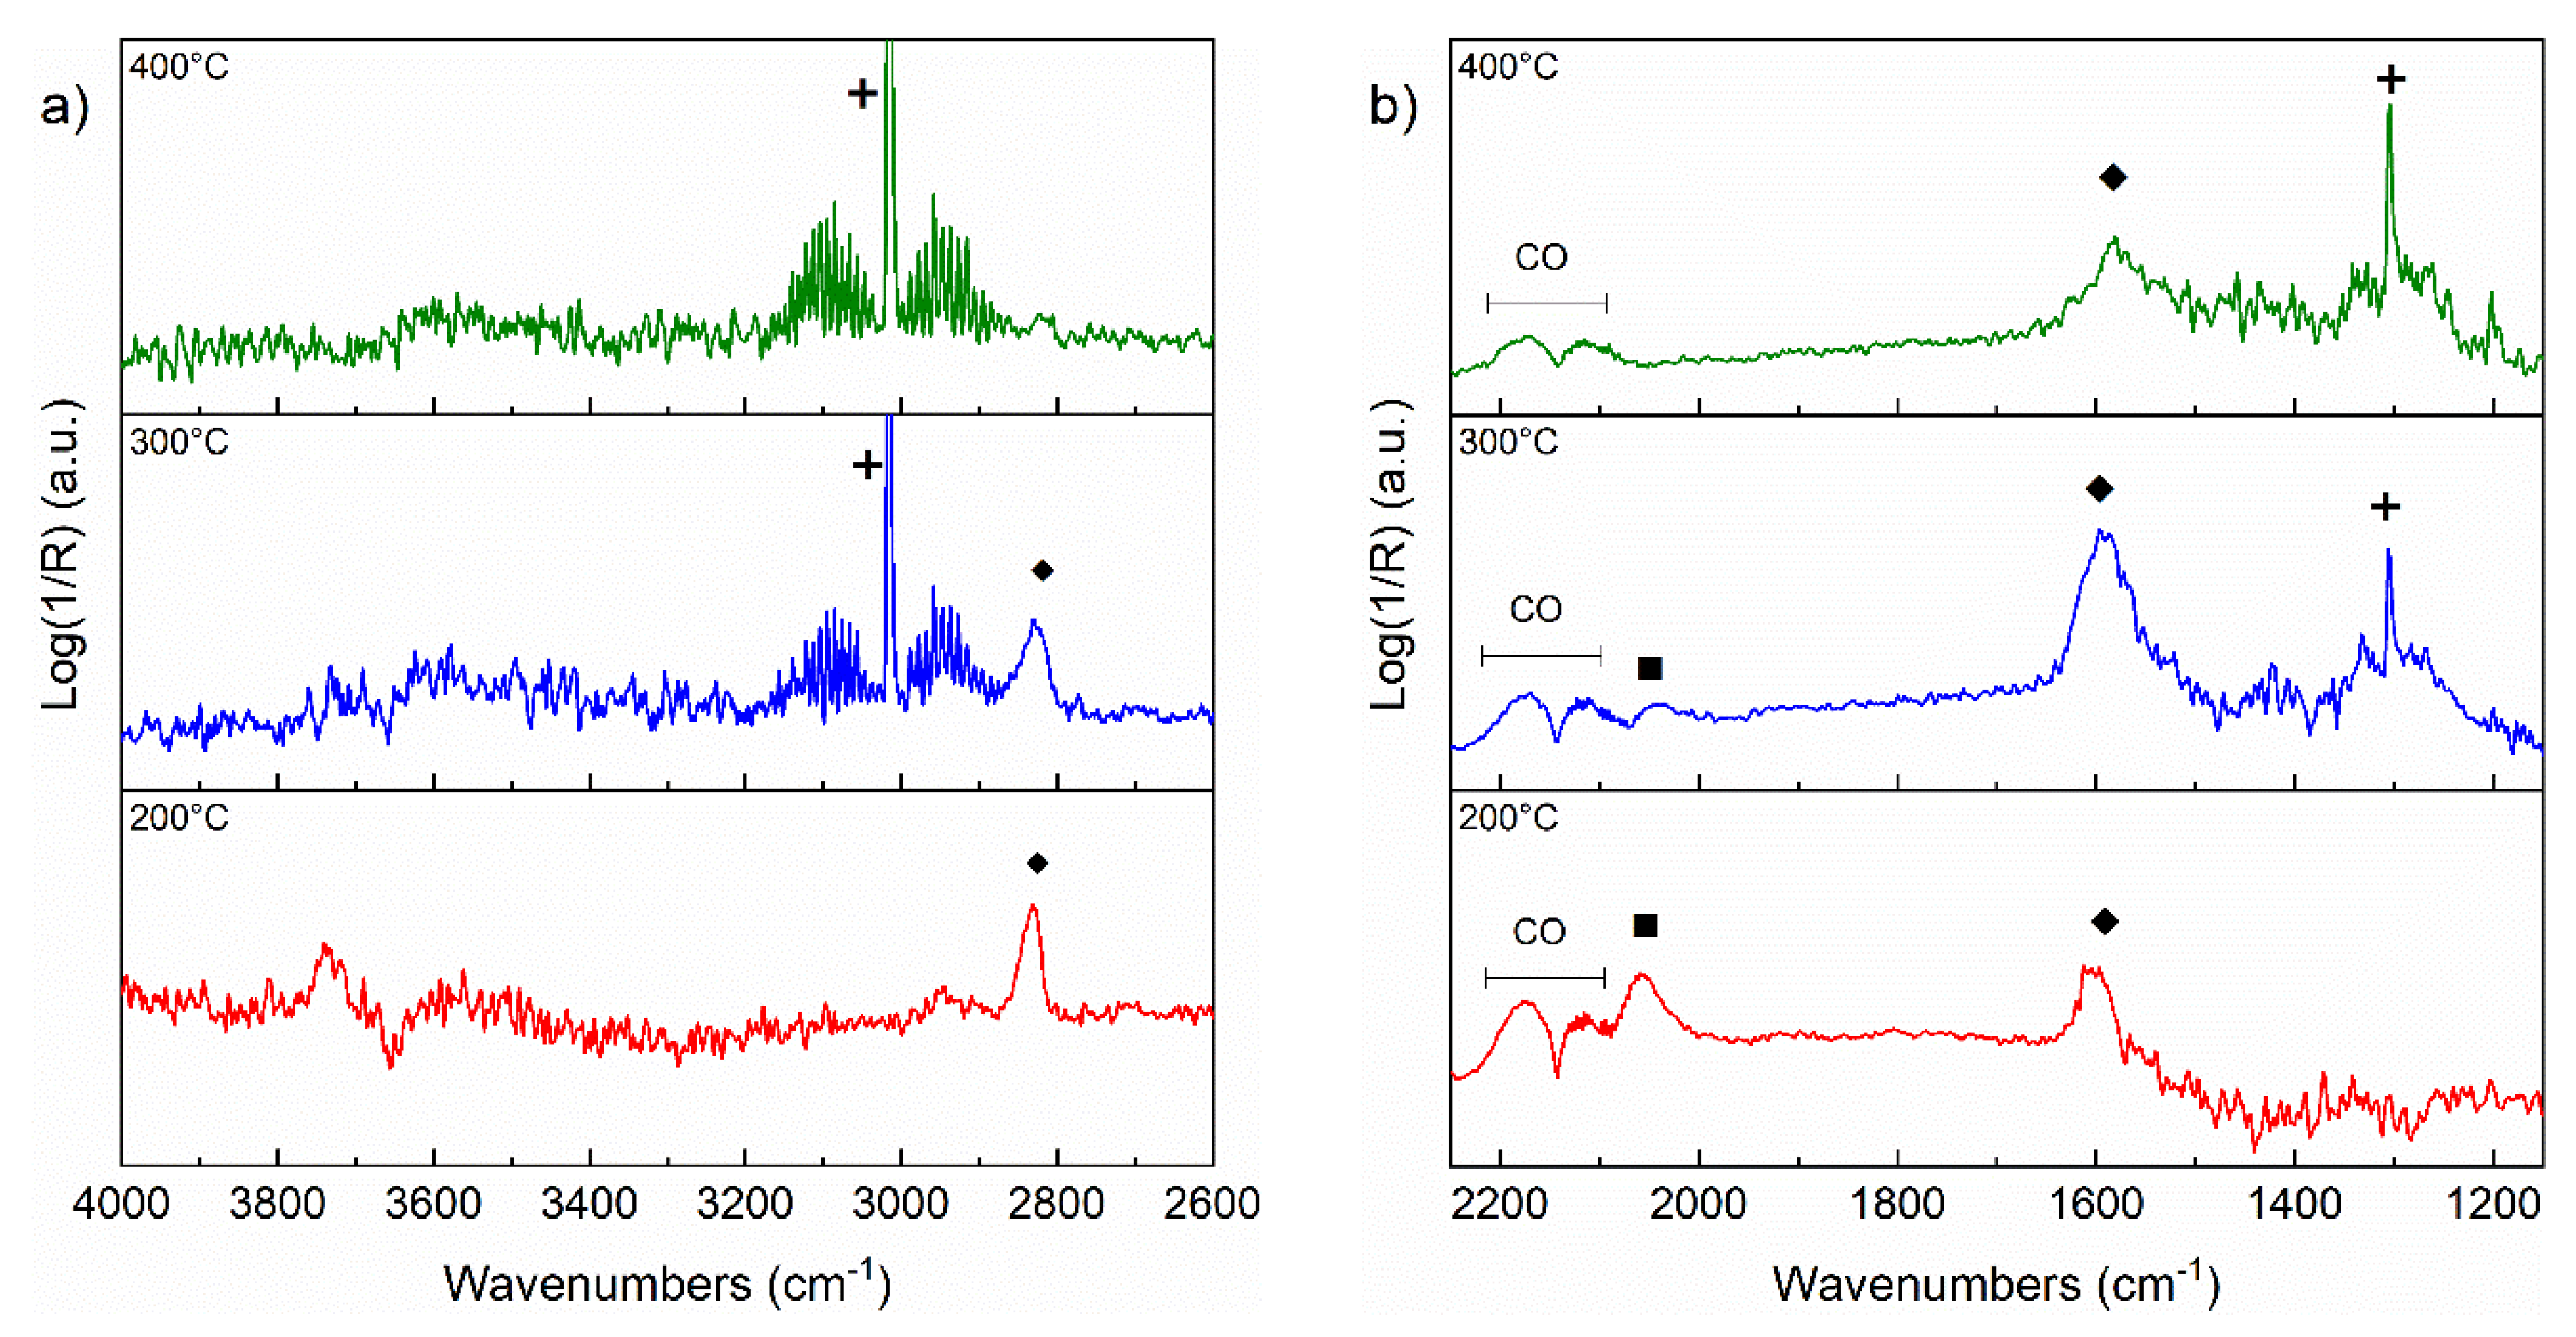
The catalytic activity performances were evaluated in the temperature range of 200–500 °C, as shown in Figure 5a. Although CO2 methanation is strongly exothermic and thermodynamically favored at low temperatures, the conversion threshold for both catalysts began above 275 °C. The CO2 conversion light-off curve of the Ni-nR catalyst increased rapidly to a maximum of about 55% at 400 °C, and then remained constant until 500 °C. The Ni-nC catalyst showed a much lower conversion. For example, at 325 °C, the conversion was 12%, while it reached a value of 40% for the Ni-nR catalyst. However, due to the progressively increasing trend, a conversion of about 48% was obtained at 500 °C, which is not different from that obtained with the nanorod morphology. It is essential to mention that the CeO2 supports did not exhibit any catalytic activity under the assumed conditions. Only the nanorod form conversion of about 2%, mainly to CO, was observed at the highest temperature of 500 °C.
The selectivity to methane is plotted in Figure 5b. It was significantly higher for the Ni-nR, starting from 90% at 250 °C, and gradually decreasing to 70% at the highest temperature of 500 °C, while a particular trend was observed for the Ni-nC, where the selectivity started from 62% at 250 °C, and reached a maximum of 70% at 370 °C, and then decreased again to 53% at 500 °C. The yields of methane and carbon monoxide are reported in Figure 5c. The CH4 yield had an increasing trend, reaching a maximum of 51% at 400 °C for the Ni-nR and 32% at 450 °C for the Ni-nC, and decreased again at higher temperatures. On the other hand, the yield of CO increased exponentially for both catalysts, but it was significantly lower for the Ni-nR, reaching 17% at 500 °C in contrast to a value of 25% observed for the Ni-nC one.
From the Arrhenius plot of TOF for CO2 reduction rate shown in Figure 5d, the apparent activation energies were 90.3 and 106.1 kJ mol—1 for the Ni-nC and Ni-nR catalysts, respectively. The slight difference in the activation energy can be attributed to the exposed crystallographic plane of ceria, involved in CO2 activation, and the Ni particle size’s effect on the interaction with H2 and CO2. In particular, the surface of CeO2, with the nanocube morphology, exposes only the (100) faces, while the nanorod morphology exposes both the (110) and (100) faces [34,41]. The effect of such exposed faces on the formation of oxygen vacancies is not fully defined [42]. The role of Ni particle sizes on the reaction mechanism, affecting the selectivity to CH4, may also significantly alter the apparent activation energy [43]. Moreover, the TOF increased for smaller metal size, e.g., the TOF of the Ni-nR sample with a Ni0 particle size of 5 nm was 0.23 s−1 at 300 °C, while the TOF of the Ni-nC sample with a Ni0 size of 7 nm decreased significantly to 0.10 s−1. This confirms a positive effect of the nanorod morphology on the catalytic activity, also due to the larger dispersion of the active Ni sites.
To further highlight the differences among the Ni-nR and Ni-nC, the kinetic rate expressed by a power-low model r C O 2 = k · P H 2 x · P C O 2 y was determined at 350 °C at different reactant partial pressures with a WHSV of 240,000 cm3g−1h−1, ensuring reactant conversions of less than 15%. The logarithmic dependence of the kinetic rate on the partial pressure of the reactants is shown in Figure 6. Although the different reactive steps involved in the kinetics were not highlighted, this was an essential method to compare the two catalysts. The Ni-nR catalyst showed a clear dependence of the CO2 conversion rate on the increase of the H2 partial pressure, resulting in an apparent reaction order of x H 2 = 0.68 , while the effect of the CO2 partial pressure was negligible and the apparent reaction order was y C O 2 = 0.06 . Therefore, the rate equation could be approximated as a near first-order dependence on H2 pressure: r C O 2 = k · P H 2 0.68 · P C O 2 0.06     k · P H 2 0.68 . For the Ni-nC catalyst, the influence of the H2 partial pressure on the CO2 conversion rate was much less pronounced with a value x H 2 = 0.22 , and the contribution of CO2 pressure was even smaller, showing an apparent reaction order y C O 2 = 0.10 , which was only slightly higher than that observed for the Ni-nR catalyst. For Ni-nC, the following rate equation was expressed: r C O 2 = k · P H 2 0.22 · P C O 2 0.10 . The negligible dependence of the reaction rate on the partial pressure of CO2 suggests that CO2 is primarily activated by the exposed surface of the CeO2 supports, having proper surface basicity [38]. Indeed, in previous work [44], a negative dependence of the CO2 conversion rate on Ni/YSZ catalyst was observed, indicating that both reactants should be activated on the Ni catalytically active surface.
After the catalytic test, which had a total duration of 10 h, the best performing Ni-nR catalyst was characterized by HR-TEM, as shown in Figure 7. The CeO2 particles remained with a rod-like morphology without sintering or morphological changes, and the average dimensions were 13 ± 3 nm for the diameter and 236 ± 43 nm for the length (Figure 7a). The Ni0 showed particles with sizes of 8.6 ± 1.5 nm, thus in good agreement with the dimensions of the catalytically active Ni sites (5 nm) determined by the TPD of H2. Higher magnification (Figure 7b) revealed that the actual distance between CeO2 (111) planes was 3.5 Å, consistent with the value of calcined catalysts. The STEM analysis (Figure 7c) showed that the Ni particles were evenly distributed, although some aggregation could be seen in some parts, indicating their partial sintering. Carbon deposits were not observed, since, feeding an H2/CO2 ratio of 4, they were thermodynamically unfavorable [45].

3.5. DRIFT

To elucidate the reaction pathway, the nR and the Ni-nR samples were analyzed using the DRIFT technique. The significant species detected on the surface are listed in Table 4. The DRIFT spectra of nR are seen in the range between 4000 and 2600 cm−1 (Figure 8a) and between 2100 and 1150 cm−1 (Figure 8b). Two bands around 3710 and 3618 cm−1 were identified in the hydroxide vibrational region due to mono-coordinated ‒OH (type I) and bridged ‒OH (type II) vibrations on Ceδ+ site [46,47,48,49]. These bands occurred at all temperatures but were most intense at 300 °C. At this distinct temperature, a further signal at 3507 cm−1 was also uncovered, which could be due to vibrations of triple-bridged ‒OH on Ceδ+ site or to the hydroxyl group of bicarbonate species [50,51]. As the temperature increased, the intensity of this band gradually decreased and, at 500 °C, it was difficult to detect.
The interaction of CO2 in combination with H2 over the CeO2 surface was already evident at 200 °C by the appearance of a weak band at 2845 cm−1, due to ν(CH) vibrations of formate species [52,53]. This band increased in intensity with a temperature up to 400 °C, and was accompanied by another less intense band at 2931 cm−1, due to the corresponding νa(CO2) + δ(CH) vibrations [52,53]. As the temperature continued to rise, the intensity of these bands decreased rapidly. Other bands appeared from 400 °C onwards due to the formation of methane (band at 3015 cm−1) and carbon monoxide (see bands at 2117 and 2174 cm−1 in Figure 8b).
In the region between 2200 and 1150 cm−1, the observed bands are mainly due to the interaction of CO2 with the CeO2 surface. It is important to emphasize that pre-reduction up to 500 °C guarantees a Ce3+ containing layers (surface-subsurface), as evidenced by a negative, although not very intense, peak at 2114 cm−1 corresponding to the Ce3+ electronic transition, a phenomenon also observed on CeO2 solid solutions with aliovalent elements, such as Gd3+ or Sm3+ by M. Grünbacher et al. [54]. At 200 °C, intense bands appeared at 1612, 1390, and 1216 cm−1 assigned to the νa(CO3), νs(CO3) and δ(OH) vibrations of bicarbonate species chemisorbed on reduced CeO2 [12,52,55,56]. Numerous other bands have been discovered that are not yet clearly resolved, but we can focus on the most important ones: the bands at 1562 and 1272 cm−1 are due to the νa(CO3) and νs(CO3) vibrations of bidentate carbonate; whereas the bands at 1462 and 1293 cm−1 should come from the νa(CO3) vibrations of monodentate carbonate [55,56,57].
In agreement with the spectra in Figure 8a, as the temperature increased, the vibrations associated with formate species became more intense, and the signal from the bands associated with bicarbonates (1612, 1390, and 1216 cm−1) gradually decreased. The formate species, probably in a bidentate configuration, showed characteristic bands at 1569 and 1352 cm−1 due to the νa(CO2) and νs(CO2)+ δ(CH) vibrations, respectively. These bands were most pronounced up to the highest temperature of 500 °C, but the interaction of CO2 on the CeO2 surface remained evident through other bands at ~1562 and ~1272 cm−1 associated with bidentate carbonate. In addition, a band at 1465 cm−1 was detected at 400 °C that could be due to the νa(CO2) vibration of carboxylate [58,59]. This species was observed at the same temperature at which the CO bands were detected, so it was attributed to a possible reactive intermediate of its own formation. On the other hand, the CO bands can occur by the decomposition of the formate, or even by the CO2 splitting as a result of a redox process involving the oxygen gap present on the reduced CeO2 (CO2 + Ce‒☐‒Ce → CO + Ce‒O‒Ce) [20].
The introduction of Ni significantly changed the intermediate species detected by the DRIFT technique in the Ni-nR sample compared to the nR support. As can be seen in Figure 9a, the peaks characteristic of Ce‒OH species, due to mono-coordinated (type I, 3710 cm−1), bridged (type II, 3611 cm−1) and triple-bridged (type III, 3541 cm−1) hydroxyl bands, were very intense already at 200 °C, while especially the latter could only be detected in the support at the highest temperature; between 300–400 °C. As the temperature increased, the intensity of Ce‒OH species decreased rapidly, and the band at 3641 cm−1 was no longer detected at 300 °C. From 400 °C, a significant increase in the absorption of the hydroxyl bands at lower wavenumbers indicated the presence of H-bonds due to the formation of H2O [49]. The labile peak at 2847 cm−1, associated with the ν(CH) vibration of formats, was already present at 200 °C, and increased significantly in intensity, up to 300 °C. At this temperature, the peak due to methane began to appear at 3016 cm−1. With increasing temperatures, the ν(CH) oscillation of formates decreased abruptly and was barely detected from 400 °C, while the peak due to CH4 was the most important up to the highest temperature of 500 °C.
As reported in Figure 9b, between 2200 and 1100 cm−1, there were intense peaks around 1590 cm−1, due to the νa(CO2) oscillation of mono- and bidentate formates, with a shoulder at ~1541 cm−1 due to the νs(CO3) of bidentate carbonates, and a broad peak at 1279 cm−1 corresponding to the νs(CO3) of bidentate carbonate bands. Significantly, other carbonate species were undetectable, even at the lowest temperature of 200 °C, but were observed instead in the nR carrier. With increasing temperature, the presence of formates and bidentate carbonates on the surface persisted, but with a progressive decrease in intensity. In addition, a sharp band was observed at 1304 cm−1 from 400 °C onwards, corresponding to the ν3(CH) vibrations of methane. At the highest temperature of 500 °C, the νa(CO2) vibration due to carboxylates appeared at ~1462 cm−1, together with faint peaks of CO, which, as in the case of the nR support, can be formed by the dissociation of CO2 at this high temperature. In addition, it is essential to emphasize that no bands associated with Ni‒(CO)x species were detected throughout the temperature range studied.
From the chemical species that can act as the main reaction intermediates on the nR and Ni-nR systems, the following reaction steps during the CO2 methanation can be hypothesized: (i) H2 favors the formation of oxygen vacancies and Ce- OH species; (ii) CO2 is chemisorbed on the “basic” CeO2−δ surface forming carbonates (mainly bidentate); (iii) the conversion of carbonates to formates, is obtained at high temperatures on the CeO2−δ support; (iv) Ni0 plays a crucial role in the activation of the H2 molecule through its dissociation into reactive H*, and thus its spillover on the CeOδ surface; (v) the hydrogen spillover by Ni0 favors the formation of formates at low temperature and their hydrogenation to CH4.
To better clarify the methanation reaction pathway, we also performed an in operando DRIFT during CO hydrogenation. The characterization was carried out up to the maximum temperature of 400 °C. Figure 10a shows a magnification between 4000–2600 cm−1 and Figure 10b in the interval 2150 and 1150 cm−1. At the temperature of 200 °C, very labile bands assigned to Ce-OH were observed, whereas monodentate formate was already evident with the ν(CH) and νa(CO2) vibrations at 2831 and 1602 cm−1, respectively. In addition to the bands associated with gaseous CO, there was an intense peak at 2059 cm−1 assigned to ν(CO-Ni) of linear nickel carbonyl and other unresolved bands between ~1960 and ~1680 cm−1, probably due to bridged nickel carbonyl vibrations. Increasing the temperature to 300 °C favored a significant methane formation, with characteristic bands at 3016 and 1305 cm−1. Moreover, the intensity of the formate bands, mainly the bidentate type at 2830 and 1596 cm−1, increased alongside a significant decrease in the CO and Ni‒CO bands. At the maximum temperature of 400 °C, there was a marked decrease in all formate bands, the absence of Ni‒CO species, and the prominent bands were only those of CH4 gas. In general, the presence of carbonates was not observed at any temperature. The CO was never oxidized by an oxygen storage process through the CeO2, as no band of CO2 was observed, clearly indicating that the surface was always maintained in a CeOδ reduced state.
It has been shown that the hydrogenation of CO can follow a mechanism involving formates [60]. In this case, they were also formed by exploiting the hydroxyl and the oxygen vacancy formed upon Ce4+→Ce3+ reduction by H2. Indeed, the low intensity of the Ce‒OH species observed in Figure 10 could be a confirmation of this. The formates were then converted to CH4 thanks to the spillover effect of H* generated by the dissociation of H2 chemisorbed on the Ni0 surface, as stated before. The CO chemisorbed on Ni could act as a spectator and not be directly hydrogenated to methane.
Thus, to summarize the results obtained with the DRIFT technique, it is possible to define Ni-nR as a bifunctional system, in which Ni plays a fundamental role in the activation of H2, while CeO2−δ acts on CO2. Obviously, in our catalyst with a low Ni loading, the exposed surface is mainly that of CeOδ. Therefore, the activation of CO2 (carbonates, formates) is kept “constant” over a wide range of CO2 partial pressure. This hypothesis is confirmed by the dependence of the reaction rate equation, exclusively on the partial pressure of H2, as mentioned above, i.e., r C O 2 = k · P H 2 0.68 · P C O 2 0.06     k · P H 2 0.68 .

4. Conclusions

Ni0.05Ce0.95O2−δ catalysts, with nanorod and nanocube morphologies, were synthesized by hydrothermal methods. The most active catalyst for CO2 methanation was the one with nanorod morphology, due to its strong metal–support interaction and its high reducibility, which favors the presence of oxygen vacancies. A high methane selectivity of about 90% was achieved over a wide temperature range up to 400 °C. No carbon residues were detected after the catalytic tests. The reaction rate essentially depended on the partial pressure of hydrogen. The DRIFT characterization showed that CeO2−δ strongly interacted with the CO2 molecule, adsorbed as various carbonates, while Ni0 participated in the H2 spillover. The absence of metal carbonyls and the considerable formation of chemisorbed formates on the CeO2−δ support indicate a direct formate-type reaction mechanism. Ni0.05Ce0.95O2−δ is thus a bifunctional system. At high temperatures (i.e., above 400 °C), CO can be formed by the dissociation of CO2 → CO + 1/2O2, with a redox mechanism involving the oxygen vacancies of CeO2−δ. The presence of formate was also observed in the hydrogenation of CO, together with the formation of carbonyls absorbed on Ni. This finding suggests an important role of formate species also in the hydrogenation of CO.

Supplementary Materials

The following are available online at https://0-www-mdpi-com.brum.beds.ac.uk/article/10.3390/pr9111899/s1, Figure S1: Average size distribution: Ni-nR CeO2 oxide width (a), Ni-nR CeO2 oxide length (b), Ni-nR Ni oxide particles (c), oxide width of CeO2 in the Ni-nC (d), Ni oxide particles in the Ni-nC (e).

Author Contributions

Conceptualization, I.L.; formal analysis, I.L., investigation, I.L., J.K.K., S.M.S.K., K.S.; resources, S.T.; data curation, I.L., J.K.K., U.P.L., S.T., S.S.; writing—original draft preparation, I.L.; writing—review and editing, S.T., S.S., U.P.L.; supervision, I.L.; project administration, G.I. All authors have read and agreed to the published version of the manuscript.

Funding

This research received no external funding.

Institutional Review Board Statement

Not applicable.

Informed Consent Statement

Not applicable.

Data Availability Statement

Not applicable.

Conflicts of Interest

The authors declare no conflict of interest.

References

  1. Centi, G.; Perathoner, S. Opportunities and prospects in the chemical recycling of carbon dioxide to fuels. Catalysis Today 2009, 148, 191–205. [Google Scholar] [CrossRef]
  2. Wang, W.; Wang, S.; Ma, X.; Gong, J. Recent advances in catalytic hydrogenation of carbon dioxide. Chem. Soc. Rev. 2011, 40, 3703–3727. [Google Scholar] [CrossRef] [Green Version]
  3. Jomjaree, T.; Sintuya, P.; Srifa, A.; Koo-amornpattana, W.; Kiatphuengporn, S.; Assabumrungrat, S.; Sudoh, M.; Watanabe, R.; Fukuhara, C.; Ratchahat, S. Catalytic performance of Ni catalysts supported on CeO2 with different morphologies for low-temperature CO2 methanation. Catal. Today 2020. [Google Scholar] [CrossRef]
  4. Rönsch, S.; Schneider, J.; Matthischke, S.; Schlüter, M.; Götz, M.; Lefebvre, J.; Prabhakaran, P.; Bajohr, S. Review on methanation—From fundamentals to current projects. Fuel 2016, 166, 276–296. [Google Scholar] [CrossRef]
  5. Hidalgo, D.; Martín-Marroquín, J.M. Power-to-methane, coupling CO2 capture with fuel production: An overview. Renew. Sustain. Energy Rev. 2020, 132, 110057. [Google Scholar] [CrossRef]
  6. Ashok, J.; Pati, S.; Hongmanorom, P.; Tianxi, Z.; Junmei, C.; Kawi, S. A review of recent catalyst advances in CO2 methanation processes. Catal. Today 2020, 356, 471–489. [Google Scholar] [CrossRef]
  7. Fan, W.K.; Tahir, M. Recent trends in developments of active metals and heterogenous materials for catalytic CO2 hydrogenation to renewable methane: A review. J. Environ. Chem. Eng. 2021, 9, 105460. [Google Scholar] [CrossRef]
  8. Lee, W.J.; Li, C.; Prajitno, H.; Yoo, J.; Patel, J.; Yang, Y.; Lim, S. Recent trend in thermal catalytic low temperature CO2 methanation: A critical review. Catal. Today 2021, 368, 2–19. [Google Scholar] [CrossRef]
  9. Aziz, M.A.A.; Jalil, A.A.; Triwahyono, S.; Ahmad, A. CO2 methanation over heterogeneous catalysts: Recent progress and future prospects. Green Chem. 2015, 17, 2647–2663. [Google Scholar] [CrossRef]
  10. Younas, M.; Loong Kong, L.; Bashir, M.J.K.; Nadeem, H.; Shehzad, A.; Sethupathi, S. Recent Advancements, Fundamental Challenges, and Opportunities in Catalytic Methanation of CO2. Energy Fuels 2016, 30, 8815–8831. [Google Scholar] [CrossRef]
  11. Li, W.; Wang, H.; Jiang, X.; Zhu, J.; Liu, Z.; Guo, X.; Song, C. A short review of recent advances in CO2 hydrogenation to hydrocarbons over heterogeneous catalysts. RSC Adv. 2018, 8, 7651–7669. [Google Scholar] [CrossRef] [Green Version]
  12. Lee, S.M.; Lee, Y.H.; Moon, D.H.; Ahn, J.Y.; Nguyen, D.D.; Chang, S.W.; Kim, S.S. Reaction Mechanism and Catalytic Impact of Ni/CeO2–x Catalyst for Low-Temperature CO2 Methanation. Ind. Eng. Chem. Res. 2019, 58, 8656–8662. [Google Scholar] [CrossRef]
  13. Shen, L.; Xu, J.; Zhu, M.; Han, Y.-F. Essential Role of the Support for Nickel-Based CO2 Methanation Catalysts. ACS Catal. 2020, 10, 14581–14591. [Google Scholar] [CrossRef]
  14. Lin, L.; Gerlak, C.A.; Liu, C.; Llorca, J.; Yao, S.; Rui, N.; Zhang, F.; Liu, Z.; Zhang, S.; Deng, K.; et al. Effect of Ni particle size on the production of renewable methane from CO2 over Ni/CeO2 catalyst. J. Energy Chem. 2021, 61, 602–611. [Google Scholar] [CrossRef]
  15. Wang, L.; Deo, S.; Dooley, K.; Janik, M.J.; Rioux, R.M. Influence of metal nuclearity and physicochemical properties of ceria on the oxidation of carbon monoxide. Chin. J. Catal. 2020, 41, 951–962. [Google Scholar] [CrossRef]
  16. Moeini, S.S.; Battocchio, C.; Casciardi, S.; Luisetto, I.; Lupattelli, P.; Tofani, D.; Tuti, S. Oxidized Palladium Supported on Ceria Nanorods for Catalytic Aerobic Oxidation of Benzyl Alcohol to Benzaldehyde in Protic Solvents. Catalysts 2019, 9, 847. [Google Scholar] [CrossRef] [Green Version]
  17. Lei, Y.; Li, W.; Liu, Q.; Lin, Q.; Zheng, X.; Huang, Q.; Guan, S.; Wang, X.; Wang, C.; Li, F. Typical crystal face effects of different morphology ceria on the activity of Pd/CeO2 catalysts for lean methane combustion. Fuel 2018, 233, 10–20. [Google Scholar] [CrossRef]
  18. Luisetto, I.; Tuti, S.; Di Bartolomeo, E. Co and Ni supported on CeO2 as selective bimetallic catalyst for dry reforming of methane. Int. J. Hydrogen Energy 2012, 37, 15992–15999. [Google Scholar] [CrossRef]
  19. Luisetto, I.; Tuti, S.; Battocchio, C.; Lo Mastro, S.; Sodo, A. Ni/CeO2–Al2O3 catalysts for the dry reforming of methane: The effect of CeAlO3 content and nickel crystallite size on catalytic activity and coke resistance. Appl. Catal. A Gen. 2015, 500, 12–22. [Google Scholar] [CrossRef]
  20. Luisetto, I.; Tuti, S.; Romano, C.; Boaro, M.; Di Bartolomeo, E.; Kesavan, J.K.; Kumar, S.S.; Selvakumar, K. Dry reforming of methane over Ni supported on doped CeO2: New insight on the role of dopants for CO2 activation. J. CO2 Util. 2019, 30, 63–78. [Google Scholar] [CrossRef]
  21. Gao, X.; Zhu, S.; Dong, M.; Wang, J.; Fan, W. Ru/CeO2 catalyst with optimized CeO2 morphology and surface facet for efficient hydrogenation of ethyl levulinate to γ-valerolactone. J. Catal. 2020, 389, 60–70. [Google Scholar] [CrossRef]
  22. Marconi, E.; Tuti, S.; Luisetto, I. Structure-Sensitivity of CO2 Methanation over Nanostructured Ni Supported on CeO2 Nanorods. Catalysts 2019, 9, 375. [Google Scholar] [CrossRef] [Green Version]
  23. Iglesias, I.; Quindimil, A.; Mariño, F.; De-La-Torre, U.; González-Velasco, J.R. Zr promotion effect in CO2 methanation over ceria supported nickel catalysts. Int. J. Hydrogen Energy 2019, 44, 1710–1719. [Google Scholar] [CrossRef]
  24. Ocampo, F.; Louis, B.; Roger, A.-C. Methanation of carbon dioxide over nickel-based Ce0.72Zr0.28O2 mixed oxide catalysts prepared by sol–gel method. Appl. Catal. A Gen. 2009, 369, 90–96. [Google Scholar] [CrossRef]
  25. Sakpal, T.; Lefferts, L. Structure-dependent activity of CeO2 supported Ru catalysts for CO2 methanation. J. Catal. 2018, 367, 171–180. [Google Scholar] [CrossRef]
  26. Ren, Z.; Peng, F.; Li, J.; Liang, X.; Chen, B. Morphology-Dependent Properties of Cu/CeO2 Catalysts for the Water-Gas Shift Reaction. Catalysts 2017, 7, 48. [Google Scholar] [CrossRef] [Green Version]
  27. Du, X.; Zhang, D.; Shi, L.; Gao, R.; Zhang, J. Morphology Dependence of Catalytic Properties of Ni/CeO2 Nanostructures for Carbon Dioxide Reforming of Methane. J. Phys. Chem. C 2012, 116, 10009–10016. [Google Scholar] [CrossRef]
  28. Wang, S.; Zhao, L.; Wang, W.; Zhao, Y.; Zhang, G.; Ma, X.; Gong, J. Morphology control of ceria nanocrystals for catalytic conversion of CO2 with methanol. Nanoscale 2013, 5, 5582–5588. [Google Scholar] [CrossRef]
  29. Trovarelli, A.; Llorca, J. Ceria Catalysts at Nanoscale: How Do Crystal Shapes Shape Catalysis? ACS Catal. 2017, 7, 4716–4735. [Google Scholar] [CrossRef]
  30. Ye, R.-P.; Li, Q.; Gong, W.; Wang, T.; Razink, J.J.; Lin, L.; Qin, Y.-Y.; Zhou, Z.; Adidharma, H.; Tang, J.; et al. High-performance of nanostructured Ni/CeO2 catalyst on CO2 methanation. Appl. Catal. B Environ. 2020, 268, 118474. [Google Scholar] [CrossRef]
  31. Padi, S.P.; Shelly, L.; Komarala, E.P.; Schweke, D.; Hayun, S.; Rosen, B.A. Coke-free methane dry reforming over nano-sized NiO-CeO2 solid solution after exsolution. Catal. Commun. 2020, 138, 105951. [Google Scholar] [CrossRef]
  32. Thommes, M.; Kaneko, K.; Neimark, A.V.; Olivier, J.P.; Rodriguez-Reinoso, F.; Rouquerol, J.; Sing, K.S.W. Physisorption of gases, with special reference to the evaluation of surface area and pore size distribution (IUPAC Technical Report). Pure Appl. Chem. 2015, 87, 1051–1069. [Google Scholar] [CrossRef] [Green Version]
  33. Perrichon, V.; Laachir, A.; Bergeret, G.; Fréty, R.; Tournayan, L.; Touret, O. Reduction of cerias with different textures by hydrogen and their reoxidation by oxygen. J. Chem. Soc. Faraday Trans. 1994, 90, 773–781. [Google Scholar] [CrossRef]
  34. Désaunay, T.; Bonura, G.; Chiodo, V.; Freni, S.; Couzinié, J.P.; Bourgon, J.; Ringuedé, A.; Labat, F.; Adamo, C.; Cassir, M. Surface-dependent oxidation of H2 on CeO2 surfaces. J. Catal. 2013, 297, 193–201. [Google Scholar] [CrossRef]
  35. Giordano, F.; Trovarelli, A.; de Leitenburg, C.; Giona, M. A Model for the Temperature-Programmed Reduction of Low and High Surface Area Ceria. J. Catal. 2000, 193, 273–282. [Google Scholar] [CrossRef]
  36. Xiao, Z.; Li, Y.; Hou, F.; Wu, C.; Pan, L.; Zou, J.; Wang, L.; Zhang, X.; Liu, G.; Li, G. Engineering oxygen vacancies and nickel dispersion on CeO2 by Pr doping for highly stable ethanol steam reforming. Appl. Catal. B Environ. 2019, 258, 117940. [Google Scholar] [CrossRef]
  37. Takeguchi, T.; Furukawa, S.-n.; Inoue, M. Hydrogen Spillover from NiO to the Large Surface Area CeO2–ZrO2 Solid Solutions and Activity of the NiO/CeO2–ZrO2 Catalysts for Partial Oxidation of Methane. J. Catal. 2001, 202, 14–24. [Google Scholar] [CrossRef]
  38. Varvoutis, G.; Lykaki, M.; Stefa, S.; Papista, E.; Carabineiro, S.A.C.; Marnellos, G.E.; Konsolakis, M. Remarkable efficiency of Ni supported on hydrothermally synthesized CeO2 nanorods for low-temperature CO2 hydrogenation to methane. Catal. Commun. 2020, 142, 106036. [Google Scholar] [CrossRef]
  39. Safa, S.; Hejazi, R.; Rabbani, M.; Azimirad, R. Hydrothermal synthesis of NiO nanostructures for photodegradation of 4-nitrophenol. Desalin. Water Treat. 2016, 57, 21982–21989. [Google Scholar] [CrossRef]
  40. Kumar, J.P.; Giri, S.D.; Sarkar, A. Mesoporous NiO with different morphology: Synthesis, characterization and their evaluation for oxygen evolution reaction. Int. J. Hydrogen Energy 2018, 43, 15639–15649. [Google Scholar] [CrossRef]
  41. Torrente-Murciano, L.; Gilbank, A.; Puertolas, B.; Garcia, T.; Solsona, B.; Chadwick, D. Shape-dependency activity of nanostructured CeO2 in the total oxidation of polycyclic aromatic hydrocarbons. Appl. Catal. B Environ. 2013, 132-133, 116–122. [Google Scholar] [CrossRef] [Green Version]
  42. Wang, N.; Qian, W.; Chu, W.; Wei, F. Crystal-plane effect of nanoscale CeO2 on the catalytic performance of Ni/CeO2 catalysts for methane dry reforming. Catal. Sci. Technol. 2016, 6, 3594–3605. [Google Scholar] [CrossRef]
  43. Wu, H.C.; Chang, Y.C.; Wu, J.H.; Lin, J.H.; Lin, I.K.; Chen, C.S. Methanation of CO2 and reverse water gas shift reactions on Ni/SiO2 catalysts: The influence of particle size on selectivity and reaction pathway. Catal. Sci. Technol. 2015, 5, 4154–4163. [Google Scholar] [CrossRef]
  44. Kesavan, J.K.; Luisetto, I.; Tuti, S.; Meneghini, C.; Iucci, G.; Battocchio, C.; Mobilio, S.; Casciardi, S.; Sisto, R. Nickel supported on YSZ: The effect of Ni particle size on the catalytic activity for CO2 methanation. J. CO2 Util. 2018, 23, 200–211. [Google Scholar] [CrossRef]
  45. Gao, J.; Wang, Y.; Ping, Y.; Hu, D.; Xu, G.; Gu, F.; Su, F. A thermodynamic analysis of methanation reactions of carbon oxides for the production of synthetic natural gas. RSC Adv. 2012, 2, 2358–2368. [Google Scholar] [CrossRef]
  46. Laachir, A.; Perrichon, V.; Badri, A.; Lamotte, J.; Catherine, E.; Lavalley, J.C.; El Fallah, J.; Hilaire, L.; Le Normand, F.; Quéméré, E.; et al. Reduction of CeO2 by hydrogen. Magnetic susceptibility and Fourier-transform infrared, ultraviolet and X-ray photoelectron spectroscopy measurements. J. Chem. Soc. Faraday Trans. 1991, 87, 1601–1609. [Google Scholar] [CrossRef]
  47. Binet, C.; Daturi, M.; Lavalley, J.-C. IR study of polycrystalline ceria properties in oxidised and reduced states. Catal. Today 1999, 50, 207–225. [Google Scholar] [CrossRef]
  48. López, J.M.; Gilbank, A.L.; García, T.; Solsona, B.; Agouram, S.; Torrente-Murciano, L. The prevalence of surface oxygen vacancies over the mobility of bulk oxygen in nanostructured ceria for the total toluene oxidation. Appl. Catal. B Environ. 2015, 174-175, 403–412. [Google Scholar] [CrossRef] [Green Version]
  49. Luo, L.; LaCoste, J.D.; Khamidullina, N.G.; Fox, E.; Gang, D.D.; Hernandez, R.; Yan, H. Investigate interactions of water with mesoporous ceria using in situ VT-DRIFTS. Surf. Sci. 2020, 691, 121486. [Google Scholar] [CrossRef]
  50. Proaño, L.; Tello, E.; Arellano-Trevino, M.A.; Wang, S.; Farrauto, R.J.; Cobo, M. In-situ DRIFTS study of two-step CO2 capture and catalytic methanation over Ru,“Na2O”/Al2O3 Dual Functional Material. Appl. Surf. Sci. 2019, 479, 25–30. [Google Scholar] [CrossRef]
  51. Cárdenas-Arenas, A.; Quindimil, A.; Davó-Quiñonero, A.; Bailón-García, E.; Lozano-Castelló, D.; De-La-Torre, U.; Pereda-Ayo, B.; González-Marcos, J.A.; González-Velasco, J.R.; Bueno-López, A. Isotopic and in situ DRIFTS study of the CO2 methanation mechanism using Ni/CeO2 and Ni/Al2O3 catalysts. Appl. Catal. B Environ. 2020, 265, 118538. [Google Scholar] [CrossRef]
  52. Tada, S.; Nagase, H.; Fujiwara, N.; Kikuchi, R. What Are the Best Active Sites for CO2 Methanation over Ni/CeO2? Energy Fuels 2021, 35, 5241–5251. [Google Scholar] [CrossRef]
  53. Köck, E.-M.; Kogler, M.; Bielz, T.; Klötzer, B.; Penner, S. In Situ FT-IR Spectroscopic Study of CO2 and CO Adsorption on Y2O3, ZrO2, and Yttria-Stabilized ZrO2. J. Phys. Chem. C 2013, 117, 17666–17673. [Google Scholar] [CrossRef] [PubMed]
  54. Grünbacher, M.; Klötzer, B.; Penner, S. CO2 Reduction by Hydrogen Pre-Reduced Acceptor-Doped Ceria. ChemPhysChem 2019, 20, 1706–1718. [Google Scholar] [CrossRef]
  55. Jia, X.; Zhang, X.; Rui, N.; Hu, X.; Liu, C.-j. Structural effect of Ni/ZrO2 catalyst on CO2 methanation with enhanced activity. Appl. Catal. B Environ. 2019, 244, 159–169. [Google Scholar] [CrossRef]
  56. Solis-Garcia, A.; Louvier-Hernandez, J.F.; Almendarez-Camarillo, A.; Fierro-Gonzalez, J.C. Participation of surface bicarbonate, formate and methoxy species in the carbon dioxide methanation catalyzed by ZrO2-supported Ni. Appl. Catal. B Environ. 2017, 218, 611–620. [Google Scholar] [CrossRef]
  57. Tada, S.; Ochieng, O.J.; Kikuchi, R.; Haneda, T.; Kameyama, H. Promotion of CO2 methanation activity and CH4 selectivity at low temperatures over Ru/CeO2/Al2O3 catalysts. Int. J. Hydrogen Energy 2014, 39, 10090–10100. [Google Scholar] [CrossRef]
  58. Jin, T.; Zhou, Y.; Mains, G.J.; White, J.M. Infrared and x-ray photoelectron spectroscopy study of carbon monoxide and carbon dioxide on platinum/ceria. J. Phys. Chem. 1987, 91, 5931–5937. [Google Scholar] [CrossRef]
  59. Shido, T.; Iwasawa, Y. Regulation of reaction intermediate by reactant in the water-gas shift reaction on CeO2, in relation to reactant-promoted mechanism. J. Catal. 1992, 136, 493–503. [Google Scholar] [CrossRef]
  60. Li, C.; Sakata, Y.; Arai, T.; Domen, K.; Maruya, K.-I.; Onishi, T. Adsorption of carbon monoxide and carbon dioxide on cerium oxide studied by Fourier-transform infrared spectroscopy. Part 2.—Formation of formate species on partially reduced CeO2 at room temperature. J. Chem. Soc. Faraday Trans. 1 Phys. Chem. Condens. Ph. 1989, 85, 1451–1461. [Google Scholar] [CrossRef]
Figure 1. (A) X-ray diffraction patterns of: (a) nR; (b) nC; (c) Ni-nR; (d) Ni-nC. Patterns in the range 2θ = 45–45° showing the NiO peaks. (B) Williamson–Hall plots of: (▲) nR; (▼) nC; (●) Ni-nR; (■) Ni-nC.
Processes 09 01899 g001
Figure 2. N2 physisorption isotherms (a) and pore size distribution (b) of: (▲) nR; (▼) nC; (●) Ni-nR; (■) Ni-nC.
Processes 09 01899 g002
Figure 3. (A) TPR and (B) TPD profiles of: (a) nC, (b) Ni-nC, (c) nR, (d) Ni-nR.
Processes 09 01899 g003
Figure 4. TEM images of Ni-nR (a) and Ni-nC (b) catalysts calcined at 550 °C. The arrows in the figure (a,b) points to the NiO particles.
Processes 09 01899 g004
Figure 5. The catalytic activity of Ni-nR (symbols in red color) and Ni-nC (symbols in blue color) catalysts: (a) CO2 conversion; (b) CH4 selectivity; (c) CH4 (circle symbols) and CO yields (square symbols); (d) Arrhenius plot of CO2 conversion TOFs.
Processes 09 01899 g005
Figure 6. Effect of reactant partial pressure on CO2 conversion rate for Ni-nR (symbols in red color) and Ni-nC (symbols in blue color): (a) H2 partial pressure in the 10.1–50.7 kPa range at constant CO2 partial pressure of 10.1 kPa; (b) CO2 partial pressure in the 10.1–45.6 kPa range at constant H2 partial pressure of 40.6 kPa.
Processes 09 01899 g006
Figure 7. HR-TEM micrograph of Ni-nR catalyst after catalytic test at low (a) and high magnification (b), STEM imaging with Ce-L, and Ni-k mapping (c). The arrow in panel (a) points to the Ni particles.
Processes 09 01899 g007
Figure 8. DRIFT spectra of nR support exposed to reaction mixture CO2:H2:He = 5:20:25 cm3 min−1 from 200–500 °C between 4000–2600 cm−1 (a), and 2150 and 1150 cm−1 (b). Before the experiment, the sample was reduced in situ at 500 °C. Symbol definition: * hydroxide species, ⬥ formate, + CH4, × Ce3+ electronic transition, ● bidentate bicarbonate, ▼ bidentate carbonate, ▲ monodentate carbonate, ★ carboxylate.
Processes 09 01899 g008
Figure 9. DRIFT spectra of Ni-nR catalyst exposed to reaction mixture CO2:H2:He = 5:20:25 cm3 min−1 from 200–400 °C between 4000–2600 cm−1 (a), and 2150 and 1150 cm−1 (b). Before the experiment, the sample was reduced in situ at 500 °C. Symbol definition: * hydroxide species, ⬥ formate, + CH4, ▼ bidentate carbonate, ★ carboxylate.
Processes 09 01899 g009
Figure 10. DRIFT spectra of Ni-nR catalyst exposed to reaction mixture CO:H2:He = 5:15:30 cm3 min−1 from 200–400 °C between 4000–2600 cm−1 (a), and 2150 and 1150 cm−1 (b). Before the experiment, the sample was reduced in situ at 500 °C. Symbol definition: ⬥ formate, + CH4, ■ linear CO on Ni.
Processes 09 01899 g010
Table 1. Structural parameters of as prepared samples.
SampleDW-H (nm) aεa (Å) DNiO (nm) b
nC401.4 × 10−35.41
Ni-nC321.5 × 10−35.4171
nR101.7 × 10−35.41
Ni-nR181.4 × 10−35.4020
a Calculated by the Williamson–Hall plot method. b Calculated by the Scherrer equation.
Table 2. Textural properties of as-prepared samples.
SampleSSA
(m2g−1)
Pore Volume
(cm3g−1)
Average Pore Diameter
(nm)
nC322.4 × 10−125
Ni-nC332.2 × 10−121
nR923.6 × 10−1 19
Ni-nR623.3 × 10−120
Table 3. Amount of hydrogen consumed during TPR measurements. Ni dispersion, D (%), and the active Ni sites dimension, d (nm), determined from TPD analyzes..
SampleHydrogen Consumption/mmol g−1D (%)d (nm)
αβγTotal
nC 0.161.051.20
Ni-nC0.120.321.031.47147
nR 0.380.791.17
Ni-nR0.440.530.671.64205
Table 4. Assignments and wavenumbers (cm−1) of the prominent DRIFT bands formed during the CO2 and CO methanation.
Processes 09 01899 i001 Processes 09 01899 i002 Processes 09 01899 i003 Processes 09 01899 i004 Processes 09 01899 i005 Processes 09 01899 i006
Bidentate bicarbonateBidentate carbonateMonodentate carbonateCarboxylateBidentate formateMonodentate formate
1612 νa(CO3)
1390 νs(CO3)
1216 δ(OH)
1562 νa(CO3)
1272 νs(CO3)
1462 νa(CO3)
1293 νs(CO3)
1465 νa(CO2)2931 νa(CO2) + δ(CH)
2845 ν(CH)
1569 νa(CO2)
1352 νs(CO2) + δ(CH)
1602 νa(CO2)
Publisher’s Note: MDPI stays neutral with regard to jurisdictional claims in published maps and institutional affiliations.

