
Automatic Tolerance Analysis of Permanent Magnet Machines with Encapsuled FEM Models Using Digital-Twin-Distiller


1
MONTANA Knowledge Management Ltd., 1111 Budapest, Hungary
2
Department of Electric Power Engineering, Budapest University of Technology and Economics, 1111 Budapest, Hungary
3
Department of Electrical Power Engineering and Mechatronics, Tallinn University of Technology, 19086 Tallinn, Estonia
*
Author to whom correspondence should be addressed.
†
These authors contributed equally to this work.
Processes 2021, 9(11), 2077; https://0-doi-org.brum.beds.ac.uk/10.3390/pr9112077
Submission received: 25 October 2021
/
Revised: 10 November 2021
/
Accepted: 16 November 2021
/
Published: 19 November 2021
(This article belongs to the Special Issue Synergies in Combined Development of Processes and Models)
Abstract
:Tolerance analysis is crucial in every manufacturing process, such as electrical machine design, because tight tolerances lead to high manufacturing costs. A FEM-based solution of the tolerance analysis of an electrical machine can easily lead to a computationally expensive problem. Many papers have proposed the design of experiments, surrogate-model-based methodologies, to reduce the computational demand of this problem. However, these papers did not focus on the information loss and the limitations of the applied methodologies. Regardless, the absolute value of the calculated tolerance and the numerical error of the applied numerical methods can be in the same order of magnitude. In this paper, the tolerance and the sensitivity of BLDC machines’ cogging torque are analysed using different methodologies. The results show that the manufacturing tolerances can have a significant effect on the calculated parameters, and that the mean value of the calculated cogging torque increases. The design of the experiment-based methodologies significantly reduced the calculation time, and shows that the encapsulated FEM model can be invoked from an external system-level optimization to examine the design from different aspects.
1. Introduction
FEM-based numerical simulations are an essential part of an electrical machine design process. Creating a good design needs to resolve a multi-objective optimization problem, which contains many numerically expensive FEM calculations with large parameter space [1,2]. Many state-of-the-art genetic and evolutionary optimization algorithms are used to solve these optimization problems, such as NSGA-II, SPEA2, OMOPS, DE, etc. [3,4,5,6]. The solution of these tasks needs to perform thousands of computationally expensive calculations. Many techniques and tools developed, such as parallel computing, surrogate modelling, and model order reduction to accelerate or reduce the computational complexity of these optimization tasks [7,8,9,10,11].
The main objectives of these optimizations are to find cost-optimal machines and increase the power density [12]. Most of these methodologies do not consider the effect of the manufacturing tolerances and uncertainties on an electrical machine design. However, to ensure the product quality, the tolerances should be analyzed during the design process [13]. Taguchi, who was the pioneer of this field of research, suggested a three-step robust design process comprising the system, parameter, and tolerance design [13,14,15]. Melvin illustrated the importance of the tolerance analysis with the aid of axiomatic design principles on an example system [16]. The goal of the axiomatic design disciplines is to satisfy the functional requirements and reduce the internal noise of the designed system. The independence and the information axioms should be followed to select the key design parameters of the machine. These axioms ensure that the designed system will be robust as possible to the performance degradation from interactions [16,17]. Figure 1 illustrates an example system, in which the axiomatic design rules choose the design parameters. Here, the parameter represents the required parameter. These functional requirements can be satisfied by selecting the independent design parameter. In the case of the M1 material, the working point should be selected in (), while () in the case of the M2 material. The and parameters have the same manufacturing tolerance. This means that the resulting uncertainty is two times higher in the functional requirement, which exceeds the acceptable tolerance range. Therefore, we can deteriorate the robustness of a design and increase the number of waste products if we use stronger or better materials in the design.
There are many publications that deal with the role of robustness in electrical machine design [2,18,19,20,21]. Robustness has been taken into consideration in two different ways. Firstly, with an expectation measure, secondly, as a constraint of the optimization task [22]. Both methodologies increase the computational complexity of the design problem. A good example is an existing team benchmark problem, where a robust solenoid design should be calculated. The solution of the robust goal function needs multiple FEM simulations for every individual during the evolutionary algorithm-based optimization [23,24,25,26]. Considering the tolerances and other uncertainties in an early design stage, they can increase further the number of calculations. Bramerdorfer pointed out that the application of the design of experiment (DOE) methodologies and the surrogate modelling techniques can significantly decrease the number of calculations, by more than 96% [27,28]. These DOE methodologies achieve this computational time reduction by certain smart sampling techniques. However, the application of DOE methods can cause an information loss, which decreases the accuracy of the calculations. In these papers [27,28], the accuracy of the applied DOE techniques was not examined, and the results were not been compared with a reference, i.e., a full-factorial design based calculations.
The main goal of the paper is to compare the accuracy of different DOE-based methodologies on the cogging torque calculation of a BLDC machine. The proposed methodologies integrated into the digital-twin-distiller, the created model were saved as a digital twin, and not only the source code of the model but its encapsulated version can be accessed from the digital-twin-distiller projects homepage (http://www.distiller.dev), accessed on 17 October 2021). This containerized version of the code contains the model and the simulation together, as a digital twin (DT) [29,30,31]. It can be run via the online application interface without any installation. The proposed solution supports long term usability and reproducibility for the proposed model.
2. Materials and Methods
2.1. Modeling with Digital-Twin-Distiller
The tolerance analysis was carried out by the digital-twin-distiller (digital-twin-distiller is available for download from: http://www.github.com/montana-knowledge-management/digital-twin-distiller, accessed: 17 October 2021). a novel robust design optimization platform, which has many features supporting high-performance tolerance analysis with different FEM-solvers [26]. Due to the Platform class, it is possible to switch between the integrated FEM-solvers: Agros2D and FEMM [25,32,33,34].
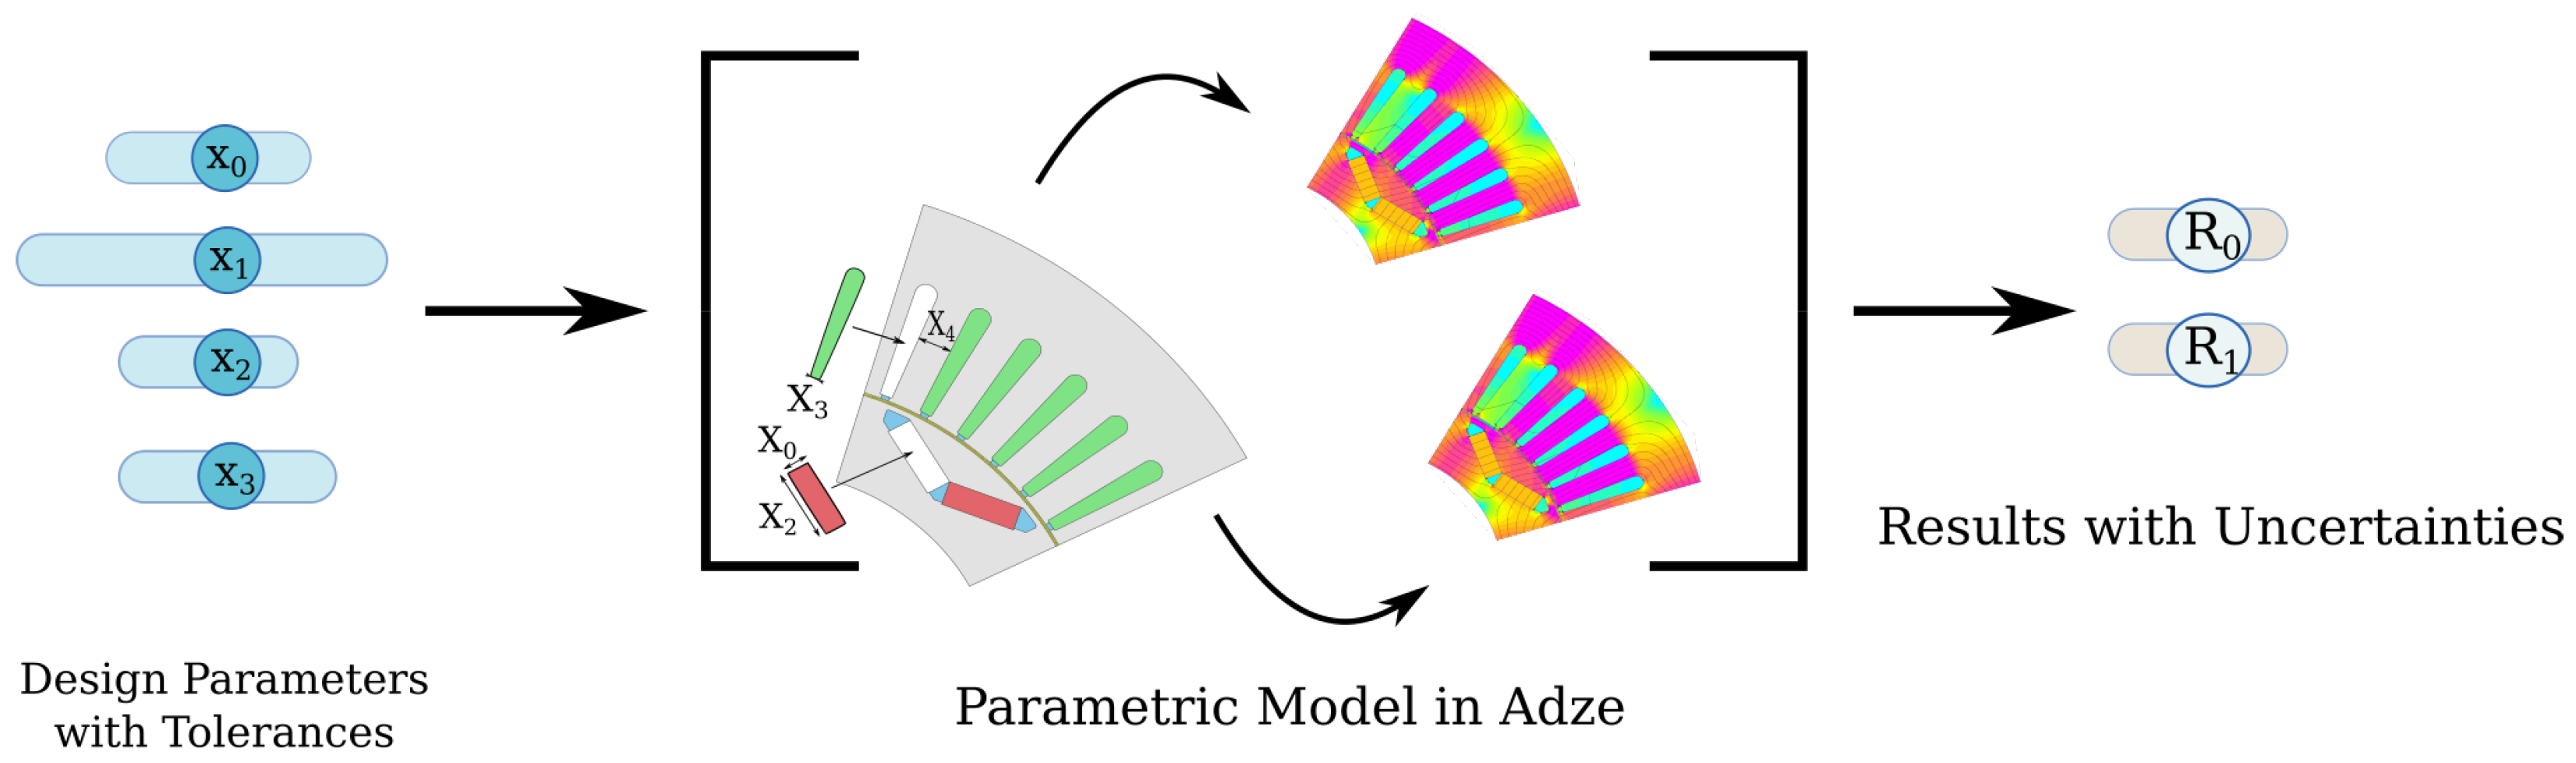
The tolerance analysis workflow with digital-twin-distiller can be seen in Figure 2. The middle of the picture shows the model of the enclosed finite element calculation. The model geometry can be built from different pieces of geometrical elements, from different CAD formats. The edges of these geometrical elements can be automatically selected and parameterized for tolerance analysis. In Figure 2 the magnets and the coils were defined separately, imported from separate sources. The selected input parameters () can be used for the tolerance analysis. then digital-twin-distiller calculates a bunch of 2D FEM simulations and returns the calculated parameters () with their tolerances, using modern Design of Experiments (DoE) based strategies [35,36,37]. Therefore, thedigital-twin-distiller can be invoked as a simple Python function from a third-party robust optimization package, such as Ārtap [25,38,39] and it gives back the resulting value of the calculated parameter with its estimated error.
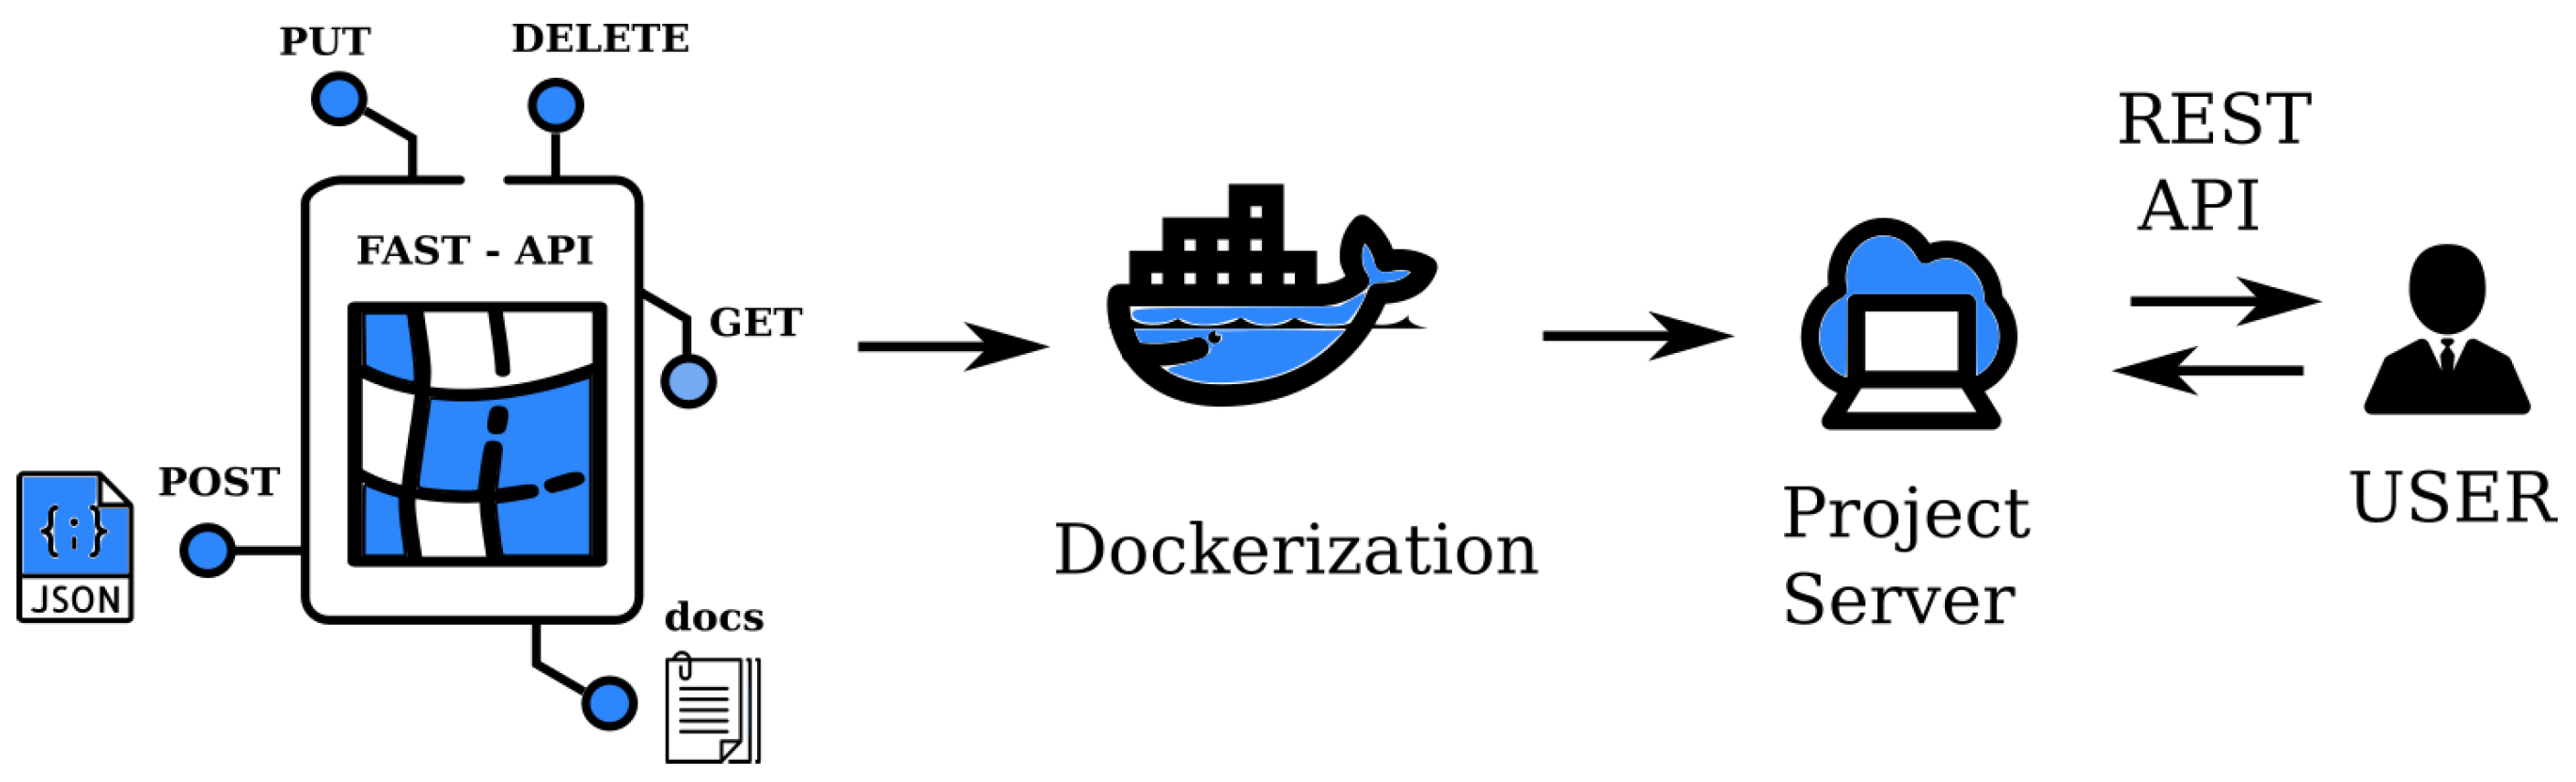
It is not necessary to install the required solver to run an digital-twin-distiller, because it contains another innovative feature, which can save the built model into a platform independent Digital Twin (DT). The motivation behind this function is similar, like in the Science Capsule [40] or the Whole Tale [41] projects, where the data and the used tools can be archived into a single container to ensure the reproducibility of a scientific experiment. The goal of the digital-twin-distillers encapsulation is different. The archived project runs as an application in a server, which can be accessed via a REST-api. The POST endpoint waits the command from an external application. In this way, the realized simulations can be accessed or used in a system level simulation by another researcher without a deep knowledge of the domain itself (Figure 3).
2.2. Design of Experiments for Tolerance Analysis
The goal of the Design of Experiment techniques is to extract as much information as possible from a limited set of laboratory and computer experiments. This terminology is usually divided into two parts: classical and modern methodologies [37]. These strategies are similar to the Taguchi proposed orthogonal arrays [36,47,48,49]. The main difference is that random error exists in a laboratory experiment but does not exist in a computer experiment [37,50]. Nonetheless, some of the previous papers showed the usefulness of these classical DoE Techniques in the tolerance analysis of electrical machine design [27,51]. Orthogonal Arrays and Box-Behnken methodology was used in [27] to reduce the computational demand of the cogging torque analysis.
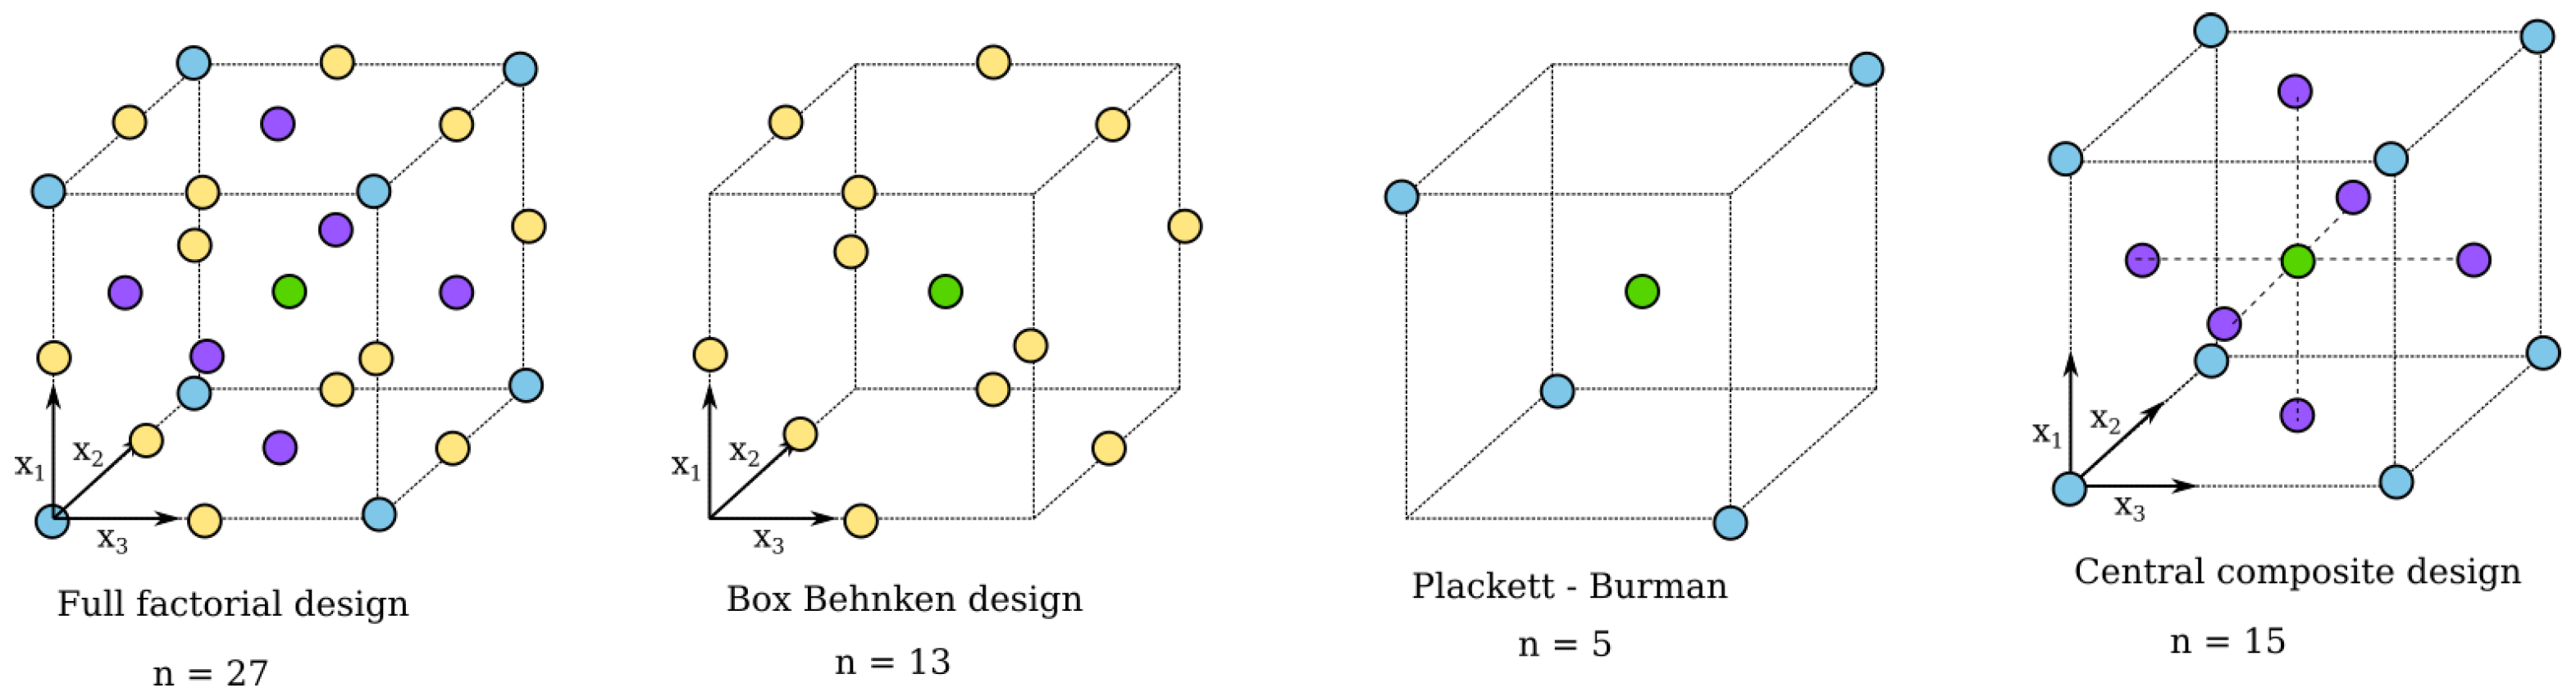
Figure 4 plots and compares the sampling strategy of the applied DOE methodologies, Full Factorial, Box-Behnken, Plackett-Burman, and Central Composite Design. These methodologies are illustrated in a three level design space , in the case of parameters. It can be seen from the figure, that in the case of a full factorial design, for all of the sampling points, 27 simulation should be done, while in the case of a Box-Behnken design only 13 variables should be considered. If the number of the parameters (n) increases, these sampling strategies are becoming more and more efficient. However, neglecting a large amount of sampling points leads to the loss of calculation accuracy. If the computational time is not critical, the full-factorial solution gives the most accurate solution. In the rest of the paper, the full factorial design is calculated to be used as a reference to compare the different methodologies with that.
2.3. Computational Model and Validation
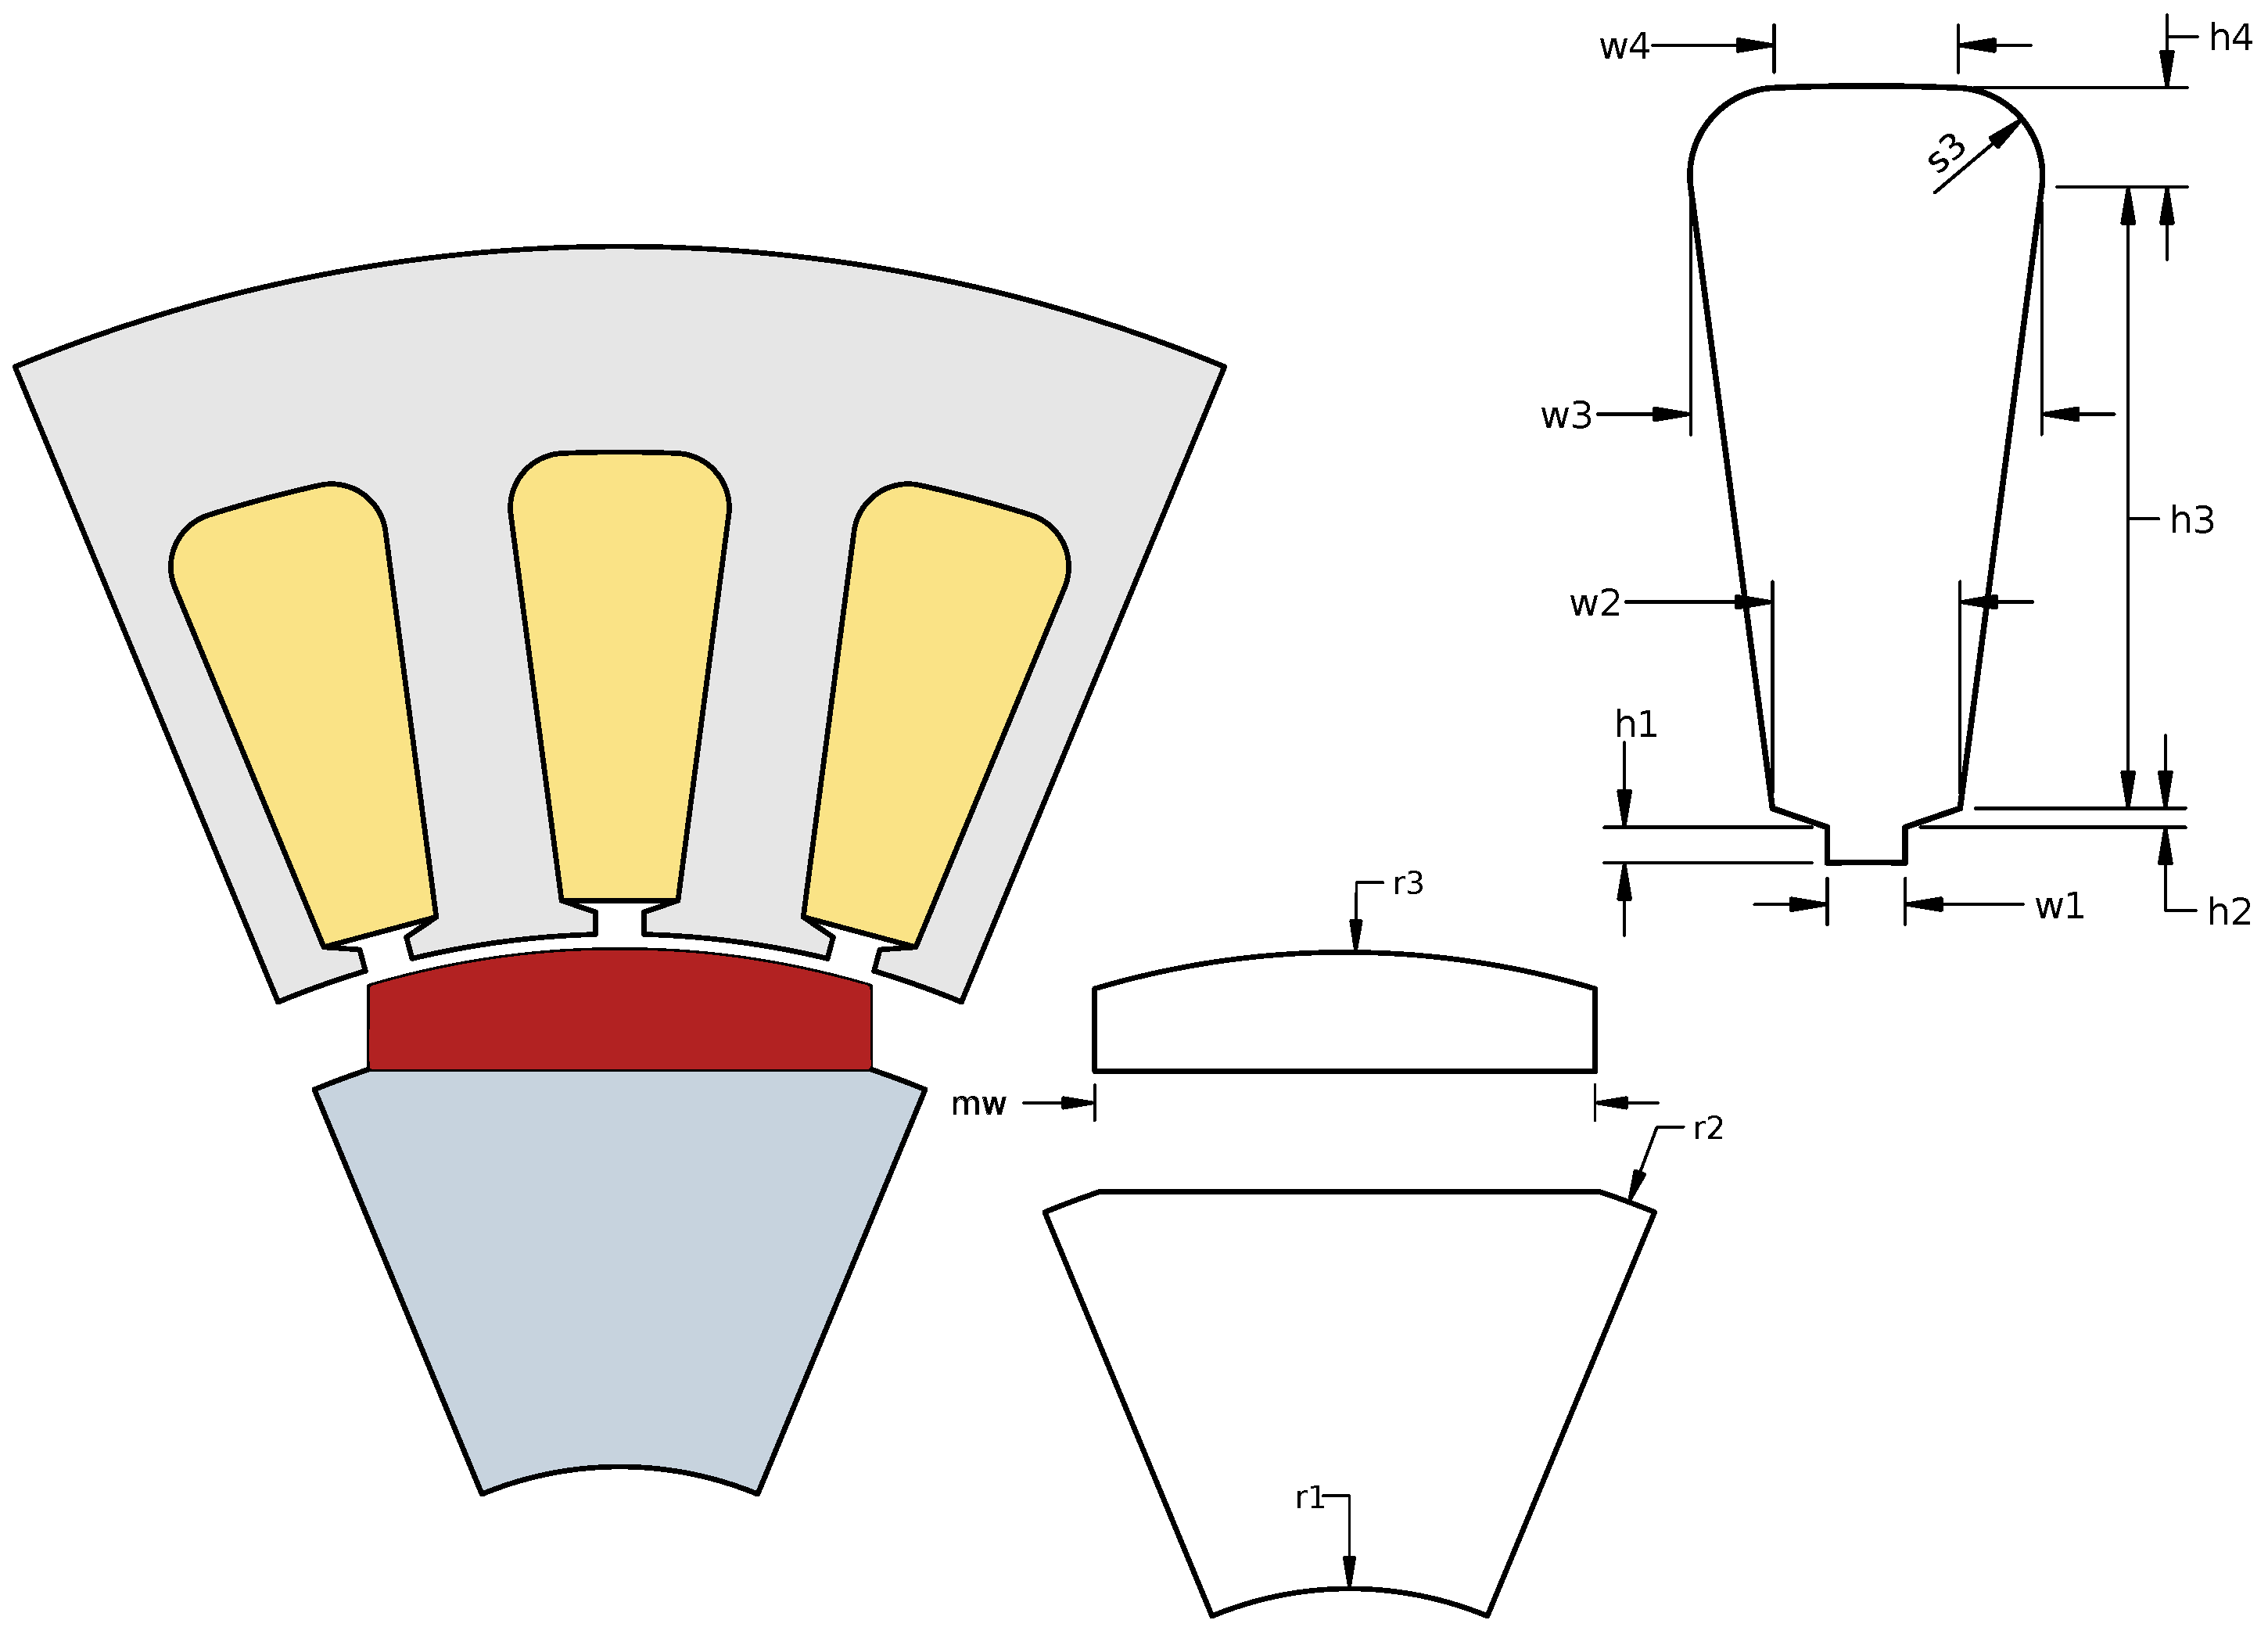
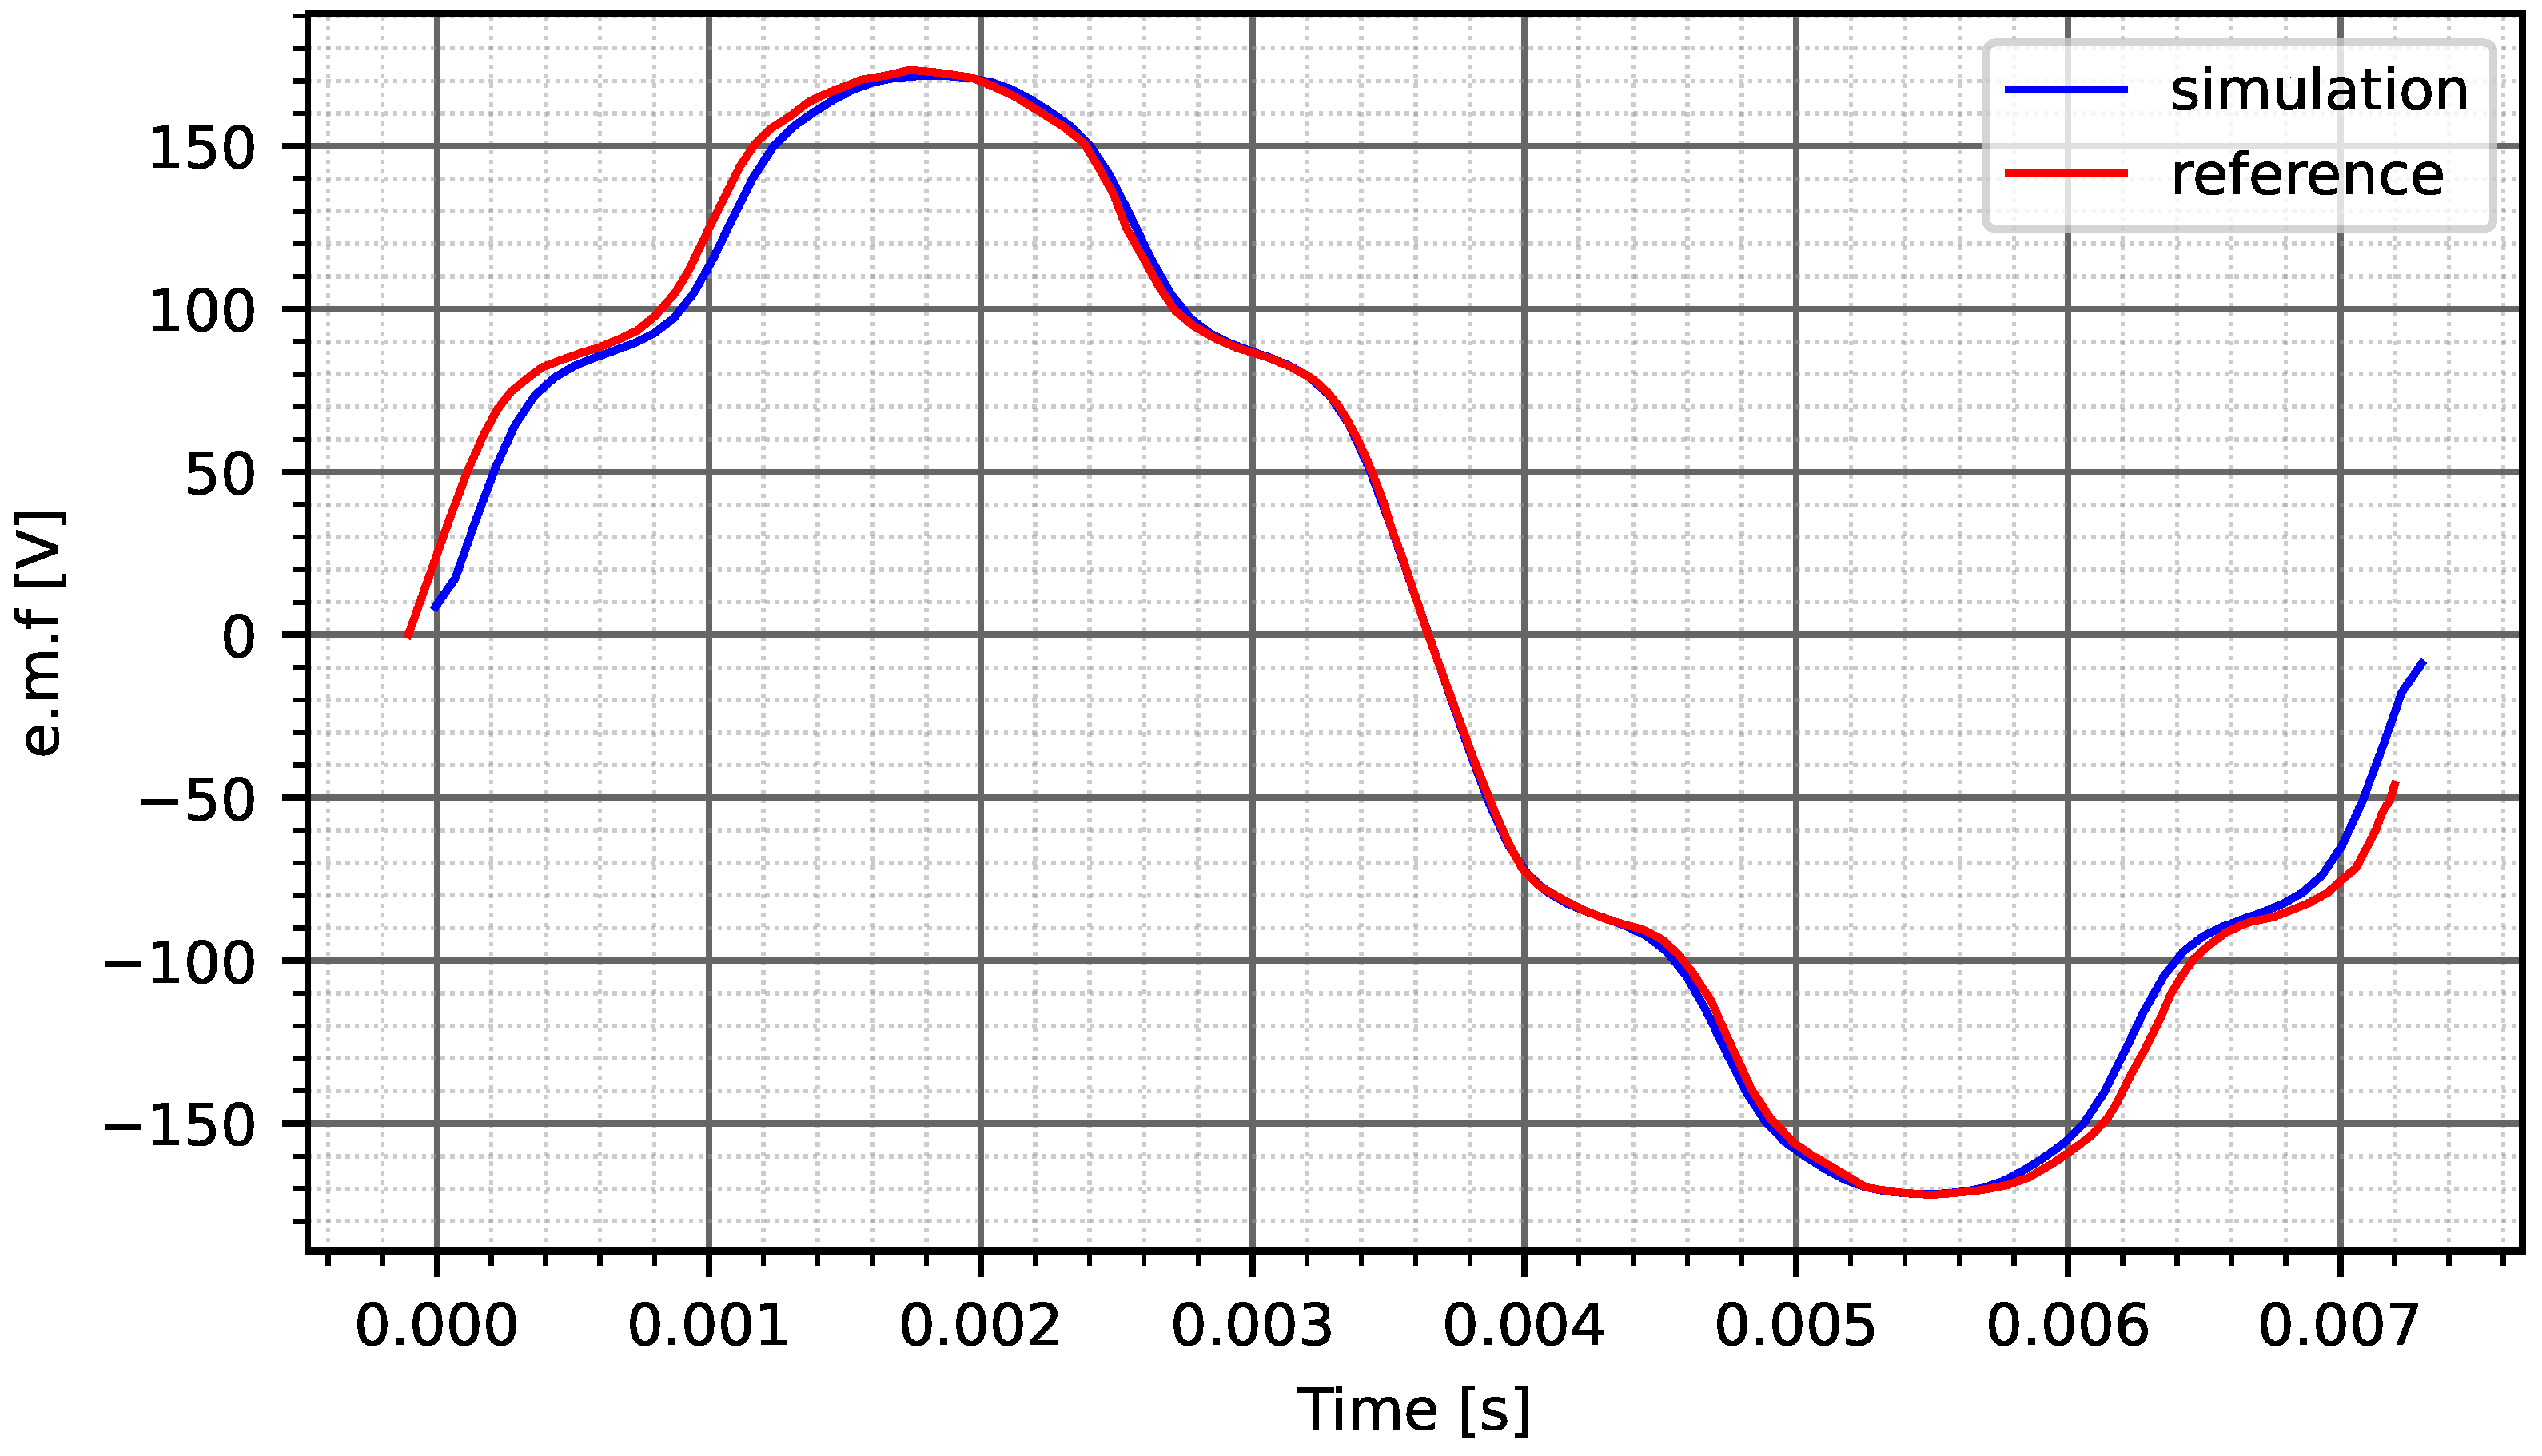
The examined geometry originally published by Antunes [52] (Figure 5), then Meeker [53], used this geometry to demonstrate his novel sliding band algorithm in FEMM. He gleaned the original geometry and the material parameters (Table 1) from [52,54] the calculation results validated by a benchmark line-to-line voltage measurement (Figure 6) [54].
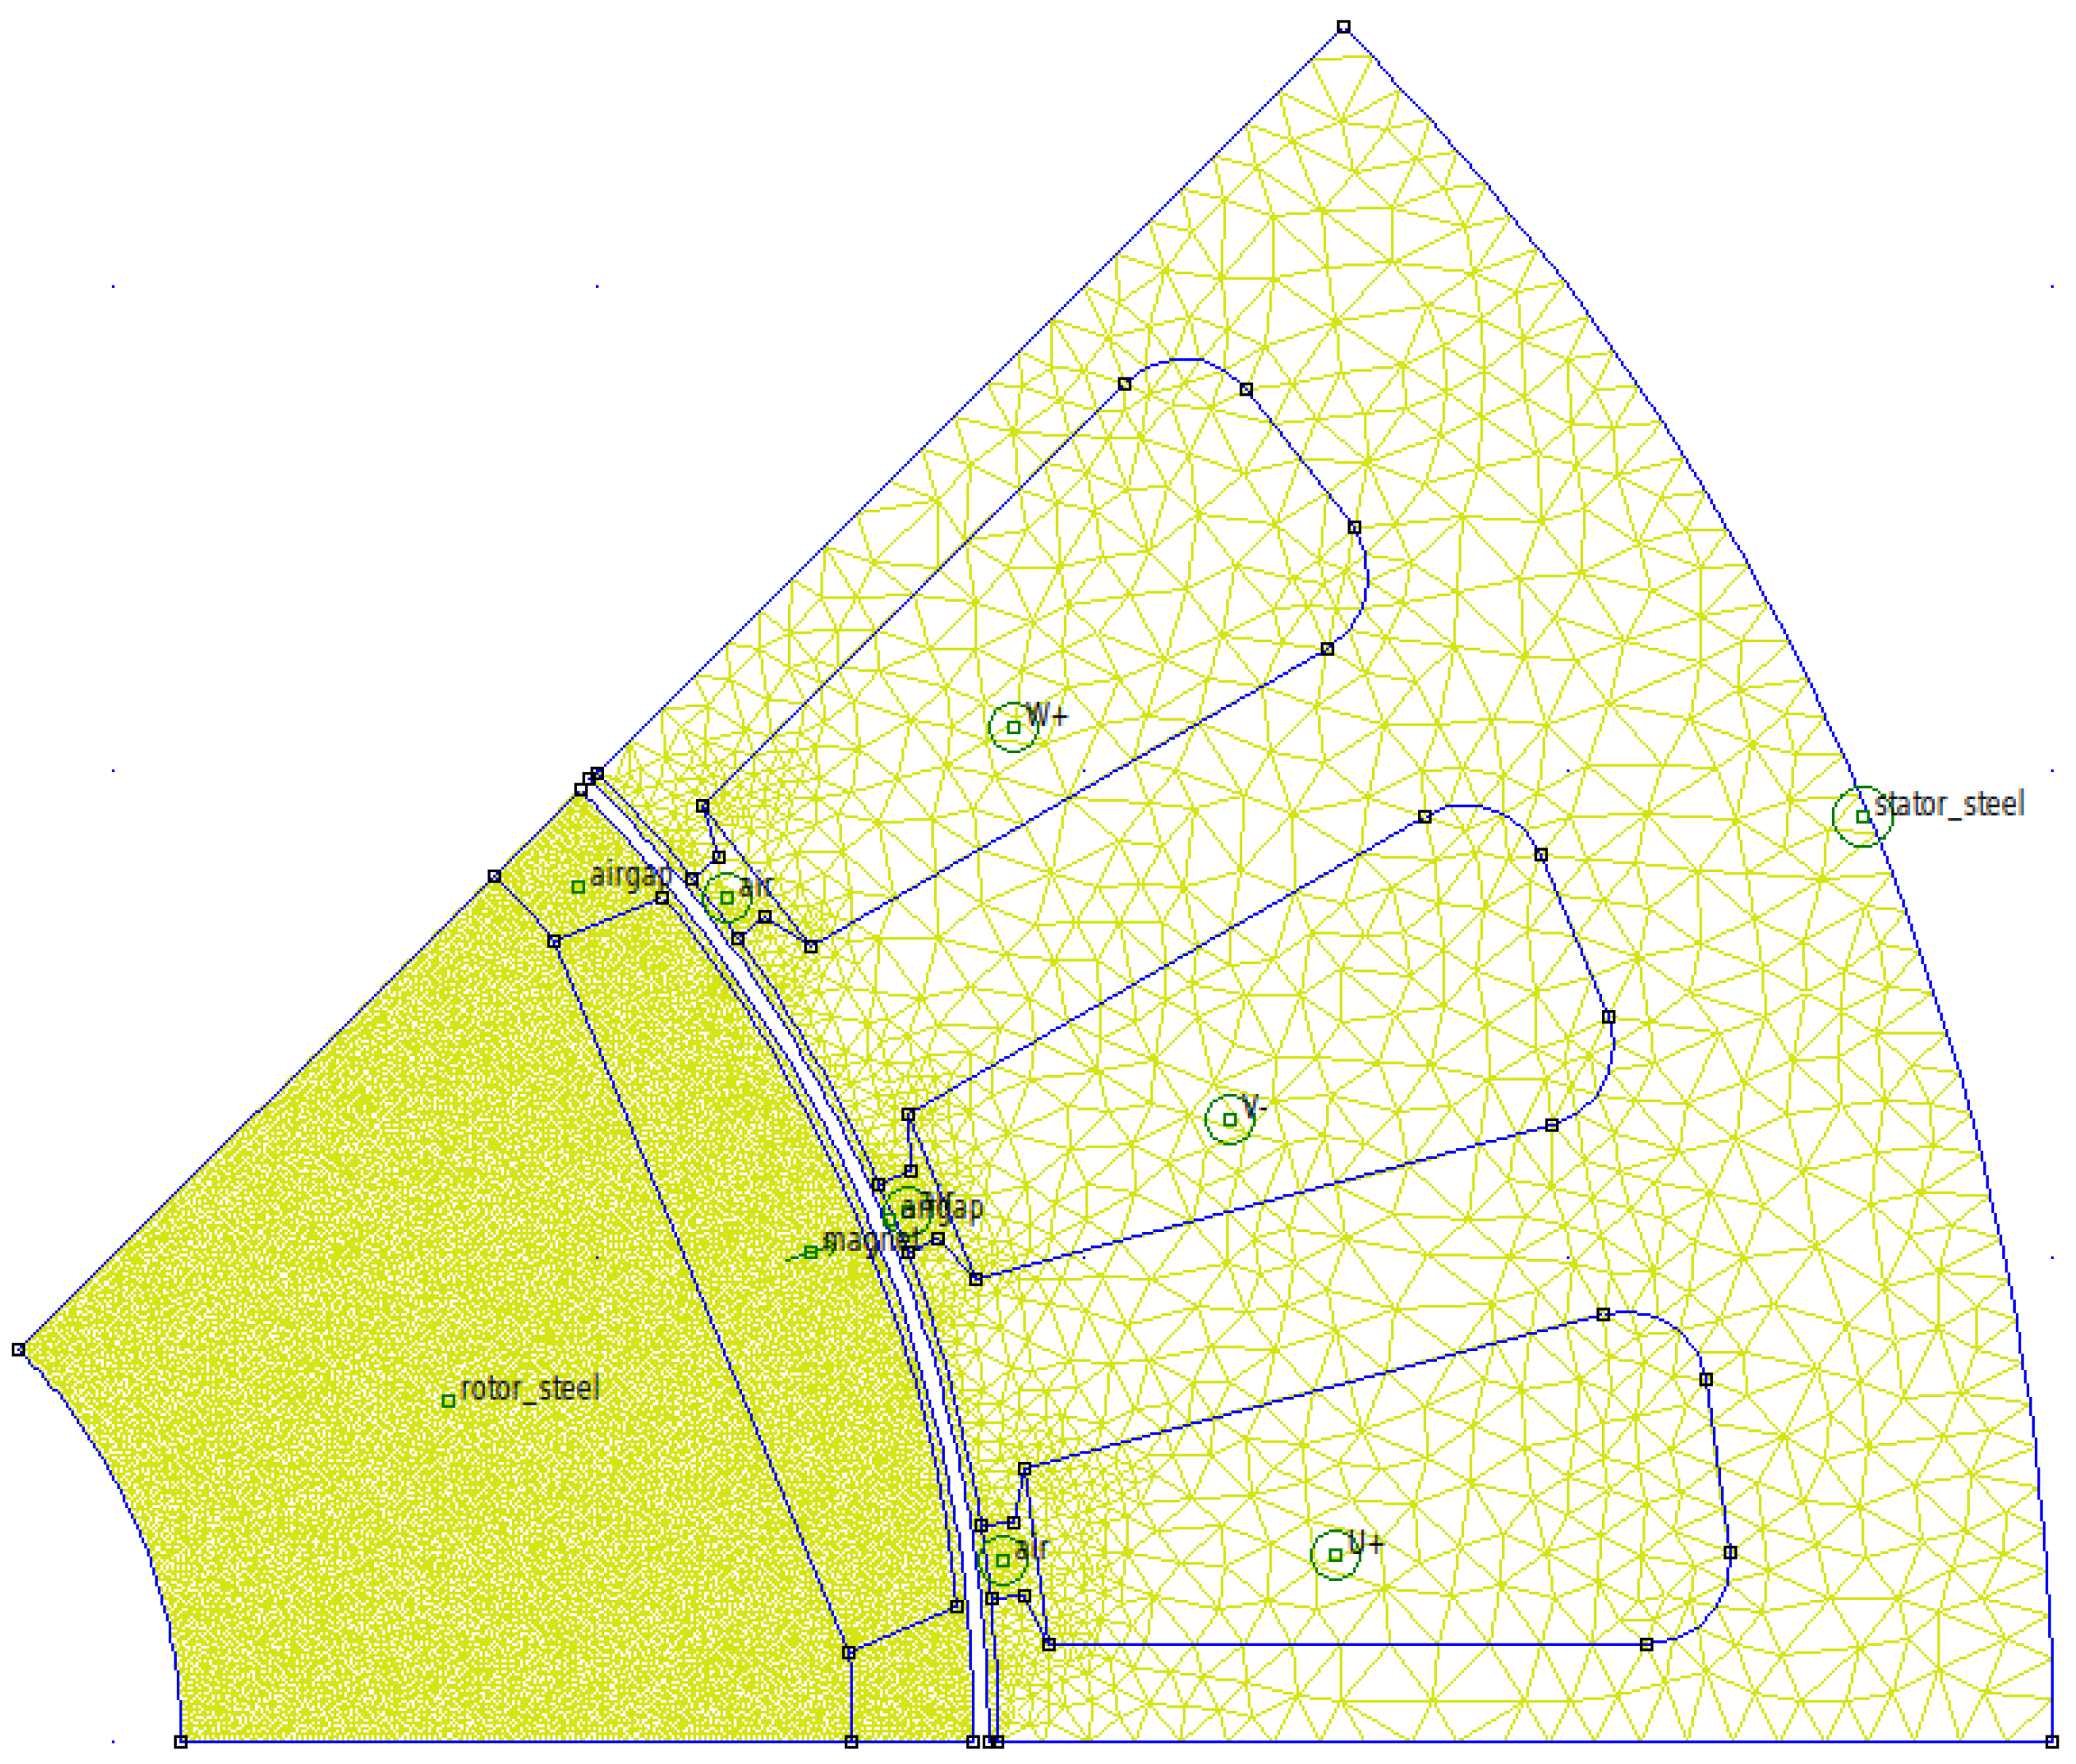
The subject of the simulation was the computation of the cogging torque. Anti-periodic air gap boundary condition was used to account the mechanical rotation between 0° and °. The motor has 24 slits, therefore the cogging torque has the period of °. It is symmetric in 61 steps. Figure 5 plots the realized segment of the permanent magnet machine in Digital-Twin-Designer. Every colored region is imported from the CAD geometry and modeled as a separate part. All of these parts are parameterized, and these parameters can be automatically used in the tolerance analysis. To call the API, the user has to fill the tolerances section of the input json, which consists of three parts: the selected design of the experiments method, the list of parameters that can be changed as well as their absolute tolerance values, and the selected variables that will be the output. It is worth pointing out that not only geometrical parameters can be used in the tolerance analysis but virtually any parameter that the particular model accepts.

Listing 1.
The tolerance analysis section in the API call. The type is “ff” which translates to the Full-Factorial design. Below the changing parameter names and their absoulte tolerance values. The “s1” parameter is coupled with the length of the airgap, “r3” and “mw” sets the magnets height and width, while “Hc” and “mur” set the magnets’ coercive field, and relative permeablility tolerances. The results will be calculated for the “Torque” variable.
| \label {listling} |
| { |
| "tolerances":{ |
| "type":"ff", |
| "parameters":{ |
| "s1":0.05, |
| "r3":0.05, |
| "mw":0.05, |
| "Hc":5000, |
| "mur":0.05 |
| }, |
| "variables":[ |
| "Torque" |
| ] |
| } |
| } |
2.4. Mesh Selectivity Analysis
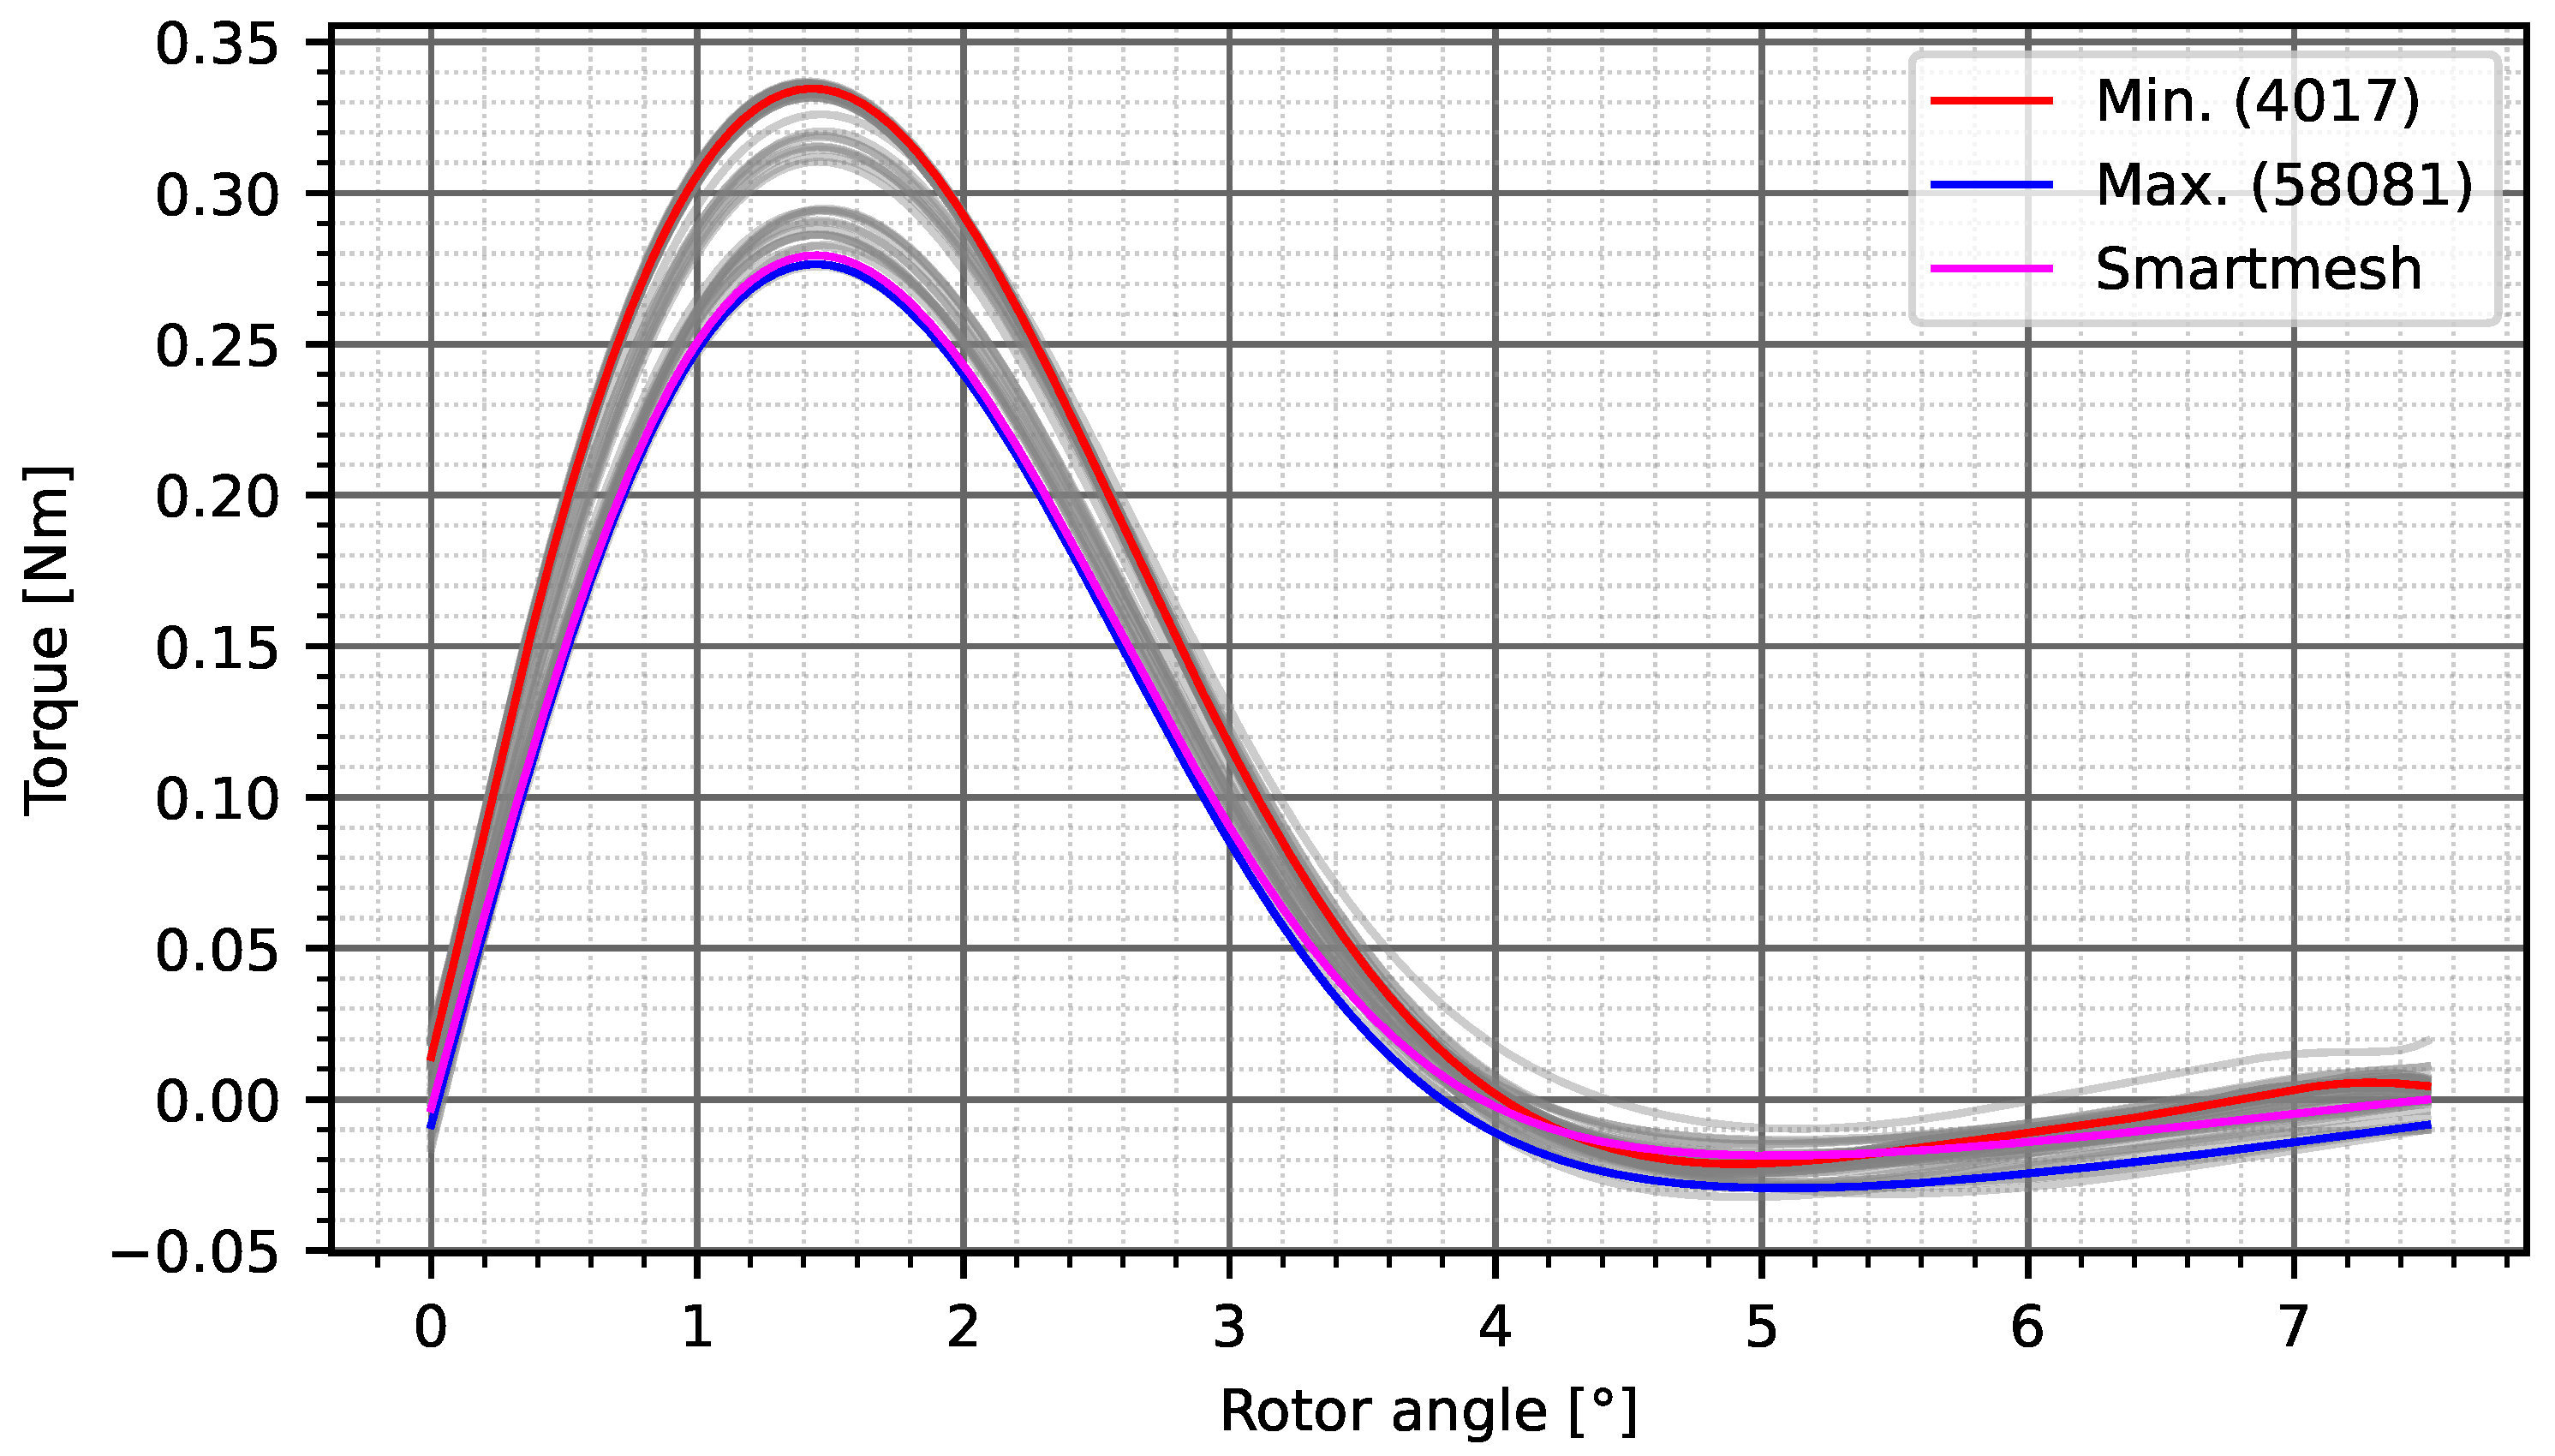
Before the tolerance analysis, the impact of the discretization on the cogging torque calculation was examined because the cogging torque is very sensitive to meshing errors. The order of the cogging torque calculation error magnitude can be on the same scale as the result. A sensitivity analysis was carried out to establish the achievable accuracy. The mesh size changed between mm and mm with 51 steps in the airgap, rotor, and magnet. The element count varied between 4000 and 58,000 during these analyses. Figure 7 shows one of the examined configurations, while the results can be seen in Figure 8 around the peaks. When the minimal number of elements was used, the peak value of the cogging torque was given to 0.335 Nm (Figure 9). This is significant, more than 20% higher than when smart mesh or the maximal number of meshes were applied (0.275 Nm).
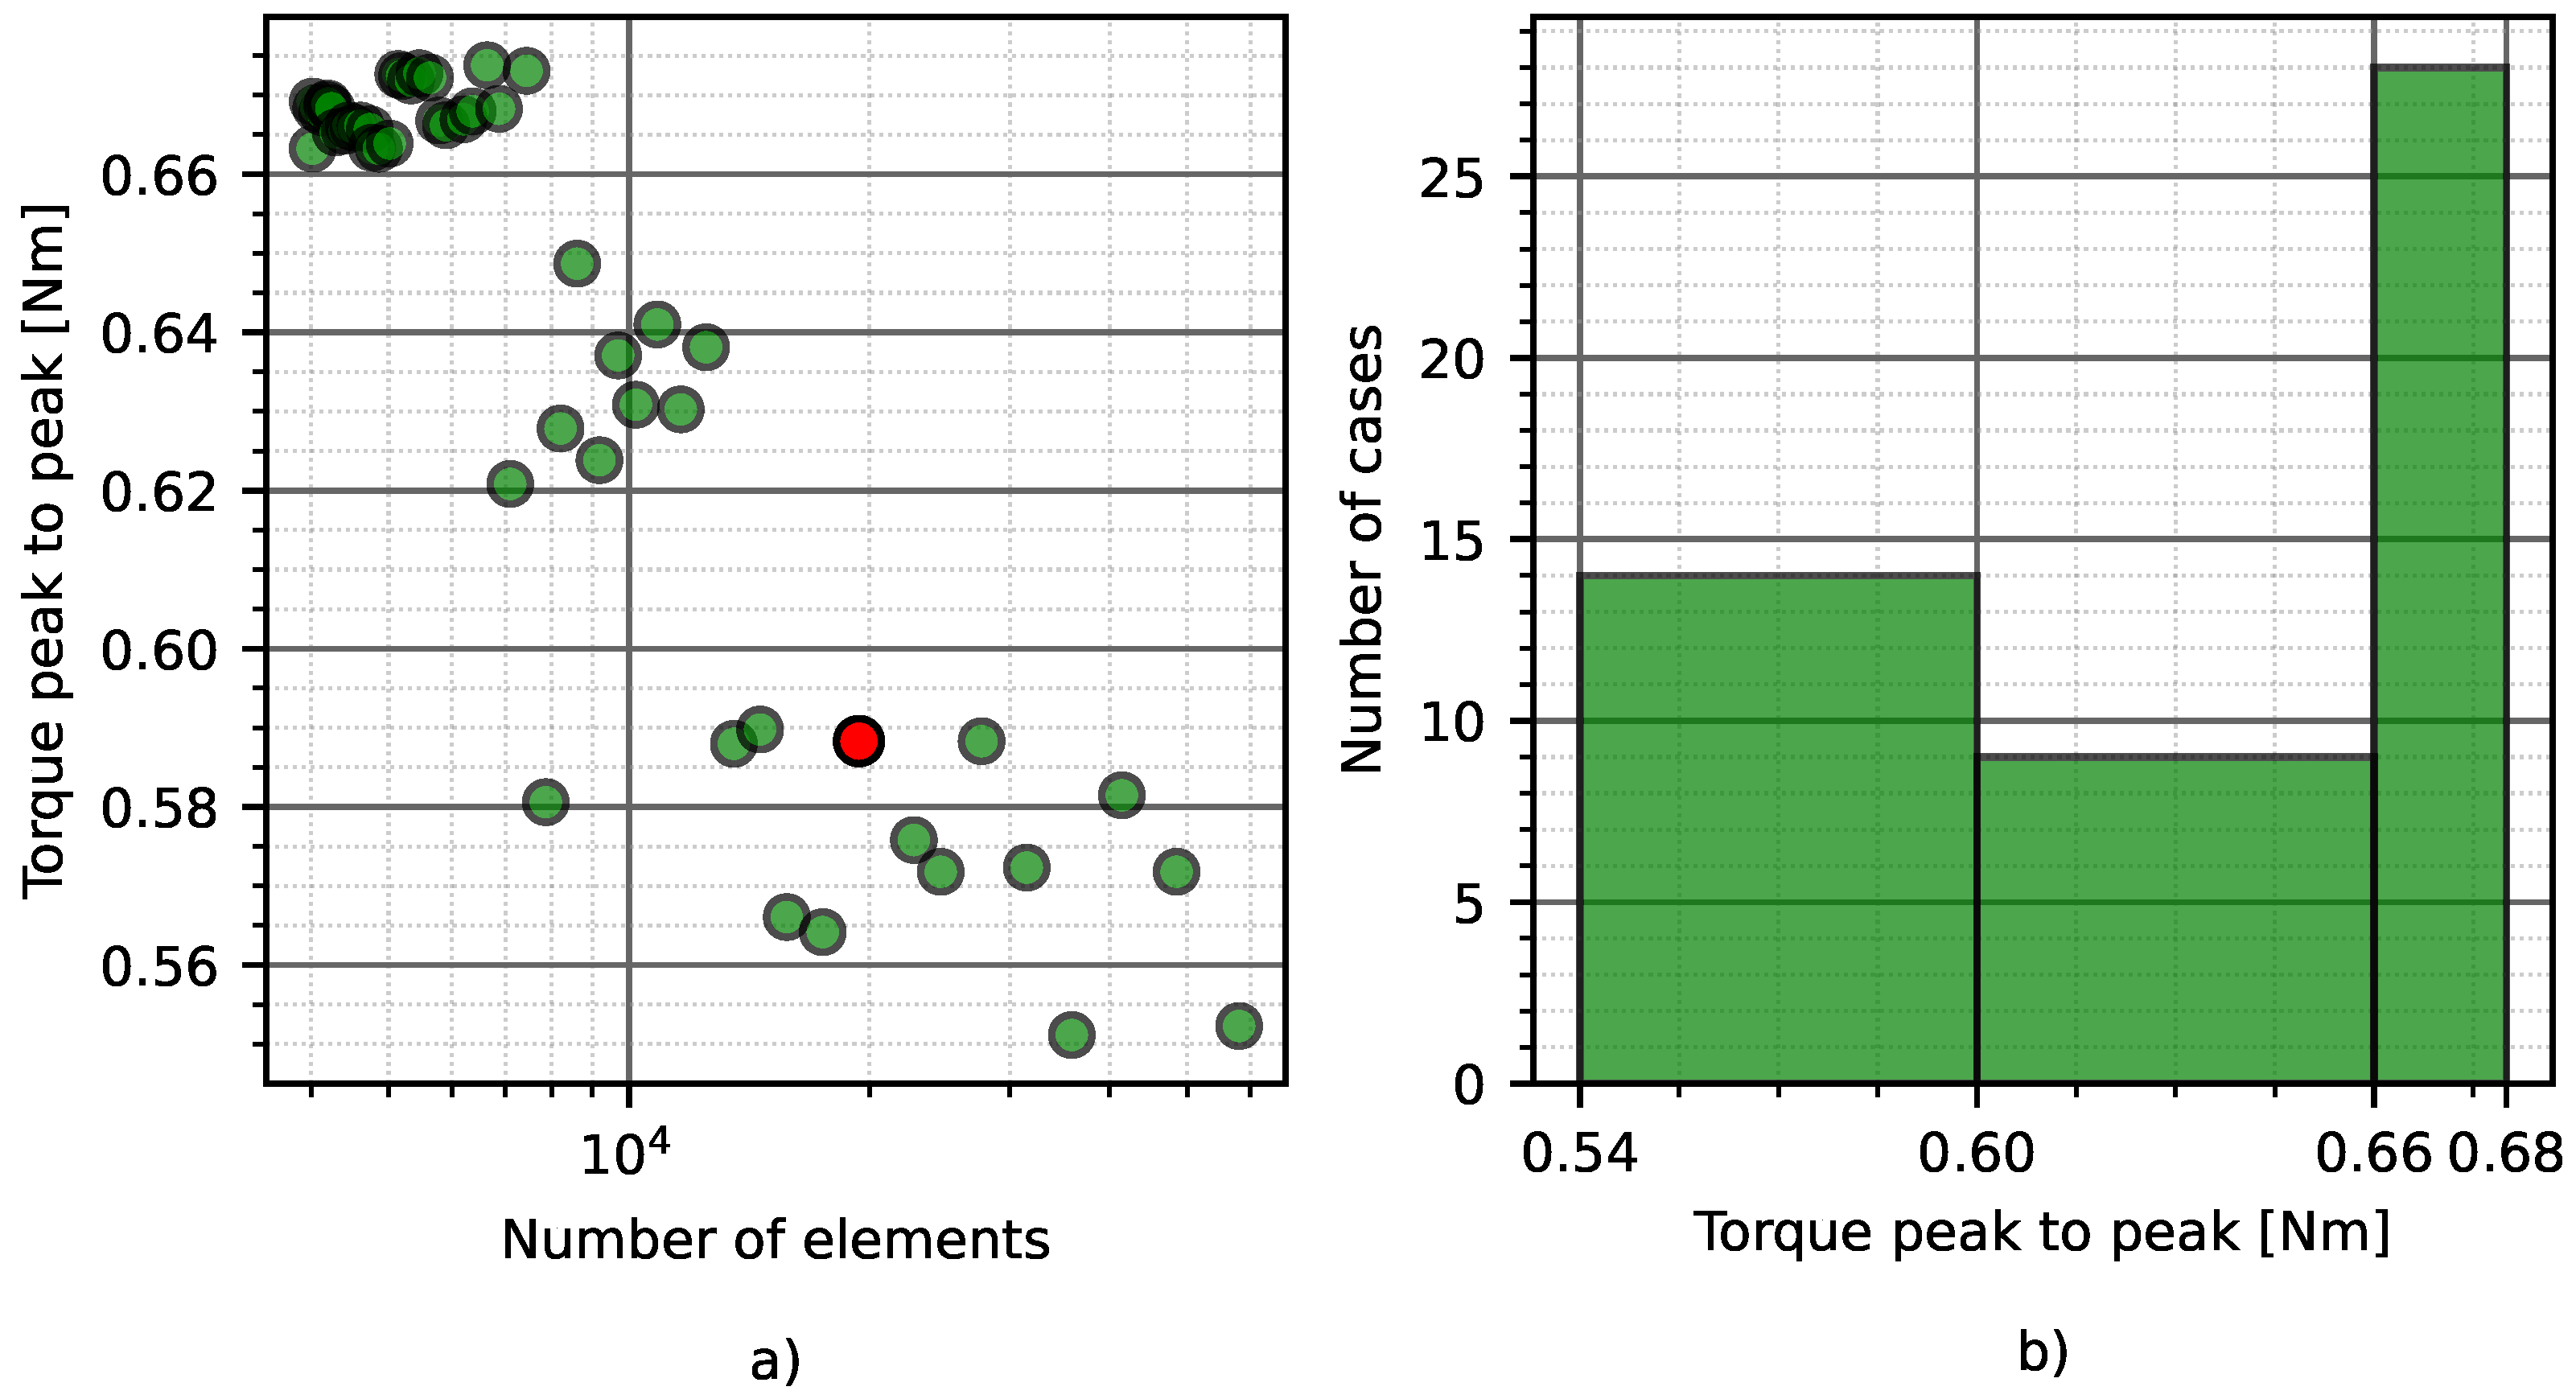
To get a better overview from the proposed solutions, the peak to peak torque is plotted in the function of the mesh elements (Figure 10). It can be seen from the picture that the highest value of the resulting torque is 0.655 Nm, while the smallest value is 0.55 Nm, the difference between these two calculations are more than 15%. If the number of elements are increasing, the value of the cogging torque is fluctuating around 0.57 Nm with ±0.015 Nm amplitude (Figure 10). (Figure 10 red dot).
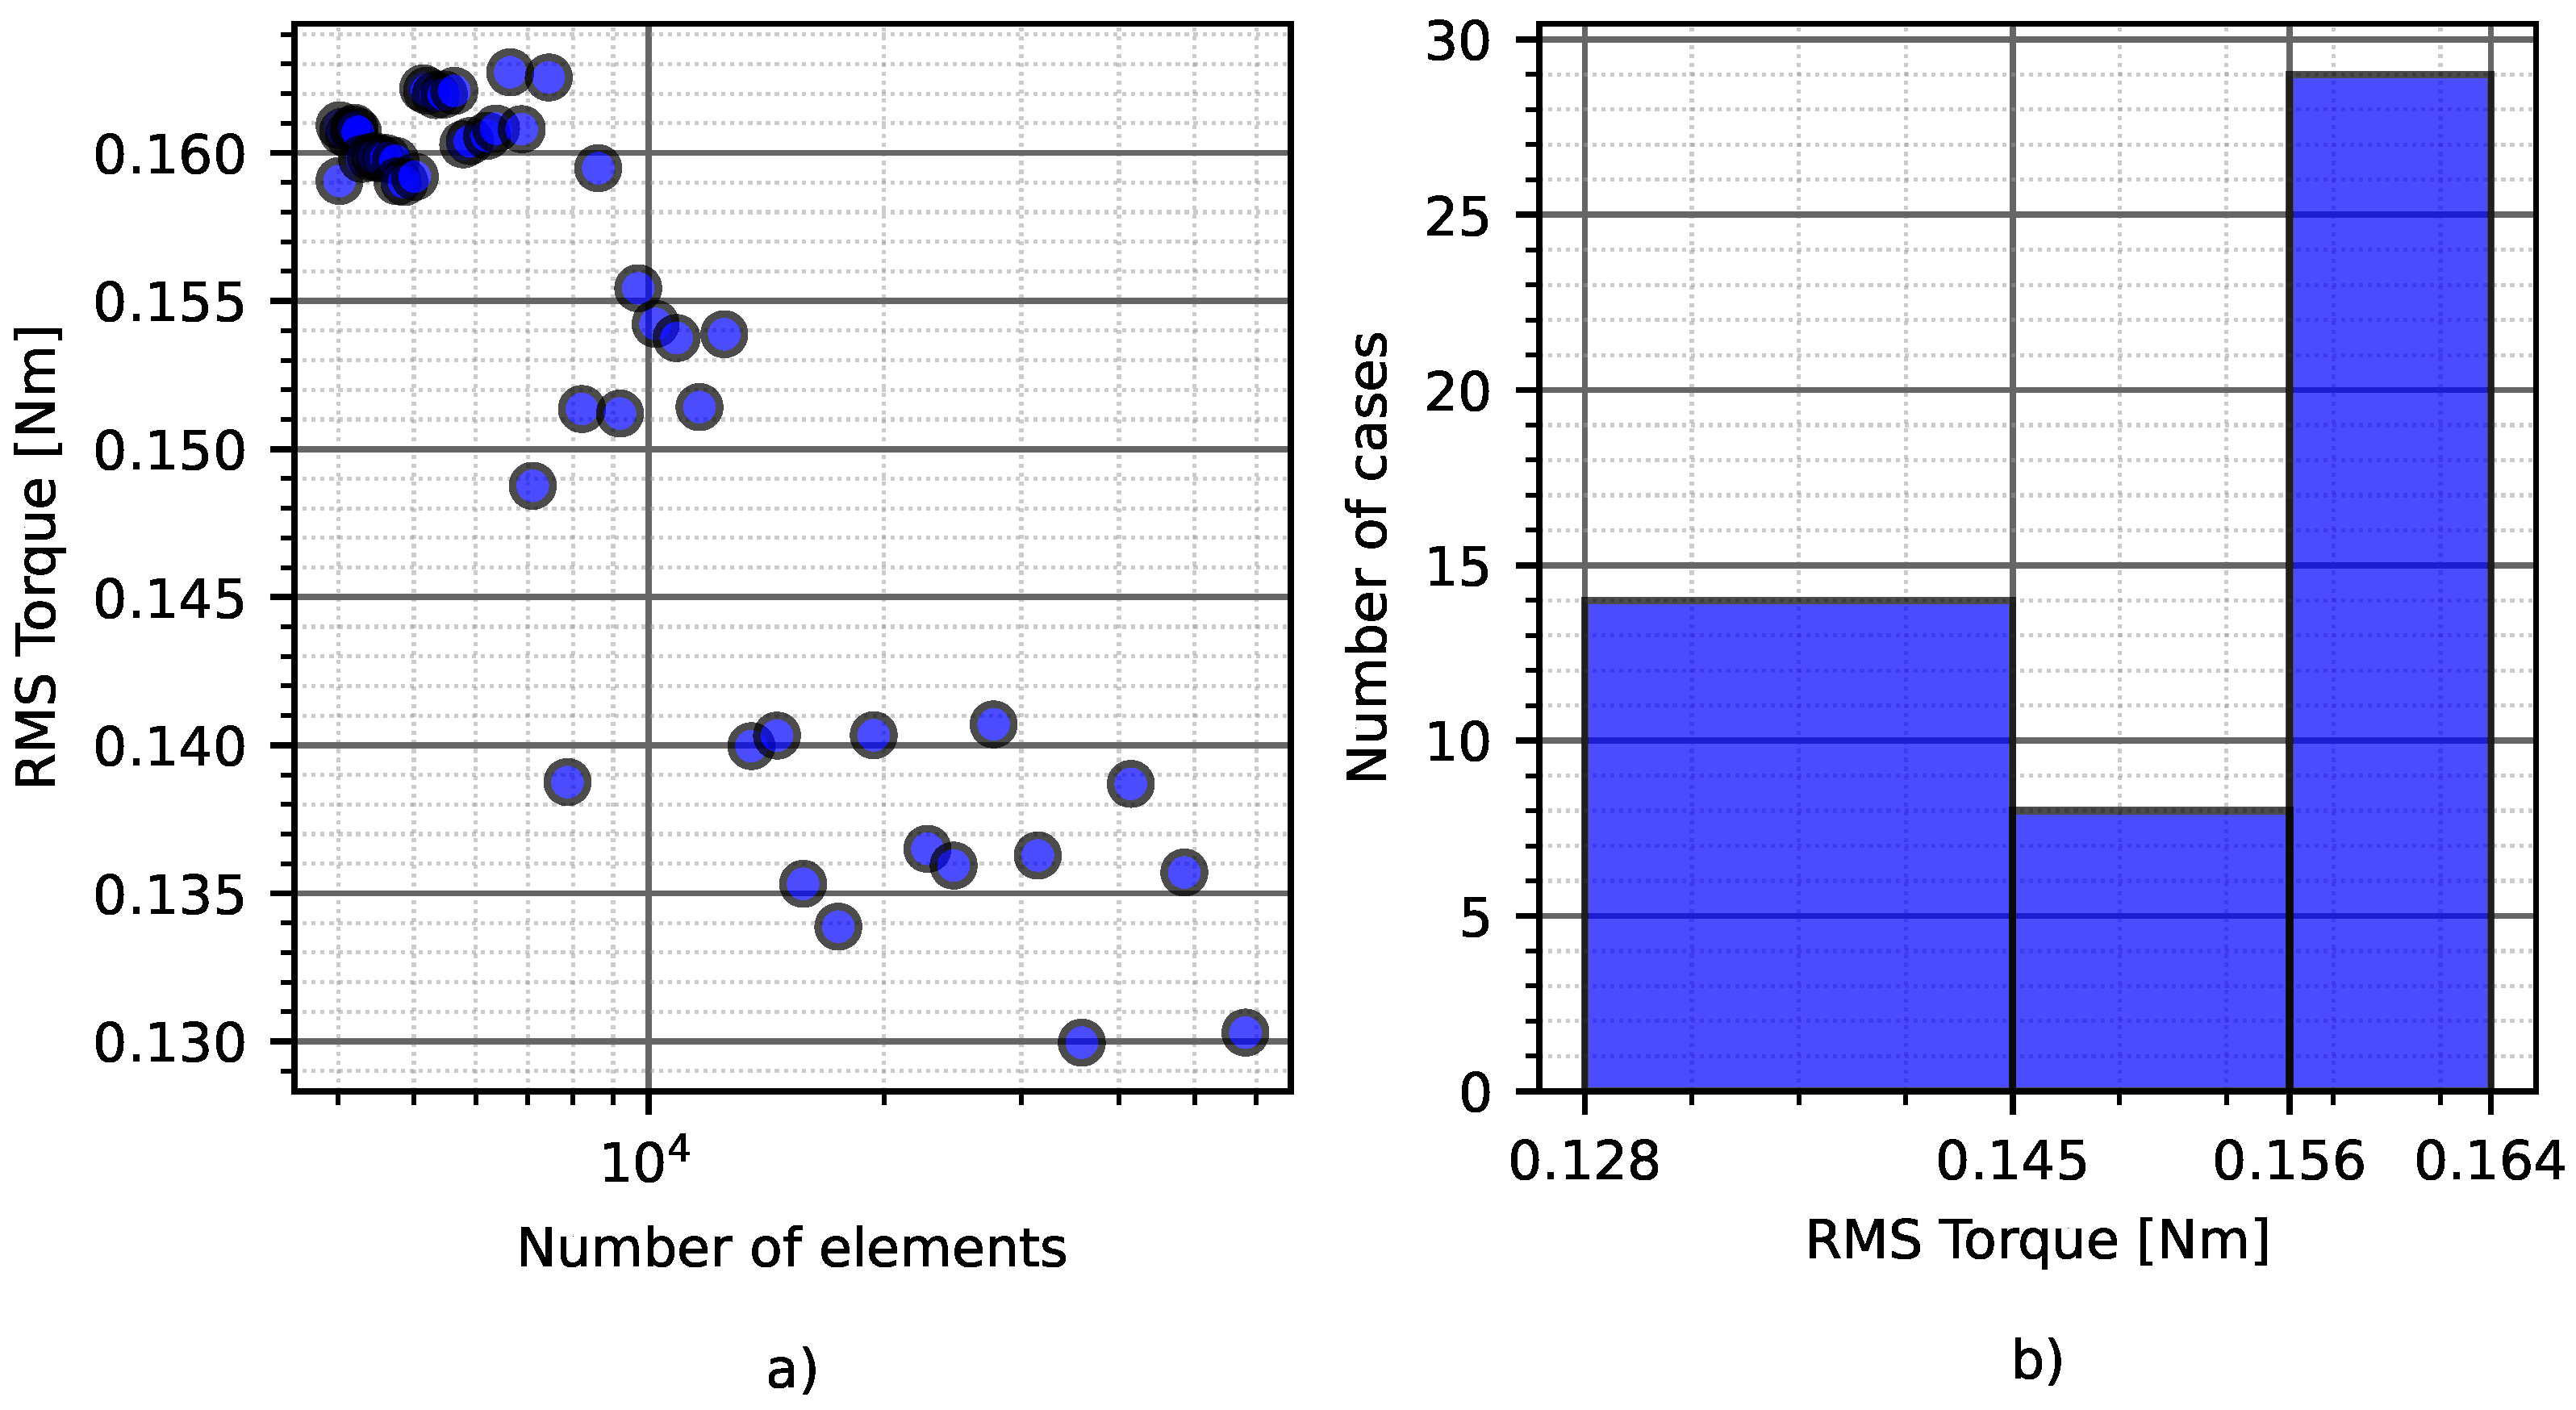
The same statistical analysis was made for the RMS value of the cogging torque, as well. Here, most of the calculations are fluctuating around 0.135 Nm, and they are placed between 0.130 Nm and 0.140 Nm. Based on the model and the calculations, the accuracy was about 3.7%, which is a bit less than what we got from the peak-to-peak calculations. This means that during the tolerance analysis the disturbances have to produce at least a % difference compared to the reference values in order to create a measurable difference in the peak-to-peak- as well as the RMS torque values (Figure 11).
2.5. Tolerance Analysis
During the tolerance analysis, five design parameters of the BLDC machine were varied. The examined parameters with their tolerances are summarized in Table 2 and plotted in Figure 12. The parameters can get three values with equal probability, which means that combinations should be considered during the full-factorial analysis. In each case, half of the cogging torque period was simulated in 61 steps. Hence, 14,823 FEM simulations were performed to calculate the resulting cogging torque’s full-factorial design, mean value, and standard deviation. This full factorial design and the resulting values are used to compare the resulting minimum, maximum, and mean values of the cogging torque with the results of different DOE methodologies: Box-Behnken, Central-Composite (CCF), Plackett-Burman, and the Taguchi designs. All of these methodologies offer a significant reduction in the calculation time. The CCF design needs the most computational cost with its 43 designs, which means an 82% reduction compared to the reference. The Plackett-Burman methodology is the cheapest, with only eight design cases. This is only the 4% of the full factorial design’s computational demand.
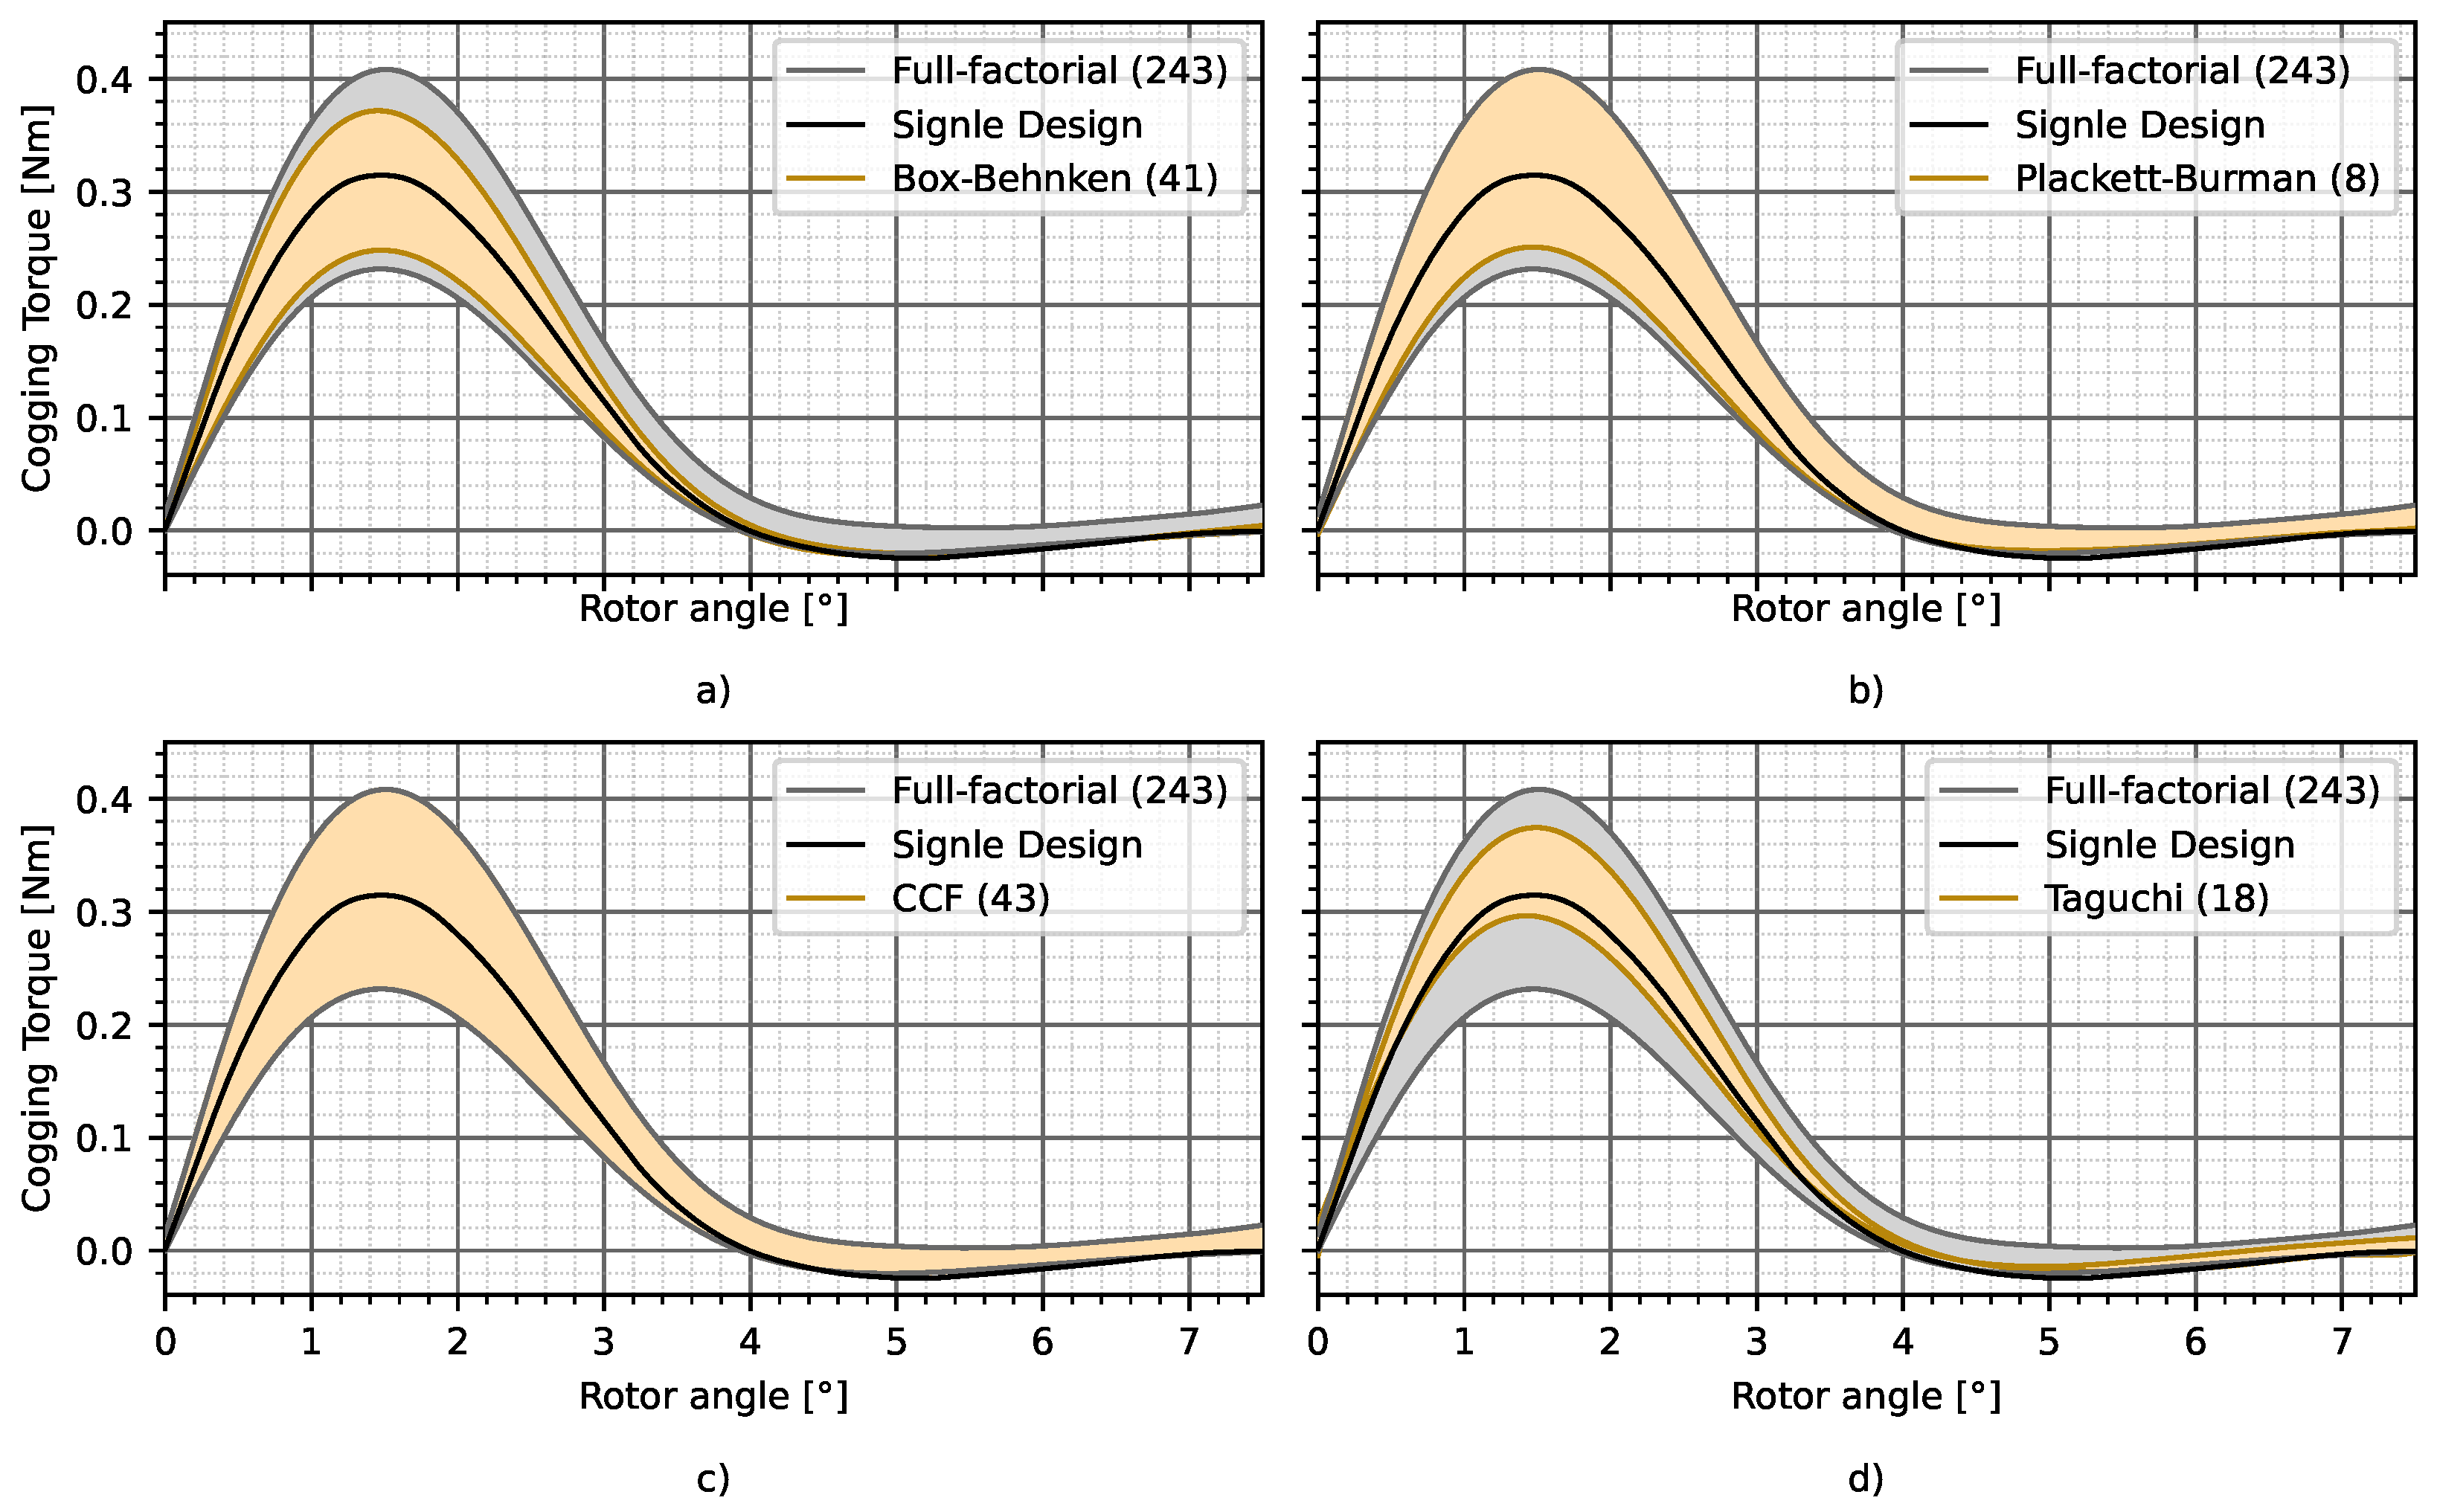
The results of the cogging torque calculation are plotted in Figure 13 and the resulting mean values are summarized in Table 3. The single design represented in Table 3 shows the previously analyzed FEM calculation, with the expected physical dimensions of the machine. Therefore single analysis means a precise FEM calculation without considering the tolerances of the parameters. Here, the error of the calculation represents the meshing error. The first finding is that the resulting mean value of the full-factorial design is significantl more than 5% higher than the original calculation. Surprisingly, it can be seen from the mesh sensitivity analysis that a single FEM calculation with a coarse mesh is more close to the result of the full-factorial design than the more precise ones (Figure 9). The reason of this phenomena is the high sensitivity of the cogging torque to the changes of the selected parameters, and there is no coincidence between the mesh selection and the mean value of the full factorial design.
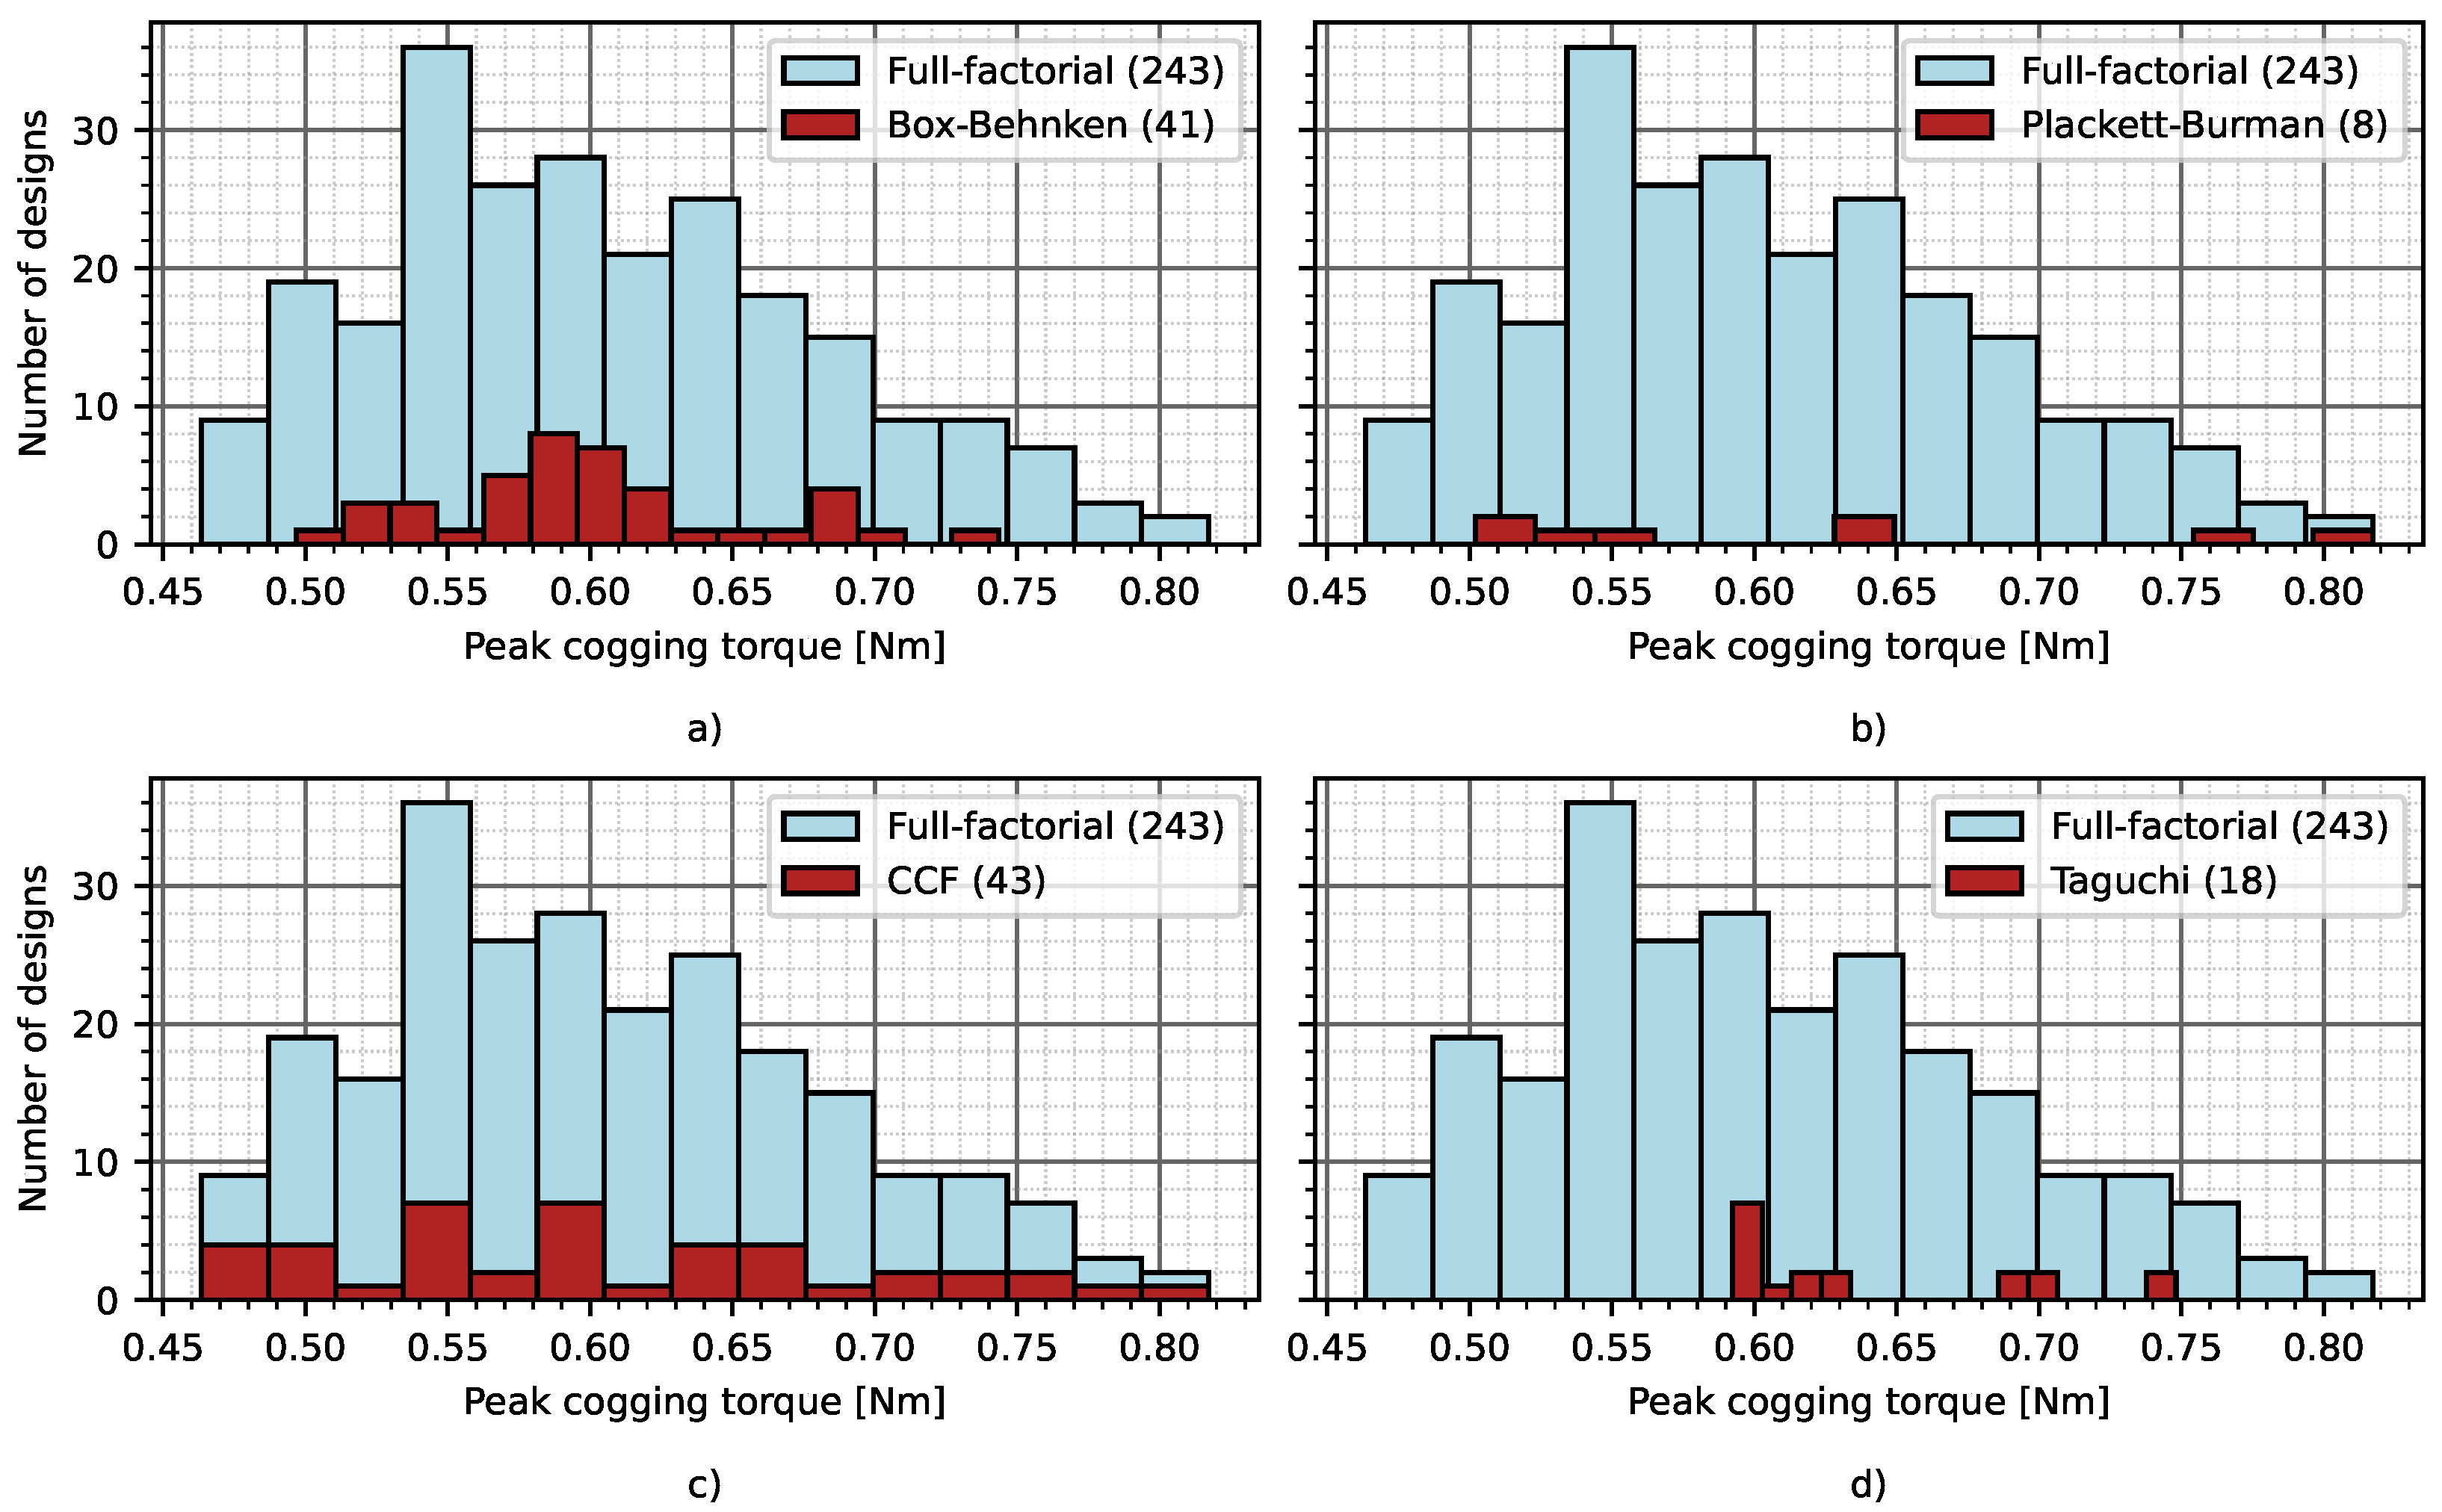
Surprisingly, the tolerance region of the resulting cogging torque is not symmetrical, although everywhere the tolerance regions of the design parameters were considered symmetrically. The smallest value of the resulting peak-to-peak cogging torque is 0.46 Nm, while the highest one is 0.83 Nm. Thus, the examined tolerances can cause more than 30% higher cogging torque in the machine, as shown in Figure 14.
If we compare the performance of the different DoE methods, it can be seen that the CCF design produced the most accurate tolerance estimation. The Box-Behnken methodology predicted the mean value of the cogging torque well, with 5% accuracy. However, the maximal and minimal values of the resulting cogging torques were under- and overestimated by more than 10%. This methodology gave back nearly the same result for the cogging torque’s mean value while predicting exactly the same value for the maximal and minimal cogging torque, like the full factorial calculation.
The Plackett-Burman design, the computationally cheapest methodology, made a good estimation for the maximum of the peak-to-peak cogging torque correctly, while the resulting minimal value was overestimated by 6%. The resulting mean value of the peak-to-peak cogging torque is more than 15% higher than in the case of the full factorial design.
Finally, the Taguchi methodology based sampling produced the worst estimation for the minimum and maximum values of the cogging torque and it overestimated the mean value of the cogging torque by more than 20%. This methodology did not use the base value for the calculations. This is the reason why we do not see any results below 0.6 Nm in Figure 14.
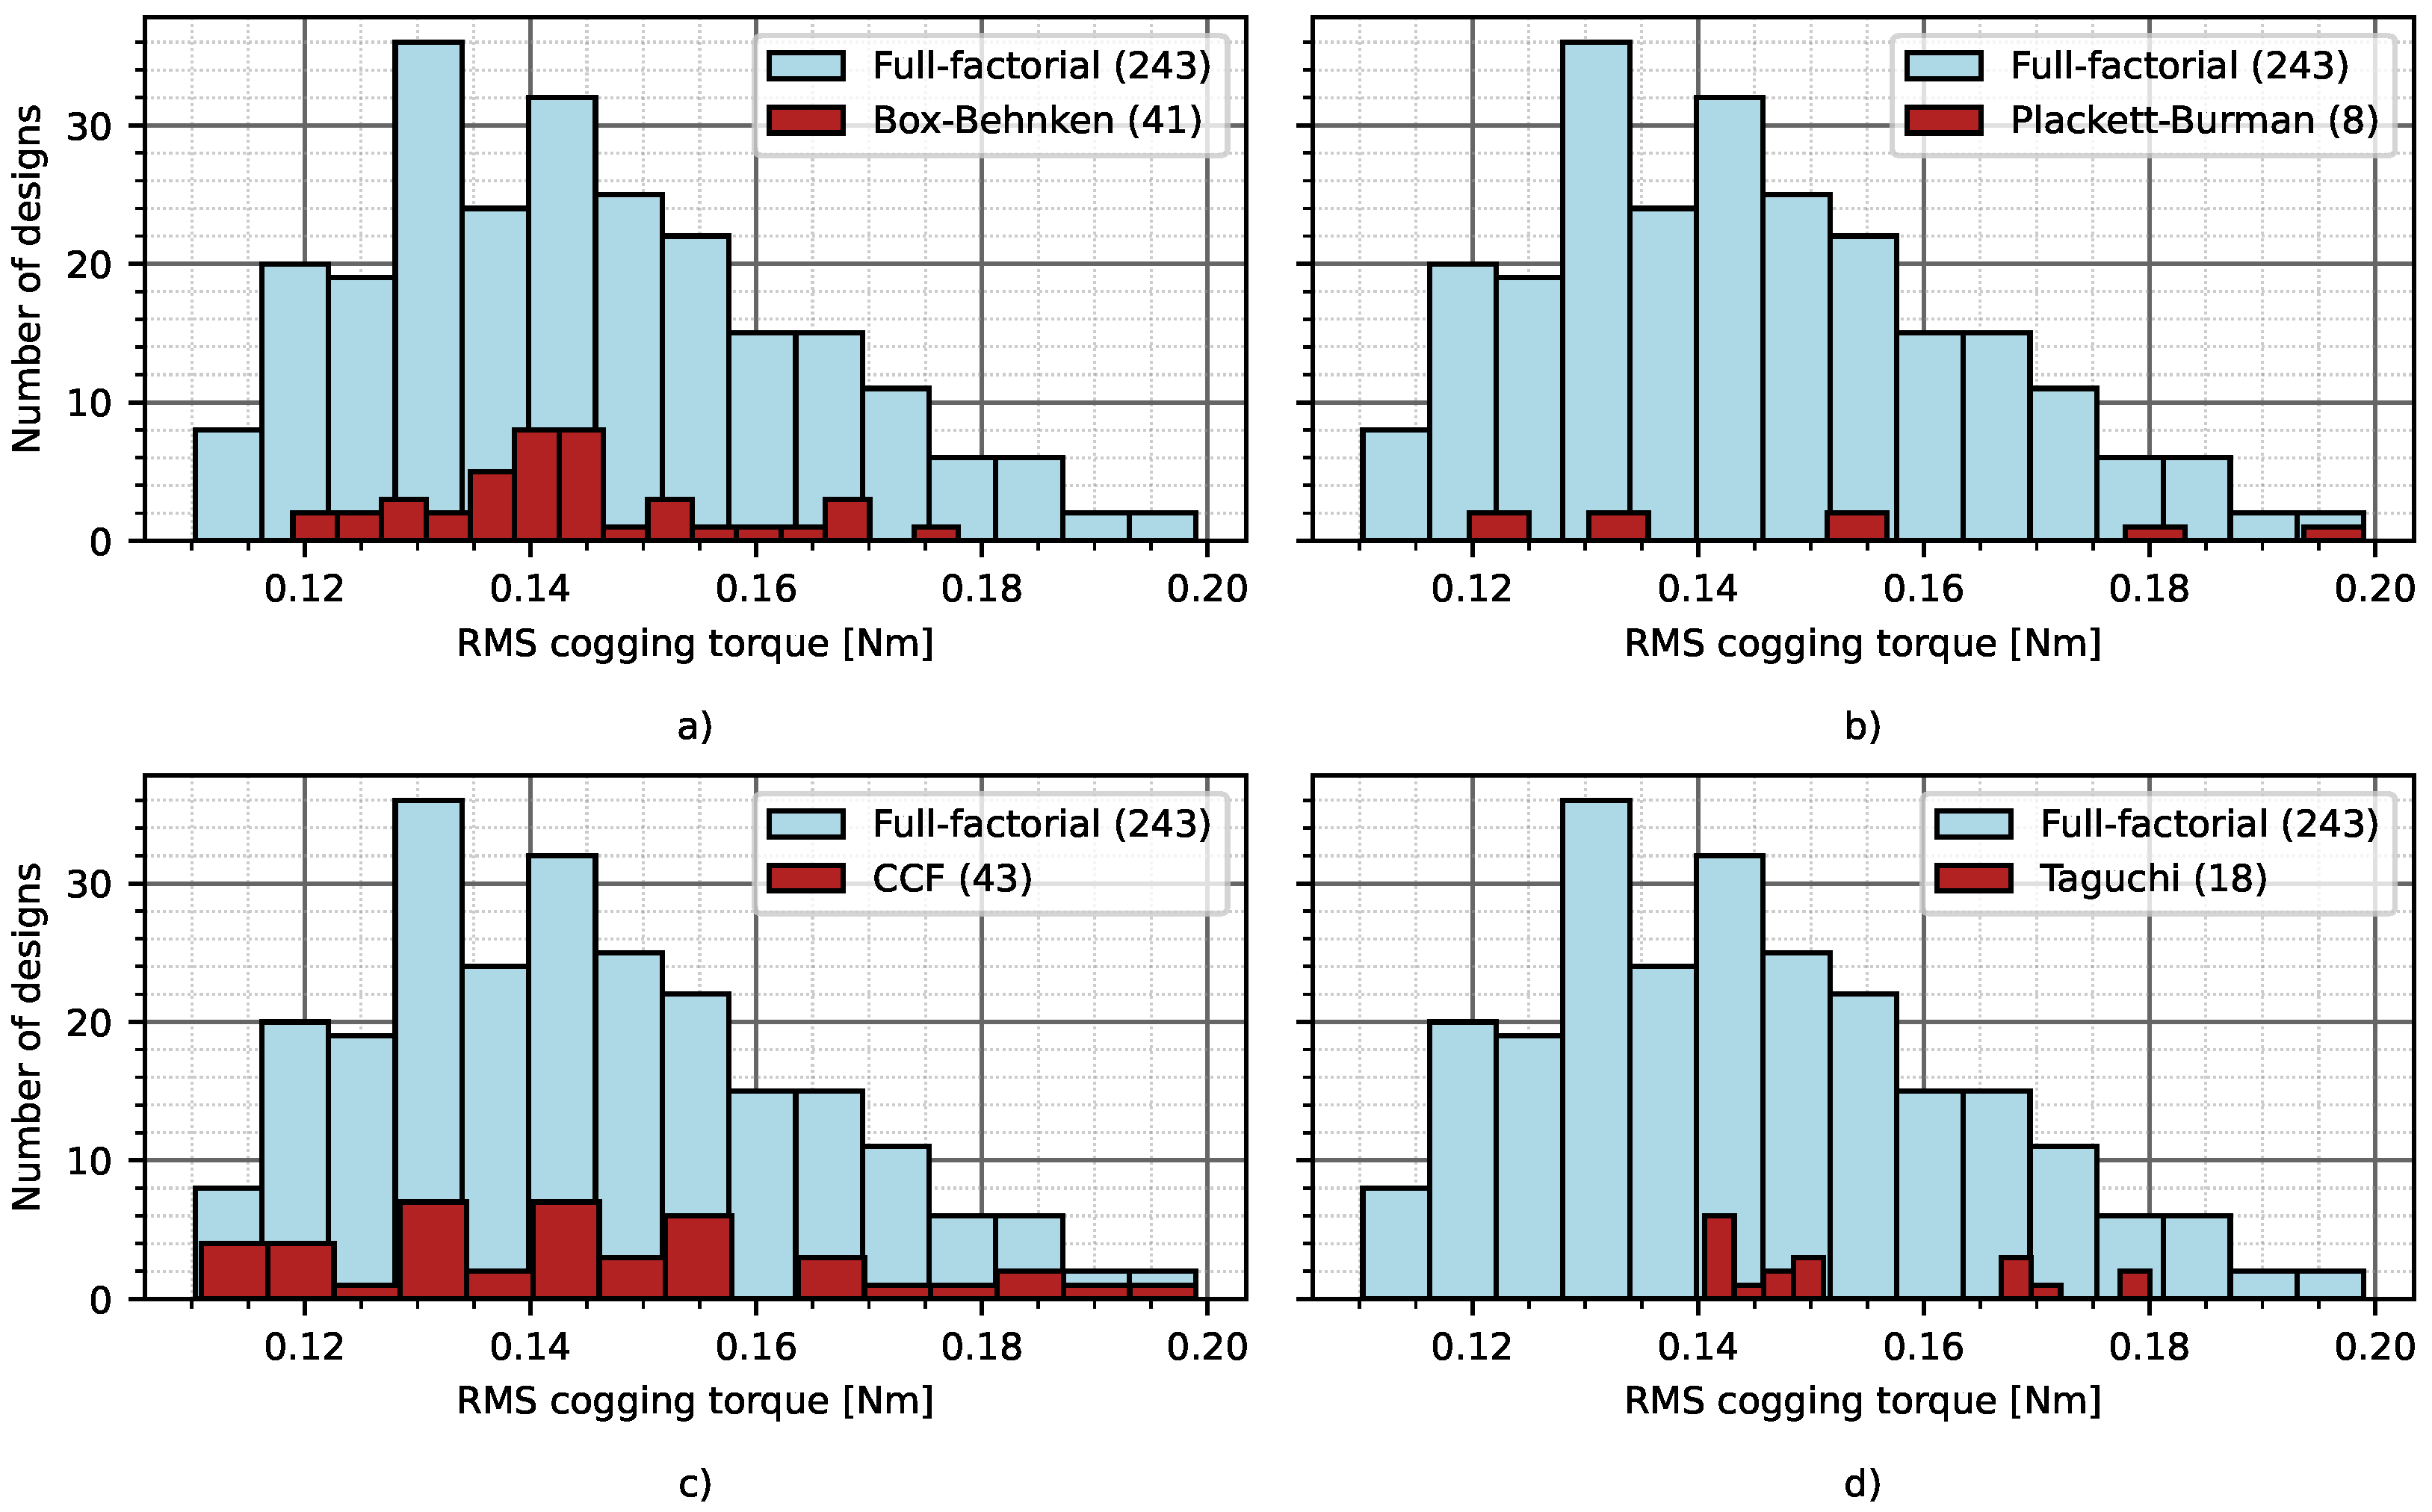
We made the same analysis on the RMS values of the cogging torque to examine what the differences were if we used a different metric to compare the results, a result of an integral instead of a point-to-point difference based metric. The plotted histogram in Figure 15 shows the distribution of the RMS cogging torque in the different cases. The shape of this function is a bit different than in the previous case, as it has two peaks around the resulting value of the base calculation (0.136 Nm), and the mean value of the cogging torque is significantly higher in the case of full-factorial design, like the result of a single design. Both the Box-Behnken and the CCF designs estimate the mean value of the calculation well, while the other two methods overestimate. For the case of minimum and maximum values, both of the methodologies made a similar prediction error, as in the previous examination.
3. Conclusions
FEM-based tolerance analysis of an electrical machine is a computationally expensive problem. A high number of designs should be performed to discover the full factorial design space, and the sensitivity of the resulting value from the discretization errors can significantly impact the results. In this paper, a BLDC machine was examined. The correctness of the model was validated by the measured data of the back-EMF calculation. Then, the sensitivity of the cogging torque from the mesh selection was examined, and the tolerance analysis was made with five parameters. The selected mesh accuracy was around 2%, while the tolerances can increase the mean value of the resulting cogging torque by more than 5%. The central composite design made the most accurate calculation on the selected design. The Box-Behnken methodology predicted the resulting mean value of the cogging torque well. This methodology made more than 10% error in the prediction of the minimal and maximal cogging torque value. The results show that these methodologies can significantly accelerate the tolerance analysis of the cogging torque. However, reducing the computational demand can lead to information loss and inaccurate prediction of the mean value or the minimum or maximum values of the examined quantities. In our case, the central composite design made the best prediction, but it should be investigated in the future how the design of these experiment methodologies work on different types of electrical machines. The proposed model and the methodologies implemented into the digital-twin-distiller, the presented calculations source code, or the working REST-api, can be accessed in the projects homepage.
Author Contributions
Conceptualization, T.O.; methodology, T.O. and K.G., M.K.; software, T.O. and K.G.; validation, K.G., M.K.—original draft preparation, T.O.; writing—review and editing, T.O.; visualization, K.G.; supervision, T.O.; project administration, A.R.; funding acquisition, A.R., T.O. All authors have read and agreed to the published version of the manuscript.
Funding
This research work by Prof Anton Rassõlkin has been supported by the Estonian Research Council under grant PSG453 “Digital twin for propulsion drive of autonomous electric vehicle”.
Informed Consent Statement
Not applicable.
Data Availability Statement
Not applicable.
Conflicts of Interest
The authors declare no conflict of interest.
References
- Bramerdorfer, G.; Lanser, S.; Amrhein, W. Multi-Harmonic Design and Optimization of PMSMs. In Proceedings of the 2019 IEEE Energy Conversion Congress and Exposition (ECCE), Baltimore, MD, USA, 29 September–3 October 2019; pp. 7049–7056. [Google Scholar]
- Orosz, T.; Rassõlkin, A.; Kallaste, A.; Arsénio, P.; Pánek, D.; Kaska, J.; Karban, P. Robust Design Optimization and Emerging Technologies for Electrical Machines: Challenges and Open Problems. Appl. Sci. 2020, 10, 6653. [Google Scholar] [CrossRef]
- Deb, K.; Pratap, A.; Agarwal, S.; Meyarivan, T. A fast and elitist multiobjective genetic algorithm: NSGA-II. IEEE Trans. Evol. Comput. 2002, 6, 182–197. [Google Scholar] [CrossRef] [Green Version]
- Zitzler, E.; Laumanns, M.; Thiele, L. SPEA2: Improving the strength Pareto evolutionary algorithm. TIK-Report 2001, 103. [Google Scholar] [CrossRef]
- De León-Aldaco, S.E.; Calleja, H.; Alquicira, J.A. Metaheuristic optimization methods applied to power converters: A review. IEEE Trans. Power Electron. 2015, 30, 6791–6803. [Google Scholar] [CrossRef]
- Coello, C.C.; Lechuga, M.S. MOPSO: A proposal for multiple objective particle swarm optimization. In Proceedings of the 2002 Congress on Evolutionary Computation (CEC’02) (Cat. No. 02TH8600), Honolulu, HI, USA, 12–17 May 2002; Volume 2, pp. 1051–1056. [Google Scholar]
- Tenne, Y.; Goh, C.K. Computational Intelligence in Expensive Optimization Problems; Springer Science & Business Media: Berlin, Germany, 2010; Volume 2. [Google Scholar]
- Darwish, A. Bio-inspired computing: Algorithms review, deep analysis, and the scope of applications. Future Comput. Inform. J. 2018, 3, 231–246. [Google Scholar] [CrossRef]
- Sizov, G.Y.; Ionel, D.M.; Demerdash, N.A.O. A review of efficient FE modeling techniques with applications to PM AC machines. In Proceedings of the 2011 IEEE Power and Energy Society General Meeting, Detroit, MI, USA, 24–28 July 2011; pp. 1–6. [Google Scholar] [CrossRef]
- Yilmaz, M.; Krein, P.T. Capabilities of finite element analysis and magnetic equivalent circuits for electrical machine analysis and design. In Proceedings of the 2008 IEEE Power Electronics Specialists Conference, Rhodes, Greece, 15–19 June 2008; pp. 4027–4033. [Google Scholar]
- Lei, G.; Zhu, J.; Guo, Y. Multidisciplinary Design Optimization Methods for Electrical Machines and Drive Systems; Springer: Berlin/Heidelberg, Germany, 2016. [Google Scholar]
- Bramerdorfer, G.; Zǎvoianu, A.C. Surrogate-Based Multi-Objective Optimization of Electrical Machine Designs Facilitating Tolerance Analysis. IEEE Trans. Magn. 2017, 53, 1–11. [Google Scholar] [CrossRef]
- Goetz, S.; Roth, M.; Schleich, B. Early Robust Design—Its Effect on Parameter and Tolerance Optimization. Appl. Sci. 2021, 11, 9407. [Google Scholar] [CrossRef]
- Taguchi, G. System of Experimental Design, Vols. 1 and 2; UNIPUB/Krauss International: White Plains, NY, USA, 1987. [Google Scholar]
- Matthiassen, B. Design for Robustness and Reliability: Improving the Quality Consciousness in Engineering Design; Department of Control and Engineering Design, DTU: Lyngby, Denmark, 1997. [Google Scholar]
- Melvin, J.W.; Deo, H.V. Axiomatically designed robustness. In Proceedings of the American Supplier Institute 19th Annual Taguchi Methods Symposium, Cambridge, MA, USA, 2002. [Google Scholar]
- Suh, N.P. Axiomatic Design: Advances and Applications; Oxford University Press: New York, NY, USA, 2001. [Google Scholar]
- Salimi, A.; Lowther, D.A. On the role of robustness in multi-objective robust optimization: Application to an IPM motor design problem. IEEE Trans. Magn. 2015, 52, 8102304. [Google Scholar] [CrossRef]
- Guimarães, F.G.; Lowther, D.A.; Ramírez, J.A. Multiobjective approaches for robust electromagnetic design. IEEE Trans. Magn. 2006, 42, 1207–1210. [Google Scholar] [CrossRef]
- Yoon, S.B.; Jung, I.S.; Hyun, D.S.; Hong, J.P.; Kim, Y.J. Robust shape optimization of electromechanical devices. IEEE Trans. Magn. 1999, 35, 1710–1713. [Google Scholar] [CrossRef]
- Ren, Z.; Pham, M.T.; Koh, C.S. Robust global optimization of electromagnetic devices with uncertain design parameters: Comparison of the worst case optimization methods and multiobjective optimization approach using gradient index. IEEE Trans. Magn. 2012, 49, 851–859. [Google Scholar] [CrossRef]
- Mirjalili, S.; Lewis, A.; Dong, J.S. Confidence-based robust optimisation using multi-objective meta-heuristics. Swarm Evol. Comput. 2018, 43, 109–126. [Google Scholar] [CrossRef] [Green Version]
- Di Barba, P.; Mognaschi, M.E.; Lowther, D.A.; Sykulski, J.K. A benchmark TEAM problem for multi-objective Pareto optimization of electromagnetic devices. IEEE Trans. Magn. 2018, 54, 1–4. [Google Scholar] [CrossRef] [Green Version]
- Di Barba, P.; Mognaschi, M.E.; Lozito, G.M.; Salvini, A.; Dughiero, F.; Sieni, I. The benchmark TEAM problem for multi-objective optimization solved with CFSO. In Proceedings of the 2018 IEEE 4th International Forum on Research and Technology for Society and Industry (RTSI), Palermo, Italy, 10–13 September 2018; pp. 1–5. [Google Scholar]
- Karban, P.; Pánek, D.; Orosz, T.; Petrášová, I.; Doležel, I. FEM based robust design optimization with Agros and Ārtap. Comput. Math. Appl. 2020, 81, 618–633. [Google Scholar] [CrossRef]
- Gadó, K.; Orosz, T. Robust and Multi-Objective Pareto Design of a Solenoid. Electronics 2021, 10, 2139. [Google Scholar] [CrossRef]
- Bramerdorfer, G. Computationally efficient tolerance analysis of the cogging torque of brushless PMSMs. IEEE Trans. Ind. Appl. 2017, 53, 3387–3393. [Google Scholar] [CrossRef]
- Bramerdorfer, G. Tolerance analysis for electric machine design optimization: Classification, modeling and evaluation, and example. IEEE Trans. Magn. 2019, 55, 1–9. [Google Scholar] [CrossRef]
- Grieves, M.; Vickers, J. Digital Twin: Mitigating Unpredictable, Undesirable Emergent Behavior in Complex Systems (Excerpt). In Transdisciplinary Perspectives on Complex Systems; Springer International Publishing: New York, NY, USA, 2016; Volume 23, pp. 889–896. [Google Scholar] [CrossRef]
- Rassõlkin, A.; Vaimann, T.; Kallaste, A.; Kuts, V. Digital twin for propulsion drive of autonomous electric vehicle. In Proceedings of the 60th International Scientific Conference on Power and Electrical Engineering of Riga Technical University (RTUCON), Riga, Latvia, 7–9 October 2019. [Google Scholar]
- Rassolkin, A.; Orosz, T.; Demidova, G.L.; Kuts, V.; Rjabtšikov, V.; Vaimann, T.; Kallaste, A. Implementation of Digital Twins for electrical energy conversion systems in selected case studies. Proc. Est. Acad. Sci. 2021, 70, 19–40. [Google Scholar]
- Meeker, D. Finite element method magnetics. FEMM 2010, 4, 162. [Google Scholar]
- Kiss, G.M.; Kaska, J.; de Oliveira, R.A.H.; Rubanenko, O.; Tóth, B. Performance Analysis of FEM Solvers on Practical Electromagnetic Problems. arXiv 2020, arXiv:2009.04399. [Google Scholar] [CrossRef]
- Karban, P.; Mach, F.; Kůs, P.; Pánek, D.; Doležel, I. Numerical solution of coupled problems using code Agros2D. Computing 2013, 95, 381–408. [Google Scholar] [CrossRef]
- Kacker, R.N.; Lagergren, E.S.; Filliben, J.J. Taguchi’s orthogonal arrays are classical designs of experiments. J. Res. Natl. Inst. Stand. Technol. 1991, 96, 577. [Google Scholar] [CrossRef] [PubMed]
- Cimbala, J.M. Taguchi Orthogonal Arrays; Pennsylvania State University: State College, PA, USA, 2014. [Google Scholar]
- Giunta, A.; Wojtkiewicz, S.; Eldred, M. Overview of modern design of experiments methods for computational simulations. In Proceedings of the 41st Aerospace Sciences Meeting and Exhibit, Reno, NV, USA, 6–9 January 2003; p. 649. [Google Scholar]
- Pánek, D.; Orosz, T.; Karban, P. Artap: Robust design optimization framework for engineering applications. In Proceedings of the 2019 Third International Conference on Intelligent Computing in Data Sciences (ICDS), Marrakech, Morocco, 28–30 October 2019; Volume 4. [Google Scholar]
- Kuczmann, M.; Szücs, A.; Kovács, G. Transformer Model Identification by Ārtap. Period. Polytech. Electr. Eng. Comput. Sci. 2021, 65, 123–130. [Google Scholar] [CrossRef]
- Ghoshal, D.; Bianchi, L.; Essiari, A.; Beach, M.; Paine, D.; Ramakrishnan, L. Science Capsule-Capturing the Data Life Cycle. J. Open Source Softw. 2021, 6, 2484. [Google Scholar] [CrossRef]
- Brinckman, A.; Chard, K.; Gaffney, N.; Hategan, M.; Jones, M.B.; Kowalik, K.; Kulasekaran, S.; Ludäscher, B.; Mecum, B.D.; Nabrzyski, J.; et al. Computing environments for reproducibility: Capturing the “Whole Tale”. Future Gener. Comput. Syst. 2019, 94, 854–867. [Google Scholar] [CrossRef]
- Lu, C.; Ferrari, S.; Pellegrino, G. Two design procedures for PM synchronous machines for electric powertrains. IEEE Trans. Transp. Electrif. 2016, 3, 98–107. [Google Scholar] [CrossRef] [Green Version]
- Lehikoinen, A.; Davidsson, T.; Arkkio, A.; Belahcen, A. A high-performance open-source finite element analysis library for magnetics in MATLAB. In Proceedings of the 2018 XIII International Conference on Electrical Machines (ICEM), Alexandroupoli, Greece, 3–6 September 2018; pp. 486–492. [Google Scholar]
- Emetor Software. Available online: https://www.emetor.com (accessed on 20 October 2021).
- Kuptsov, V.; Fajri, P.; Trzynadlowski, A.; Zhang, G.; Magdaleno-Adame, S. Electromagnetic Analysis and Design Methodology for Permanent Magnet Motors Using MotorAnalysis-PM Software. Machines 2019, 7, 75. [Google Scholar] [CrossRef] [Green Version]
- Bonneel, P.; Le Besnerais, J.; Pile, R.; Devillers, E. Pyleecan: An open-source Python object-oriented software for the multiphysic design optimization of electrical machines. In Proceedings of the 2018 XIII International Conference on Electrical Machines (ICEM), Alexandroupoli, Greece, 3–6 September 2018; pp. 948–954. [Google Scholar]
- Andriushchenko, E.; Kallaste, A.; Belahcen, A.; Vaimann, T.; Rassõlkin, A.; Heidari, H.; Tiismus, H. Optimization of a 3d-printed permanent magnet coupling using genetic algorithm and taguchi method. Electronics 2021, 10, 494. [Google Scholar] [CrossRef]
- Soo-Gyung, L.; Kim, S.; Min-Ro, P.; Lee, T.H.; Jung-Pyo, H. Sensitivity Analysis for Robust Performance of Electrical Machines Affected by Manufacturing Tolerance. In IET Conference Proceedings; The Institution of Engineering & Technology: Edinburgh, UK, 2019. [Google Scholar]
- Sorgdrager, A.; Wang, R.J.; Grobler, A. Taguchi method in electrical machine design. SAIEE Afr. Res. J. 2017, 108, 150–164. [Google Scholar] [CrossRef] [Green Version]
- Giunta, A.; Watson, L. A comparison of approximation modeling techniques-Polynomial versus interpolating models. In Proceedings of the 7th AIAA/USAF/NASA/ISSMO Symposium on Multidisciplinary Analysis and Optimization, St. Louis, MO, USA, 2–4 September 1998; p. 4758. [Google Scholar]
- Ma, B.; Lei, G.; Zhu, J.; Guo, Y.; Liu, C. Application-oriented robust design optimization method for batch production of permanent-magnet motors. IEEE Trans. Ind. Electron. 2017, 65, 1728–1739. [Google Scholar] [CrossRef]
- Antunes, O.; Bastos, J.; Sadowski, N. Using high-order finite elements in problems with movement. IEEE Trans. Magn. 2004, 40, 529–532. [Google Scholar] [CrossRef]
- Sliding Band Boundary Condition Example. Available online: https://www.femm.info/wiki/RotorMotion (accessed on 20 October 2021).
- Antunes, O.; Bastos, J.; Sadowski, N.; Razek, A.; Santandrea, L.; Bouillault, F.; Rapetti, F. Comparison between nonconforming movement methods. IEEE Trans. Magn. 2006, 42, 599–602. [Google Scholar] [CrossRef]
Figure 1.
The tolerance on the required function parameter () can be increased if a linear material property (M2) is changed by another one (M1).
Figure 1.
The tolerance on the required function parameter () can be increased if a linear material property (M2) is changed by another one (M1).

Figure 2.
Automatic tolerance analysis with the enclosed parametric FEM in digital-twin-distiller (, ).
Figure 2.
Automatic tolerance analysis with the enclosed parametric FEM in digital-twin-distiller (, ).

Figure 3.
Deployment of the containerized parametric FEM calculation using a DT as a standardized REST-API.
Figure 3.
Deployment of the containerized parametric FEM calculation using a DT as a standardized REST-API.

Figure 4.
Illustration of the sampling points in the used design of experiment methodologies in the case of a three level, three parameter design.
Figure 4.
Illustration of the sampling points in the used design of experiment methodologies in the case of a three level, three parameter design.

Figure 5.
The geometry of the analyzed BLDC machine, which is built from the colored segments of the machines via the Digital-Twin-Designer. The right side of the image shows the parameterization of these different elements.
Figure 5.
The geometry of the analyzed BLDC machine, which is built from the colored segments of the machines via the Digital-Twin-Designer. The right side of the image shows the parameterization of these different elements.


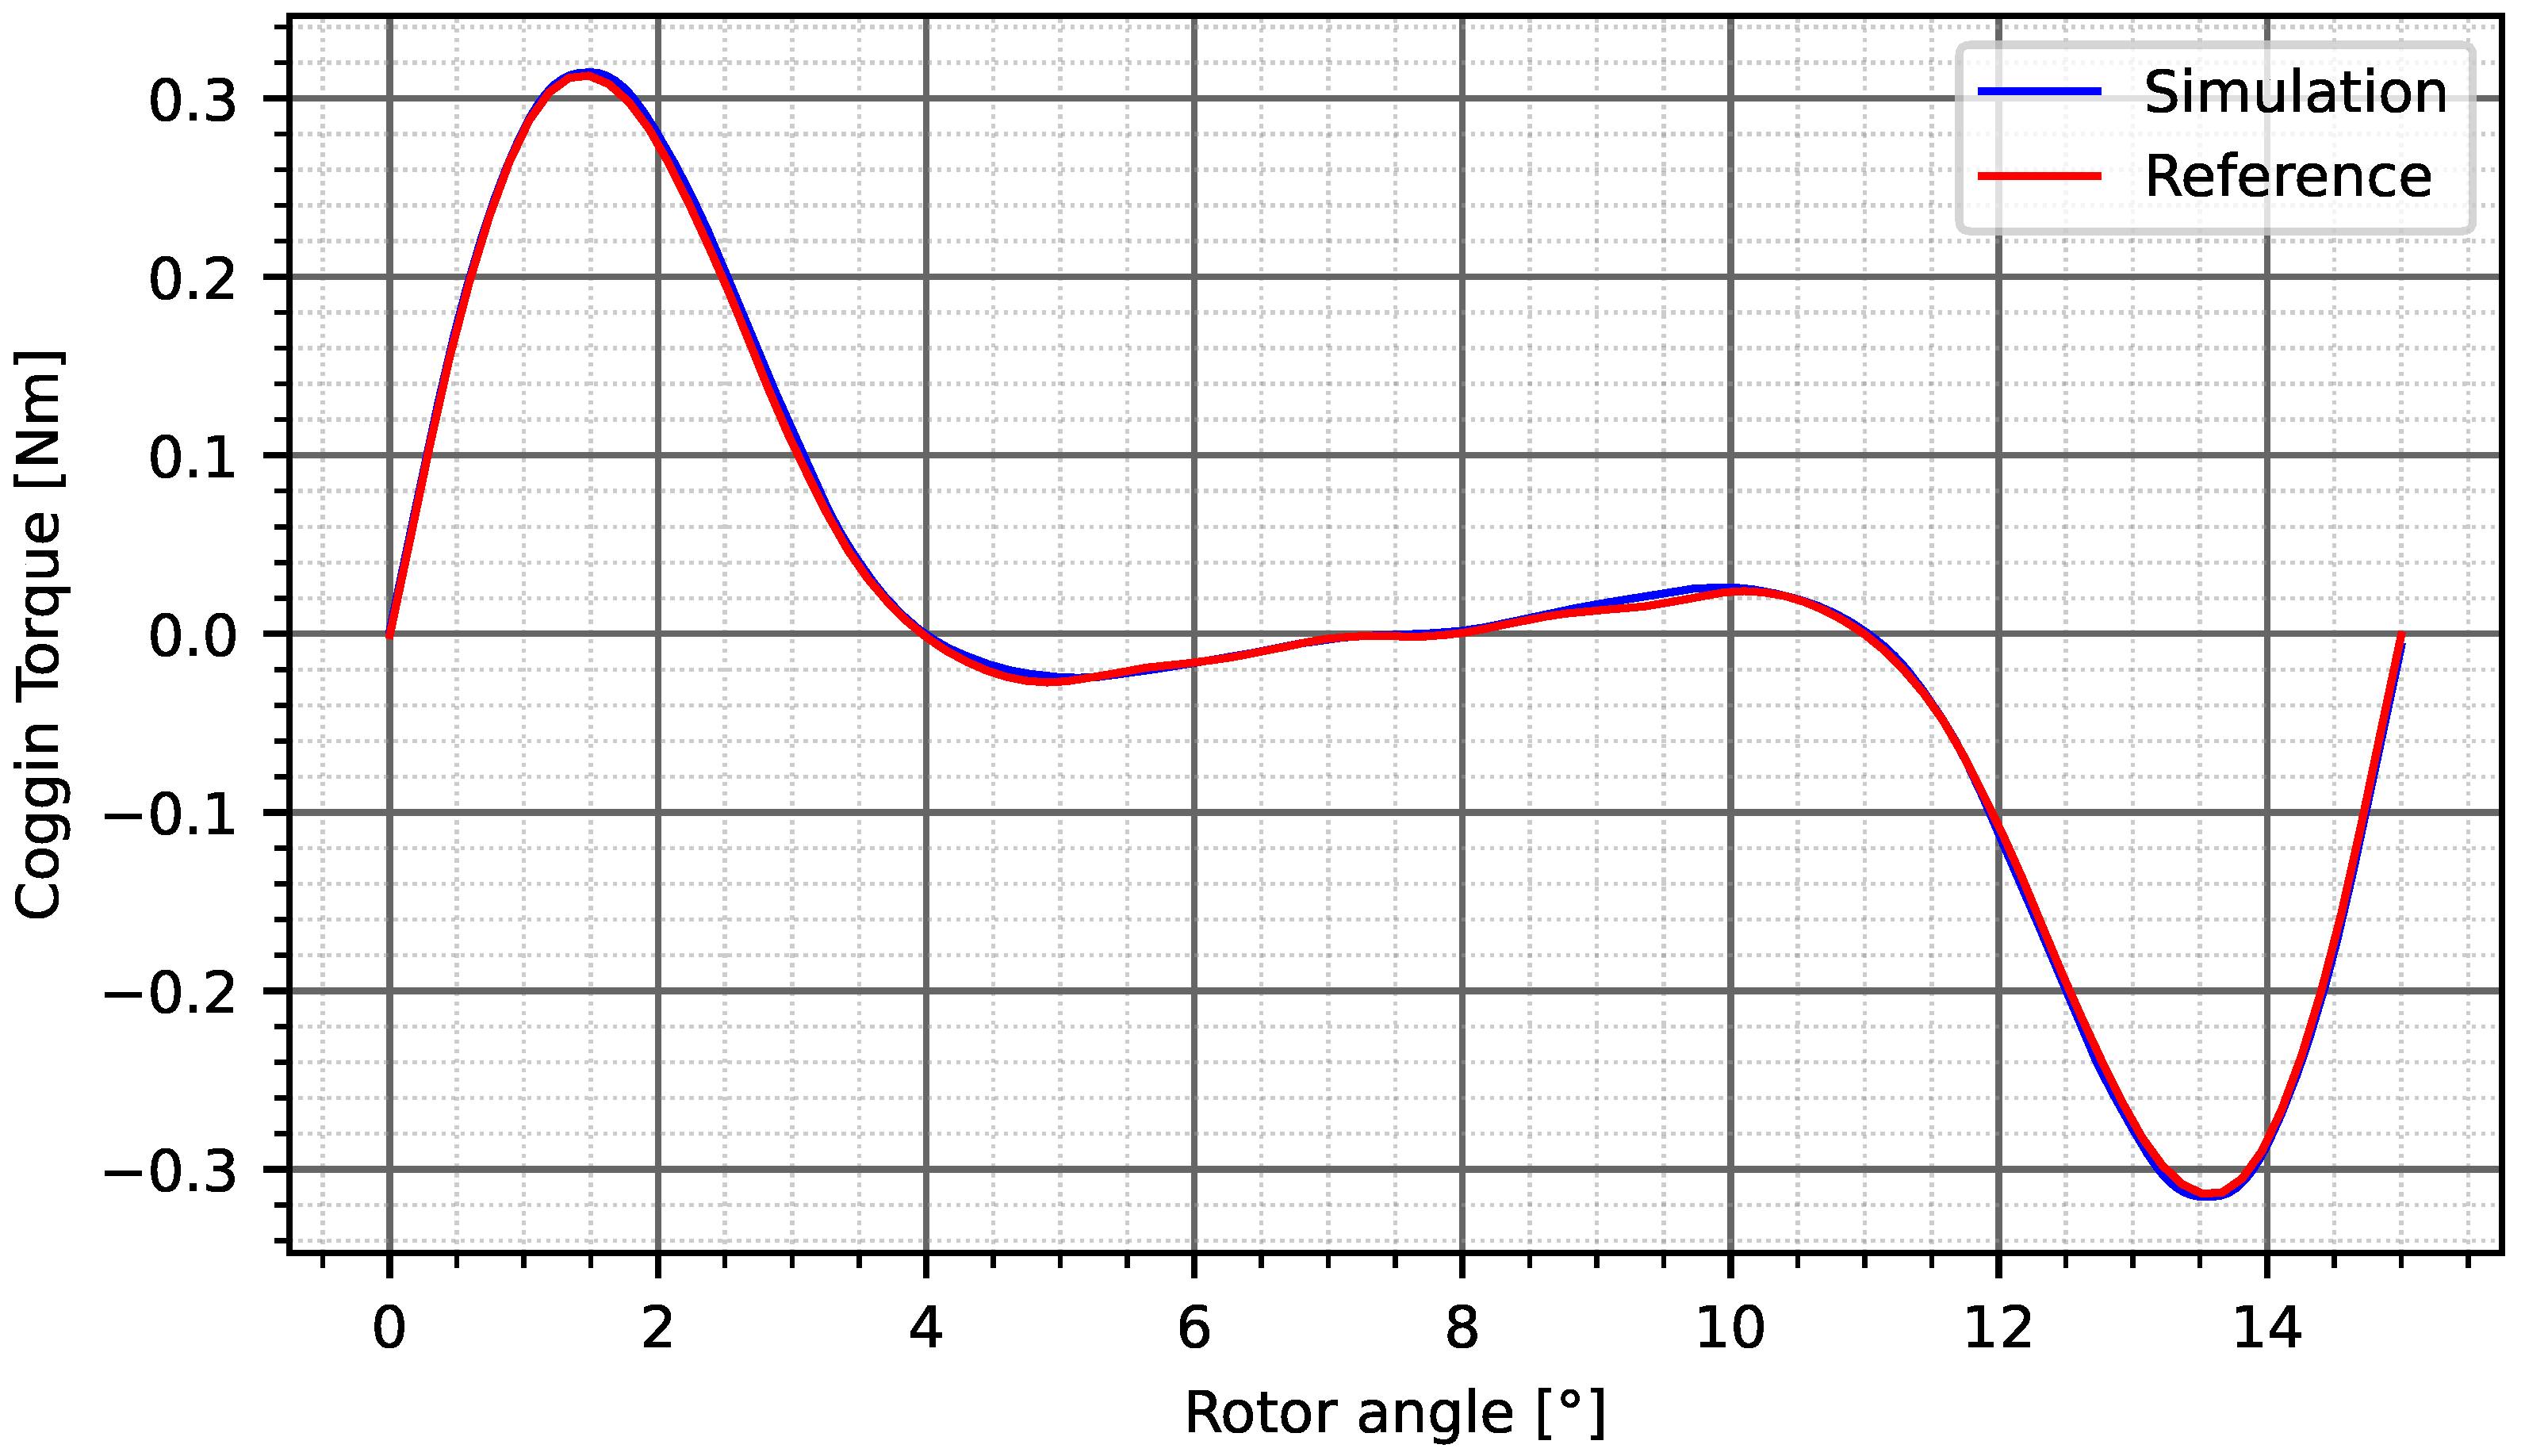
Figure 7.
Comparison of the simulated and the reference cogging torque.

Figure 8.
An example configuration for the mesh selectivity analysis. The mesh size is set to mm on the rotor_steel, airgap, magnet regions.
Figure 8.
An example configuration for the mesh selectivity analysis. The mesh size is set to mm on the rotor_steel, airgap, magnet regions.

Figure 9.
Cogging torque in relation to different mesh settings. The labels show the total number of elements in a particular configuration. In magenta, the smart mesh option was turned on.
Figure 9.
Cogging torque in relation to different mesh settings. The labels show the total number of elements in a particular configuration. In magenta, the smart mesh option was turned on.

Figure 10.
The peak cogging torque in relation to the number of elements. (a) The peak cogging torque in each simulation, (b) the distribution of the results.
Figure 10.
The peak cogging torque in relation to the number of elements. (a) The peak cogging torque in each simulation, (b) the distribution of the results.

Figure 11.
The root mean square torque in relation to the number of elements. (a) The RMS torque in each simulation, (b) the distribution of the results.
Figure 11.
The root mean square torque in relation to the number of elements. (a) The RMS torque in each simulation, (b) the distribution of the results.

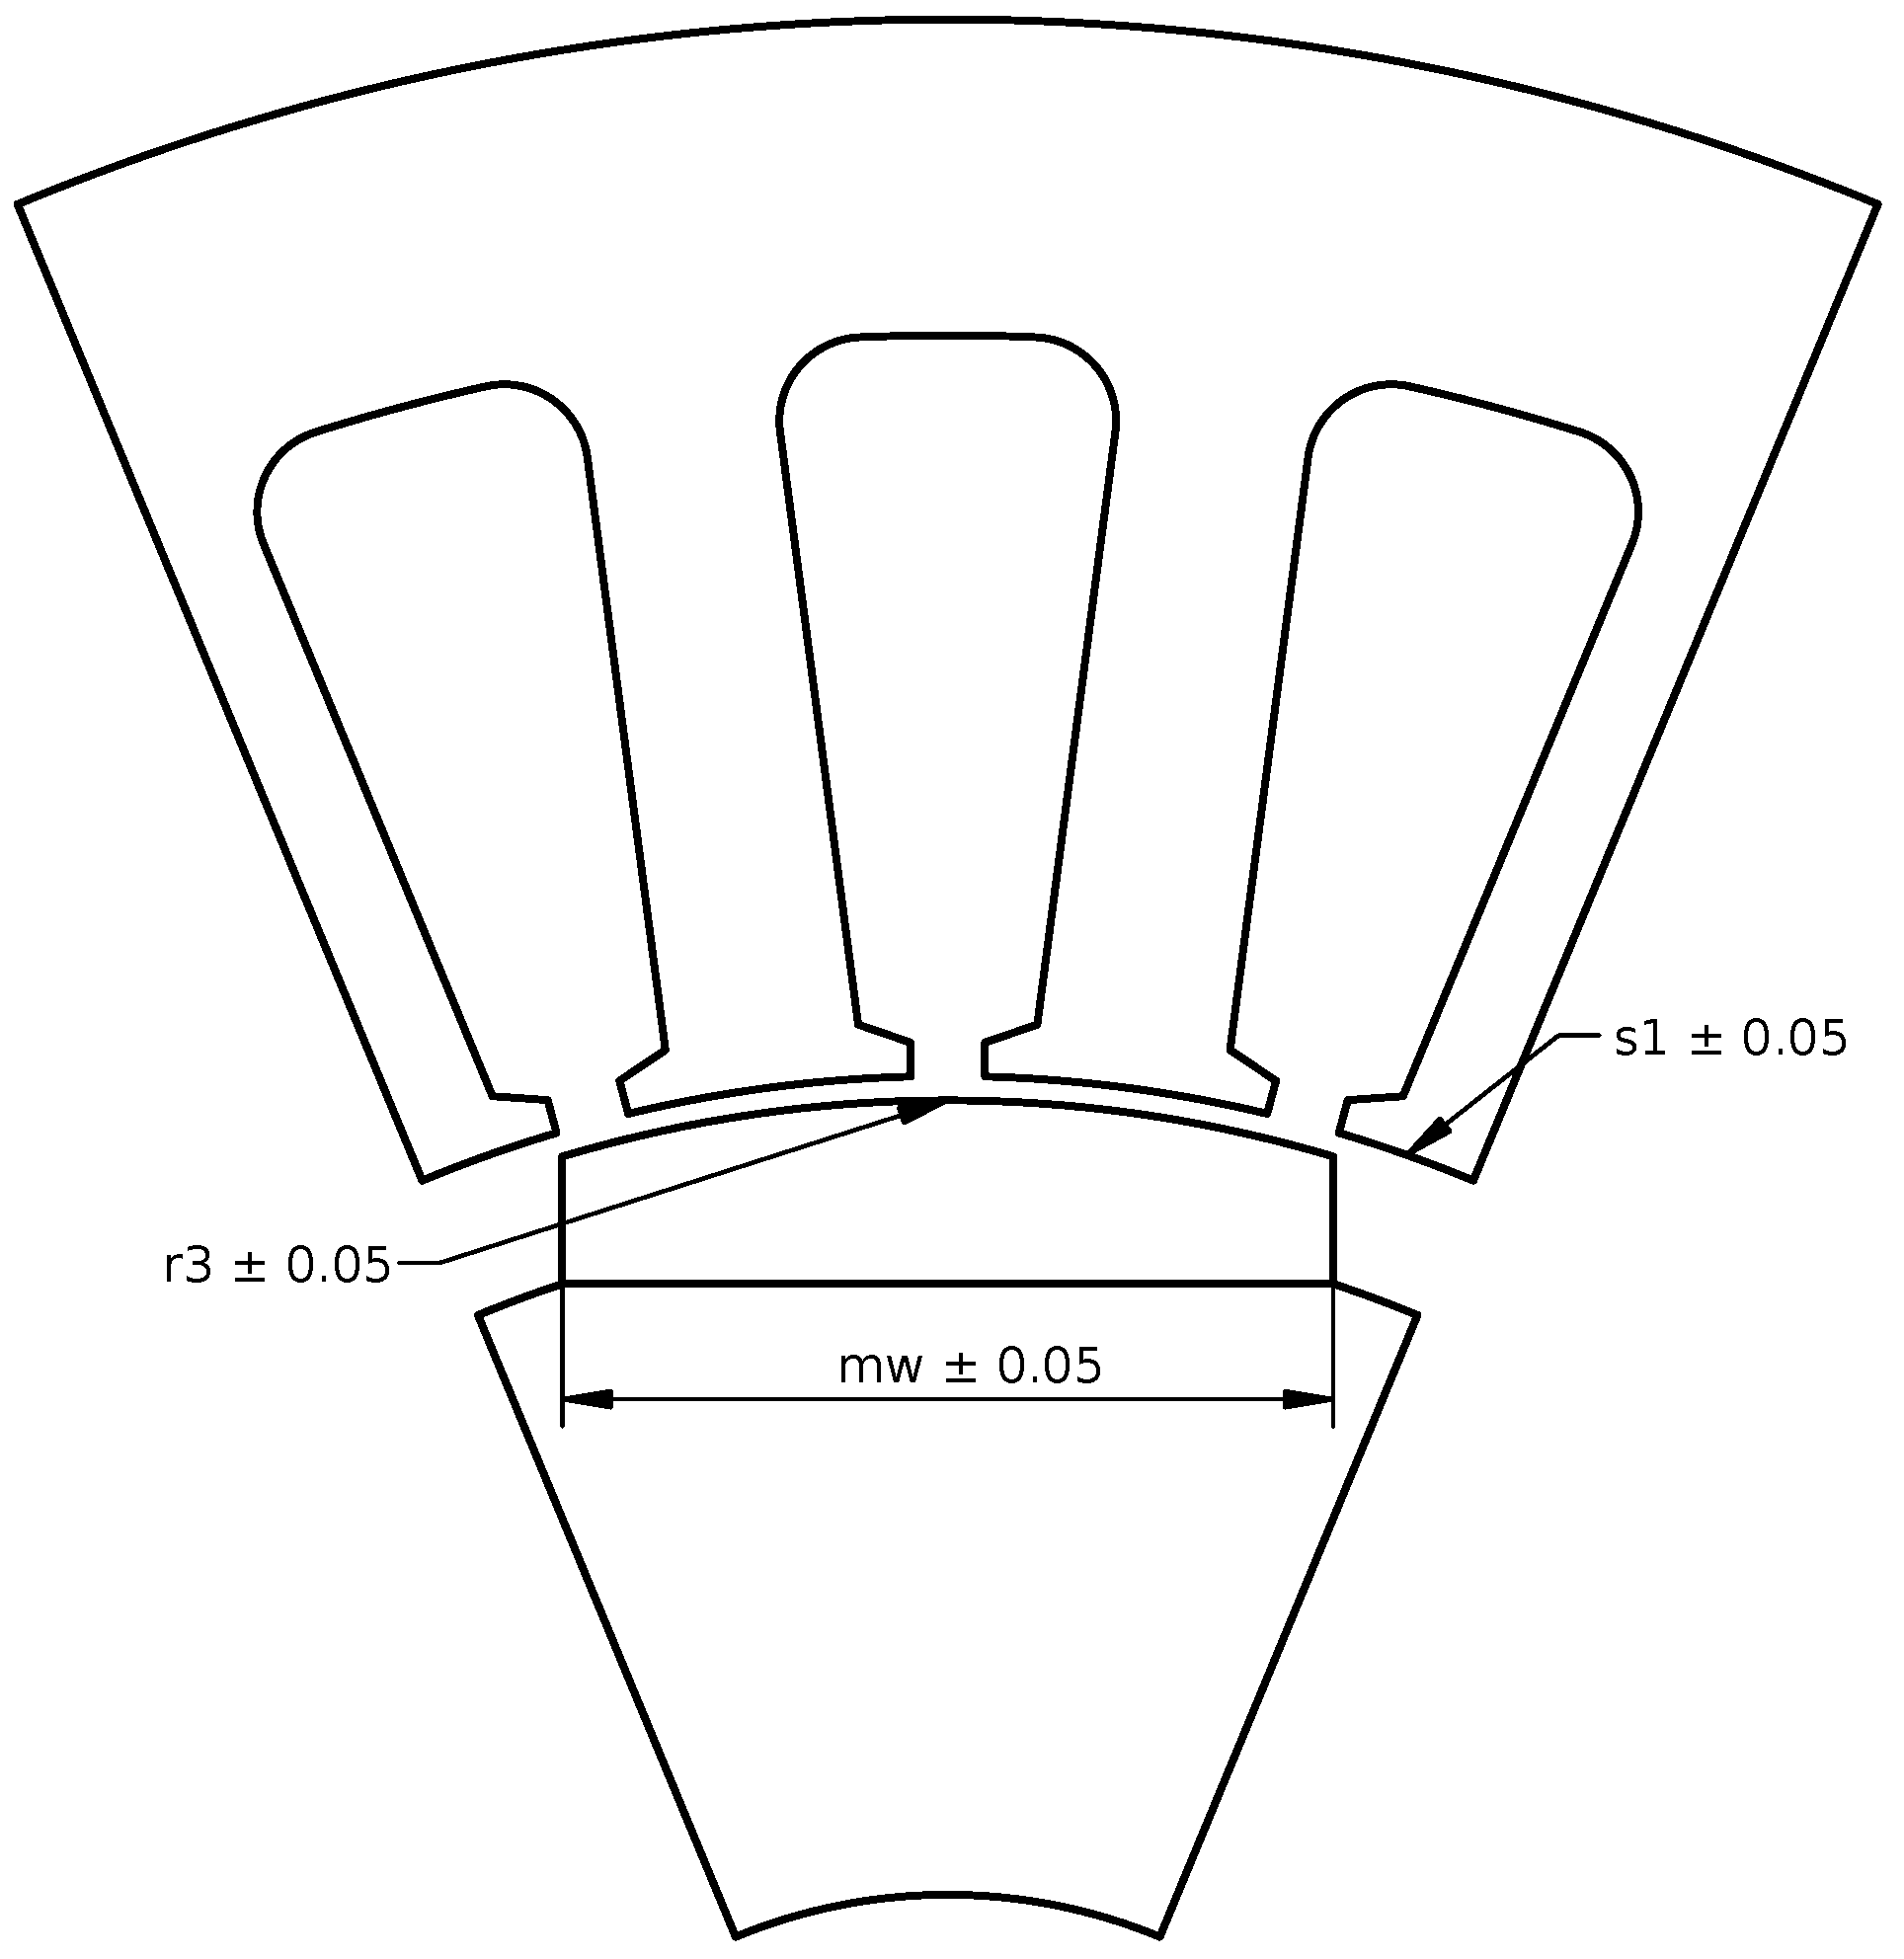
Figure 12.
The geometrical parameters, which tolerances were considered during the analysis.

Figure 13.
The mean value of the calculated cogging torque and its tolerances with different DoE strategies: Full-facorial designs represented by the gray zone and its results compared by Box-Behnken design (a), Plackett-Burman (b), CCF (c) and Taguchi design (d).
Figure 13.
The mean value of the calculated cogging torque and its tolerances with different DoE strategies: Full-facorial designs represented by the gray zone and its results compared by Box-Behnken design (a), Plackett-Burman (b), CCF (c) and Taguchi design (d).

Figure 14.
The distribution of the peak value of the cogging torque with the different Doe strategies: Box-Behnken (a), Plackett-Burman (b), CCF (c), and Taguchi (d), which were compared with the Full-factorial design.
Figure 14.
The distribution of the peak value of the cogging torque with the different Doe strategies: Box-Behnken (a), Plackett-Burman (b), CCF (c), and Taguchi (d), which were compared with the Full-factorial design.

Figure 15.
The distribution of the calculated rms value of the cogging torque with the different Doe strategies: Box-Behnken (a), Plackett-Burman (b), CCF (c), and Taguchi (d), which were compared with the Full-factorial design.
Figure 15.
The distribution of the calculated rms value of the cogging torque with the different Doe strategies: Box-Behnken (a), Plackett-Burman (b), CCF (c), and Taguchi (d), which were compared with the Full-factorial design.

| Parameter | Dimension | Value |
|---|---|---|
| Axial Length | mm | 50 |
| Rotor Inner Diameter | mm | 22.8 |
| Rotor Iron Outer Diameter | mm | 50.5 |
| Rotor Outer Diameter | mm | 55.1 |
| Magnet Width | mm | 15.9 |
| Air Gap Length | mm | 0.7 |
| Angle Spanned by Tooth | deg | 11.9 |
| Tooth width | mm | 4 |
| Tooth Root diameter | mm | 86.6 |
| Stator Outer Diameter | mm | 100 |
| Turns/Slot | - | 46 |
| Winding Wire | - | 4X20AWG copper wire |
| Magnet Material | - | Sm2Co17 24MGOe |
| Stator Material | - | 24 Gauge M19 NGO Steel @ 98% fill |
| Rotor Material | - | 1018 steel |
Table 2.
The varied parameters during the tolerance analysis with their mean values and the applied tolerances.
Table 2.
The varied parameters during the tolerance analysis with their mean values and the applied tolerances.
| Parameter | Dimension | Mean Value | Tolerance |
|---|---|---|---|
| Airgap | [mm] | 0.7 | 0.05 |
| Magnet height | [mm] | 3.577 | 0.05 |
| Magnet width | [mm] | 15.8566 | 0.05 |
| [kA/m] | 724 | 5 | |
| [-] | 1.11 | 0.05 |
Table 3.
The resulting mean value and the standard deviation of the peak to peak () and rms cogging torque after the different Design of Experiment Calculations.
Table 3.
The resulting mean value and the standard deviation of the peak to peak () and rms cogging torque after the different Design of Experiment Calculations.
| Design Methodology | ||||
|---|---|---|---|---|
| Mean | std | Mean | std | |
| Single Design | 0.57 | 0.015 | 0.136 | 0.05 |
| Full-Factorial | 0.603 | 0.077 | 0.145 | 0.019 |
| Box-Behnken | 0.6 | 0.054 | 0.144 | 0.013 |
| Plackett-Burman | 0.618 | 0.118 | 0.149 | 0.029 |
| Central-Composite | 0.606 | 0.09 | 0.145 | 0.022 |
| Taguchi | 0.642 | 0.055 | 0.154 | 0.013 |
Publisher’s Note: MDPI stays neutral with regard to jurisdictional claims in published maps and institutional affiliations. |
© 2021 by the authors. Licensee MDPI, Basel, Switzerland. This article is an open access article distributed under the terms and conditions of the Creative Commons Attribution (CC BY) license (https://creativecommons.org/licenses/by/4.0/).
Share and Cite
MDPI and ACS Style
Orosz, T.; Gadó, K.; Katona, M.; Rassõlkin, A. Automatic Tolerance Analysis of Permanent Magnet Machines with Encapsuled FEM Models Using Digital-Twin-Distiller. Processes 2021, 9, 2077. https://0-doi-org.brum.beds.ac.uk/10.3390/pr9112077
AMA Style
Orosz T, Gadó K, Katona M, Rassõlkin A. Automatic Tolerance Analysis of Permanent Magnet Machines with Encapsuled FEM Models Using Digital-Twin-Distiller. Processes. 2021; 9(11):2077. https://0-doi-org.brum.beds.ac.uk/10.3390/pr9112077
Chicago/Turabian StyleOrosz, Tamás, Krisztián Gadó, Mihály Katona, and Anton Rassõlkin. 2021. "Automatic Tolerance Analysis of Permanent Magnet Machines with Encapsuled FEM Models Using Digital-Twin-Distiller" Processes 9, no. 11: 2077. https://0-doi-org.brum.beds.ac.uk/10.3390/pr9112077
Note that from the first issue of 2016, this journal uses article numbers instead of page numbers. See further details here.