
Development of a General PAT Strategy for Online Monitoring of Complex Mixtures—On the Example of Natural Product Extracts from Bearberry Leaf (Arctostaphylos uva-ursi)

Abstract
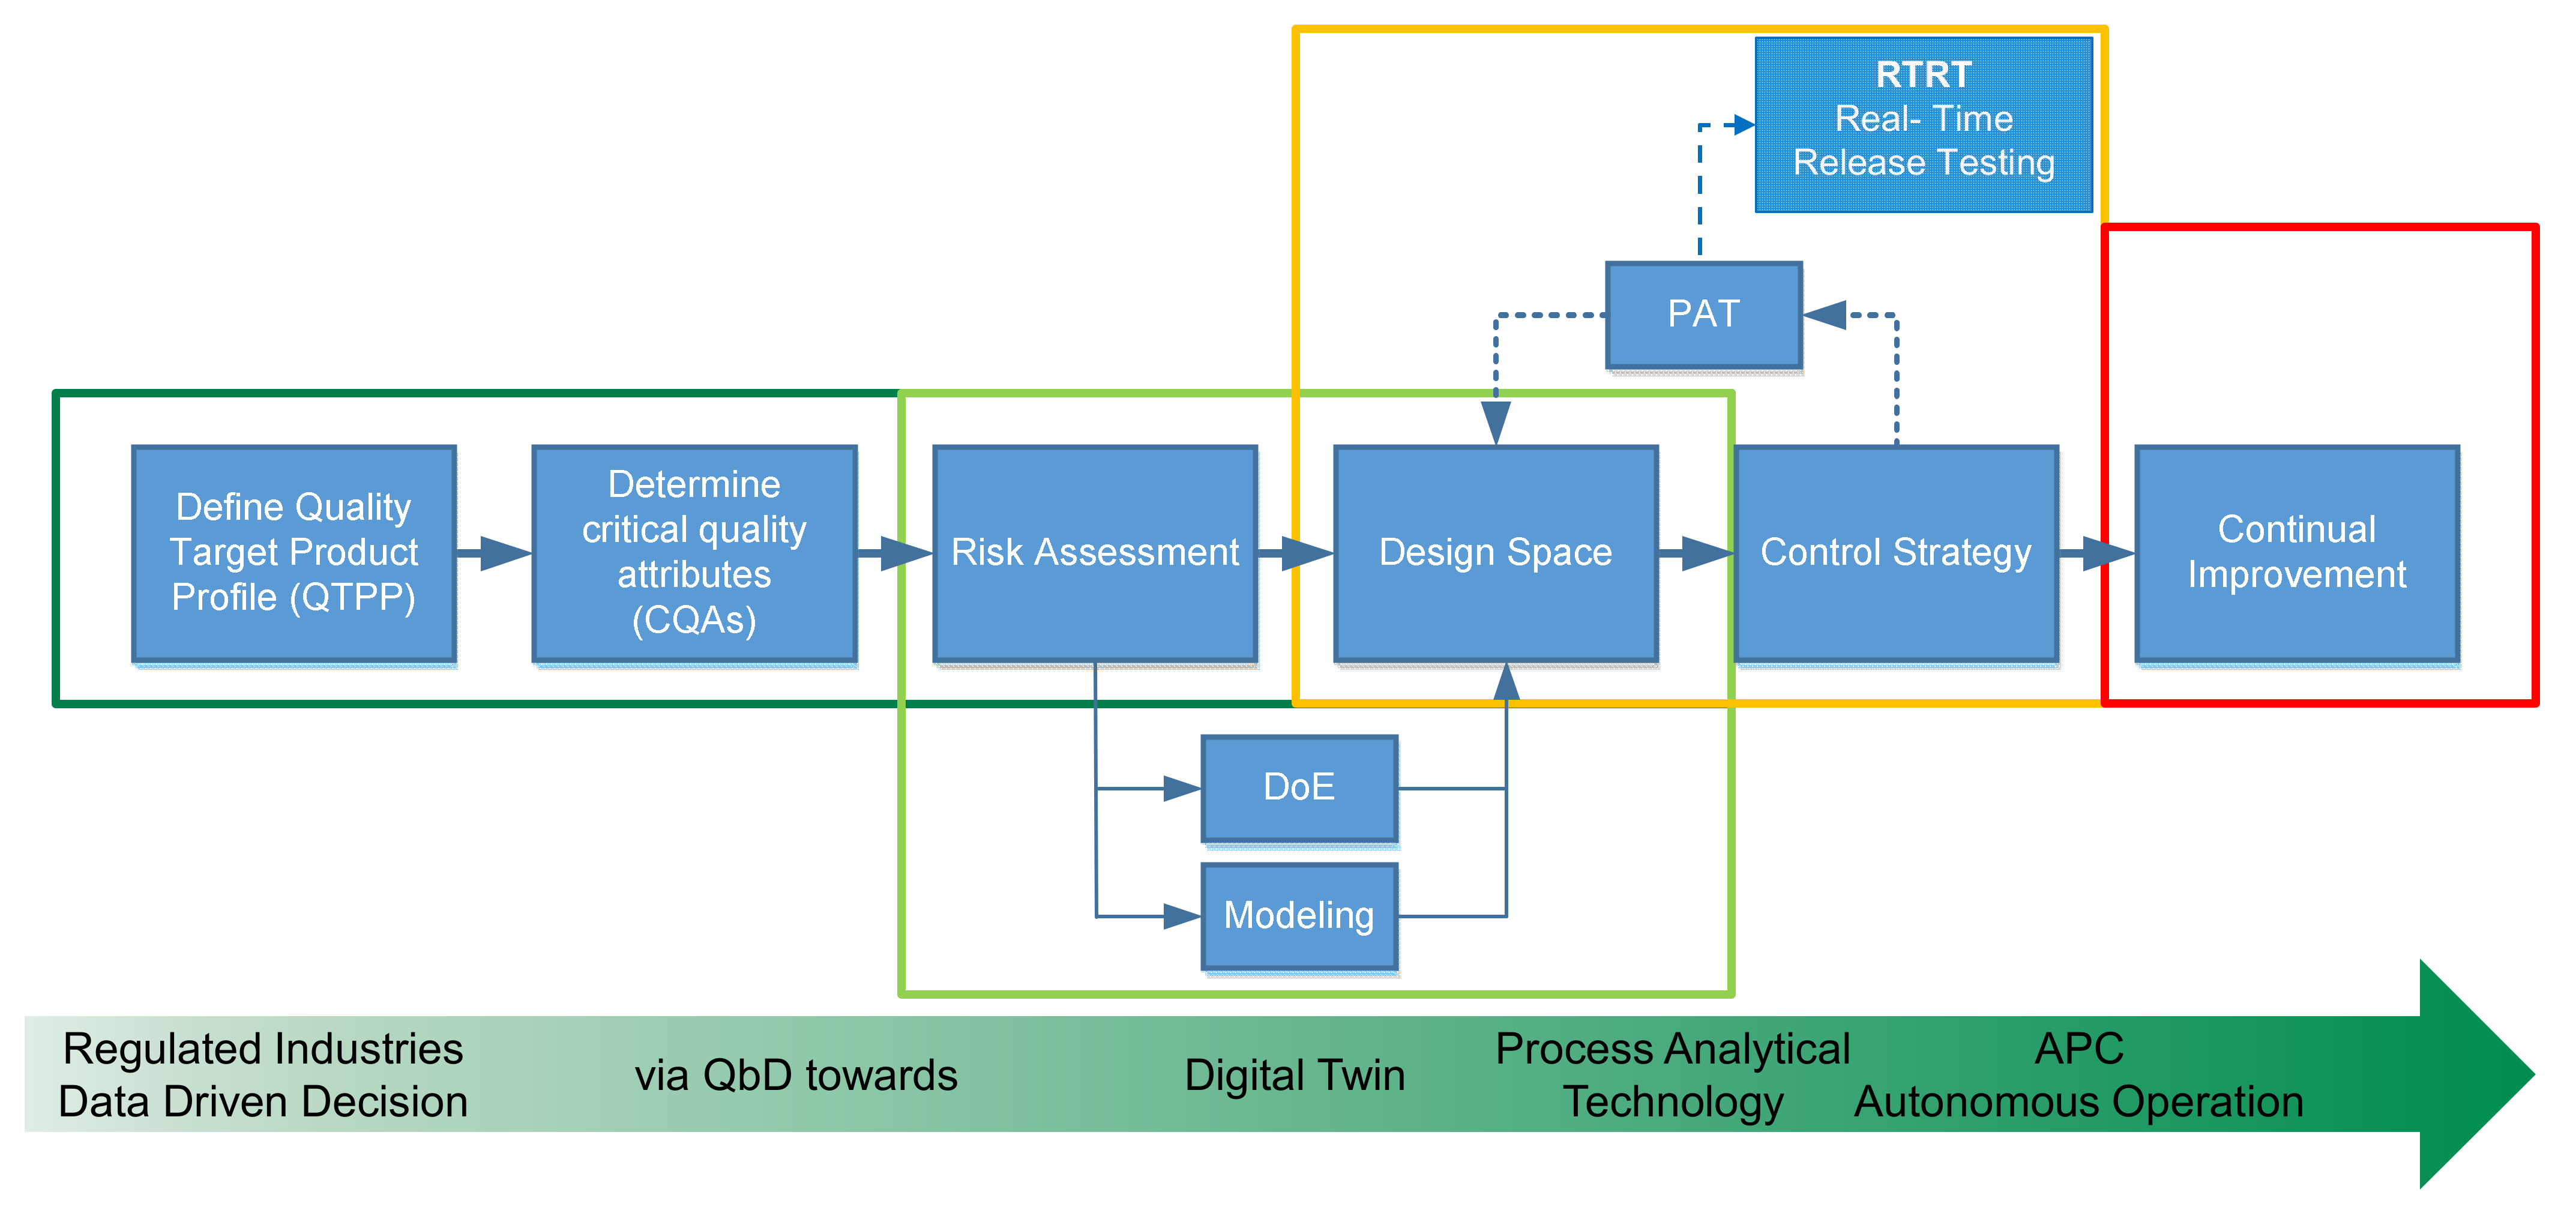
:1. Introduction
2. Materials and Methods
2.1. Extraction Setup
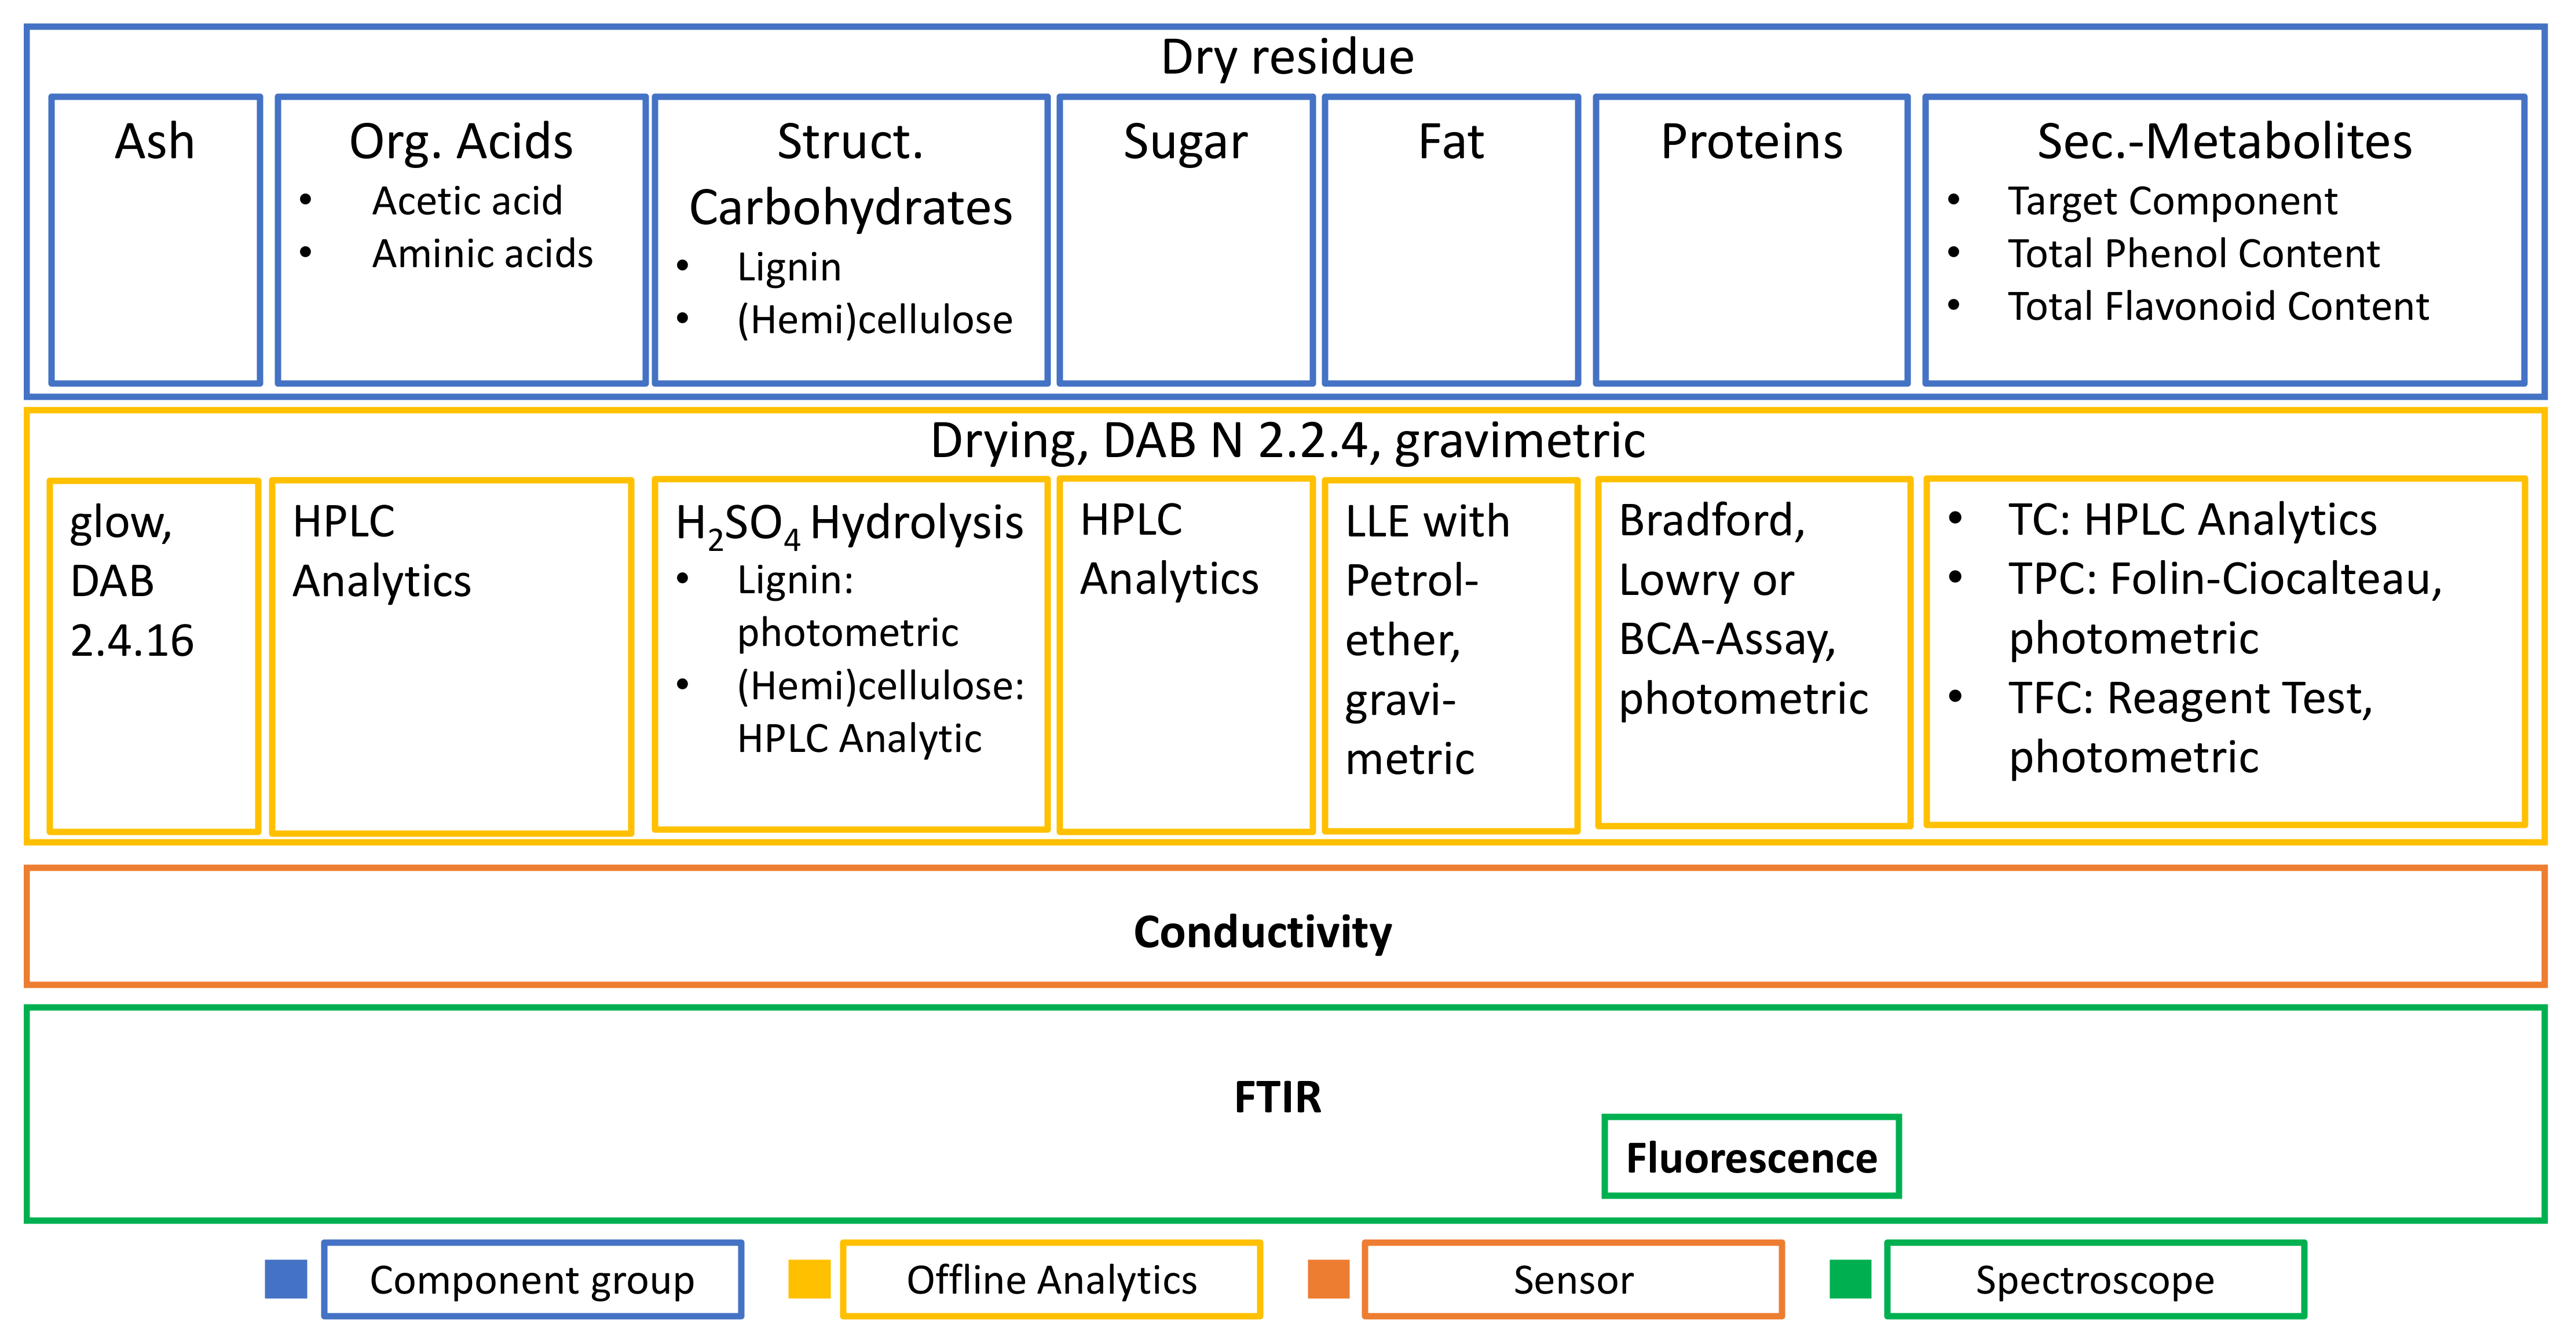
2.2. Dry Residue Determination
2.3. Target Component Analytic for Arbutin
2.4. Hydrolysis of Structural Carbohydrates
2.5. Sugar and Acetic Acid Analytics
2.6. TPC and TFC Determination
2.7. Aminic Acids
2.8. Protein Determination
2.9. Fat Determination
2.10. Ash Determination
2.11. Spectroscopic and Sensoric Data Acquisition
2.12. Data Analysis
3. Results
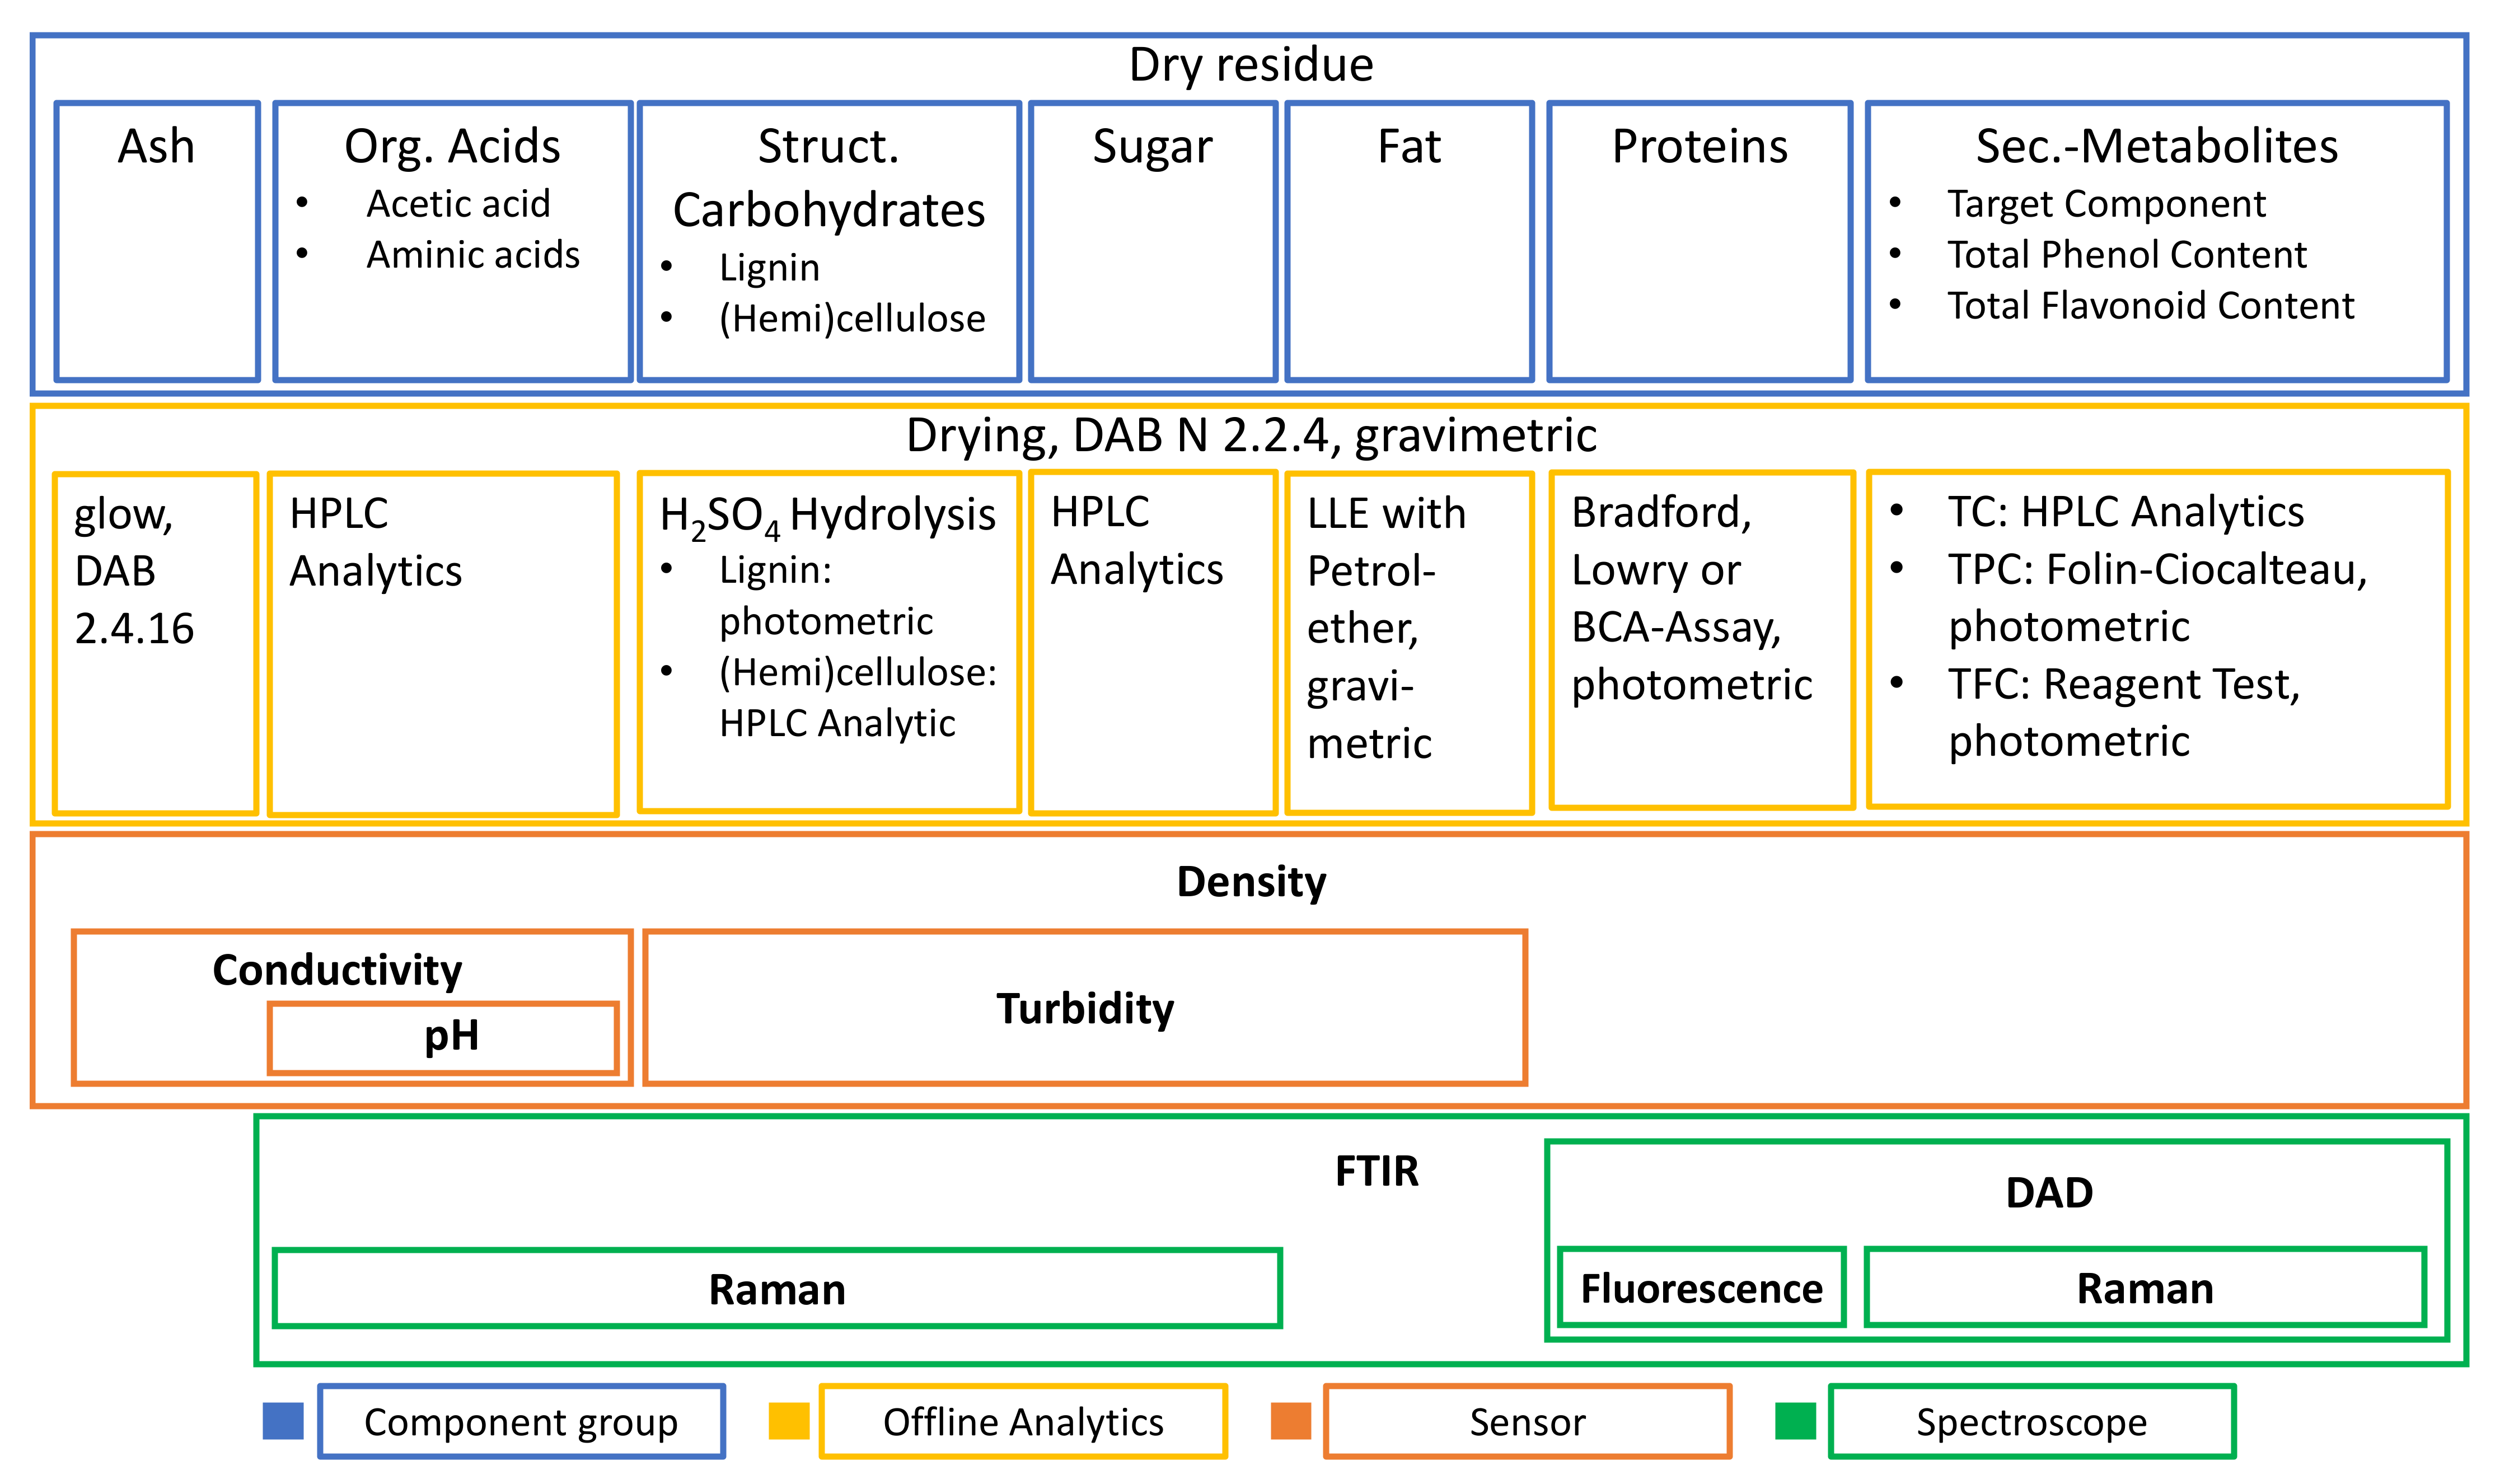
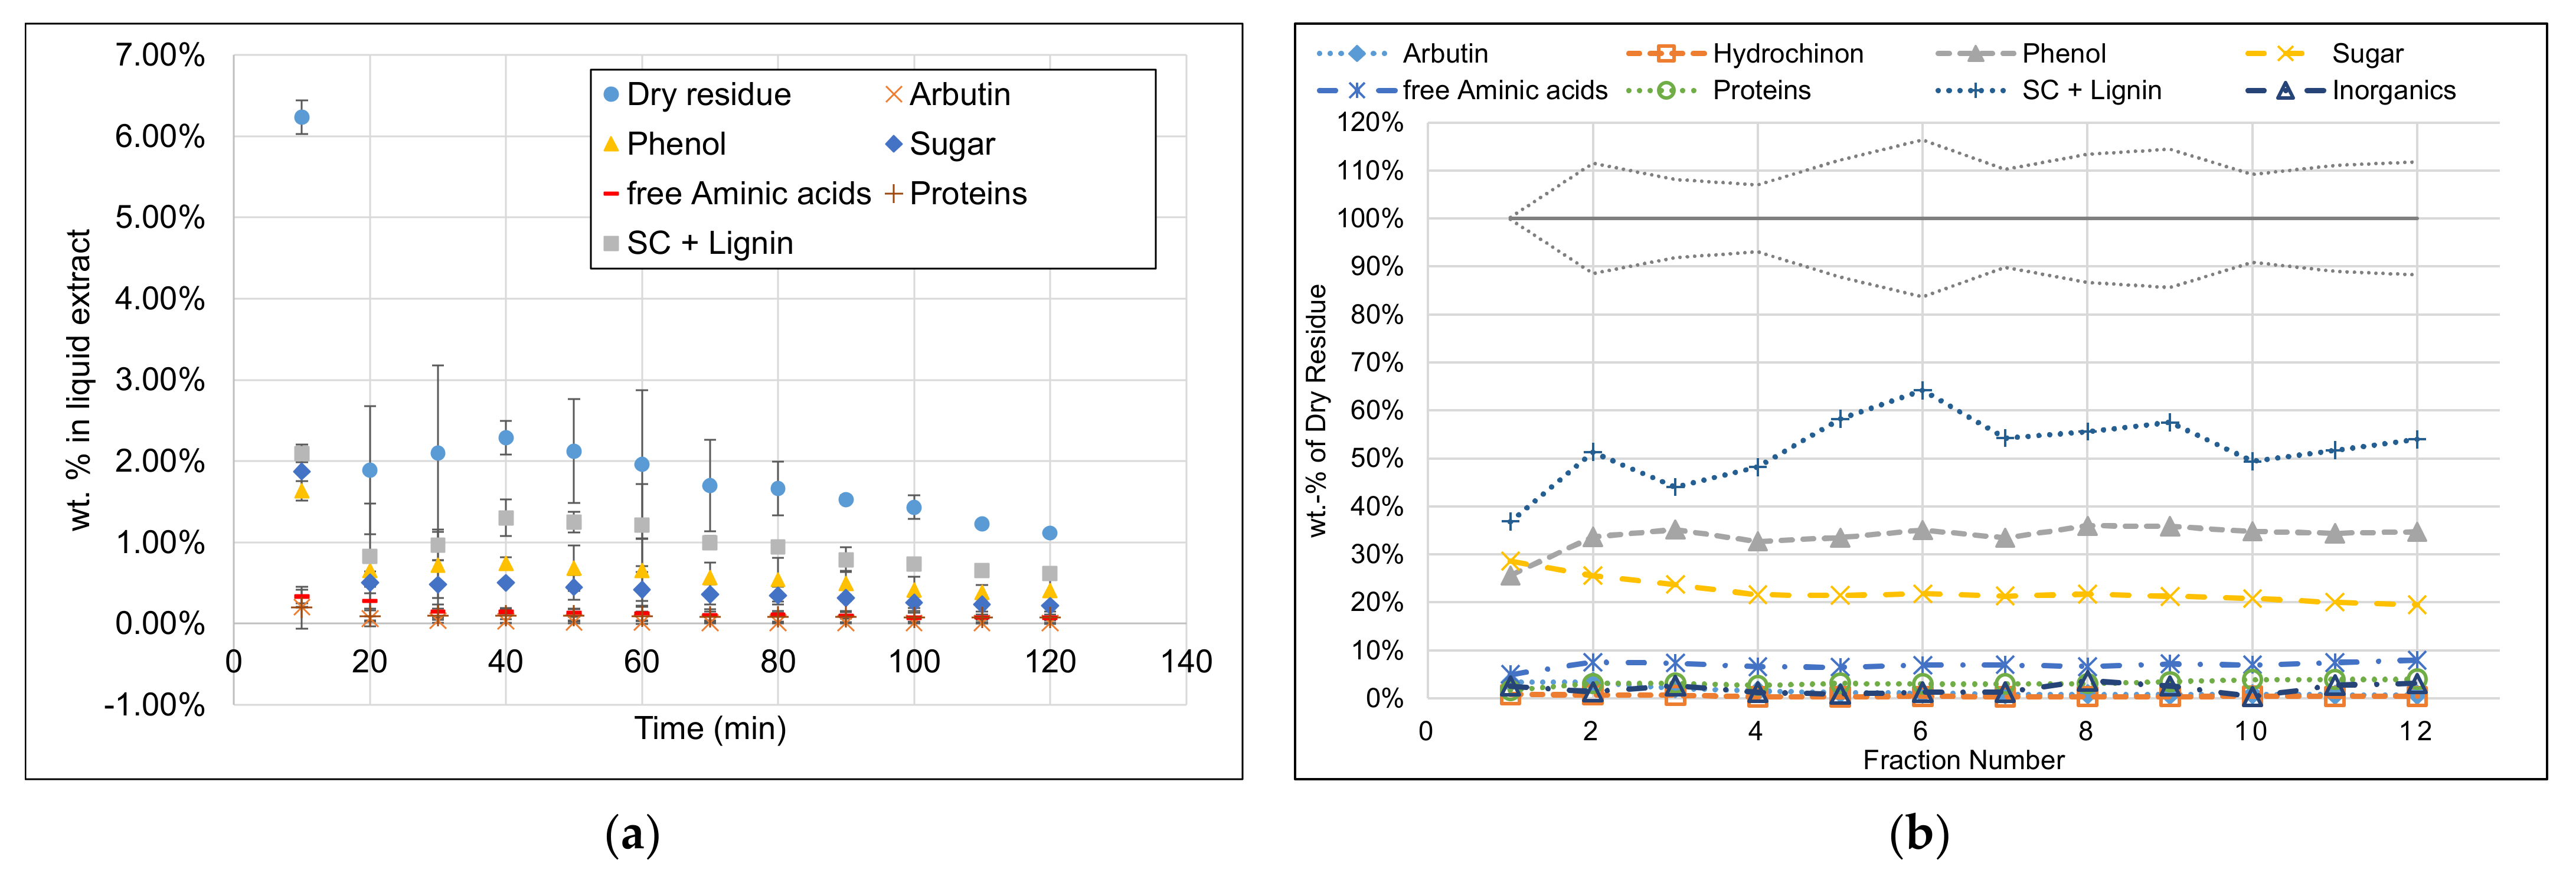
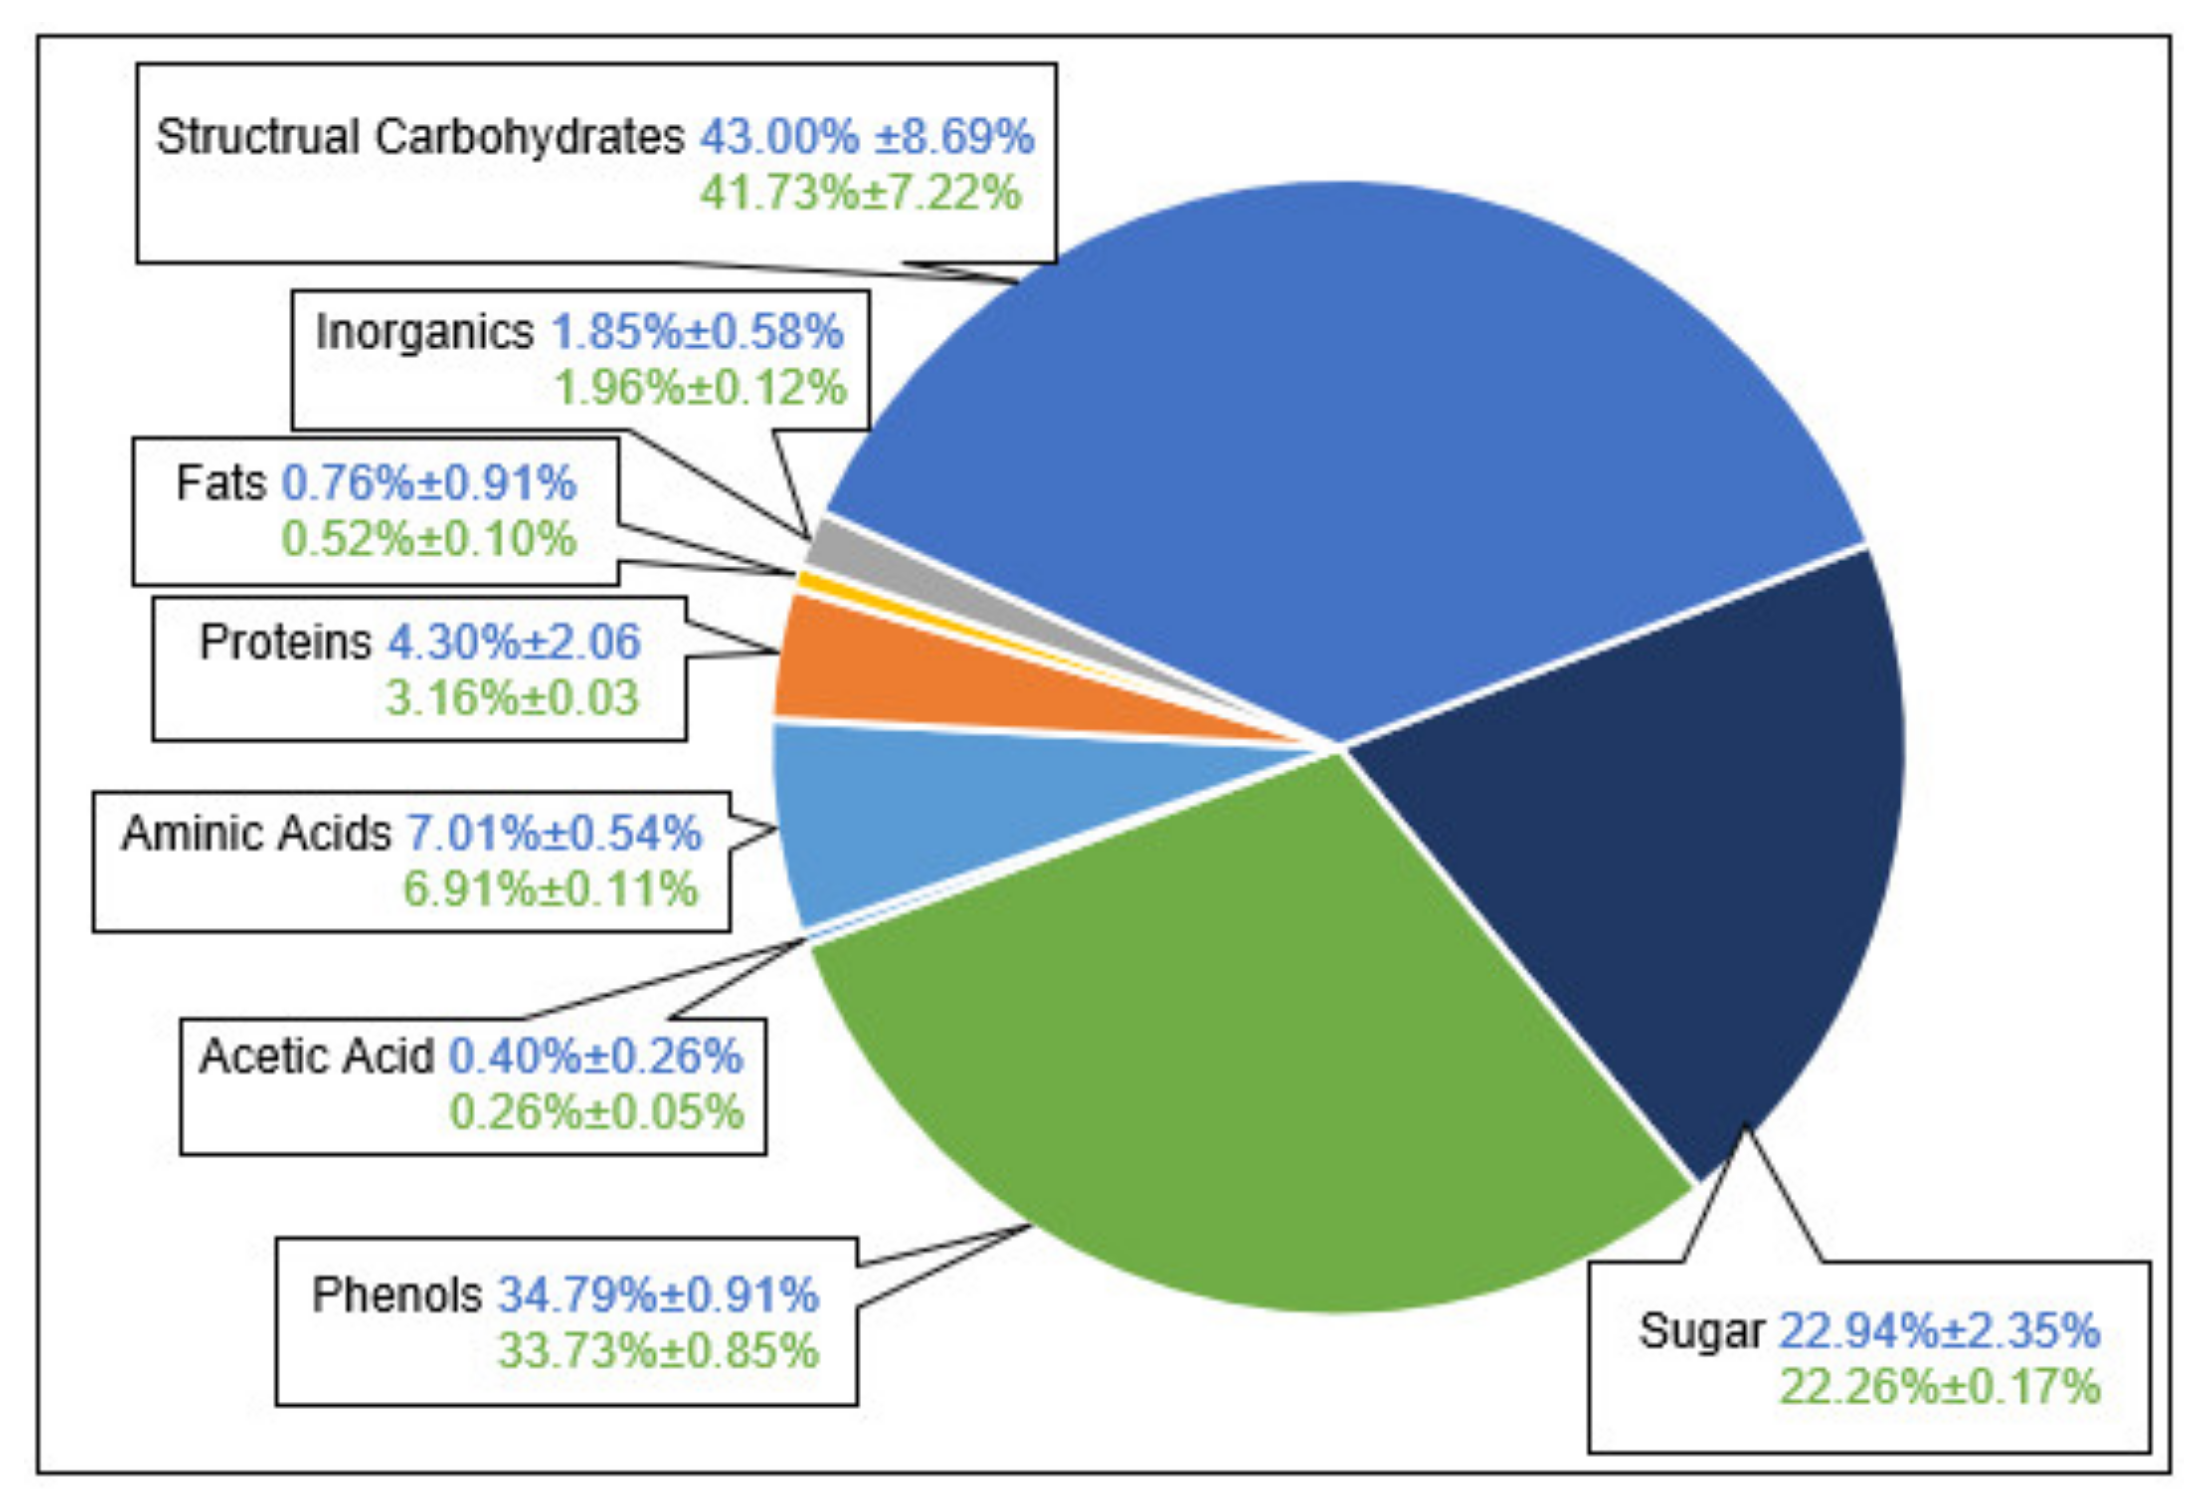
3.1. Extract Composition
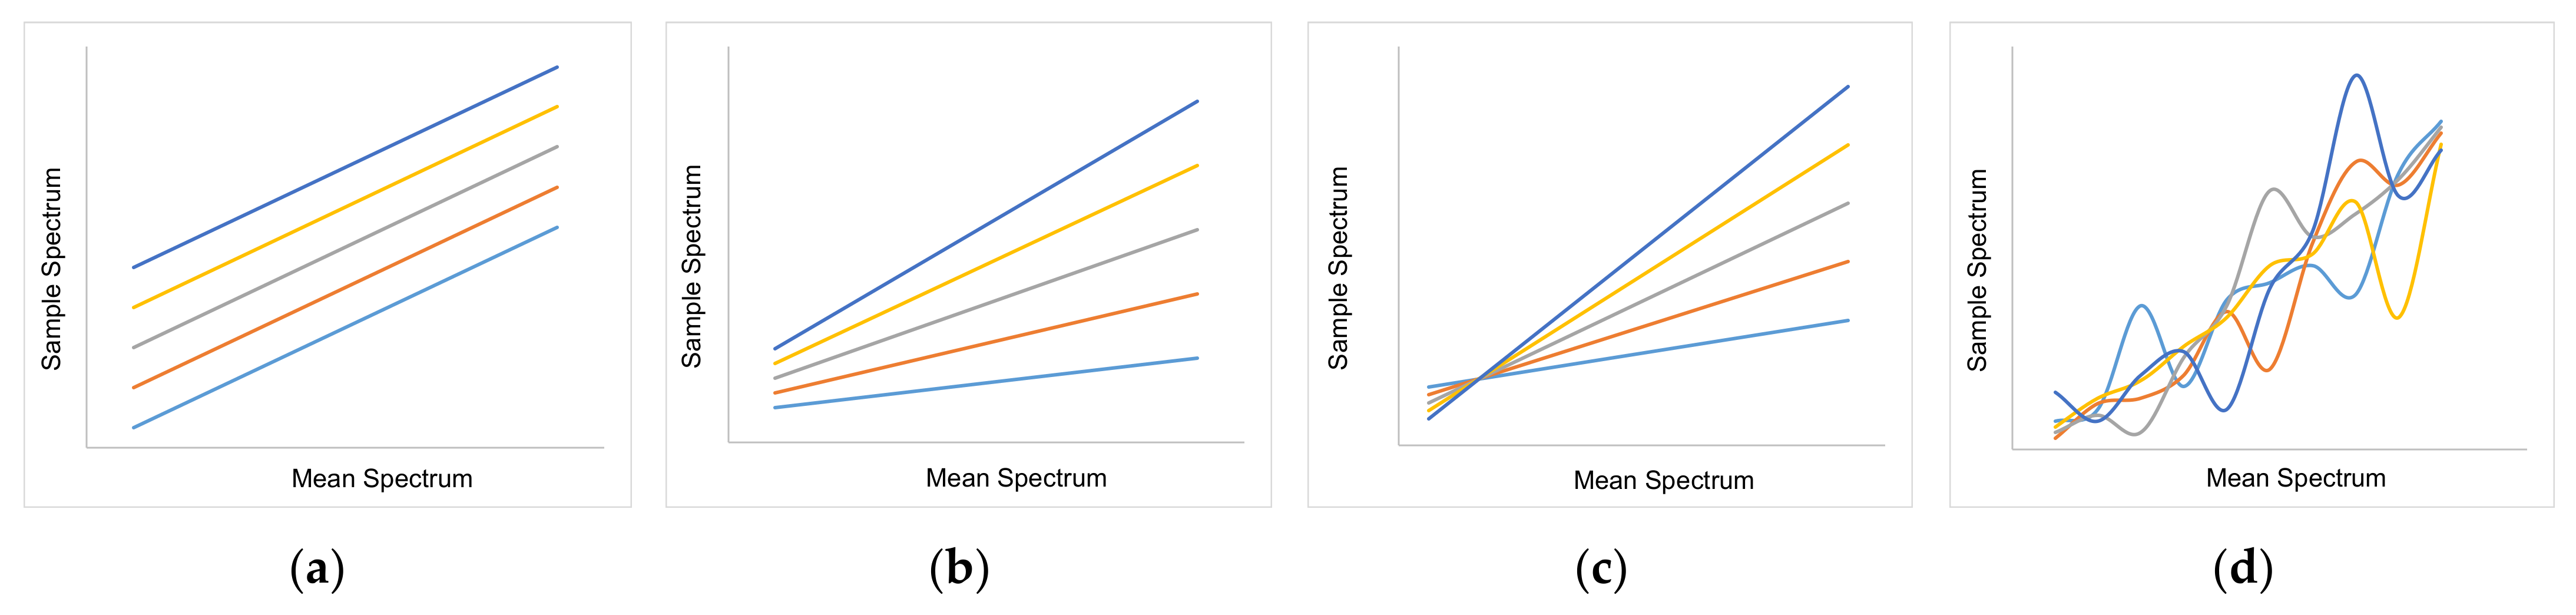
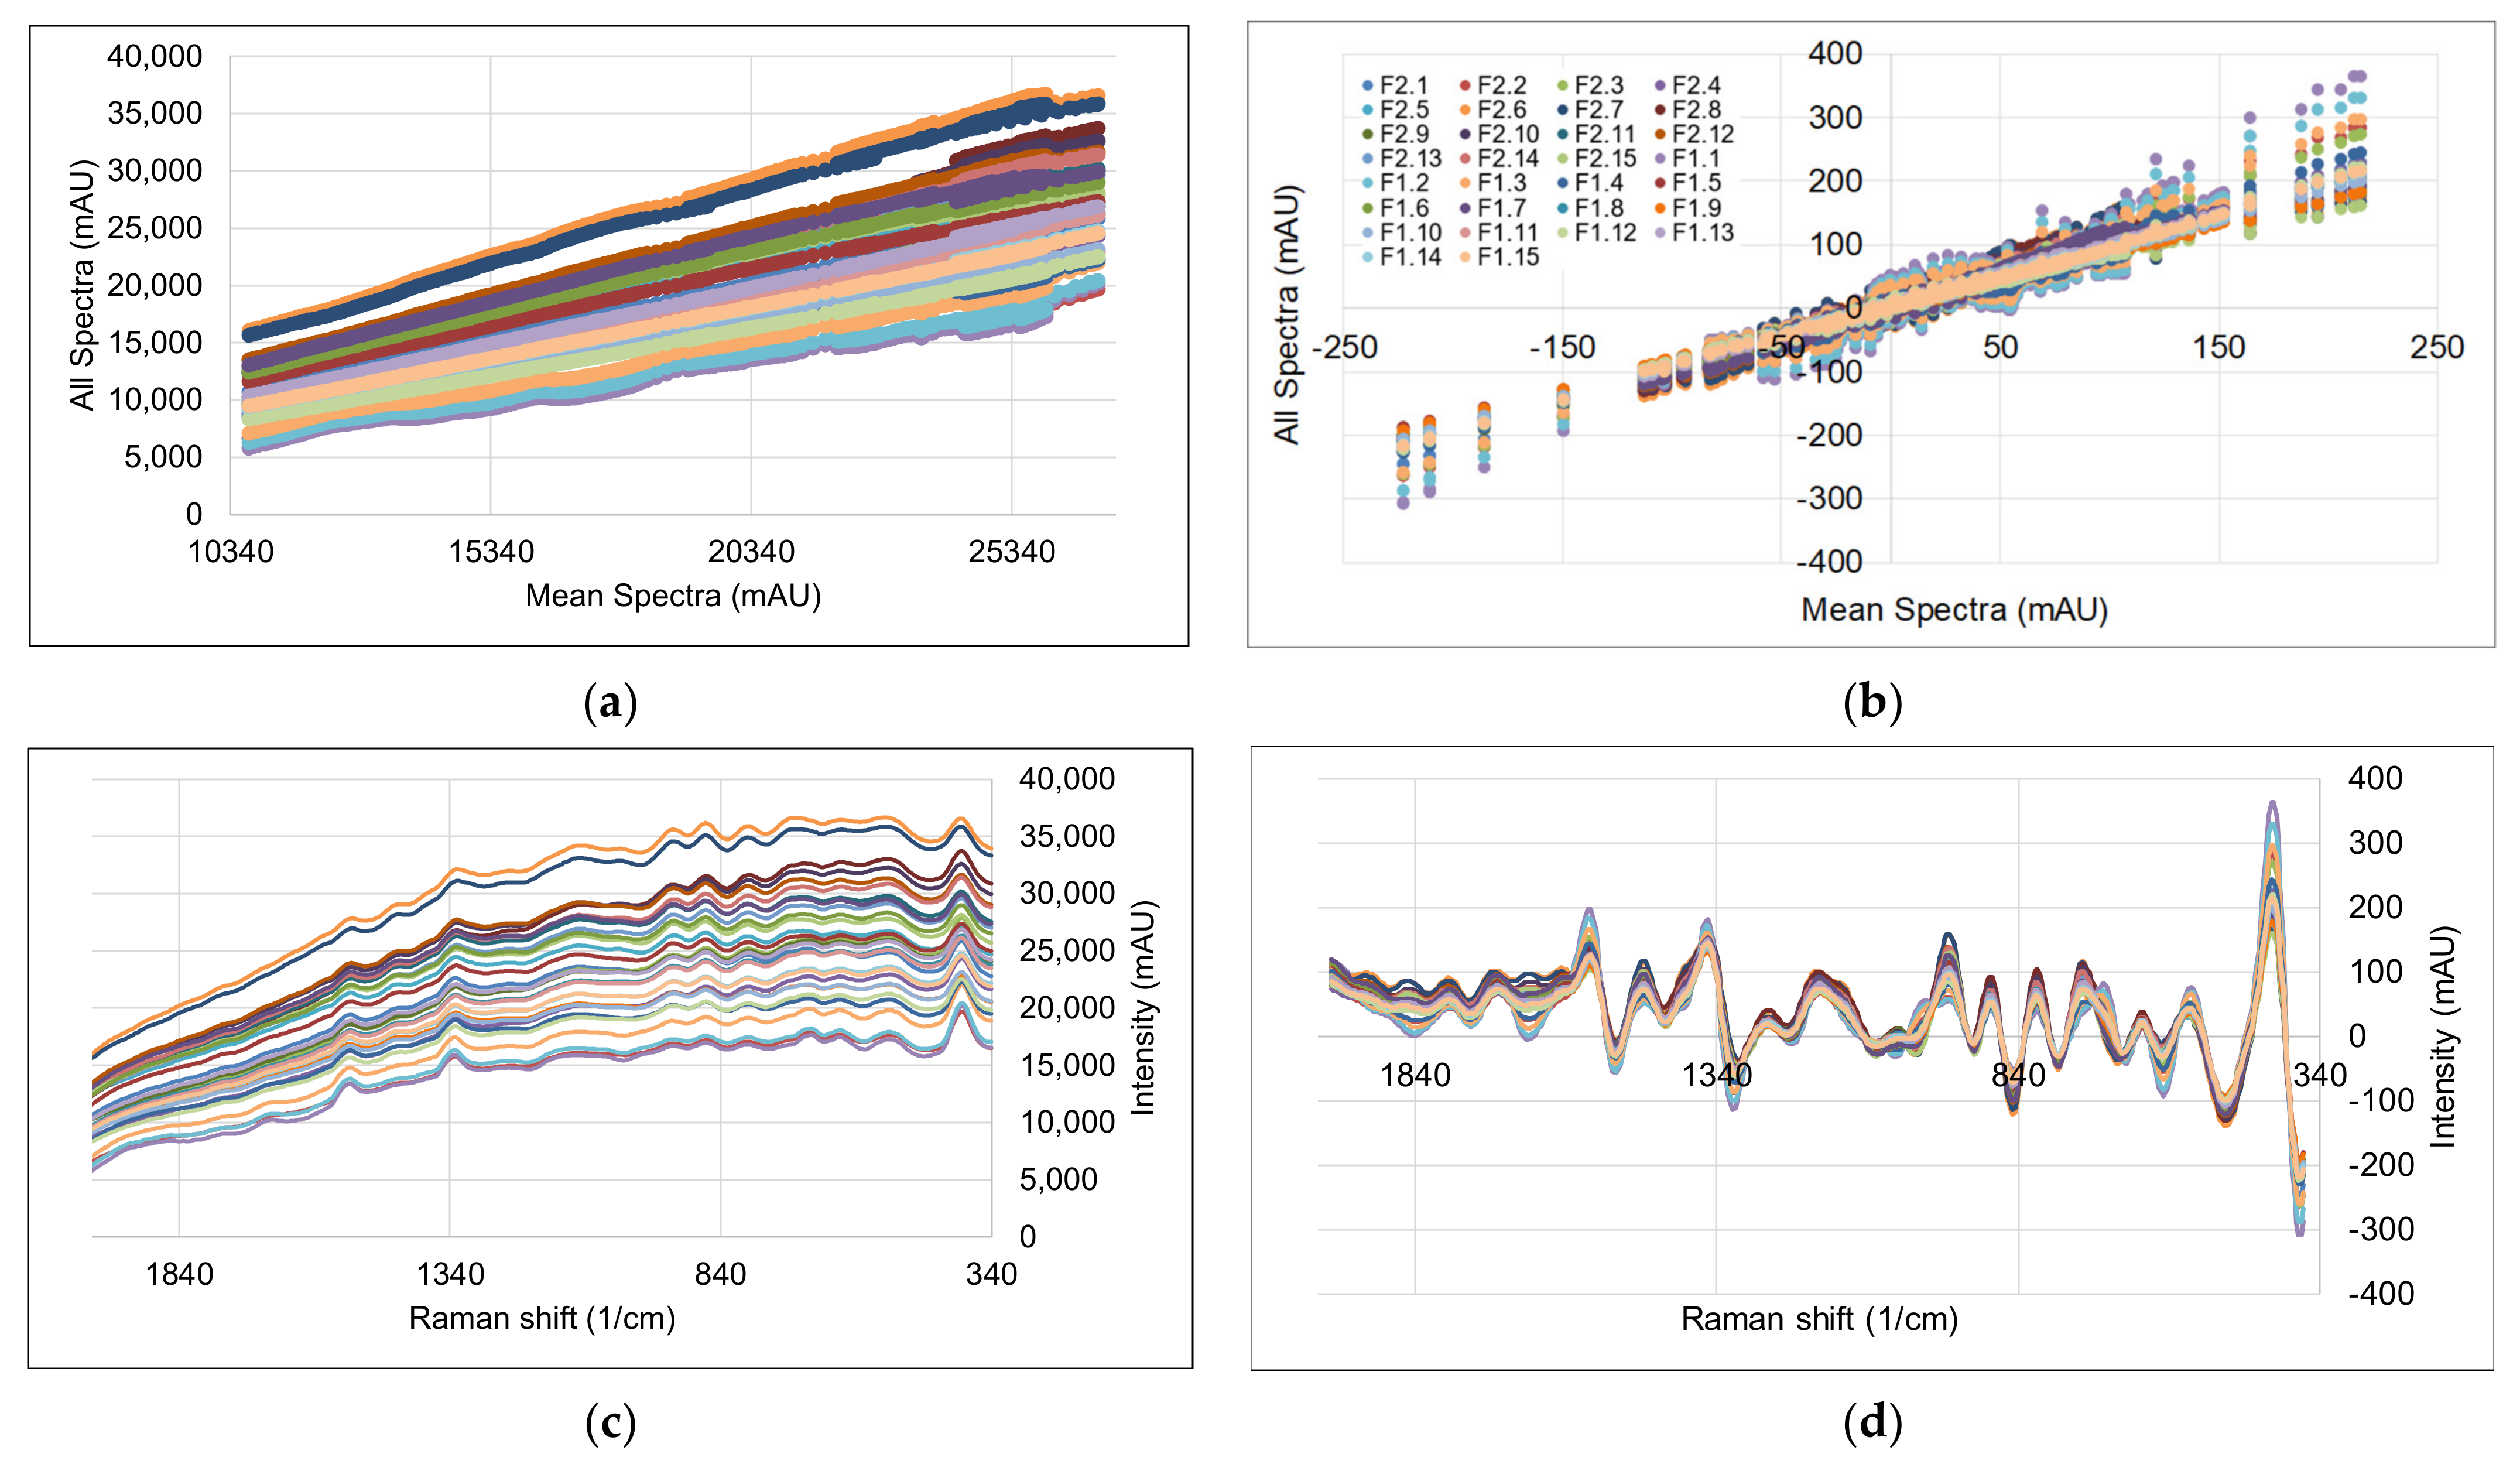
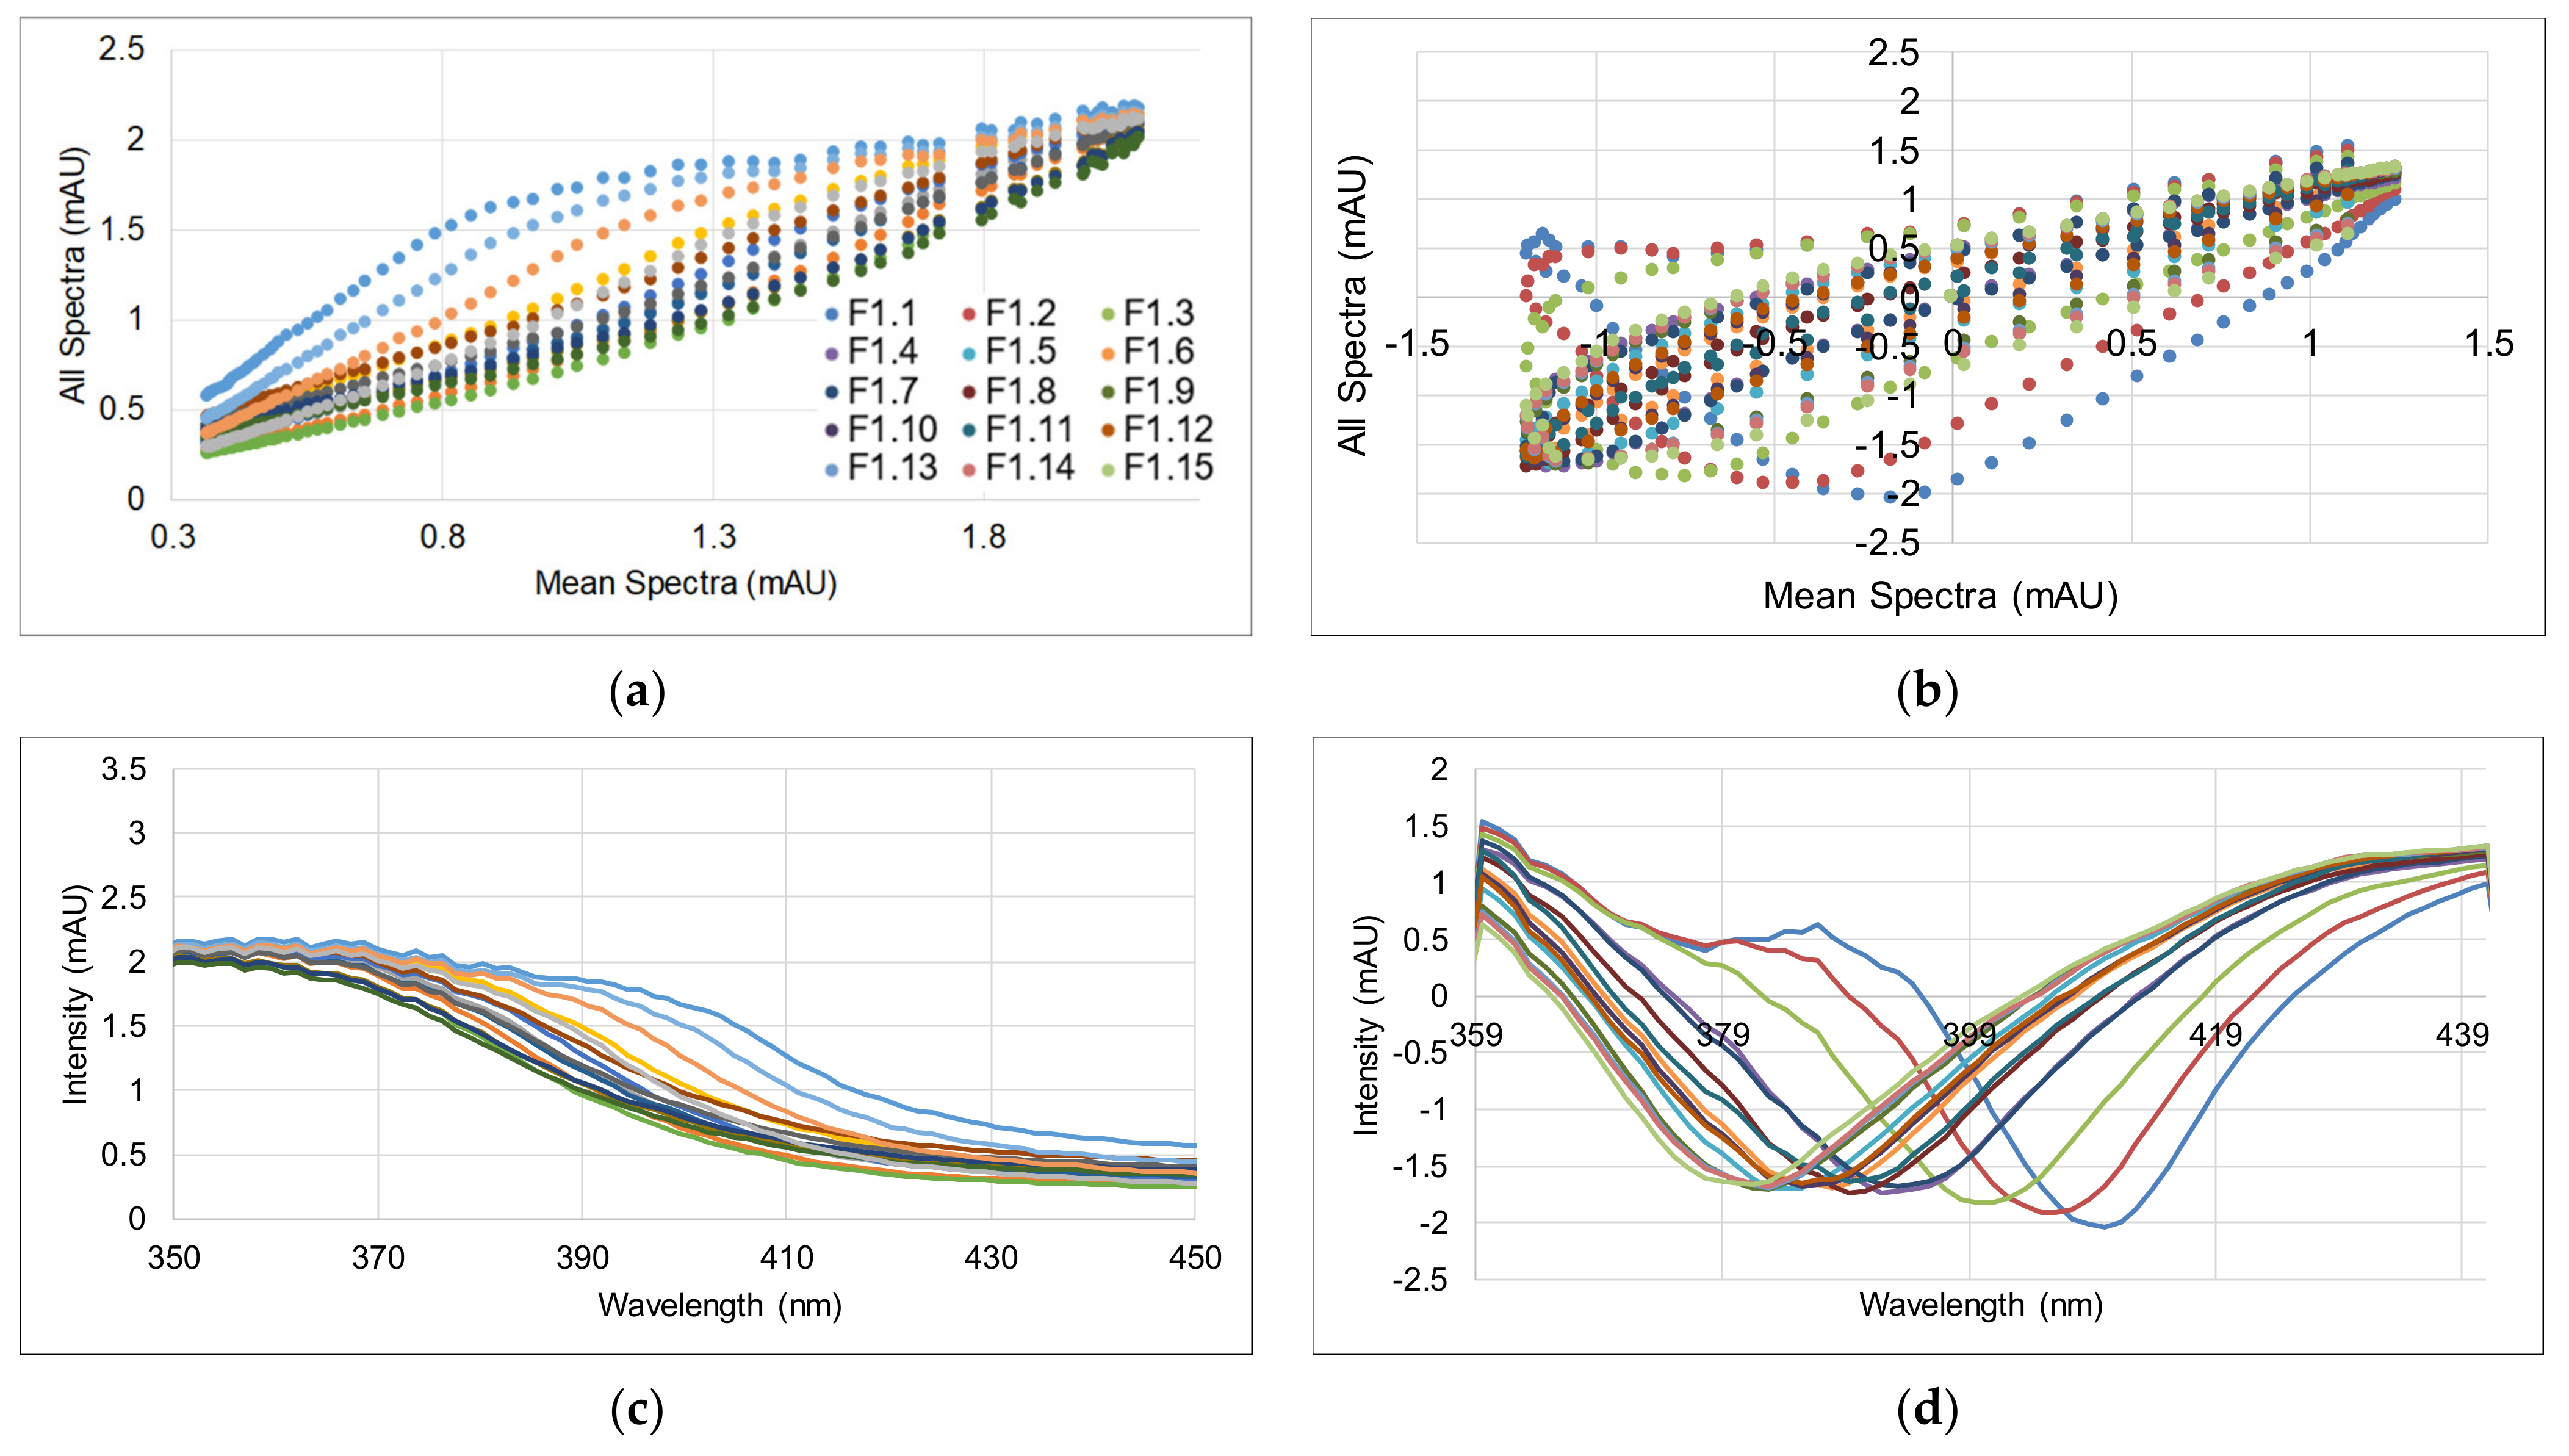
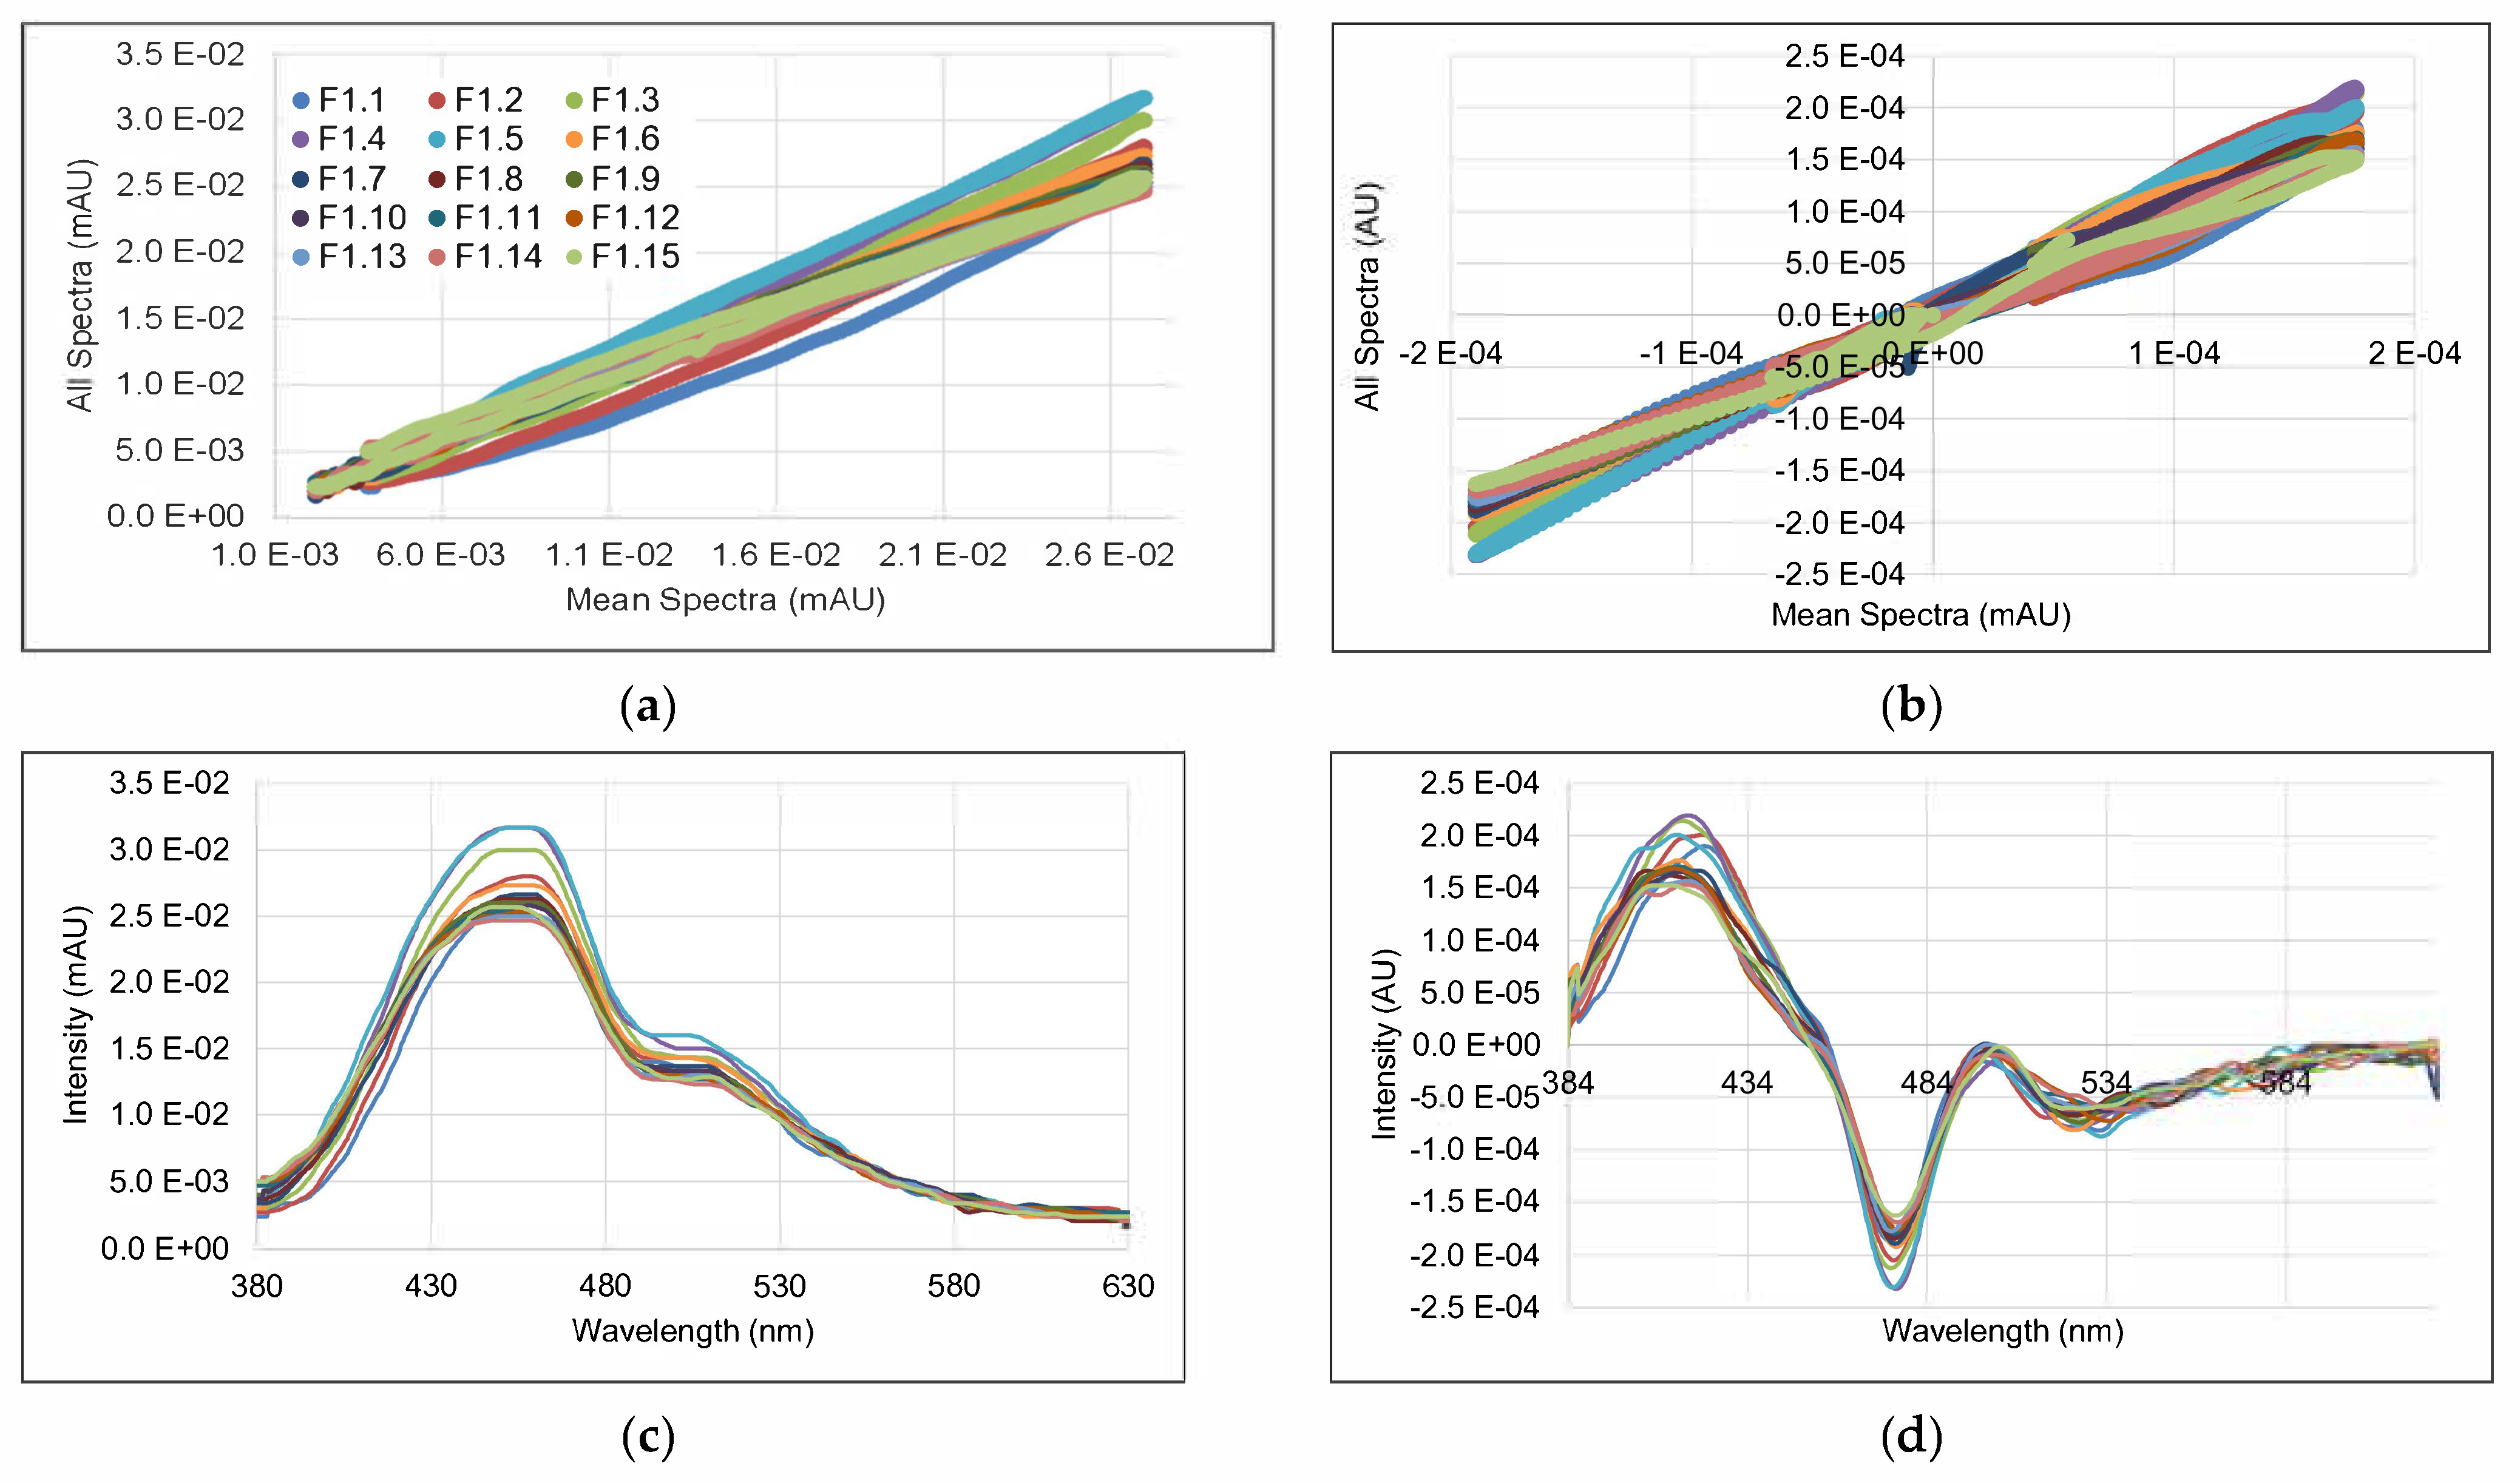
3.2. Spectral Data and Preprocessing
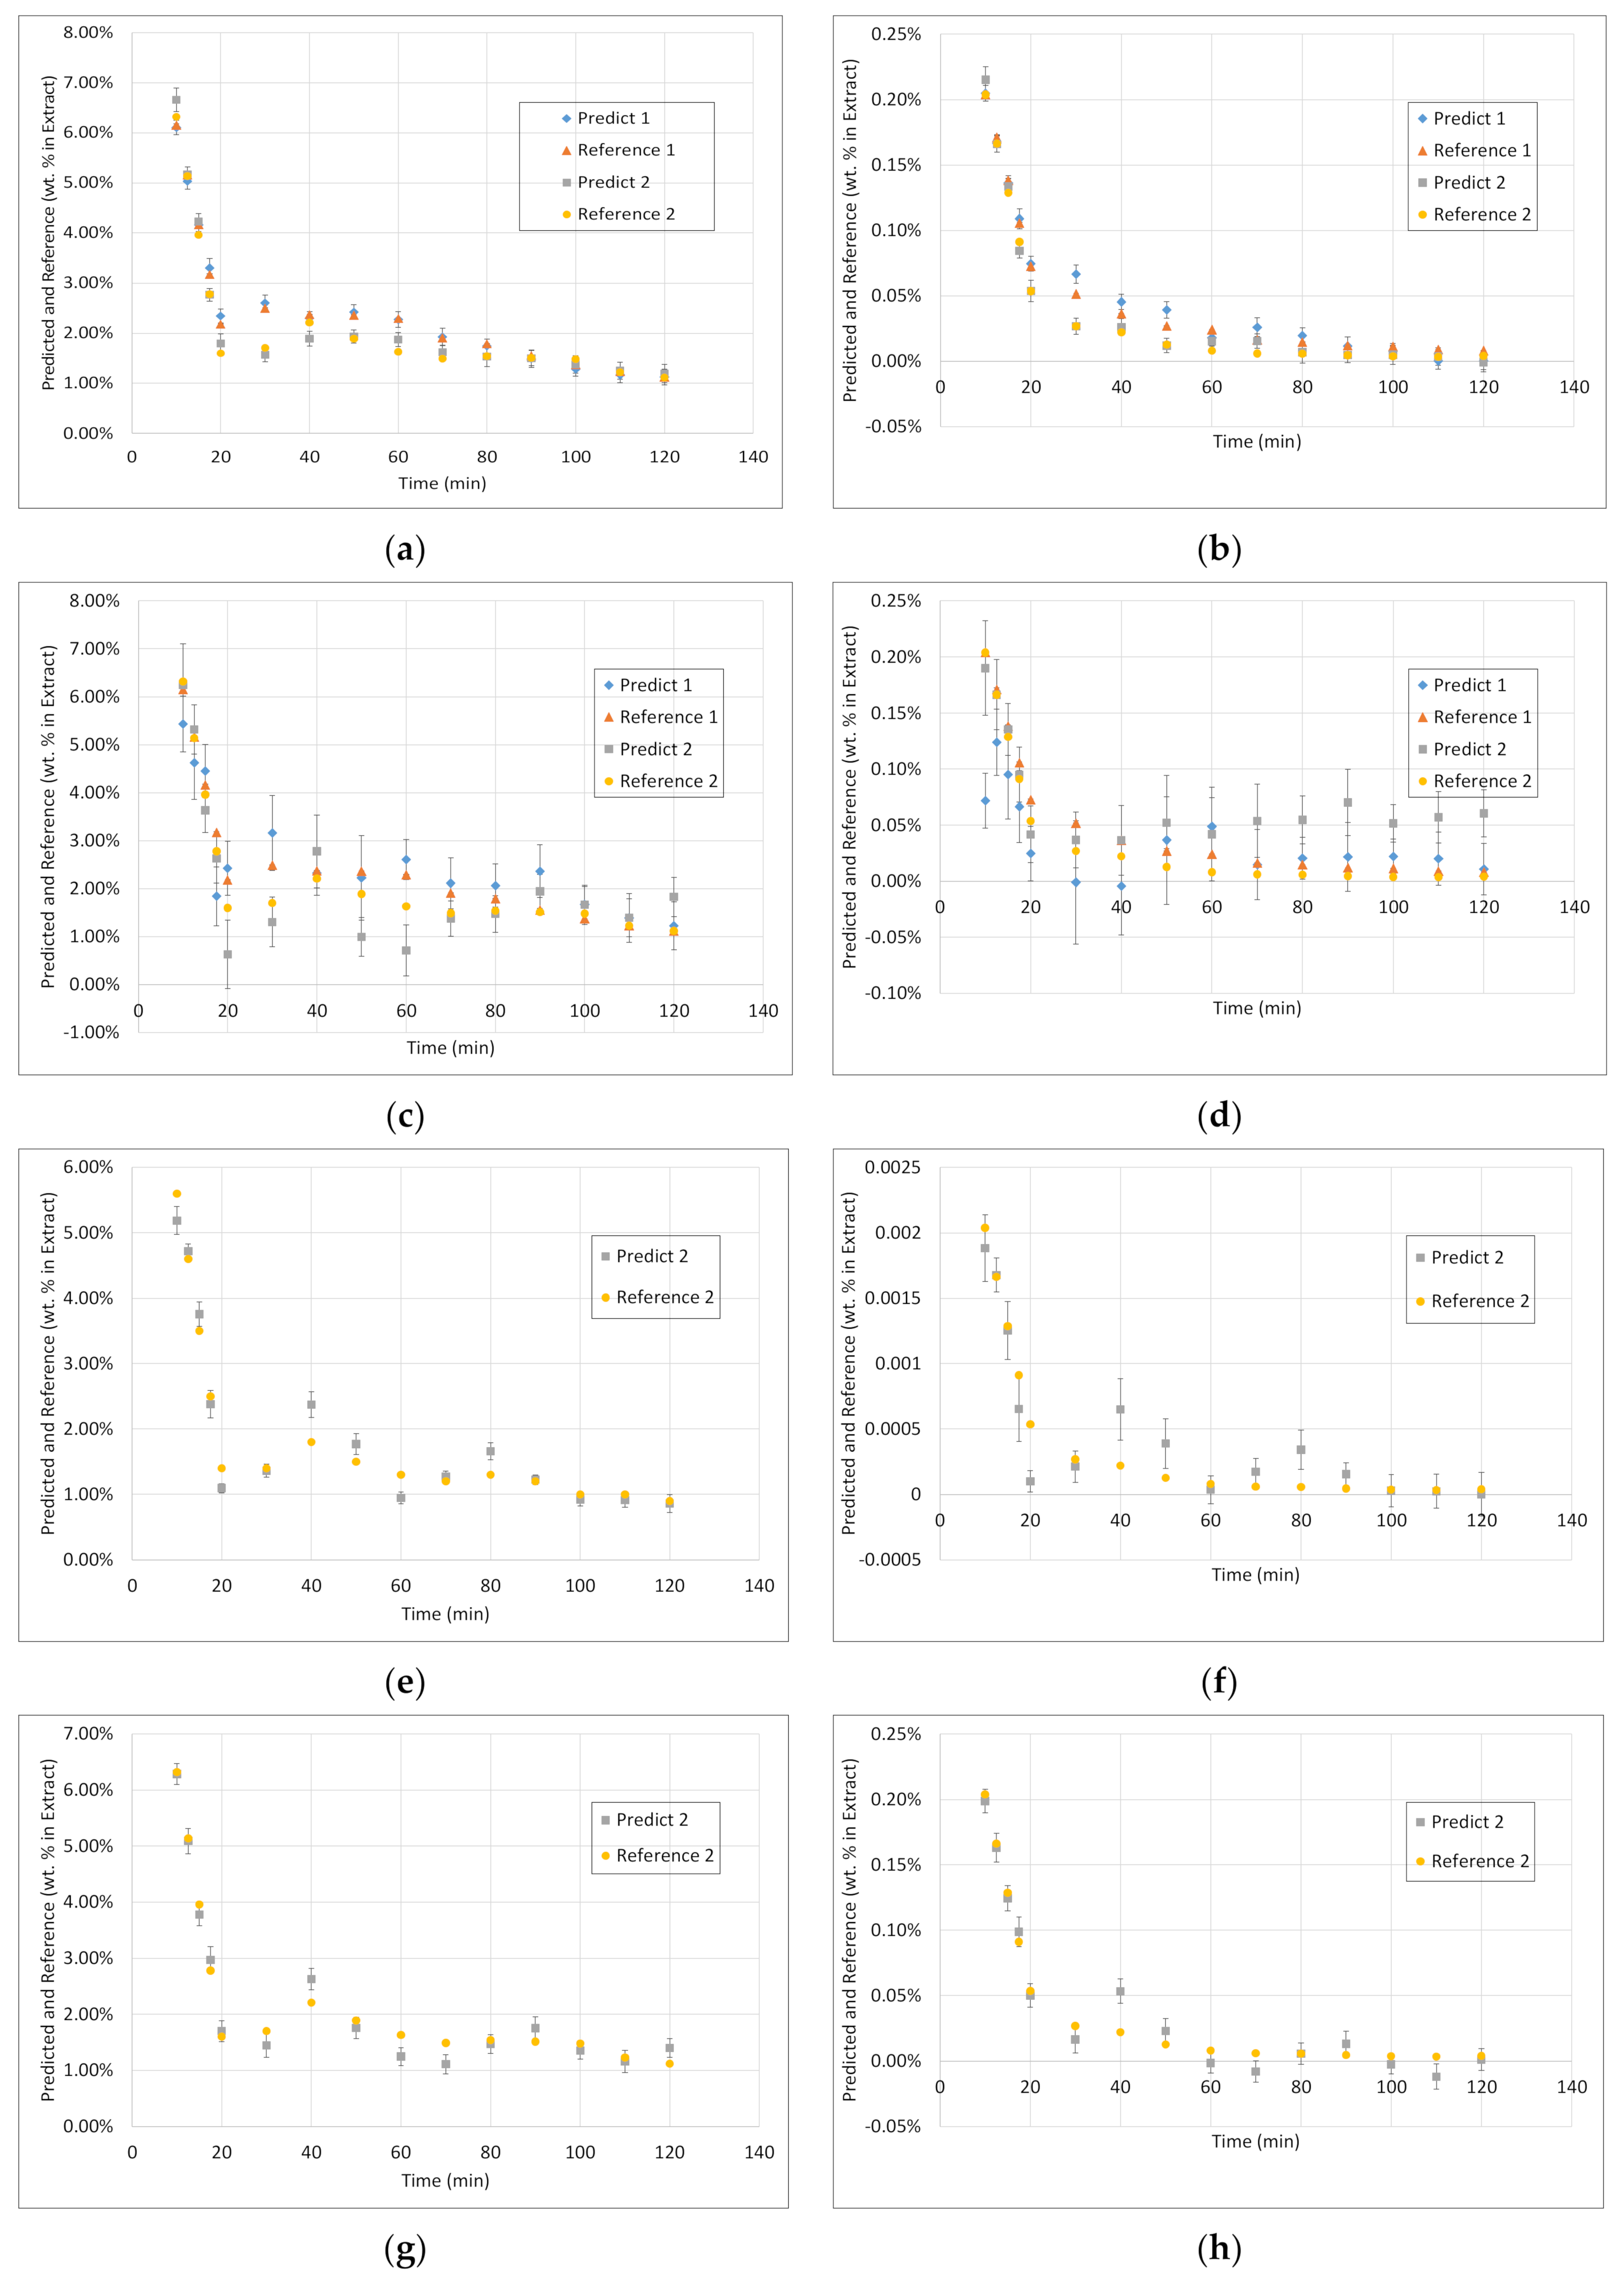
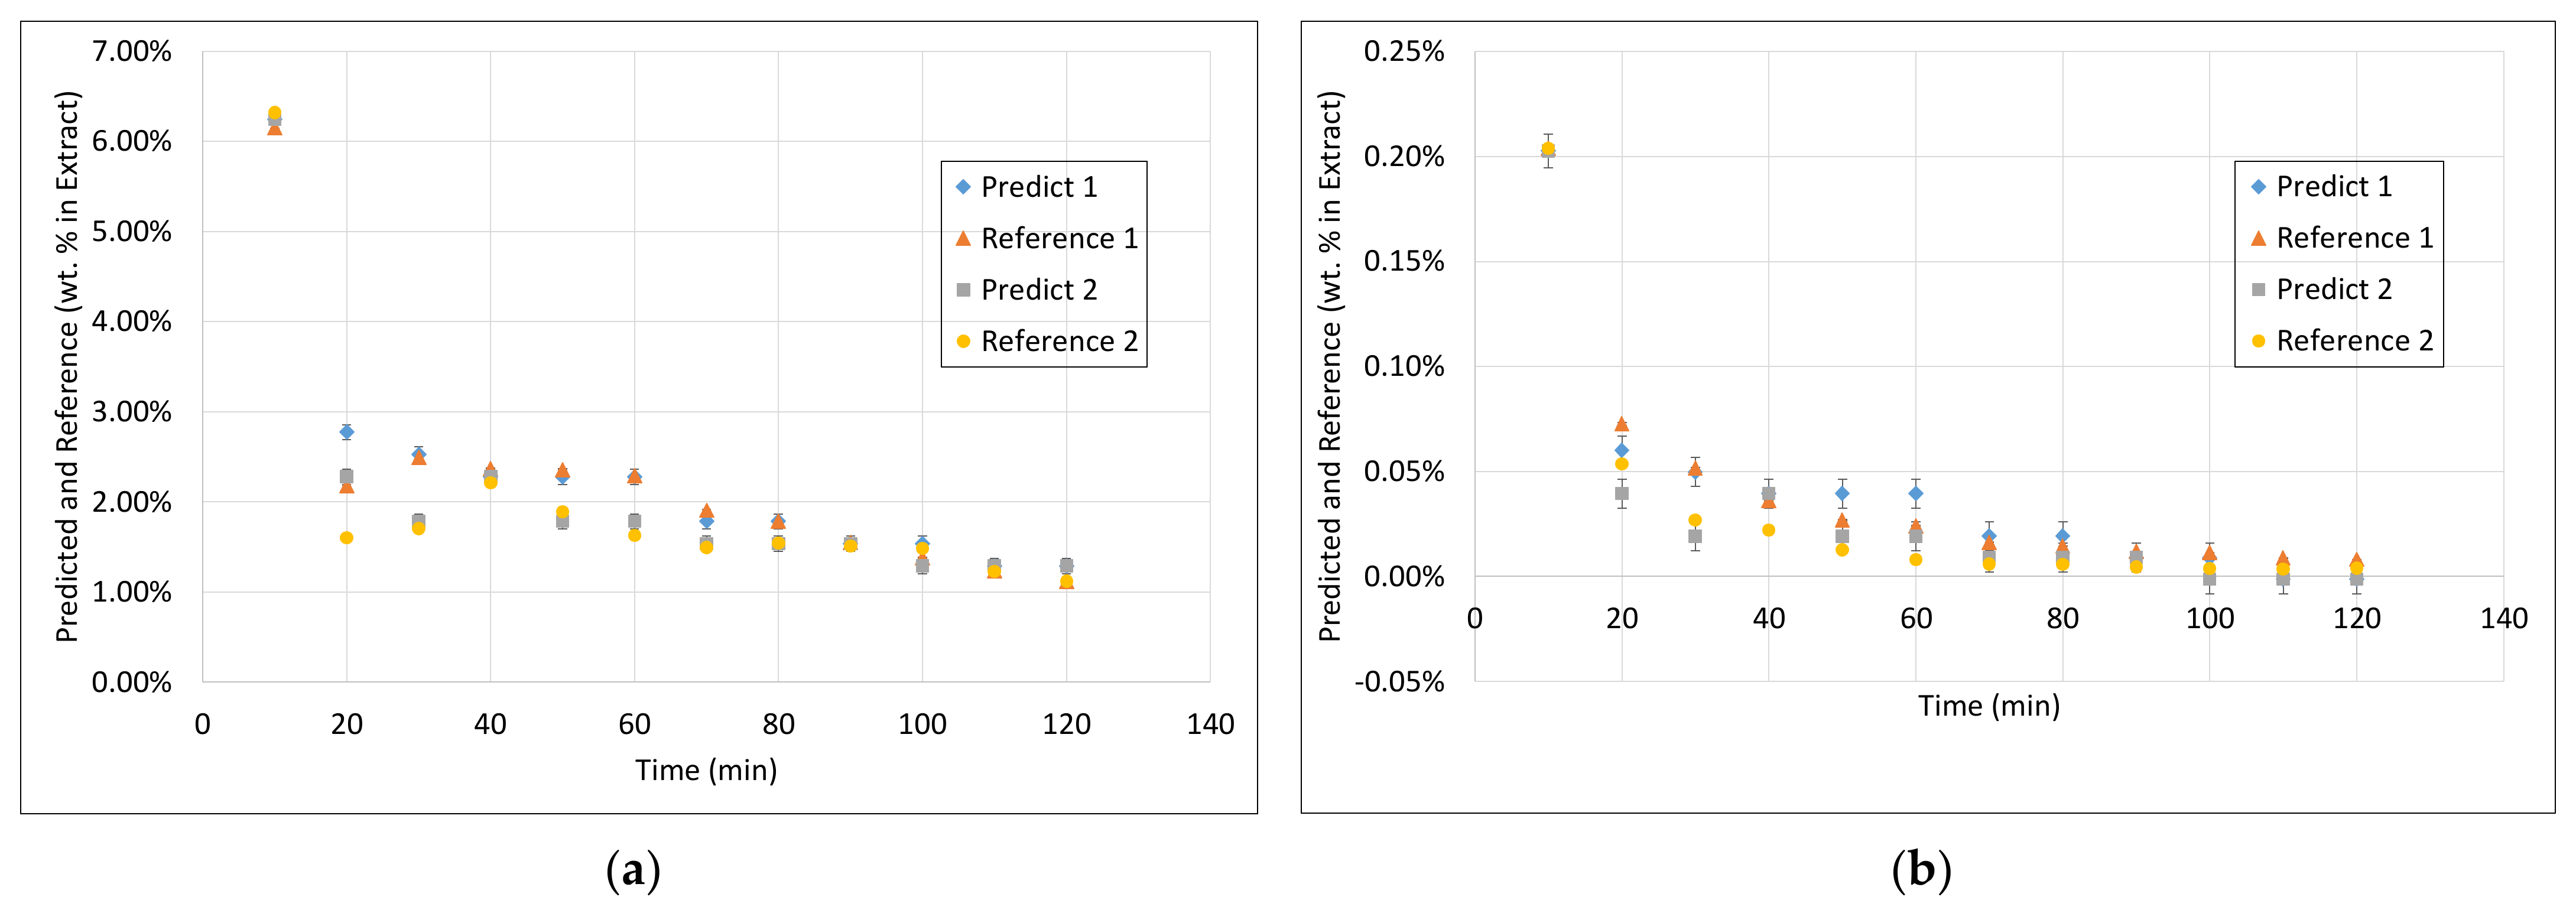
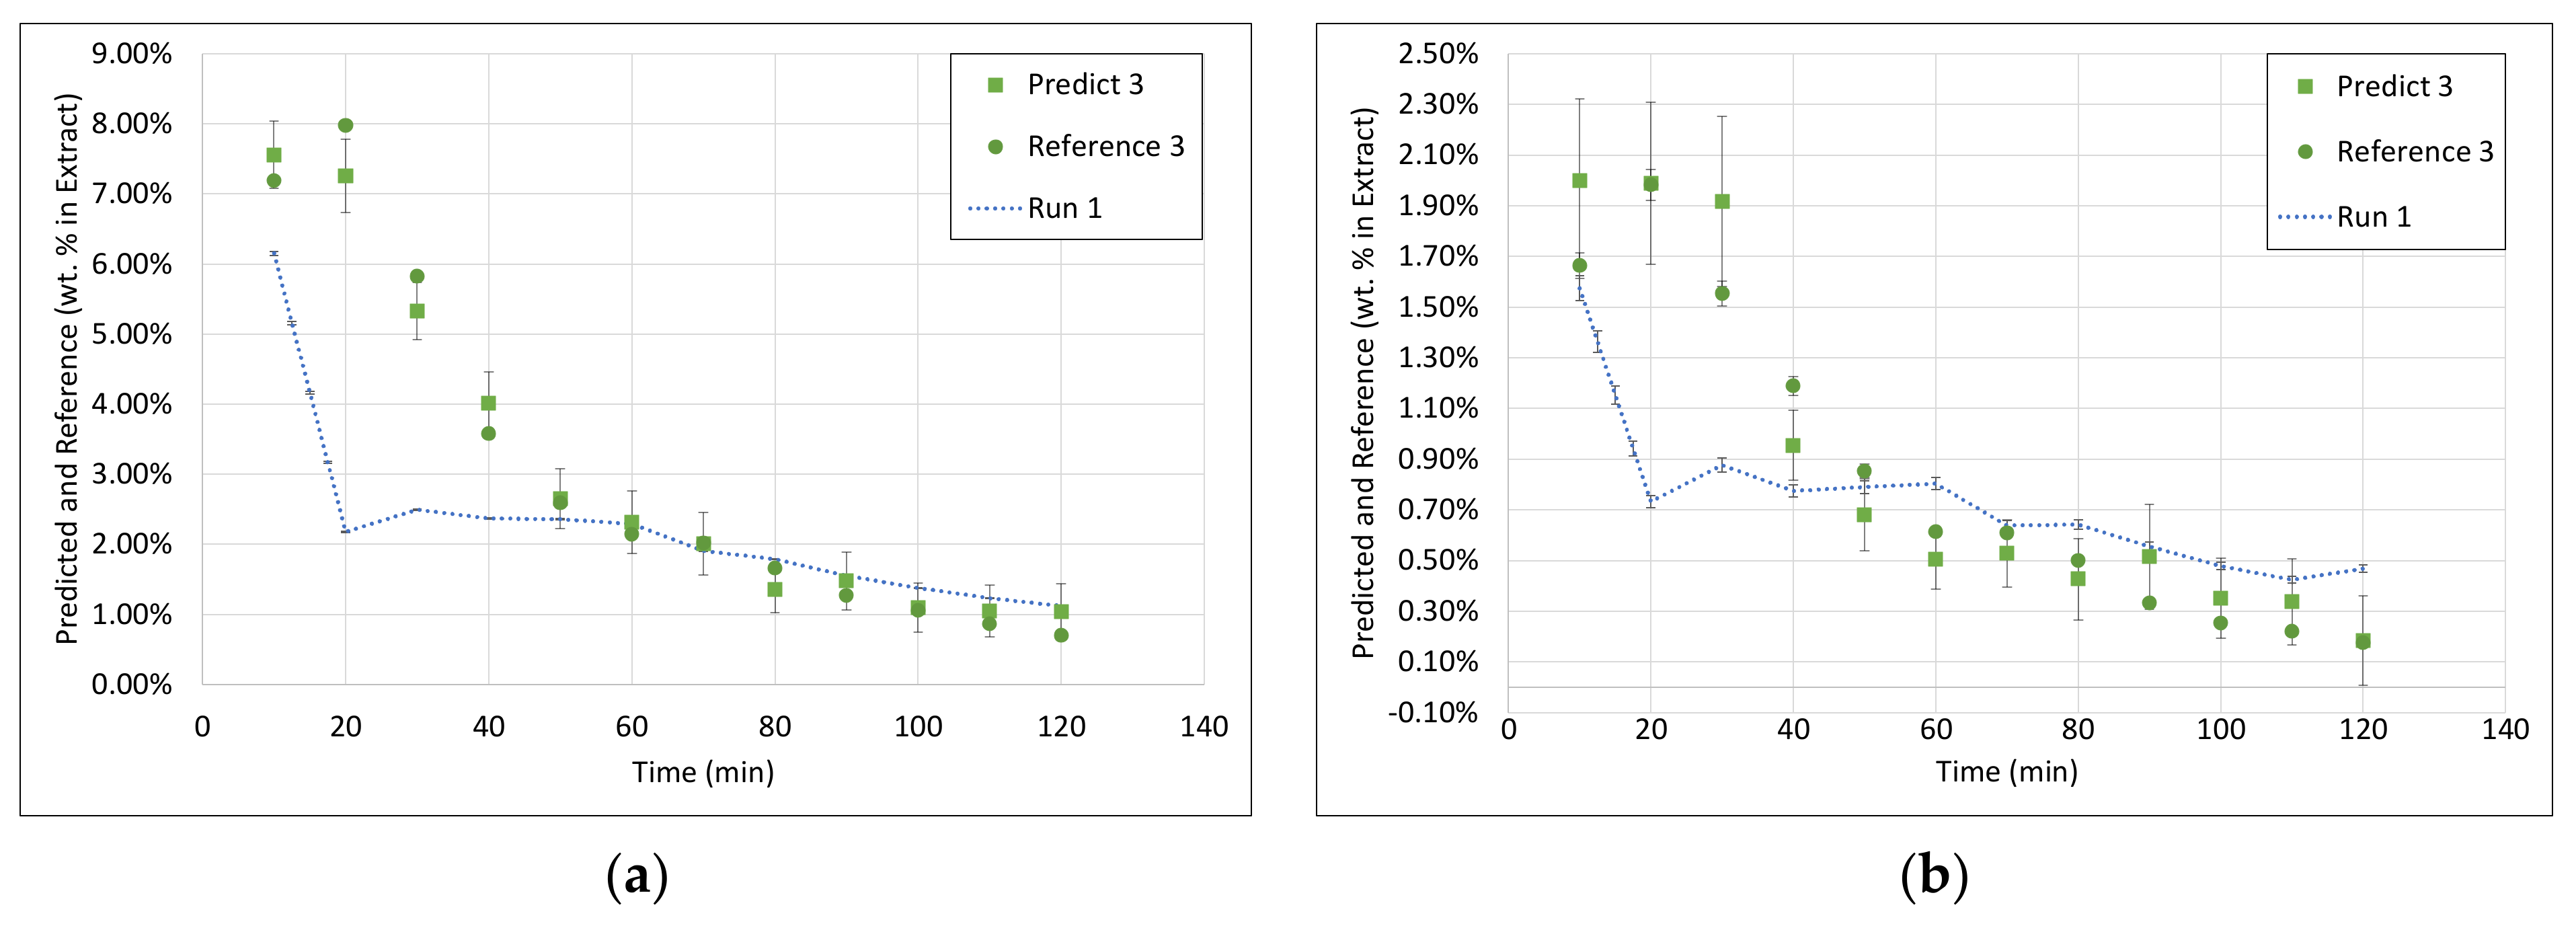
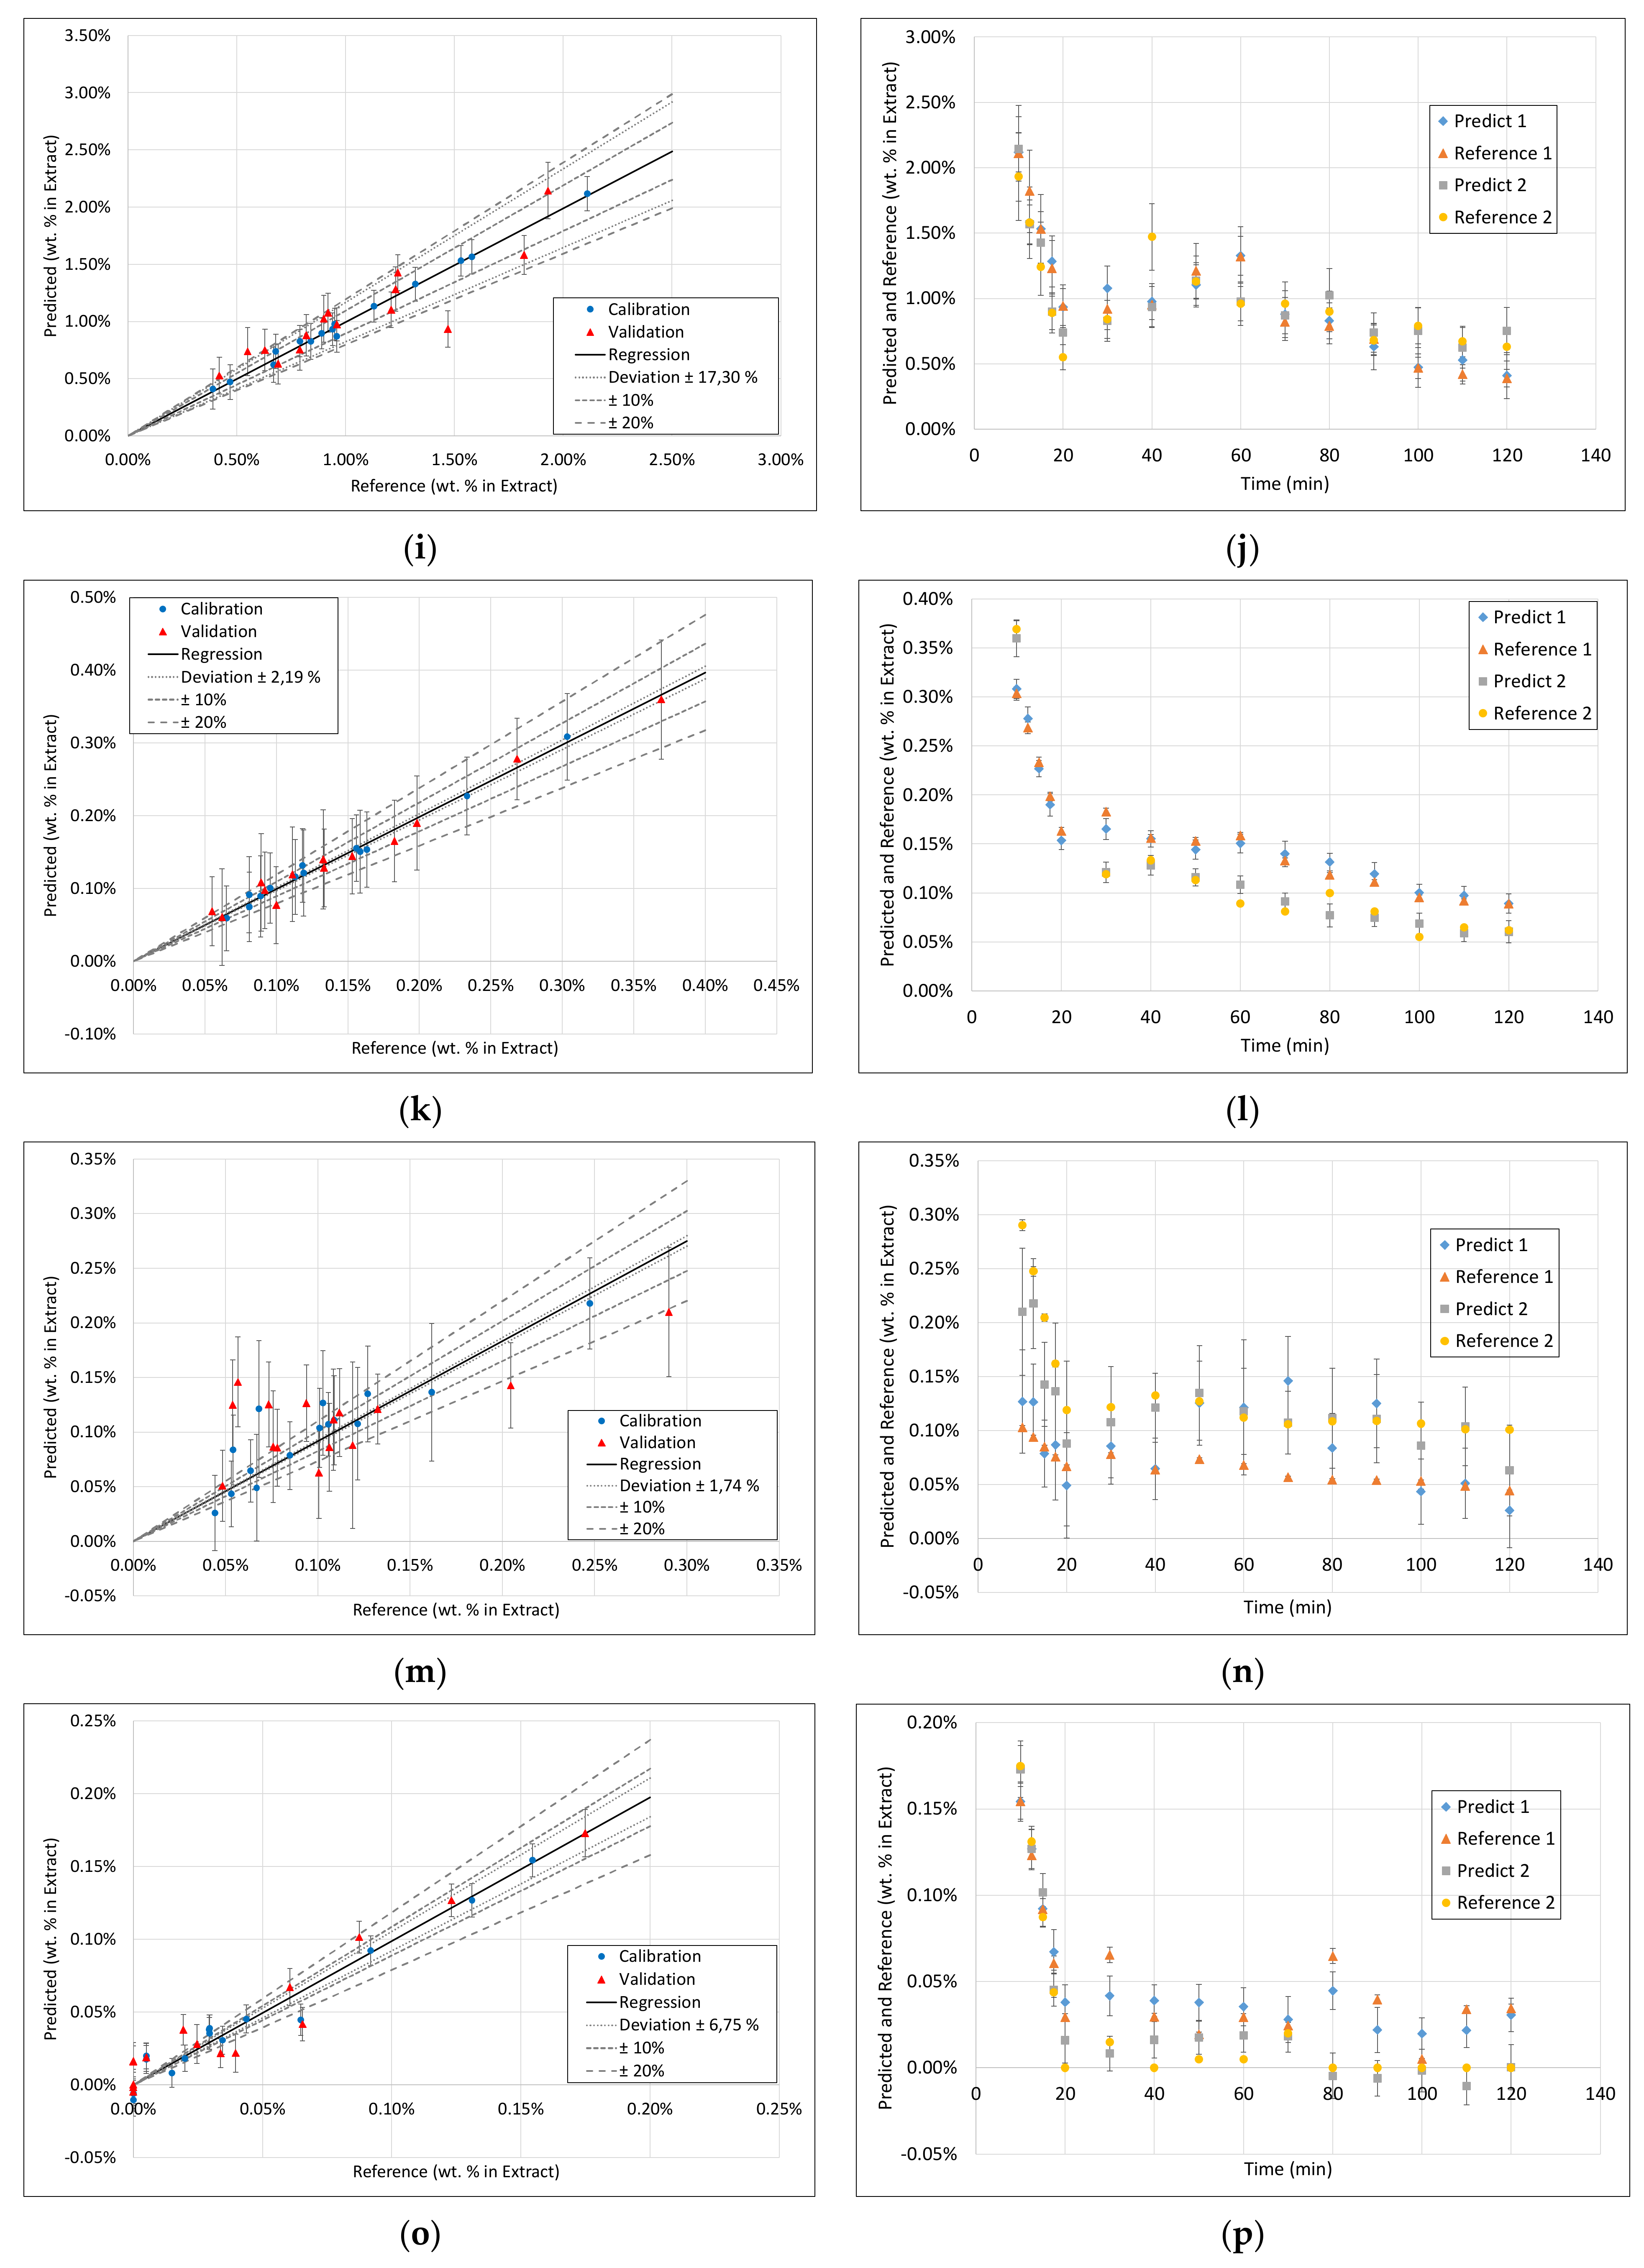
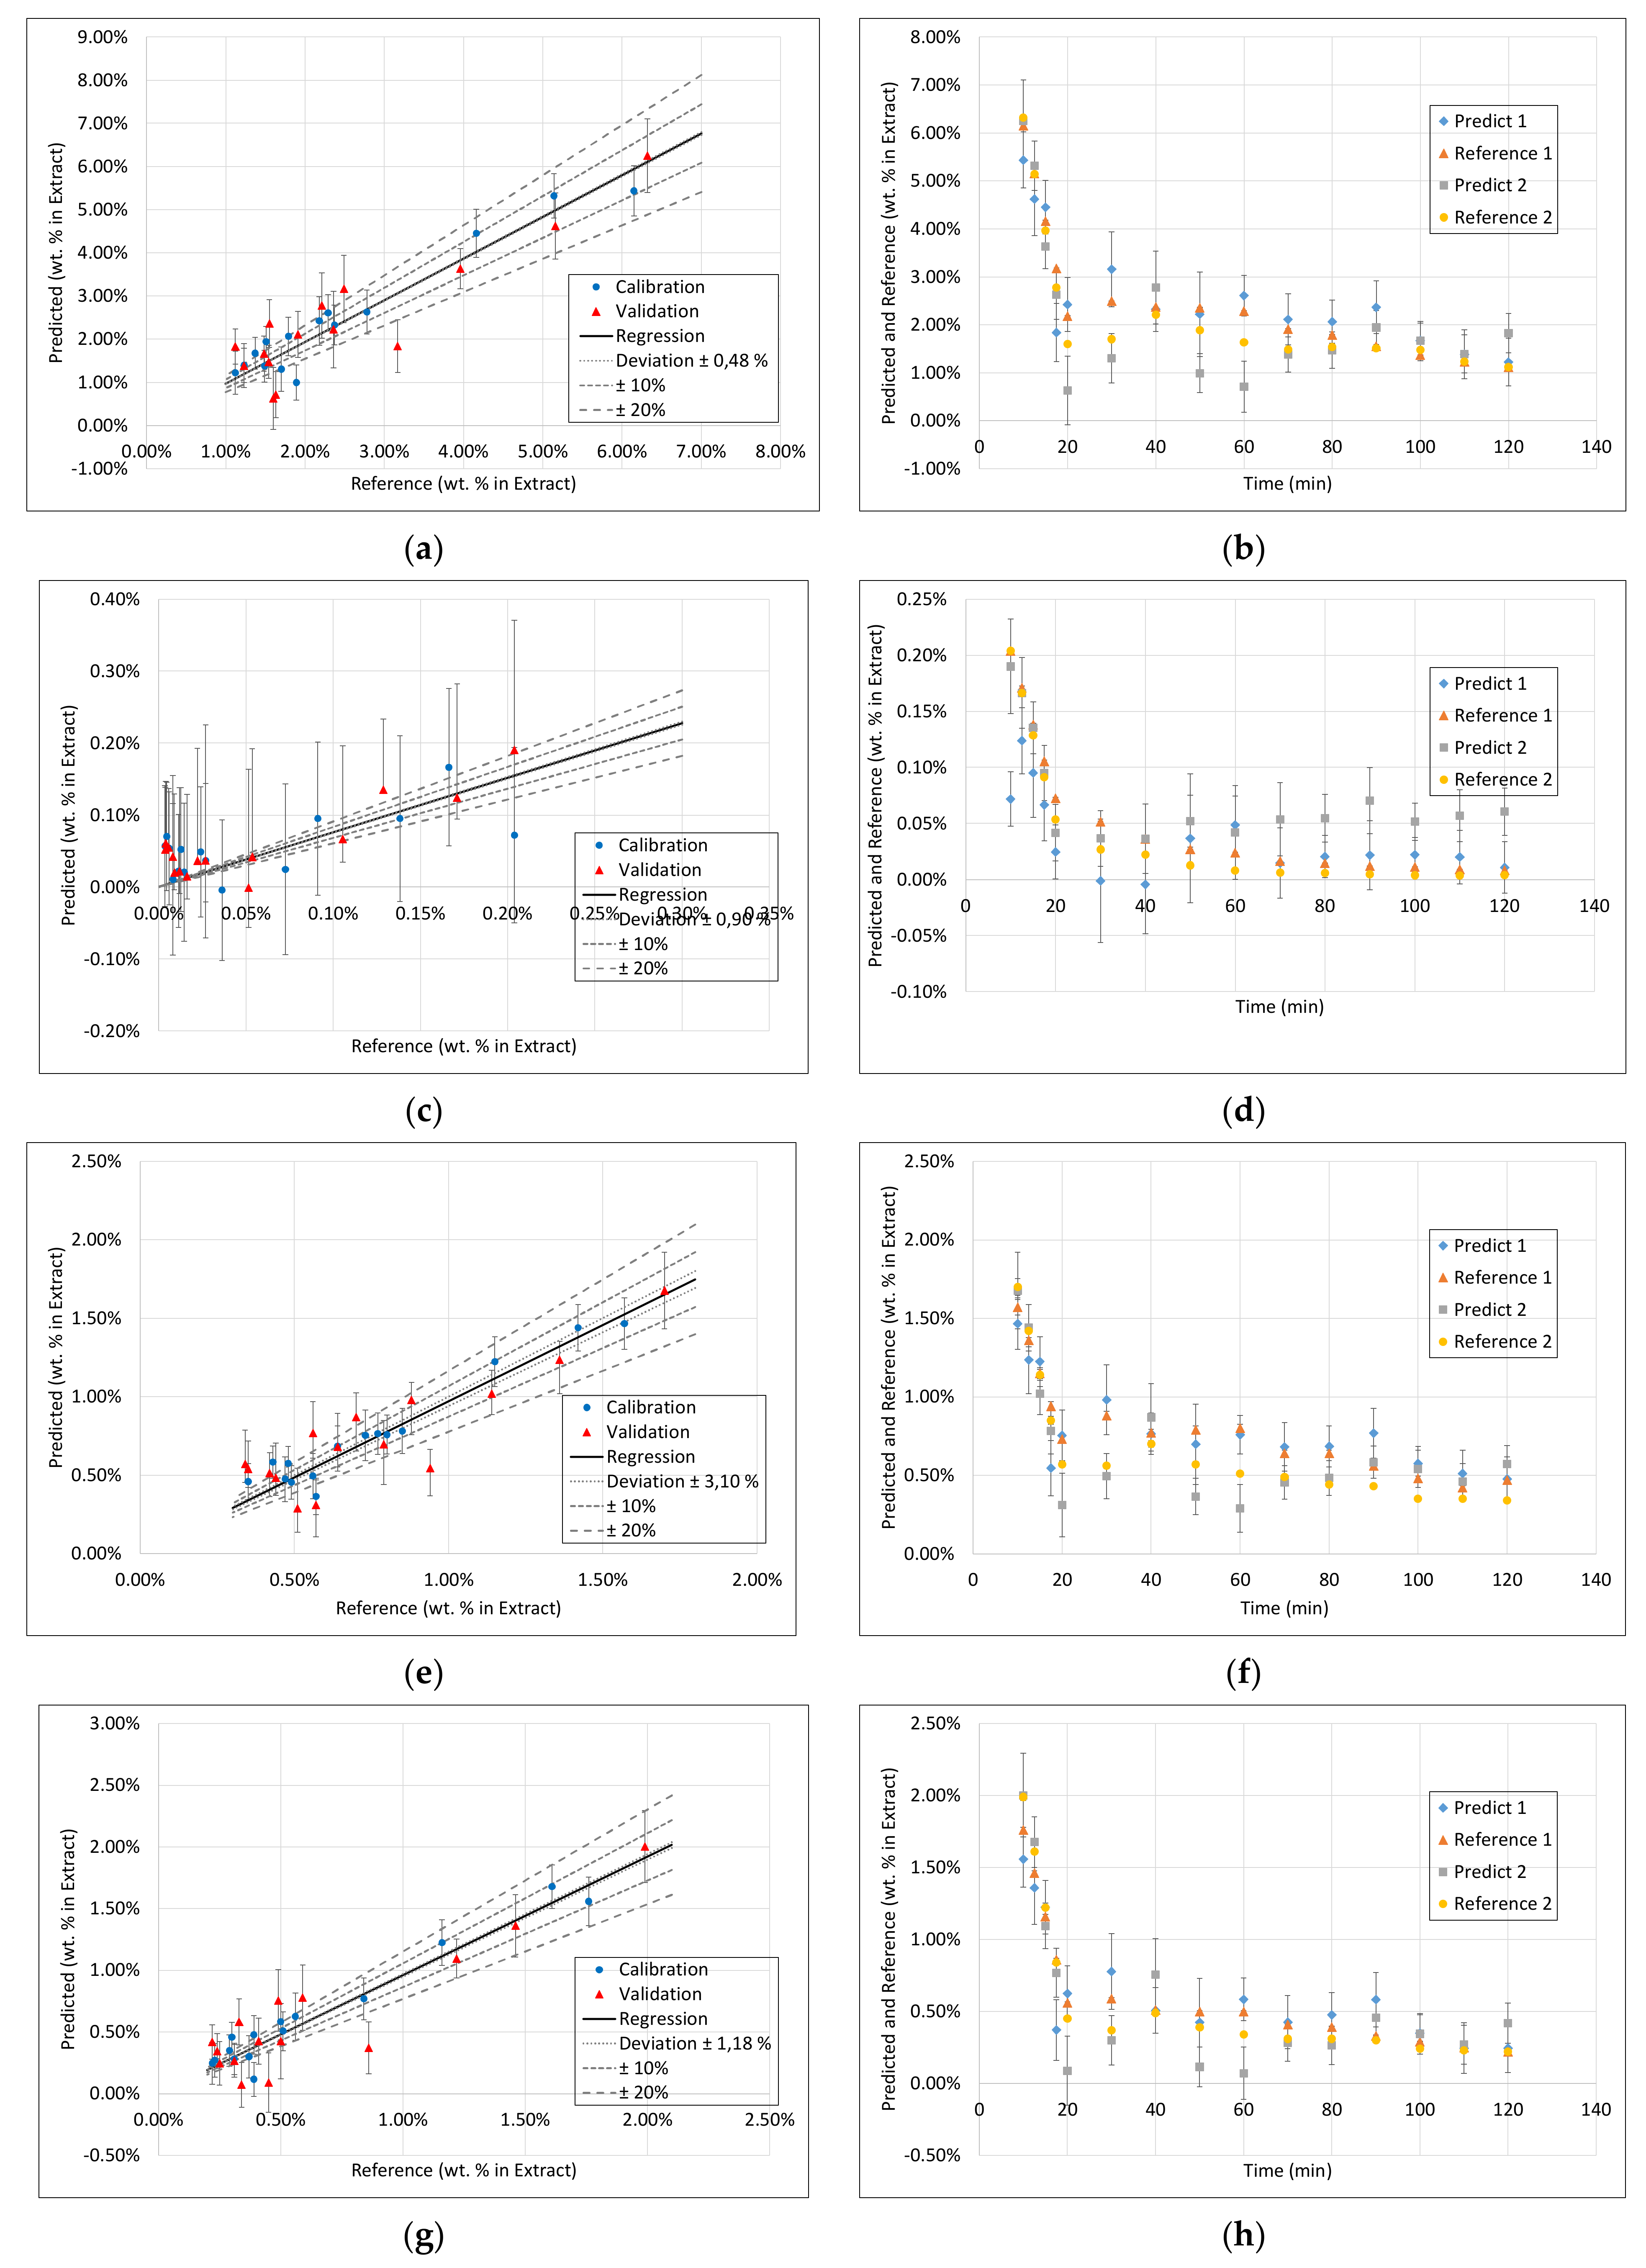
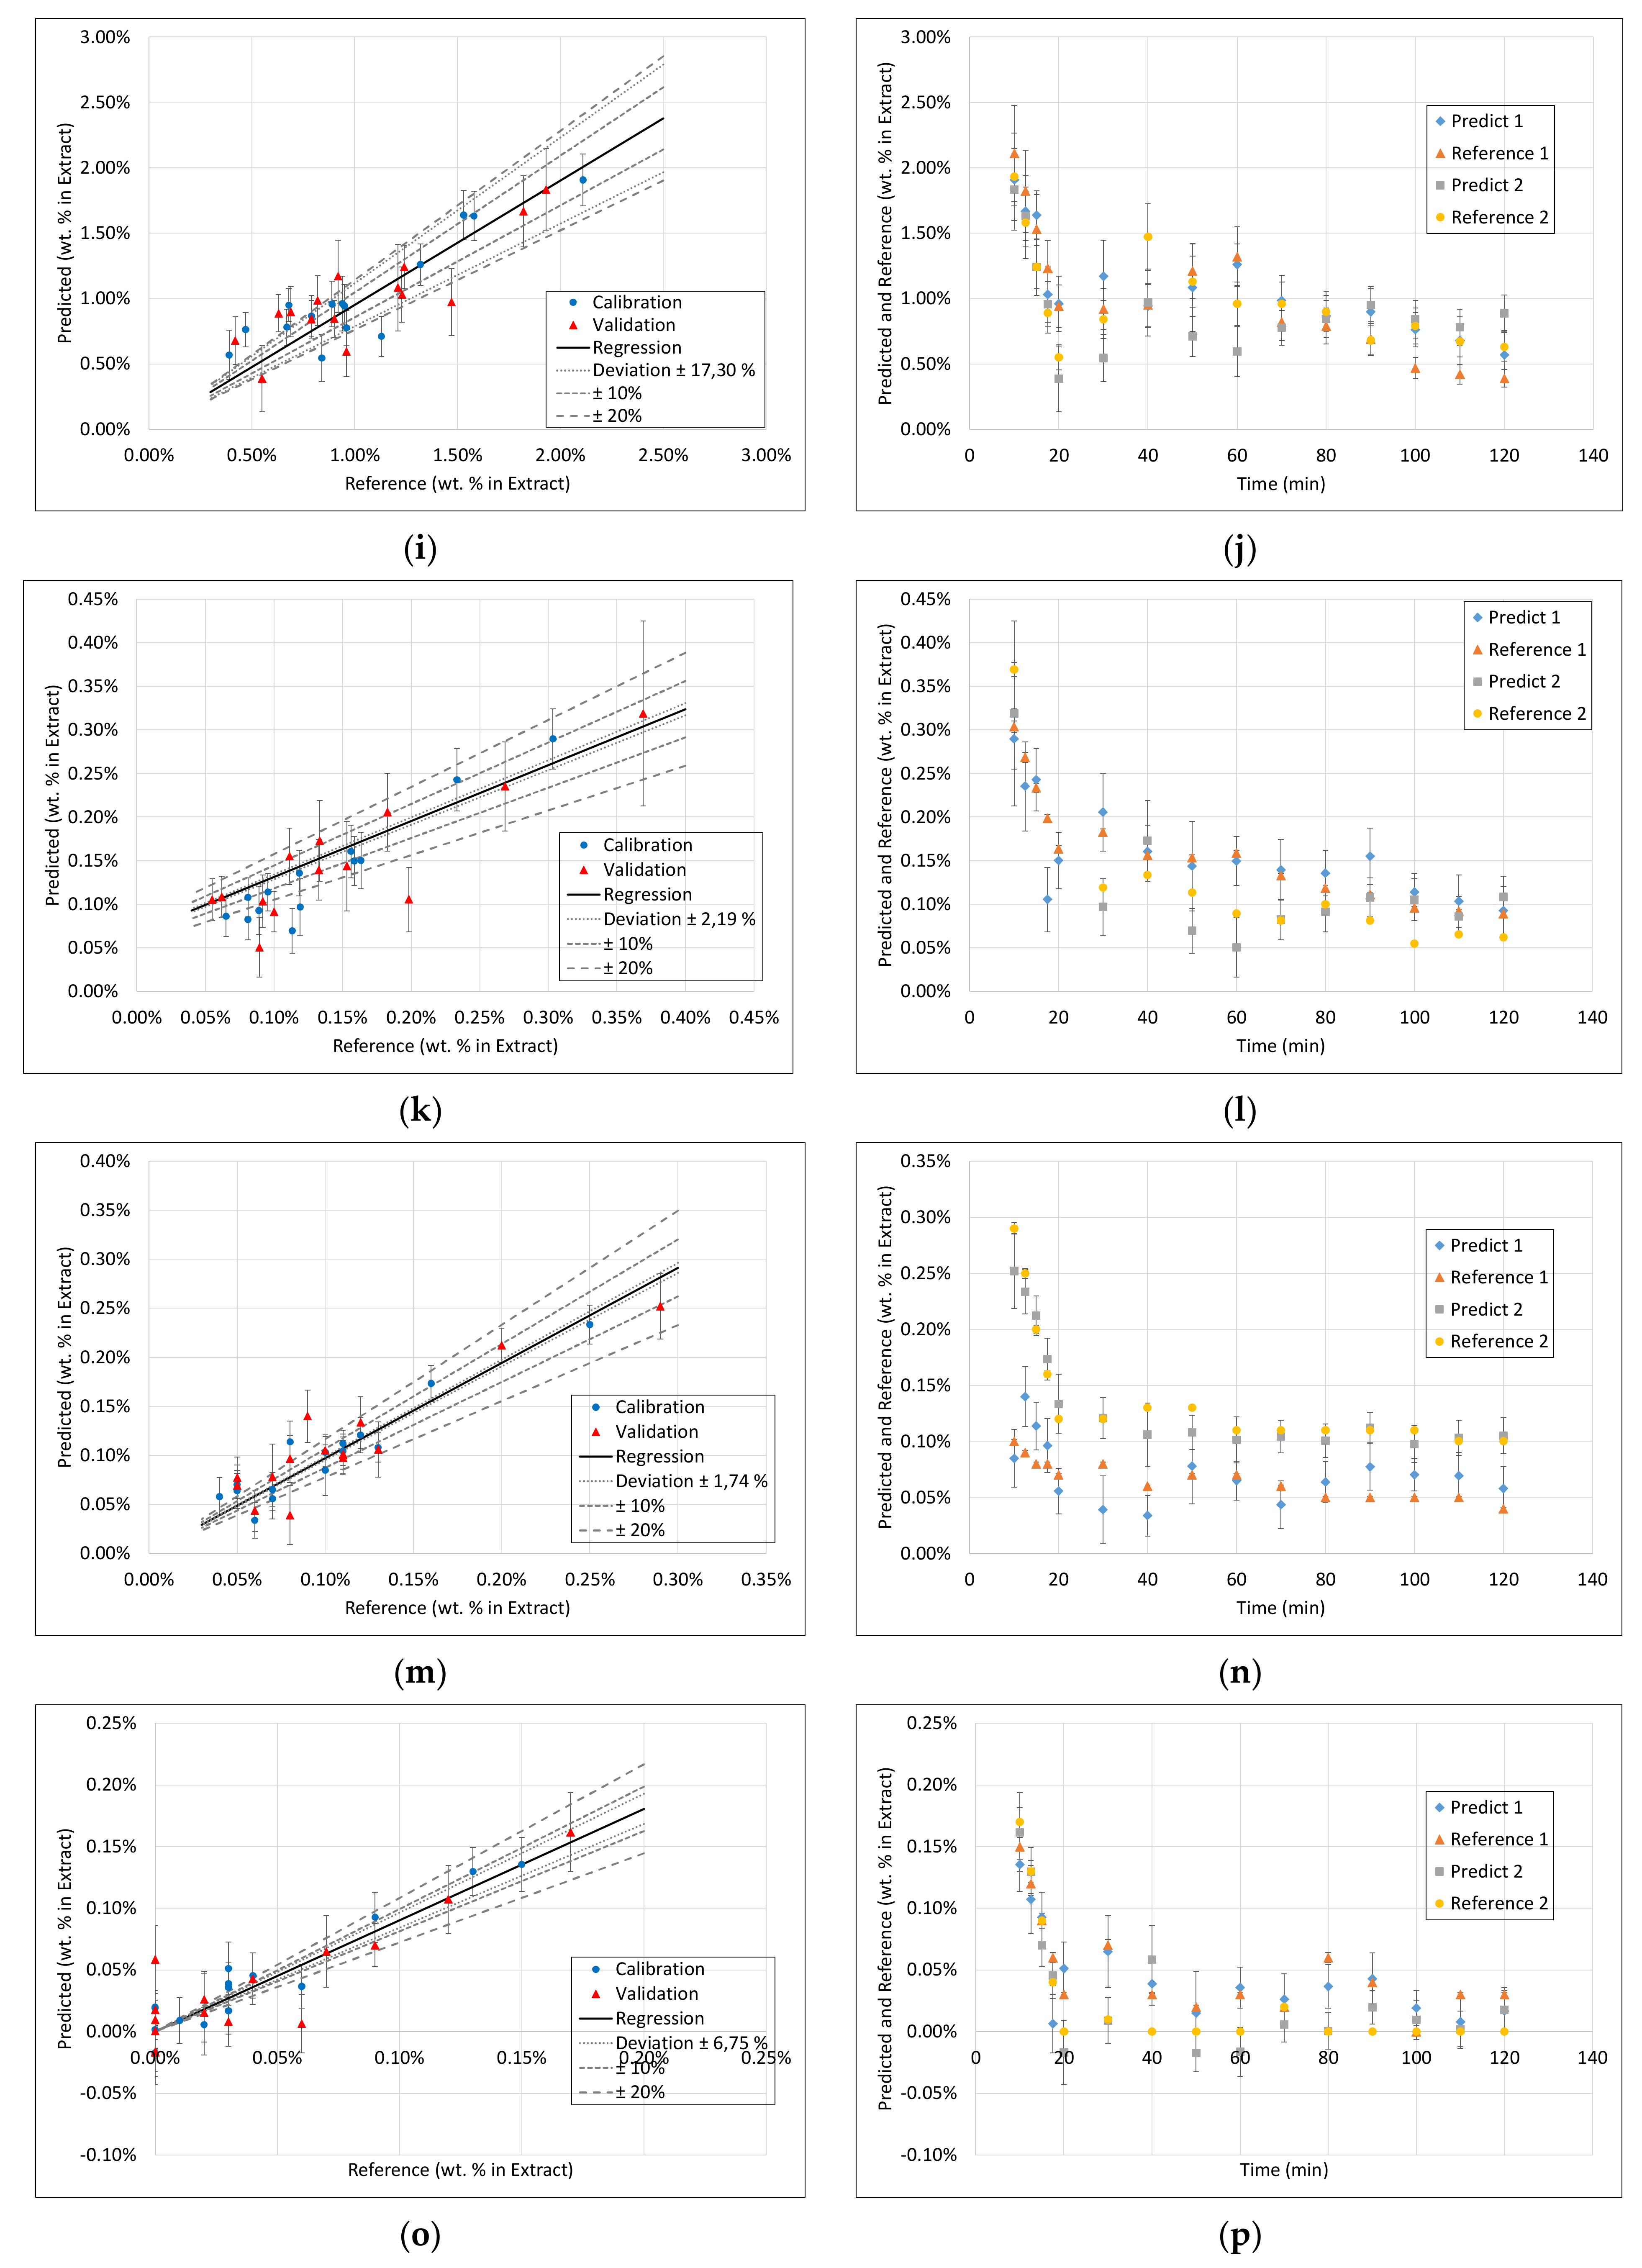
3.3. PLS Models
3.4. Application of PAT
4. Discussion
- 1.
- The first is that all the main component groups should be defined and quantified which cover the largest part of the entirety of ingredients.
- This hypothesis could be verified as the mass balance is closed sufficiently.
- ○
- In the first fraction with the highest reproducibility of offline analytics, the mass balance was closed with only 0.21% deviation.
- ○
- In the later fractions, the uncertainty regarding the mass balance increased, inter alia, because of less accurate results of offline analytics to about +/−5%.
- ○
- In particular, the accuracy of structural carbohydrates in later fractions had a relatively high uncertainty about +/−20% due to the analytical methods.
- With such a reliable offline basis and the data sets of two extraction runs, the next step was the elaboration of a process analytical technology concept for these component groups for online measurement.
- ○
- Based on the literature, in which different component groups or typical representatives of the regarding group are detected with one of the used spectroscopic methods, a concept was developed which links the components to a measurement method.
- ○
- In addition, the chemical structures and properties and detection mechanisms of the spectroscopic and sensoric PATs were considered here.
- 2.
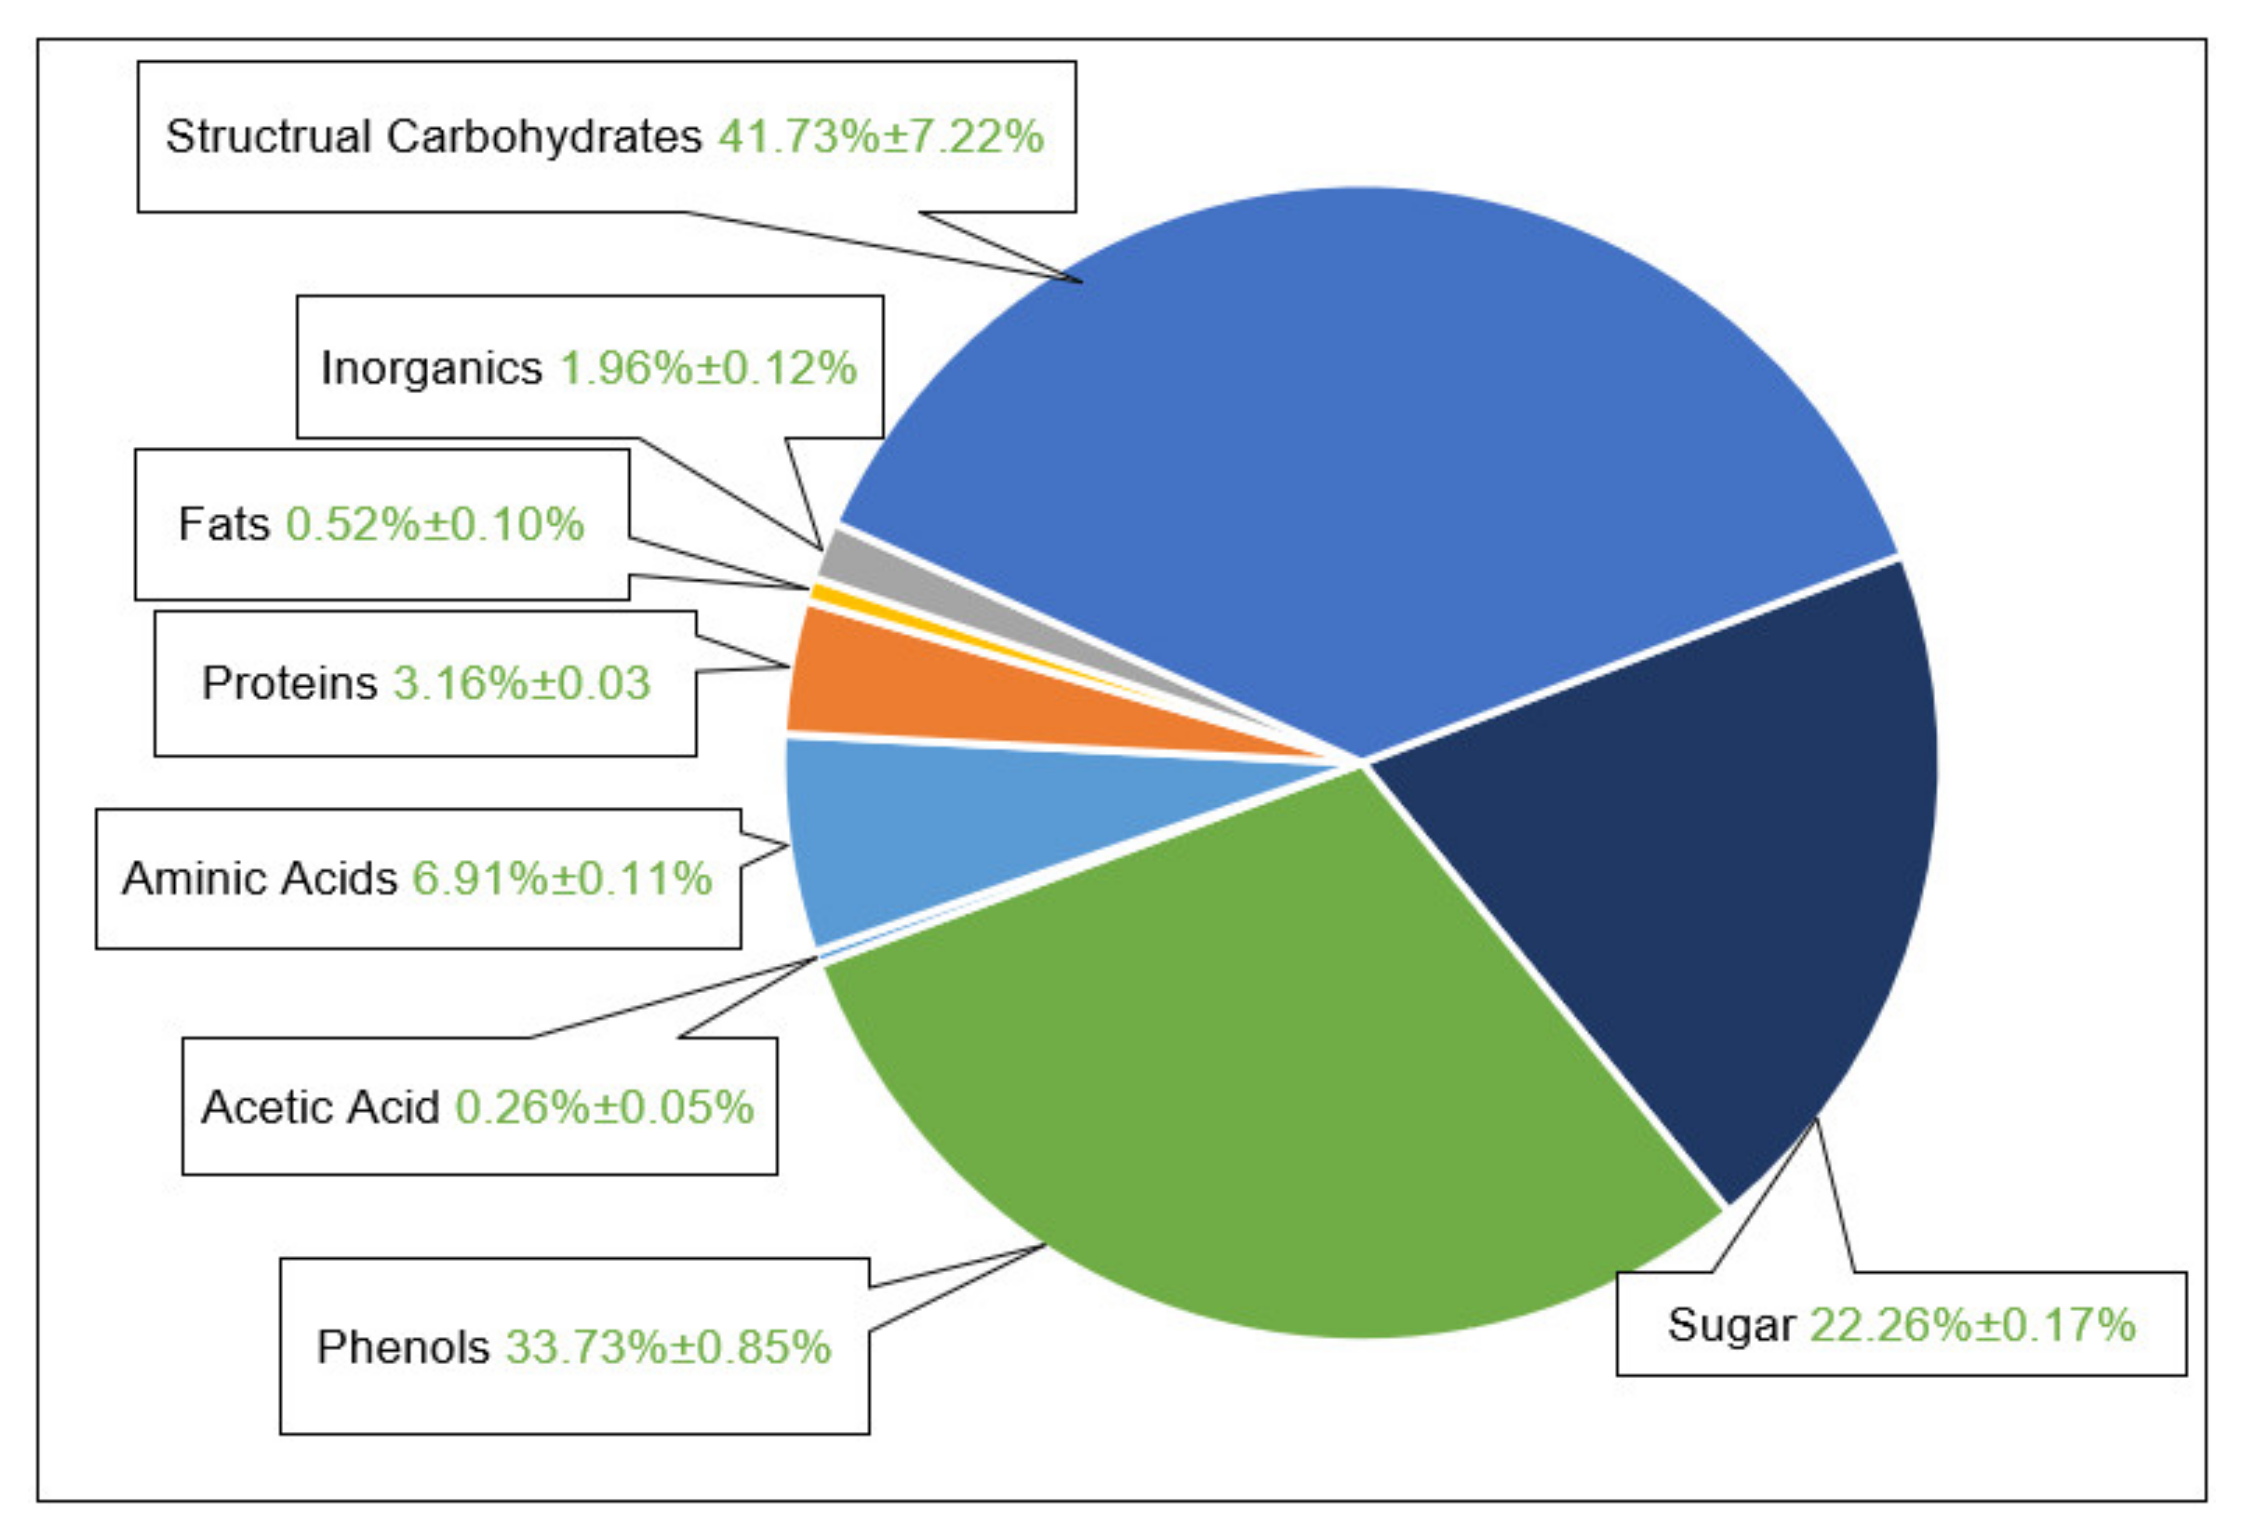
- As the second working hypothesis, it could be proven that main component groups could be defined and quantified. After conducting the analyses of the individual groups of substances, it turns out:
- a.
- That the largest part of the extract consists of structural carbohydrates and lignin with 43% of the extracted dry mass.
- b.
- The second group is formed by phenolic components with 34%
- c.
- and the third largest group is the sum of free sugars with a partition of 22% of extracted dry mass.
- d.
- The rest is made up of free aminic acids (7%), proteins (4%), inorganic components (2%), fats (0.5%), and acetic acid (0.3%).
- 3.
- Resulting of this concept, the third working hypothesis has been stated, that the combination of multiple spectroscopic methods such as FTIR and Raman with an additional insert of sensoric methods such as conductivity and turbidity would be necessary to distinguish between the proposed component groups.
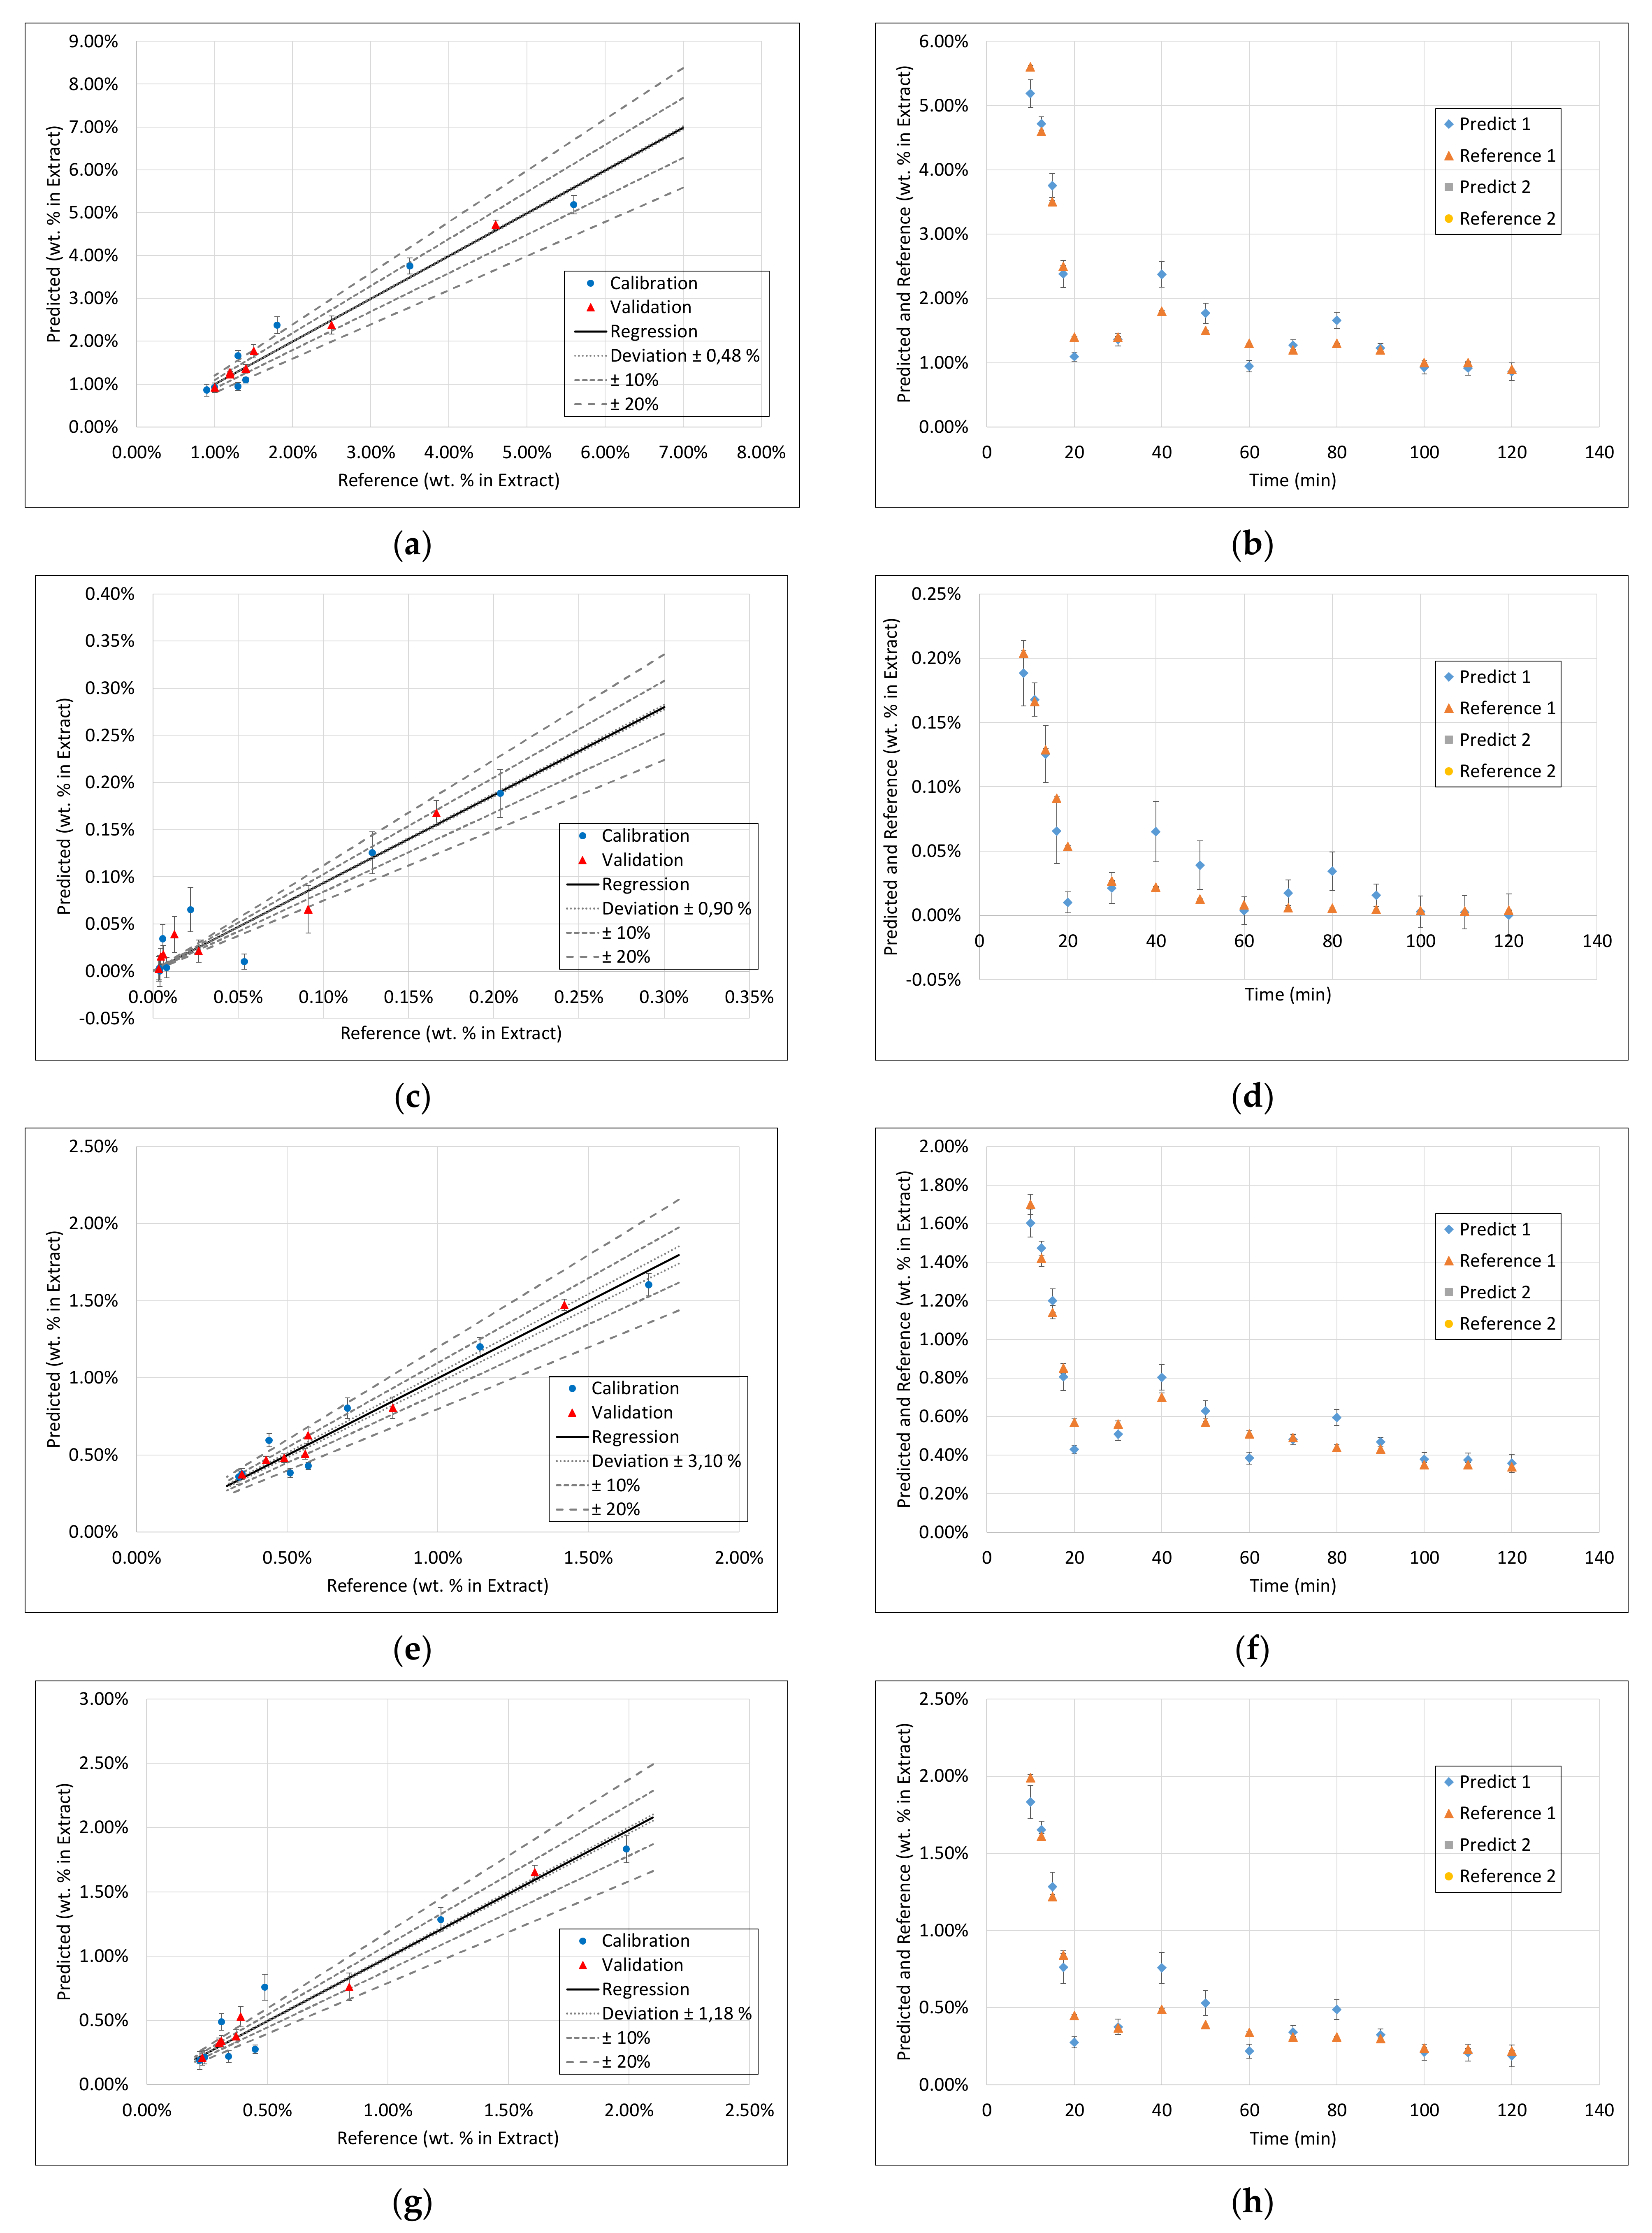
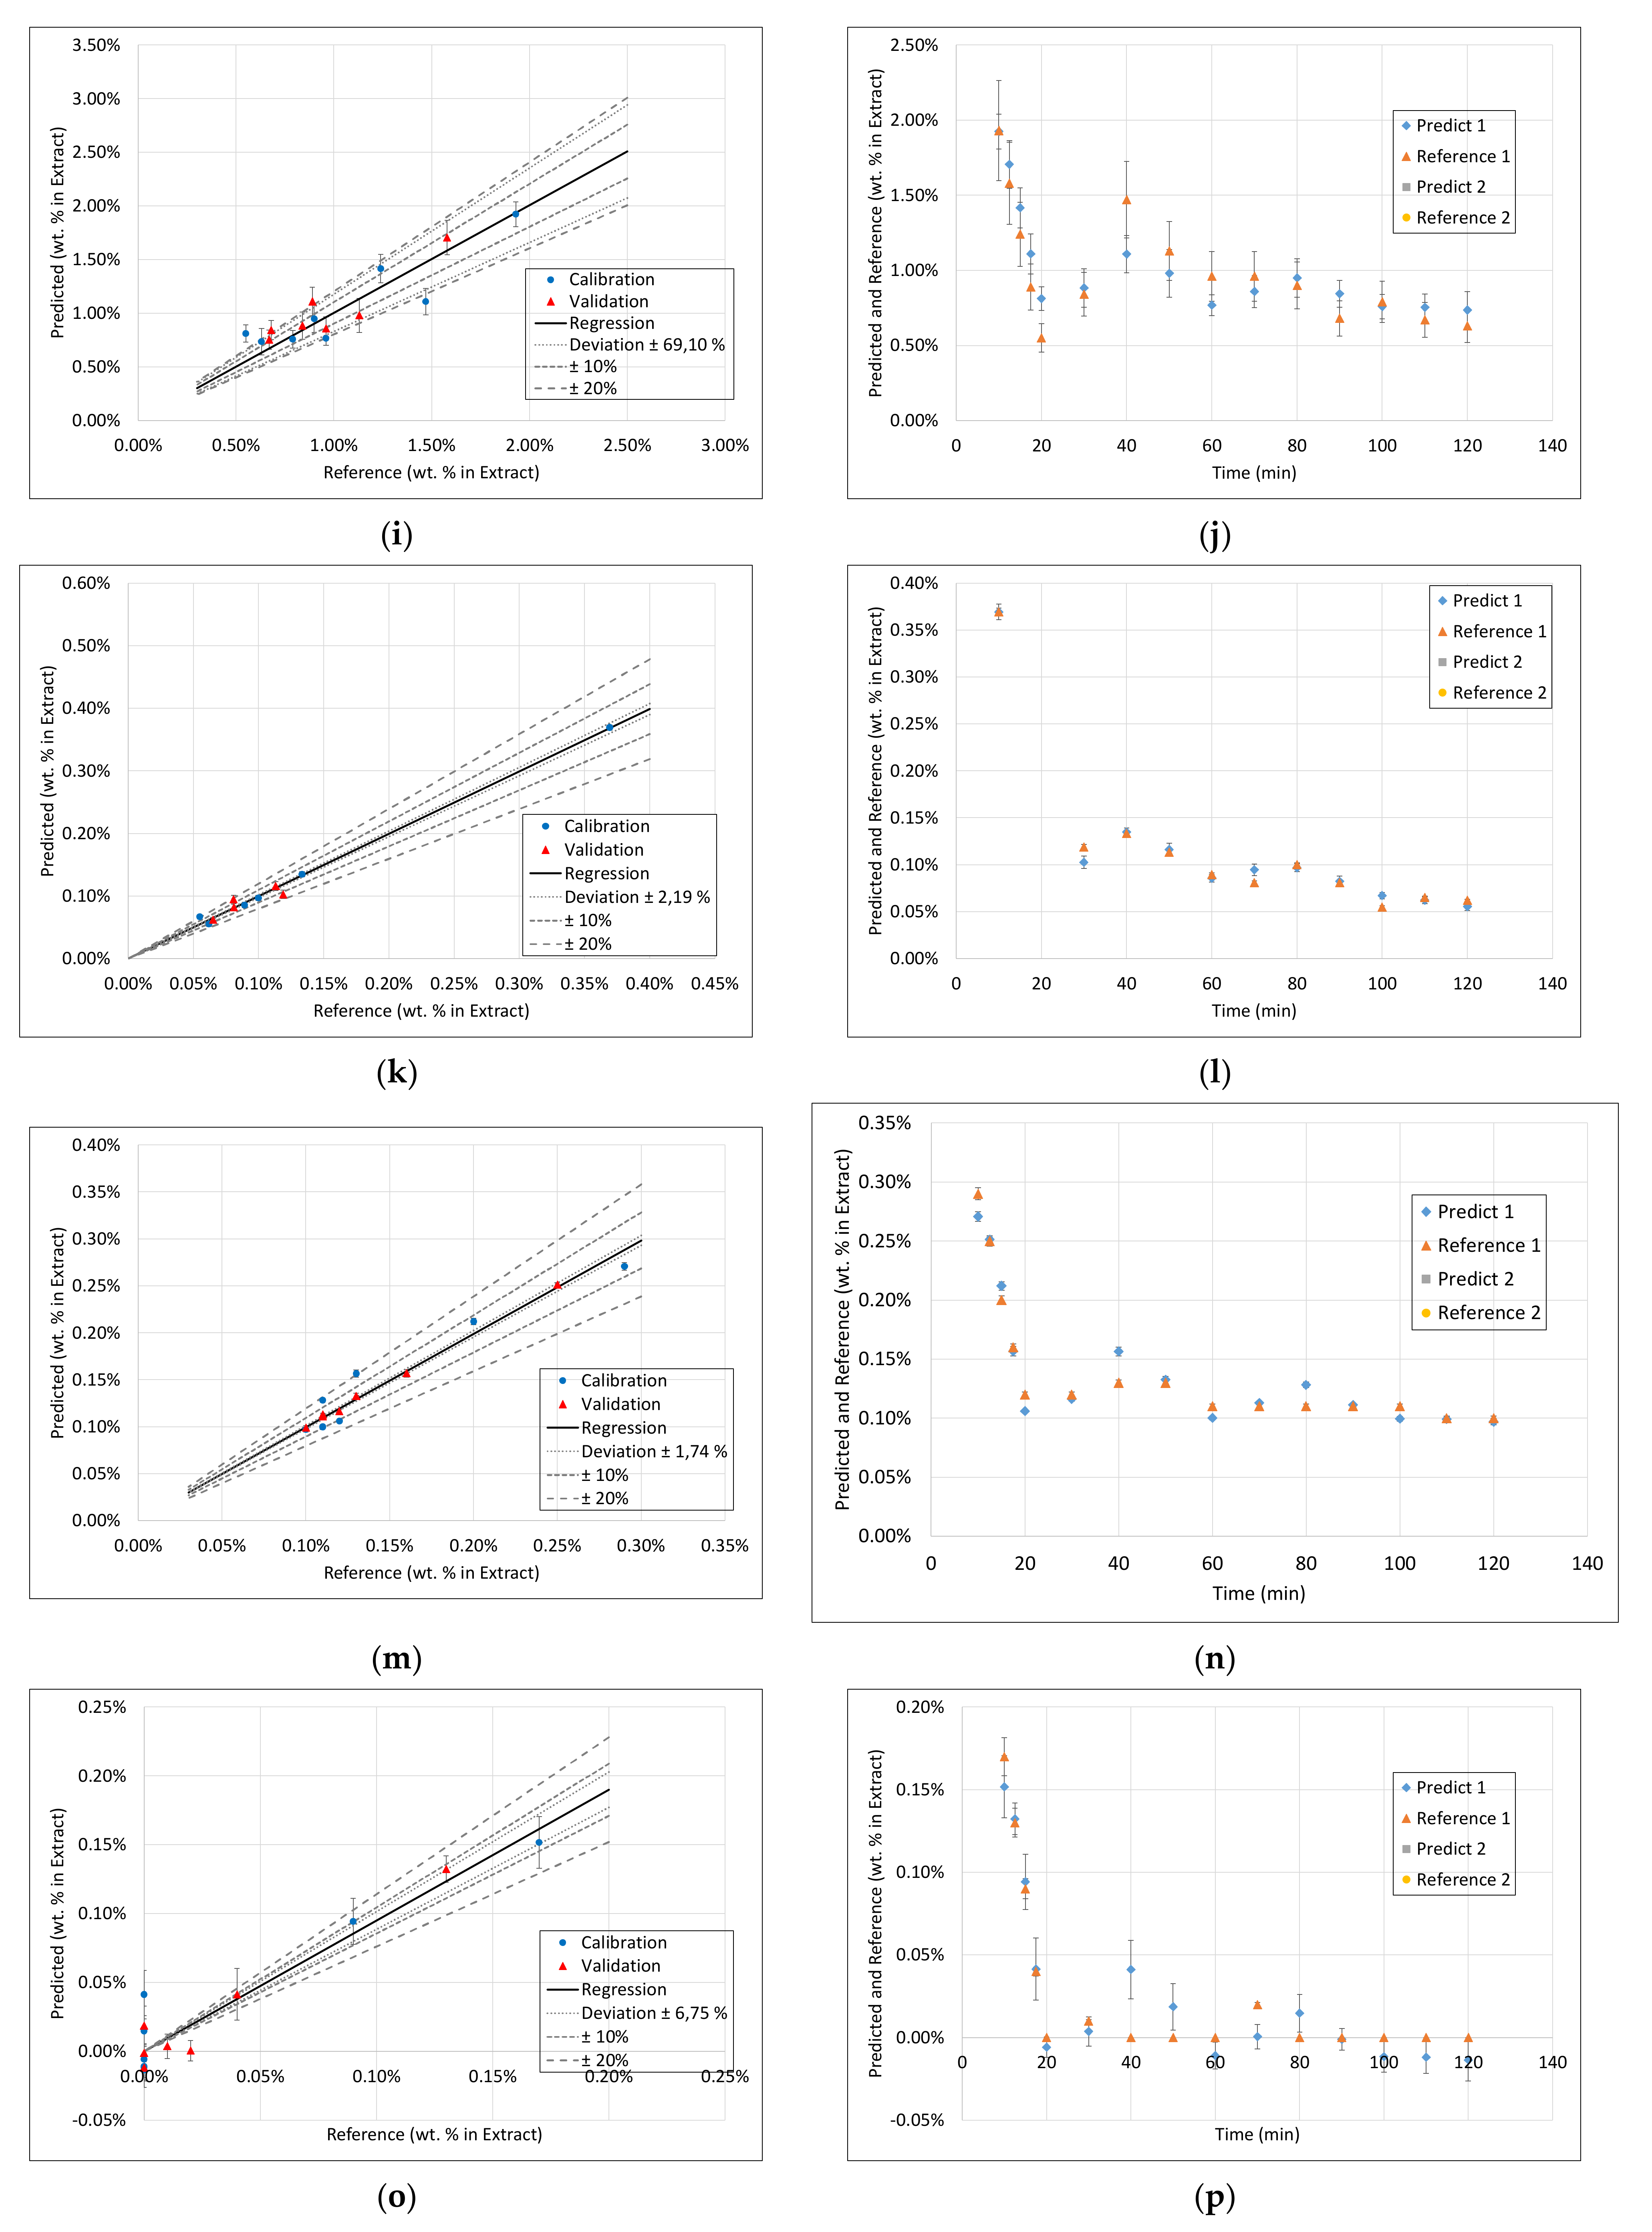
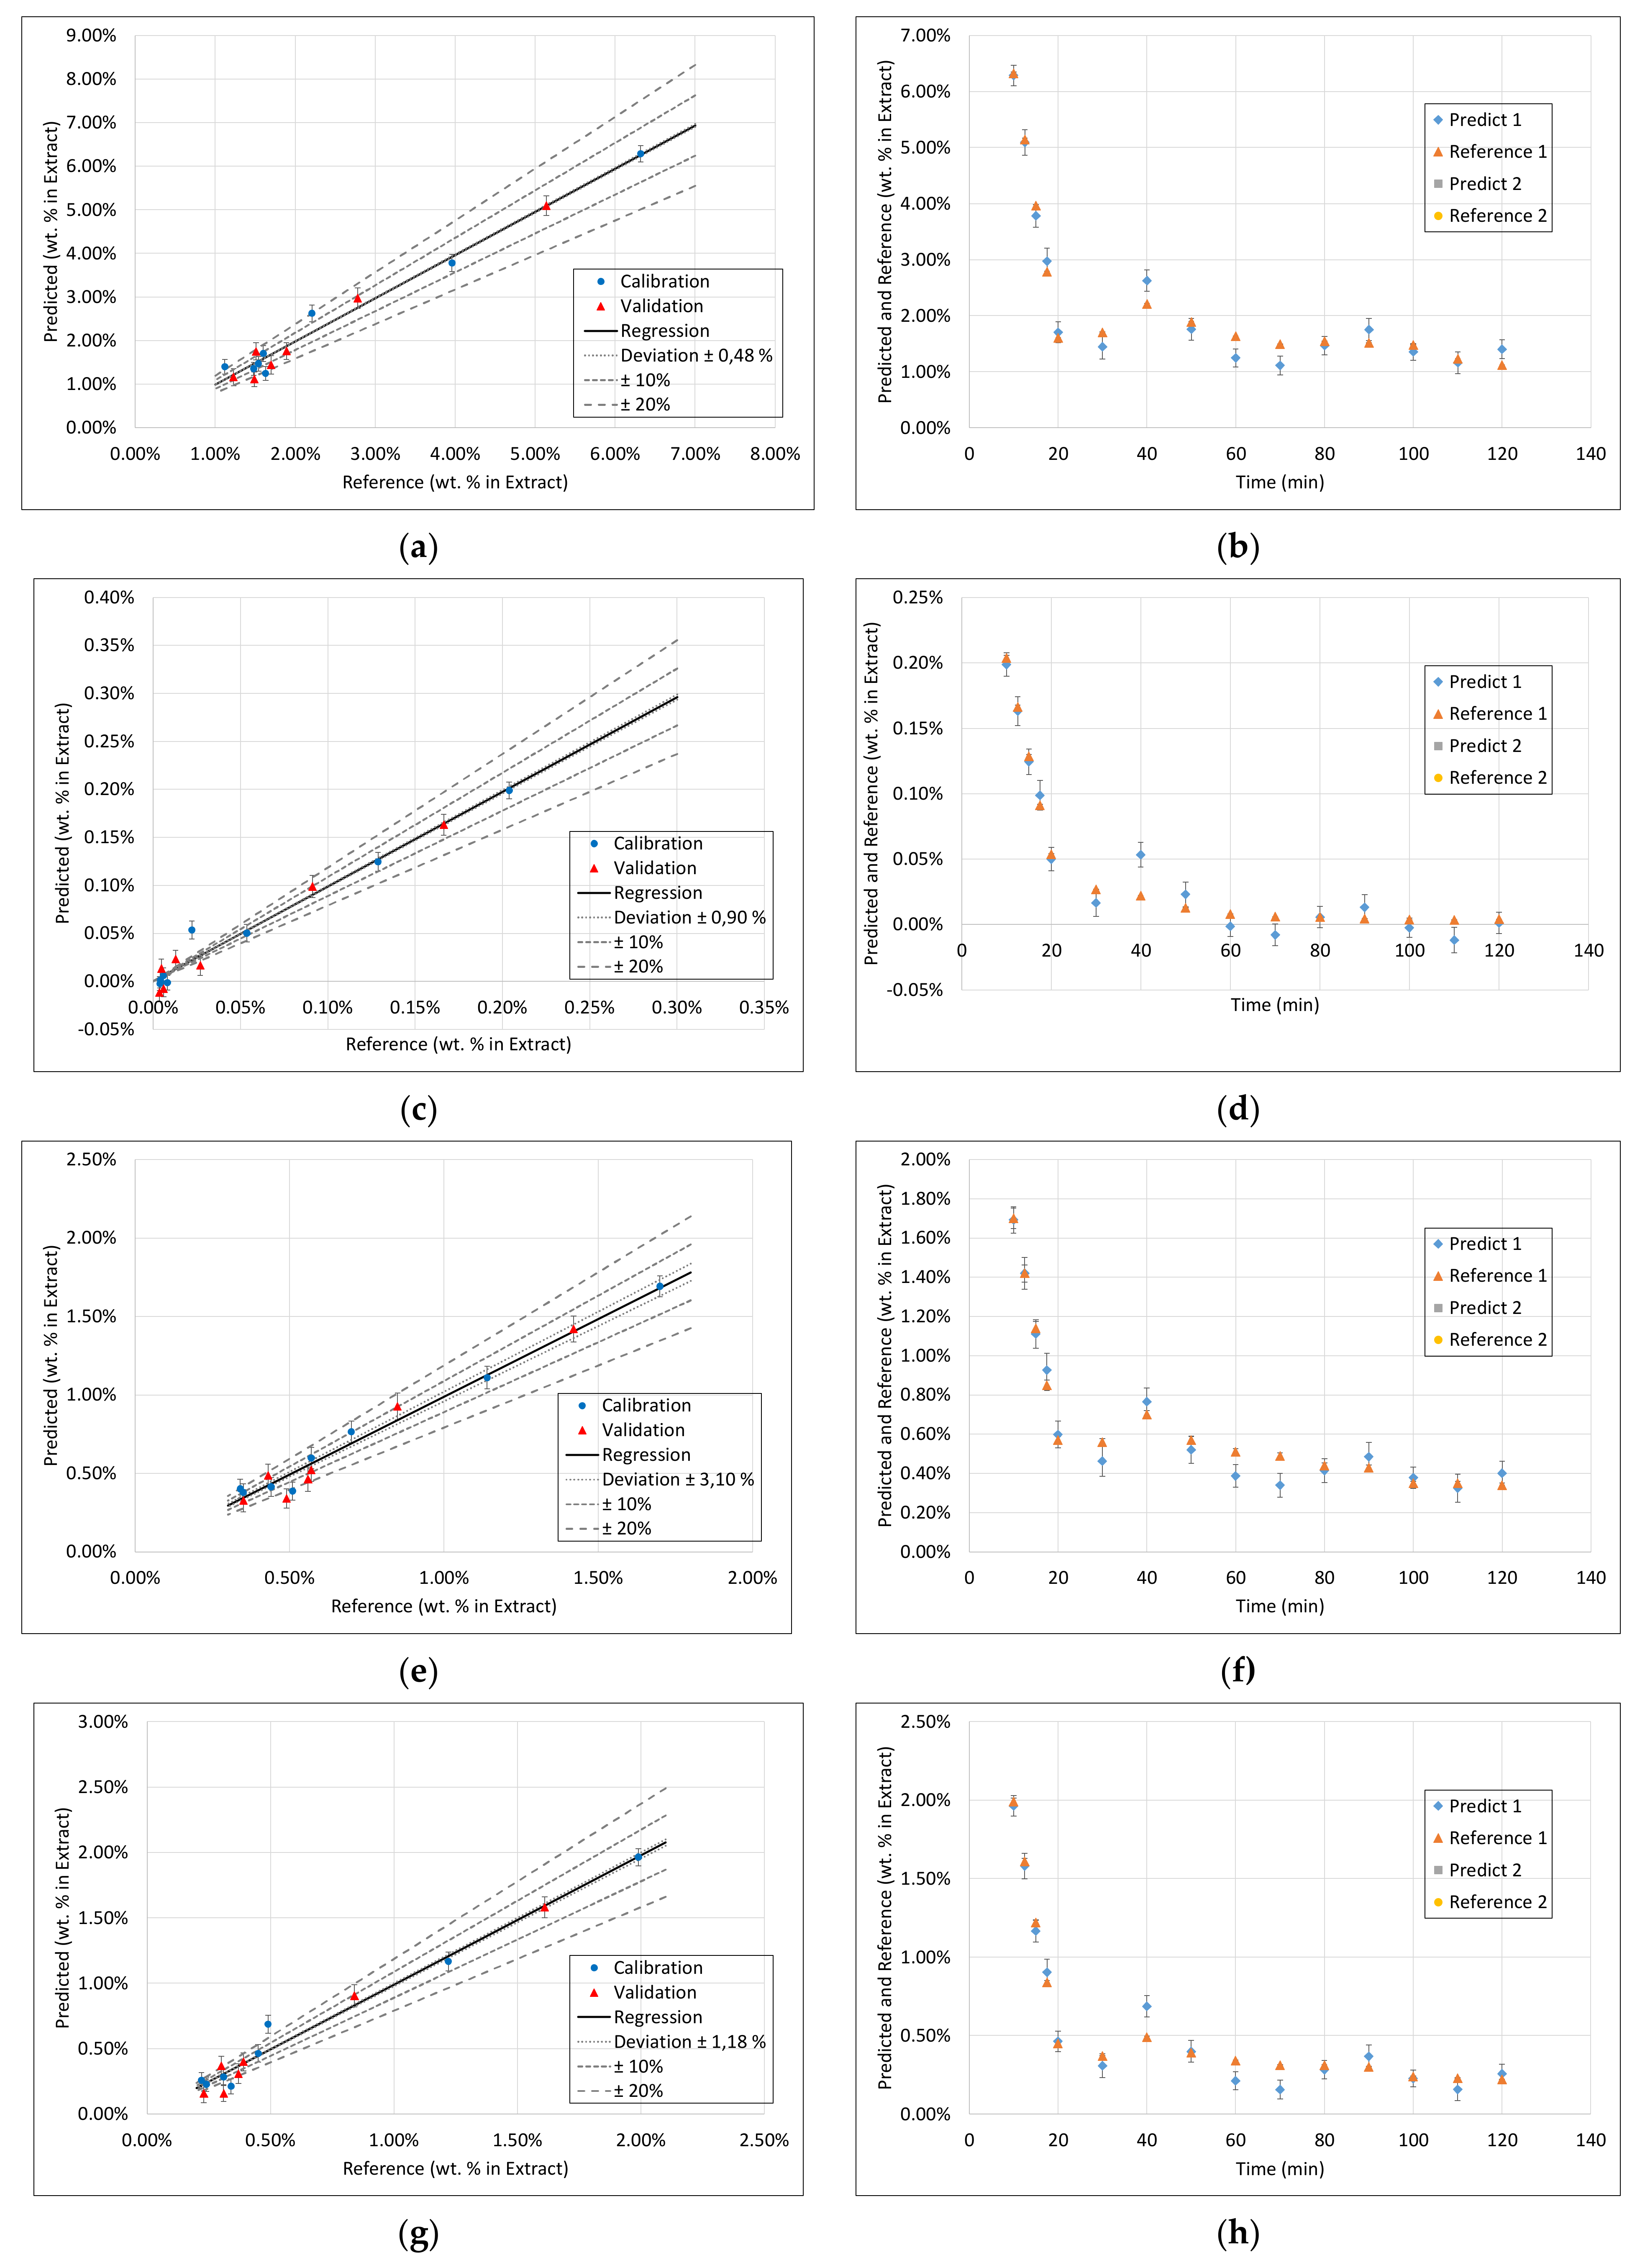
- Surprisingly, the FTIR alone shows enough variance in its spectra to be able to represent the slightly different extraction profiles of the different component groups (see 2. above) by itself. With R2 between 0.96 and 0.99 for calibration and validation of FTIR for each component group, FTIR reached the overall best results.
- ○
- During the establishment of PLS models, a combination of different spectra as well as spectra and sensoric data were researched. However, there was no benefit in predictability observed by combining these different measurement techniques.
- ○
- Accordingly, FTIR is the best candidate for a standalone solution for the quality-focused PAT, in which product quality and composition is determined.
- Within the field of turbidity, pH value, conductivity, and density, conductivity was the most promising technique.
- ○
- Here, one has to distinguish between different possibilities of implementation.
- ▪
- The conductivity in a control-focused PAT circuit can be either used for model-predicted process control or as a process abort criterion.
- ▪
- In both cases, a well-predicted dry residue would be sufficient because the extraction process can be well described by the dry residue and there is no possibility to shift the extract composition significantly by small adjustments of the process parameters.
- ○
- However, for a model-predicted control, the data set has to be increased to be able to describe the higher concentrated fractions with sufficiently higher accuracy.
- ▪
- However, nevertheless, as a process abort criterion, accurate prediction of medium to low concentrated fractions would be sufficient, which is already gained successfully at this point.
5. Conclusions
- Based on this study, conductivity will be used for the monitoring of dry residue as the deciding component group for the process control PAT.
- ○
- Based on the conductivity of the extract, the digital twin will evaluate the current process status and check, whether the extract lies within the permitted area of the design space.
- ○
- Based on this evaluation the decision, whether and how process parameters have to be adjusted or not, will be made based on the digital twins prediction.
- The FTIR spectra will be used to determine the composition of the extract regarding the component groups and can therefore be used as a method for quality assurance and post-process analytics.
- Once validated, such robust methods can then be extended to real-time release testing, which will be followed up by further studies.
Author Contributions
Funding
Institutional Review Board Statement
Informed Consent Statement
Data Availability Statement
Acknowledgments
Conflicts of Interest
Appendix A


References
- Borges, A.; Abreu, A.; Dias, C.; Saavedra, M.; Borges, F.; Simões, M. New Perspectives on the Use of Phytochemicals as an Emergent Strategy to Control Bacterial Infections Including Biofilms. Molecules 2016, 21, 877. [Google Scholar] [CrossRef] [PubMed]
- Leonel, M.; Sarmento, S.B.S.; Cereda, M.P. New starches for the food industry: Curcuma longa and Curcuma zedoaria. Carbohydr. Polym. 2003, 54, 385–388. [Google Scholar] [CrossRef]
- D’Antuono, M.; Carola, A.; Sena, L.S.; Linsalata, V.; Cardinali, A.; Logrieco, A.F.; Colucci, M.G.; Apone, F. Artichoke polyphenols produce skin anti-age effects by improving endothelial cell integrity and functionality. Molecules 2018, 23, 2729. [Google Scholar]
- Kleeberg, H. Method for the Production of Storage Stable Azadirachtin from Seed Kernels of the Neem Tree. U.S. Patent 5,695,763, 9 December 1997. [Google Scholar]
- Fraunhofer-Projektgruppe für Wertstoffkreisläufe und Ressourcenstrategie. Positionspapier zu Bioplastik. 2018. Available online: https://www.iwks.fraunhofer.de/de/presse-und-medien/pressemeldungen-2018/positionspapier-zu-bioplastik.html (accessed on 3 December 2018).
- DECHEMA. Fortschrittliche Alternative Flüssig Brenn- und Kraftstoffe: Für Klimaschutz im Globalen Rohstoffwandel; DECHEMA: Frankfurt, Germany, 2017. [Google Scholar]
- Bundesministerium für Bildung und Forschung. Nationale Forschungsstrategie BioÖkonomie 2030; Herausgeber BMBF Referat Bioökonomie: Bonn/Berlin, Germany, 2010.
- Ditz, R.; Gerard, D.; Hagels, H.; Igl, N.; Schäffler, M.; Schulz, H.; Stürtz, M.; Tegtmeier, M.; Treutwein, J.; Strube, J.; et al. Position Paper of European Working Group on „Phytoextracts—Products and Processes“: Proposal towards a New Comprehensive Research Focus; DECHEMA: Frankfurt am Main, Germany, 2016. [Google Scholar]
- Uhlenbrock, L.; Jensch, C.; Tegtmeier, M.; Strube, J. Digital Twin for Extraction Process Design and Operation. Processes 2020, 8, 866. [Google Scholar] [CrossRef]
- Uhlenbrock, L.; Sixt, M.; Strube, J. Quality-by-Design (QbD) process evaluation for phytopharmaceuticals on the example of 10-deacetylbaccatin III from yew. Resour. Effic. Technol. 2017, 3, 137–143. [Google Scholar] [CrossRef]
- ICH Expert Working Group. Pharmaceutical Developement Q8(R2): ICH Harmonised Tripartite Guideline; ICH: Geneva, Switzerland, 2009. [Google Scholar]
- ICH Expert Working Group. Riskmanagement (Q9): ICH Harmonised Tripartite Guideline; ICH: Geneva, Switzerland, 2005. [Google Scholar]
- ICH Expert Working Group. Pharmaceutical Quality System (Q10): ICH Harmonised Tripartite Guideline; ICH: Geneva, Switzerland, 2008. [Google Scholar]
- Sixt, M.; Strube, J. Systematic and Model-Assisted Evaluation of Solvent Based- or Pressurized Hot Water Extraction for the Extraction of Artemisinin from Artemisia annua L. Processes 2017, 5, 86. [Google Scholar] [CrossRef] [Green Version]
- Sixt, M.; Strube, J. Systematic Design and Evaluation of an Extraction Process for Traditionally Used Herbal Medicine on the Example of Hawthorn (Crataegus monogyna JACQ.). Processes 2018, 6, 73. [Google Scholar] [CrossRef] [Green Version]
- Sixt, M.; Uhlenbrock, L.; Strube, J. Toward a Distinct and Quantitative Validation Method for Predictive Process Modelling—On the Example of Solid-Liquid Extraction Processes of Complex Plant Extracts. Processes 2018, 6, 66. [Google Scholar] [CrossRef] [Green Version]
- Roth, T.; Uhlenbrock, L.; Strube, J. Distinct and Quantitative Validation for Predictive Process Modelling in Steam Distillation of Caraway Fruits and Lavender Flower Following a Quality-By-Design (QbD) Approach. Processes 2020, 8, 594. [Google Scholar] [CrossRef]
- Uhlenbrock, L. Quality-by-Design zur Systematischen Entwicklung von Wertschöpfungsprozessen Pflanzlicher Rohstoffe. Ph.D. Thesis, TU Clausthal, Clausthal, Germany, 2021. [Google Scholar]
- Zobel-Roos, S.; Schmidt, A.; Uhlenbrock, L.; Ditz, R.; Köster, D.; Strube, J. Digital Twins in Biomanufacturing. Adv. Biochem. Eng. Biotechnol. 2021, 176, 181–262. [Google Scholar] [CrossRef]
- Sixt, M.; Gudi, G.; Schulz, H.; Strube, J. In-line Raman spectroscopy and advanced process control for the extraction of anethole and fenchone from fennel (Foeniculum vulgare L. MILL.). C. R. Chim. 2018, 21, 97–103. [Google Scholar] [CrossRef]
- DAB. Deutsches Arzneibuch; Deutscher Apotheker Verlag: Stuttgart, Germany, 2017. [Google Scholar]
- Williams, S. Official Methods of Analysis of the Association of Official Analytical Chemists, 14th ed.; Association of Official Analytical Chemists: Arlington, VA, USA, 1984. [Google Scholar]
- Sluiter, A.; Hames, B.; Ruiz, R.; Scarlata, C.; Sluiter, J.; Templeton, D.; Crocker, D. Determination of Structural Carbohydrates and Lignin in Biomass: Laboratory Analytical Procedure (LAP); Battelle: Columbus, OH, USA, 2005. [Google Scholar]
- Baranska, M.; Roman, M.; Dobrowolski, J.C.; Schulz, H.; Baranski, R. Recent Advances in Raman Analysis of Plants: Alkaloids, Carotenoids, and Polyacetylenes. CAC 2012, 9, 108–127. [Google Scholar] [CrossRef]
- Gierlinger, N.; Schwanninger, M. The potential of Raman microscopy and Raman imaging in plant research. Spectroscopy 2007, 21, 69–89. [Google Scholar] [CrossRef] [Green Version]
- Holser, R.A. Principal Component Analysis of Phenolic Acid Spectra. ISRN Spectrosc. 2012, 2012, 1–5. [Google Scholar] [CrossRef]
- Jović, O.; Habinovec, I.; Galić, N.; Andrašec, M. Maceration of Extra Virgin Olive Oil with Common Aromatic Plants Using Ultrasound-Assisted Extraction: An UV-Vis Spectroscopic Investigation. J. Spectrosc. 2018, 2018, 1–9. [Google Scholar] [CrossRef] [Green Version]
- Mehrotra, R. Infrared Spectroscopy, Gas Chromatography/Infrared in Food Analysis. In Encyclopedia of Analytical Chemistry; Meyers, R.A., Ed.; John Wiley & Sons, Ltd: Chichester, UK, 2006; p. 177. ISBN 9780470027318. [Google Scholar]
- Moldenhauer, M.; Sluchanko, N.N.; Buhrke, D.; Zlenko, D.V.; Tavraz, N.N.; Schmitt, F.-J.; Hildebrandt, P.; Maksimov, E.G.; Friedrich, T. Assembly of photoactive Orange Carotenoid Protein from its domains unravels a carotenoid shuttle mechanism. Photosynth. Res. 2017, 133, 327–341. [Google Scholar] [CrossRef] [PubMed]
- Rys, M.; Szaleniec, M.; Skoczowski, A.; Stawoska, I.; Janeczko, A. FT-Raman spectroscopy as a tool in evaluation the response of plants to drought stress. Open Chem. 2015, 13, 21. [Google Scholar] [CrossRef]
- Schulz, H.; Baranska, M. Identification and quantification of valuable plant substances by IR and Raman spectroscopy. Vib. Spectrosc. 2007, 43, 13–25. [Google Scholar] [CrossRef]
- Trivedi, M.K.; Dahryn Trivedi, A.B.; Khemraj Bairwa, H.S. Fourier Transform Infrared and Ultraviolet-Visible Spectroscopic Characterization of Biofield Treated Salicylic Acid and Sparfloxacin. Nat. Prod. Chem. Res. 2015, 3, 1–6. [Google Scholar] [CrossRef]
- Yuan, C.; Li, Y.; Li, Q.; Jin, R.; Ren, L. Purification of Tea Saponins and Evaluation of its Effect on Alcohol Dehydrogenase Activity. Open Life Sci. 2018, 13, 56–63. [Google Scholar] [CrossRef] [Green Version]
- Sixt, M.; Strube, J. Pressurized hot water extraction of 10-deacetylbaccatin III from yew for industrial application. Resour. Effic. Technol. 2017, 3, 177–186. [Google Scholar] [CrossRef]
- Plaza, M.; Turner, C. Pressurized hot water extraction of bioactives. TrAC Trends Anal. Chem. 2015, 71, 39–54. [Google Scholar] [CrossRef] [Green Version]
- Schmidt, A.; Uhlenbrock, L.; Strube, J. Technical Potential for Energy and GWP Reduction in Chemical–Pharmaceutical Industry in Germany and EU—Focused on Biologics and Botanicals Manufacturing. Processes 2020, 8, 818. [Google Scholar] [CrossRef]
- Sixt, M. Methoden zur Systematischen Gesamtprozessentwicklung und Prozessintensivierung von Extraktions- und Trennprozessen zur Gewinnung Pflanzlicher Wertkomponenten; Shaker Verlag: Aachen, Germany, 2018; ISBN 978-3-8440-6169-7. [Google Scholar]
- Uhlenbrock, L.; Sixt, M.; Tegtmeier, M.; Schulz, H.; Hagels, H.; Ditz, R.; Strube, J. Natural Products Extraction of the Future—Sustainable Manufacturing Solutions for Societal Needs. Processes 2018, 6, 177. [Google Scholar] [CrossRef] [Green Version]
- Bro, R. Exploratory study of sugar production using fluorescence spectroscopy and multi-way analysis. Chemom. Intell. Lab. Syst. 1999, 46, 133–147. [Google Scholar] [CrossRef]
- Chakraborty, R.; Berglund, K.A. Steady state fluorescence spectroscopy of pyranine as a trace extrinsic probe to study structure in aqueous sugar solutions. J. Cryst. Growth 1992, 125, 81–96. [Google Scholar] [CrossRef]
- Ghosh, N.; Verma, Y.; Majumder, S.K.; Gupta, P.K. A Fluorescence Spectroscopic Study of Honey and Cane Sugar Syrup. FSTR 2005, 11, 59–62. [Google Scholar] [CrossRef] [Green Version]
- Esbensen, K.; Swarbrick, B.; Westad, F.; Anderson, M.; Whitcomb, P. Multivariate Data Analysis: An introduction to Multivariate Analysis, Process Analytical Technology and Quality by Design, 6th ed.; CAMO Software AS: Magnolia, TX, USA, 2018. [Google Scholar]
- Dingermann, T.; Hiller, K.; Schneider, G.; Zündorf, I. Schneider Arzneidrogen, 5th ed.; Spektrum Akad. Verl.: Heidelberg, Germany, 2011; ISBN 978-3-8274-2765-6. [Google Scholar]
- Lohmann, L.J.; Strube, J. Process Analytical Technology for Precipitation Process Integration into Biologics Manufacturing towards Autonomous Operation—mAb Case Study. Processes 2021, 9, 488. [Google Scholar] [CrossRef]
- Vetter, F.L.; Zobel-Roos, S.; Strube, J. PAT for Continuous Chromatography Integrated into Continuous Manufacturing of Biologics towards Autonomous Operation. Processes 2021, 9, 472. [Google Scholar] [CrossRef]
- Rolinger, L.; Rüdt, M.; Diehm, J.; Chow-Hubbertz, J.; Heitmann, M.; Schleper, S.; Hubbuch, J. Multi-attribute PAT for UF/DF of Proteins-Monitoring Concentration, particle sizes, and Buffer Exchange. Anal. Bioanal. Chem. 2020, 412, 2123–2136. [Google Scholar] [CrossRef]
- Rolinger, L.; Rüdt, M.; Hubbuch, J. A critical review of recent trends, and a future perspective of optical spectroscopy as PAT in biopharmaceutical downstream processing. Anal. Bioanal. Chem. 2020, 412, 2047–2064. [Google Scholar] [CrossRef] [PubMed] [Green Version]
- Thakur, G.; Thori, S.; Rathore, A.S. Implementing PAT for single-pass tangential flow ultrafiltration for continuous manufacturing of monoclonal antibodies. J. Membr. Sci. 2020, 613, 118492. [Google Scholar] [CrossRef]
- Feidl, F.; Garbellini, S.; Vogg, S.; Sokolov, M.; Souquet, J.; Broly, H.; Butté, A.; Morbidelli, M. A new flow cell and chemometric protocol for implementing in-line Raman spectroscopy in chromatography. Biotechnol. Prog. 2019, 35, e2847. [Google Scholar] [CrossRef] [PubMed]
- Grillo, G.; Boffa, L.; Binello, A.; Mantegna, S.; Cravotto, G.; Chemat, F.; Dizhbite, T.; Lauberte, L.; Telysheva, G. Analytical dataset of Ecuadorian cocoa shells and beans. Data Brief 2019, 22, 56–64. [Google Scholar] [CrossRef]
- Zeise, I.; Heiner, Z.; Holz, S.; Joester, M.; Büttner, C.; Kneipp, J. Raman Imaging of Plant Cell Walls in Sections of Cucumis sativus. Plants 2018, 7, 7. [Google Scholar] [CrossRef] [PubMed] [Green Version]
- Sixt, M.; Schmidt, A.; Mestmäcker, F.; Huter, M.; Uhlenbrock, L.; Strube, J. Systematic and Model-Assisted Process Design for the Extraction and Purification of Artemisinin from Artemisia annua L.—Part I: Conceptual Process Design and Cost Estimation. Processes 2018, 6, 161. [Google Scholar] [CrossRef] [Green Version]


| FTIR | Raman | DAD | Fluorescence | |||||||||||||
|---|---|---|---|---|---|---|---|---|---|---|---|---|---|---|---|---|
| Component | R2 Calibration | R2 Validation | RMSE Calibration | RMSE Validation | R2 Calibration | R2 Validation | RMSE Calibration | RMSE Validation | R2 Calibration | R2 Validation | RMSE Calibration | RMSE Validation | R2 Calibration | R2 Validation | RMSE Calibration | RMSE Validation |
| Dry Residue | 1 | 0.99 | 0.0007 | 0.0018 | 0.92 | 0.78 | 0.0042 | 0.007 | 1 | 0.95 | 0.0007 | 0.0027 | 1 | 0.94 | 0.0011 | 0.003 |
| Arbutin | 0.99 | 0.99 | 0.00005 | 0.00007 | 0.89 | 0.56 | 0.0002 | 0.0004 | 0.93 | 0.83 | 0.0002 | 0.0002 | 0.99 | 0.91 | 0.00006 | 0.0001 |
| Hydroquinone | 0.97 | 0.81 | 0.00002 | 0.00004 | 0.78 | 0.6 | 0.00006 | 0.00007 | 0.9 | 0.76 | 0.00003 | 0.00003 | 0.98 | - | 0.00001 | 0.00006 |
| TPC | 1 | 0.98 | 0.0002 | 0.0005 | 0.92 | 0.73 | 0.001 | 0.002 | 0.99 | 0.96 | 0.0005 | 0.0007 | 1 | 0.92 | 0.0002 | 0.001 |
| Free sugars | 1 | 0.99 | 0.0008 | 0.0005 | 0.92 | 0.77 | 0.0014 | 0.0024 | 0.98 | 0.91 | 0.0008 | 0.001 | 1 | 0.95 | 0.0004 | 0.001 |
| Acetic acid | 0.96 | 0.74 | 0.00002 | 0.00006 | 0.89 | 0.58 | 0.00004 | 0.00008 | 0.82 | 0.8 | 0.00005 | 0.00006 | 0.99 | 0.85 | 0.00001 | 0.00006 |
| Proteins | 0.93 | 0.4 | 0.0001 | 0.0005 | 0.87 | 0.81 | 0.0002 | 0.0003 | 0.99 | 0.91 | 0.00005 | 0.0001 | 1 | 0.95 | 0.00004 | 0.0001 |
| Ash | 0.96 | 0.94 | 0.00009 | 0.0001 | 0.88 | 0.71 | 0.0002 | 0.0003 | 0.99 | 0.81 | 0.00007 | 0.0002 | 0.99 | 0.8 | 0.00006 | 0.0002 |
| Aminic acids | 0.99 | 0.98 | 0.00007 | 0.0001 | 0.88 | 0.72 | 0.0002 | 0.0005 | 0.99 | 0.95 | 0.00008 | 0.0001 | 1 | 0.91 | 0.00001 | 0.0001 |
| Structural carbohydrates | 0.97 | 0.79 | 0.0008 | 0.0019 | 0.76 | 0.62 | 0.0022 | 0.0026 | 0.84 | 0.74 | 0.0017 | 0.0016 | 0.98 | 0.59 | 0.0006 | 0.002 |
Publisher’s Note: MDPI stays neutral with regard to jurisdictional claims in published maps and institutional affiliations. |
© 2021 by the authors. Licensee MDPI, Basel, Switzerland. This article is an open access article distributed under the terms and conditions of the Creative Commons Attribution (CC BY) license (https://creativecommons.org/licenses/by/4.0/).
Share and Cite
Jensch, C.; Knierim, L.; Tegtmeier, M.; Strube, J. Development of a General PAT Strategy for Online Monitoring of Complex Mixtures—On the Example of Natural Product Extracts from Bearberry Leaf (Arctostaphylos uva-ursi). Processes 2021, 9, 2129. https://0-doi-org.brum.beds.ac.uk/10.3390/pr9122129
Jensch C, Knierim L, Tegtmeier M, Strube J. Development of a General PAT Strategy for Online Monitoring of Complex Mixtures—On the Example of Natural Product Extracts from Bearberry Leaf (Arctostaphylos uva-ursi). Processes. 2021; 9(12):2129. https://0-doi-org.brum.beds.ac.uk/10.3390/pr9122129
Chicago/Turabian StyleJensch, Christoph, Larissa Knierim, Martin Tegtmeier, and Jochen Strube. 2021. "Development of a General PAT Strategy for Online Monitoring of Complex Mixtures—On the Example of Natural Product Extracts from Bearberry Leaf (Arctostaphylos uva-ursi)" Processes 9, no. 12: 2129. https://0-doi-org.brum.beds.ac.uk/10.3390/pr9122129