Article

Concentration Polarization Quantification and Minimization in Cork Process Wastewater Ultrafiltration by an Ozone Pretreatment

by
Miguel Minhalma
1,2,
Maria Norberta de Pinho
1,3 and
Joaquin R. Dominguez
4,5,*
1
Center of Physics and Engineering of Advanced Materials (CeFEMA), Instituto Superior Técnico, Universidade de Lisboa, Av. Rovisco Pais 1, 1049-001 Lisboa, Portugal
2
Chemical Engineering Department, Instituto Superior de Engenharia de Lisboa, Instituto Politécnico de Lisboa, Rua Conselheiro Emídio Navarro, 1, 1959-007 Lisboa, Portugal
3
Chemical Engineering Department, Instituto Superior Técnico, Universidade de Lisboa, Av. Rovisco Pais 1, 1049-001 Lisboa, Portugal
4
Chemical Engineering Department, Universidad de Extremadura, Av. Elvas s/n, 06006 Badajoz, Spain
5
Instituto Universitario de Investigación del Agua, Cambio climático y Sostenibilidad (IACYS), Avda de la Investigación s/n, 06006 Badajoz, Spain
*
Author to whom correspondence should be addressed.
Submission received: 8 November 2021 / Revised: 1 December 2021 / Accepted: 2 December 2021 / Published: 3 December 2021
(This article belongs to the Special Issue Emerging Technologies for Water and Wastewater Treatment)

Abstract

:
Concentration polarization and membrane fouling have been identified as the main problems during the ultrafiltration treatment of cork processing wastewaters. These problems drastically reduce the permeate fluxes and, therefore, their potential applications. In this work, a soft ozonation pretreatment was applied to minimize these undesirable effects. A new systematic study was carried out for membranes with different molecular weight cut-offs and at different operating conditions to monitor and quantify the concentration polarization caused by the wastewater’s remaining ozonated compounds. Film theory was used to correlate the mass transfer coefficient, k, and the intrinsic rejection coefficient, f′, with the resistance introduced by concentration polarization. The ultrafiltration treatment was carried out under varying hydrodynamic operating conditions (circulating flow rates of 100–200 L/h) and transmembrane pressures (1–3 bar) for a set of four cellulose acetate membranes covering a wide range of molecular weight cut-offs (5000–100,000 Da) and hydraulic permeabilities (25–110 kg/h/m2/bar). The ozone pretreatment (at wastewater pH) reduced the phenolic content selectively (direct oxidation) by more than 50%, reducing membrane fouling and concentration polarization and increasing permeate fluxes (by 22–45%) and mass transfer coefficients (up to six times).

1. Introduction

Membrane pressure-driven processes play an important role in wastewater treatment and the recovery of valuable products from different agro-industrial wastewaters [1]. Wastewaters from food, pulp and paper, cork, and many other agro-industrial industries are very complex mixtures of plant extracts that cover a wide range of molecular weights [2].
In this context, membrane fouling and concentration polarization have been identified as the main problems during the ultrafiltration (UF) of different industrial effluents [3,4]. These undesirable phenomena drastically reduce the permeate fluxes and, therefore, the potential use of this technology. In this context, phenolic/tannic compounds have been commonly associated with these significant flux declines and membrane fouling [5].
The cork industry is an important sector in Portugal and Spain [6]. Both countries’ production represents more than 80% of the world cork output. One of the first steps in cork processing consists of boiling cork planks (extracted from the Quercus suber tree). Several planks of cork (approximately 1000 kg) are boiled in water in boiling tanks for around 1 h, and this process is repeated for five days in the same water. After this period, the water is discharged from the boiling tank. The generated wastewater becomes rich in organic-extractable compounds, having a strong negative environmental impact. It presents very low biodegradability due to its high content of phenolic compounds, recalcitrant nature, and high toxicity. Chemically, the cork processing wastewater is a very complex mixture of vegetal extracts with high content of phenolic compounds, tannins, polysaccharides, and other bioactive compounds [2,5].
Because of this situation, new technologies (for pretreatment) have been developed to reduce these concentration polarization and membrane fouling problems. Among them, the following technologies may be highlighted: PAC adsorption [7], coagulation [8], electrochemical oxidation [9], photocatalytic oxidation [10], and ozonation [5,11].
In this context, authors have reported in previous investigations [12] that ozonation is the treatment that gives better results for the selective oxidation of phenolic compounds. Ozone is a powerful oxidizing reagent and can destroy phenolic compounds effectively and selectively [5,12]. Moreover, ozone, in particular, has many of the oxidizing properties desirable for use in water treatment: it is readily available, soluble in water, and generally leads to less toxic substances (oxygen). Dominguez et al. [12] pointed out that ozone can react with phenolic compounds selectively by direct oxidation at pH < 6. In these conditions, molecular ozone reacts at electron-rich sites of the organic phenolic compounds. This selective oxidation in treating phenolic substances, which are frequently present in agro-industrial effluents, has been examined by different authors [13,14,15]. Other researchers [16] have used an ozone pretreatment (0.3 mg O3/L) for the reverse osmosis (RO) of surface waters, reducing membrane fouling and increasing permeate fluxes. Kim et al. [17] used an ozone pretreatment for natural waters’ ultrafiltration (UF), reporting that the permeate flux was reduced by only 15% using ozone. In comparison, it decreased by around 60% without any pretreatment. On the other hand, Lee et al. [18] reported slight improvements in the permeate flux for microfiltration (MF) sewage.
This work’s objective was to quantify the concentration polarization and mass transfer coefficients obtained for wastewaters subjected to ozone pretreatment, which oxidize selectively phenolic compounds, thus achieving remarkable concentration polarization minimization and membrane fouling minimization, obtaining an increase in permeate fluxes. In this work, a soft and low-cost ozonation pretreatment of only 0.4 mg O3/L was sufficient to remove more than 50% of the phenolic compounds, removing only 10% of the total organic carbon (TOC).
To quantify membrane concentration polarization and membrane fouling for each experiment (with different membrane types and hydrodynamic conditions), some parameters of film theory were determined, namely the intrinsic rejection coefficient (f) and the mass transfer coefficient (k). Film theory [19] was used to correlate the mass transfer coefficient, k, and the intrinsic rejection coefficient, f, with the resistance introduced by concentration polarization and fouled membrane resistance.

2. Materials and Methods

2.1. Cellulose Acetate Membranes (Preparation and Characterization)

Four laboratory-fabricated membranes were prepared according to the phase inversion method [20], using cellulose acetate with 38.9% acetyl content, supplied by Eastman-Kodak. Table 1 shows the casting solution composition of the MCA4.1, MCA4.2, MCA4.3, and MCA4.4 membranes. The fabricated membranes were characterized by hydraulic permeability (Lp) and molecular weight cut-off (MWCO), obtaining a wide work range of MWCOs between 5000 and 100,000 Da, and hydraulic permeabilities in the range of 25–110 kg/h/m2/bar (Table 1). The hydraulic permeability was calculated for each membrane by performing several experiments with water at different transmembrane pressures. The slope of the representation of the permeate fluxes as a function of the pressure gives the hydraulic permeability value.

2.2. Cork Process Wastewater Characterization

The wastewater samples were collected at a Portuguese cork processing industry (Montijo, Portugal) and no more than 3–4 days elapsed before the permeation experiments. They were kept refrigerated at 5 °C and characterized before use. Table 2 shows the main physicochemical properties of these wastewaters.

2.3. Ozone Pretreatment

Ozone pretreatment was conducted in a chemical batch reactor (1.25 L cylindrical Pyrex glass vessel) provided with a cover containing inlets for bubbling the gas feed and stirring. The ozonation reactor operated batch-wise to the liquid solution and was immersed in a thermostatic bath with the necessary elements to keep the temperature constant within 25 ± 0.5 °C.
For ozone generation, oxygen was taken from a commercial cylinder and introduced into an ozone generator (Erwin Sander Elektroapparatebau, GmbH, model 301.7). The ozone–oxygen gas stream was fed to the reacting medium through a bubble gas sparger with a flow rate of 20 L/h. This soft and low-cost ozone pretreatment reduced the total organic carbon (TOC) of raw wastewater to less than 10%, whereas total polyphenols were removed at over 50%. The reaction time was only 10 min to proportionate a dose of 0.4 mg O3/L. Zeta potential and pH of the resulting effluent were −11.0 mV and 3.8, respectively.
Regarding the reaction mechanism, ozone can react with solutes either by direct oxidation (pH < 6), in which molecular ozone reacts at electron-rich sites of the organic compounds, or by an indirect pathway, whereby hydroxyl radicals (·OH) resulting from the decomposition of ozone serve as the oxidants through chain reactions (pH > 6). For this case, we can assume a mainly direct oxidation pathway.
Considering the cork process wastewater as a complex mixture of organic compounds, the organic matter content must be measured by a global parameter such as TOC. The ozone pretreatment reduced the TOC of raw wastewater from 3225 to 2905 mg/L (less than 10%), whereas total polyphenols were reduced from 365 mg/L to 176 mg/L of gallic acid (approximately 50%). This implies the high selectivity of ozone towards polyphenol compounds.
As ozone was not detected in the gas out-stream (the ozone dose was fully consumed by the reaction), the ozone mass balance indicated an apparent mass reaction stoichiometry of 800 mg of TOC per mg of ozone, and, regarding polyphenols, this value reached 472 mg/L of gallic acid removed per milligram of ozone.

2.4. Ultrafiltration Experiments

UF experiments were performed in flat cell laboratory units. The membrane surface was 13.2 × 10⁻⁴ m2 for all experiments. The feed temperature was kept at 25 ± 0.5 °C in all experiments. The membranes were first compacted by recirculation of ultrapure water pressurized at 5 bar for 3 h. This procedure avoided the effects of pressure on the membrane structure in subsequent experiments. The stabilization time for each experimental run was 45 min. The membranes were washed with deionized water between each run until the water permeate flow reached at least 90% of the initial value.
The ultrafiltration experiments were carried out under varying hydrodynamic operating conditions (circulating flow rates of 100–200 L/h) and transmembrane pressures (1–3 bar) for a set of four cellulose acetate membranes covering a wide range of molecular weight cut-offs (5000–100,000 Da) and hydraulic permeabilities (25–110 kg/h/m2/bar).
The feed and permeate solutions were analyzed in terms of TOC concentration. Feed samples were taken at the beginning and the end of each experimental run; the average concentration of these two samples was considered the feed concentration.

2.5. Modeling Membrane Mass Transfer

For a membrane of given MWCO and a given solute A, an intrinsic rejection coefficient, f′, and an apparent rejection coefficient, f, are defined [17] by:
f = C A m C A p C A m
f = C A b C A p C A b
where CAp is the concentration of solute A in the permeate stream, CAm is the solute concentration on the membrane surface, and CAb is the solute concentration in the bulk of the solution. Parameters f and f are directly related to the build-up of the concentration profile of solute A at the feed fluid phase adjacent to the membrane surface and depend on the MWCO of the membrane and the operating conditions (feed circulation and transmembrane pressure). Considering convection towards the membrane surface and diffusion away from it, a steady-state mass balance for solute A yields:
D A w d C A d x + v p C A = v p C A p
where vp is the permeate flux (m/s), CA is the concentration of solute A, and DAw is the diffusivity of solute A in water. The integration of Equation (3) in a boundary layer of constant thickness, δ, with the corresponding boundary conditions (CA = CAm for x = 0 and CA = CAb for x = δ), gives Equation (4):
C A m C A p C A b C A p = e v p D A w δ
The introduction of a mass transfer coefficient, k, which, by film theory [17], is given by k = DAw/δ, and the substitution of the definitions of f and f in Equation (4) leads to Equation (5).
l n ( 1 f f ) = l n ( 1 f f ) + 1 k v p
which relates f and f to the mass transfer coefficient, through k (m/s), and the permeate flux through vp (m/s). As stated in the previous section, film theory was used to correlate the mass transfer coefficient, k, and the intrinsic rejection coefficient, f, with the resistance introduced by concentration polarization with the fouled membrane resistance. In fact, higher f values show that the concentration of solute A at the membrane surface increased and therefore a higher concentration polarization was observed, and this was assessed, in this work, for membranes with different MWCOs and at different operating conditions. These different sets of conditions were also used to quantify the variation in the mass transfer coefficient at the fluid phase adjacent to the membrane surface. Higher values of k show better transport phenomena at the fluid phase.

3. Results and Discussion

3.1. UF Experiments

As previously stated, this work evaluates the concentration polarization and membrane fouling by systematically determining some membrane parameters, such as the intrinsic rejection (f) and the mass transfer coefficient (k), for varying conditions. The ultrafiltration performance upon varying operating conditions of hydrodynamics (circulating flow rates of 100–200 L/h) and transmembrane pressures (1, 2 and 3 bar) was investigated for a set of four synthesized cellulose acetate membranes covering a wide range MWCOs (5000–100,000 Da) and hydraulic permeabilities (25–110 kg/h/m2/bar). The obtained results were compared for raw wastewater (without pretreatment) and ozone pretreated wastewater.

3.1.1. Permeate Fluxes (vp)

In general, permeate fluxes increased with increasing transmembrane pressure and feed circulating rate. The ozone pretreatment also enhanced permeate fluxes for both circulating rates (100 and 200 L/h). These ozone pretreatment enhancements (at 200 L/h and 3 bar) were for the MCA4.1 and MCA4.2 membranes of 45% and 41%, respectively. Regarding the MCA4.3 and MCA4.4 membranes (with higher MWCOs), the ozone pretreatment was less effective, and the permeate fluxes were enhanced by 22% and 34%, respectively (at 200 L/h and 3 bar). These results are consistent with the improvements of ozone pretreatment observed by Minhalma et al. [5], Brown et al. [16], and Kim al. [17].

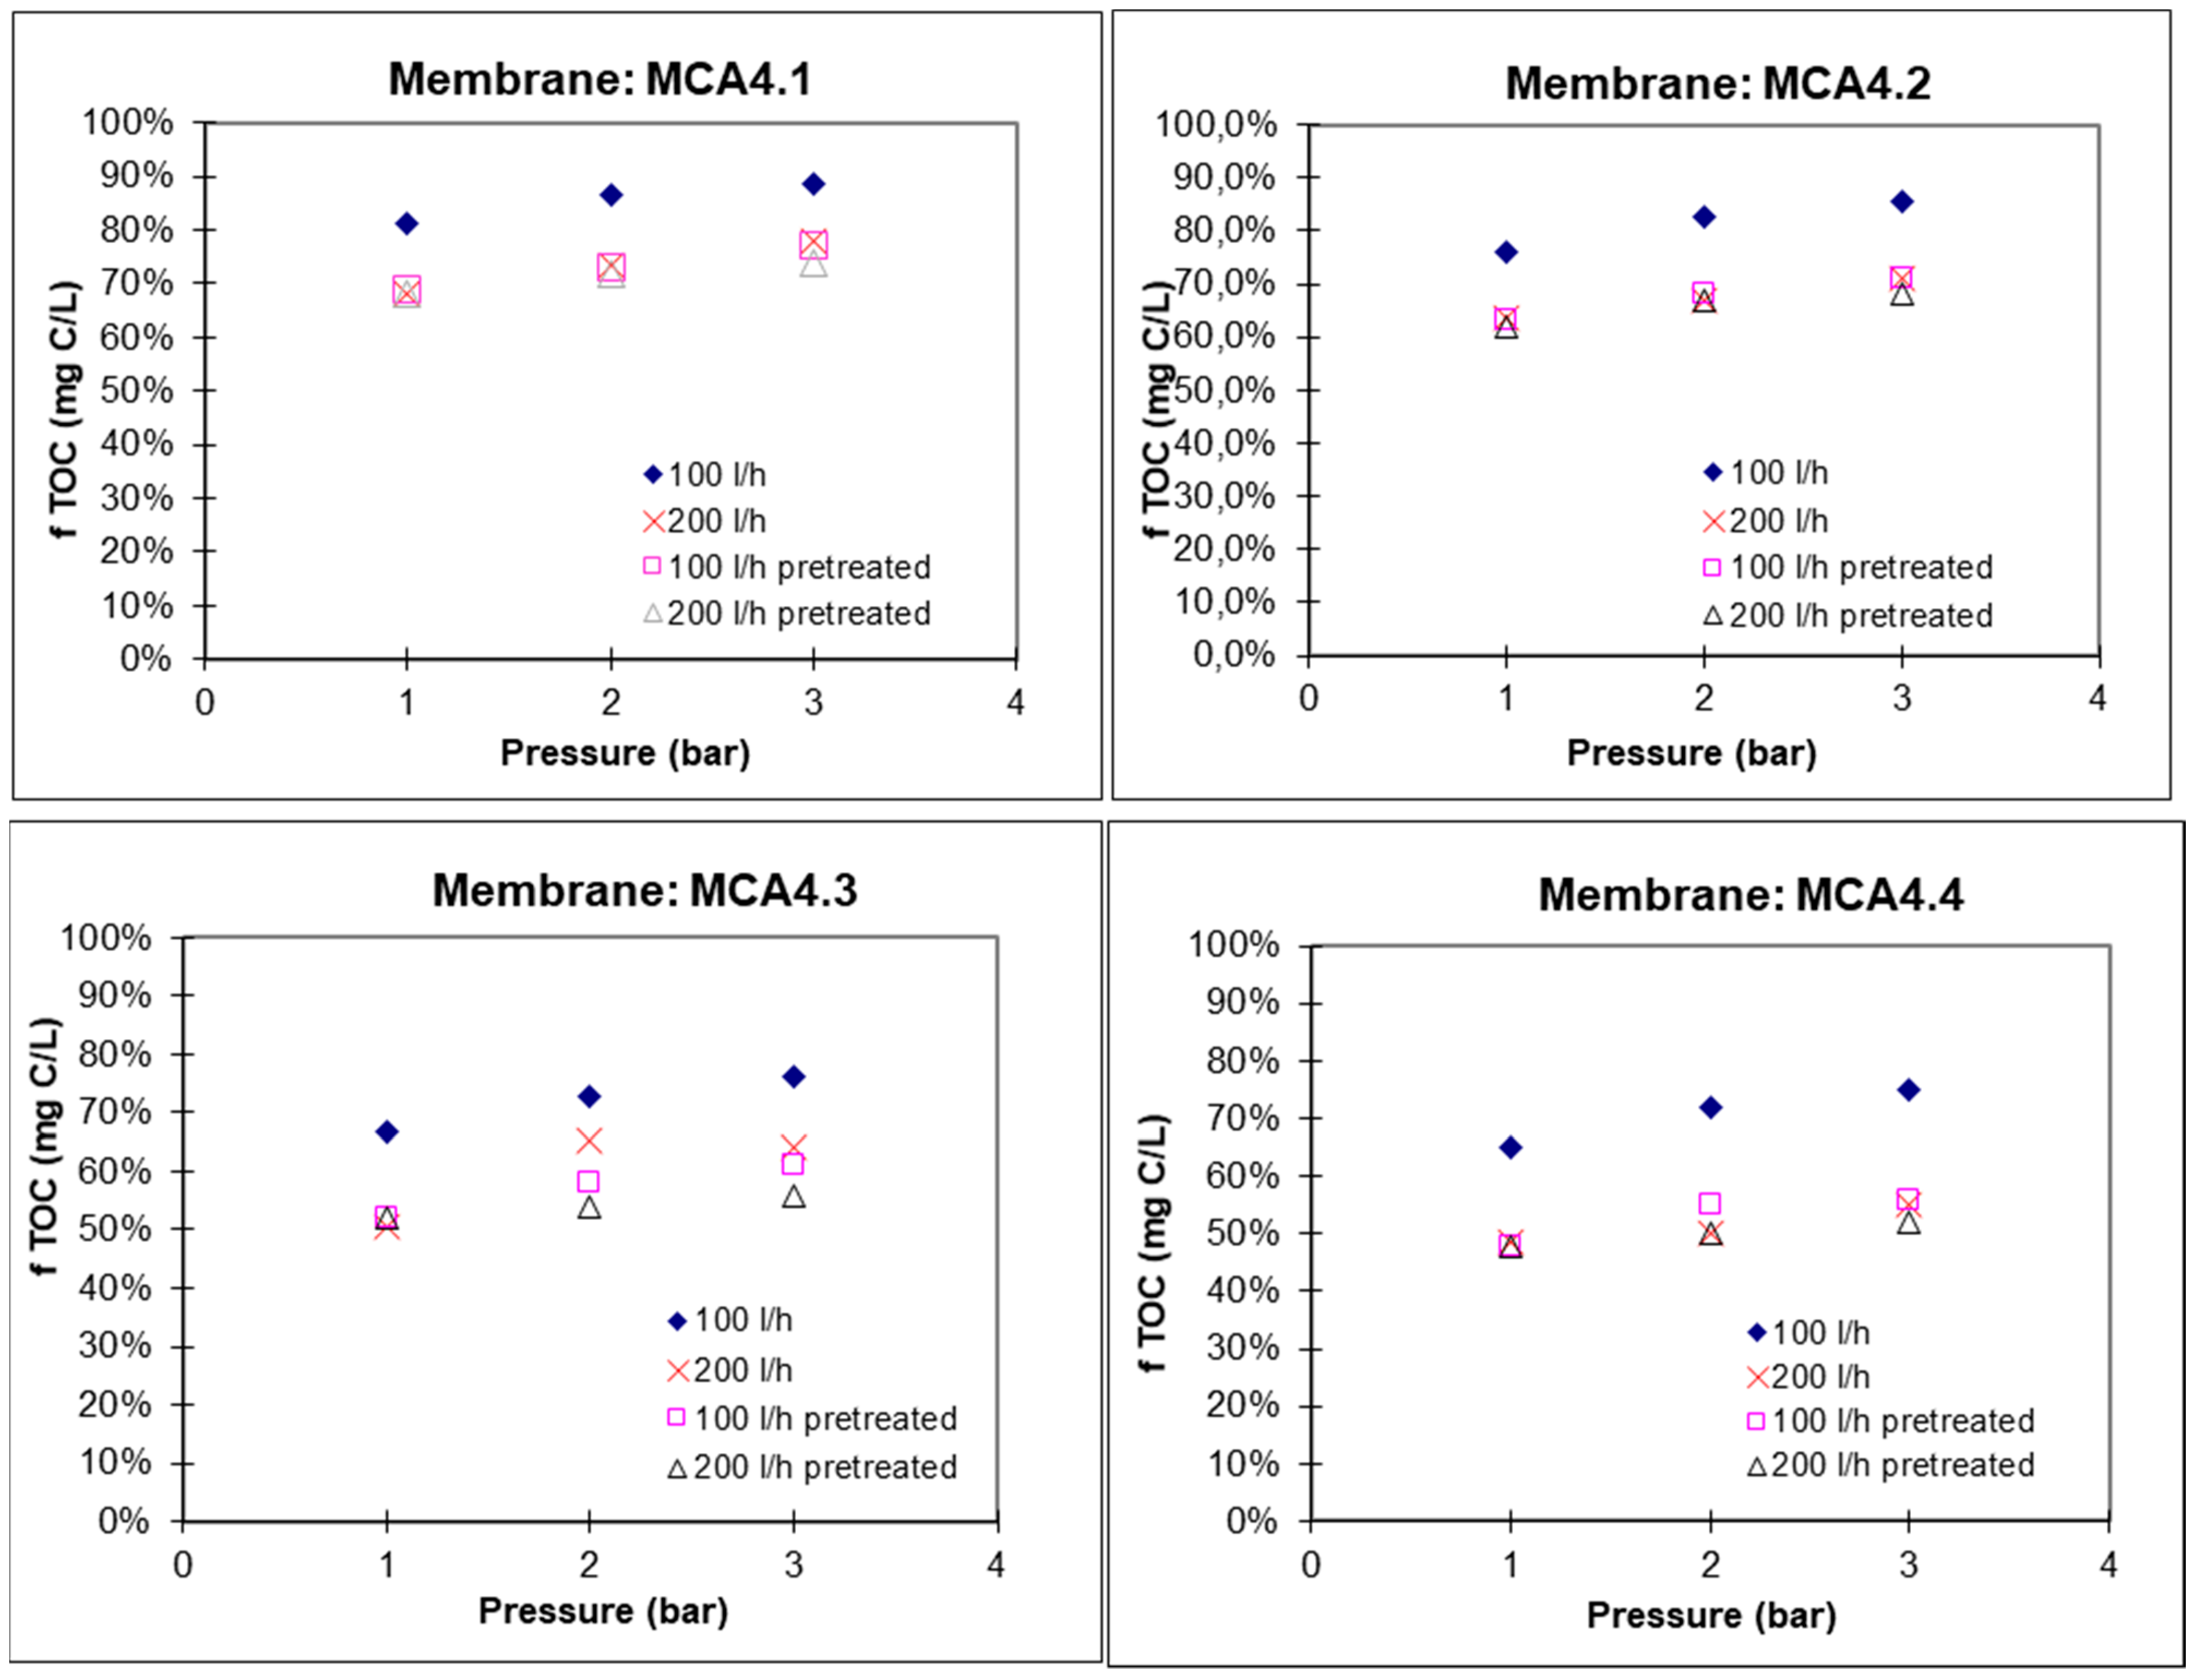
3.1.2. Apparent Rejection Coefficients (f)

The TOC apparent rejection coefficients (f) for varying transmembrane pressures and feed circulating velocities are shown in Figure 1. In general, for all membranes, the apparent rejection coefficients increased with increasing transmembrane pressure (which leads to higher concentration polarization) and decreased with the increased feed recirculation rate (which leads to lower concentration polarization).
The ozonation pretreatment led to a decrease in the apparent rejection coefficient, f, for both feed flowrates (100 and 200 L/h) and all pressures. This effect was more pronounced for the experiments performed at the lowest circulating flow rate (100 L/h), showing that the pretreatment favors decreasing membrane selectivity. This effect could be related to the partial fragmentation of large molecules into smaller ones by ozonation.

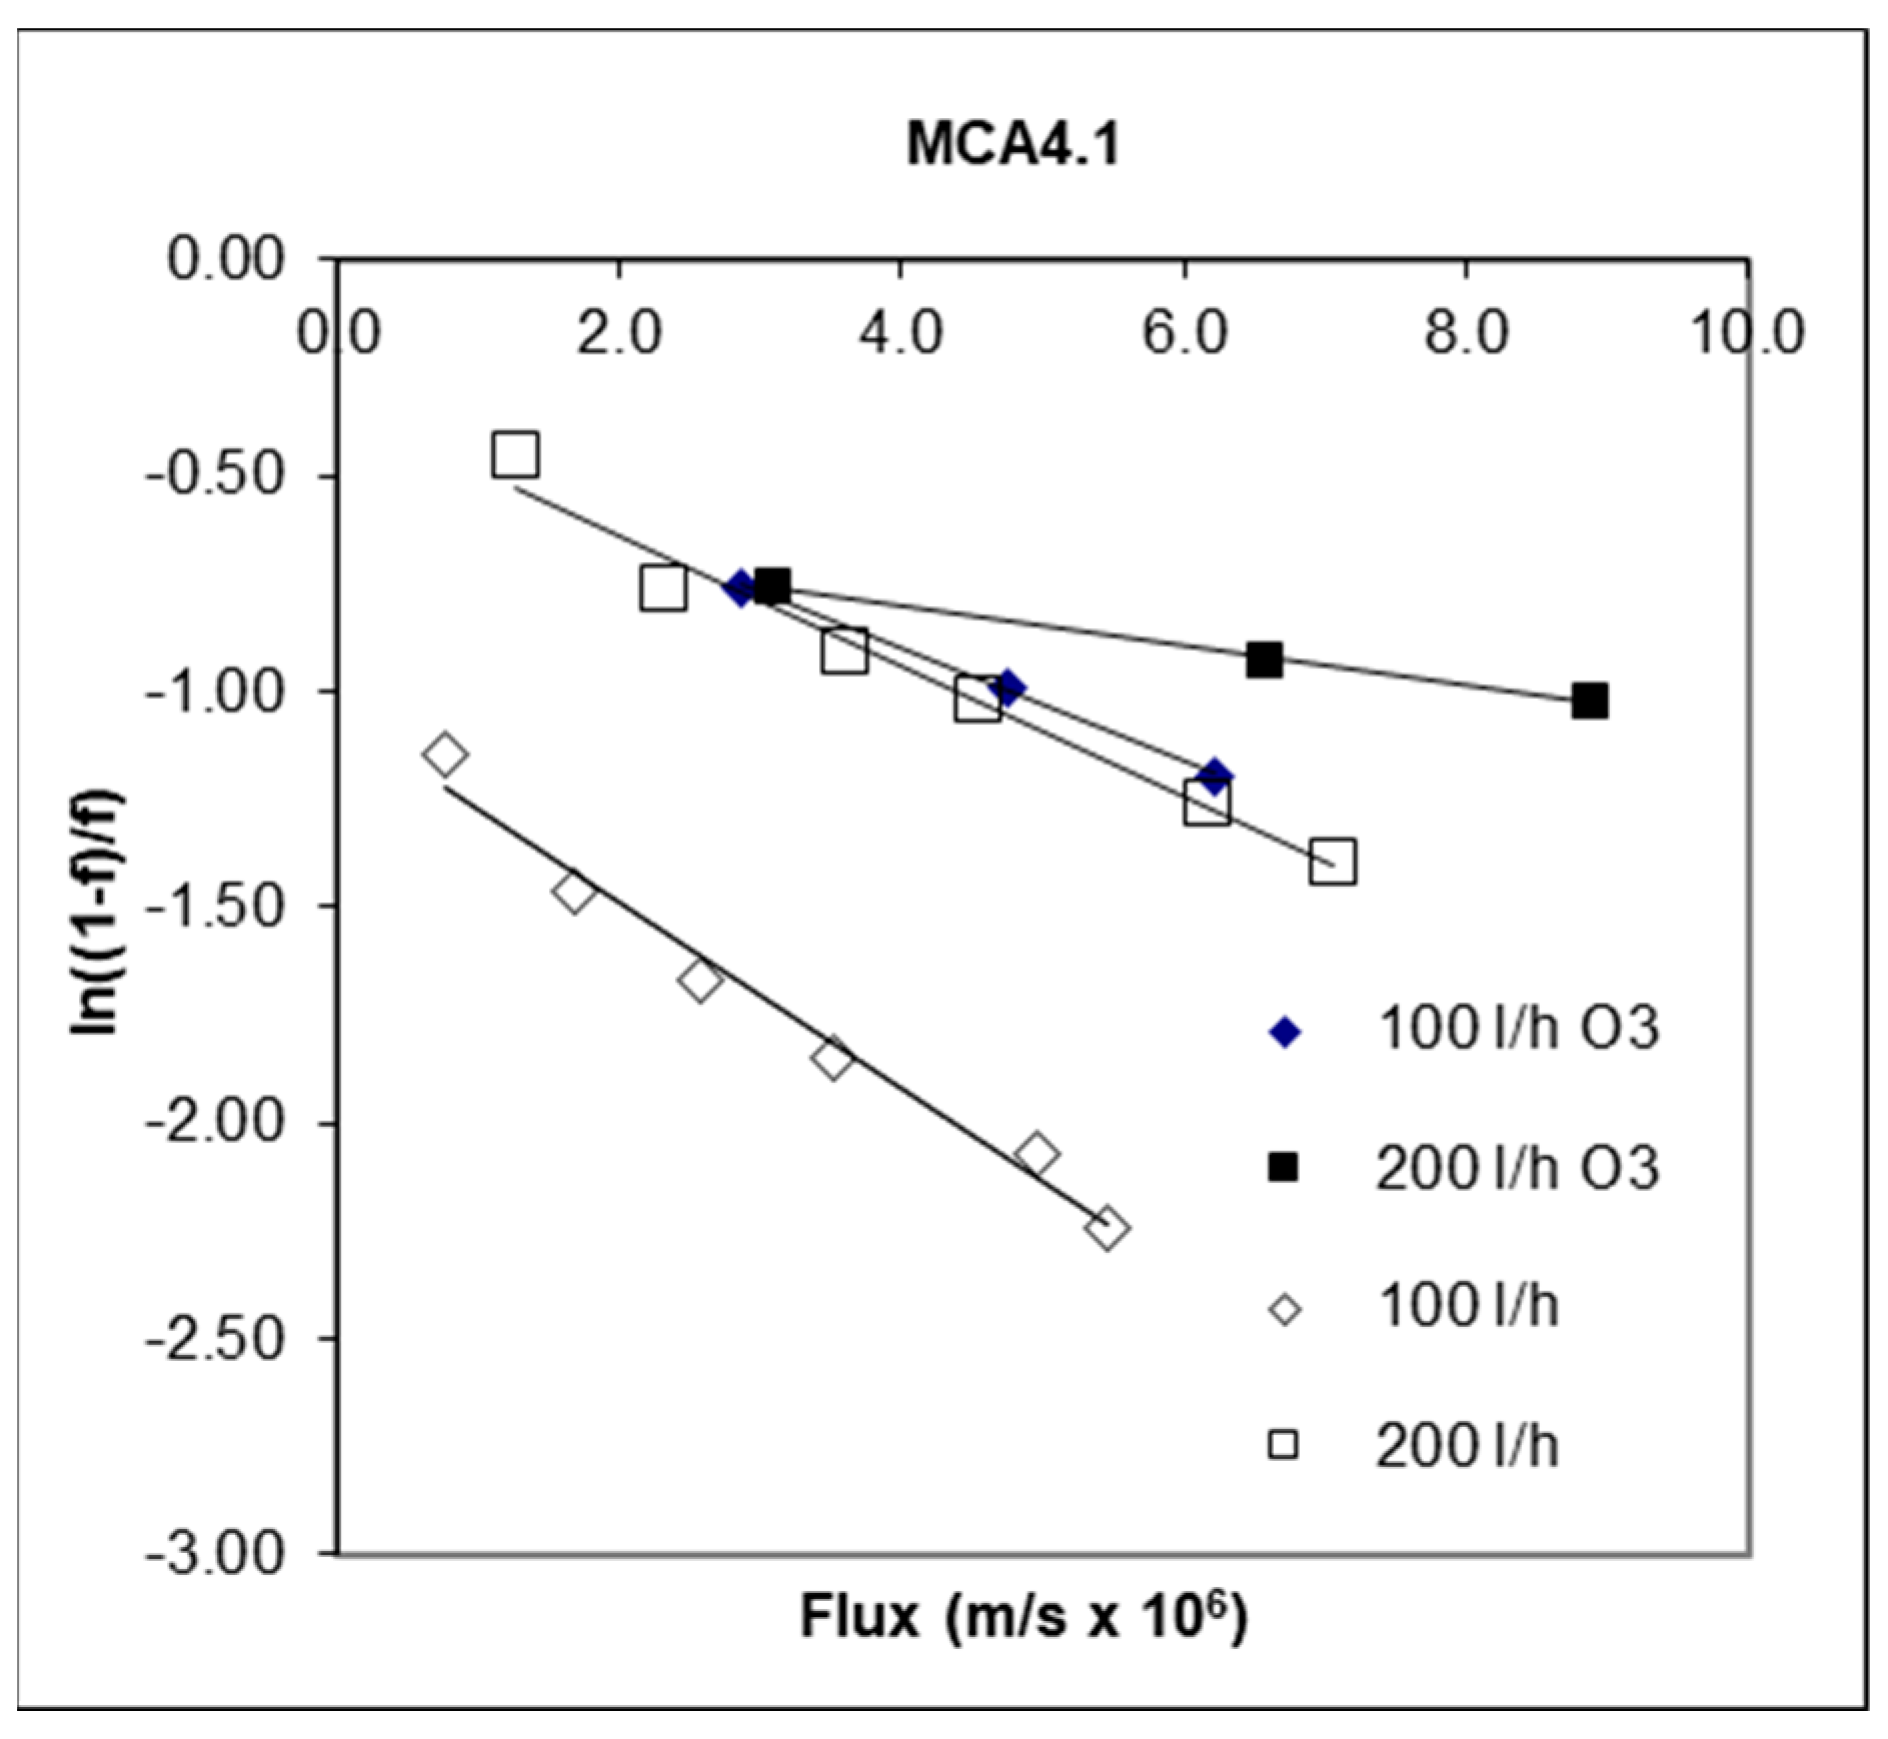
3.1.3. Mass Transfer and Intrinsic Rejection Coefficients

To determine the mass transfer coefficient, k, and the intrinsic rejection coefficient, f, for all membranes, the ln((1 − f)/f) was plotted as a function of the permeate fluxes. Through Equation (5), a straight line equation was obtained for each set of conditions (membrane/feed flow rate), as shown, as an example for the MCA4.1 membrane, in Figure 2. The origin of each straight line allowed the calculation of the f, and the slope permitted the calculation of k.

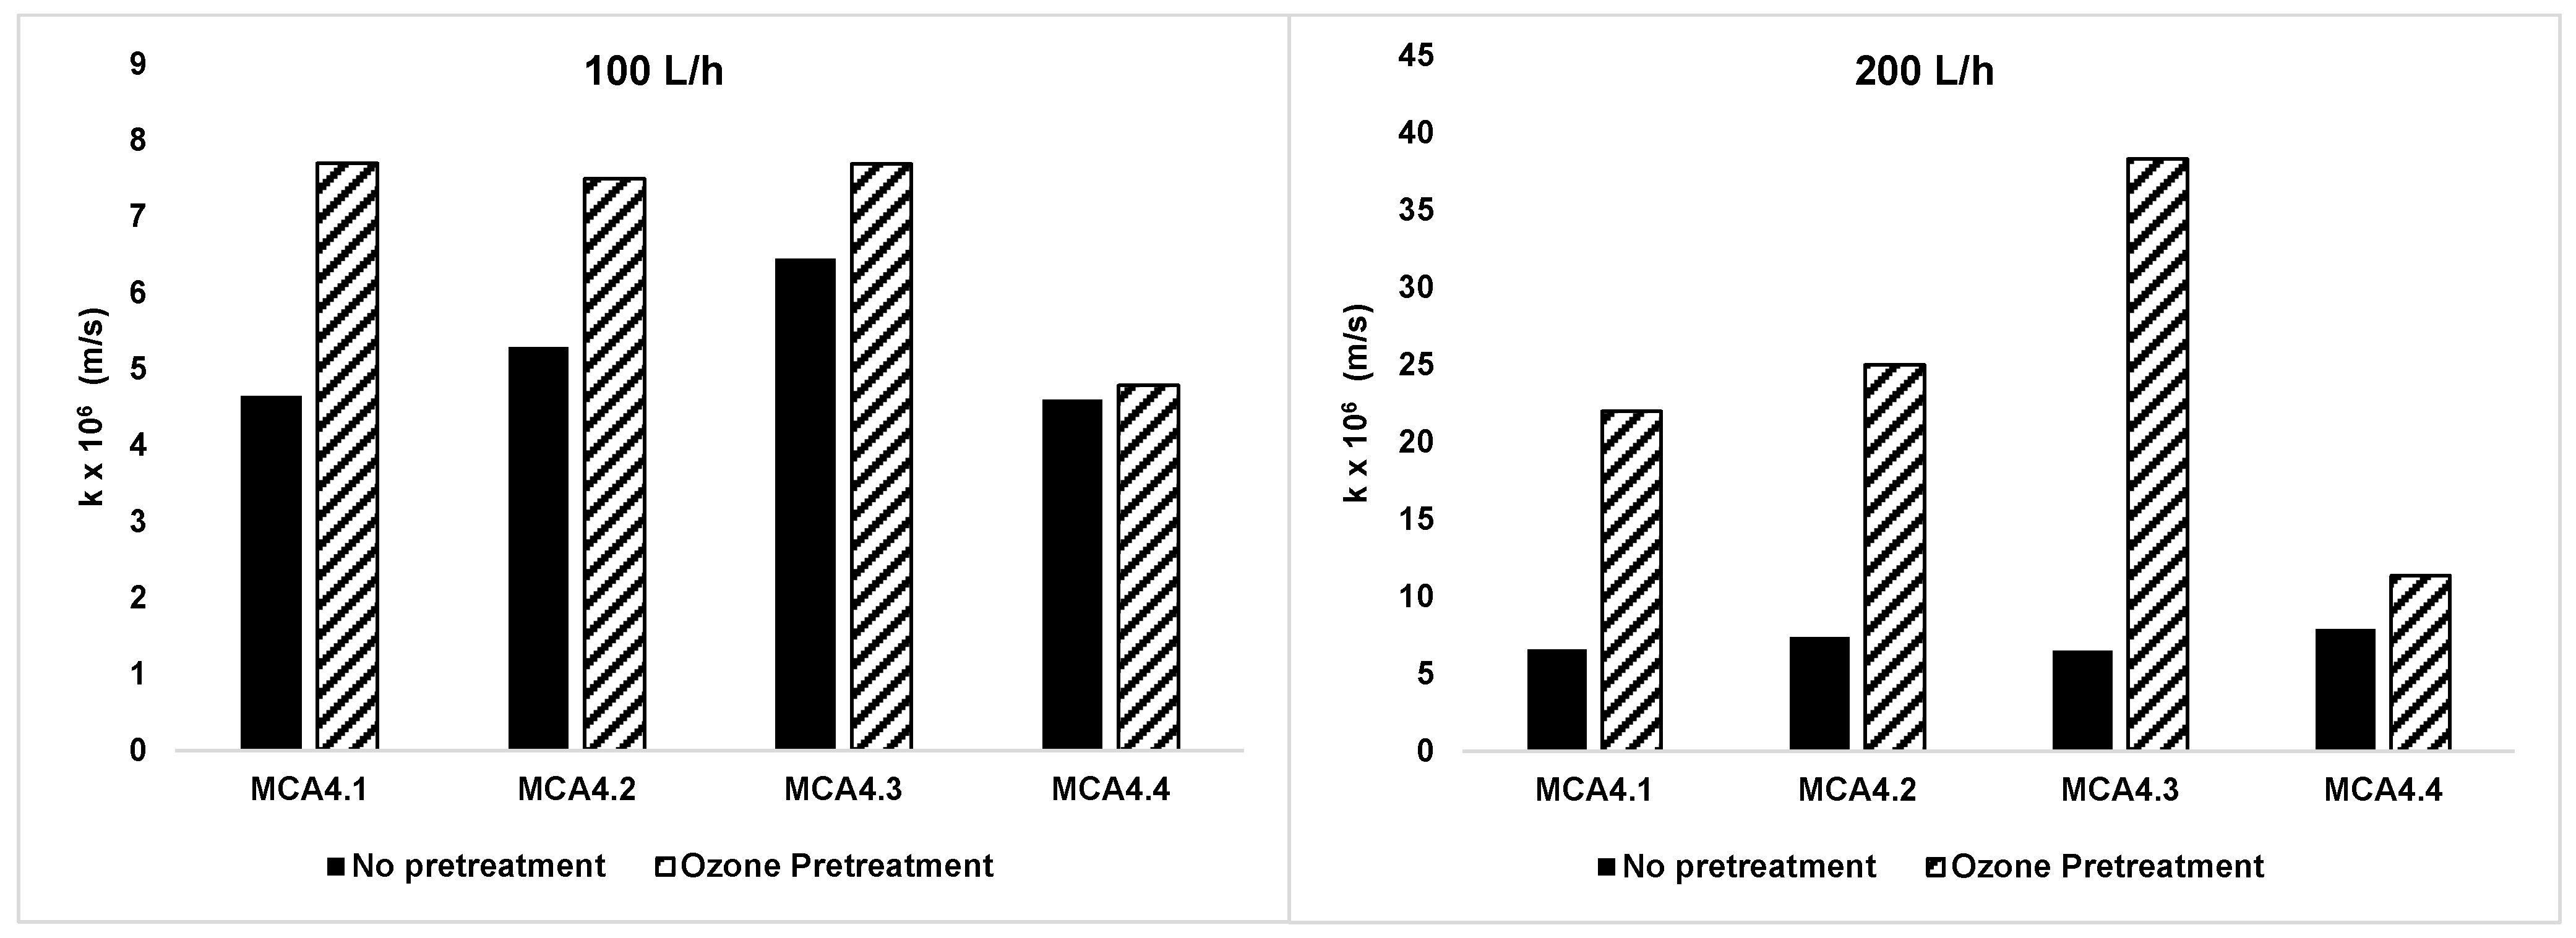
Mass Transfer Coefficient Analysis (k)

Film theory [19] was used to correlate the mass transfer coefficient, k, with the resistance introduced by concentration polarization. The mass transfer coefficient values obtained for each membrane, feed flowrate, and with or without ozone pretreatment are presented in Table 3 and Figure 3.
The results obtained for the mass transfer coefficient, k, clearly show that the ozone pretreatment increased the mass transfer of matter in the fluid feed phase adjacent to the membrane surface. This fact could be related to the smaller solutes present in the solution, after the partial fragmentation/oxidation performed by ozone pretreatment, and to their higher diffusivity. This effect was more pronounced for the higher feed flowrate of 200 L/h, as these smaller solutes were more easily dragged from the membrane surface by the feed flowrate turbulence.

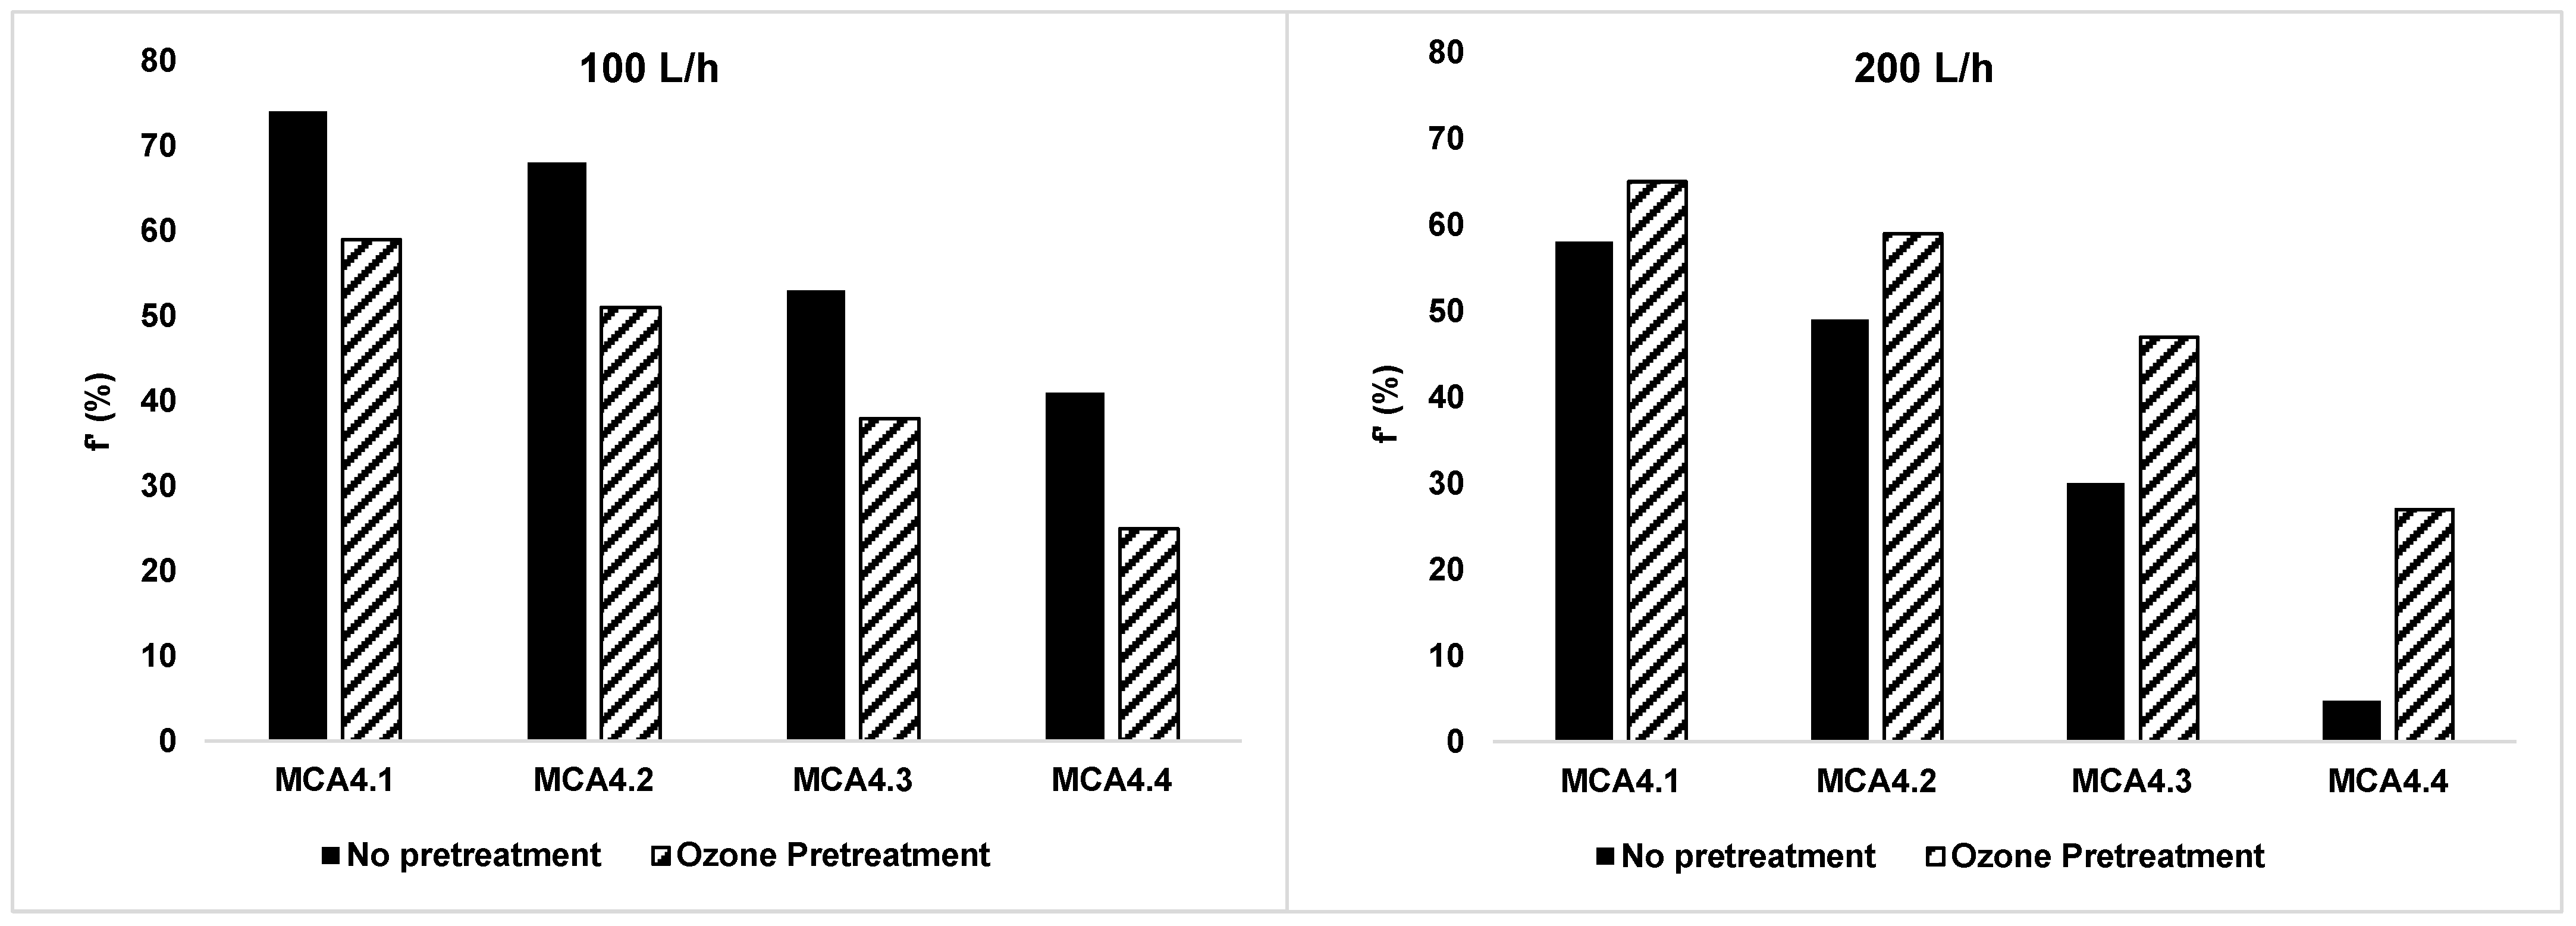
Intrinsic Rejection Coefficient Analysis (f)

According to film theory, the intrinsic rejection coefficient, f, is related to the increase in solute concentration at the membrane surface and to the fouled membrane resistance. The f results obtained for each membrane, feed flowrate, and with or without ozone pretreatment are presented in Table 4 and Figure 4.
For all membranes, as expected, the f decreased with the increase in the MWCO, as the increased porosity of the membranes led to lower solute rejections and therefore lower concentration polarization. Regarding the influence of the feed flowrate, the intrinsic rejection coefficients, f, showed two distinct behaviors. For the lower feed flowrate, 100 L/h, all membranes presented lower f for the pretreated effluent, while, for the higher feed flowrate, 200 L/h, the membranes presented higher intrinsic rejection coefficients for the pretreated effluent. This may be because the pretreatment led to the production of smaller solutes that, although having higher diffusivities, which lead to higher k values, also presented higher concentration polarization and fouling capability.

4. Conclusions

Ozone pretreatment leads to an enhancement of permeate fluxes for all membranes and hydrodynamic conditions. These enhancements were around 40–45% for the more selective membranes (MCA4.1 and MCA4.2) and lower, in the range of 22–34%, for membranes with higher MWCOs (MCA4.3 and MCA4.4).
For all membranes, the apparent rejection coefficients (f) increased with increasing transmembrane pressure, leading to higher concentration polarization, and decreased with the increase in the feed recirculation rate, leading to lower concentration polarization. The pre-ozonation treatment decreased the apparent rejection coefficients, this being more pronounced at the lowest circulating flowrate (100 L/h). This effect can be related to the partial fragmentation of large molecules into smaller ones by ozonation.
Ozone pretreatment also increased the mass transfer coefficients (k). This fact can be related to the smaller solutes present in the solution, which have higher diffusivities, and this effect was more evident for the higher feed flowrate of 200 L/h.
The intrinsic rejection coefficients (f) showed two distinct behaviors depending on the feed flowrate. For the lower feed flowrate, 100 L/h, all membranes presented lower values for the pre-ozonated effluent, while, for the higher feed flowrate, 200 L/h, the membranes presented higher intrinsic rejection coefficients for the pretreated effluent. This may be because of the appearance in the solution of smaller solutes that, although having higher diffusivities, presented higher fouling capability.

Author Contributions

Conceptualization, M.M. and M.N.d.P.; methodology, M.M. and M.N.d.P.; validation, J.R.D. and M.M.; formal analysis, M.M. and J.R.D.; investigation, J.R.D. and M.M.; writing—original draft preparation, J.R.D. and M.M.; writing—review and editing, M.M., M.N.d.P. and J.R.D.; supervision, M.M. and M.N.d.P.; project administration, M.N.d.P.; funding acquisition, M.N.d.P. and J.R.D. All authors have read and agreed to the published version of the manuscript.

Funding

This paper is part of the project I+D+i PID2020-113389RB-I00 funded by MCIN/AEI/10.13039/501100011033. Joaquin R. Dominguez also requested a postdoctoral scholarship (reference PRX21/00196) from the Ministerio de Universidades of Spain for his postdoctoral stay.

Institutional Review Board Statement

Not applicable.

Informed Consent Statement

Not applicable.

Acknowledgments

The authors gratefully acknowledge the financial support of this research work through the Ministerio de Ciencia e Innovacion of Spain (Agencia Estatal de Investigación) MCIN/AEI/10.13039/501100011033 under project PID2020-113389RB-I00, as well as the Ministerio de Universidades of Spain for the postdoctoral scholarship (reference PRX21/00196). The authors Miguel Minhalma and Maria Norberta de Pinho acknowledges the portuguese funding of FCT(Fundação para a Ciência e Tecnologia) through CeFEMA—UID/CTM/04540/201.

Conflicts of Interest

The authors declare no conflict of interest.

References

  1. Castro-Muñoz, R.; Barragán-Huerta, B.E.; Fíla, V.; Denis, P.C.; Ruby-Figueroa, R. Current Role of Membrane Technology: From the Treatment of Agro-Industrial by-Products up to the Valorization of Valuable Compounds. Waste Biomass Valorization 2018, 9, 513–529. [Google Scholar] [CrossRef]
  2. Gomes, L.; Borges, C.; Serralheiro, M.L.M.; Minhalma, M.; Pacheco, R. Cork processing wastewaters components fractioned by ultrafiltration membranes—Studies of antioxidant and antitumoral activity. J. Chem. Technol. Biotechnol. 2018, 93, 861–870. [Google Scholar] [CrossRef]
  3. Virtanen, T.; Lahti, J.; Kalliola, A.; Tamminen, T.; Mänttäri, M.; Kallioinen, M. Influence of laccase treatment on fouling layer formation in ultrafiltration of birch hot-water extract. Sep. Purif. Technol. 2020, 240, 116558. [Google Scholar] [CrossRef]
  4. Li, S.; Chen, H.; Zhao, X.; Lucia, L.A.; Liang, C.; Liu, Y. Impact factors for flux decline in ultrafiltration of lignocellulosic hydrolysis liquor. Sep. Purif. Technol. 2020, 240, 116597. [Google Scholar] [CrossRef]
  5. Minhalma, M.; Domínguez, J.R.; de Pinho, M.N. Cork processing wastewaters treatment by an ozonation/ultrafiltration integrated process. Desalination 2006, 191, 148–152. [Google Scholar] [CrossRef]
  6. Sierra-Pérez, J.; Boschmonart-Rives, J.; Gabarrell, X. Production and trade analysis in the Iberian cork sector: Economic characterization of a forest industry. Resour. Conserv. Recycl. 2015, 98, 55–66. [Google Scholar] [CrossRef] [Green Version]
  7. Cheng, X.; Hou, C.; Li, P.; Luo, C.; Zhu, X.; Wu, D.; Zhang, X.; Liang, H. The role of PAC adsorption-catalytic oxidation in the ultrafiltration performance for treating natural water: Efficiency improvement, fouling mitigation and mechanisms. Chemosphere 2021, 284, 131561. [Google Scholar] [CrossRef] [PubMed]
  8. Du, Z.; Ji, M.; Li, R. Enhanced membrane fouling control and trace organic compounds removal during microfiltration by coupling coagulation and adsorption in an electric field. Sci. Total Environ. 2021, 795, 148830. [Google Scholar] [CrossRef] [PubMed]
  9. Wang, X.; Li, F.; Hu, X.; Hua, T. Electrochemical advanced oxidation processes coupled with membrane filtration for degrading antibiotic residues: A review on its potential applications, advances, and challenges. Sci. Total Environ. 2021, 784, 146912. [Google Scholar] [CrossRef] [PubMed]
  10. Gokulakrishnan, S.A.; Arthanareeswaran, G.; László, Z.; Veréb, G.; Kertész, S.; Kweon, J. Recent development of photocatalytic nanomaterials in mixed matrix membrane for emerging pollutants and fouling control, membrane cleaning process. Chemsphere 2021, 281, 130891. [Google Scholar] [CrossRef] [PubMed]
  11. Asif, M.B.; Ren, B.; Li, C.; He, K.; Zhang, X.; Zhang, Z. Understanding the role of in-situ ozonation in Fe(II)-dosed membrane bioreactor (MBR) for membrane fouling mitigation. J. Membr. Sci. 2021, 633, 119400. [Google Scholar] [CrossRef]
  12. Domínguez, J.R.; Peres, J.A.; Beltran-Heredia, J. Phenolic acids ozonation: QSAR analysis and pH influence on the selectivity of ozone. J. Adv. Oxid. Technol. 2009, 12, 249–254. [Google Scholar] [CrossRef]
  13. Valsania, M.C.; Fasano, F.; Richardson, S.D.; Vincenti, M. Investigation of the degradation of cresols in the treatments with ozone. Water Res. 2012, 46, 2795–2804. [Google Scholar] [CrossRef] [PubMed] [Green Version]
  14. Beltrán de Heredia, J.; Torregrosa, J.; Dominguez, J.R.; Peres, J.A. Ozonation kinetics of phenolic compounds present in table olive wastewaters: P-hydroxybenzoic acid, tyrosol and p-coumaric acid. Chem. Eng. Commun. 2001, 184, 157–174. [Google Scholar] [CrossRef]
  15. Beltrán de Heredia, J.; Torregrosa, J.; Dominguez, J.R.; Peres, J.A. Kinetics of the reaction between ozone and phenolic acids present in agro-industrial wastewaters. Water Res. 2001, 35, 1077–1085. [Google Scholar] [CrossRef]
  16. Brown, S.L.; Leonard, K.M.; Messimer, S.L. Evaluation of Ozone Pretreatment on Flux Parameters of Reverse Osmosis for Surface Water Treatment. Ozone Sci. Eng. 2008, 30, 152–164. [Google Scholar] [CrossRef]
  17. Kim, J.; Davies, S.H.; Baumann, M.J.; Tarabara, V.V.; Masten, S. Effect of ozone dosage and hydrodynamic conditions on the permeate flux in a hybrid ozonation-ceramic ultrafiltration system treating natural waters. J. Membr. Sci. 2008, 311, 165–172. [Google Scholar] [CrossRef]
  18. Lee, S.; Lee, K.; Wan, W.M.; Choi, Y. Comparison of membrane permeability and a fouling mechanism by pre-ozonation followed by membrane filtration and residual ozone in membrane cells. Desalination 2005, 178, 287–294. [Google Scholar] [CrossRef]
  19. Mulder, M. Basic Principles of Membrane Technology, 2nd ed.; Kluwer Academic Publishers: Dordrecht, The Netherlands, 1996. [Google Scholar]
  20. Kunst, B.; Sourirajan, S. An approach to the development of cellulose acetate ultrafiltration membranes. J. Appl. Polym. Sci. 1974, 18, 3423–3430. [Google Scholar] [CrossRef]
Figure 1. TOC apparent rejection coefficients for varying transmembrane pressures and feed circulating velocities in pretreated and non-pretreated effluents.
Processes 09 02182 g001
Figure 2. Representation of ln((1 − f)/f vs. the permeate fluxes in pretreated and non-pretreated effluents for feed flowrates of 100 and 200 L/h.
Processes 09 02182 g002
Figure 3. Representation of k vs. membrane type in pretreated and non-pretreated effluents for feed flowrates of 100 and 200 L/h.
Processes 09 02182 g003
Figure 4. Representation of f vs. membranes in pretreated and non-pretreated effluents for feed flowrates of 100 and 200 L/h.
Processes 09 02182 g004
Table 1. Casting solution compositions and film casting conditions. Main characterization parameters of membranes.
MembraneMCA4.1MCA4.2MCA4.3MCA4.4
Casting solution (weight %)
Cellulose Acetate17.017.017.017.0
Acetone61.056.048.043.0
Formamide22.027.035.040.0
Casting Conditions
Temperature (°C)25252525
Evaporation time (min.)0.50.50.50.5
Gelation medium (1.5 h)Water at 3 °C
Characterization
Lp (kg/h/m2/bar)2550105110
MWCO (Da)500015,00040,000100,000
Table 2. Main physicochemical characteristics of cork processing wastewaters.
ParameterValue
pH4.8
Conductivity3.3 (mS/cm)
Color16,600 (Hazen units)
TOC3225 (mg C/L)
Average colloid size363.3 nm
Total polyphenols365 mg/L (gallic acid)
Zeta potential−12.8 mV
Table 3. Mass transfer coefficient for each membrane, k, feed flowrate, and with or without ozone pretreatment.
k (m/s)
Without
Pretreatment
Ozone
Pretreatment
Without
Pretreatment
Ozone
Pretreatment
100 L/h200 L/h
MCA.14.7 × 10−67.7 × 10−66.6 × 10−62.2 × 10⁻⁵
MCA.25.3 × 10−67.5 × 10−67.4 × 10−62.5 × 10⁻⁵
MCA.36.5 × 10−67.7 × 10−66.5 × 10−63.8 × 10⁻⁵
MCA.44.6 × 10−64.8 × 10−67.9 × 10−61.1 × 10⁻⁵
Table 4. Intrinsic rejection coefficient f′ for each membrane, feed flowrate, and with or without ozone pretreatment.
f′ (%)
Without
Pretreatment
Ozone
Pretreatment
Without
Pretreatment
Ozone
Pretreatment
100 L/h200 L/h
MCA4.174595865
MCA4.268514959
MCA4.353383047
MCA4.44125527
Publisher’s Note: MDPI stays neutral with regard to jurisdictional claims in published maps and institutional affiliations.

