Article

Simulation and Performance Comparison for CO2 Capture by Aqueous Solvents of N-(2-Hydroxyethyl) Piperazine and Another Five Single Amines

State Key Laboratory of Chemical Engineering, Tsinghua University, Beijing 100084, China
*
Author to whom correspondence should be addressed.
Submission received: 28 October 2021 / Revised: 23 November 2021 / Accepted: 1 December 2021 / Published: 3 December 2021

Abstract

:
N-(2-Hydroxyethyl) piperazine (HEPZ) has a chemical structure similar to PZ and has less volatility. It is not easy to volatilize in a continuous operation device. It is studied to replace PZ as a promotor to increase the CO2 capture rate. This paper researches the lowest energy consumption and absorbent loss of HEPZ/H2O in the absorption-regeneration process, and compares it with another five amines, including PZ, MEA, 1-MPZ, AMP and DMEA. Based on the thermodynamic model, this work establishes a process simulation based on the equilibrium stage, assuming that all stages of the absorption and desorption towers reach thermodynamic equilibrium and CO2 recovery in the absorption tower is 90%. By optimizing the process parameters, the lowest thermodynamic energy consumption and absorbent loss of process operation are obtained. Our results show that HEPZ as a promotor to replace PZ and MEA has significant economic value. The lowest reboiler energy consumption of HEPZ with the optimal process parameters is 3.018 GJ/tCO2, which is about 35.2% lower than that of PZ and about 11.6% lower than that of MEA, and HEPZ has the lowest solvent loss. The cyclic capacity is 64.7% higher than PZ and 21.6% lower than primary amine MEA.

1. Introduction

The problem of global warming caused by excessive emission of greenhouse gases continues to pose a severe threat to the natural environment. CO2 is the main greenhouse gas [1]. The suppression of global warming and the reduction of CO2 emissions is a concern for many countries. Carbon capture, utilization and storage (CCUS) is one of the required emission reduction methods that can reduce carbon emissions on a large scale in the short to medium term, including the capture, transportation and storage of CO2. It is estimated that CCUS will contribute about 17% of the total cumulative emission reduction by 2035 [2]. There are three main types of CO2 capture technologies: oxy-fuel combustion, pre-combustion capture and post-combustion capture. Compared with the former two, the post-combustion capture technology has the slightest modification to coal-fired power plants, and the lowest cost of transformation and the operation of the power plant. The changes are minimal, so it is suitable for upgrading existing power plants [3]. Among the methods for capturing CO2 from flue gas of coal-fired power plants, amine scrubbing has been successfully applied in ammonia production and natural gas processes [4]. However, the regeneration of the absorbent is carried out by high-temperature heating, so the capture of CO2 based on alcohol amine solutions requires huge regeneration energy. Typically, the energy penalty associated with solvent regeneration is the largest contributor to operating costs [3]. This is the biggest challenge to post-combustion capture still in need of a solution. The power generation efficiency of a typical 500 MWe supercritical power plant is about 44%, and when the carbon capture process is added, the power generation efficiency can be reduced by 9.4–10.6% [5], and some power plants’ power generation efficiency can lose up to 25% [3]. In order to reduce the cost, research has been carried out on several aspects: the development of new absorbents, high-efficiency separation equipment and enhancing technological processes.
The loss of organic amines in the absorption process roughly comes from the following scenarios: reactions with residual oxygen in the flue gas (oxidative degradation), thermal degradation at high temperatures (mainly occurs during the operation of the desorption tower) and volatilization of absorbents. Therefore, as an absorbent, amine has good CO2 absorption and desorption capabilities. Still, it also needs to have less oxidative degradation and high-temperature degradation, along with low vaporization. The influence of the organic amine solution’s viscosity cannot be ignored: the higher the viscosity, the slower the mass and heat transfer rate, which leads to an increase in the size of heat exchangers. Similarly, with a lower mass transfer and reaction rate, the need to increase the size of the absorption and desorption tower will also put pressure on the capital. Ideally, high-performance chemical absorbents generally need to have the following properties [6]: The large circulating absorption capacity can reduce the circulating volume of the absorbent, thereby reducing the power of the pump and reducing the energy consumption of the reboiler. The large absorption rate reduces the size of the absorption tower, thereby reducing facility investment. Low degradation and volatility can decrease the solvent replenishment and the environmental pollution, and low viscosity can reduce the size of packing, and of heat exchangers. The low heat of the reaction can reduce the energy consumption required for solvent regeneration.
Different organic amines have different structures, so their absorption characteristics are different due to various absorption mechanisms. Primary and secondary amines have a fast reaction rate, low absorption capacity and high absorption heat [7]. Tertiary amines and sterically hindered amines have high circulating absorption capacity, slow absorption rate and low heat of absorption [6,8,9]. The mixed amine system refers to a mixed system of amines with different reaction mechanisms, which combines the advantages of two alcohol amines with a high circulating absorption capacity and a rapid absorption rate. For example, the primary amine MEA and cyclic amine PZ with a fast absorption rate are added to a sterically hindered amine with a high capacity [10,11,12]. MEA is the most commonly used absorbent in the process of absorbing CO2 by amine scrubbing, with the most extended history of use. Due to the accumulated process experience and performance, it is often considered as the reference solvent for new absorbents. Nevertheless, the regeneration energy of the MEA solvent to capture CO2 is too high and MEA will degrade during desorption operation with high temperature, which will lead to an increase in the cost of overall carbon capture and is unacceptable for long-time, large-scale carbon capture deployment. Due to the fast absorption rate, PZ is usually added to the amine system as a promotor to increase the carbon absorption rate of the system. The disadvantage of piperazine as a promotor is its low boiling point and high melting point. It is easy to crystallize at low temperatures and cannot be configured with higher concentration solutions, therefore reducing the absorption capacity. Its boiling point of 146 °C is within 120–160 °C, the range of maximum working temperature of device, so it is easy to volatilize in the continuous absorption and desorption device and causes solvent loss. Then, PZ derivatives have similar molecular structures as PZ and have also been researched for their activation performance in recent years [13,14,15].
As one of the PZ derivatives, HEPZ has the highest boiling point of 246 °C and better thermal stability than PZ. Therefore, in industrial applications, it can withstand higher temperatures and potentially replace PZ as a promotor. However, only a part of the kinetic-related research [13,14] and CO2 solubility of HEPZ/H2O has been studied [13]. There is a lack of thermodynamic modeling and process simulation of the system HEPZ/H2O/CO2. The advantage of HEPZ instead of PZ to capture CO2 is only based on theoretical analysis of physical properties and has not been verified by experiments or process simulations. The pilot-scale study on the new absorbent can obtain its economic performance and process energy consumption to evaluate and promote its industrial application. However, the pilot plant experiment requires time and expense. The new absorbent can be simulated in the Aspen Plus® platform before the pilot-scale study, and compared with the widely used absorbents such as MEA and PZ, in the energy consumption, absorbent loss and cyclic absorption capacity, to evaluate whether it has the value of the pilot-scale study.
With process simulation, parametric studies can be carried out for analysis of a post-combustion CO2 capture plant. Abu-Zahra et al. [16] established a CO2 capture process based on absorption/desorption with MEA solutions and conducted a parametric study of the economic performance. The optimization included investigating the effect of CO2 removal percentage, MEA concentration, lean solvent loading and stripper operating pressure. In addition to the process design parameters, the impact of economic parameters such as fuel prices and interest rate was investigated. Liang et al. [17] presented the simulation of a monoethanolamine (MEA)-based CO2 capture and compression process, and conducted an optimization of some important process parameters, including the operating stripper pressure, CO2 capture efficiency and steam extraction location. Dash et al. [18] used the absorption-regeneration process with aqueous (AMP + PZ) solvents of 30–50 wt.% total amine concentration simulated by the RadFrac-RateSep block in the Aspen Plus® platform to study the effect of amine concentration, L/G, column pressure and packing height on CO2 capture rate, the effect of column pressure on temperature profile and the reboiler duty for CO2 capture at a constant L/G. Dubois and Thomas [19] studied different CO2 capture process configurations applied to the flue gas coming from the cement plant and using three different solvents: MEA, PZ and PZ-MDEA blend. For each configuration and solvent, parametric studies were carried out in order to identify the operating conditions (L/G, split fraction, flash pressure variation, etc.) minimizing the solvent regeneration energy. Ayittey et al. [20] carried out detailed parametric analyses on a post-combustion CO2 capture system using a hot potassium carbonate solution using a rate-based simulation study. The effect of system parameters on CO2 capture rate and stripper reboiler duty were studied: reflux ratio of stripping column, lean solvent flowrate, flue gas flowrate, lean solvent concentration, lean solvent temperature, flue gas temperature and absorber operating pressure. Changes in the lean solvent concentration (from 25 to 45 wt.%) and absorber operating pressure (from 0.5 to 2.5 MPa) were observed to have the most significant effects on the overall performance of the capture system.
Our previous research measured the thermodynamic properties and established a HEPZ/H2O/CO2 model in Aspen Plus® platform. The physical parameter system required to establish a process simulation has been obtained. In this work, a process simulation model was established based on the previous thermodynamic model to study the lowest energy consumption and corresponding operating parameters in the operation of the process. The operating parameters of the process with the lowest energy consumption were explored and the cyclic capacity and absorbent loss of HEPZ, PZ and MEA under the lowest energy consumption were compared.

2. Materials and Methods
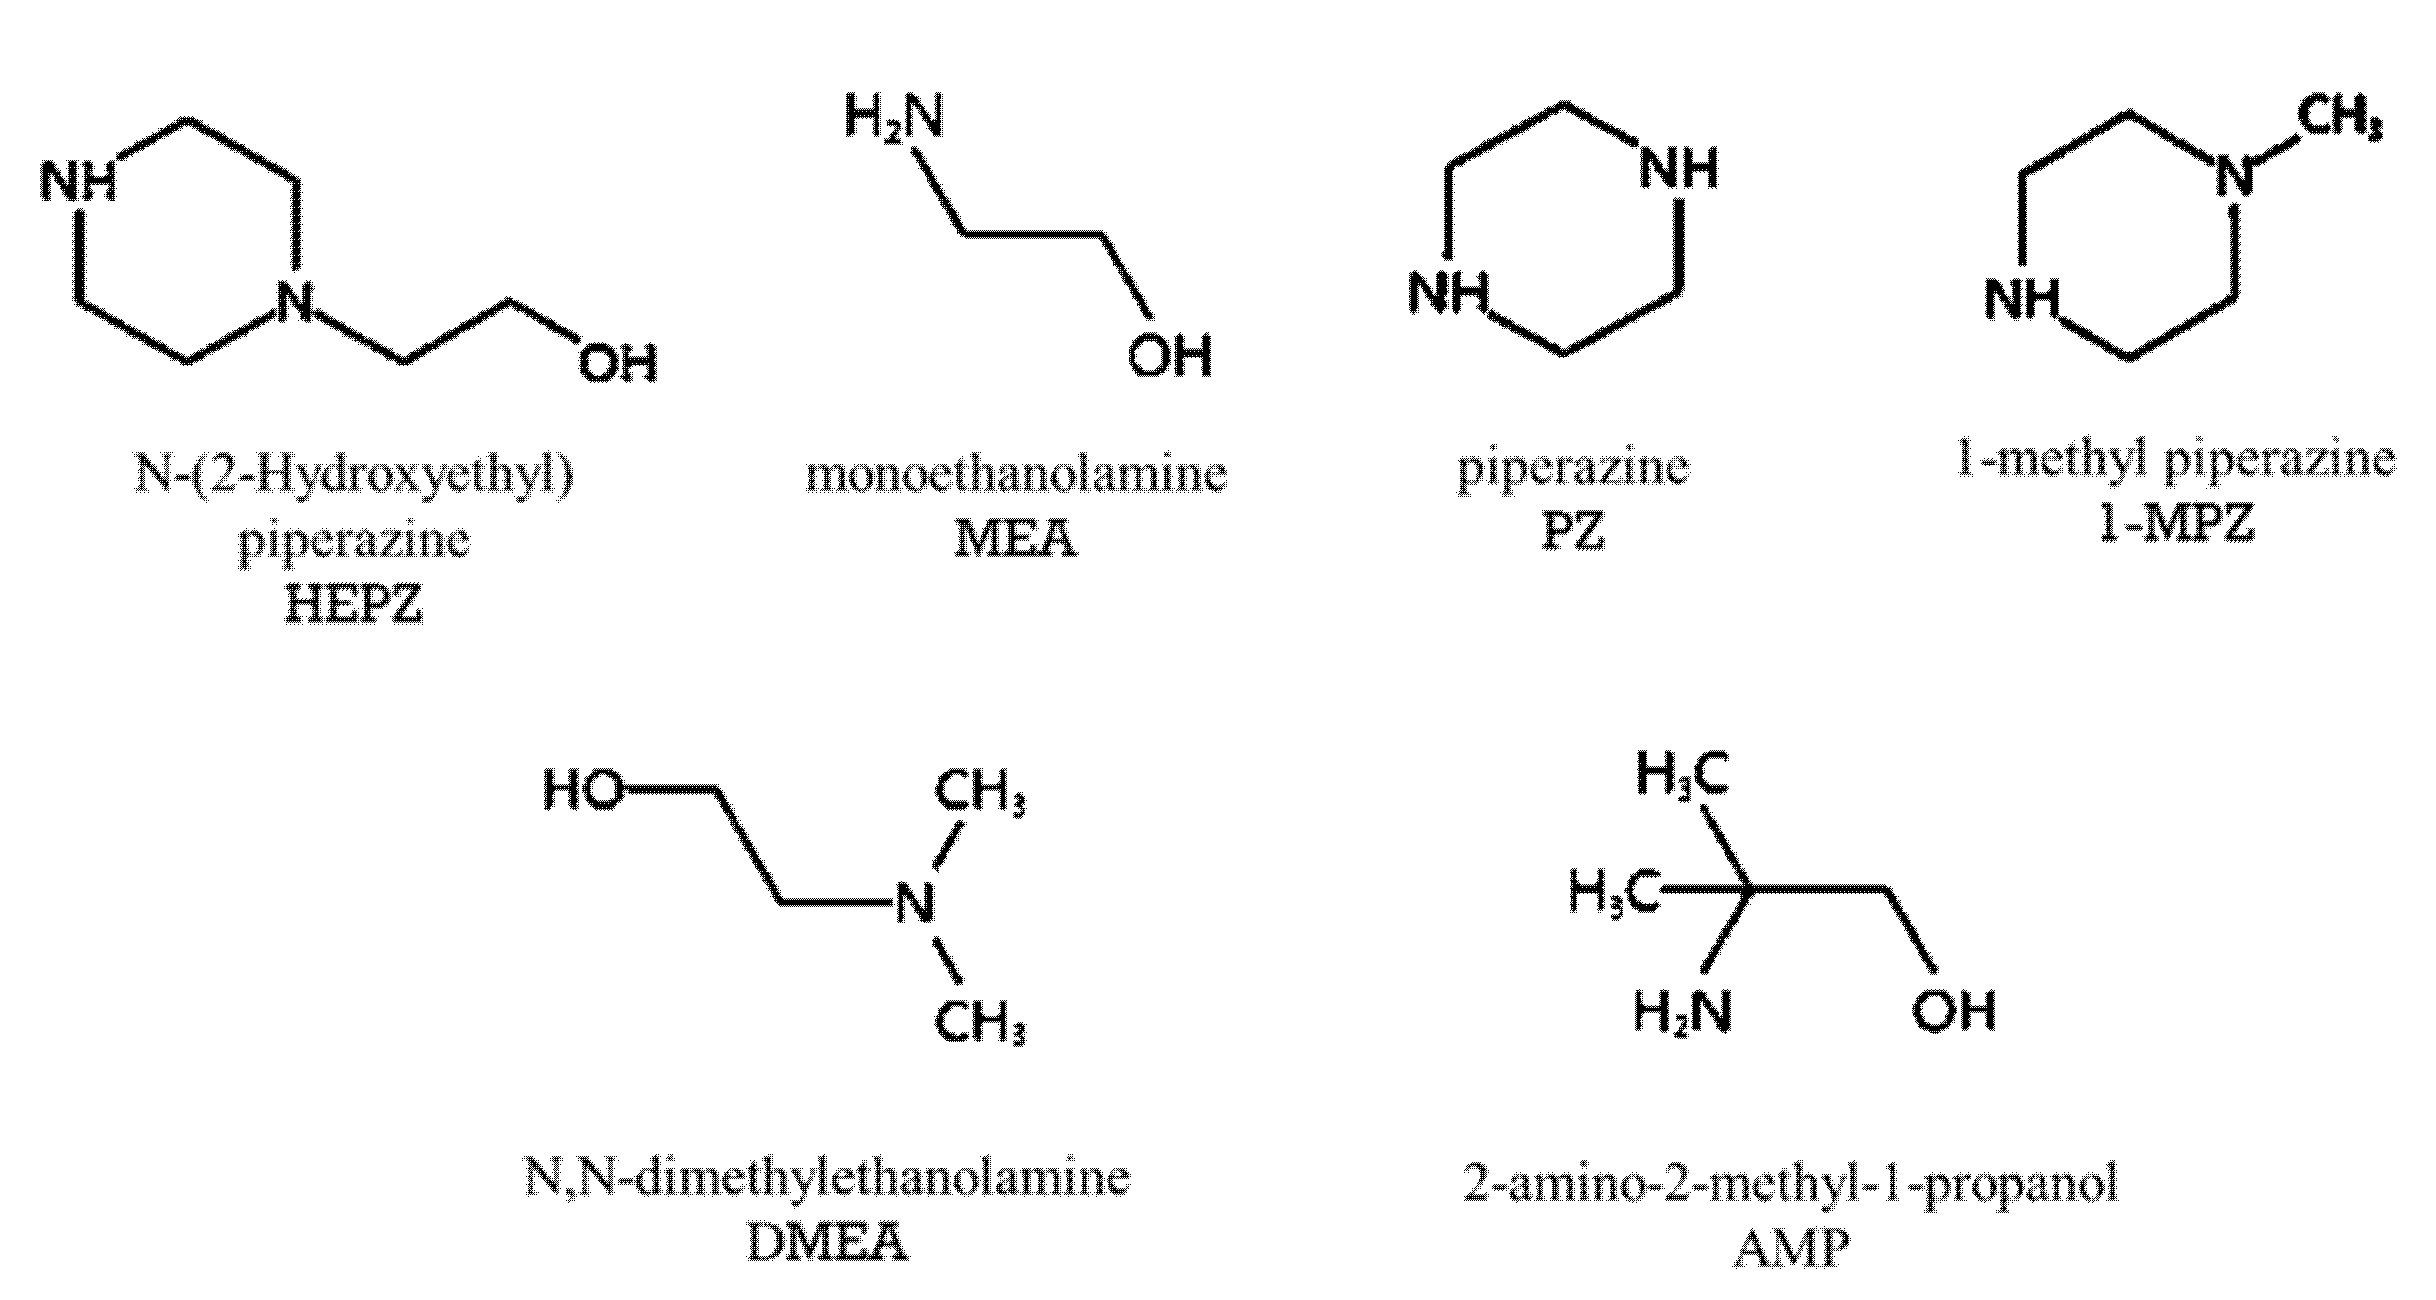
2.1. Absorbent

The abbreviations and molecular structures of the absorption reagents studied in this work are shown in Figure 1. Table 1 lists some of the physical property parameters and information of these solvents. In addition to the new absorbent HEPZ that is mainly studied, there are also a variety of absorbents used for comparative evaluation of its performance. According to molecular structures, the amine absorbents currently studied in the literature are classified into primary amines, secondary amines, tertiary amines, sterically hindered amines and polyamines. In order to thoroughly compare the performance difference between HEPZ and different absorbents, the primary amines: monoethanolamine (MEA), piperazine (PZ) and piperazine derivative 1-methyl piperazine (1-MPZ), sterically hindered amine 2-amino-2-methyl-1-propanol (AMP) and tertiary amine N, N-dimethylethanolamine (DMEA), were selected and studied. MEA has the longest industrial application and is usually used as a benchmark for comparison between various absorbents [21,22,23,24]. Concerning, 1-MPZ, with a molecular structure similar to PZ, its solubility and absorption rate have been shown by many studies [13,14,25,26]. AMP is a sterically hindered amine, and its product reacted with CO2 is unstable and easy to desorb, which is the same as DMEA—the isomer of AMP. Both have low absorption heat and desorption heat, but their absorption rate is slow [27], and the CO2 solubility at low temperature and low pressure is poor [28]. The thermodynamic parameters of the above absorbents were all obtained by the method in Section 2.2.2.

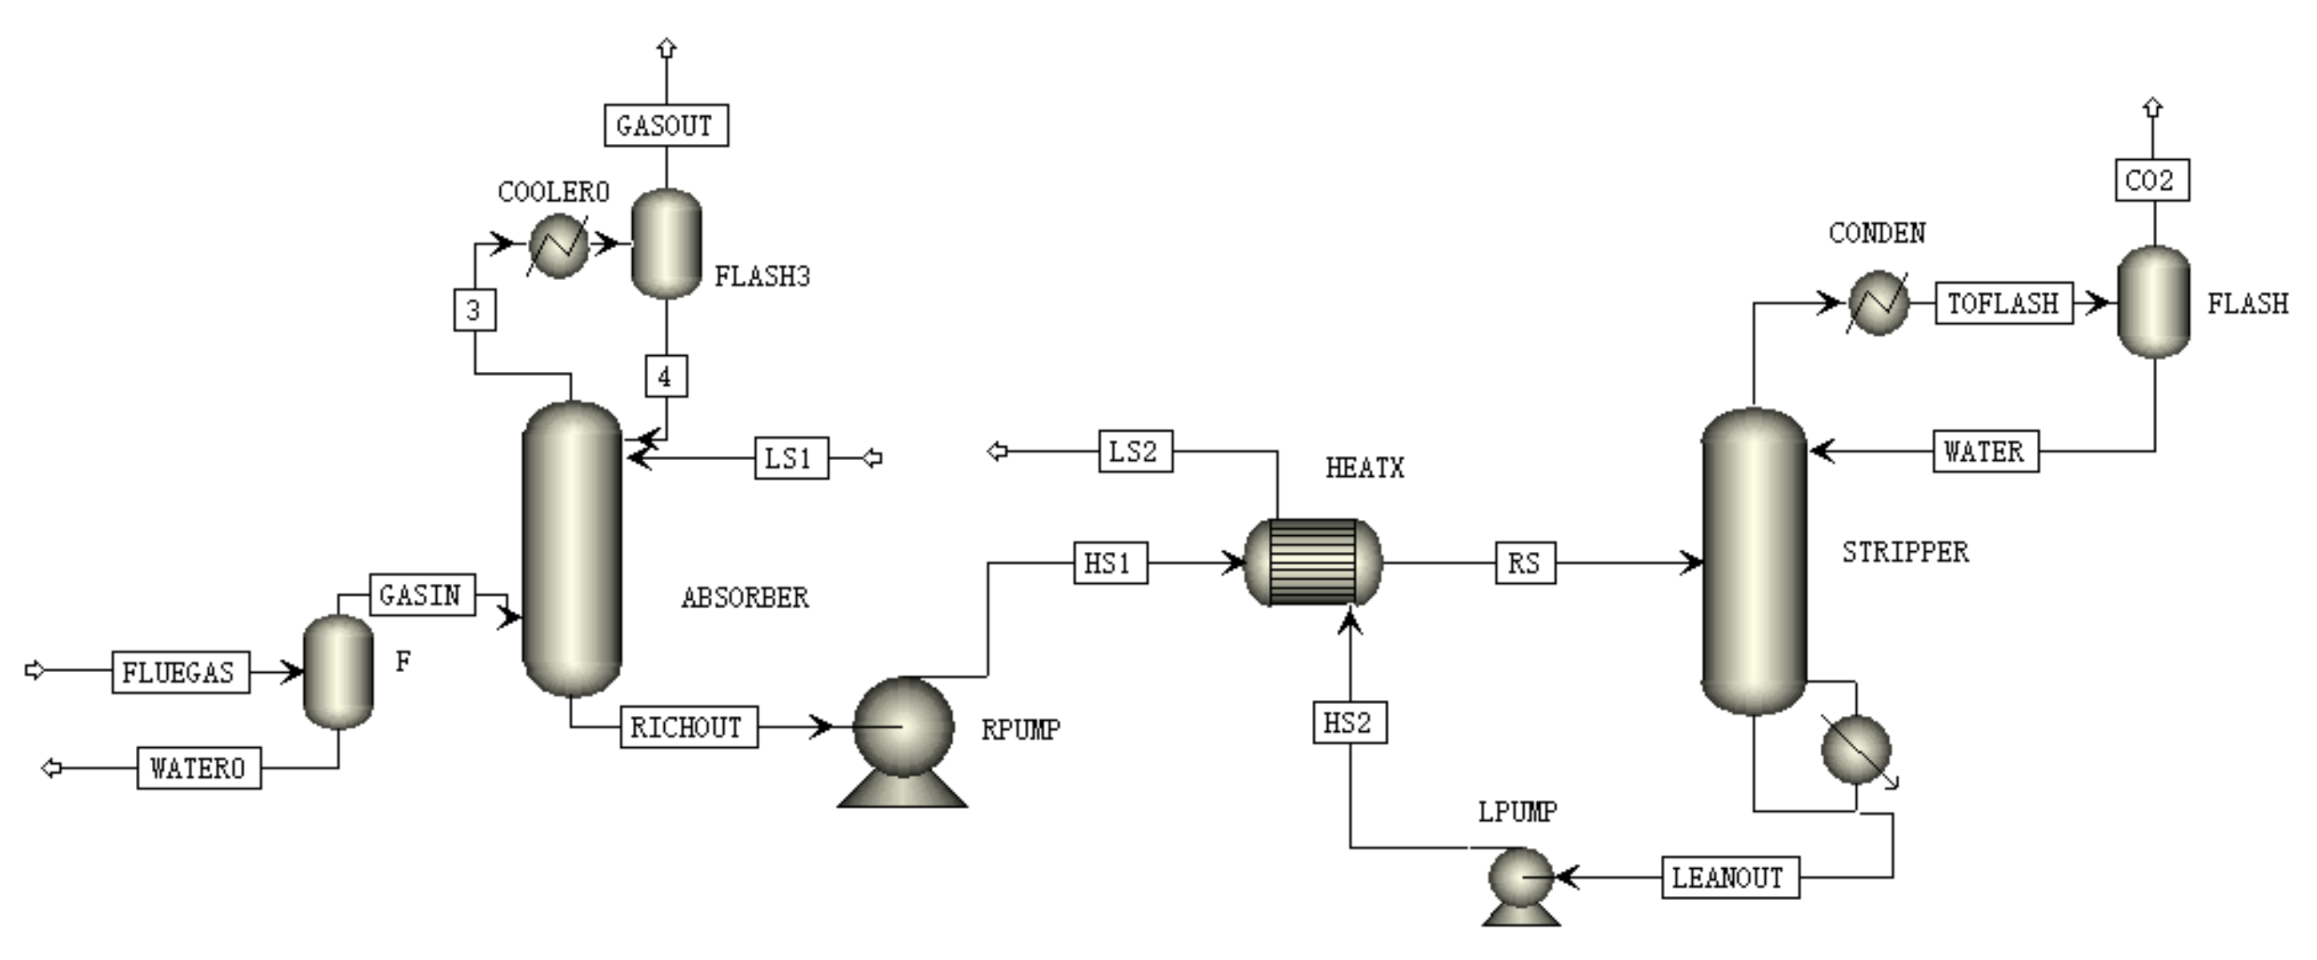
2.2. Process Simulation

2.2.1. The Modeling Object

In the process of amine scrubbing, pumps, condensers, reboilers and compressors all consume energy. The two most energy-consuming parts are the reboiler and compressor. The compressor is used to compress the high-purity CO2 gas desorbed from the top of the regenerator. Therefore, its energy consumption depends only on the pressure of the regenerator. If the pressure of the regenerator is high, the compression energy consumption will be low, while the pressure of the regenerator depends on the high resistance to oxidative and thermal degradation of the absorbent. This is due to the fact that high desorption pressure will make the desorption temperature higher. Different absorbents have different resistance to degradation at high temperatures, and absorbents that can withstand higher temperatures can be desorbed at higher pressures. The degradation of absorbents is not within the scope of this work, and all absorbents are compared under the same desorption pressure, so their compression energy consumption is the same. The energy consumption of the reboiler is determined by the CO2 cyclic capacity and the heat of CO2 desorption of the absorbent, which is the main research content in this work. Firstly, an accurate thermodynamic model of the capture system was established using data from experiments and the literature. On this basis, a process simulation based on the thermodynamic-equilibrium model was established, and it was assumed that both the absorber and the regenerator reached thermodynamic equilibrium and the influence of kinetics was not considered. The lowest energy consumption of each absorbent was obtained by optimizing the process parameters. In order to evaluate the performance of HEPZ instead of PZ as a promotor, simulation models of HEPZ, PZ and MEA as absorbent systems were established in this work, and the energy consumption, cyclic absorption and absorbent loss of the three were compared, respectively.

2.2.2. Physical Parameter System

In the processing system, there are components H2O, CO2, N2, HEPZ, H3O+, OH-, HCO3, CO32−, HEPZH+, HEPZH22+, HEPZCOOH and HEPZCOO, and the physical property method is ENRTL-RK. Establishing a process simulation model requires a complete physical parameter system, including the necessary physical parameters of amines in the system, the interaction parameters of the nonrandom two-liquid model (NRTL) and the electrolyte nonrandom two-liquid (ENRTL) activity coefficient model, along with the standard state properties of amine ions. The physical property parameters and interaction parameters between the HEPZ molecule and various ions in the system are lacking in the Aspen database. It is necessary to perform regression fitting on the heat capacity, saturated vapor pressure and vapor–liquid balance and solubility of amine data. A rigorous thermodynamic model was established to obtain the physical property system, and the specific modeling method is described in detail in [29]. In our previous work, CO2 solubility was measured for HEPZ aqueous solutions at three concentrations—5, 15 and 30 wt.%, and four temperatures—313.15, 343.15, 373.15 and 393.15 K. The VLE data for HEPZ/H2O were obtained at a pressure of 30–100 pKa, within a whole mole-fraction range. By regressing and fitting data from experiments and the literature, the parameters of NRTL and ENRTL were obtained, and the standard thermodynamic parameters of the new substances HEPZH+ and HEPZH22+, which were not in the database of Aspen, were manually adjusted to fit the dissociation constant of HEPZ. The equilibrium constant can be calculated from the standard state properties of the reactants and products. Knowing the standard Gibbs free energy, the standard enthalpy of each component’s formation and the heat capacity in the reference state in the reaction equilibrium equation, the equilibrium constant of each reaction can be calculated. In the work of [30], we could obtain pKa1 and pKa2 of HEPZ, so the equilibrium constants of the hydrolysis reactions of HEPZ could also be obtained. Therefore, the calculated equilibrium constant can be used to verify whether the standard state properties of the reactants and products are correct. The pKa curve was compared with the experimental data in [30], and the value of the standard property is manually adjusted if there is any deviation. In this work, the obtained pKa curve agreed well with the experimental data. More detailed descriptions can be found in [31].
This accurate thermodynamic model can predict the thermodynamic properties and absorption performance of the CO2 capture system, which provides reliable physical properties for the establishment of process simulation. The physical parameters of the model are listed in the previous work [31].

2.2.3. Process Description and Main Process Parameter Setting

A schematic diagram of the amine scrubbing process simulation is shown in Figure 2. The main equipment in the process is an absorber and regenerator, and the auxiliary equipment includes pumps, heat exchangers, condensers and flash tanks. The absorber and regenerator are modeled by RadFrac in Aspen Plus® platform, using the equilibrium model. FLUEGAS with a temperature of 110 °C, a pressure of 1 bar and a flow rate of 499.8 kg/h is first flashed by a flash evaporator, the purpose of which is to reduce the flue gas temperature to 40 °C and ensure that the water in the flue gas reaches saturation. The composition of flue gas is (volume fraction): 8% H2O, 10% CO2, 76% N2 and 6% O2, which was referenced by the experimental values of the pilot plant. Then, GASIN enters from the bottom of the absorber, contacts with the absorbent in the countercurrent and is evacuated from the top of the absorber after condensation, separation and liquid reflux. The temperature of the condenser is 40 °C, and the temperature of LS1 is also set to 40 °C. After RICHOUT is pressurized to 2.5 bar by the pump, the HS1 exchanges heat with the high-temperature lean liquid from the regenerator. The lean-rich heat exchanger is modeled using the Aspen® Heatx model. The minimum heat transfer temperature difference is set to 10 °C, and the temperature of the condenser at the top of the desorption tower is set to 40 °C. The number of plates in the absorber is sufficient to ensure that the absorber reaches the thermodynamic equilibrium, which is generally 40. When operating the process, the converged calculation result of the operation for the absorption tower with 40 plates was basically the same as the result for the absorption tower with more plates. For the desorption tower, the thermodynamic equilibrium can be achieved with fewer plates by our simulation, and it is sufficient to set the number of plates in the regenerator to 10, as suggested by Oyenekan and Rochelle [32]. The top plate’s pressure of the absorber is 1 bar, and the pressure drop of 0.2 bar is considered for both towers. Some design specifications for the reboiler duty and the lean-rich heat exchanger are incorporated to converge the flow sheet in a closed loop. The design specifications require that the CO2 removal ratio reaches 90% and the CO2 loading of LS1 is equal to the CO2 loading of LS2. The value range of the flow rate of LS1 and reboiler duty is set and the program is run. The program can calculate the accurate values of the flow rate of LS1 and reboiler duty. The parameters of LS1 with the lowest reboiler duty are explored by changing the amine concentration and CO2 loading.

2.3. Regeneration Energy Study

This work studied the regeneration energy consumption, absorbent loss and cyclic capacity of different absorbents in the process of capturing CO2. The goal of optimizing process parameters is to obtain the lowest energy consumption of the reboiler at 90% CO2 recovery. The adjustable process parameters include solvent concentration, lean loading of LS1 and liquid–gas ratio, L/G. When the reboiler heat duty reaches the minimum value, the cyclic capacity and absorbent loss of different absorbents for capturing CO2 can be obtained. The absorbent with the lowest regeneration energy consumption, the least absorbent loss and the largest cyclic capacity has the best economic benefits and potential for factory promotion.
The regeneration energy is determined by the CO2 cyclic capacity of the absorbent and the heat of CO2 desorption, which is the main research content of this study. The energy consumption of the reboiler is mainly used in three parts: water evaporation, CO2 desorption and liquid heating. The evaporation heat of water and the liquid heating heat are determined by the CO2 cyclic capacity. The higher the CO2 cycle absorption, the lower the amount of absorbent, which will reduce the water evaporation heat and heat for liquid heating. In order to analyze the total energy consumption, that is, the composition of the reboiler energy consumption, Q r e b , the desorption part, including the heat exchanger, can be calculated as follows:
Q r e b = H C O 2 + H l e a n i n 2 H t o h e a t x 1 Q c o n
where Q c o n is the heat of condensation of water, H C O 2 + H l e a n i n 2 H t o h e a t x 1 is the sum of the heat Q T required to heat the rich liquid at the bottom outlet of the absorption tower and the heat Q a b s required to desorb from the rich loading to the lean loading. Q T is obtained directly from the heat capacity, and the calculation formula is as follows:
Q T = C p toheatx 1 × F mass , toheatx 1 × ( T leanin 2     T toheatx 1 / F mass , C O 2
where C p t o h e a t x 1 and F m a s s , t o h e a t x 1 are the heat capacity and mass flow rate of rich liquid TOHEATX1, respectively, and F m a s s , C O 2 is the mass flow rate of CO2 at the top of the desorption tower. After obtaining Q T , the value of Q a b s can be calculated as:
Q a b s = Q r e b + Q c o n Q T
This work studies the influence of absorbent concentration and process parameters on the total energy consumption of the reboiler and its three parts. By comparing energy consumption under the optimal operating conditions of each absorbent, the potential of HEPZ as a new absorbent is evaluated. In Section 3.1, the effect of these process parameters on the reboiler energy of each absorbent is discussed. According to the discussion, the optimal process parameters that could minimize the energy consumption of the reboiler were obtained, as presented in Section 3.2. When optimizing process parameters, the effect of a certain process parameter was studied while keeping other process parameters fixed. The optimal value of one process parameter was selected, then the optimal value of the next process parameter was studied.

3. Results and Discussion

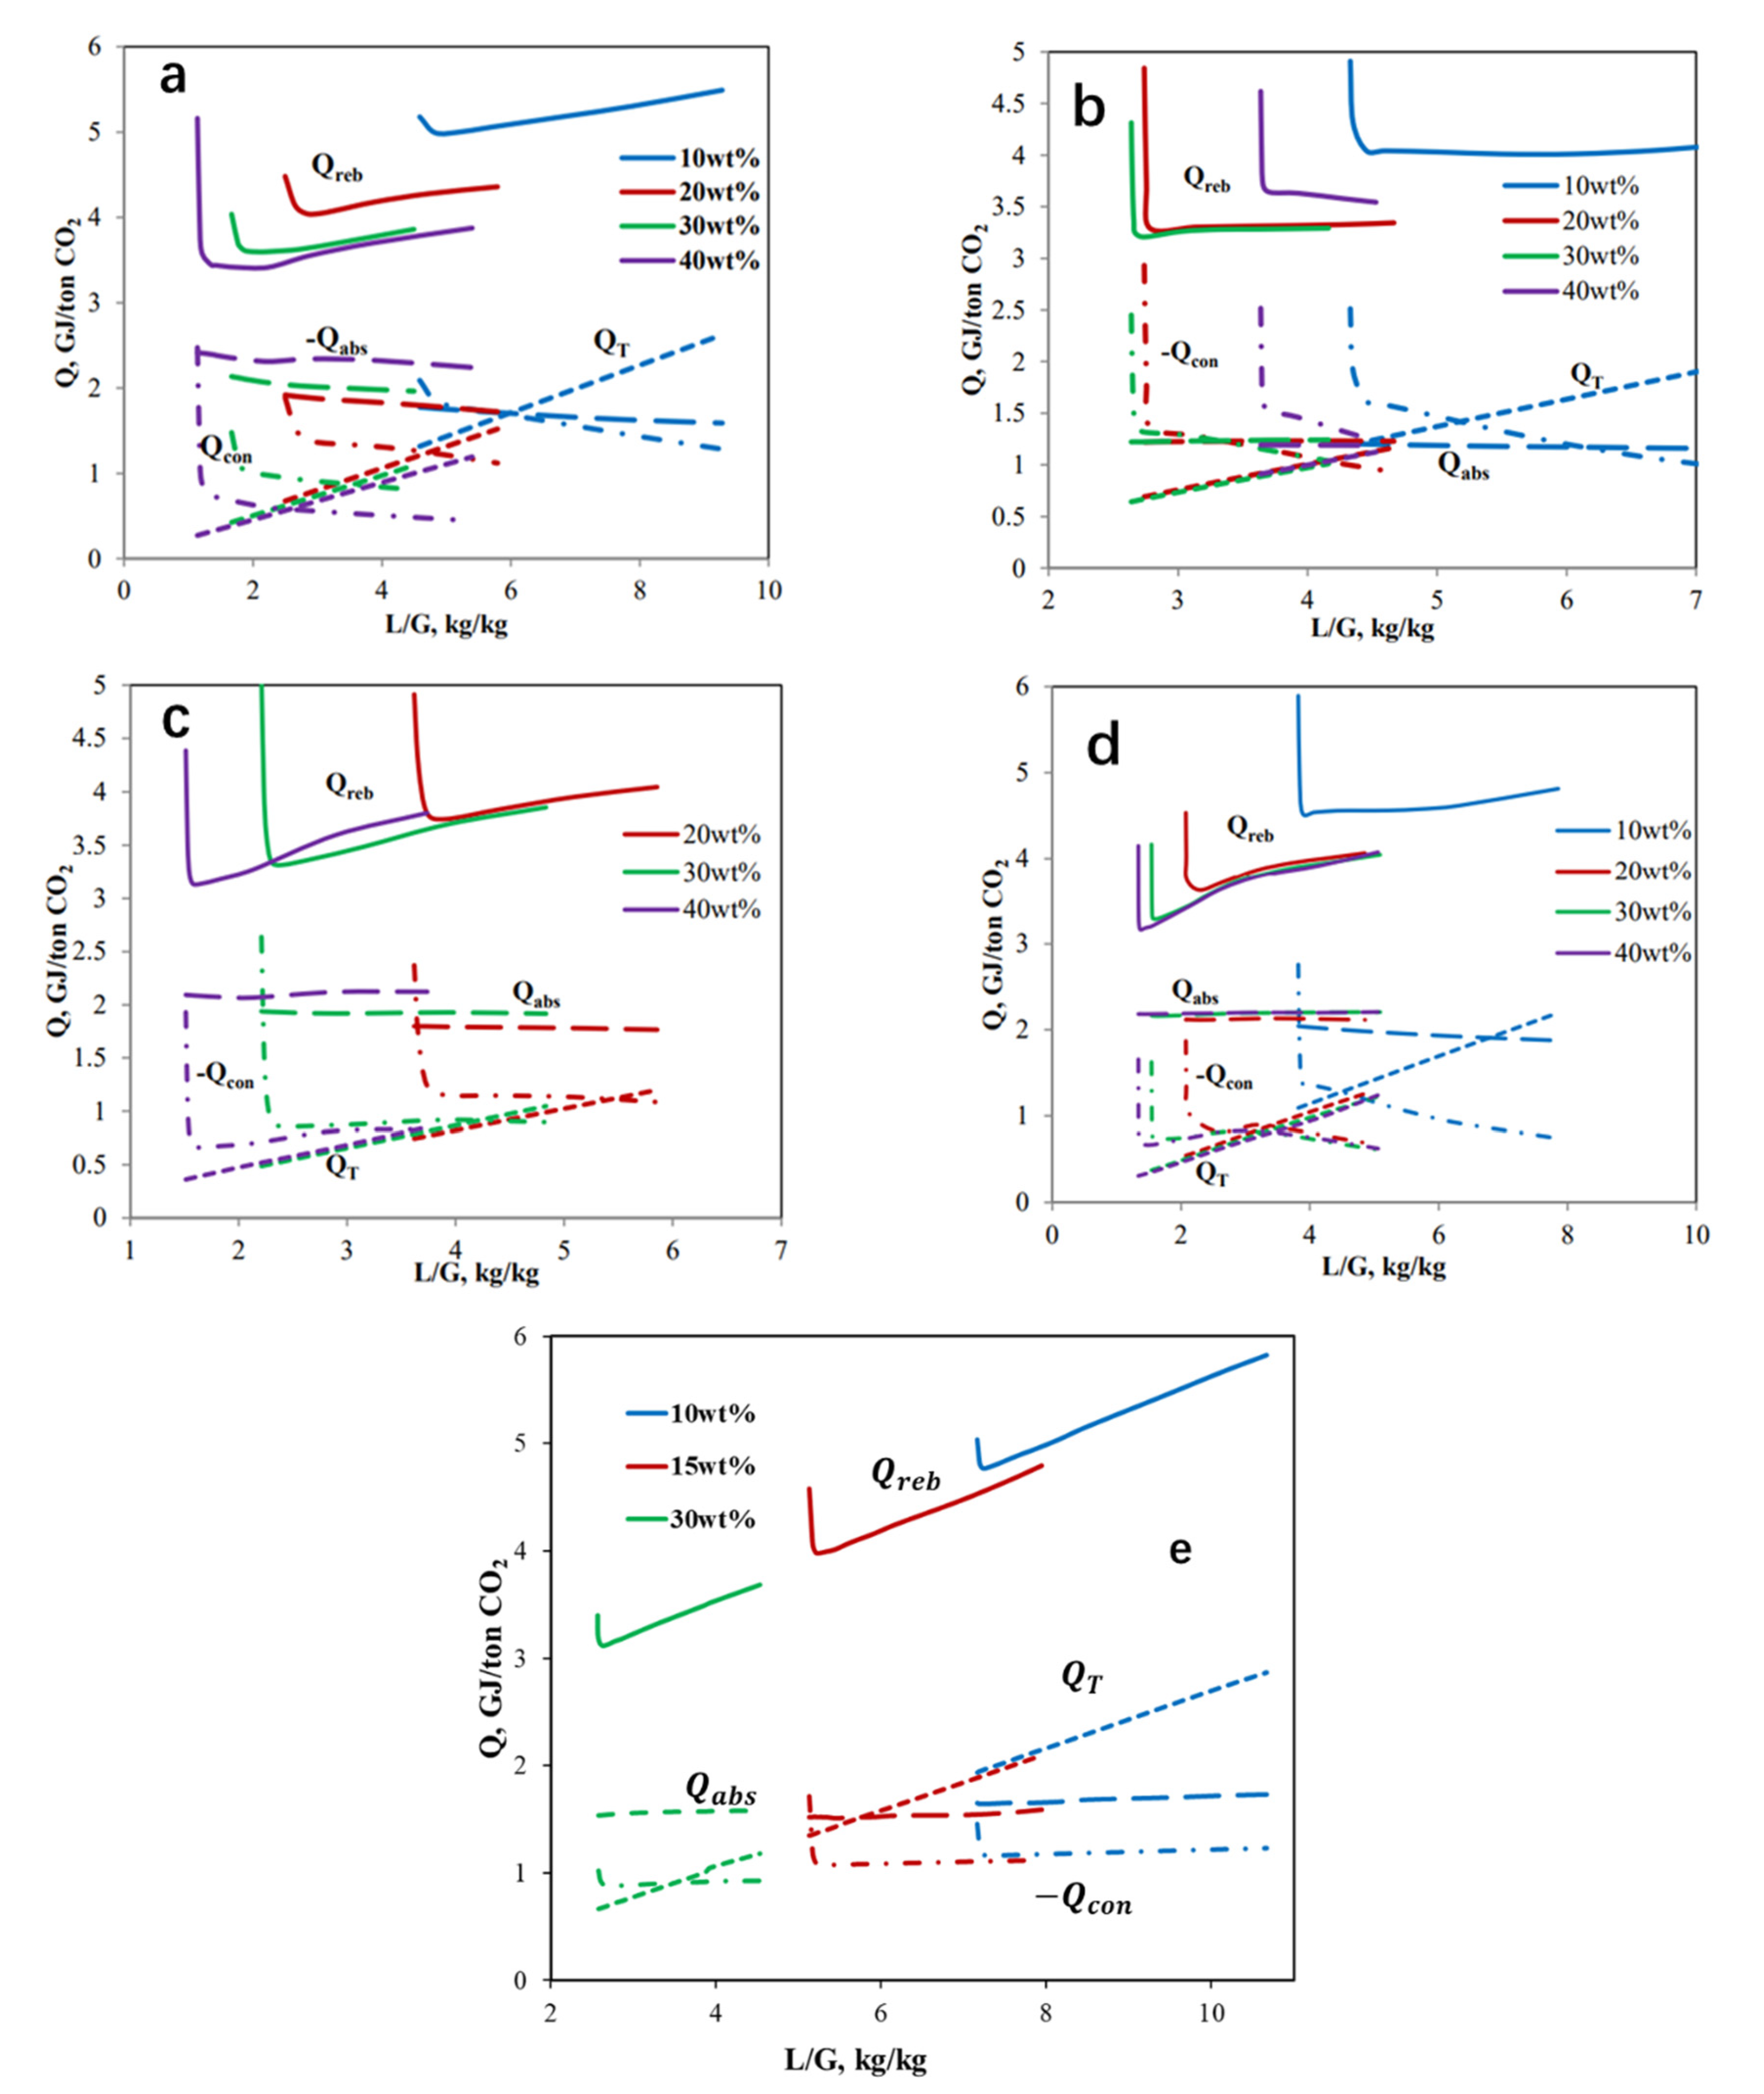
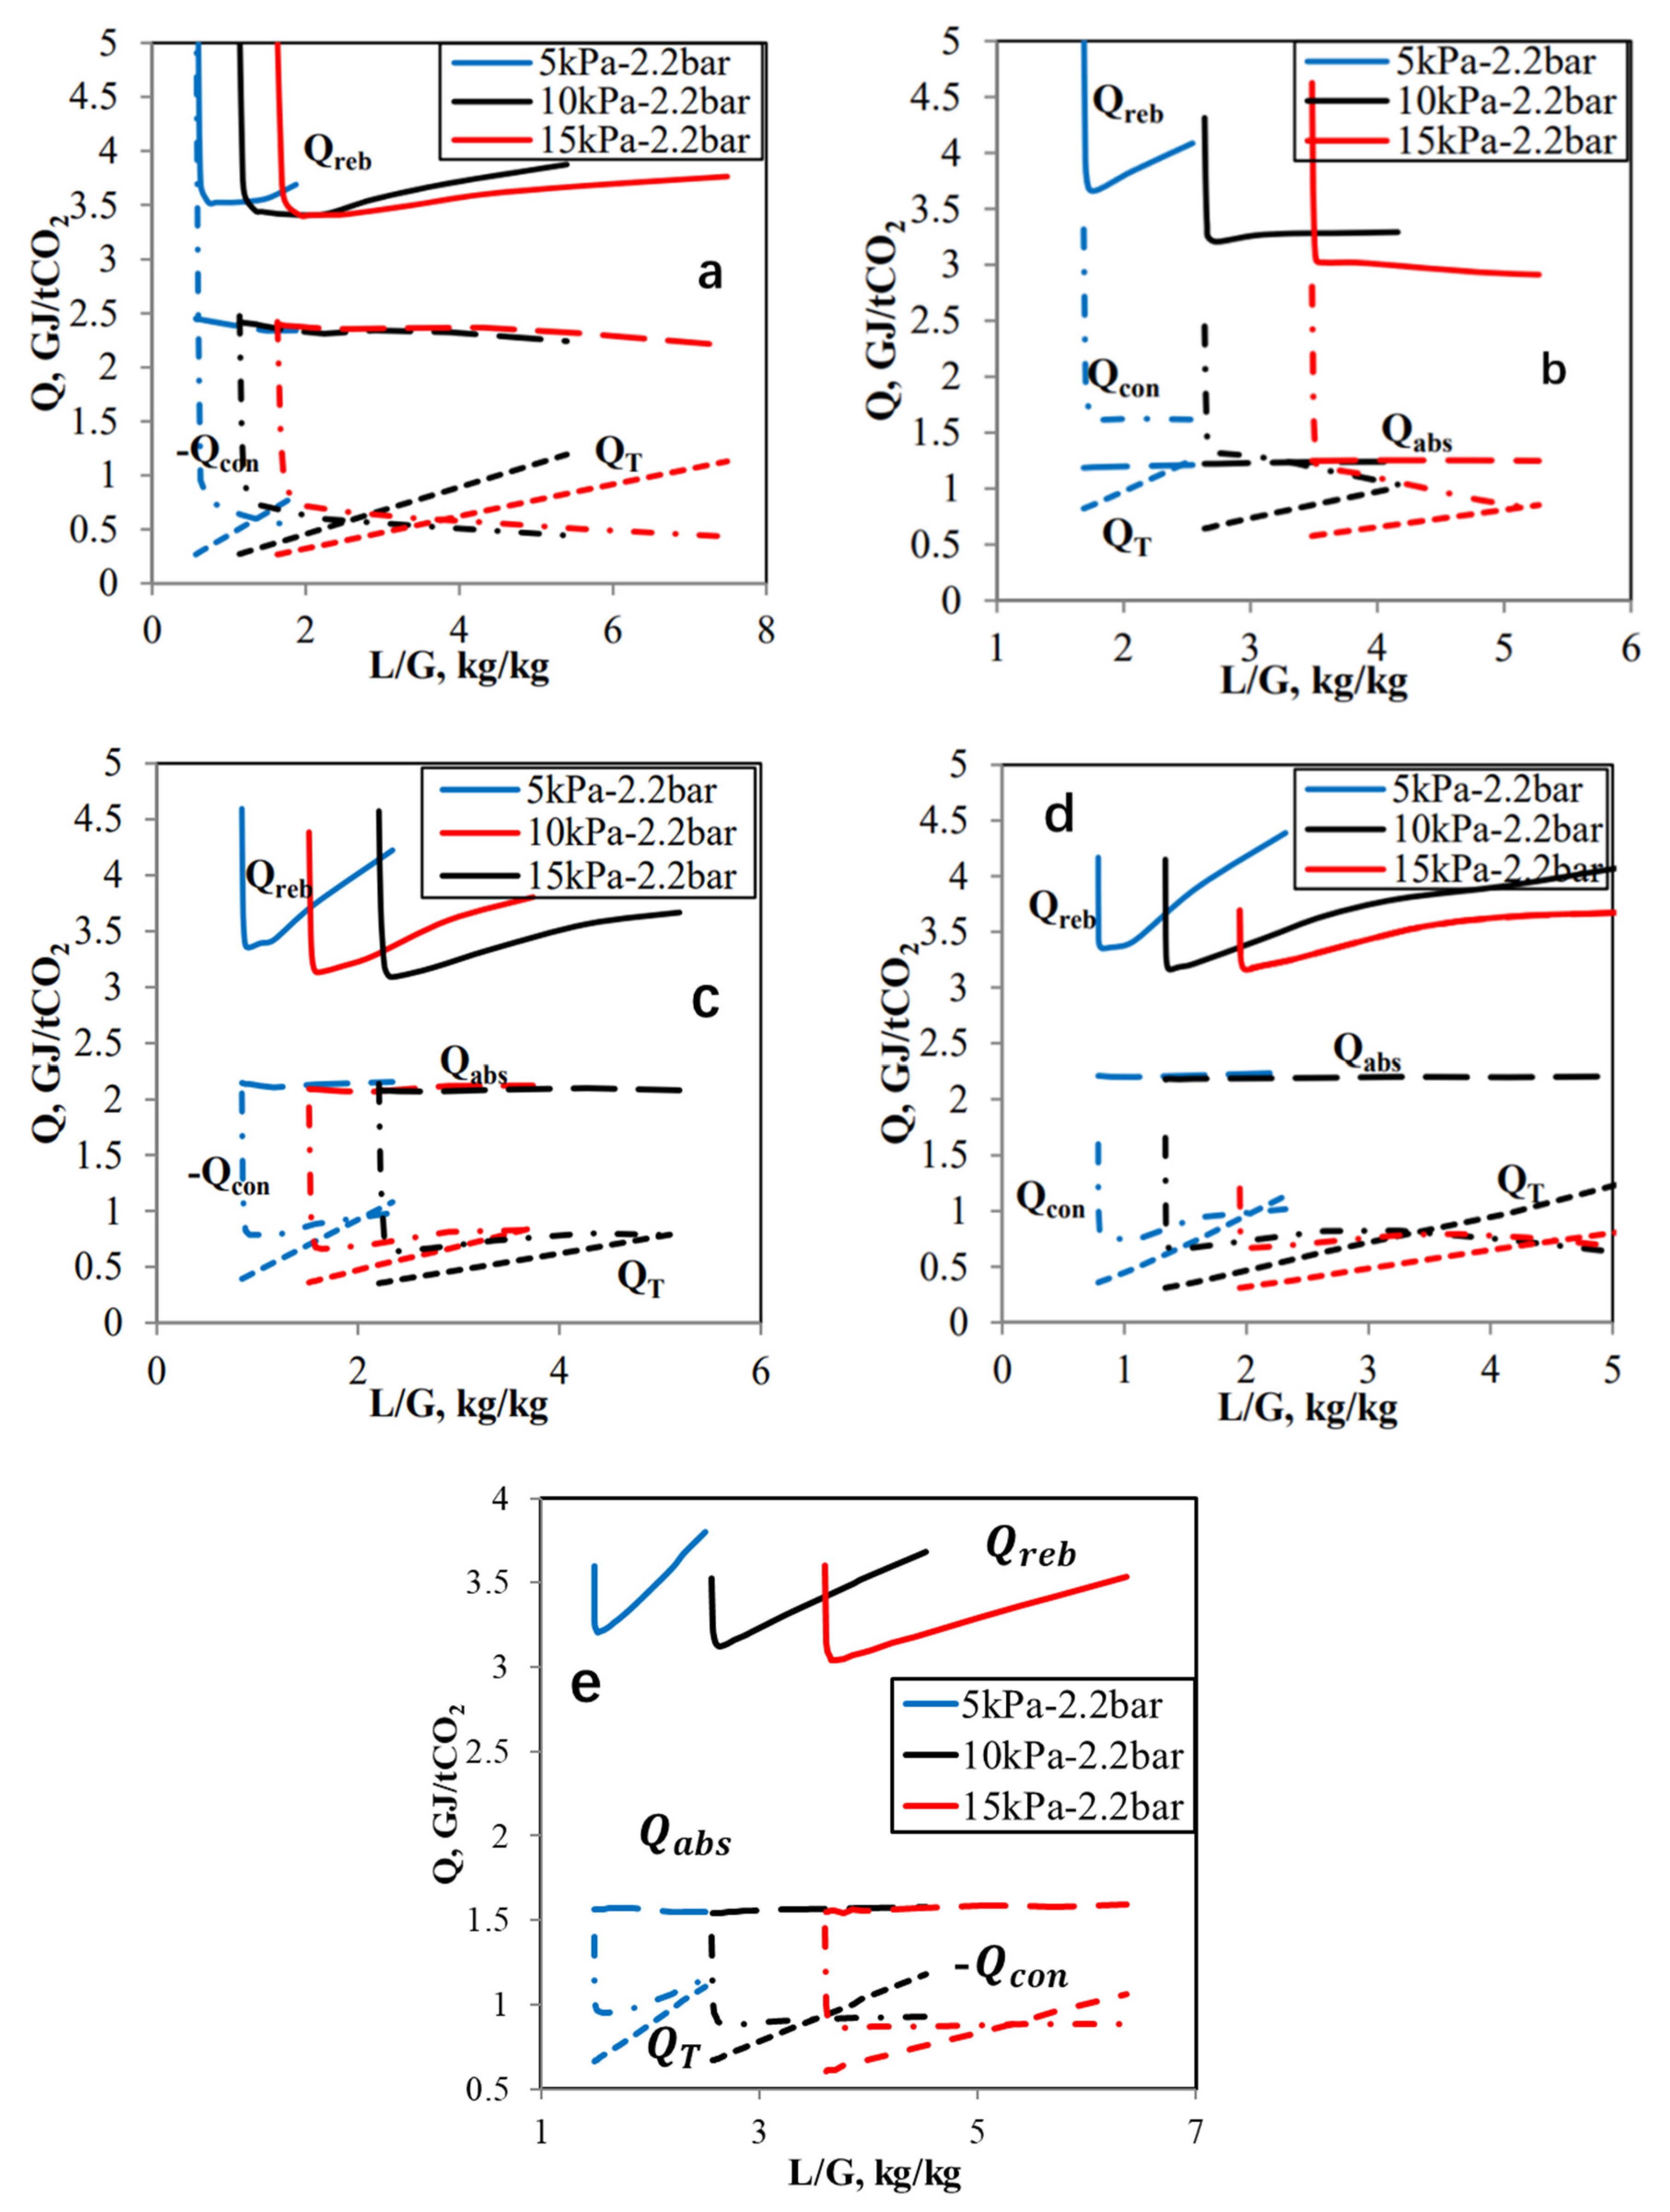
3.1. Influence of Process Parameters on Reboiler Energy

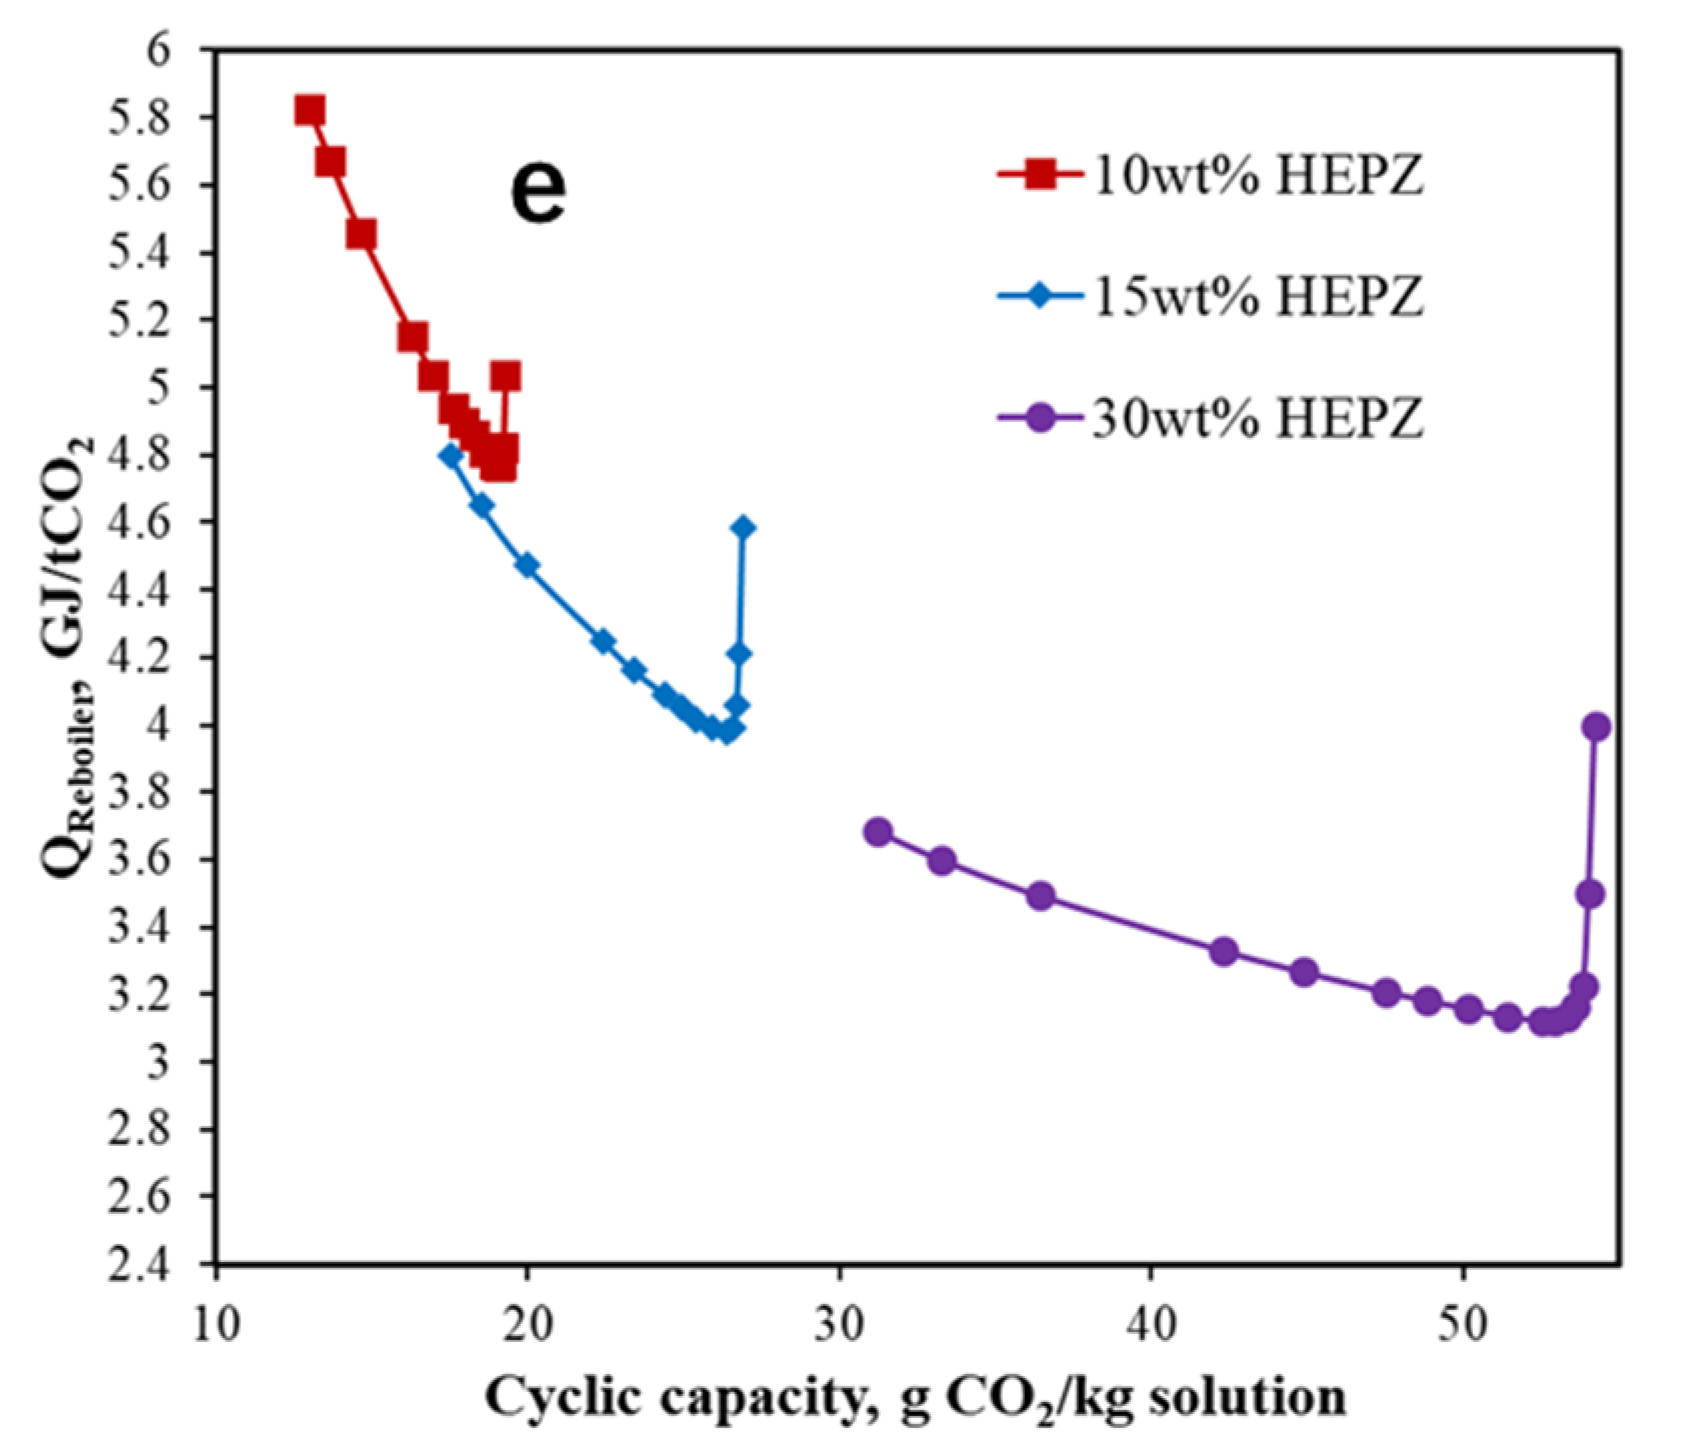
3.1.1. Solvent Concentration
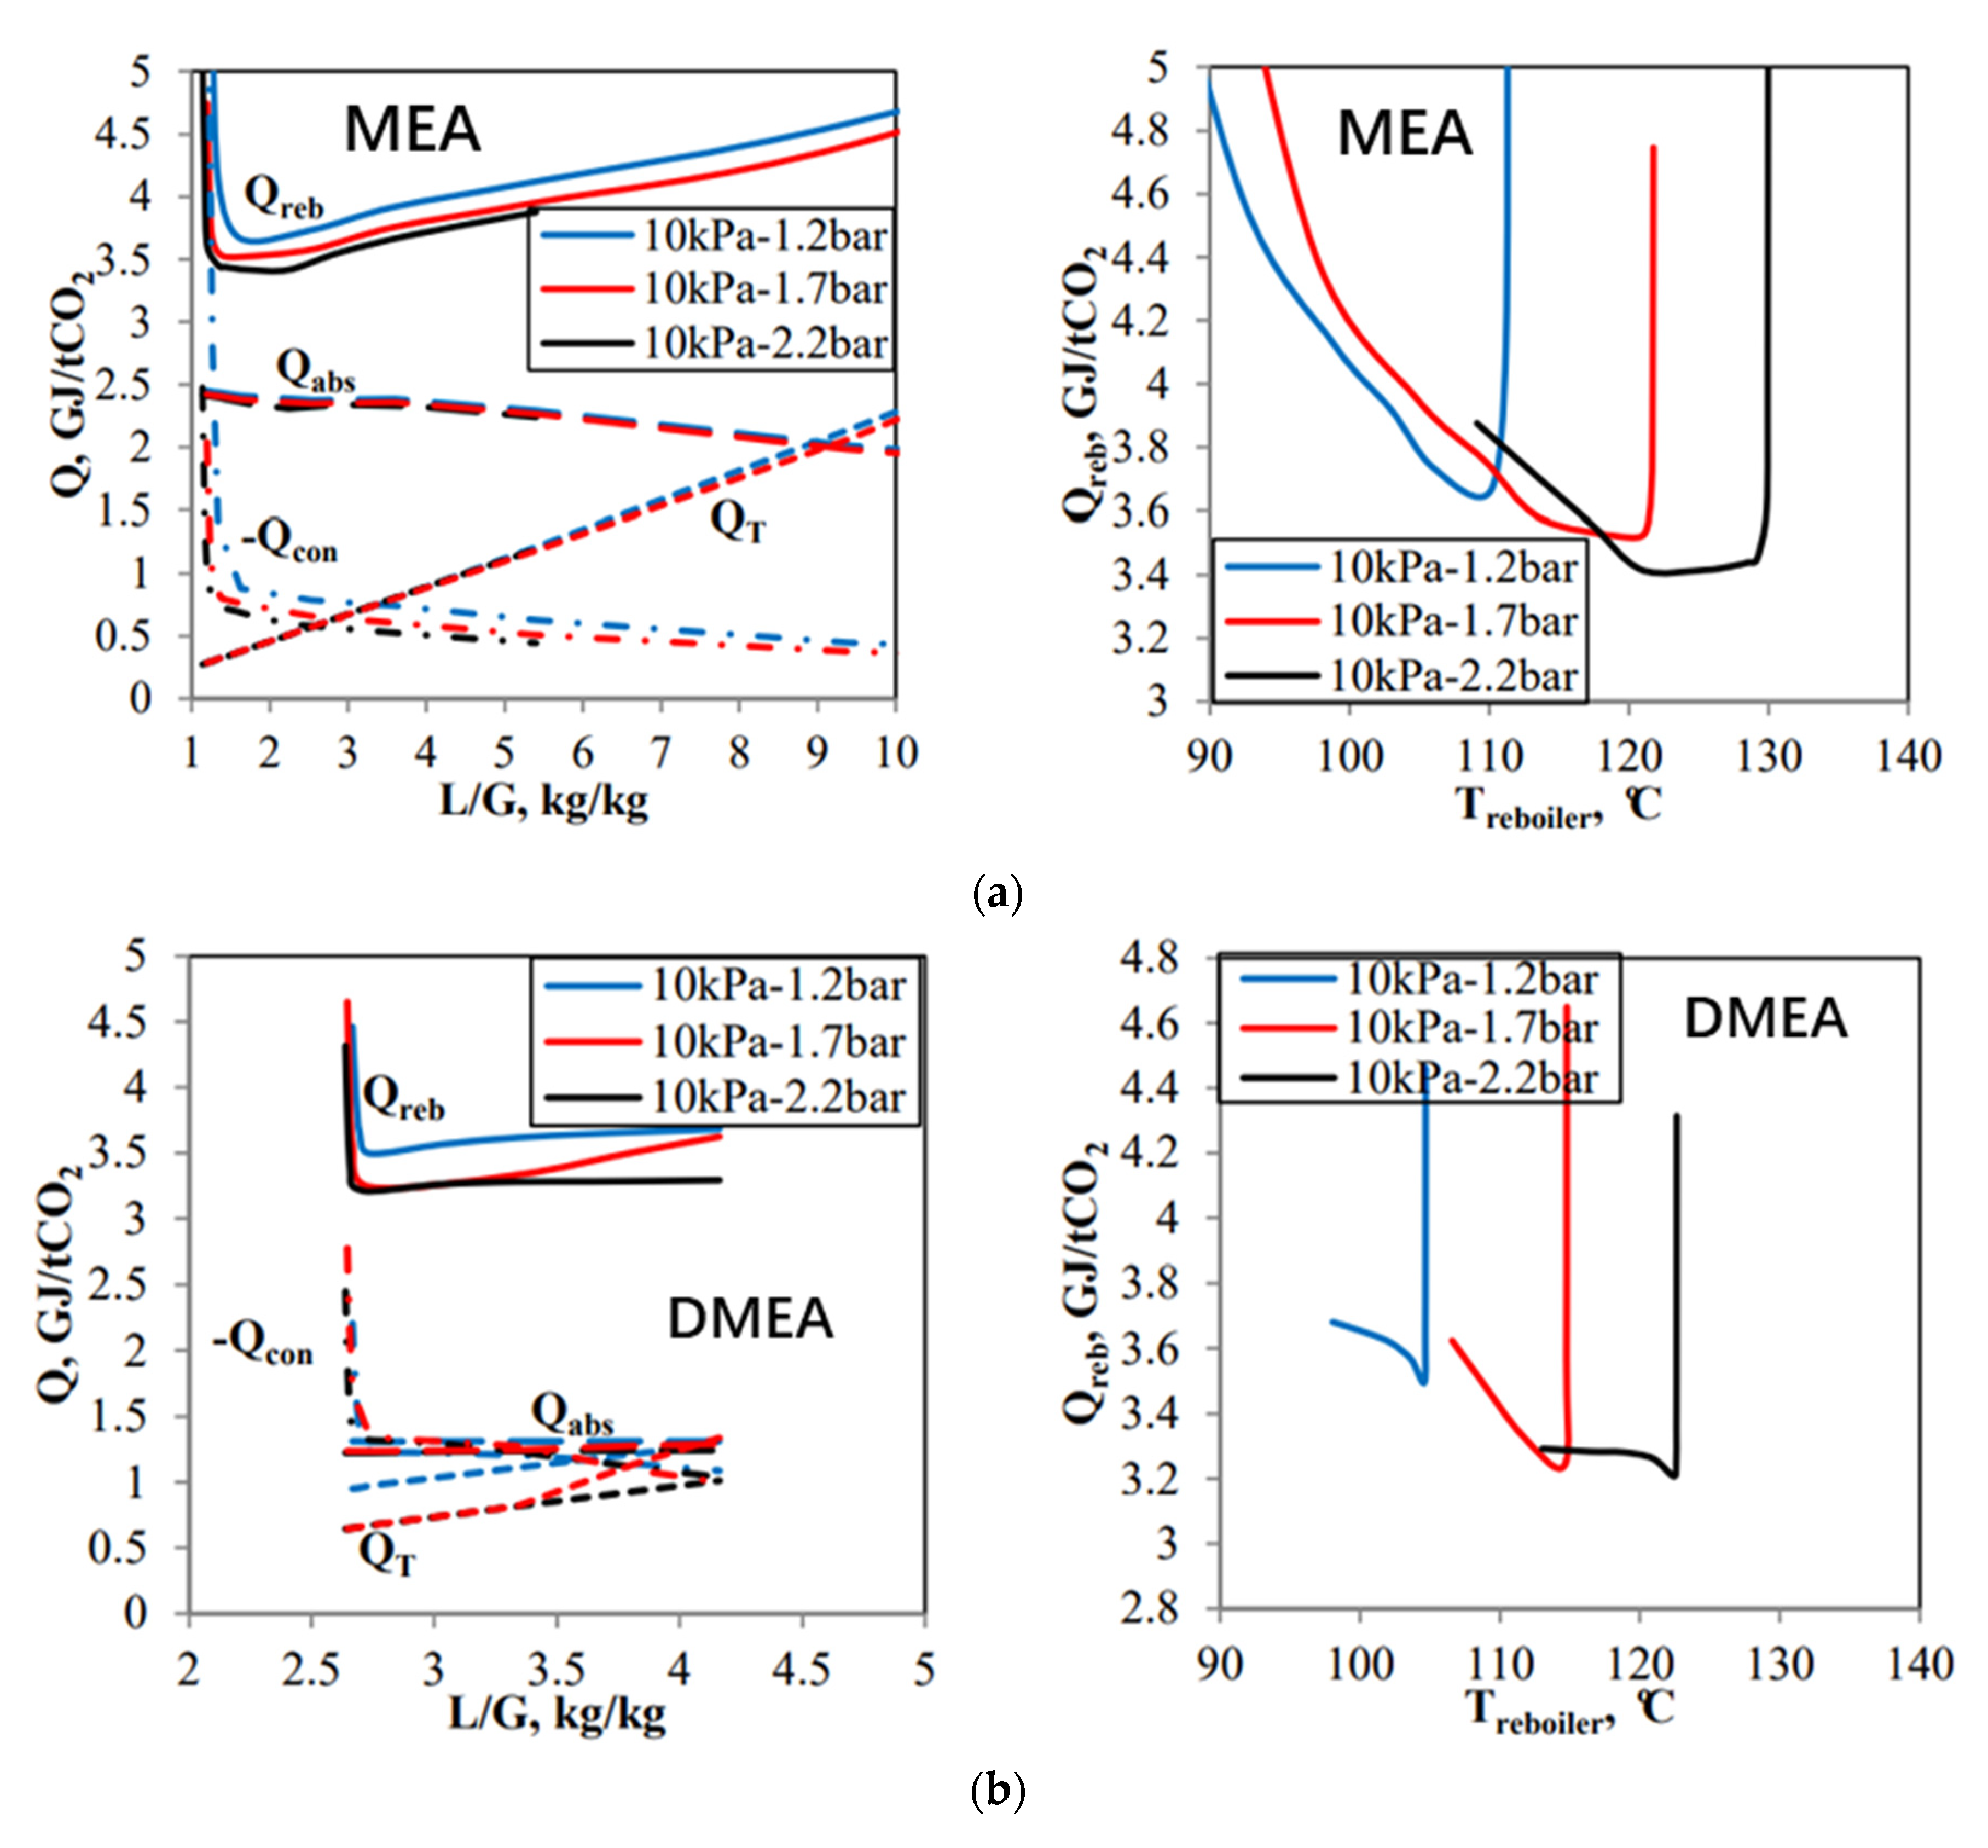
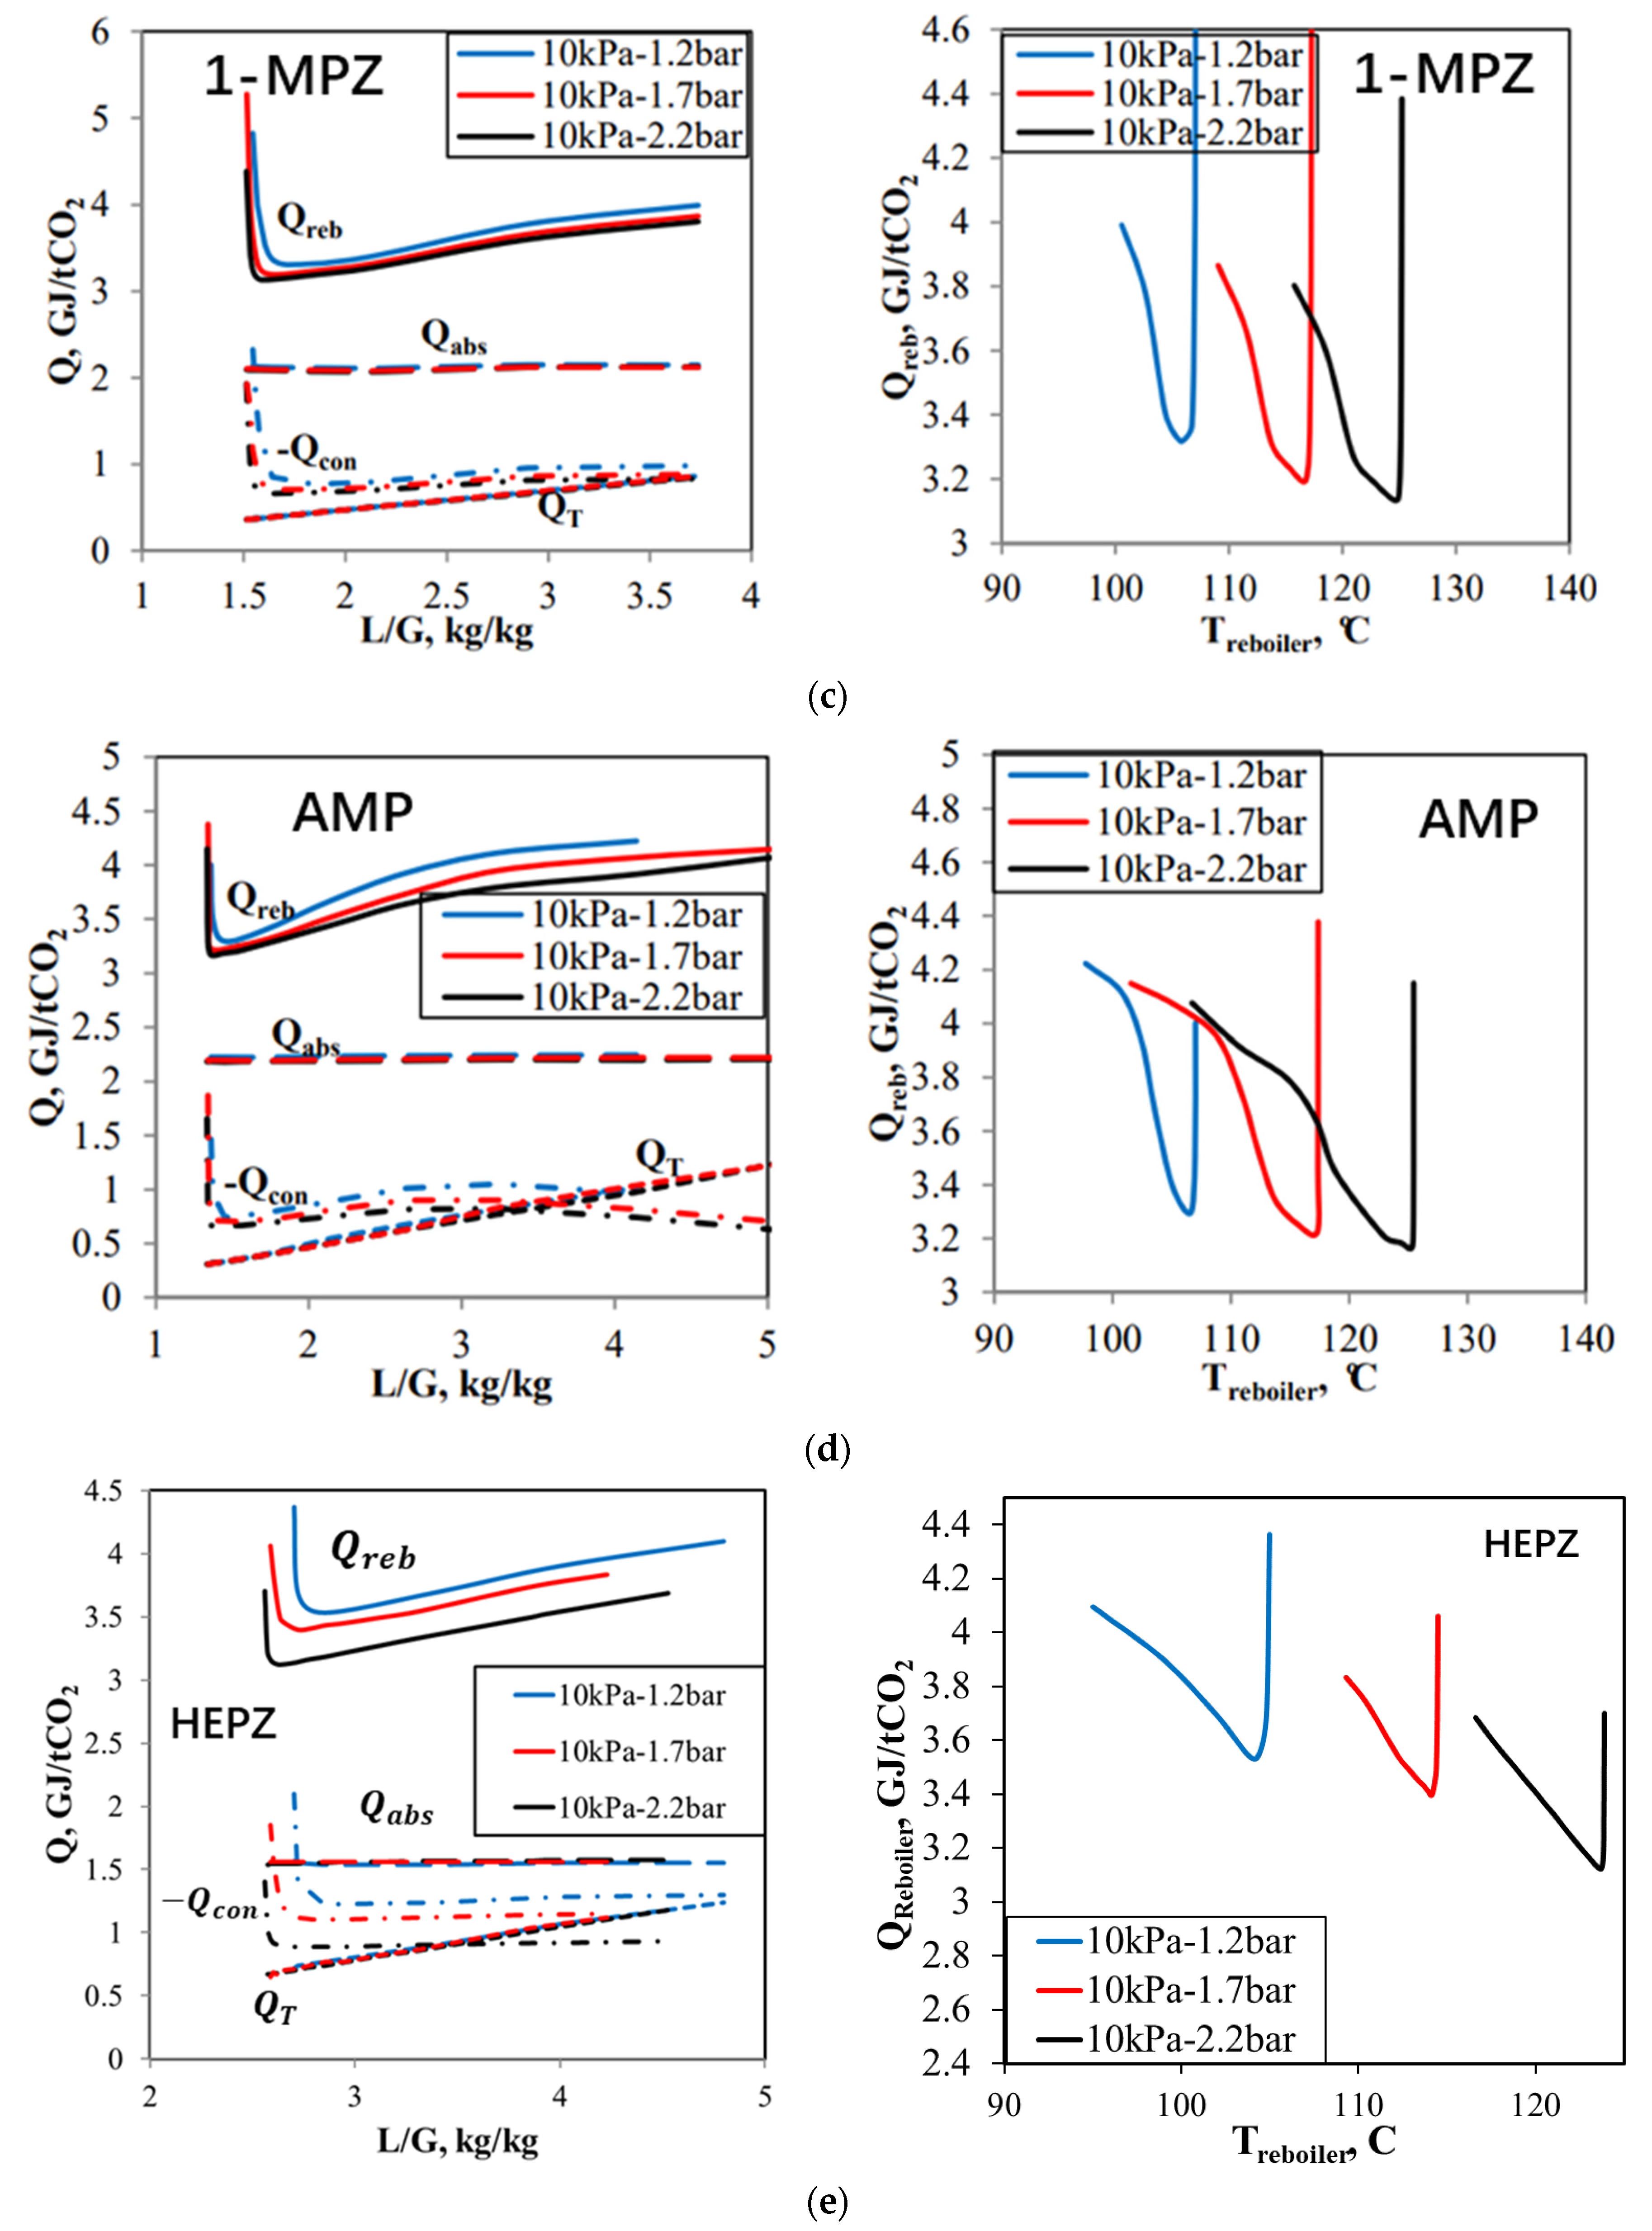
When the CO2 partial pressure of flue gas is 10 kPa and the pressure of the desorption tower is 2.2 bar, the influence of concentration on reboiler energy consumption is studied, and the studied concentration range is 10–40 wt.%. Since the measured concentration of the CO2 solubility data of the HEPZ solution used for regression modeling was up to 30 wt.%, the highest solution concentration applicable to the HEPZ thermodynamic model is also 30 wt.%. The concentrations studied for HEPZ were 5, 15 and 30 wt.%. When the concentration of PZ is too high, crystals will be precipitated and the solubility of anhydrous PZ at 20 °C is 14 wt.% PZ, which corresponds to 1.9 m PZ [32]. Therefore, problems will exist during plant start-up, operation and shutdown. The relationship between its concentration and energy consumption will no longer be studied. Figure 3 shows the relationship between the concentration of MEA, HEPZ, DMEA, 1-MPZ, AMP aqueous solution and energy consumption.
It can be seen from Figure 3 that as the concentration of the MEA aqueous solution increases, Q a b s increases and L/G of the absorption tower decreases, so Q c o n and Q T decrease. The sum of the three kinds of heat, Q r e b , decreases, and the magnitude of the decrease becomes smaller as the concentration increases. The concentration of DMEA aqueous solution increases from 10 to 30 wt.%, Q a b s is basically unchanged, L/G decreases, so Q c o n and Q T decrease, and Q r e b decreases. When it rises from 30 to 40 wt.%, L/G increases, Q c o n and Q T also increase, while Q a b s is unchanged, so Q r e b increases, and the optimal concentration of DMEA is 30 wt.%. As the concentration of 1-MPZ increases, Q r e b decreases. The optimal concentration of 1-MPZ is 40 wt.%. The effect of the concentration of AMP on energy consumption is the same as that of MEA. As for HEPZ, the reboiler energy consumption is significantly lower than that of other solvents, and the proportion of Q c o n is the lowest, which does not change much with the concentration. Due to the large MW of HEPZ, the L/G difference of HEPZ solutions with different concentrations is significant, and Q c o n and Q T decrease significantly with the increase of the concentration.

3.1.2. L/G

It can be seen in Figure 3 that L/G has different effects on reboiler energy consumption and its three parts. With the increase of L/G, Q a b s is basically unchanged, and Q T increases linearly, while Q c o n first decreases and then increases. The sum of total energy consumption, Q r e b , first decreases and then increases with the increase of L/G. The stronger the amine’s cyclic capacity, the smaller the L/G and the amount of solvent used. When L/G drops to a certain value, Q r e b suddenly increases significantly, indicating that the cyclic capacity cannot increase indefinitely. The lowest energy consumption and relatively strong cyclic capacity can be obtained at a certain value, which is shown in Figure 4. In addition, it can be seen from Figure 4 that for different solvents, the reboiler energy consumption changes with the cyclic capacity in the same trend.

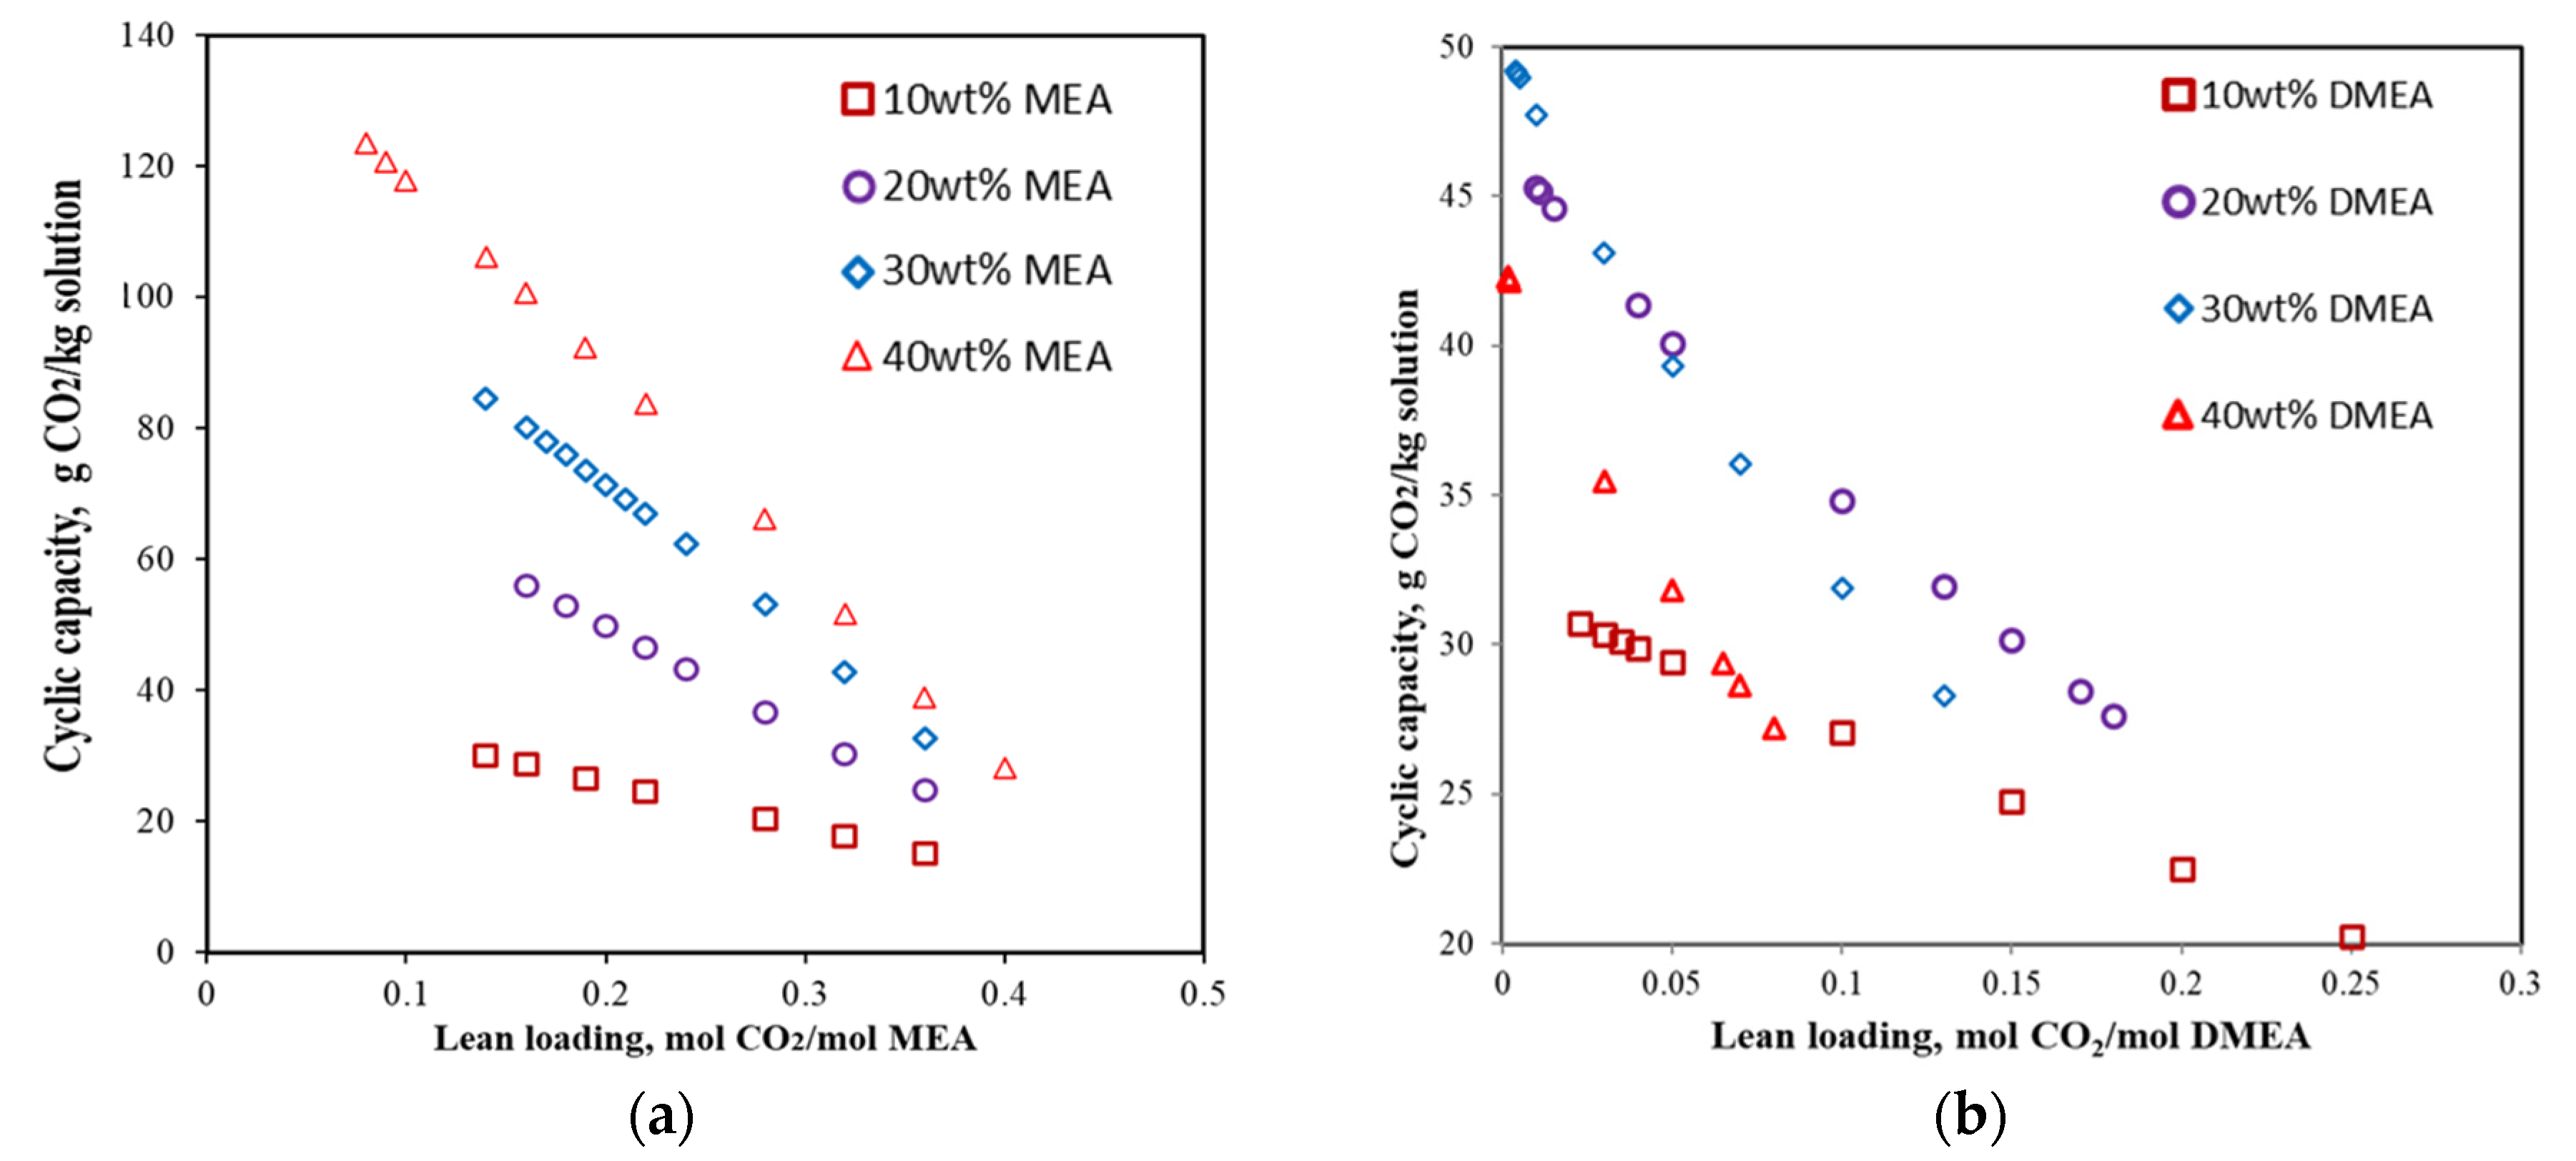
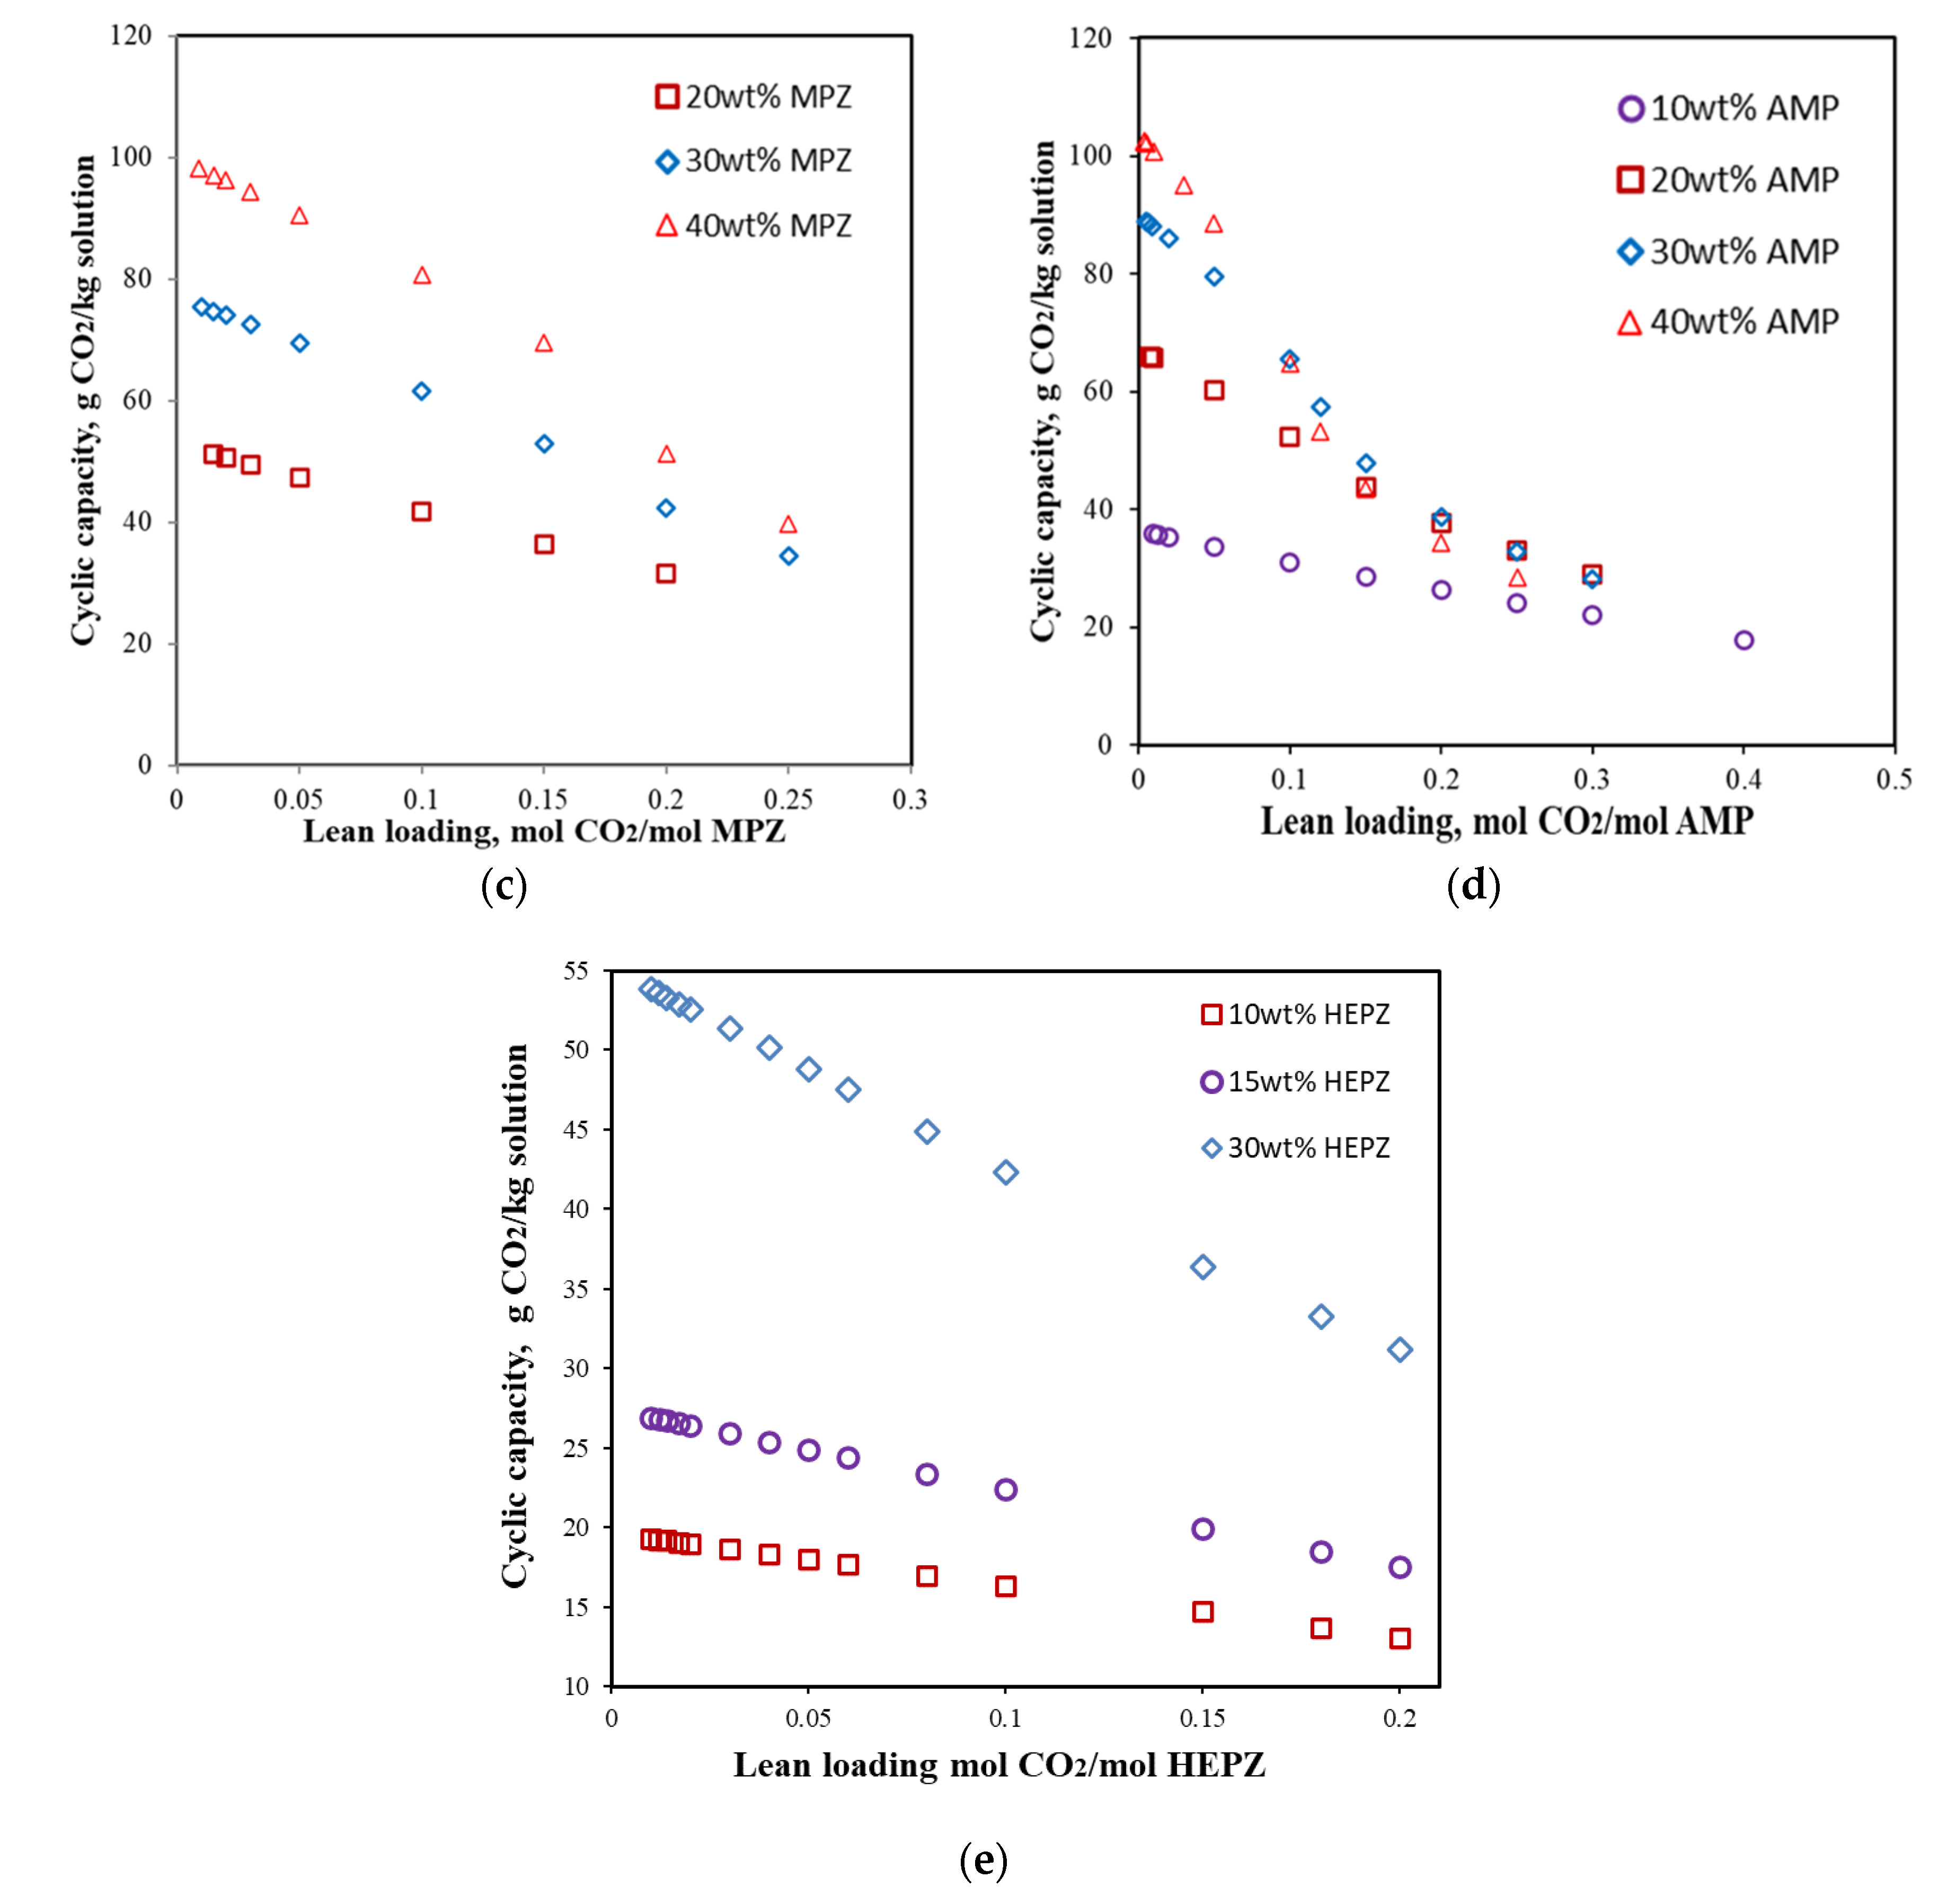
3.1.3. CO2-Lean Loading

The previous section explained the influence of L/G on energy consumption, and the value of L/G is related to the cyclic capacity of the amine solvent. CO2-lean loading, a process parameter set in the process, also affects the regeneration energy consumption by affecting the cyclic capacity. It is the CO2 loading of the stream LS1. The influence relationship is shown in Figure 5. In the case of a fixed CO2 removal rate, if the CO2-lean loading is different, the rich loading is different. The cyclic capacity of the absorbent with different lean and rich loading is different. This can be seen from the CO2 solubility curve of the absorbents. The cyclic capacity decreases as the CO2-lean loading increases, which is the same for all solvents.

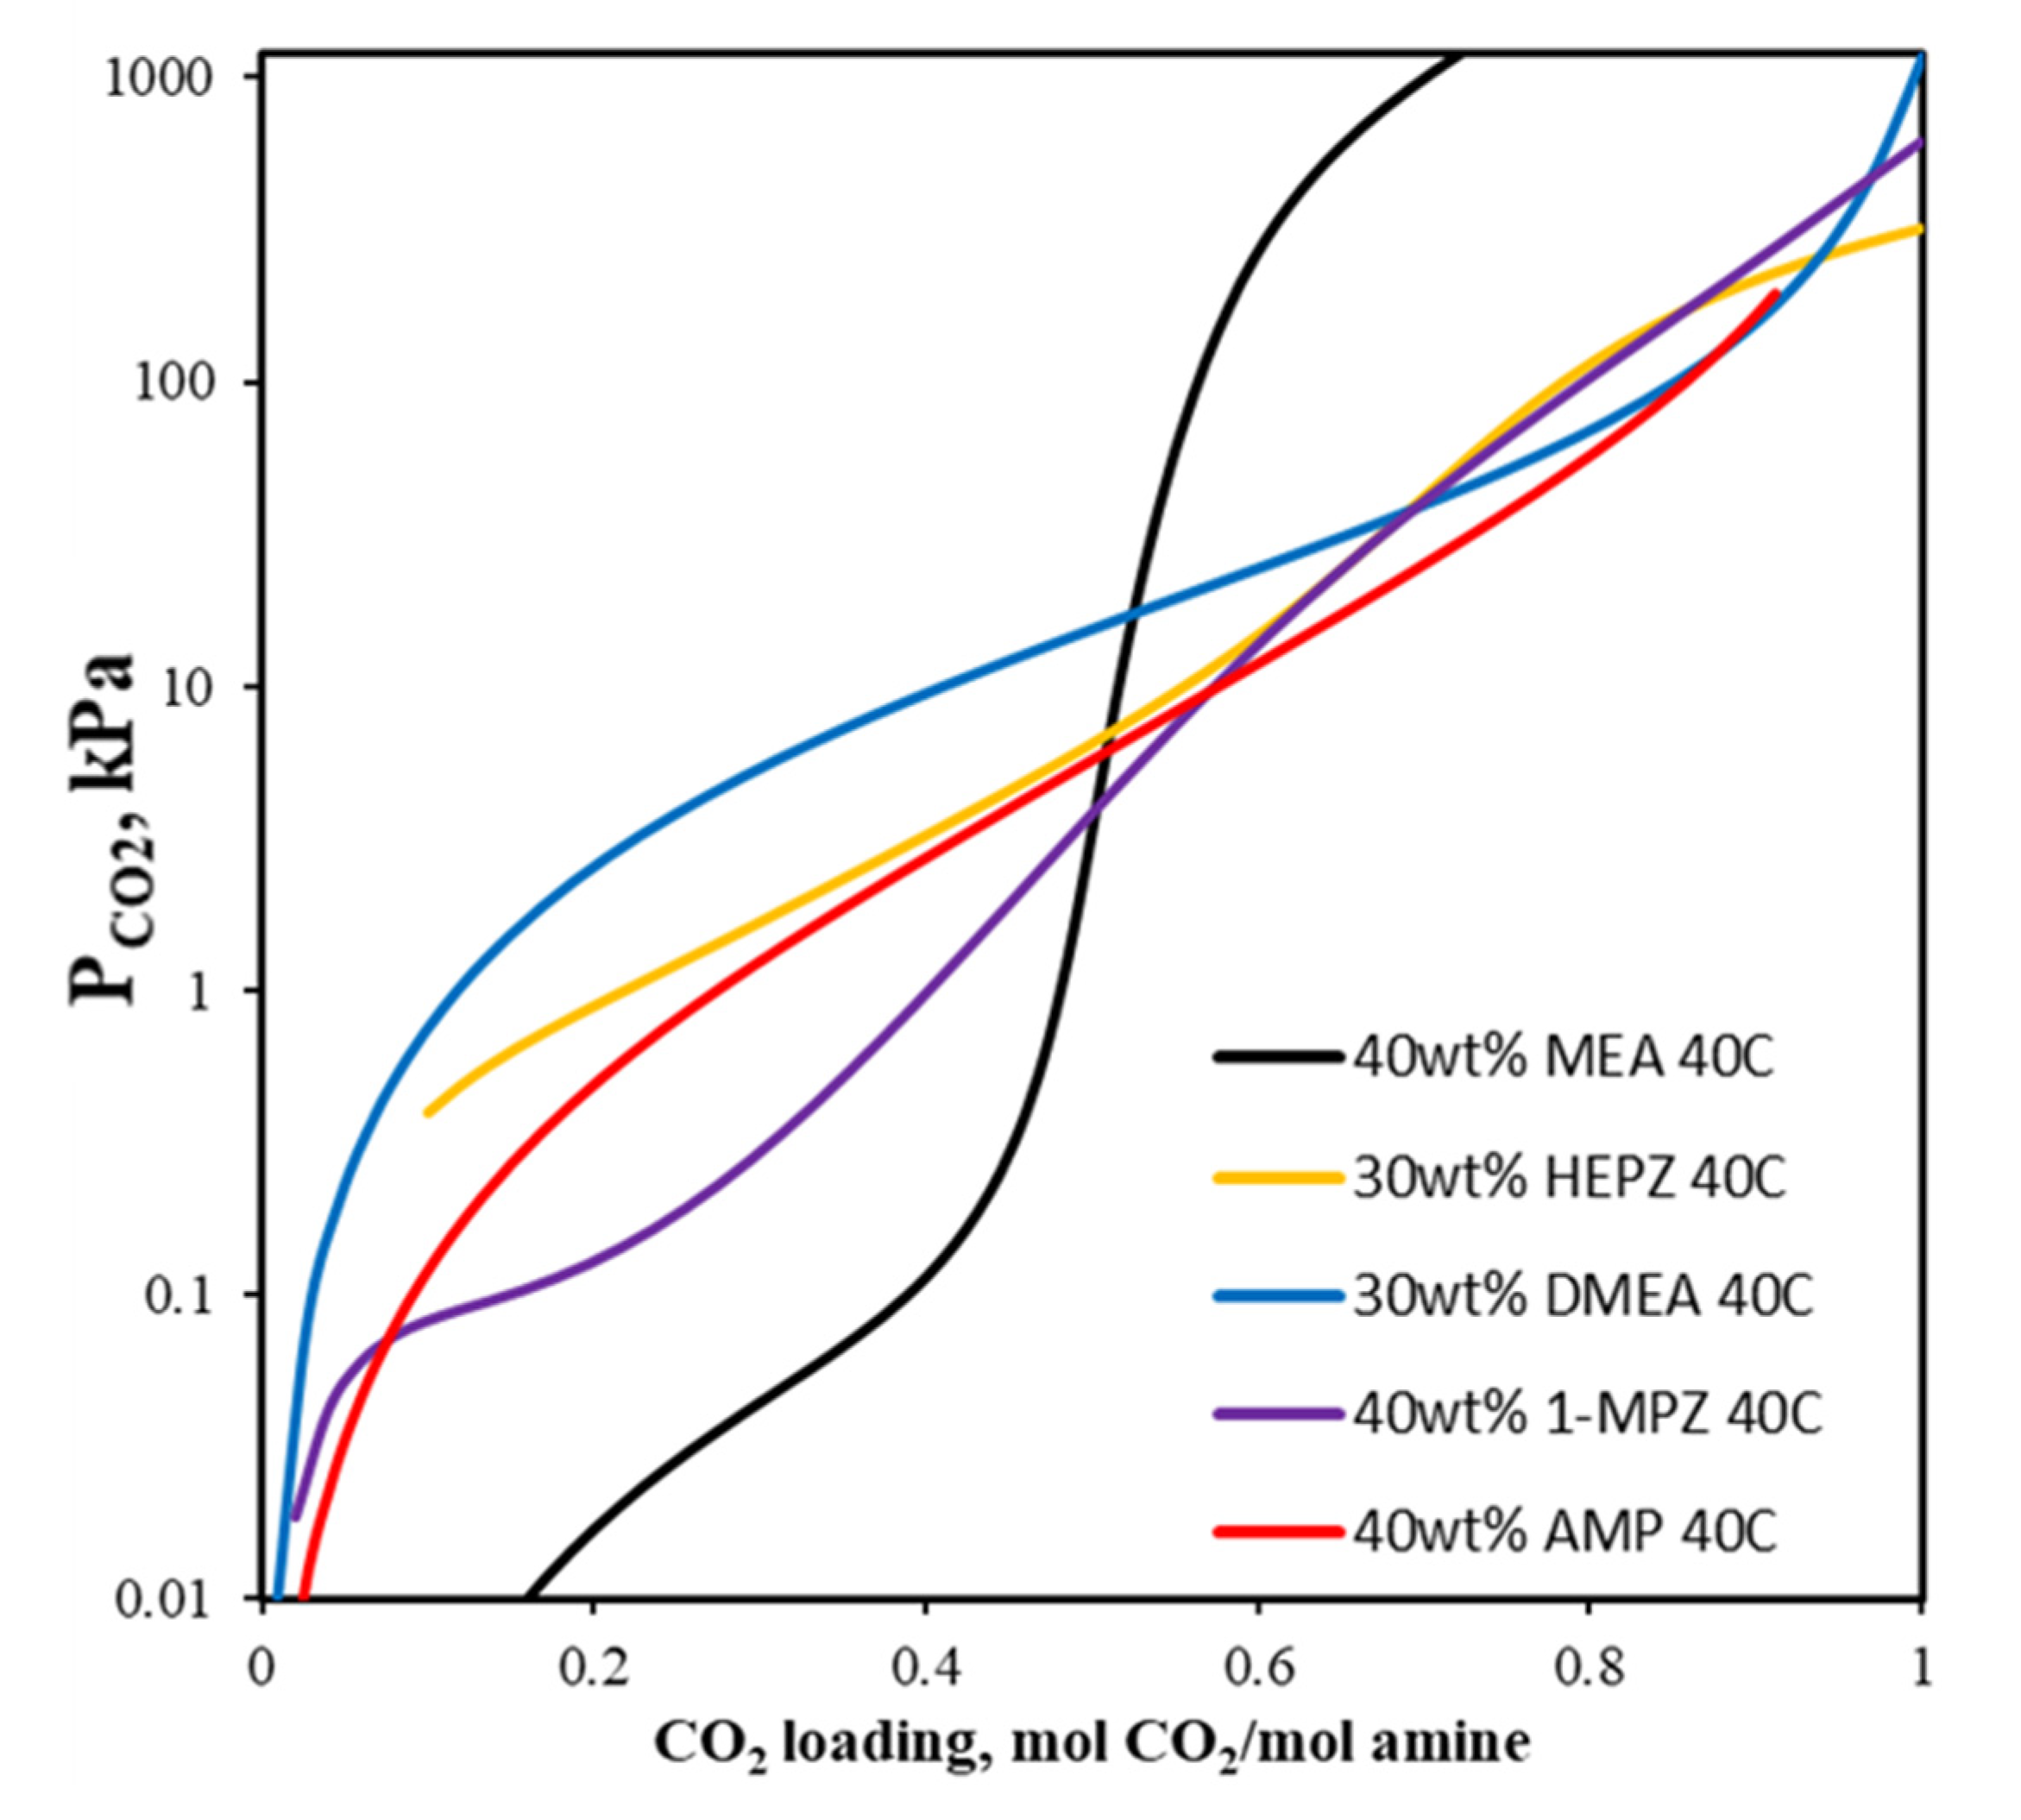
3.1.4. CO2 Partial Pressure of Flue Gas

The optimal concentration of different solvents with the lowest energy consumption was obtained in Section 3.1.1. The choice of PZ aqueous solution concentration was 10 wt.% because PZ was usually used as a promotor in mixed amine solutions. Although the concentration of CO2-loaded PZ solution which will not crystallize can be higher [33], the use of a high-concentration PZ solution will still cause problems during plant start-up, operation and shutdown. In this work, the highest PZ concentration can be configured to be 10 wt.%, which was selected to compare with other absorbents. Figure 6 shows the CO2 solubility curve of various solvents at 313.15 K. The curve slope shows the effect of CO2 partial pressure on a load of carbon dioxide: the more significant the slope, the less the effect of the increase in CO2 partial pressure on the CO2 loading.
The process simulation results shown in Figure 7 can verify the effect of CO2 partial pressure on the regeneration energy consumption of different solvents. The solubility curve of primary amine MEA has the largest slope, which means that the change in CO2 partial pressure has little effect on CO2 loading. When the partial pressure is increased from 1 to 10 kPa, the CO2 loading is almost unchanged. Therefore, it can be predicted that the increase of the CO2 partial pressure of flue gas has no effect on the energy consumption of 40 wt.% MEA. When the partial pressure is increased from 5 to 15 kPa, the reboiler energy consumption is only reduced by about 0.1 GJ/tCO2. The slope of the solubility curve of HEPZ and DMEA is the smallest, so the change of CO2 partial pressure has a greater impact on CO2 loading. The CO2 partial pressure of flue gas was increased from 5 to 15 kPa, and the energy consumption of 30 wt.% HEPZ was reduced from 2.7 to 2.4 GJ/tCO2, a reduction of approximately 11%. The energy consumption of 30 wt.% DMEA decreases more with the increase of the CO2 partial pressure. When the partial pressure increases from 5 to 15 kPa, the energy consumption decreases from 3.8 to 3.05 GJ/tCO2, a reduction of nearly 20%. For 40 wt.% 1-MPZ and 40 wt.% AMP, the slope of the solubility curve is between 40 wt.% MEA and 30 wt.% DMEA, so the reduction in energy consumption as CO2 partial pressure increases is between 40 wt.% MEA and 30 wt.% DMEA. When the CO2 partial pressure is increased from 5 to 10 kPa, the reboiler energy consumption of 40 wt.% 1-MPZ and 40 wt.% AMP are reduced by about 0.3 and 0.2 GJ/tCO2, respectively. When the partial pressure is increased from 10 to 15 kPa, the energy consumption of 1-MPZ and AMP reboilers does not change significantly. The CO2 partial pressure of flue gas mainly affects Q c o n , and has almost no effect on Q a b s and Q T .

3.1.5. Pressure of Desorption Tower

When other conditions remain unchanged, the change in the pressure of the desorption tower only affects Q c o n , whereas Q T and Q a b s are basically unaffected. As the pressure increases, Q c o n and Q r e b decrease. Meanwhile, the increase of pressure will increase the temperature of the reboiler, and a high temperature will cause the degradation of the absorbent. Figure 8 shows the effect of desorption tower pressure on the energy consumption of solvents and the reboiler temperature when the CO2 partial pressure of flue gas is 10 kPa. The pressures of the desorption towers studied in this work are 1.2, 1.7 and 2.2 bar, respectively. The results of different solvents affected by the pressure of the desorption tower are consistent. For MEA, when the pressure is increased by 0.5 bar, the energy consumption, Q r e b , is reduced by about 0.1 GJ/tCO2. For AMP and 1-MPZ, the energy consumption, Q r e b , decreases slightly as the pressure increases. For HEPZ, the energy consumption, Q r e b , decreases by approximately 0.2 GJ/tCO2 as the pressure increases by 0.5 bar. For DMEA, when the pressure is increased from 1.2 to 1.7 bar, Q T used to heat the liquid is greatly reduced, and Q r e b is reduced by 0.3 GJ/tCO2. The minimum heat transfer temperature difference appears at the cold end of the heat exchanger with pressures of 1.7 and 2.2 bar; that is, the temperature difference between LS2 and HS1 in Figure 2 is 10 °C. However, when the pressure of the desorption tower is 1.2 bar, the minimum heat transfer temperature difference appears at the hot end of the heat exchanger, causing the temperature difference between LS2 and HS1 to be greater than 10 °C, so Q T is relatively higher. If the pressure of the desorption tower is increased by 0.5 bar, the energy consumption will be slightly reduced, and the desorption tower temperature will increase by approximately 10 °C. Since the maximum temperature of the solvent solubility measured in this work was 120 °C, the applicable temperature of the thermodynamic model was 120 °C. Therefore, the maximum pressure of the desorption tower is 2.2 bar.

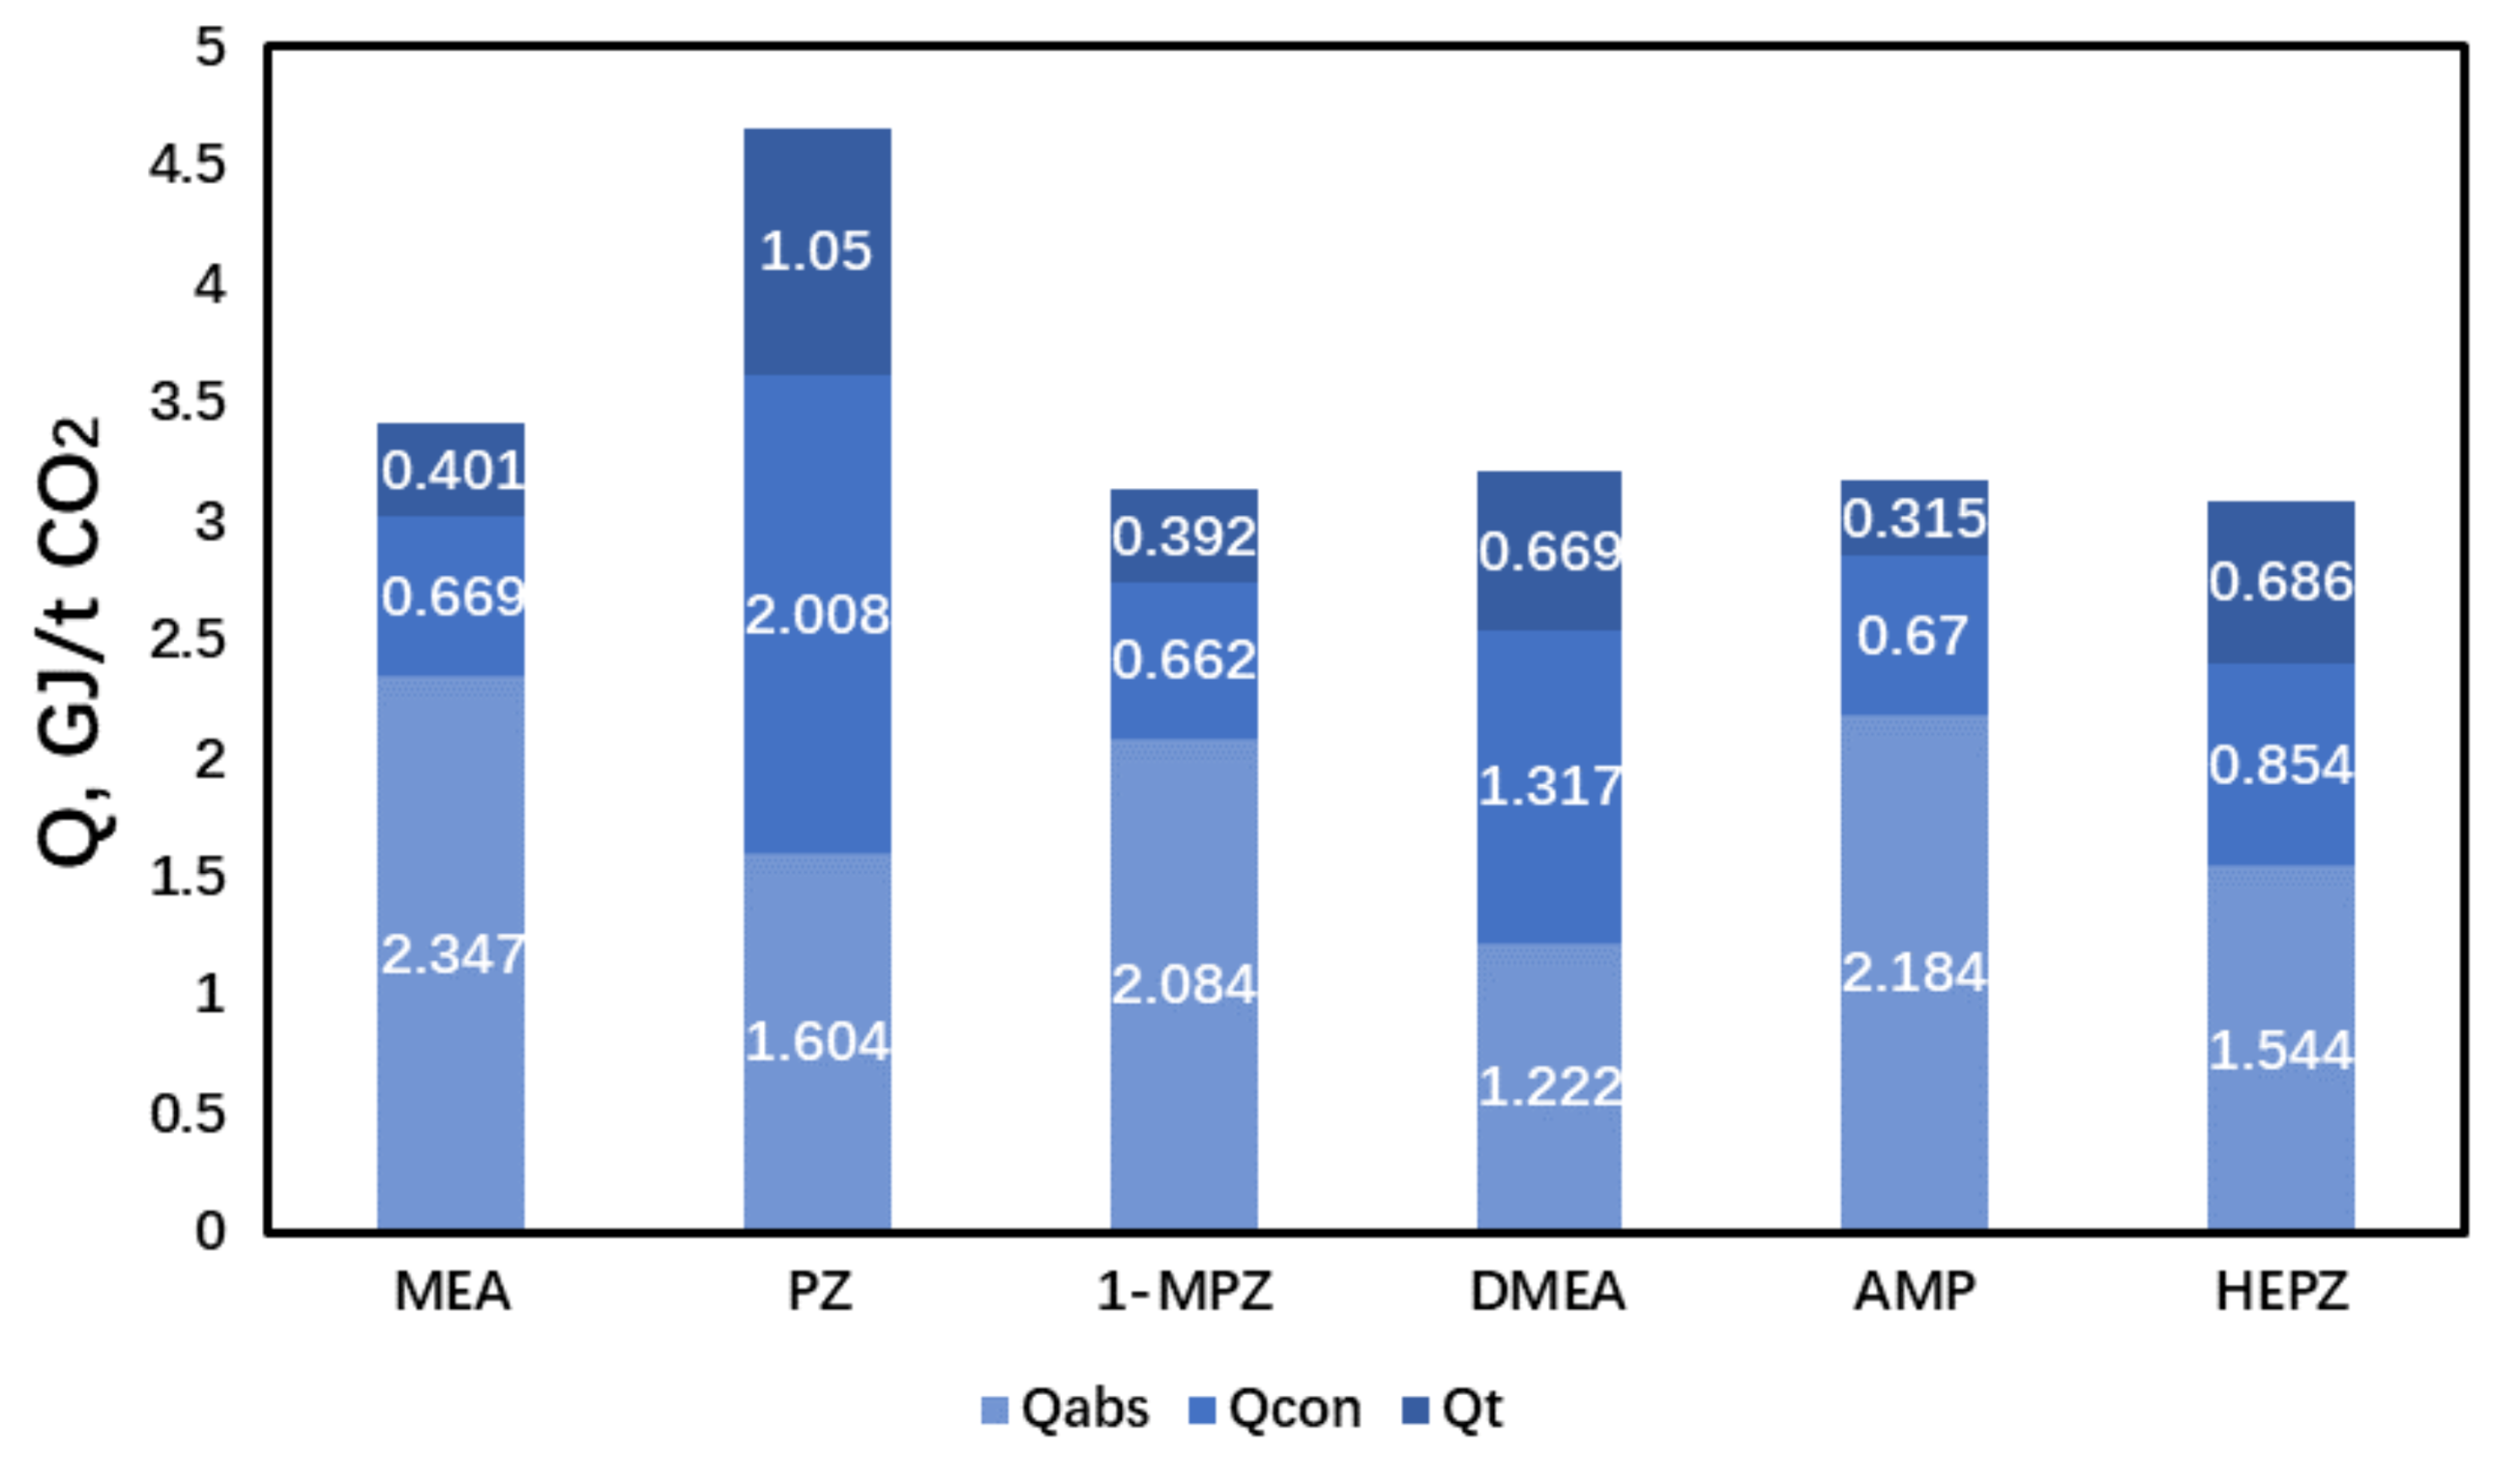
3.2. The Proportion of Different Heat in Reboiler Energy with the Optimal Process Parameters

From the results above, the optimal process parameters and the lowest reboiler energy for different solvents can be obtained, which are listed in Table 2. The concentration of each solvent is selected in Section 3.1, the CO2 partial pressure of flue gas is selected as 10 kPa and the pressure of the desorption tower is 2.2 bar. The highest configurable concentration of PZ considered in this work, 10 wt.%, was selected as the concentration of the PZ solvent, and the reason for this has been provided in Section 3.1. Due to the low concentration of PZ, L/G is 6.167, which is too large, and the reboiler energy consumption is very high, so PZ is not suitable for use as an absorbent alone. The L/G of other solvents is between 1.3 and 2.7, which is a reasonable range.
Figure 9 shows the lowest reboiler energy consumption of different solvents and the contribution of the three types of heat for different solvents at the optimal concentration. The highest reboiler energy consumption is PZ, because L/G is relatively high, so the energy consumption for condensing and heating the liquid is also relatively high. The reboiler energy consumption of the MEA solvent is the second highest. Q c o n and Q T contribute less. The desorption heat, Q a b s , contributes the most, and its value is higher than other solvent desorption heats. HEPZ has the lowest reboiler energy consumption, 3.018 GJ/tCO2, which is about 35.2% lower than Q r e b of PZ and 11.6% lower than Q r e b of MEA, and Q a b s is almost the lowest among all solvents, only slightly higher than Q a b s of DMEA. The reboiler energy consumption of 1-MPZ, DMEA and AMP is close. The three heat values and their proportions of 1-MPZ and AMP are close.

3.3. Comparison of Regeneration Energy, Solvent Loss and Cyclic Capacity of Different Solvents

In addition to regeneration energy, this work also compares the solvent loss and cyclic capacity of each solvent to comprehensively evaluate the economic performance of the solvent. During the operation process, each solvent will have varying degrees of loss as the solution volatilizes in the desorption tower. If the ratio of the loss to the solvent in solution is too large, the concentration of the solution will be diluted. Therefore, it is necessary to constantly replenish the solvent, which increases the cost of the solvent and reduces the economic efficiency of the technology. Therefore, the lower the ratio, the better the economy of the solvent. It can be seen from Table 3 that the solvent with the lowest ratio is HEPZ, which is 0.02%. The operating temperature of the desorption tower in this process is 123–125 °C. HEPZ has the highest boiling point, so it is the least volatile. 1-MPZ and DMEA have the highest loss ratios because their boiling points are the lowest. In actual operation, the temperature of the desorption tower may be higher. If it exceeds 130 °C, the economic cost for solvent loss will be greater. Therefore, HEPZ has obvious advantages. The cyclic capacity shows the amount of CO2 absorbed by the circulation per kilogram of solution. As a sterically hindered amine, the cyclic capacity of AMP is the highest, which is consistent with the initial theory. The cyclic capacity of HEPZ is 47% lower than AMP, but 64.7% higher than PZ and 21.6% lower than the primary amine MEA. Considering the absorption rate PZ > HEPZ > MEA [33], the economic value of HEPZ as a promotor will be significantly better than MEA and PZ. HEPZ can replace PZ and MEA as an absorbent to configure a mixed amine system with sterically hindered amine AMP. It is expected to be superior to the AMP/PZ system and has value for conducting pilot studies.

4. Conclusions

In this work, the influence of process parameters on regeneration energy consumption of post-combustion capture was studied by process modeling on Aspen Plus® platform. Additionally, by comparing the regeneration energy consumption, cyclic capacity and solvent loss during operation of different absorbents, the potential of HEPZ to replace piperazine as the promotor of a mixed amine system was analyzed.
The process parameters that influence regeneration energy consumption mainly include absorbent concentration, liquid to gas (L/G) ratio, CO2-lean loading, CO2 partial pressure of flue gas and the pressure of the desorption tower.
The increase in the concentration of the absorbents will reduce the liquid to gas (L/G) ratio and decrease Q c o n and Q T . The concentration of different absorbents had different effects on Q a b s : as the concentration of MEA, 1-MPZ and AMP aqueous solutions increased, Q a b s increased, and as the concentration of DMEA and HEPZ increased, Q a b s remained almost unchanged. As the absorbent concentration increased, the total energy consumption for regeneration decreased.
The stronger the amine’s circulating absorption capacity, the smaller the L/G and the amount of solvent used. The increase of L/G had no effect on Q a b s : it increased Q T linearly, and Q c o n first decreased and then increased. With the increase of L/G, the total energy consumption also decreased first and then increased.
The CO2-lean loading affected the cyclic absorption capacity, which in turn affected the energy consumption. The circulating absorption capacity decreased as the CO2-lean loading increased.
The influence of the CO2 partial pressure of flue gas on regeneration energy is related to the type of solvent. The smaller the slope of the solvent’s CO2 solubility curve, the greater the impact of CO2 partial pressure on regeneration energy. When the CO2 partial pressure increased, Q c o n decreased, and Q T and Q a b s were not affected by CO2 partial pressure. The solubility curve of 40 wt.% MEA had the largest slope, and as the CO2 partial pressure of flue gas increased, the regeneration energy consumption was basically unchanged. The slopes of the solubility curves of 30 wt.% HEPZ and 30 wt.% DMEA were the smallest, the CO2 partial pressure increased from 5 to 15 kPa and regeneration decreased by about 11% and 20%, respectively.
The change in the pressure of the desorption tower had little effect on energy consumption. The pressure rose by 0.5 bar, the energy consumption was slightly reduced and the temperature of the desorption tower rose by approximately 10 °C. All absorbent systems have a set of process parameters with the largest cyclic absorption and the lowest energy consumption.
With the optimal process parameters, the lowest reboiler energy consumption of HEPZ was 3.018 GJ/tCO2, which was 35.2% lower than that of PZ and 11.6% lower than that of MEA, and the heat of desorption, Q a b s , was almost the lowest among all absorbents. During operation, HEPZ had the lowest solvent loss. The cyclic capacity was 64.7% higher than PZ and 21.6% lower than the primary amine MEA. The absorption rate was PZ > HEPZ > MEA, and HEPZ has significant economic value as a promotor to replace PZ and MEA.

Author Contributions

Conceptualization, S.L. and H.L.; methodology, S.L. and H.L.; software, S.L. and H.L.; validation, S.L. and J.C.; formal analysis, S.L.; investigation, S.L.; resources, J.C.; data curation, S.L. and H.L.; writing—original draft preparation, S.L.; writing—review and editing, J.C.; visualization, S.L.; supervision, J.C. and Y.Y.; project administration, J.C. and Y.Y.; funding acquisition, J.C. All authors have read and agreed to the published version of the manuscript.

Funding

This research was funded by the National Natural Science Foundation of China, grant number 21978145, and the National Science and Technology Support Program of China, grant number 2015BAC04B01.

Institutional Review Board Statement

Not applicable.

Informed Consent Statement

Not applicable.

Data Availability Statement

The data presented in this study are available upon request from the corresponding author.

Conflicts of Interest

The authors declare no conflict of interest.

References

  1. Anderson, M. Climate Change 2014: Synthesis Report. Libr. J. 2016, 141, 28. [Google Scholar]
  2. Lockwood, T. A compararitive review of next-generation carbon capture technologies for coal-fired power plant. Energy Procedia 2017, 114, 2658–2670. [Google Scholar] [CrossRef]
  3. MacDowell, N.; Florin, N.; Buchard, A.; Hallett, J.; Galindo, A.; Jackson, G.; Adjiman, C.S.; Williams, C.K.; Shah, N.; Fennell, P. An Overview of CO2 Capture Technologies. Eng. Environ. Sci. 2010, 3, 1645–1669. [Google Scholar] [CrossRef] [Green Version]
  4. Plasynski, S.I.; Litynski, J.T.; McIlvried, H.G.; Srivastava, R.D. Progress and New Developments in Carbon Capture and Storage %. J. Crit. Rev. Plant. Sci. 2009, 28, 123–138. [Google Scholar] [CrossRef]
  5. Ystad, P.A.M.; Bolland, O.; Hillestad, M. NGCC and Hard-Coal Power Plant with CO2 Capture Based on Absorption. Energy Procedia 2012, 23, 33–44. [Google Scholar]
  6. Liang, Z.W.; Rongwong, W.; Liu, H.; Fu, K.; Gao, H.; Cao, F.; Zhang, R.; Sema, T.; Henni, A.; Sumon, K.; et al. Recent progress and new developments in post-combustion carbon-capture technology with amine based solvents. Int. J. Greenh. Gas Control 2015, 40, 26–54. [Google Scholar] [CrossRef] [Green Version]
  7. Rinker, E.B.; Ashour, S.S.; Sandall, O.C. Absorption of carbon dioxide into aqueous blends of diethanolamine and methyldiethanolamine. Ind. Eng. Chem. Res. 2000, 39, 4346–4356. [Google Scholar] [CrossRef]
  8. Dubois, L.; Thomas, D. Screening of Aqueous Amine-Based Solvents for Postcombustion CO2 Capture by Chemical Absorption. Chem. Eng. Tech. 2012, 35, 513–524. [Google Scholar] [CrossRef]
  9. Sartori, G.; Savage, D.W. Sterically Hindered Amines for CO2 Removal from Gases. Ind. Eng. Chem. Fundam. 1983, 22, 239–249. [Google Scholar] [CrossRef]
  10. Seo, D.J.; Hong, W.H. Effect of Piperazine on the Kinetics of Carbon Dioxide with Aqueous Solutions of 2-Amino-2-Methyl-1-Propanol. Ind. Eng. Chem. Res. 2000, 39, 2062–2067. [Google Scholar] [CrossRef]
  11. Bruder, P.; Grimstvedt, A.; Mejdell, T.; Svendsen, H.F. CO2 Capture into Aqueous Solutions of Piperazine Activated 2-Amino-2-Methyl-1-Propanol. Chem. Eng. Sci. 2011, 66, 6193–6198. [Google Scholar] [CrossRef]
  12. Artanto, Y.; Jansen, J.; Pearson, P.; Puxty, G.; Cottrell, A.; Meuleman, E.; Feron, P. Pilot-Scale Evaluation of AMP/PZ to Capture CO2 from Flue Gas of an Australian Brown Coal-Fired Power Station. Int. J. Greenh. Gas Control 2014, 20, 189–195. [Google Scholar] [CrossRef]
  13. Rayer, A.V.; Sumon, K.Z.; Henni, A.; Tontiwachwuthikul, P. Kinetics of the Reaction of Carbon Dioxide (CO2) with Cyclic Amines Using the Stopped-Flow Technique. Energy Procedia 2011, 4, 140–147. [Google Scholar] [CrossRef] [Green Version]
  14. Chen, X.; Rochelle, G.T. Aqueous Piperazine Derivatives for CO2 Capture: Accurate Screening by a Wetted Wall Column. Chem. Eng. Res. Des. 2011, 89, 1693–1710. [Google Scholar] [CrossRef]
  15. Robinson, K.; McCluskey, A.; Attalla, M.I. An ATR-FTIR Study on the Effect of Molecular Structural Variations on the CO2 Absorption Characteristics of Heterocyclic Amines, Part II. Chemphyschem 2012, 13, 2331–2341. [Google Scholar] [CrossRef] [Green Version]
  16. Abu-Zahra, M.R.M.; Niederer, J.P.M.; Feron, P.H.M.; Versteeg, G.F. CO2 Capture from Power Plants-Part II. A Parametric Study of the Economical Performance Based on Mono-Ethanolamine. Int. J. Greenh. Gas Control 2007, 1, 135–142. [Google Scholar] [CrossRef]
  17. Liang, H.W.; Xu, Z.G.; Si, F.Q. Economic Analysis of Amine Based Carbon Dioxide Capture System with Bi-Pressure Stripper in Supercritical Coal-Fired Power Plant. Int. J. Greenh. Gas Control 2011, 5, 702–709. [Google Scholar] [CrossRef]
  18. Dash, S.K.; Samanta, A.N.; Bandyopadhyay, S.S. Simulation and Parametric Study of Post Combustion CO2 Capture Process Using (AMP plus PZ) Blended Solvent. Int. J. Greenh. Gas Control 2014, 21, 130–139. [Google Scholar] [CrossRef]
  19. Dubois, L.; Thomas, D. Comparison of Various Configurations of the Absorption-Regeneration Process Using Different Solvents for the Post-Combustion CO2 Capture Applied to Cement Plant Flue Gases. Int. J. Greenh. Gas Control 2018, 69, 20–35. [Google Scholar] [CrossRef]
  20. Ayittey, F.K.; Saptoro, A.; Kumar, P.; Wong, M.K. Parametric Study and Optimisation of Hot K2CO3-Based Post-Combustion CO2 Capture from a Coal-Fired Power Plant. Greenh. Gases-Sci. Tech. 2020, 10, 631–642. [Google Scholar] [CrossRef]
  21. Jou, F.-Y.; Mather, A.E.; Otto, F.D. The Solubility of CO2 in a 30 Mass Percent Monoethanolamine Solution. Can. J. Chem. Eng. 1995, 73, 140–147. [Google Scholar] [CrossRef]
  22. Strazisar, B.R.; Anderson, R.R.; White, C.M. Degradation Pathways for Monoethanolamine in a CO2 Capture facility. Eng. Fuels 2003, 17, 1034–1039. [Google Scholar] [CrossRef]
  23. Kim, I.; Svendsen, H.F.J.I.; Research, E.C. Heat of Absorption of Carbon Dioxide (CO2) in Monoethanolamine (MEA) and 2-(Aminoethyl)ethanolamine (AEEA) Solutions. Ind. Eng. Chem. Res. 2007, 46, 5803–5809. [Google Scholar] [CrossRef]
  24. Nuchitprasittichai, A.; Cremaschi, S.J.C.; Engineering, C. Optimization of CO2 Capture Process with Aqueous Amines Using Response Surface Methodology. Comput. Chem. Eng. 2011, 35, 1521–1531. [Google Scholar] [CrossRef]
  25. Nguyen, T.; Hilliard, M.; Rochelle, G.J.E.P. Volatility of Aqueous Amines in CO2 Capture. Eng. Proced. 2011, 4, 1624–1630. [Google Scholar] [CrossRef] [Green Version]
  26. Conway, W.; Wang, X.G.; Fernandes, D.; Burns, R.; Lawrance, G.; Puxty, G.; Maedert, M. Toward Rational Design of Amine Solutions for PCC Applications: The Kinetics of the Reaction of CO2 (aq) with Cyclic and Secondary Amines in Aqueous Solution. Environ. Sci. Tech. 2012, 46, 7422–7429. [Google Scholar] [CrossRef]
  27. Tong, C.; Perez, C.C.; Chen, J.; Marcos, J.C.V.; Neveux, T.; Le Moullec, Y. Measurement and Calculation for CO2 Solubility and Kinetic Rate in Aqueous Solutions of Two Tertiary Amines. Energy Procedia 2013, 37, 2084–2093. [Google Scholar] [CrossRef] [Green Version]
  28. Liu, Y.; Dong, L.; Mi, J.; Chen, J. Molecular Structure of Alcoholamine and Its CO2 Capture Capacity. Sci. Sin. Chim. 2012, 42, 291–296. [Google Scholar]
  29. Li, H.; Le Moullec, Y.; Lu, J.H.; Chen, J.; Marcos, J.C.V.; Chen, G.F.; Chopin, F. CO2 Solubility Measurement and Thermodynamic Modeling for 1-Methylpiperazine/Water/CO2. Fluid Phase Equilib. 2015, 394, 118–128. [Google Scholar] [CrossRef]
  30. Hamborg, E.S.; Versteeg, G.F. Dissociation Constants and Thermodynamic Properties of Alkanolamines. Greenh. Gas Control Tech. 2009, 1, 1213–1218. [Google Scholar] [CrossRef] [Green Version]
  31. Li, S.; Kang, G.; Chen, J. Measurement and Thermodynamic Modeling for CO2 Solubility in N-(2-Hydroxyethyl)-Piperazine + Water System. Front. Eng. Res. 2021. [Google Scholar] [CrossRef]
  32. Oyenekan, B.A.; Rochelle, G.T. Energy Performance of Stripper Configurations for CO2 Capture by Aqueous Amines. Ind. Eng. Chem. Res. 2006, 45, 2457–2464. [Google Scholar] [CrossRef]
  33. Freeman, S.A.; Dugas, R.; Van Wagener, D.H.; Nguyen, T.; Rochelle, G.T. Carbon Dioxide Capture with Concentrated, Aqueous Piperazine. Int. J. Greenh. Gas. Control 2010, 4, 119–124. [Google Scholar] [CrossRef]
Figure 1. Molecular structure of studied amines.
Processes 09 02184 g001
Figure 2. Schematic diagram of amine scrubbing process simulation.
Processes 09 02184 g002
Figure 3. When the CO2 partial pressure of flue gas is 10 kPa, and the pressure of the desorption tower is 2.2 bar, the influence of the concentration of aqueous amine solutions on energy consumption for: (a) MEA, (b) DMEA, (c) 1-MPZ, (d) AMP and (e) HEPZ, is shown.
Processes 09 02184 g003
Figure 4. The relationship between reboiler energy consumption,   Q r e b , and circulating absorption: (a) MEA, (b) DMEA, (c) 1-MPZ, (d) AMP and (e) HEPZ.
Processes 09 02184 g004aProcesses 09 02184 g004b
Figure 5. The influence relationship between the cyclic capacity and CO2-lean loading: (a) MEA, (b) DMEA, (c) 1-MPZ, (d) AMP and (e) HEPZ.
Processes 09 02184 g005aProcesses 09 02184 g005b
Figure 6. The CO2 solubility curve of various solvents at 313.15 K.
Processes 09 02184 g006
Figure 7. The effect of CO2 partial pressure on the regeneration energy consumption of different solvents: (a) 40 wt.% MEA, (b) 30 wt.% DMEA, (c) 40 wt.% 1-MPZ, (d) 40 wt.% AMP and (e) 30 wt.% HEPZ.
Processes 09 02184 g007
Figure 8. The effect of desorption tower pressure on reboiler energy consumption and reboiler temperature: (a) MEA, (b) DMEA, (c) 1-MPZ, (d) AMP and (e) HEPZ.
Processes 09 02184 g008aProcesses 09 02184 g008b
Figure 9. The proportion of different heat in the reboiler energy of different solvents.
Processes 09 02184 g009
Table 1. The physical parameters and information of solvents.
AbsorbentCAS#BP/°CMW
MEA141-43-5170.861.08
PZ110-85-0146–14886.14
1-MPZ109-01-3138100.16
DMEA108-01-0133–13689.14
AMP124-68-516589.14
HEPZ103-76-4246130.19
Table 2. The lowest reboiler energy and process parameters of different solvents.
Absorbent w t . % α l e a n
mol/mol
α r i c h
mol/mol
L/G
kg/kg
T r e b
°C
Q r e b Q c o n   Q a b s Q T
GJ/ton   C O 2
MEA400.220.5111.742125.43.4150.6692.3470.401
PZ100.200.8466.167123.34.6572.0081.6041.05
1-MPZ400.050.5651.641124.53.1360.6622.0840.392
DMEA300.010.3492.738122.43.2071.3171.2220.669
AMP400.010.5201.361125.33.1680.672.1840.315
HEPZ300.020.5382.641123.73.0180.8541.5440.686
Table 3. Regeneration energy, solvent loss and cyclic capacity of different solvents.
Absorbent Q r e b GJ / tCO 2 Cyclic Capacity
mol CO2/kg sol
The Solvent Loss
mol/s
Loss/RS
%
MEA3.4151.52340.0003420.14
PZ4.6570.72470.0001420.10
1-MPZ3.1362.05750.0021770.98
DMEA3.2071.08390.0292123.23
AMP3.1682.28830.0024660.52
HEPZ3.0181.19380.0000870.02
Publisher’s Note: MDPI stays neutral with regard to jurisdictional claims in published maps and institutional affiliations.

