
Analysis of Rotor Position Detection Performance According to the Frequency of Square Waveform Voltage in the Harmonic Injection Sensorless Method through HILS

Abstract
:1. Introduction
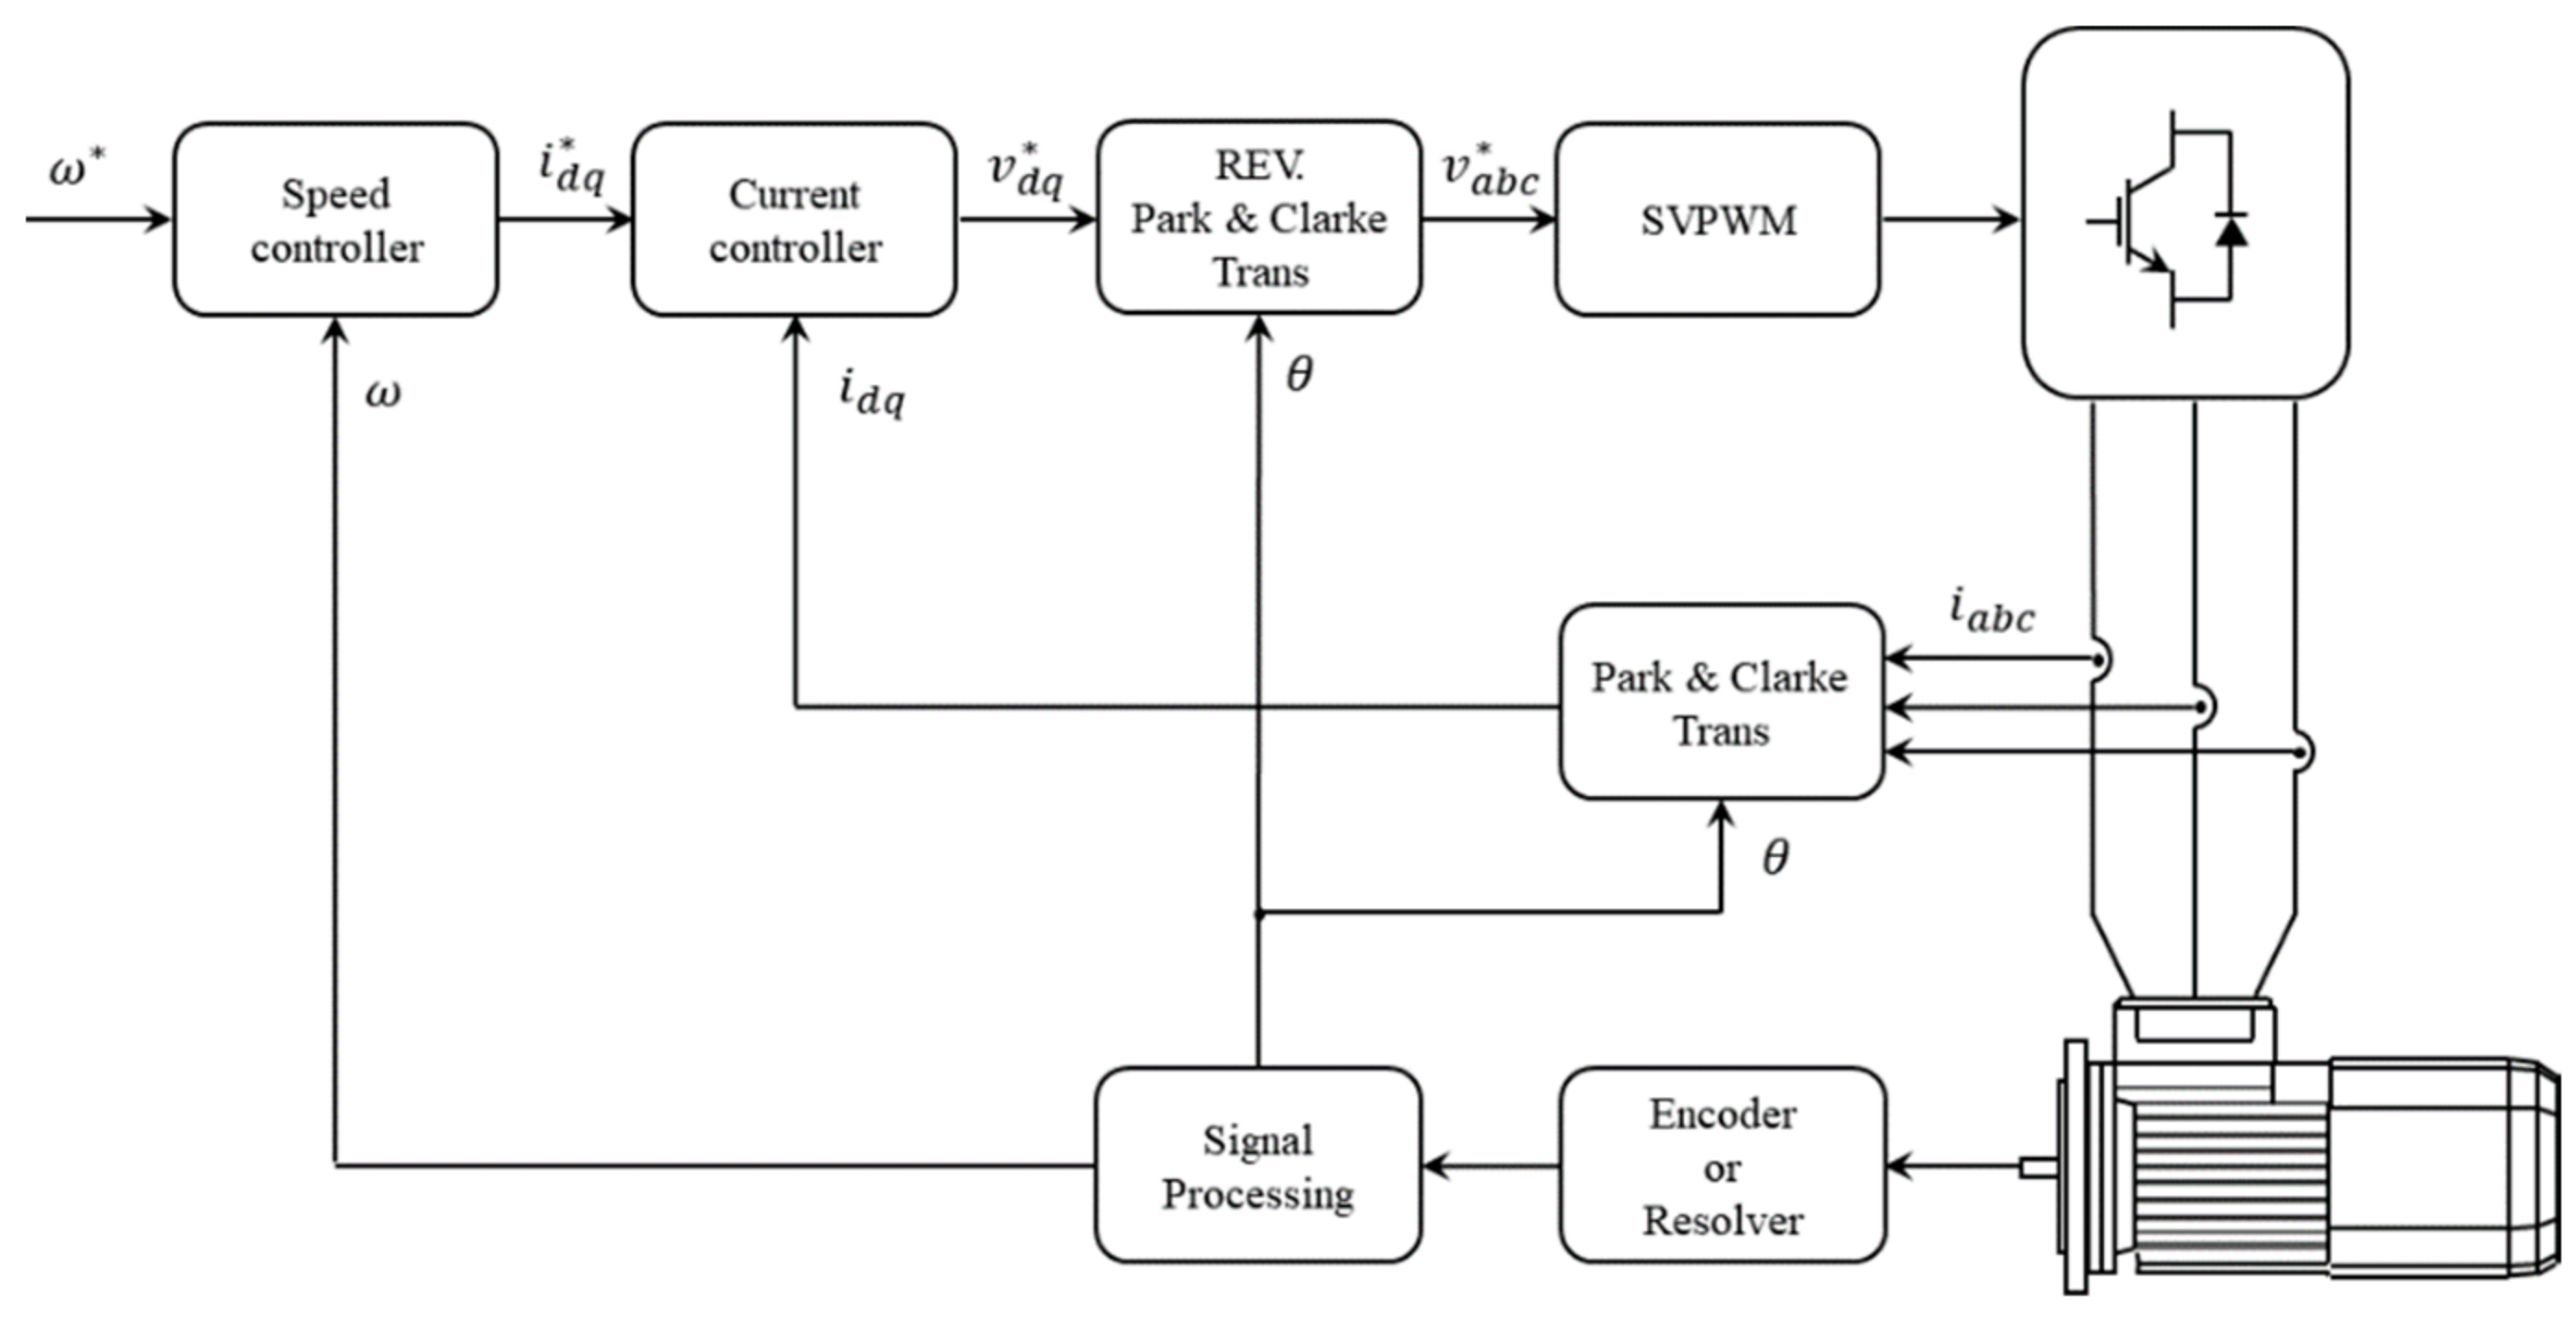
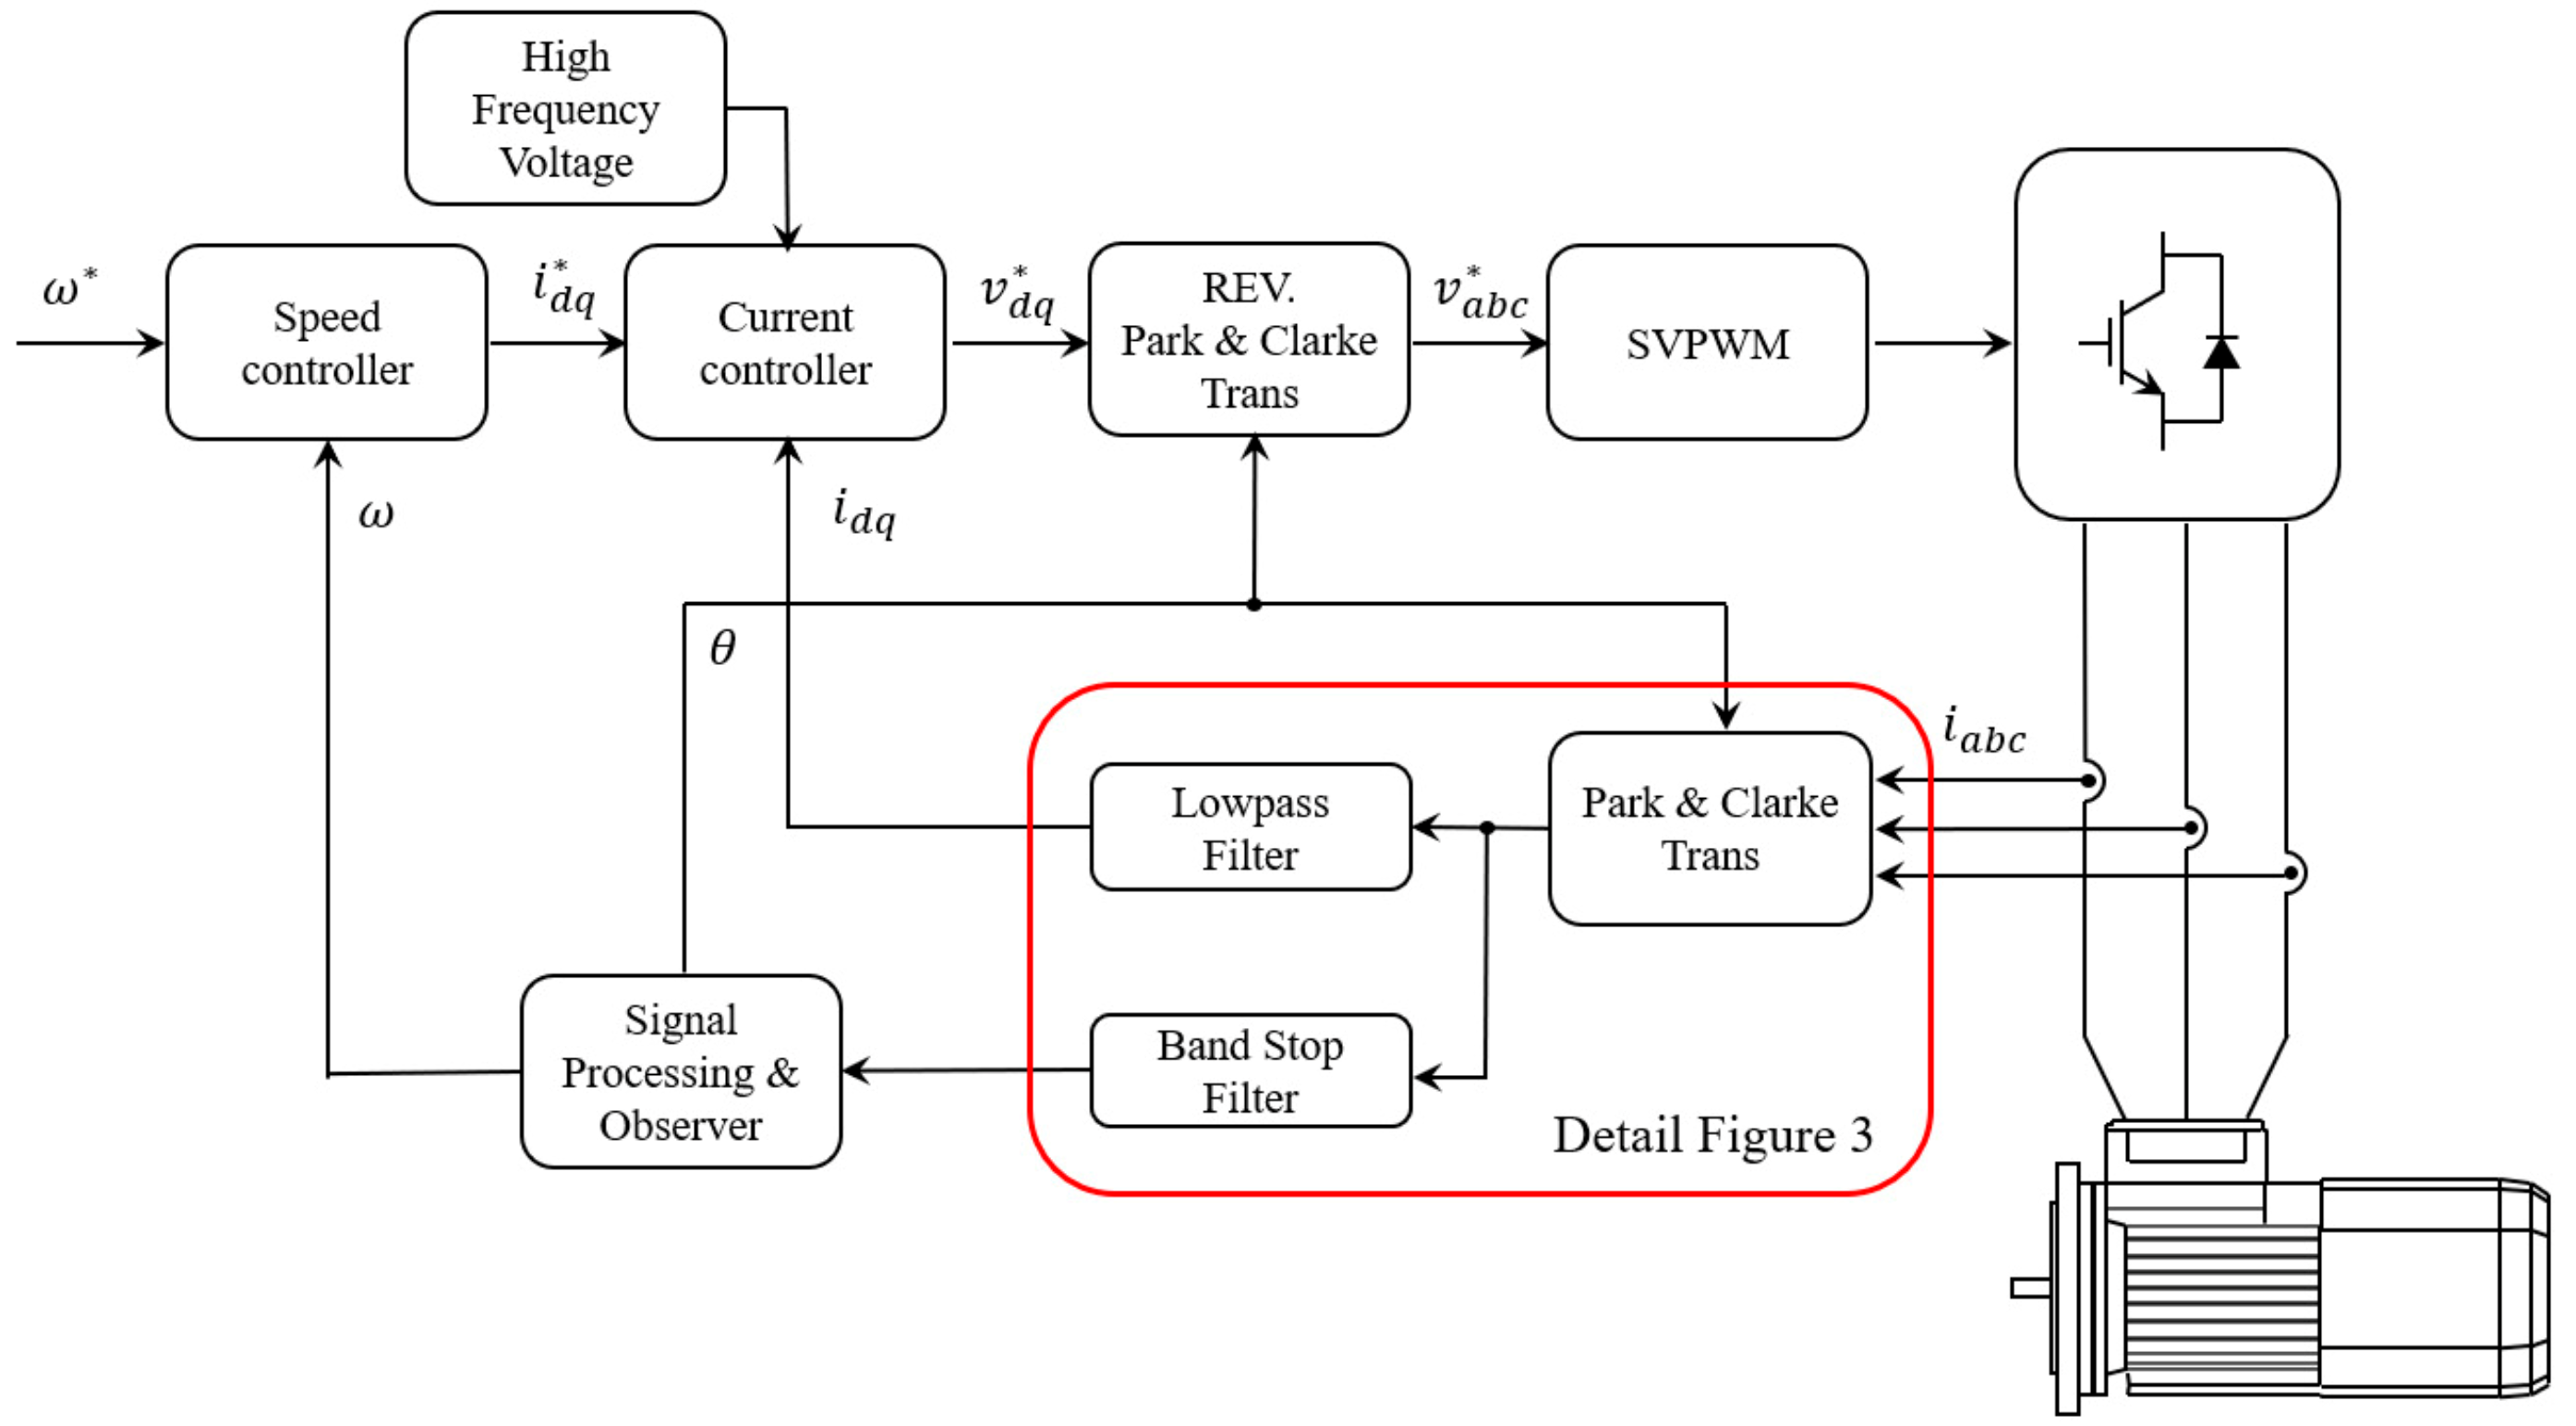
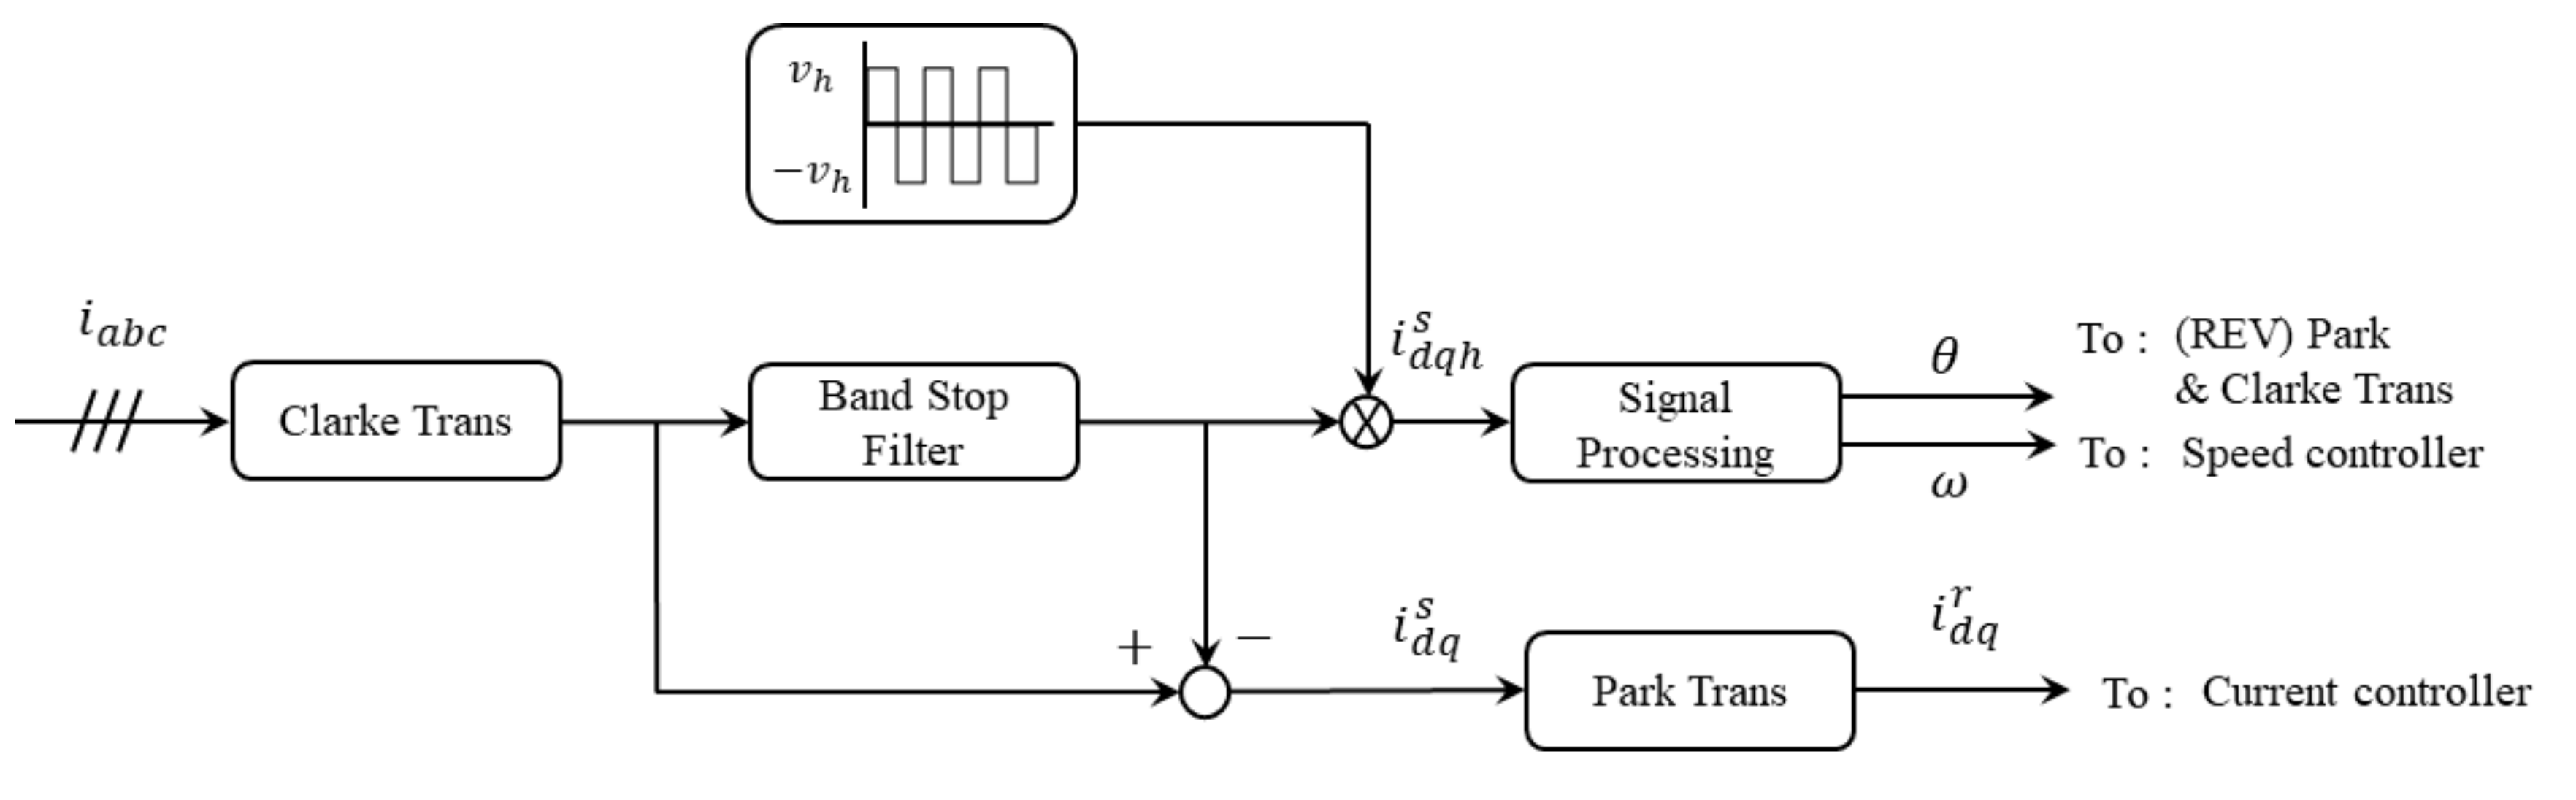
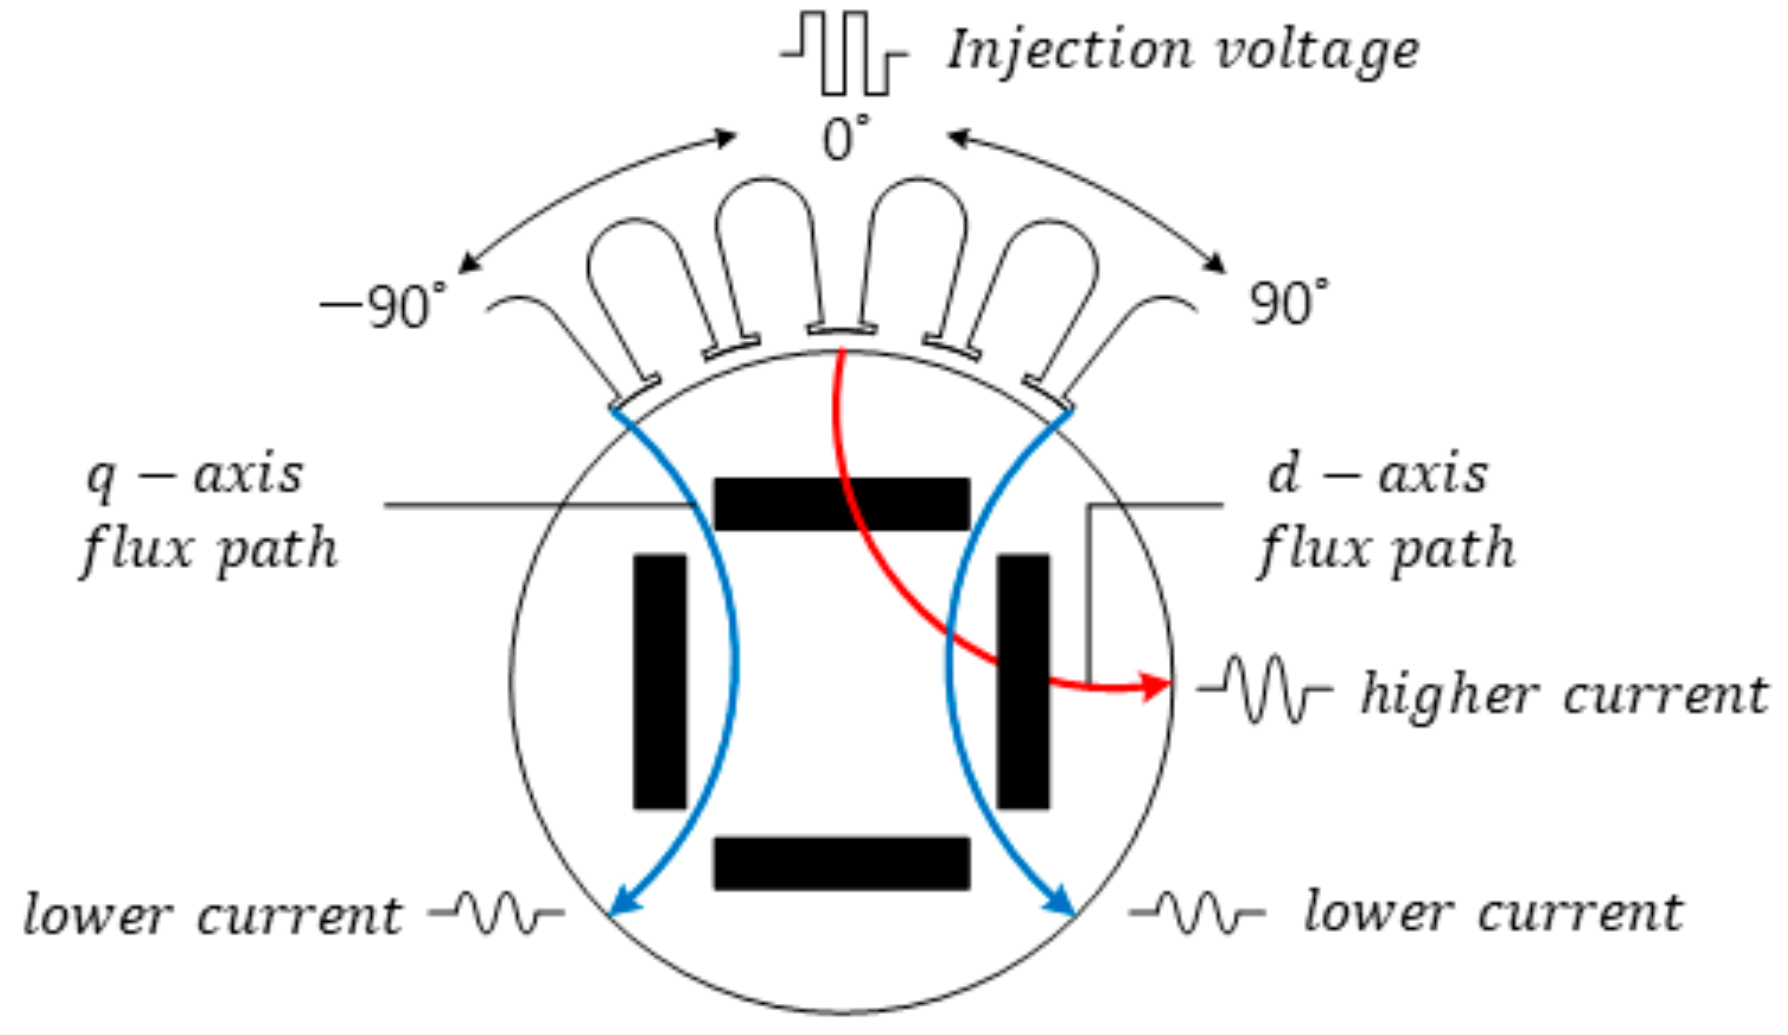
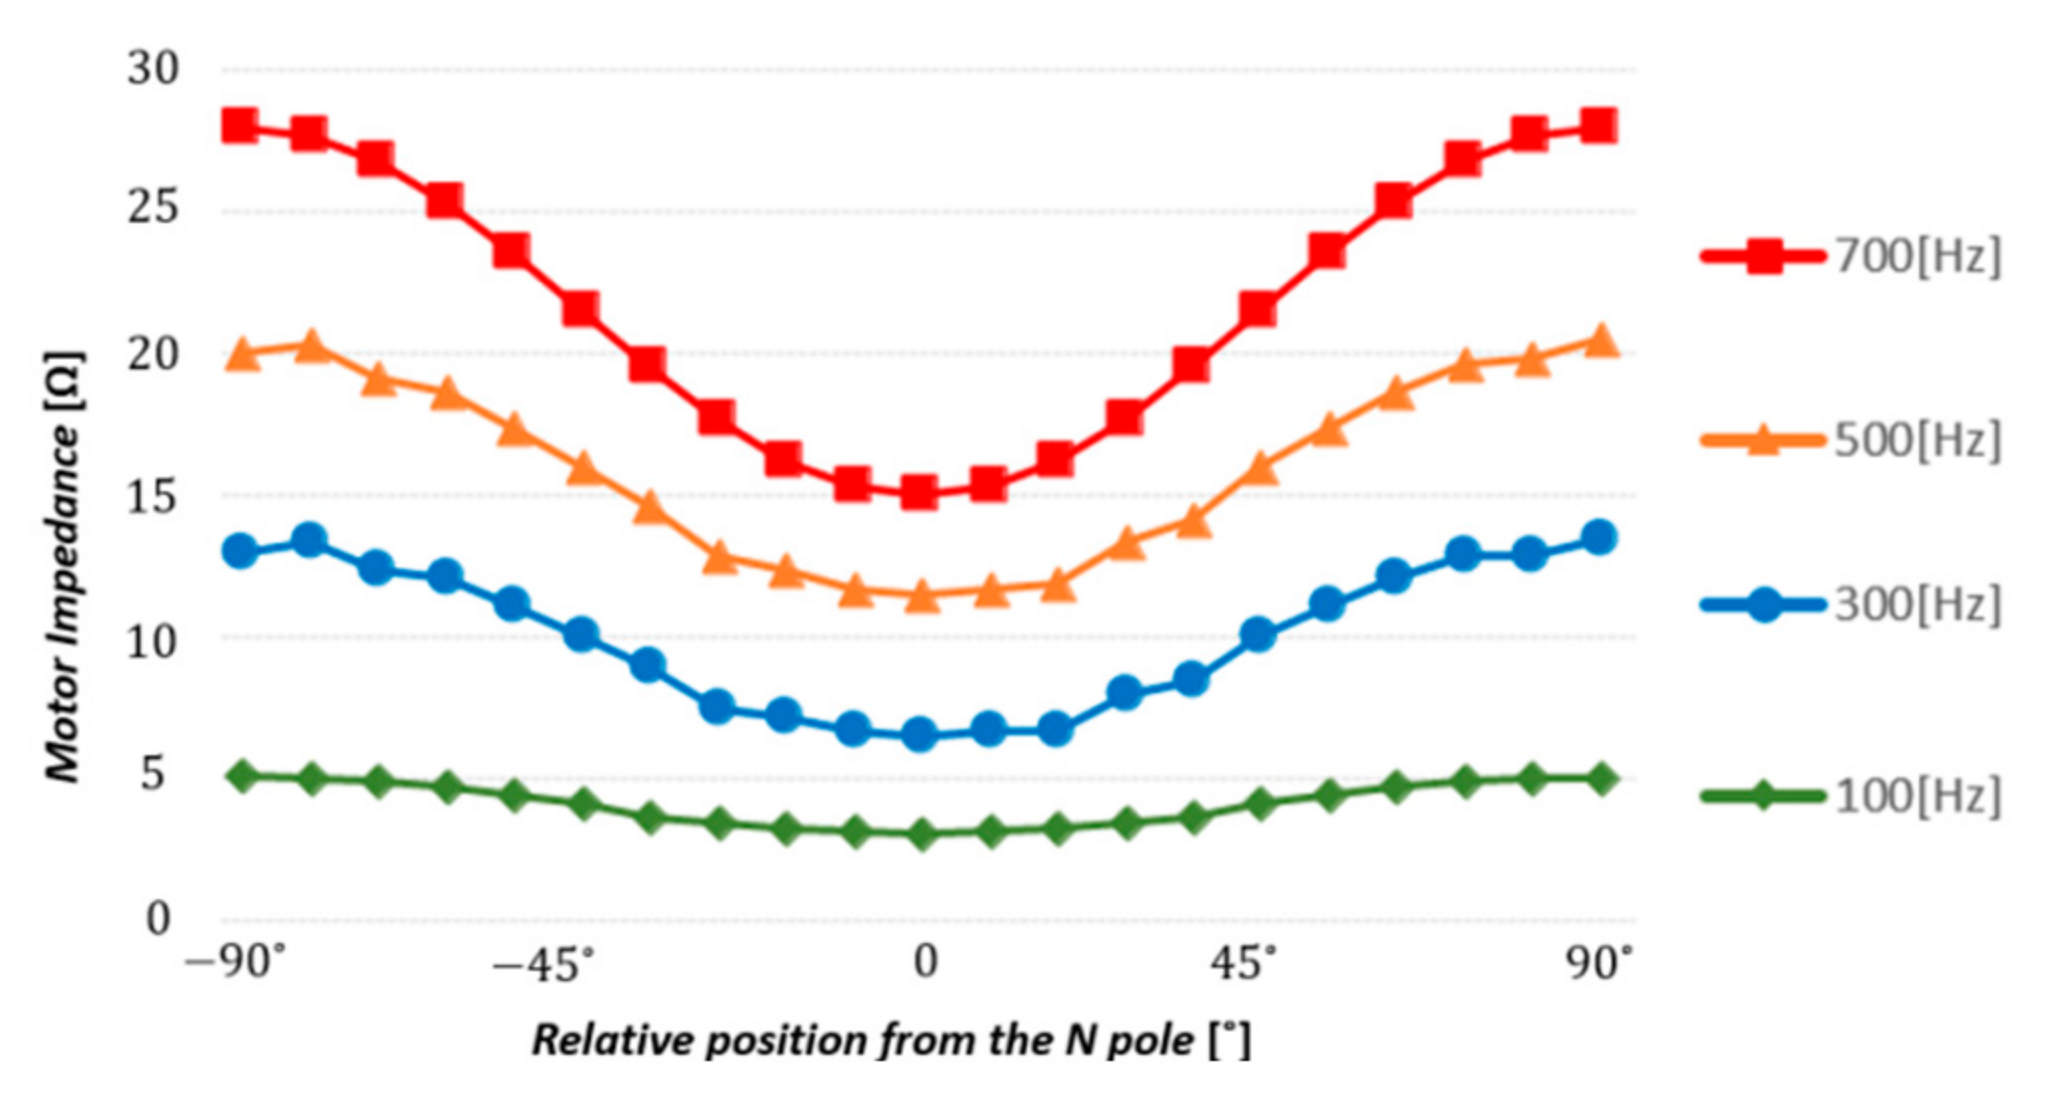
2. Square Waveform Harmonic Injection Sensorless Control and GaN FET
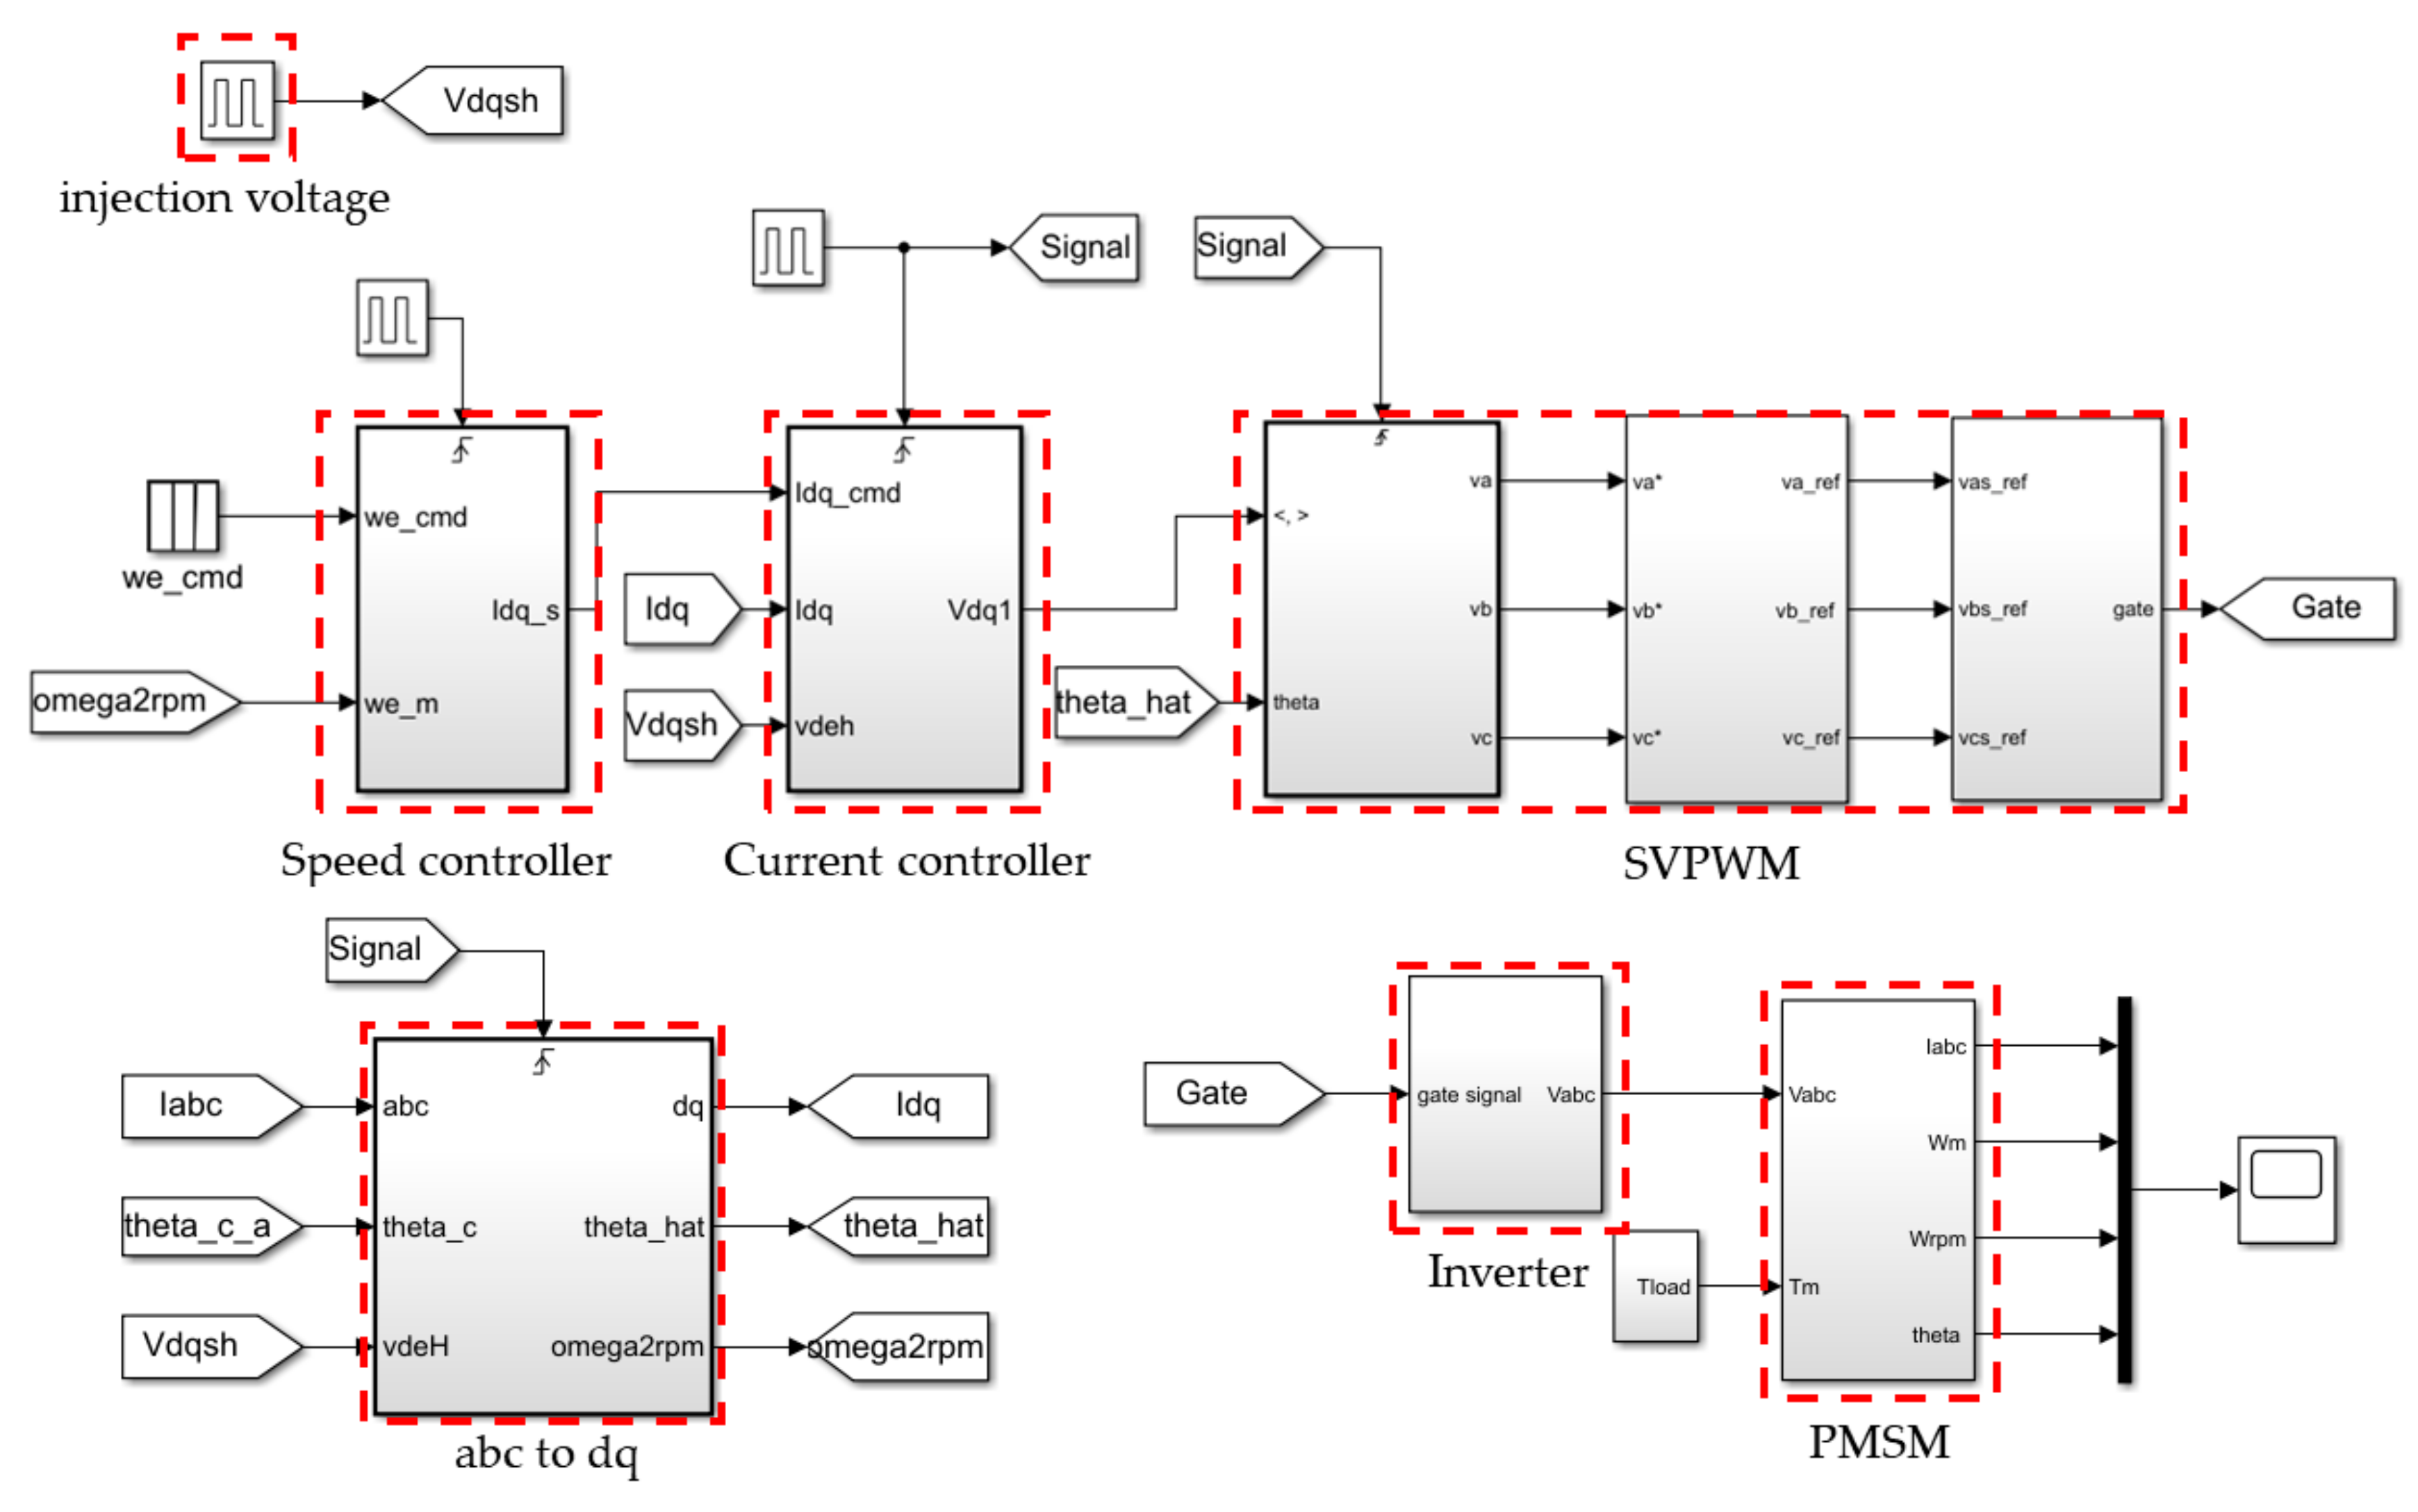
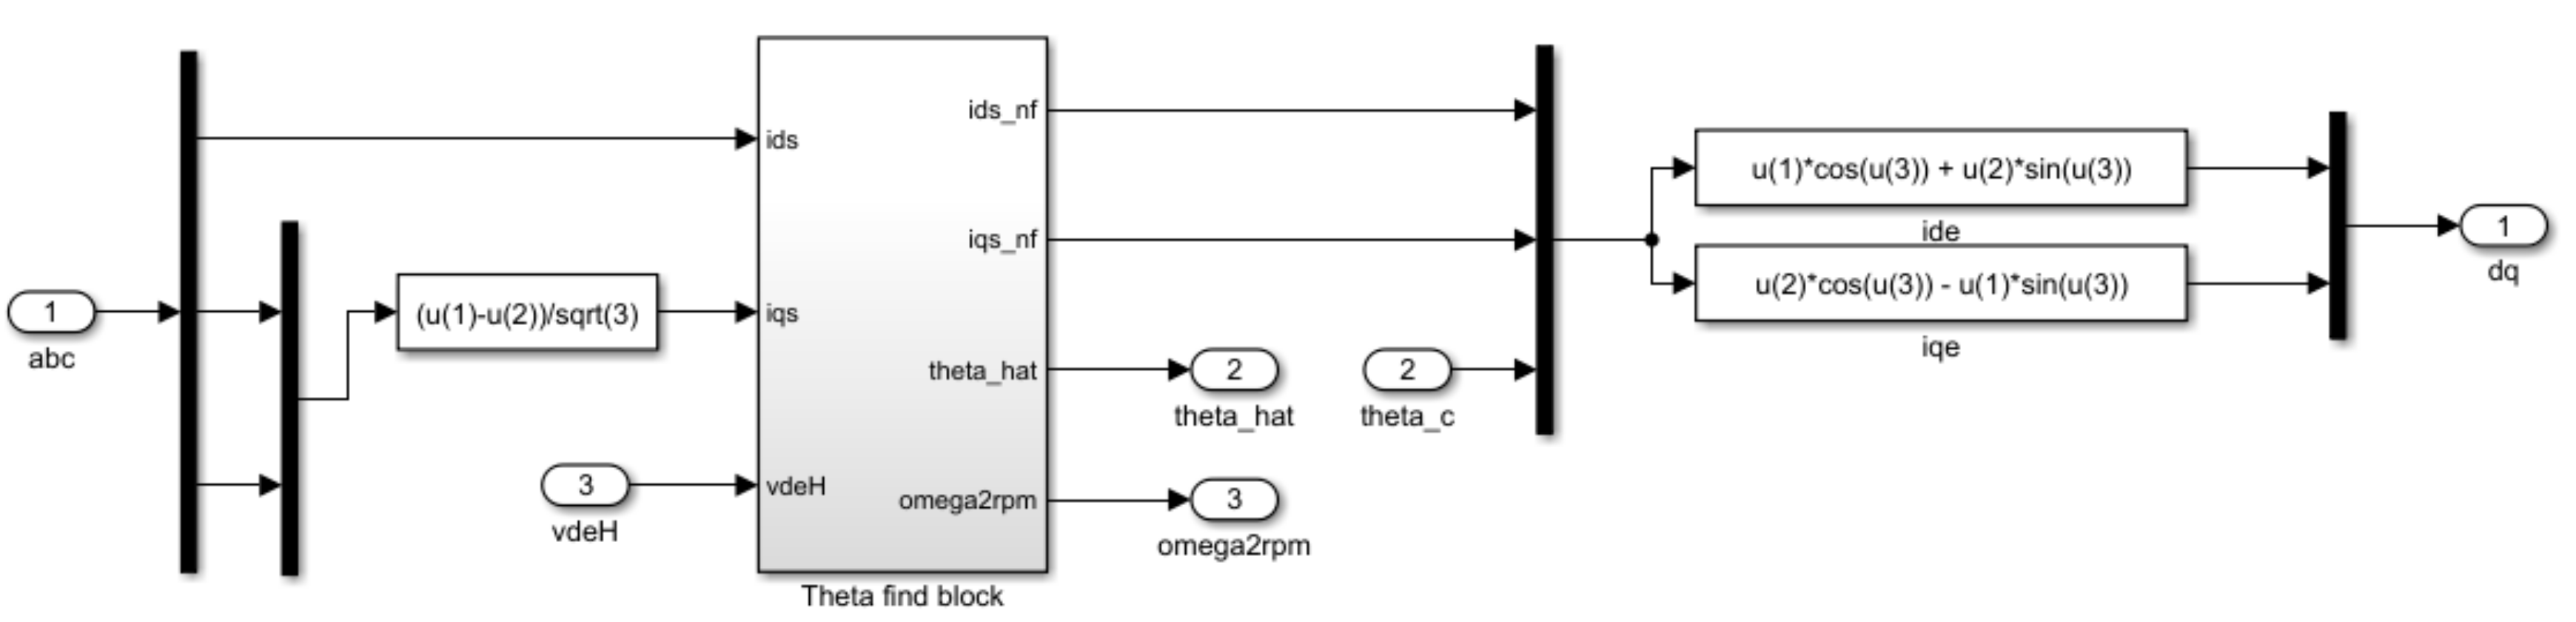
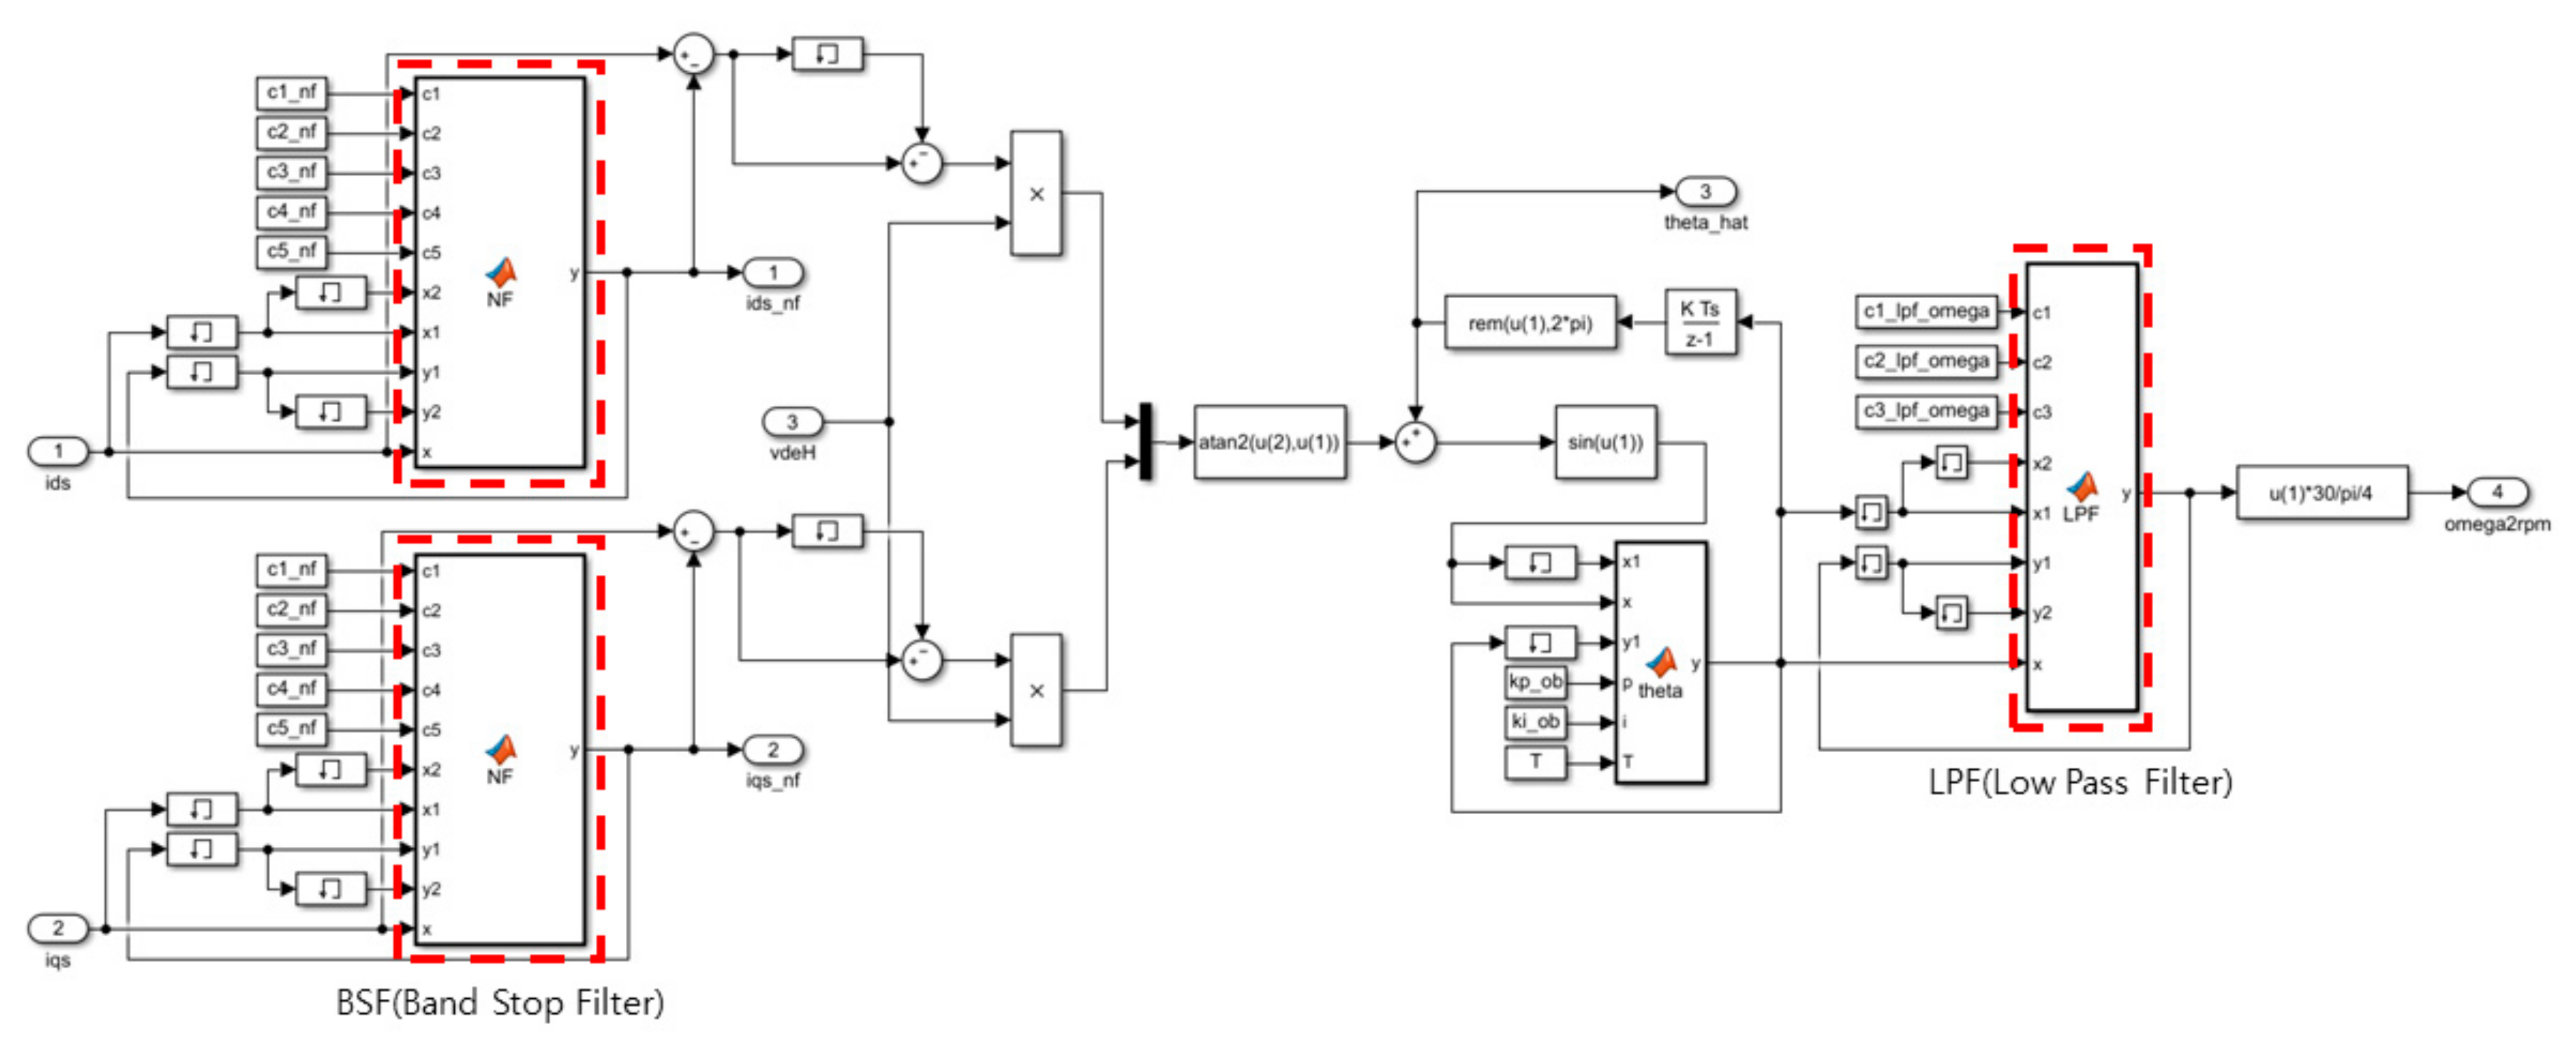
3. Maltab/Simulink Model of Square Harmonic Injection Sensorless Technique
4. Configuration of HILS Experimental Equipment and VHDL Program
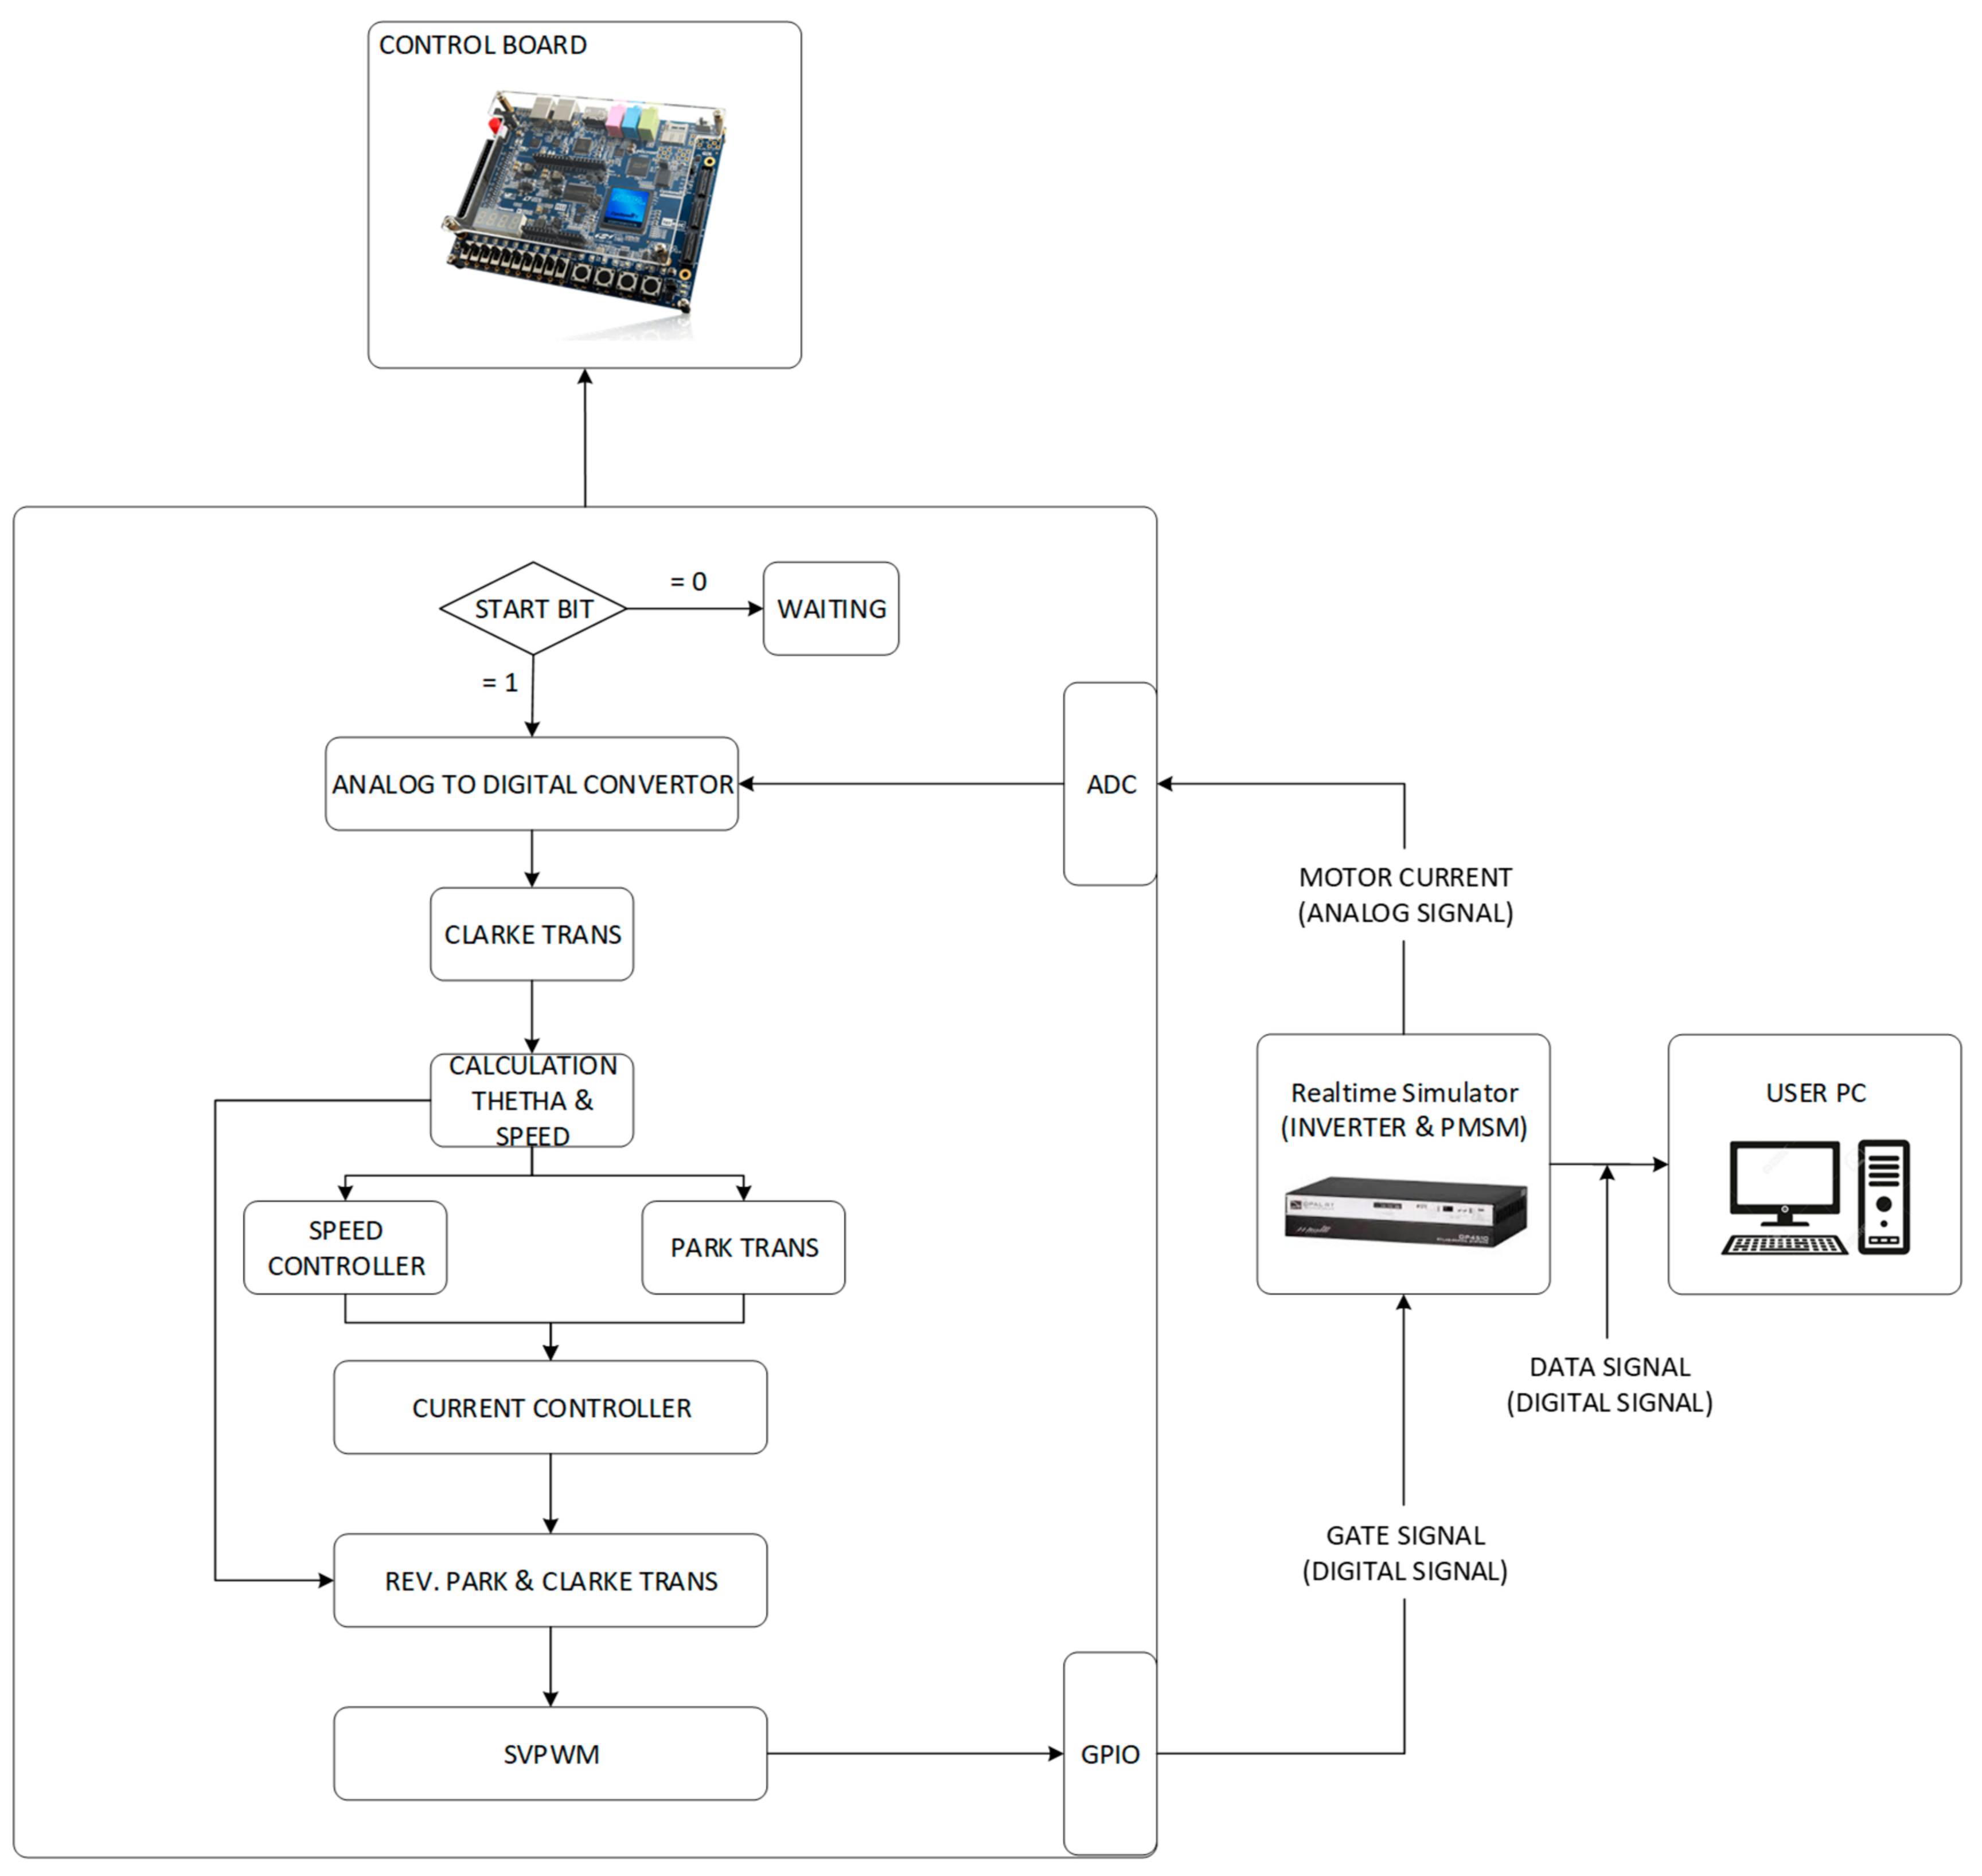
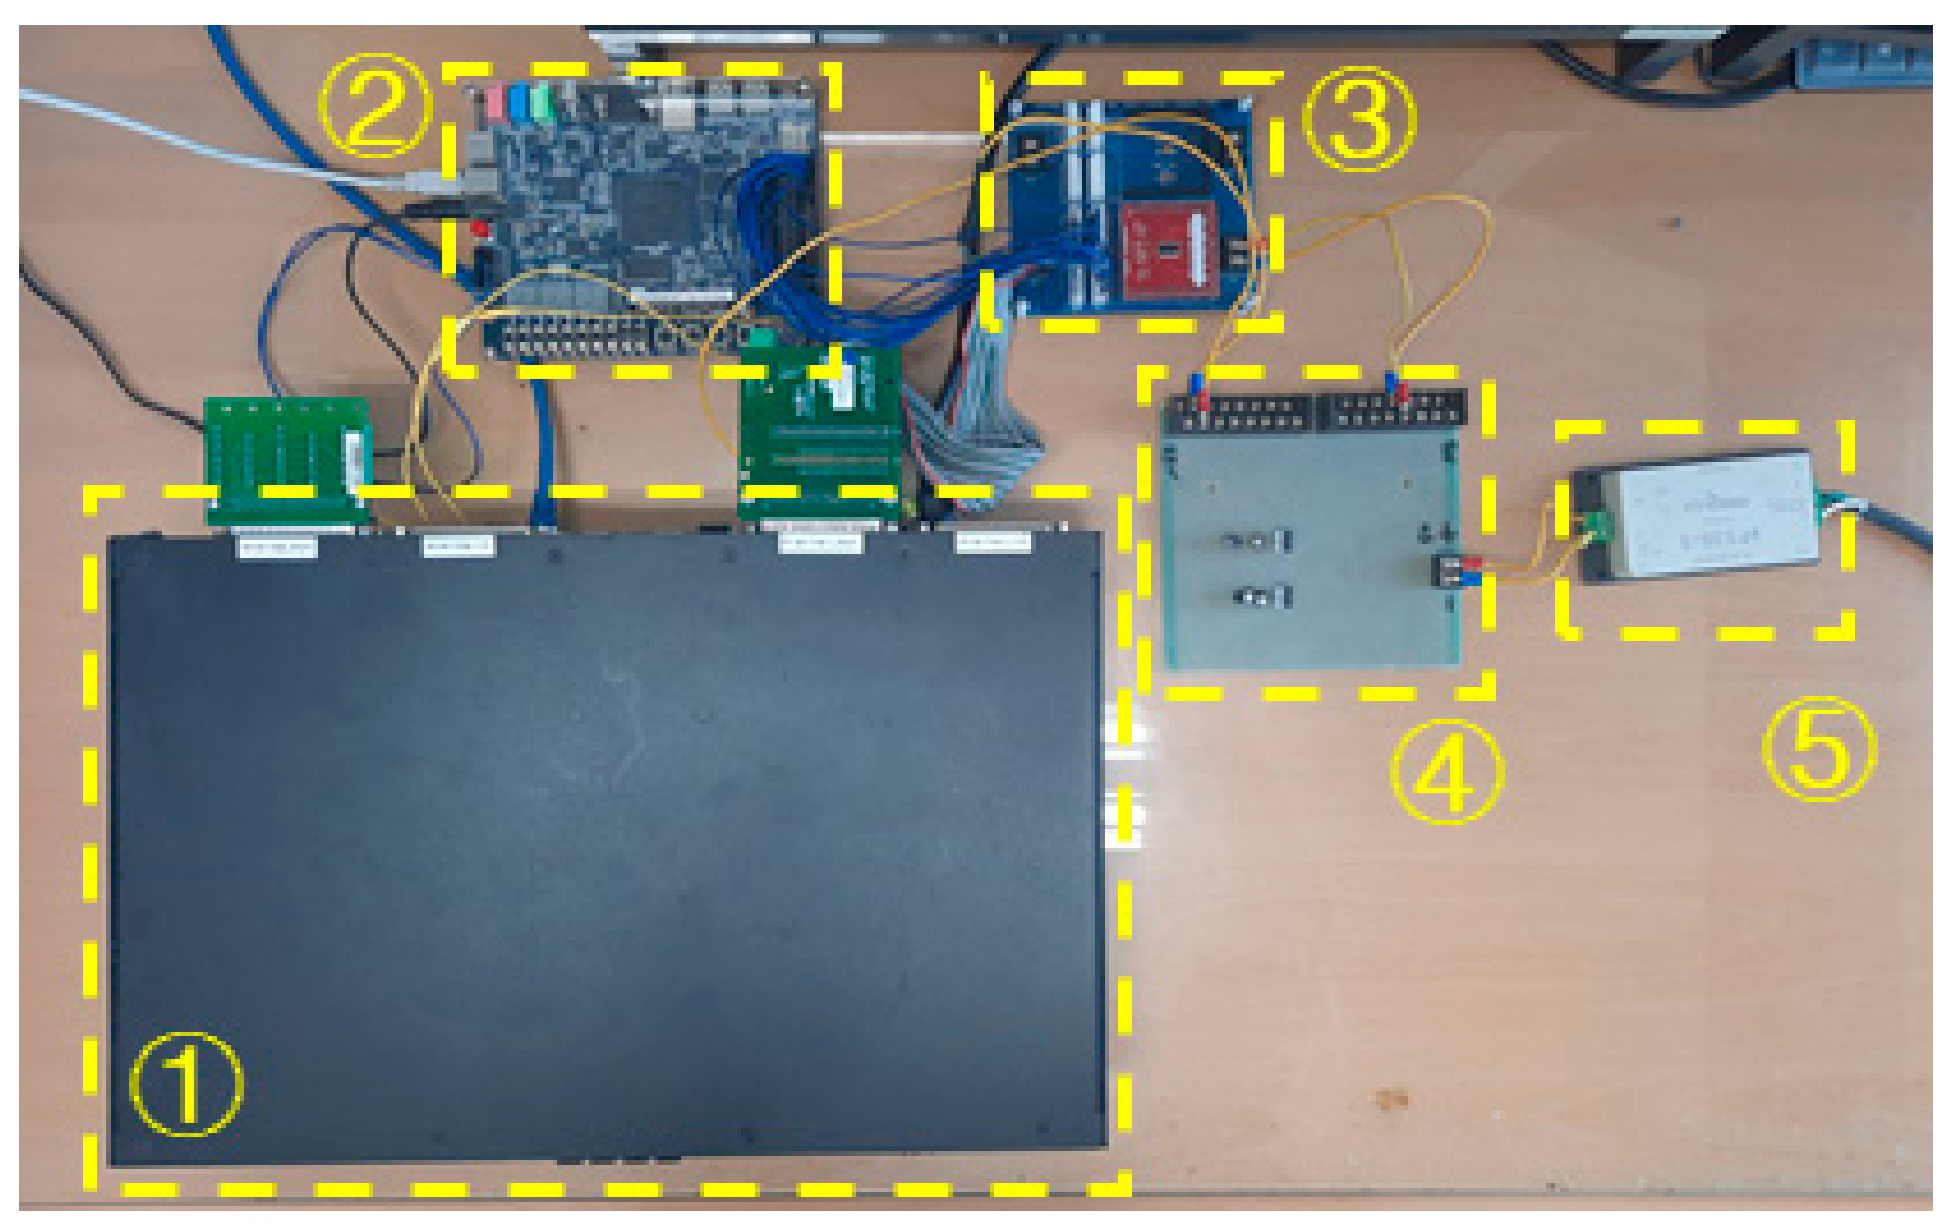
4.1. Configuration of HILS Experimental Equipment
4.2. Controller Implementation Using FPGA
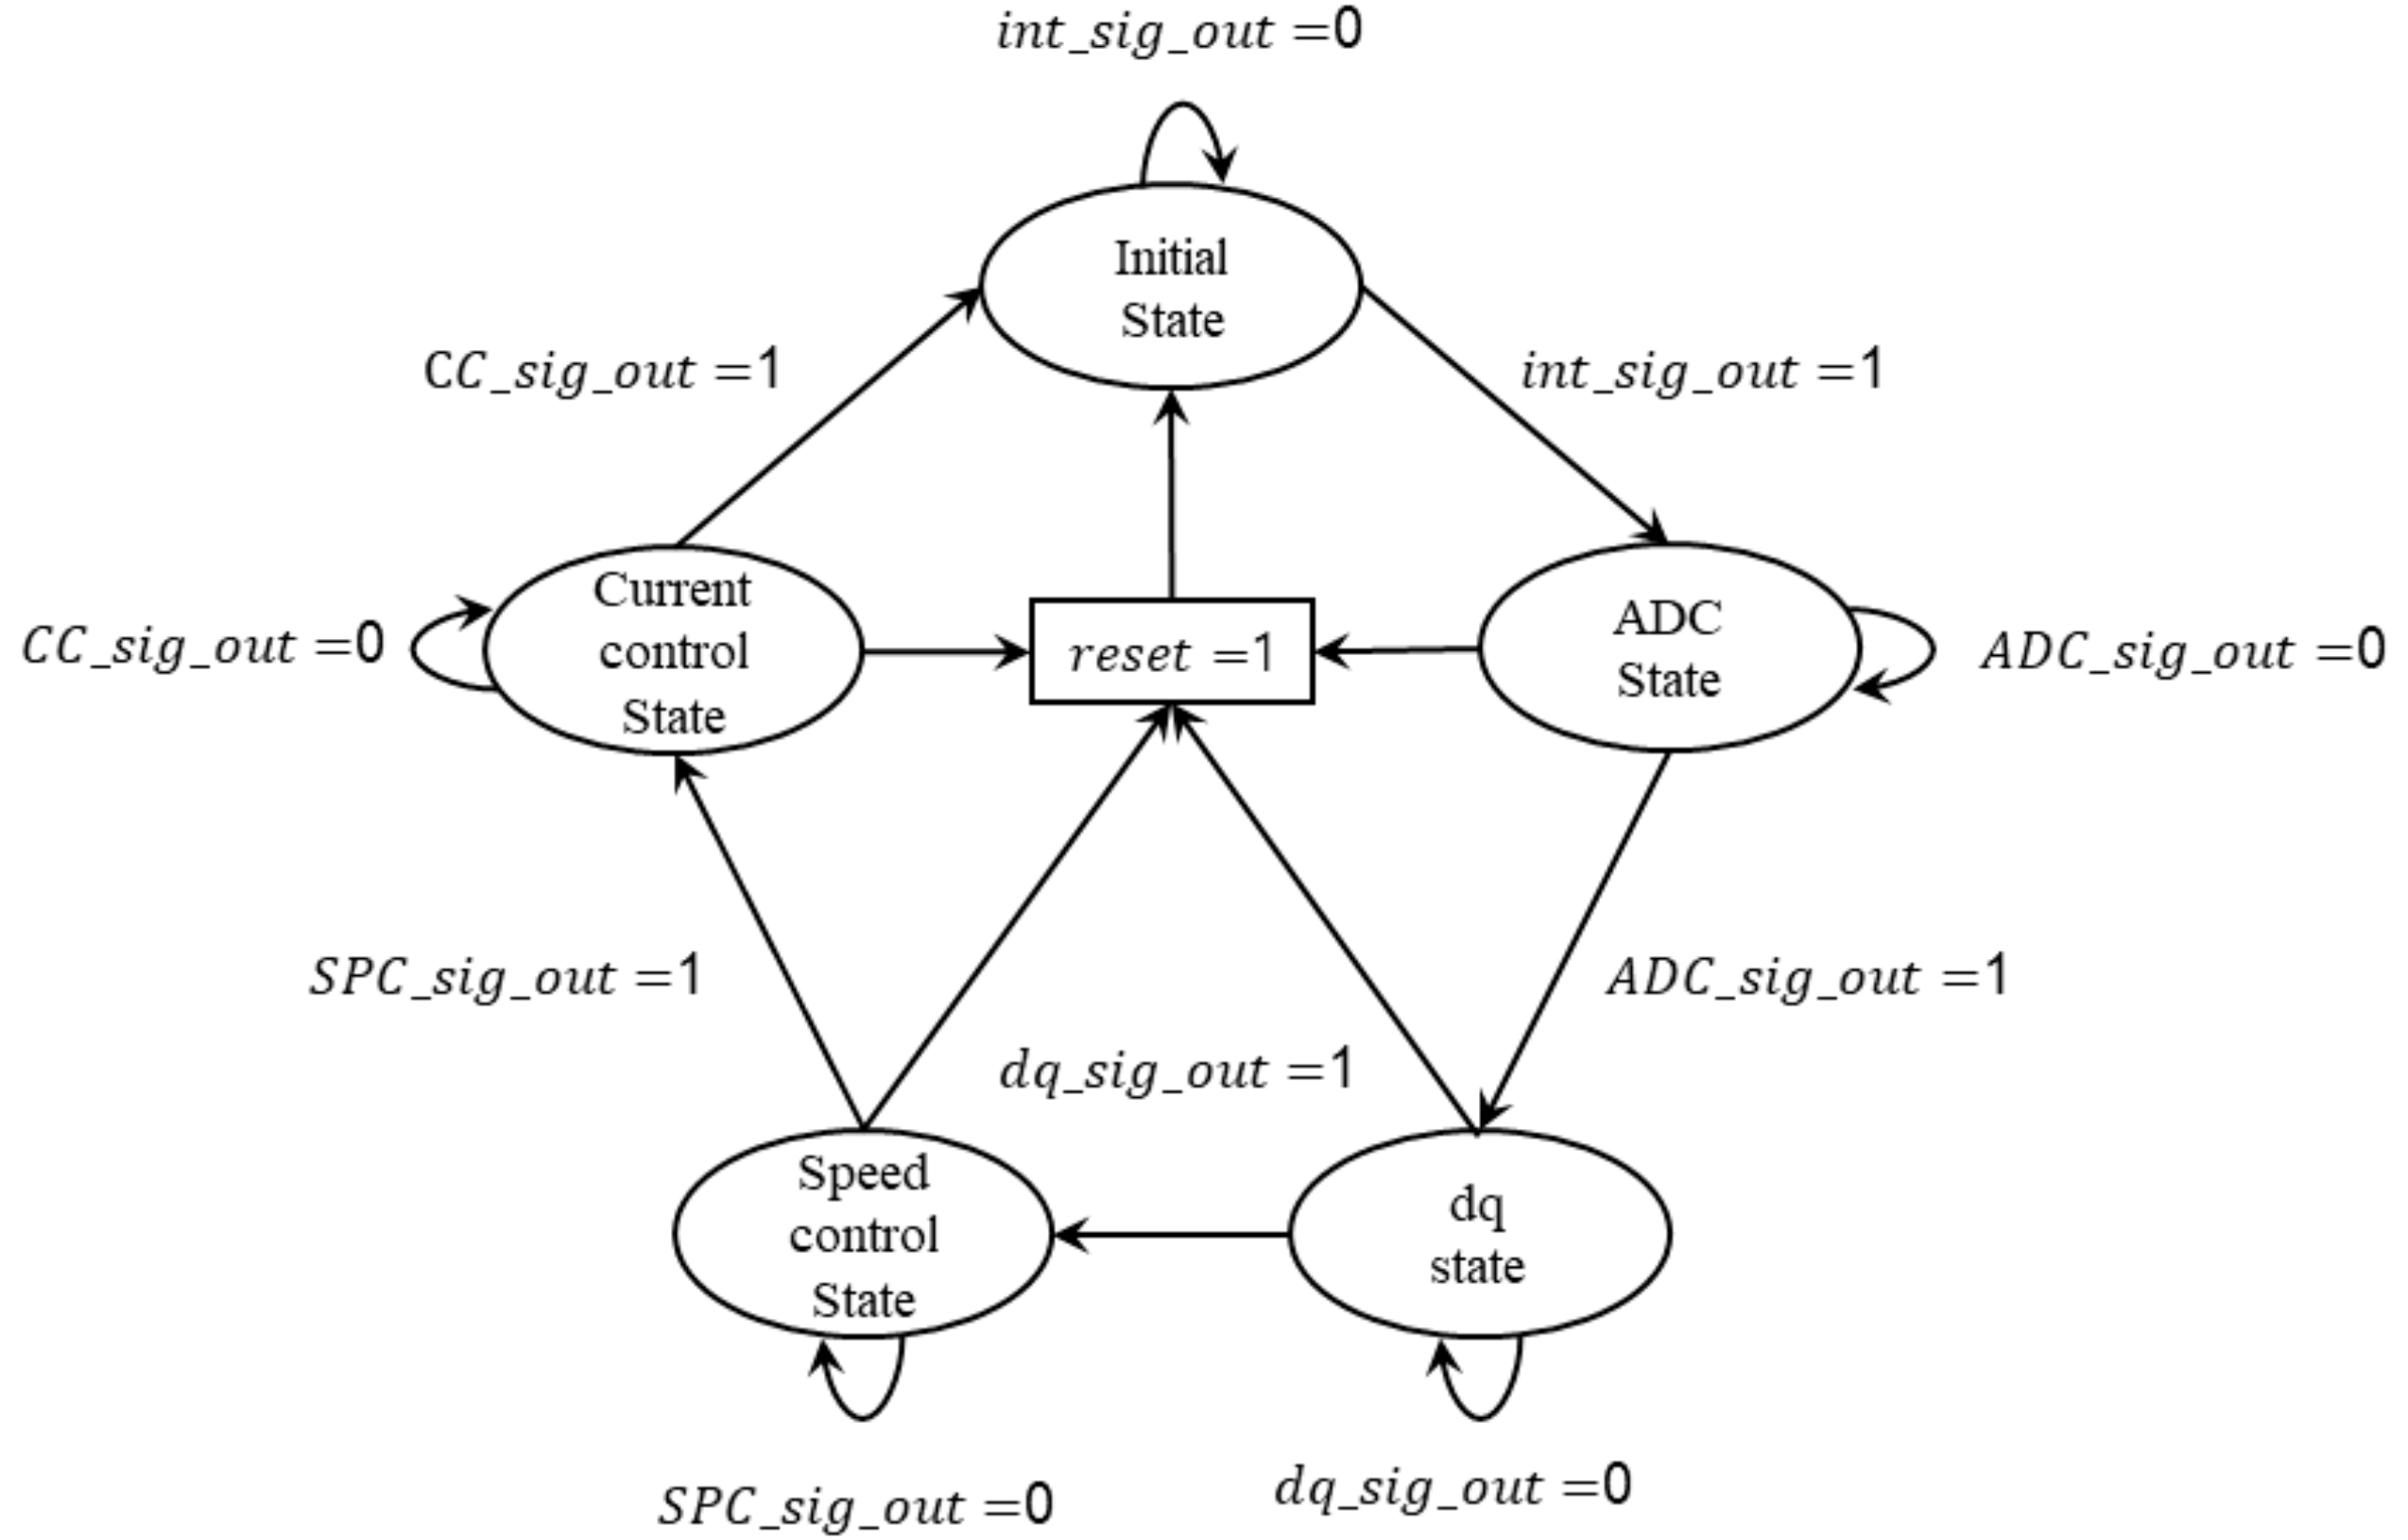
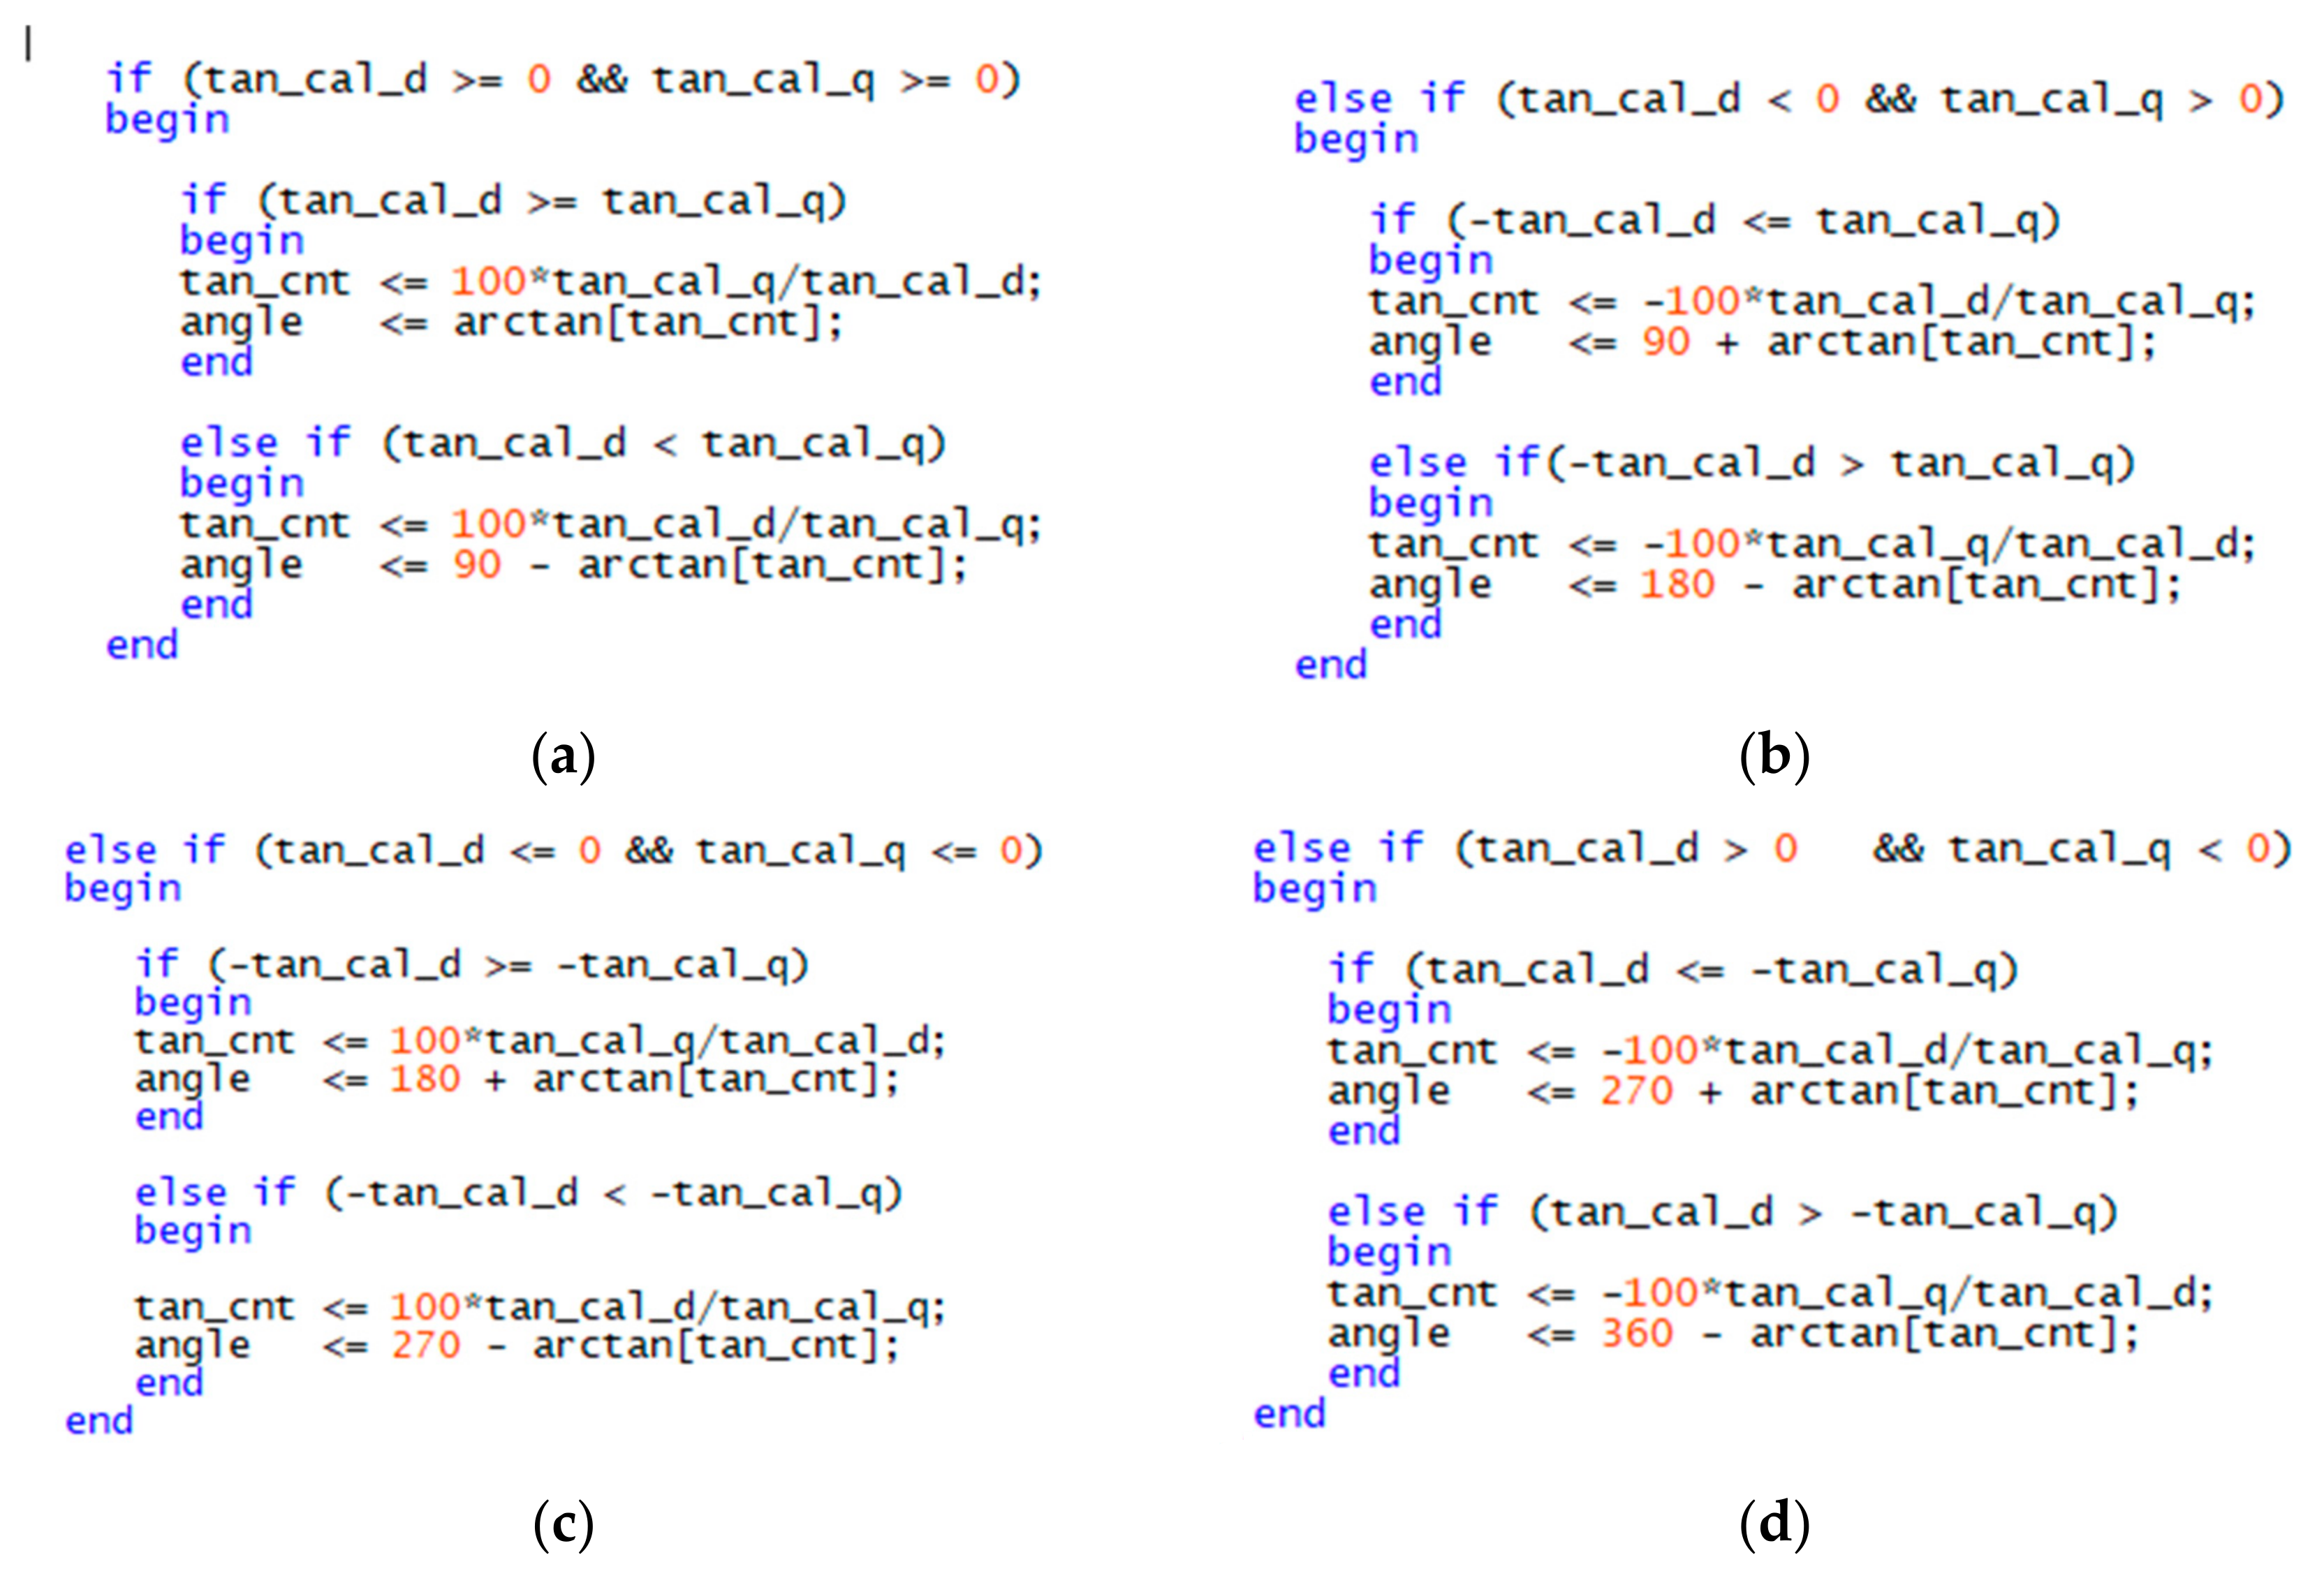
4.3. Arc Tangent Calculation Using VHDL
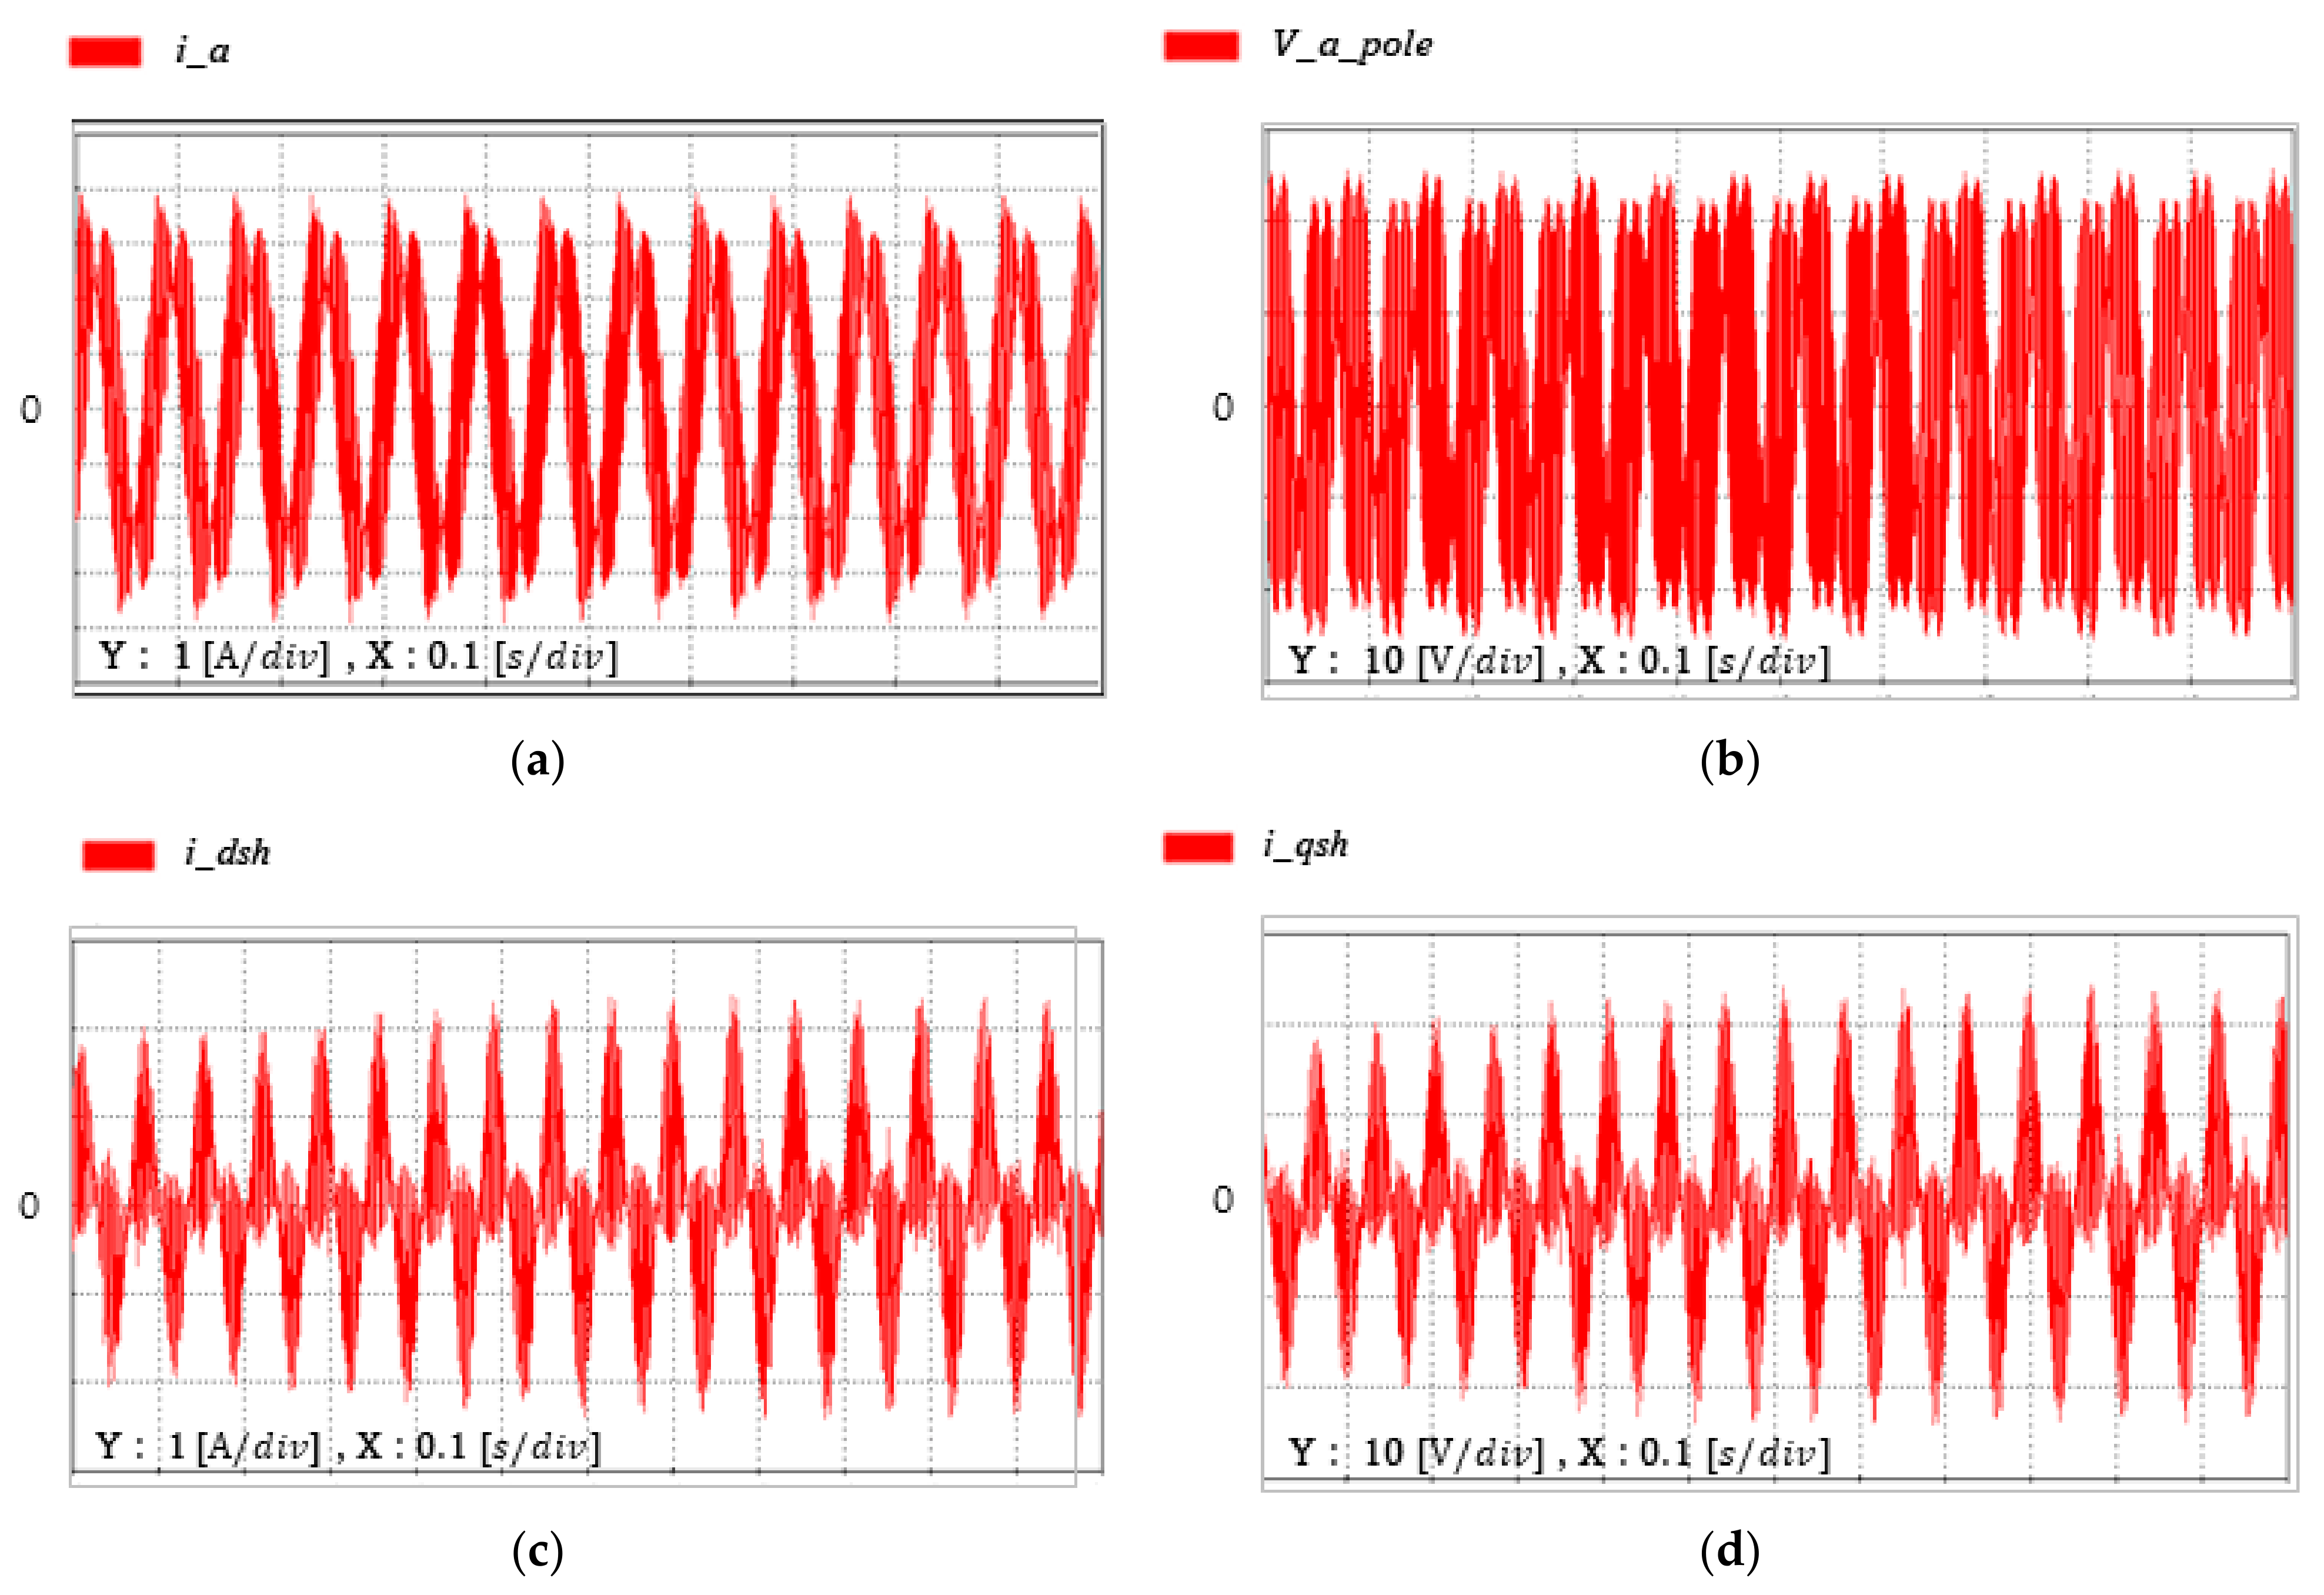
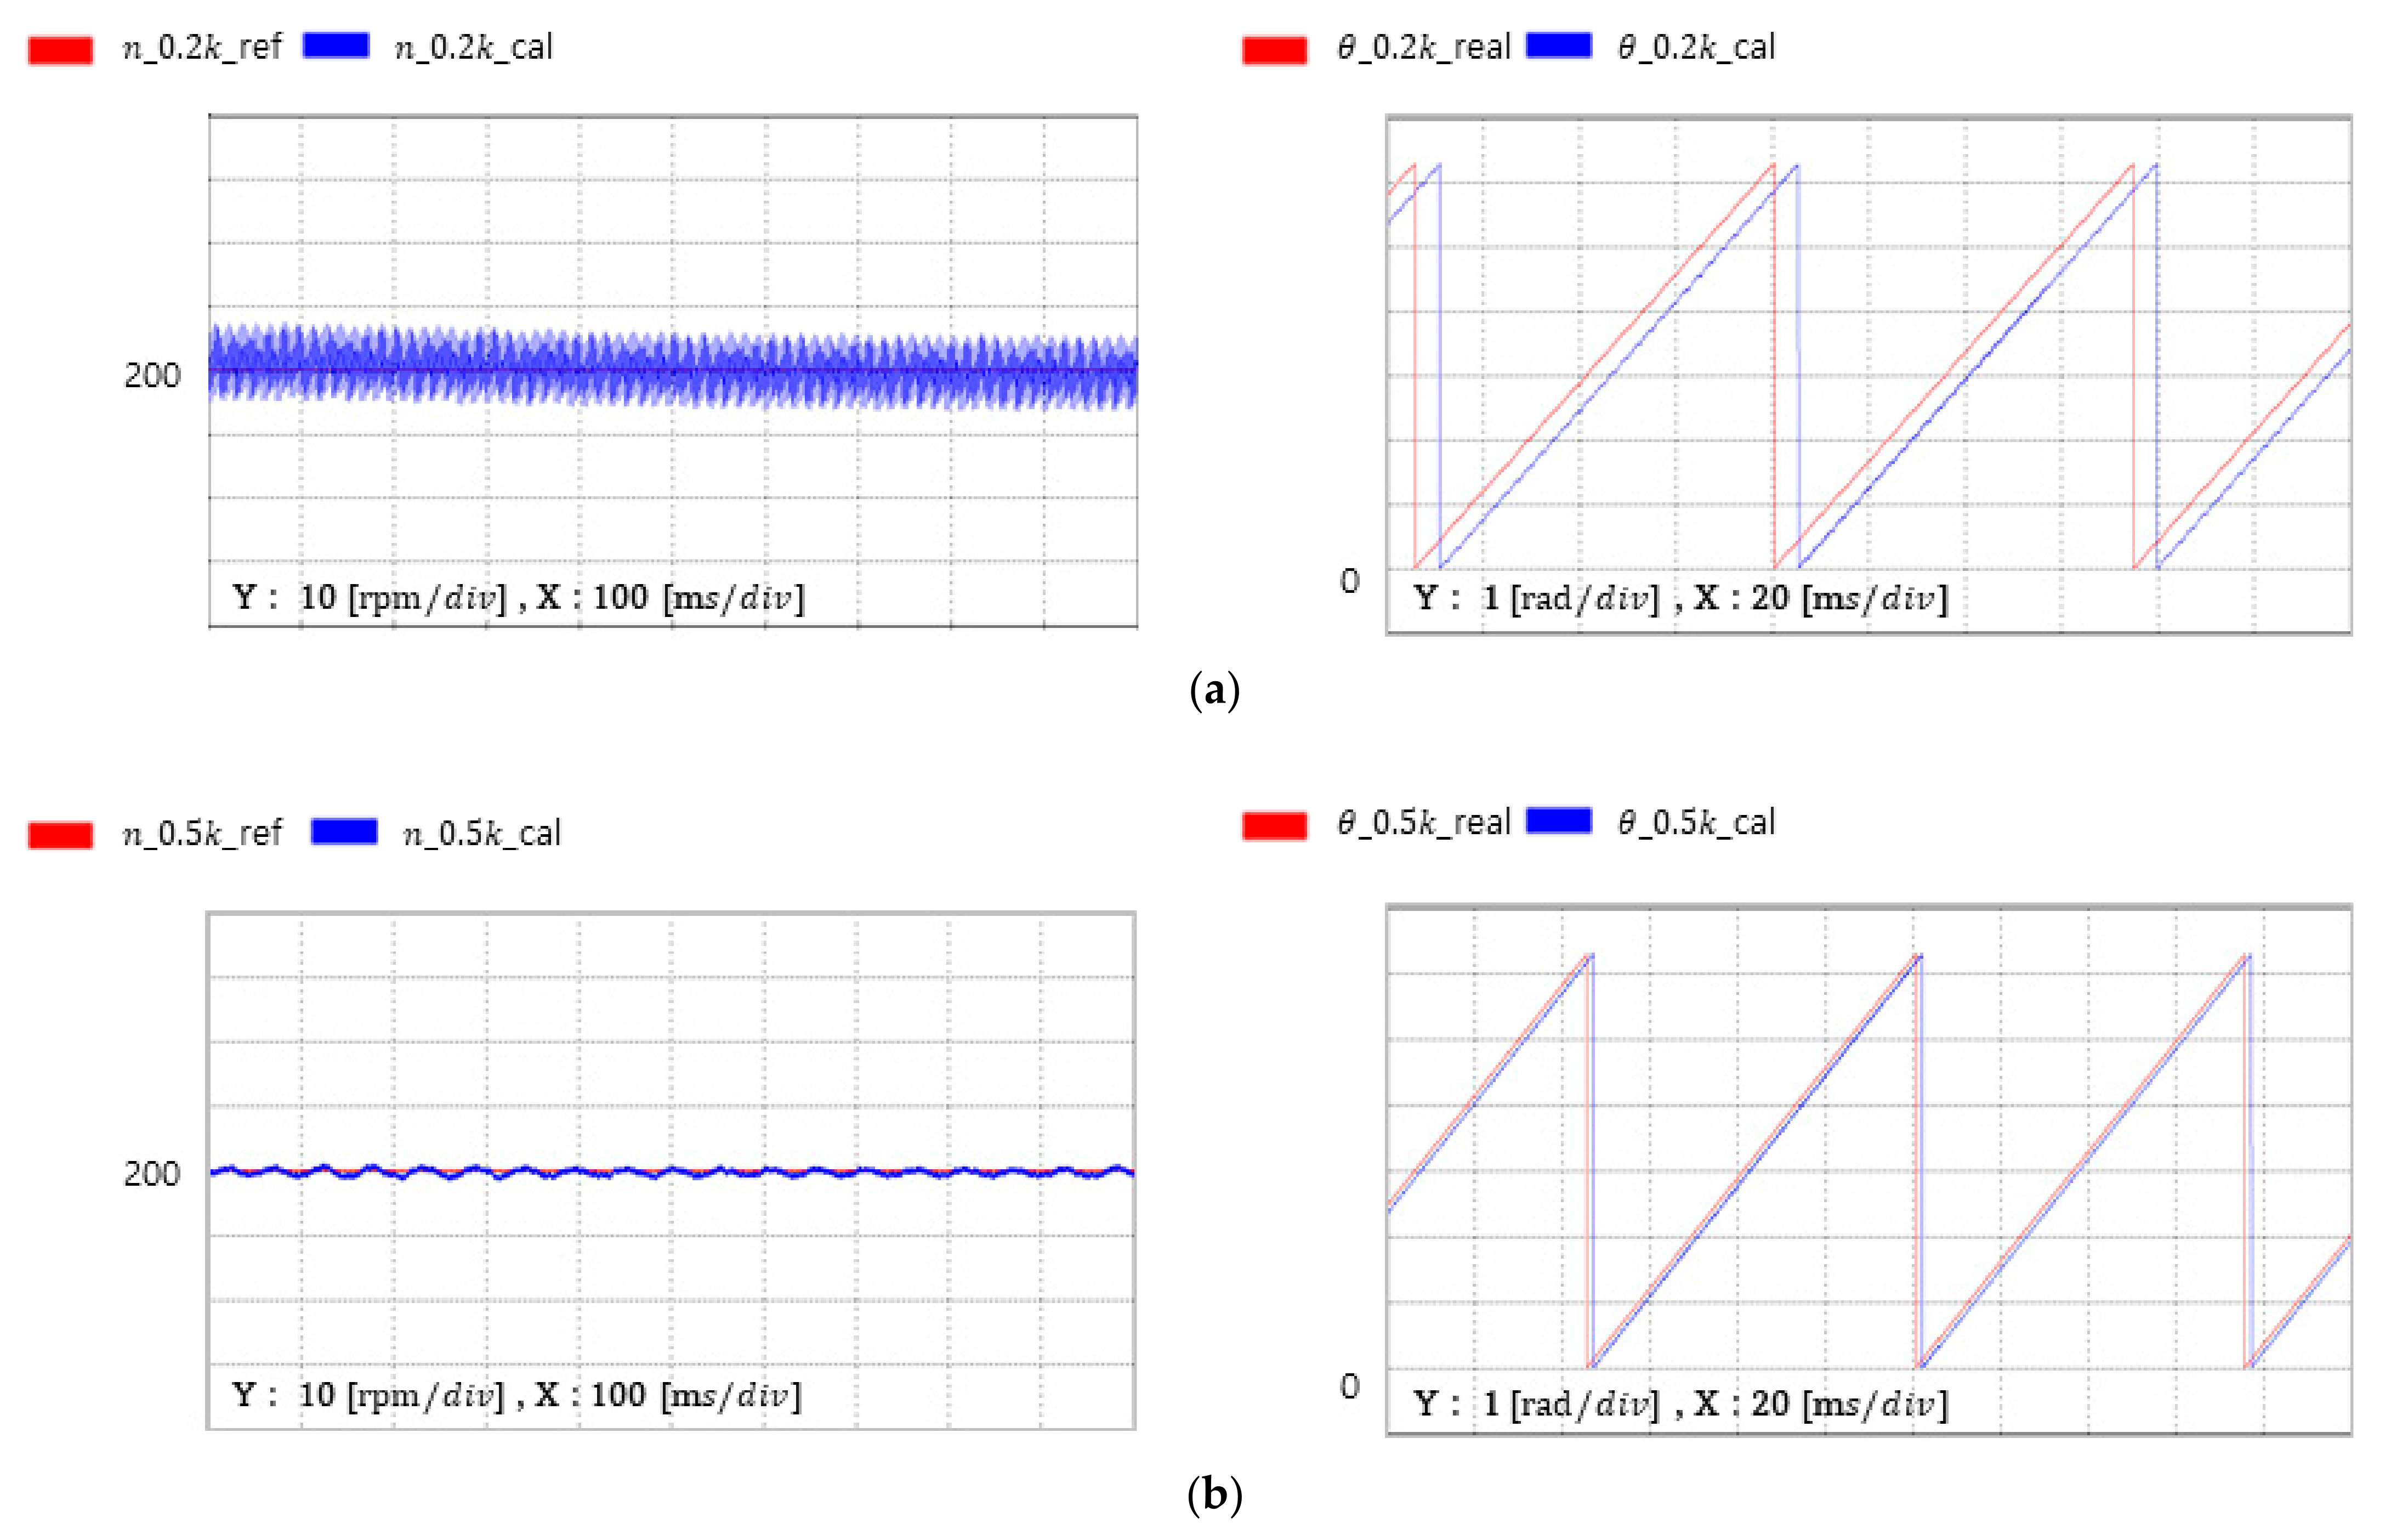
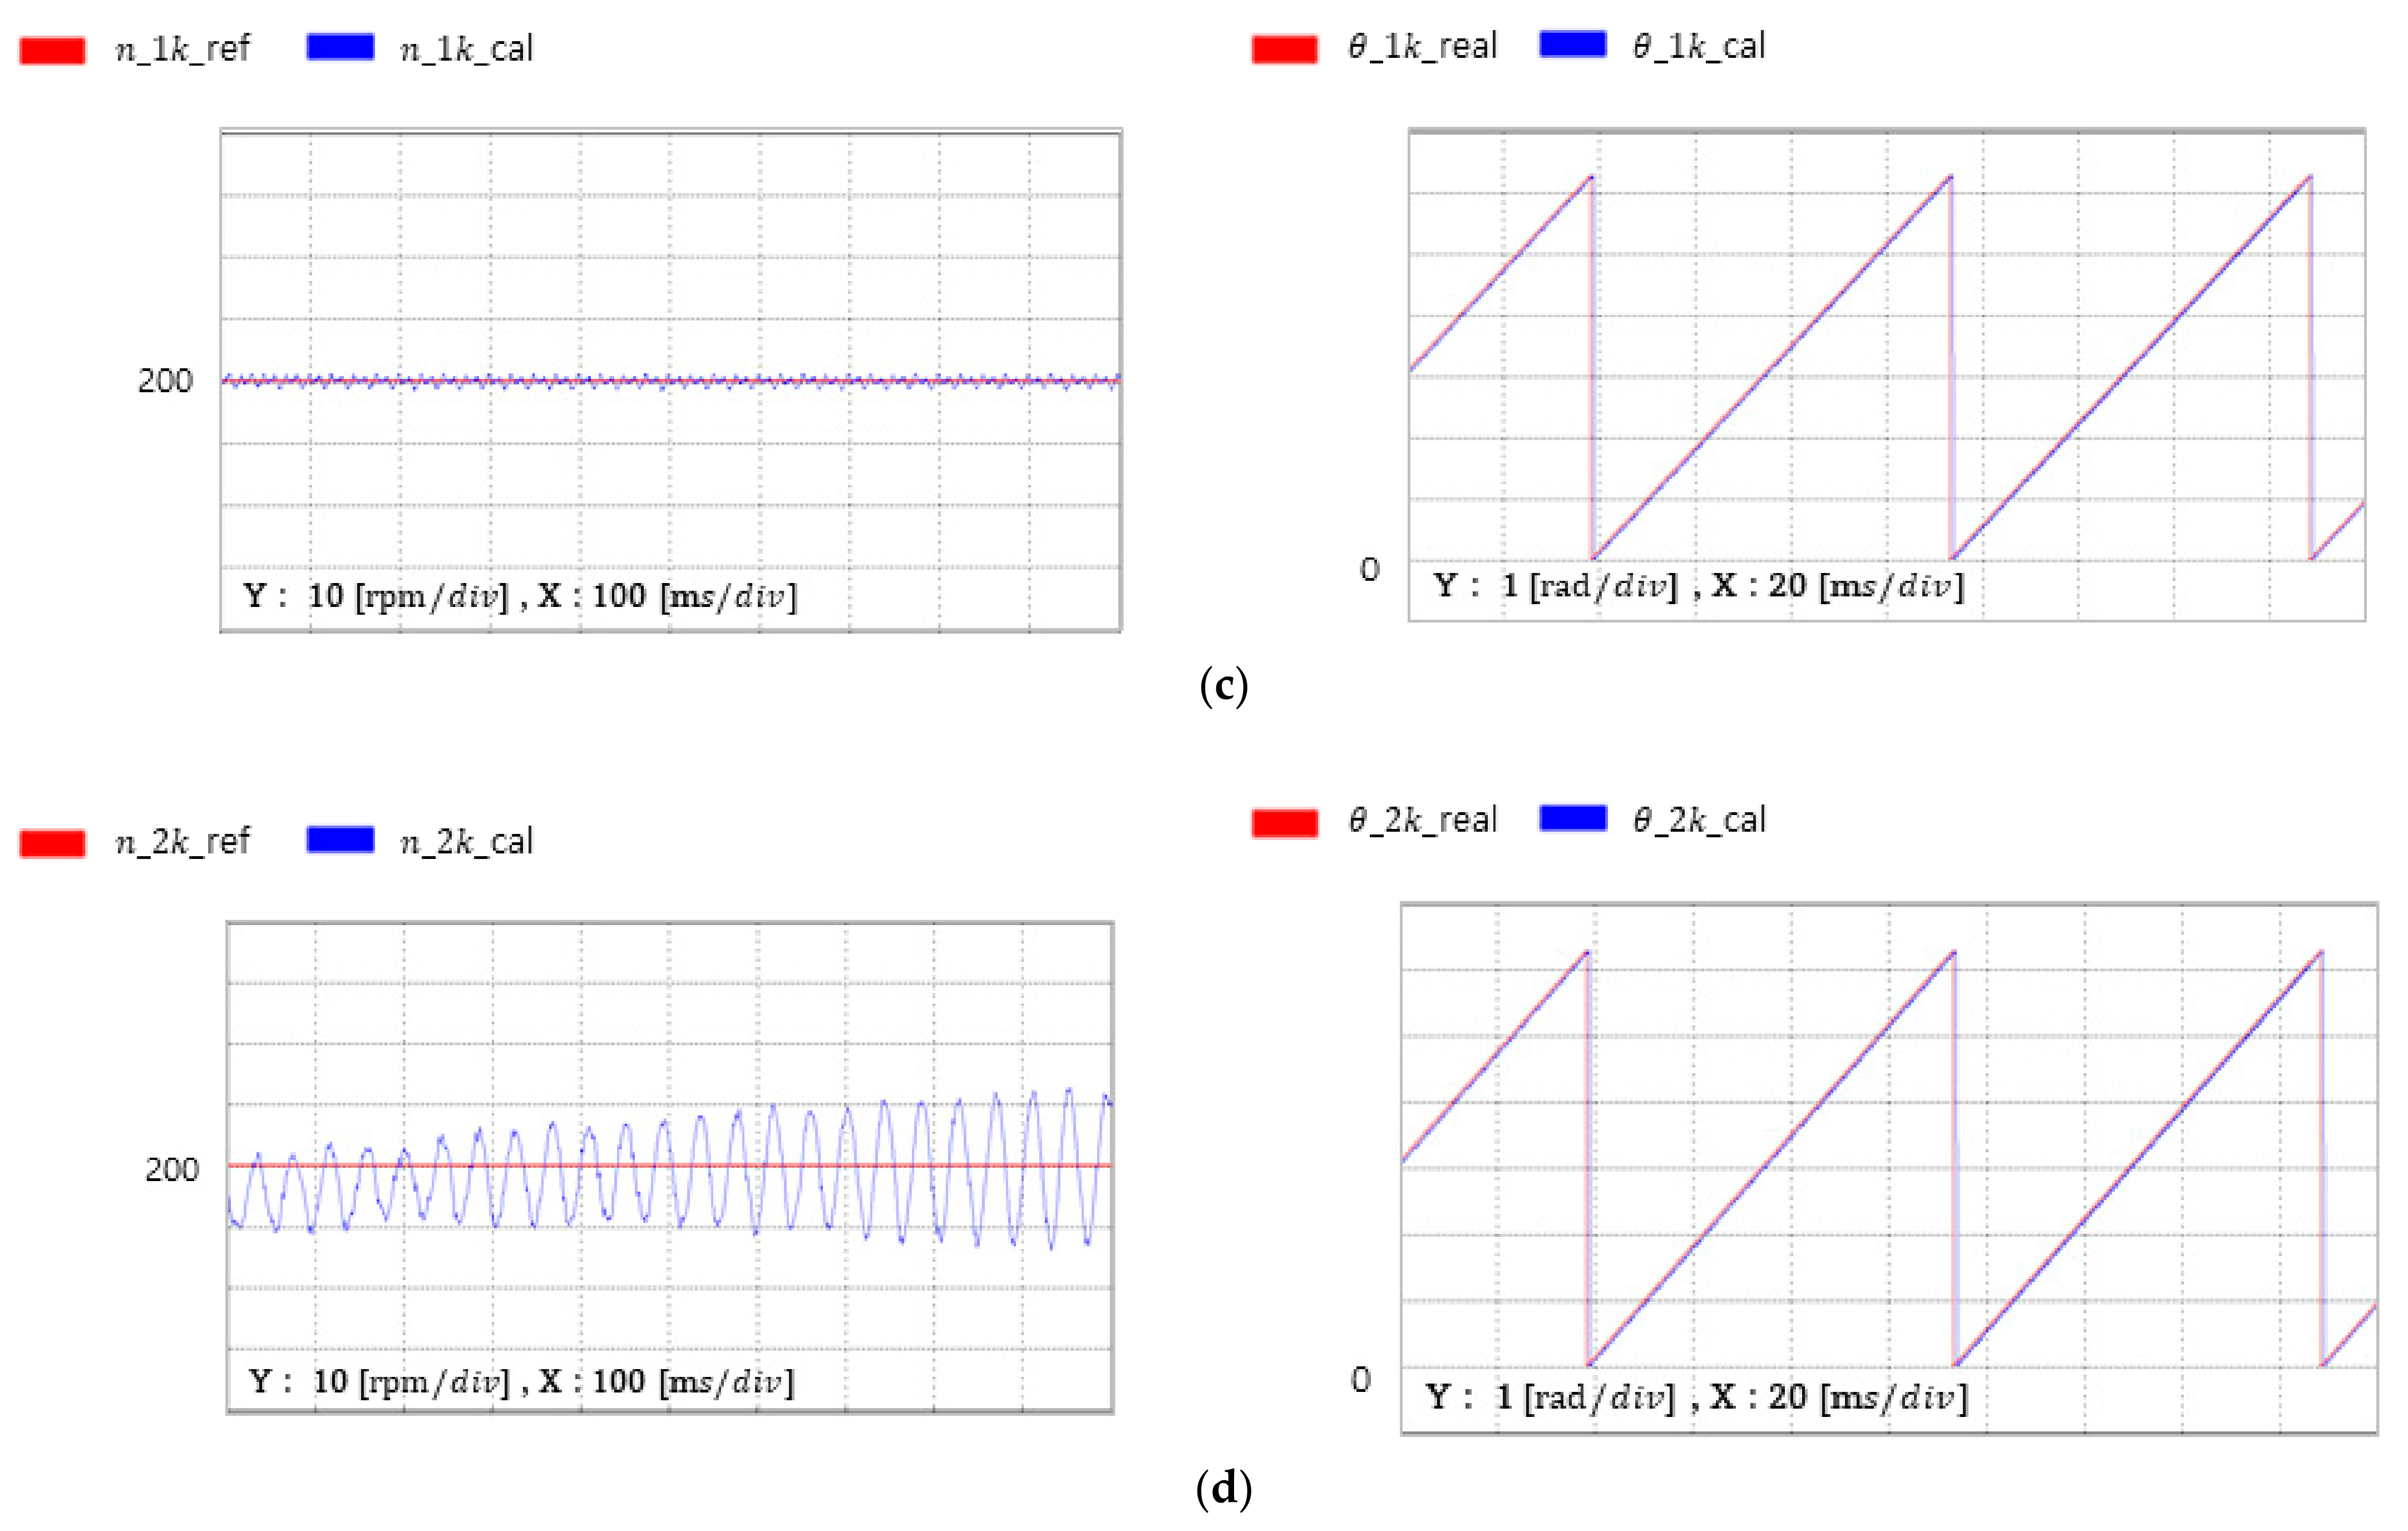
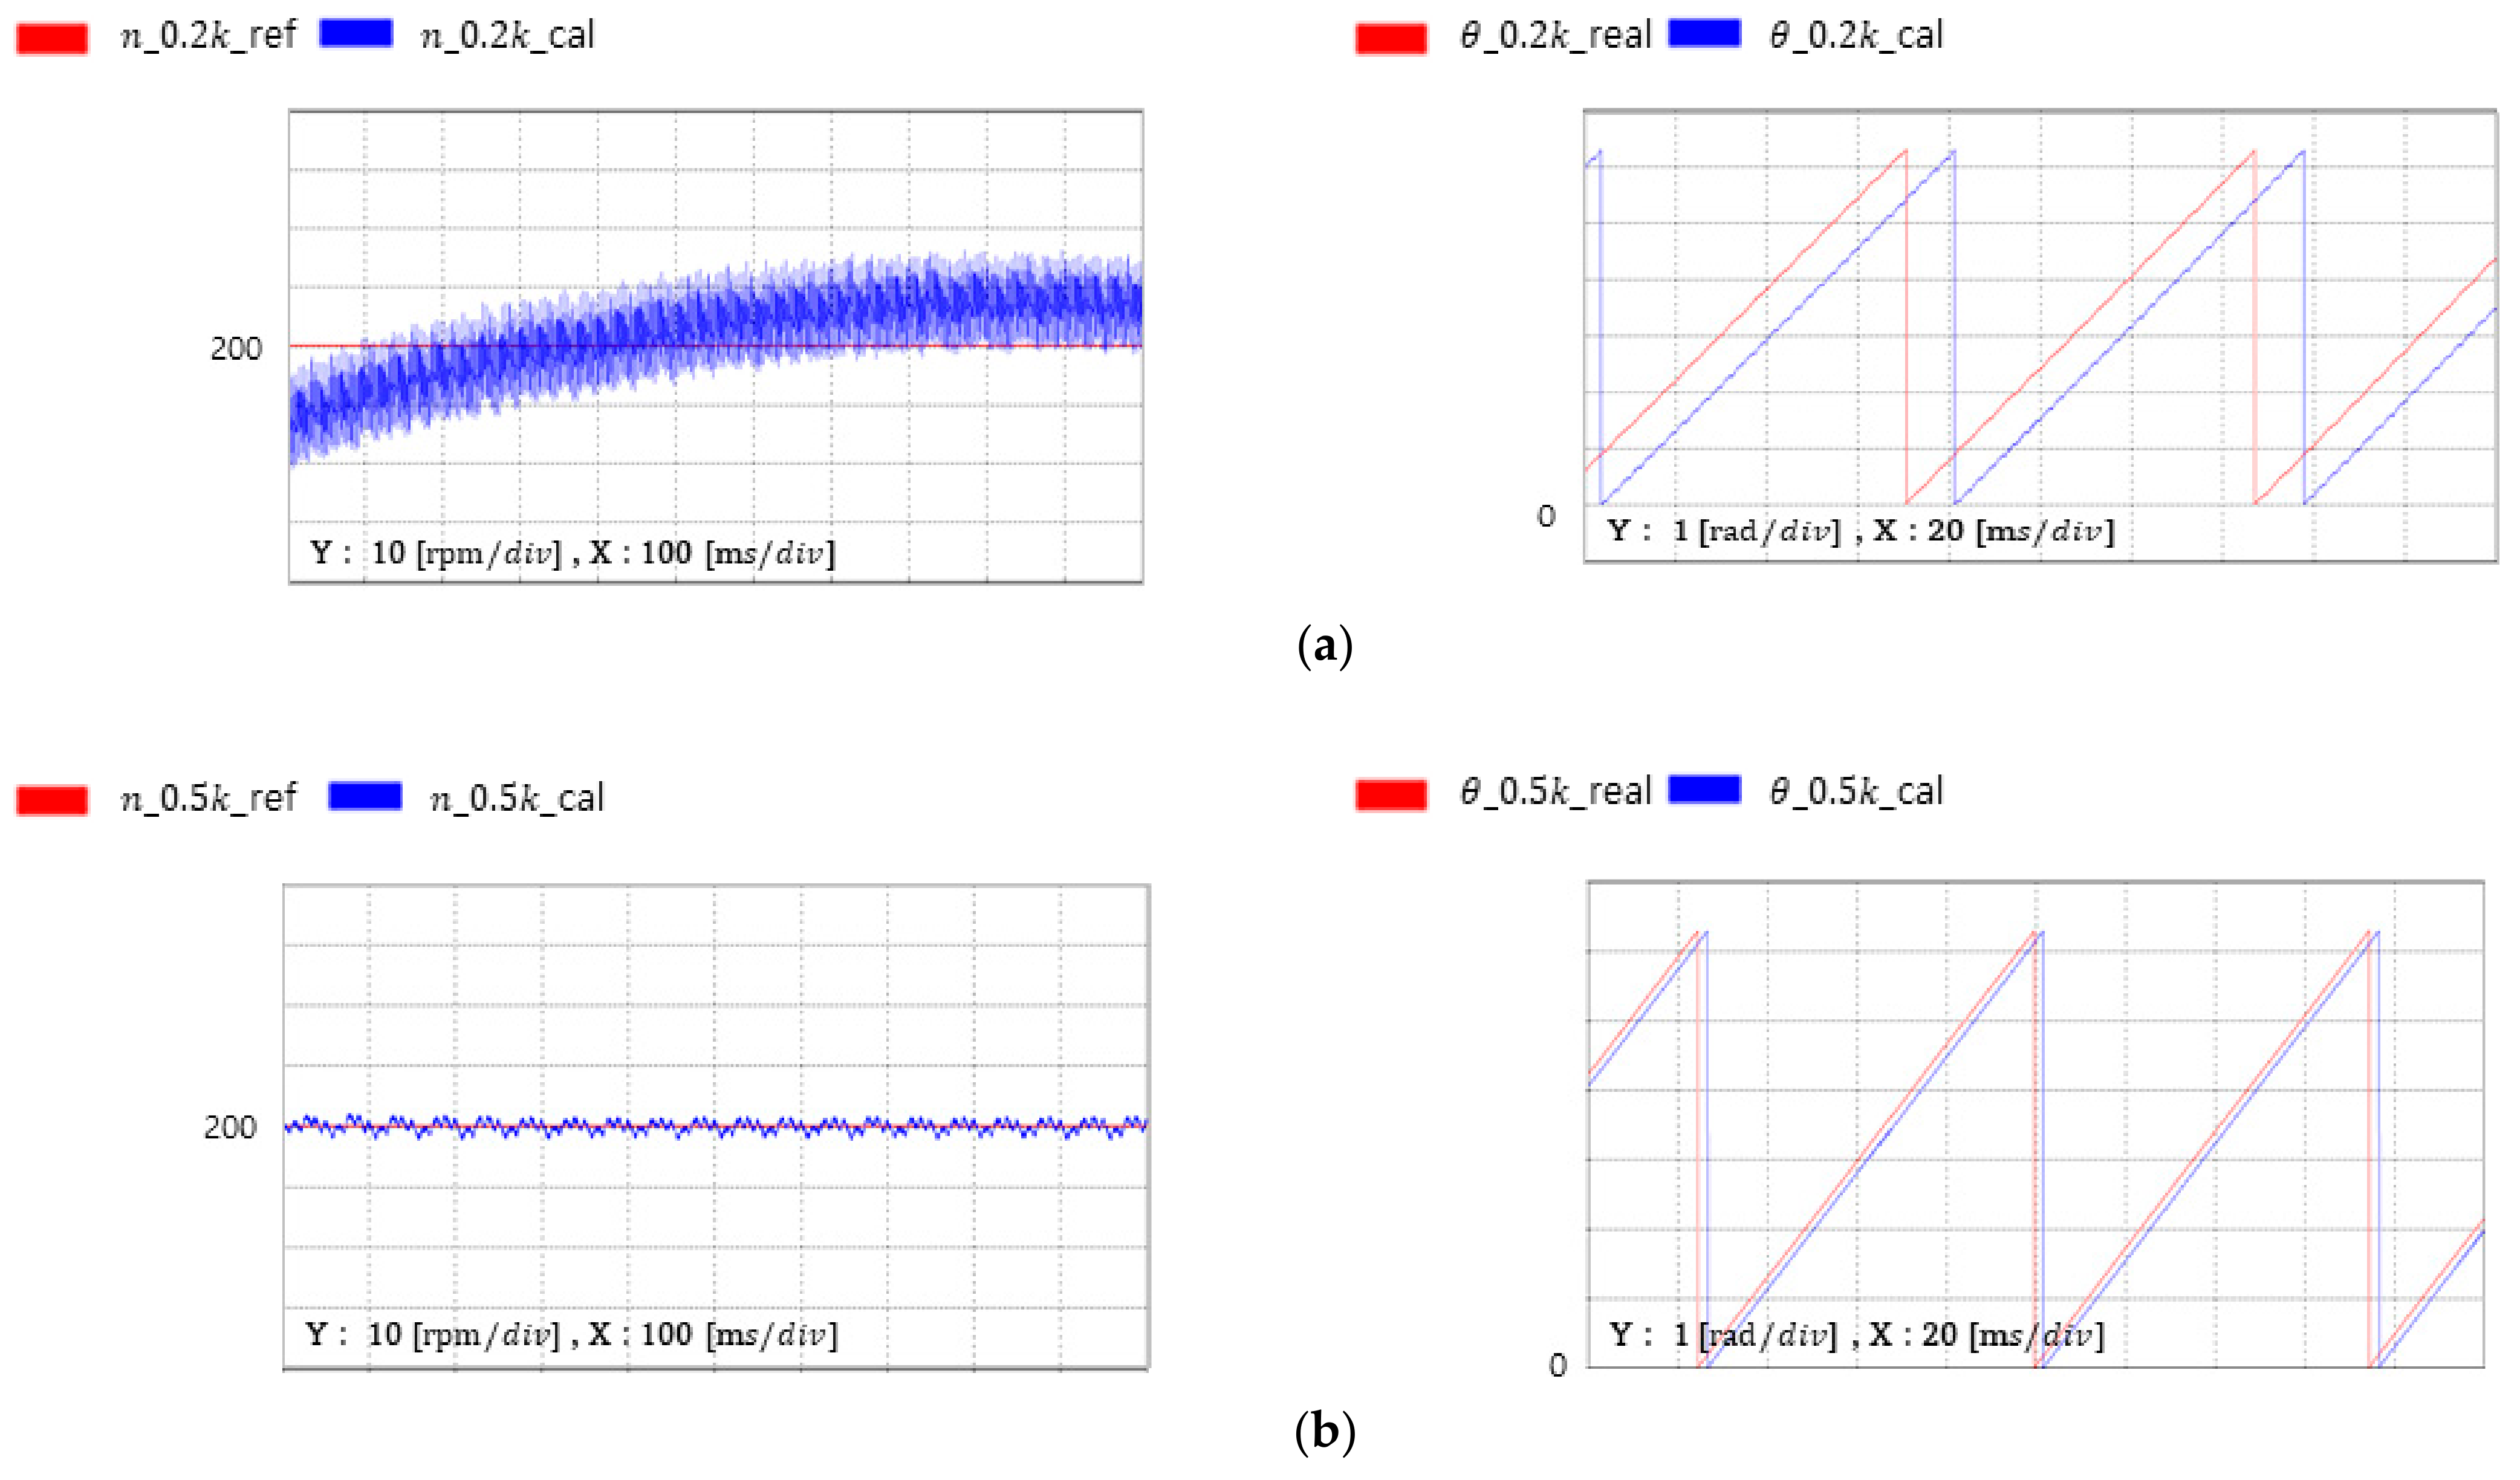
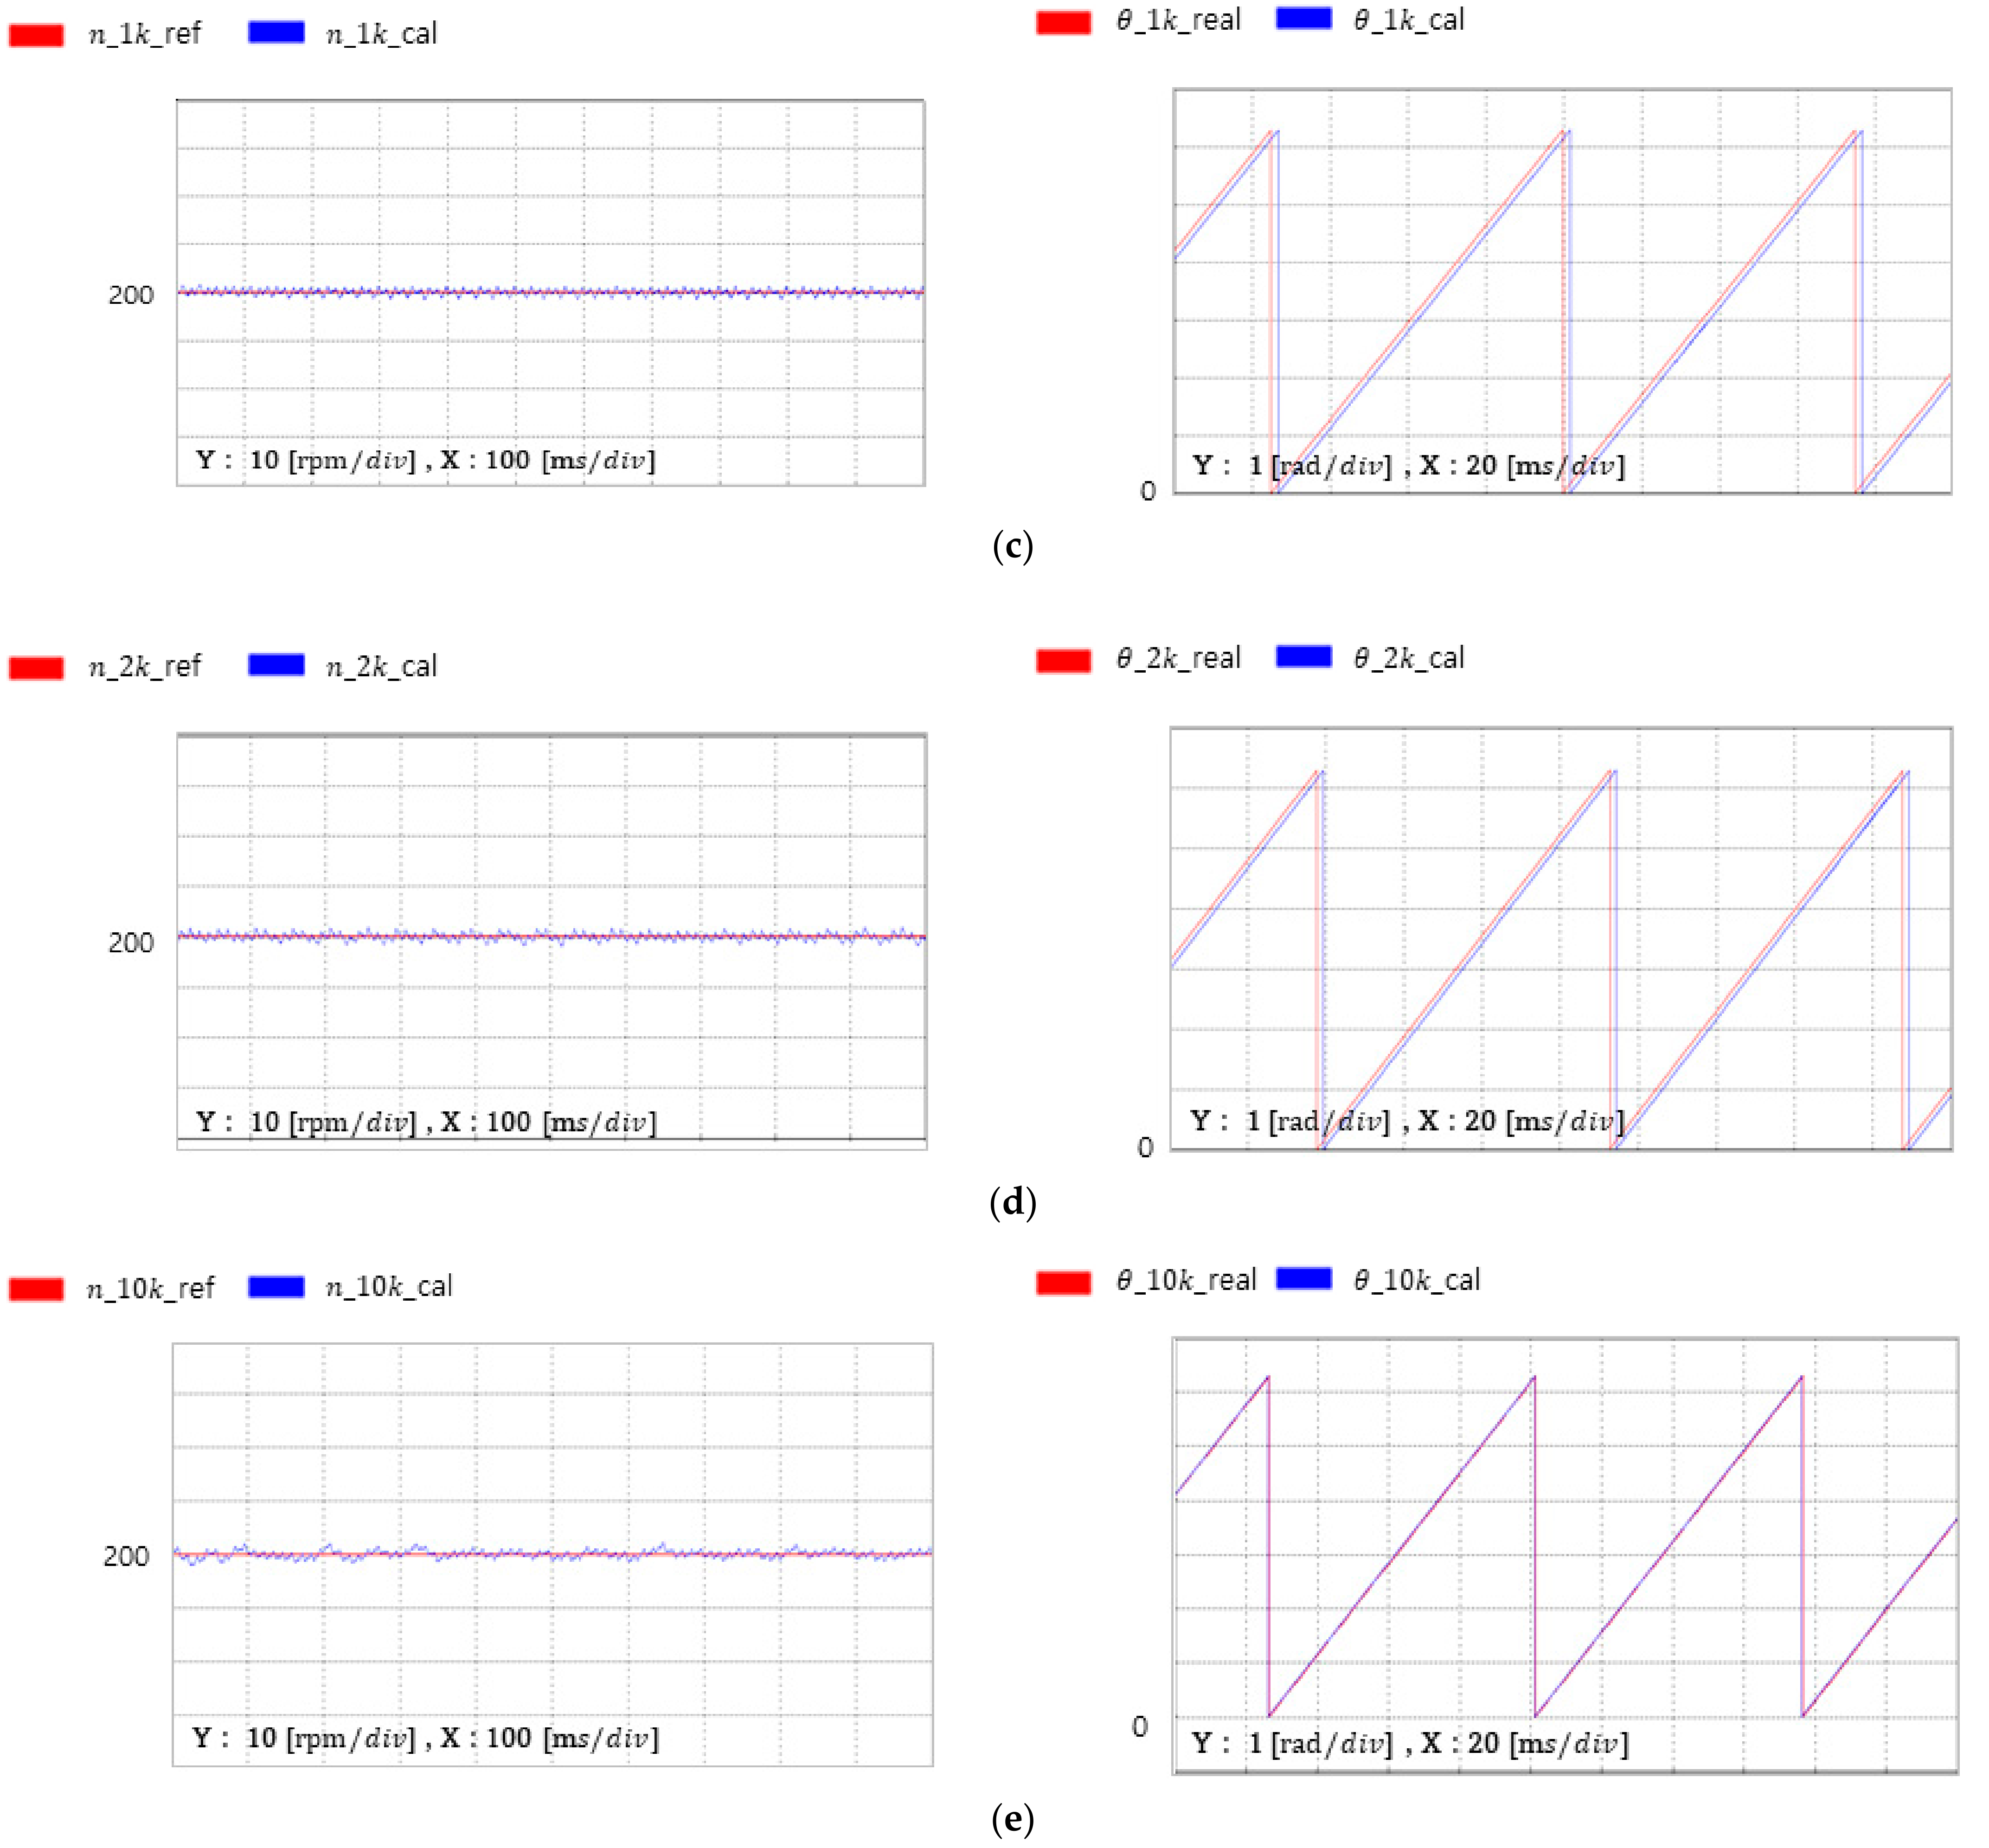
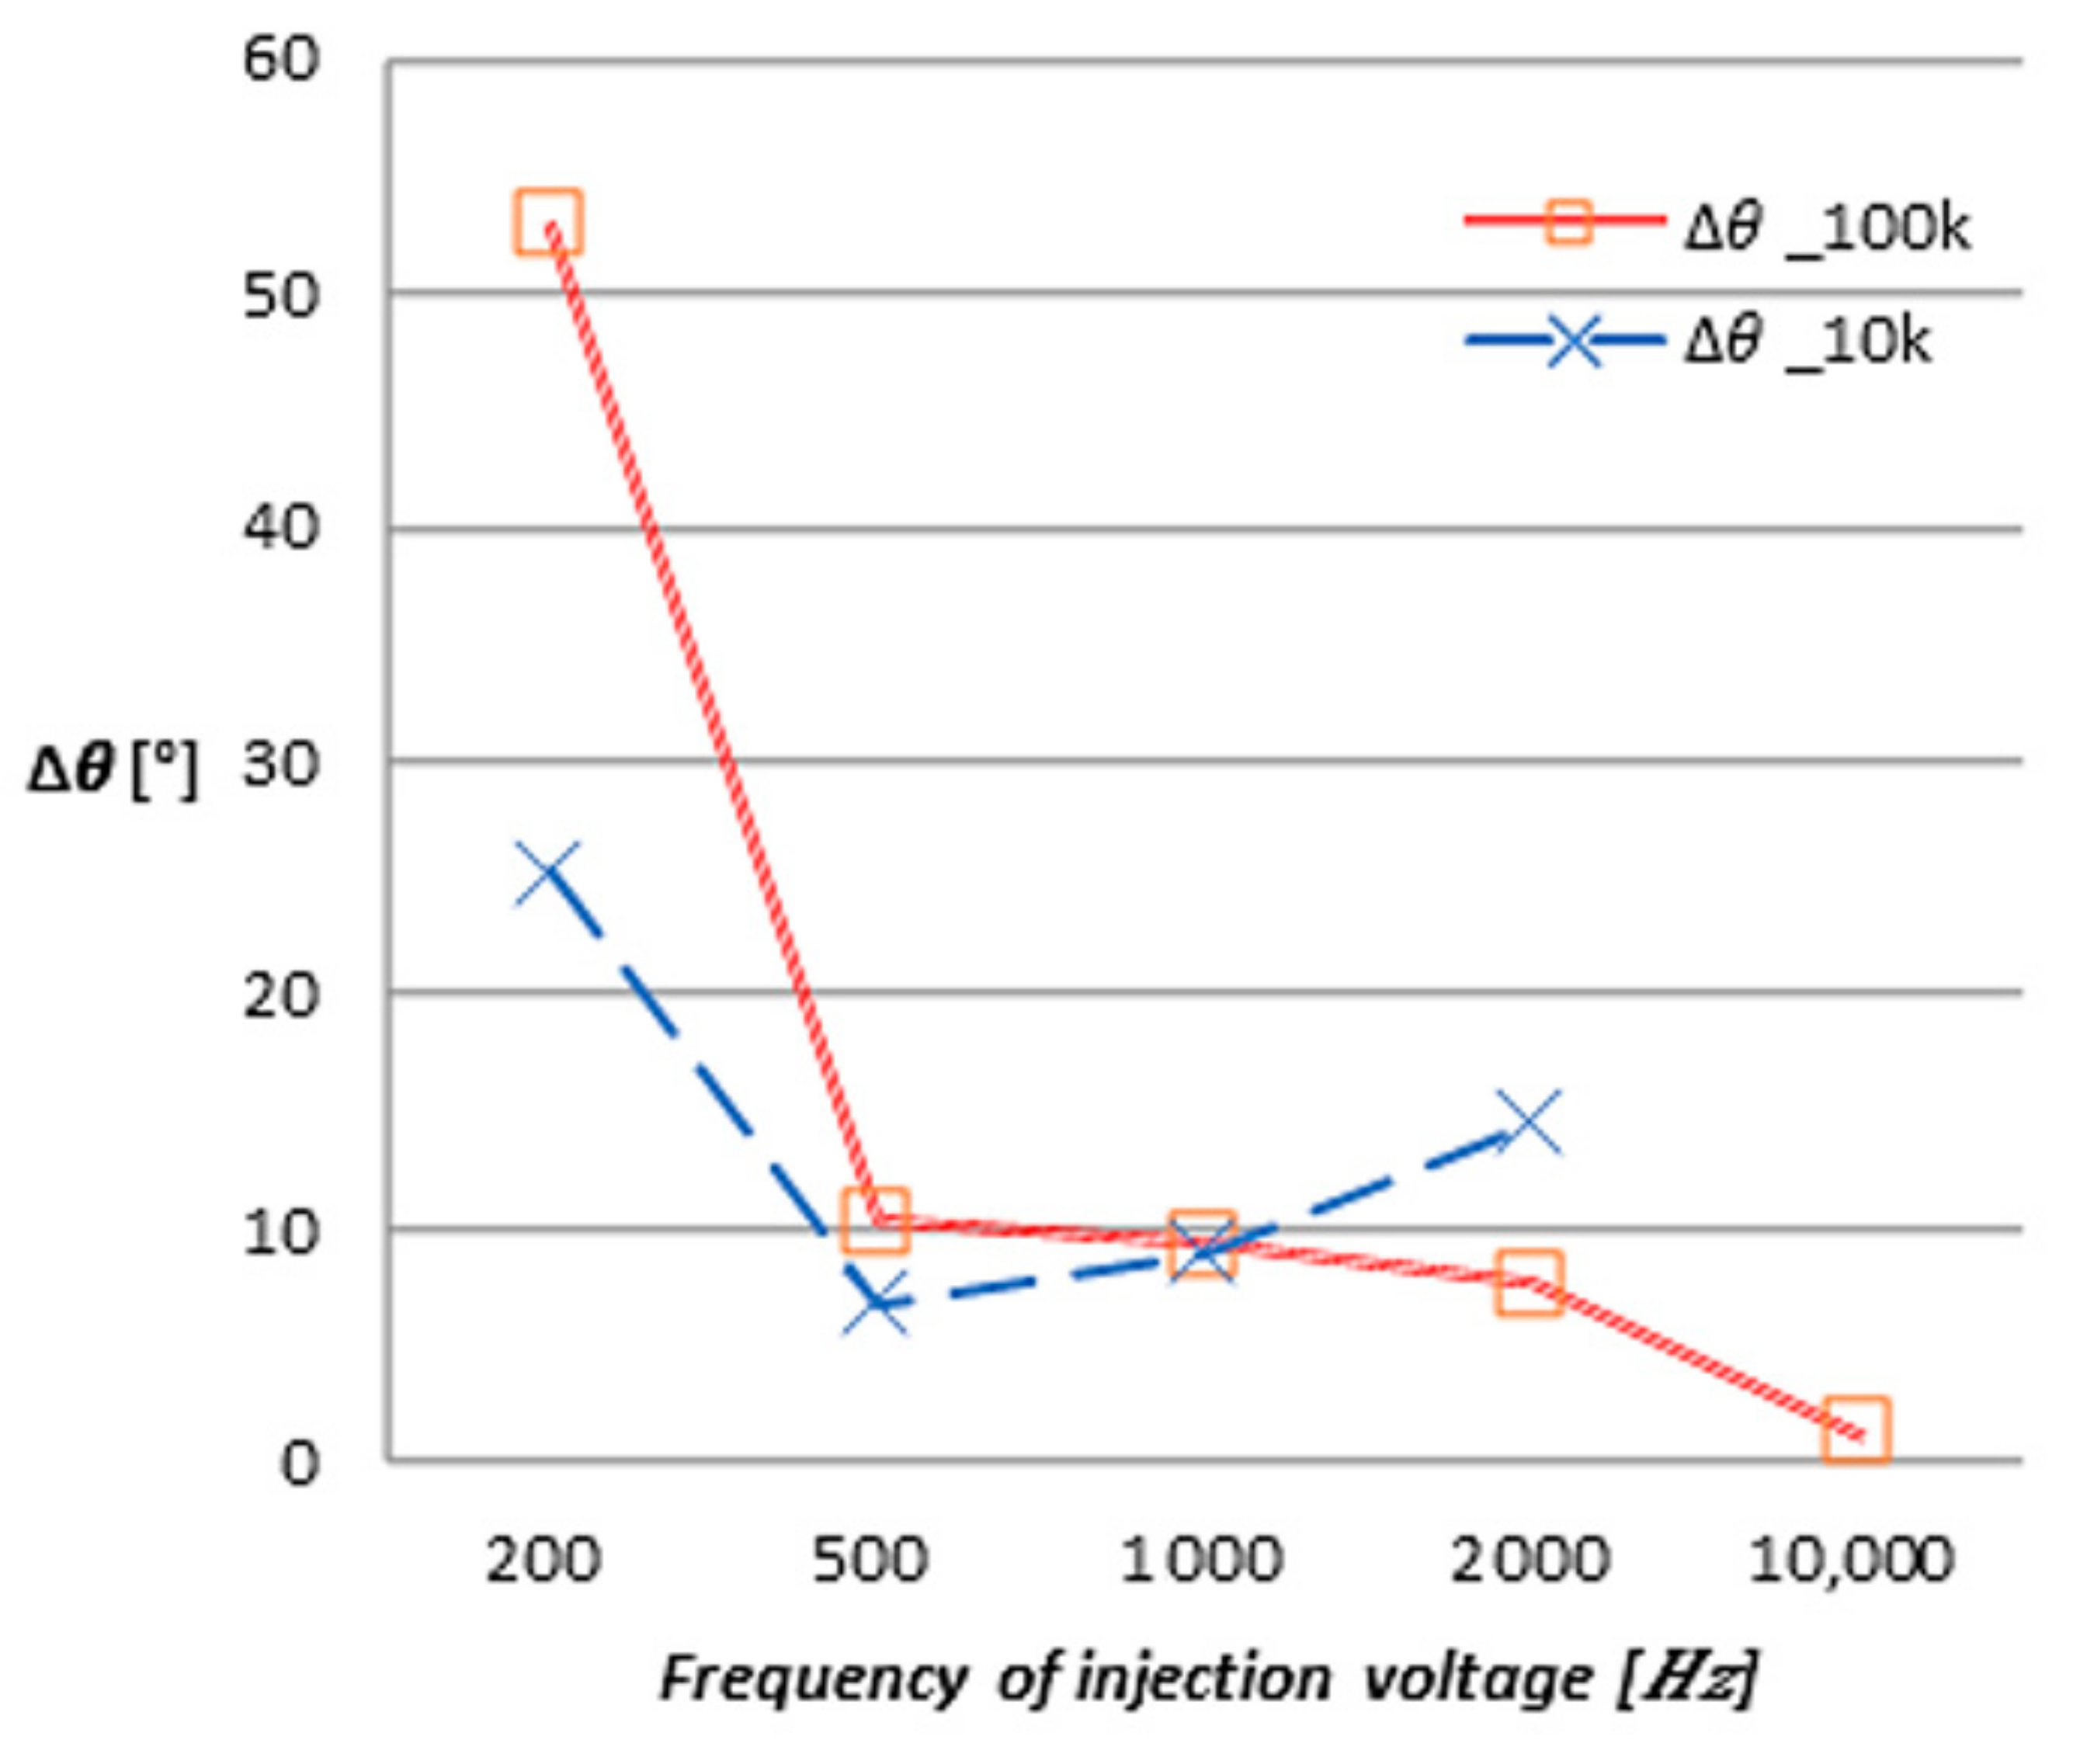
5. Experimental Results
6. Conclusions
Author Contributions
Funding
Institutional Review Board Statement
Informed Consent Statement
Data Availability Statement
Acknowledgments
Conflicts of Interest
References
- Zwerger, T. A Control Scheme for PMSMs using Model Predictive Control and a Feedforward Action in the Presence of Saturated Inputs. In Proceedings of the 2021 22nd International Carpathian Control Conference (ICCC), Velké Karlovice, Czech Republic, 31 May–1 June 2021; pp. 1–6. [Google Scholar]
- Zbede, Y.B.; Gadoue, S.M.; Atkinson, D.J. Model Predictive MRAS Estimator for Sensorless Induction Motor Drives. IEEE Trans. Ind. Electron. 2016, 63, 3511–3521. [Google Scholar] [CrossRef] [Green Version]
- Vollmer, M.U.; Kennel, R. Demodulation Approach for Slowly Sampled Sensorless Field-oriented Control Systems Enabling Multiple-frequency Injections. Ind. Appl. Soc. Ann. Meet. 2016, 54, 1–9. [Google Scholar]
- Sul, S.K.; Kwon, Y.C.; Lee, Y. Sensorless Control of IPMSM for Last 10 Years and Next 5 Years. CES Trans. Electron. Mach. Syst. 2017, 1, 91–99. [Google Scholar] [CrossRef]
- Lee, K.W.; Ha, J.I. Evaluation of Back-EMF Estimators for Sensorless Control of Permanent Magnet Synchronous Motors. J. Power Electron. 2012, 12, 604–614. [Google Scholar] [CrossRef]
- Xu, D.; Wang, B.; Zhang, G.; Wang, G.; Yu, Y. A review of Sensorless Control Methods for AC motor Drives. CES Trans. Electr. Mach. Syst. 2018, 2, 104–115. [Google Scholar] [CrossRef]
- Lee, K.W. High-speed Sensorless Control of a PMSM Operating under Periodic Magnetic Saturation Conditions. In Proceedings of the 2014 IEEE Energy Conversion Congress and Exposition (ECCE), Pittsburgh, PA, USA, 14–18 September 2014; Volume 15, pp. 4478–4483. [Google Scholar]
- Hong, C.H.; Lee, J.; Lee, D.M. Sensorless Scheme for Interior Permanent Magnet Synchronous Motors with a Wide Speed Control Range. J. Power Electron. 2016, 16, 2173–2181. [Google Scholar] [CrossRef] [Green Version]
- Filho, C.J.V.; Xiao, D.; Vieira, R.P.; Emadi, A. Observers for High-Speed Sensorless PMSM Drives: Design Methods, Tuning Challenges and Future Trends. IEEE Access 2021, 9, 56397–56415. [Google Scholar] [CrossRef]
- Makino, S.; Kakihara, M.; Takase, Y.; Takaki, M.; Shikayama, T.; Ohto, M.; Higuchi, T.; Abe, T. Development of a Stator-Magnetless Linear Synchronous Motor for Sensorless Control. IEEE Trans. Ind. Appl. 2017, 53, 4559–4568. [Google Scholar] [CrossRef] [Green Version]
- Bae, B.H.; Sul, S.K.; Kwon, J.H.; Byeon, J.S. Implementation of Sensorless Vector Control for Super-high-speed PMSM of Turbo-compressor. IEEE Trans. Ind. Appl. 2003, 39, 811–818. [Google Scholar] [CrossRef]
- Lee, W.; Han, D.; Sarlioglu, B. GaN-based Single phase Brushless DC Motor Drive for High-speed Applications. In Proceedings of the IECON 2014-40th Annual Conference of the IEEE Industrial Electronics Society, Dallas, TX, USA, 29 October–1 November 2014; Volume 61, pp. 1499–1505. [Google Scholar]
- Lee, W.; Kim, J.H.; Choi, W.; Sarlioglu, B. Torque Ripple Minimization via PWM Control Technique with GaN-based Motor Drive for High Speed Single phase Brushless DC motor. In Proceedings of the 2015 IEEE Energy Conversion Congress and Exposition (ECCE), Montreal, QC, Canada, 20–24 September 2015; pp. 4019–4025. [Google Scholar]
- Wang, Z.; Li, J.; Wang, H.; Cheng, H.A. GaN Drive for Ultra-High-Speed Permanent Magnet Synchronous Motor. In Proceedings of the 2020 23rd International Conference on Electrical Machines and Systems (ICEMS), Hamamatsu, Japan, 24–27 November 2020; pp. 1040–1045. [Google Scholar]
- Walden, J. High Frequency Injection Sensorless Control for a Permanent Magnet Synchronous Machine Driven by an FPGA Controlled SiC Inverter. Master’s Thesis, University of Tennessee Knoxville, Knoxville, TN, USA, 2021. [Google Scholar]
- Kim, J.; Jeong, I.; Nam, K.; Yang, J.; Hwang, T. Sensorless Control of PMSM in a High-speed Region Considering Iron Loss. IEEE Trans. Ind. Electron. 2015, 62, 6151–6159. [Google Scholar] [CrossRef]
- Yoon, Y.; Sul, S.; Morimoto, S.; Ide, K. High-Bandwidth Sensorless Algorithm for AC Machines Based on Square-Wave-Type Voltage Injection. IEEE Trans. Ind. Appl. 2011, 47, 1361–1370. [Google Scholar] [CrossRef]
- Han, B.; Shi, Y.; Song, X.; Hong, K.; Mao, K. Initial Rotor Position Detection Method of SPMSM Based on New High Frequency Voltage Injection Method. IEEE Trans. Power Electron. 2019, 34, 3553–3562. [Google Scholar] [CrossRef]
- Kim, S.; Ha, J.; Sul, S. PWM Switching Frequency Signal Injection Sensorless Method in IPMSM. IEEE Trans. Ind. Appl. 2012, 48, 1576–1587. [Google Scholar] [CrossRef]
- Kang, J. Sensorless Control of Permanent Magnet Motors. Control. Eng. 2010, 57, 1–4. [Google Scholar]
- Mishra, U.K.; Parikh, P.; Wu, Y.F. AlGaN/GaN HEMTs-an Overview of Device Operation and Applications. Proc. IEEE 2002, 90, 1022–1031. [Google Scholar] [CrossRef] [Green Version]
- Shah, F.M.; Xiao, H.M.; Awais, R.; Zhou, G. Comparative Performance Evaluation of Temperature Dependent Characteristics and Power Converter using GaN, SiC and Si Power Devices. In Proceedings of the 2018 IEEE 12th International Conference on Compatibility, Power Electronics and Power Engineering (CPE-POWERENG 2018), Doha, Qatar, 10–12 April 2018; pp. 1–7. [Google Scholar]
- Tsao, J.Y.; Chowdhury, S.; Hollis, M.A.; Jena, D.; Johnson, N.M.; Jones, K.A.; Kaplar, R.J.; Rajan, S.; Van de Walle, C.G.; Bellotti, E.; et al. Ultrawide-Bandgap Semiconductors: Research Opportunities and Challenges. Adv. Electron. Mater. 2018, 4, 1600501. [Google Scholar] [CrossRef] [Green Version]
- Yoon, J.W.; Lee, D.M. Simulation Model of Harmonics Injection Sensorless Technique for Permanent Magnet Synchronous Motor. J. KAIS 2020, 24, 67–71. [Google Scholar]
- Shin, D.C.; Lee, D.M. Development of Real-time Implementation of a Wind Power Generation System with Modular Multilevel Converters for Hardware in the Loop Simulation using Matlab/Simulink. Electronics 2020, 9, 606. [Google Scholar] [CrossRef] [Green Version]
- Fathy, H.K.; Filipi, Z.S.; Hagena, J.; Stein, J.L. Review of Hardware in the Loop Simulation and its Prospects in the Automotive Area. Proc. SPIE 2006, 6228, 1–20. [Google Scholar]
- Cho, J.; Choi, D.; Yoo, S.; Lee, W.; Stein, J.L. PC-based Real-time Driving Simulation. In Proceedings of the Korea Society for Simulation Conference, Daejeon, Korea, 11 November 2000; pp. 192–197. [Google Scholar]
- Lyons, R. Another Contender in the Arc Tangent Race. IEEE Signal. Proc. Mag. 2004, 21, 109–110. [Google Scholar] [CrossRef]
- Ukil, A.; Shah, V.H.; Deck, B. Fast Computation of Arctangent Functions for Embedded Applications: A Comparative Analysis. In Proceedings of the 2011 IEEE International Symposium on Industrial Electronics, Gdansk, Poland, 27–30 June 2011; pp. 1206–1211. [Google Scholar]
- Intel. ALTERA_CORDIC IP Core User Guide. Available online: www.intel.com/content/www/us/en/products/programmable.html (accessed on 8 May 2017).


| Quantity | Si | GaN |
|---|---|---|
| Band-gap | ||
| Dielectric breakdown field | ||
| Electron mobility | 2.5 | 10 |
| Thermal conductivity | 1.5 | 1.3 |
| Quantity | Comment | Value |
|---|---|---|
| Stator resistance | ||
| d-axis inductance | ||
| q-axis inductance | ||
| p | Number of poles | |
| P | Rated power | 1.5 |
| Switching frequency | 10, 100 | |
| Frequency of injection voltage | 0.2~1 | |
| Magnitude of injection voltage |
| Number | Name |
|---|---|
| ① | OP4510 (Real-time OS) |
| ② | DE1-SoC (Control board) |
| ③ | Signal voltage level change board |
| ④ | 3.3 volt regulator |
| ⑤ | 220 volt to 5 volt converter |
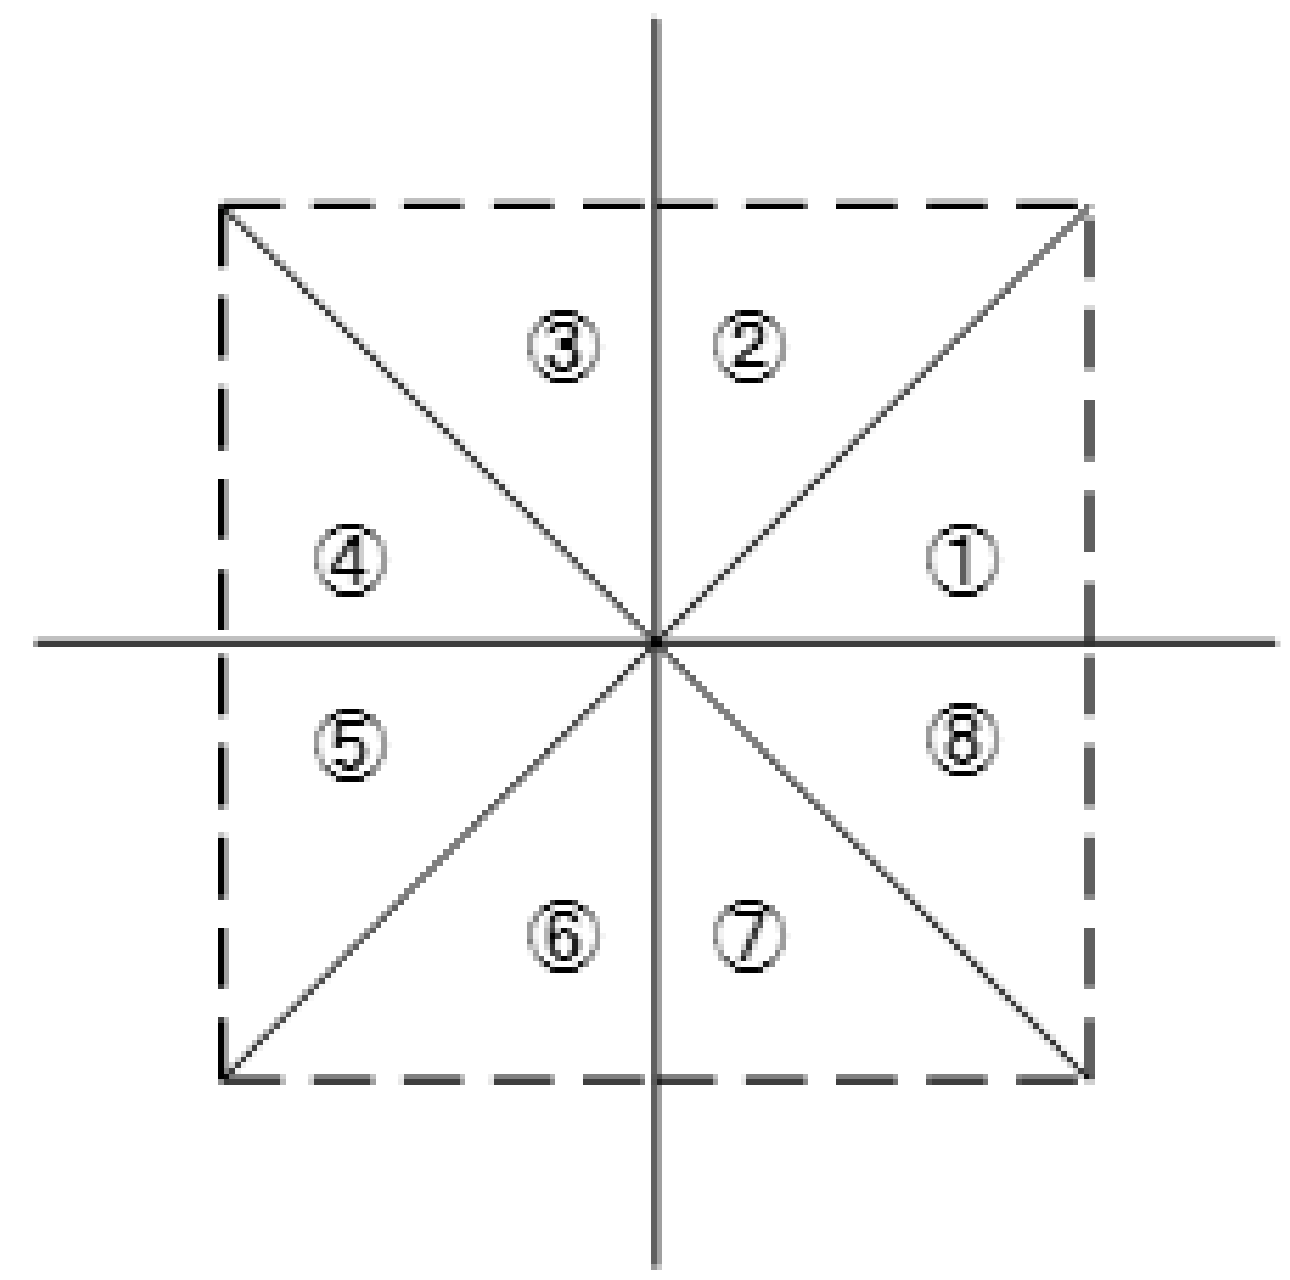
| Condition | Sector | θ′ | θ |
|---|---|---|---|
| ① | θ′ | ||
| ② | 90 − θ′ | ||
| ③ | 90 + θ′ | ||
| ④ | 180 − θ′ | ||
| ⑤ | 180 + θ′ | ||
| ⑥ | 270 − θ′ | ||
| ⑦ | 270 + θ′ | ||
| ⑧ | 360 − θ′ |
Publisher’s Note: MDPI stays neutral with regard to jurisdictional claims in published maps and institutional affiliations. |
© 2021 by the authors. Licensee MDPI, Basel, Switzerland. This article is an open access article distributed under the terms and conditions of the Creative Commons Attribution (CC BY) license (https://creativecommons.org/licenses/by/4.0/).
Share and Cite
Moon, K.-R.; Lee, D.-M. Analysis of Rotor Position Detection Performance According to the Frequency of Square Waveform Voltage in the Harmonic Injection Sensorless Method through HILS. Processes 2021, 9, 2267. https://0-doi-org.brum.beds.ac.uk/10.3390/pr9122267
Moon K-R, Lee D-M. Analysis of Rotor Position Detection Performance According to the Frequency of Square Waveform Voltage in the Harmonic Injection Sensorless Method through HILS. Processes. 2021; 9(12):2267. https://0-doi-org.brum.beds.ac.uk/10.3390/pr9122267
Chicago/Turabian StyleMoon, Kyeong-Rok, and Dong-Myung Lee. 2021. "Analysis of Rotor Position Detection Performance According to the Frequency of Square Waveform Voltage in the Harmonic Injection Sensorless Method through HILS" Processes 9, no. 12: 2267. https://0-doi-org.brum.beds.ac.uk/10.3390/pr9122267