Article

Continuous Crystallization Using Ultrasound Assisted Nucleation, Cubic Cooling Profiles and Oscillatory Flow

1
Research Unit CIPT, Department of Chemical Engineering, Diepenbeek Campus, Katholieke Universiteit Leuven, Agoralaan Gebouw B, 3590 Diepenbeek, Belgium
2
Research Unit ProCESS, Department of Chemical Engineering, Katholieke Universiteit Leuven, Celestijnenlaan 200F Box 2424, 3001 Leuven, Belgium
*
Authors to whom correspondence should be addressed.
Submission received: 25 November 2021 / Revised: 14 December 2021 / Accepted: 15 December 2021 / Published: 17 December 2021
(This article belongs to the Special Issue Continuous Crystallization Processes and Product Design)

Abstract

:
Continuous tubular crystallizers have the potential to reduce manufacturing costs and increase product quality. However, designing tubular crystallizers is a complex and challenging task as crystallization is a complex, multiphase process with a propensity for fouling and clogging. While several designs have been proposed to overcome these issues, these designs are either unproven or poorly scalable and complex. In this work a continuous crystallizer is designed and evaluated to mitigate these issues. The tubular crystallizer combines a novel method to obtain a cubic cooling profile to control the supersaturation, ultrasound to induce nucleation and oscillatory flow to improve mixing and minimize fouling and sedimentation. The results show that the crystallizer was able to operate for more than 4 h without clogging, with high yields and a narrow particle size distribution. The design proposed here is therefore considered a viable approach for continuous crystallizers.

1. Introduction

Crystallization is an important unit operation in the pharmaceutical industry that determines downstream processes and the bioavailability of the pharmaceutical ingredient in the human body. Historically, pharmaceutical processes, including crystallization, have been performed in batch, but a transition towards continuous processing has been started to minimize capital and operating costs and increase product quality. Tubular crystallizers are continuous crystallizers that are of interest because of their narrow residence time distributions, small working volumes and excellent heat transfer, allowing conditions that favor small particle sizes and narrow particle size distributions [1,2]. Additionally, tubular crystallizers have shown to allow control over the particle size [3,4,5] and they accommodate a large range of obtainable crystal sizes [6].
However, there are still shortcomings, with fouling and clogging as the Achilles’ heel of continuous crystallization, especially for tubular crystallizers. Even though a lot of research has been performed on tubular crystallizers, most research does not mention how long the crystallizer can run without fouling or clogging [1]. Many solutions have been proposed to solve fouling, however these often lack experimental validation [7]. One solution showing promising results are tubular crystallizers that are sonicated from front to end as shown by Furuta et al., Ezeanowi et al. and Kreimer et al. [8,9,10]. Furuta et al. and Ezeanowi et al. both reported no blockages in their sonicated tubular crystallizer, however, they did not report how long their crystallizers could operate. The sonicated tubular crystallizer made by Kreimer et al. could work for 2 h with ultrasound compared to 30 min without ultrasound, furthermore, by optimizing the conditions they managed to increase the operating time to 5 h. Another promising solution is a slug flow with two liquid phases as shown by Rossi et al. and Nagasawa and Mae as it prevents contact between the wall and the crystals, however, experiments proving this are still lacking [11,12,13]. Additionally, liquid-gas slug flows have also shown promising results [14], however, it is still unclear under which conditions these crystallizers can omit fouling and for how long as crystals still come in contact with the wall. Unfortunately, all these solutions introduce new problems in the form of complexity and scalability.
The yield is another important design criterion of crystallizers, however, similar to the operating time, yields are sparsely reported for tubular crystallizers [1]. While tubular crystallizers theoretically have an advantage over mixed suspension mixer product removal (MSMPR) crystallizers, as by definition MSMPR crystallizers have remaining supersaturation in their outlet, the residence time is generally shorter in a tubular crystallizer making high yields questionable.
Continuous crystallizers often exist out of two stages, a nucleation stage and growth stage. In the nucleation stage the number of nuclei is determined, which will determine the final particle size and surface area for growth and in the growth stage the supersaturation is depleted to maximize the yield. The nucleation rate of pharmaceutical components is usually low and requires high supersaturations, which usually lead to fouling and clogging. Therefore, the nucleation is often aided by an external energy source to increase the nucleation rate [15]. Ultrasound is the most used and studied method of enhancing the nucleation rate [16]. Earlier work by our group already established which parameters control the nucleation rate with ultrasound [17]. Eder et al. and Jiang et al. already showed that the particle size in tubular crystallizers can be controlled by employing ultrasound in the nucleation stage [4,5].
Growth is ideally performed under constant supersaturation, which makes the cooling profile in a cooling crystallization important. Ideally the cooling rate is low at the beginning of the growth and gradually increases as more surface area becomes available on which supersaturation can be depleted. Additionally, the solubility dependence of most components is quasi-exponential and thus more supersaturation is generated for a 1 °C decrease in temperature at high temperatures than for a 1 °C decrease at low temperatures, which is at the beginning and end of the growth respectively [18]. Mullin proposed a cubic cooling profile in which the temperature follows the trajectory described by equation 1 in order to mimic the surface area gain during a crystallization [19].
T ( t ) = T I ( T I T E ) ( t τ ) 3 ,
With T(t) the temperature profile, TI the initial temperature, TE the final temperature, t the time and τ the residence time. Figure 1 shows the cubic cooling profile along other common cooling profiles. Most crystallizers employ a natural cooling profile by placing the tubular crystallizer in a cooling bath as it is convenient. However, this results in one of the worst possible cooling profiles for a crystallizer as it is practically the opposite of a cubic cooling profile. Additionally, the profile is heavily dependent on the heat transfer rate, therefore there is little control over the profile. Some researchers try to employ a cubic cooling profile using several temperature baths in series with a cubic offset in temperature between these baths [20]. However, the temperature of the suspension cooled in these baths still follows a natural trajectory, thus the temperature decreases quickly when entering the temperature bath which results in supersaturation peaks [21,22]. This leads to fouling, agglomeration and secondary nucleation. Additionally, the other zones of the crystallizer will be used less effectively. Therefore, in order to optimally use the volume of a crystallizer, which is already small for tubular crystallizers, a cubic cooling profile is important and has potential to improve yields and operating times. However, as of thus far, a cubic cooling profile has not been achieved in a tubular crystallizer to our knowledge and it is far from easy to obtain.
Another method that could improve yields, prolong operating times and reduce agglomeration is oscillatory flow or pulsation, which is a back- and forward motion of the flow. This is already used in oscillatory baffled crystallizers (OBCs) which are very similar to tubular crystallizers, with the main differences being the oscillatory flow, the baffles and the usually larger diameters of OBCs. However, oscillatory flow can also be used in the absence of baffles [23]. Similar to the effect of baffles, the coiled shape of a tube can also generate dean vortices which create eddies and mixing [23]. These reactors are sometimes referred to as oscillatory baffleless coil crystallizers. Oscillatory flow has the potential to improve mixing, and thus mass and heat transfer, break agglomerates, prevent sedimentation and remove fouling. It is, therefore, a potent technique. Doyle et al. already used oscillatory flow during a precipitation reaction in a coiled flow reactor and showed how it prevented clogging for at least 5 h while clogging would occur after 55 min without oscillatory flow [23].
In this research, a continuous tubular crystallizer is developed that applies ultrasound assisted nucleation, a cubic cooling profile and oscillatory flow. The cubic cooling profile is obtained in novel way by the use of a countercurrent heat exchanger with a heating jacket. The goal is to minimize fouling and clogging and achieve an operating time of at least 4 h. Additionally, the particle size distribution should be narrow with an aimed particle size below 100 µm and a yield of at least 90%. The above-mentioned parameters were assessed under different conditions by using a 23 design of experiments (DOE) to evaluate flow rates (residence times), nucleation supersaturations (temperatures) and sonicated fractions of the solution.

2. Materials and Methods

2.1. Materials

Adipic acid (Alfa Aesar, 99%) was used as a model compound for the crystallization experiments and was dissolved in water. A total of 50 g adipic acid was added per liter of water. Adipic acid has a solubility of 20.0 g/L at 22 °C according to interpolated data from Gaivoronskii [24]. Saturated dilution solutions were also made which contained 25 g adipic acid per liter water and were filtered before use.

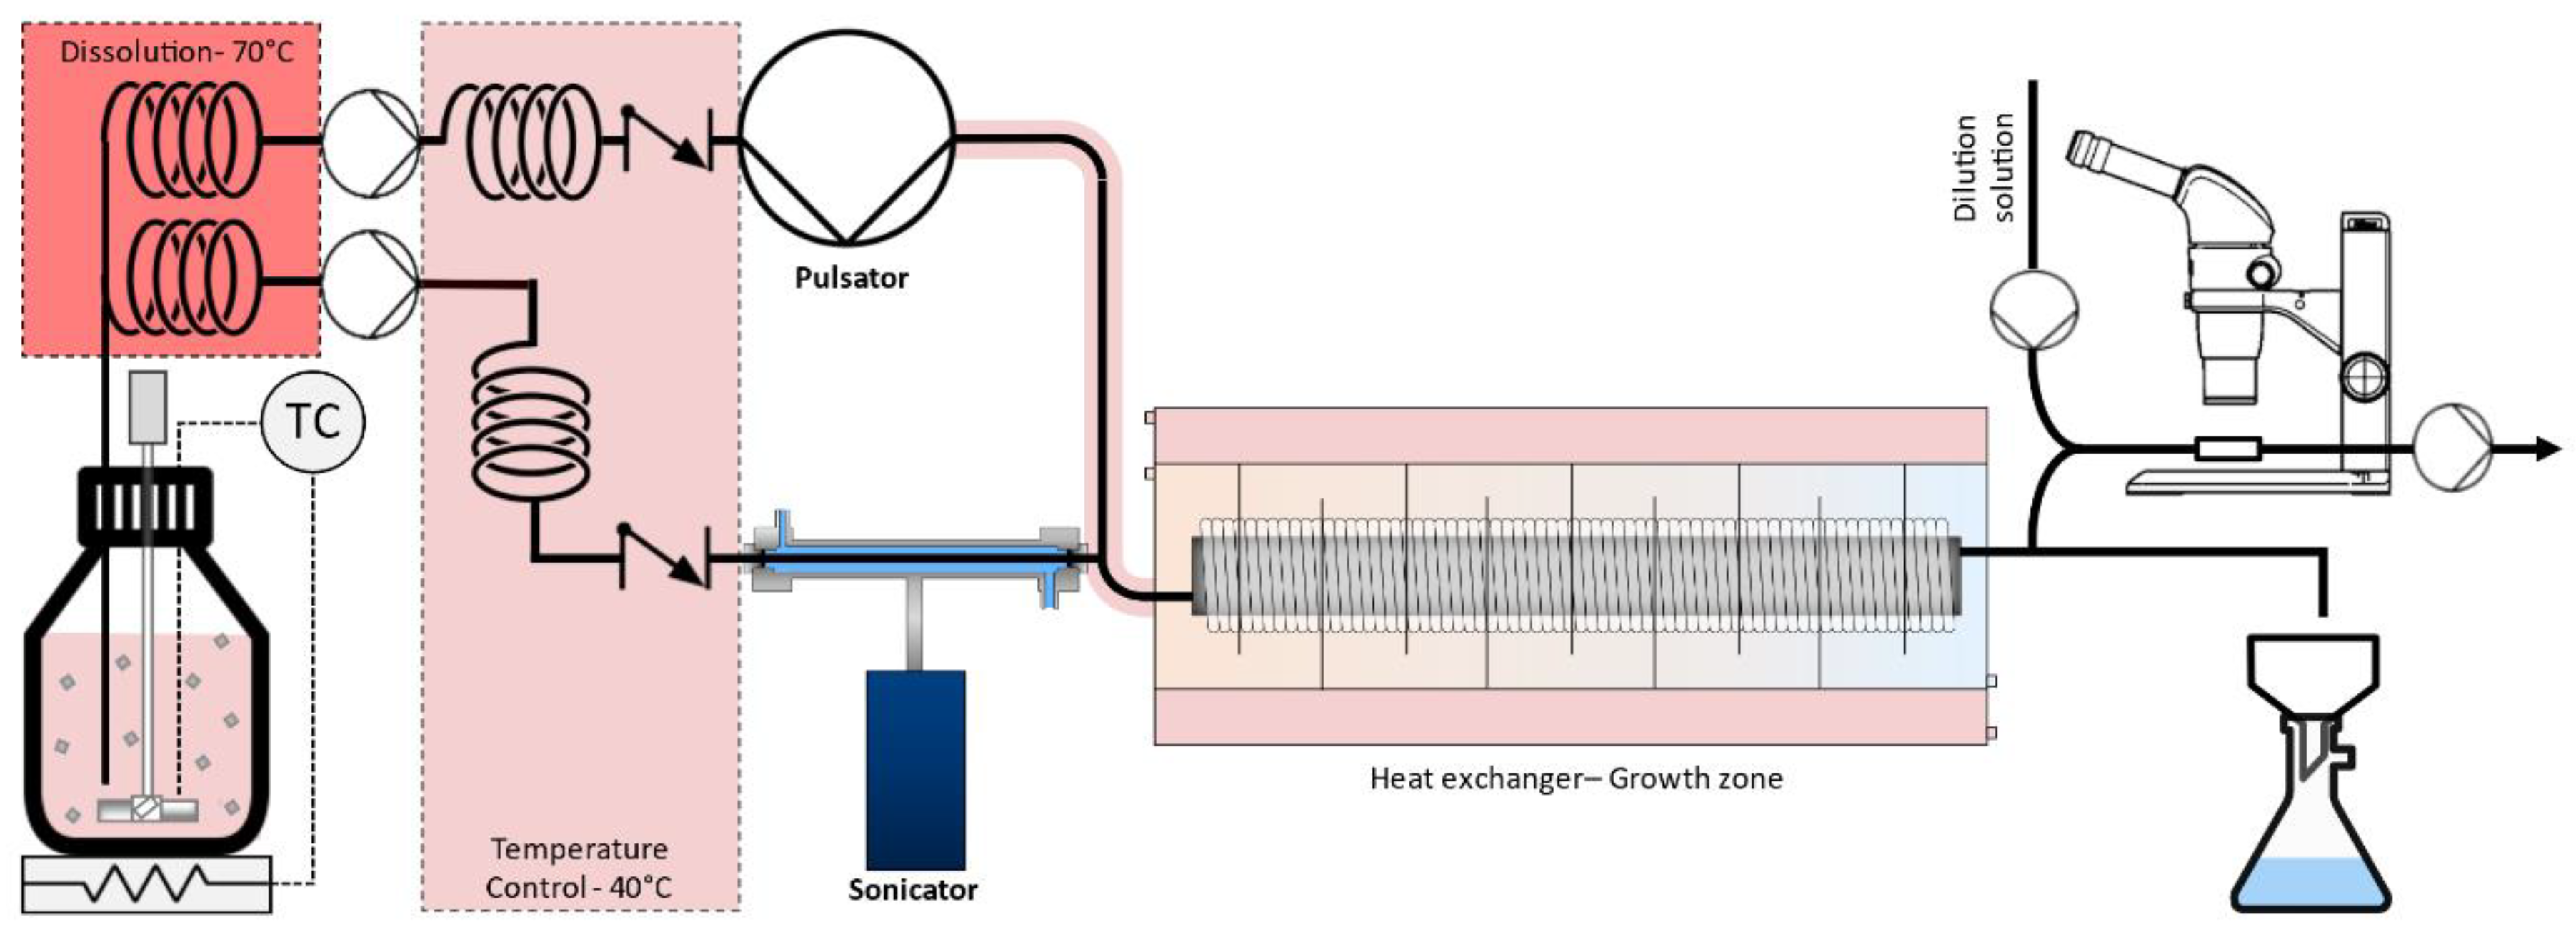
2.2. Experimental Setup

Figure 2 illustrates the experimental setup that was used in the experiments, a picture of the setup can be found in the supplementary information, Figure S1. The adipic acid suspension was stirred with a pitched 4 blade impeller in a 3 L Erlenmeyer flask. The flask was heated to 40 °C using a heating element to dissolve most of the adipic acid crystals, which simplified mixing in the feed vessel as the crystals had a tendency to float causing an inhomogeneous feed. The remaining crystals were dissolved continuously and inline at 70 °C in two 5 m PFA coils with an internal diameter (ID) of 4 mm and an outer diameter (OD) of 6 mm. Two peristaltic pumps (Medorex, Model TU, Nörten-Hardenberg, Germany), installed after the dissolution bath, pump the solution to the pulsator and the sonicator. Before reaching the sonicator or pulsator the solutions flow through 5 m long PFA coils, with an OD of 3.2 mm and an ID of 1.6 mm, which are immersed in a temperature control bath that cools the solutions to a saturation temperature of 40 °C. The small diameter was chosen to dampen the pulses of the pulsator in the direction of to the pumps. Additionally, two check valves were installed after these coils to prevent pressure variations in these coils that would cause unwanted cavitation and gas formation. Additionally, they assist in dampening the pulsation from the pulsator to the pumps. The sonicator is a GDmini2 ultrasound flow cell made by Hielscher which is used for the ultrasound assisted nucleation. A glass tube with an internal diameter of 2.15 mm is used in the sonicator in which the nucleation takes places. A glass tube was chosen as preliminary experiments showed that PFA tubes had a tendency to clog at the entrance and exit of the ultrasound flow cell, which was attributed to vibrations not being transmitted through the PFA to these places. PFA was chosen for all other tubes for its smoothness, low surface energy and because it performed the best against fouling and clogging in preliminary experiments together with stainless steel. The ultrasound flow cell is cooled to 1 or 9 °C to generate supersaturation using a thermostatic bath (Lauda, Variocool 3000, Lauda-Königshofen, Germany) and a booster pump (Standex—Procon, C013754, Irishtown, Ireland). The pulsator is a diaphragm pump (Milton Roy, Proteus, ERB 233-S1414V1PN, Pont-Saint-Pierre, France) of which the check valves have been removed. The suction and discharge stroke of the pulsator were equal in duration and the frequency of the pulsator was 0.55 Hz. The theorical stroke volume was 5.45 mL/stroke and the observed stroke volume, which was measured by determining the distance the liquid front moved during a pulse in a 4 mm ID tube after the heat exchanger, was 4.65 mL/stroke. The flows going through the pulsator and sonicator are combined directly after the sonicator and then go to the heat exchanger for growth. The heat exchanger is fully described and explained in Section 3. There is no oscillatory flow in the sonicator, as preliminary experiments showed that this is detrimental to the nucleation rate. The tubes between the pulsator, sonicator and heat exchanger are heated to 38 °C using hot air (heat blower, 700 W) and a heating cable with a controller (idetrading, 15QTVR2-CT; raystat V5, Dordrecht, Netherlands) to control the temperature. The temperature at this junction proved to be crucial for the operation of the crystallizer. If the temperature is too high the crystals would dissolve, if it were too low fouling would occur. The heat exchanger cools the solution slowly, according to a cubic cooling profile to 22 °C, as described in Section 3. After the heat exchanger, part of the flow is diluted with saturated dilution solution and goes to the online microscope. The online microscope uses a pulsating light source (PyroOptic, custom made, Kirke Saaby, Denmark) in order to make images of the moving particles. These images are then analyzed using an open source analysis algorithm in ImageJ, more information regarding the image analysis and microscope can be found elsewhere [25]. The other part of the flow is filtered over a Büchner funnel. The filtered crystals are dried at 50 °C and weighed afterwards. According to the mass balance this weight can be compared to the mass of the filtrate for determination of the yield according to following the formula:
η c r y s t a l   m a s s = m c m f ( c 0 ( t ) + 1 ) · ( c f c 0 ( t ) )
With mc the mass of the adipic acid crystals, mf the mass of the filtrate, c0(t) the solubility at temperature measured at the exit of the crystallizer (mass adipic acid/mass water) and cf the concentration of the feed (mass adipic acid/mass water). The remaining adipic acid concentration of the filtrate is also determined by taking 40 mL of the filtrate, weighing it, evaporating the water at 50 °C for 24 h and determining the remaining adipic acid mass according to Equation (3), which is derived from the mass balance.
η d e p l e t e d   s u p e r s a t u r a t i o n = m a m w c 0 ( t ) c f c 0 ( t )
with ma the mass of adipic acid crystals after evaporation, mw the mass of the water.

2.3. Experimental Procedure

Prior to each experiment the whole setup was rinsed with deionized water and the temperatures of the heat exchanger were allowed to equilibrate. At the start of the experiment the feed was changed to the adipic acid suspension. The experiments ended when either clogging occurred or when the operating time exceeded 4 h. If clogging occurred, it was cleaned by turning of the flow of the cooling gas and switching the feed to water.

2.4. Experiments

A 23 design of experiments (DOE) was performed in order to find the optimal working conditions of the crystallizer and evaluate the influence of 3 parameters on the crystallization process. The first parameter that was varied was the temperature in the sonicator or nucleator, which was set at 1 °C and 9 °C for the low and high setting respectively. More specifically, it was the temperature of the cooling water that flows around the tube that was varied. The second parameter is the percentage of the total flow that goes through the sonicator. The flow goes either through the sonicator or through the pulsator. The high and low setting were 30% and 80%, respectively. The final parameter that was varied was the total flow rate, which is inversely proportional to the residence time in the crystallizer. The high and low setting were 45 mL/min and 15 mL/min respectively, which correspond to a residence time of 31 and 10 min in the heat exchanger, respectively. The center point of the DOE was measured using a sonicator temperature, percentage of flow going through the sonicator, flow rate and residence time of 5 °C, 55%, 30 mL/min and 15 min, respectively. Several criteria were used to evaluate the crystallization process; first, the operating time, which is the time until clogging, which was evaluated up to 4 h. Second, the time until fouling is observed, which is subjective but does give information. Third, images of the crystals were evaluated visually online and offline and particle size distributions were measured. The inline images were taken each second and the offline images were taken by suspending a small amount of filtered adipic acid into heptane with lecithin. Finally, the yield was measured using three methods: the remaining supersaturation in the liquid, the mass of crystals formed in a set amount of time and the sum of volumes that was determined under the microscope. The sum of volumes determines the volume of crystals under the microscope by assuming all particles are spheres, calculating their volume using the spherical equivalent diameter and adding up all volumes [25].

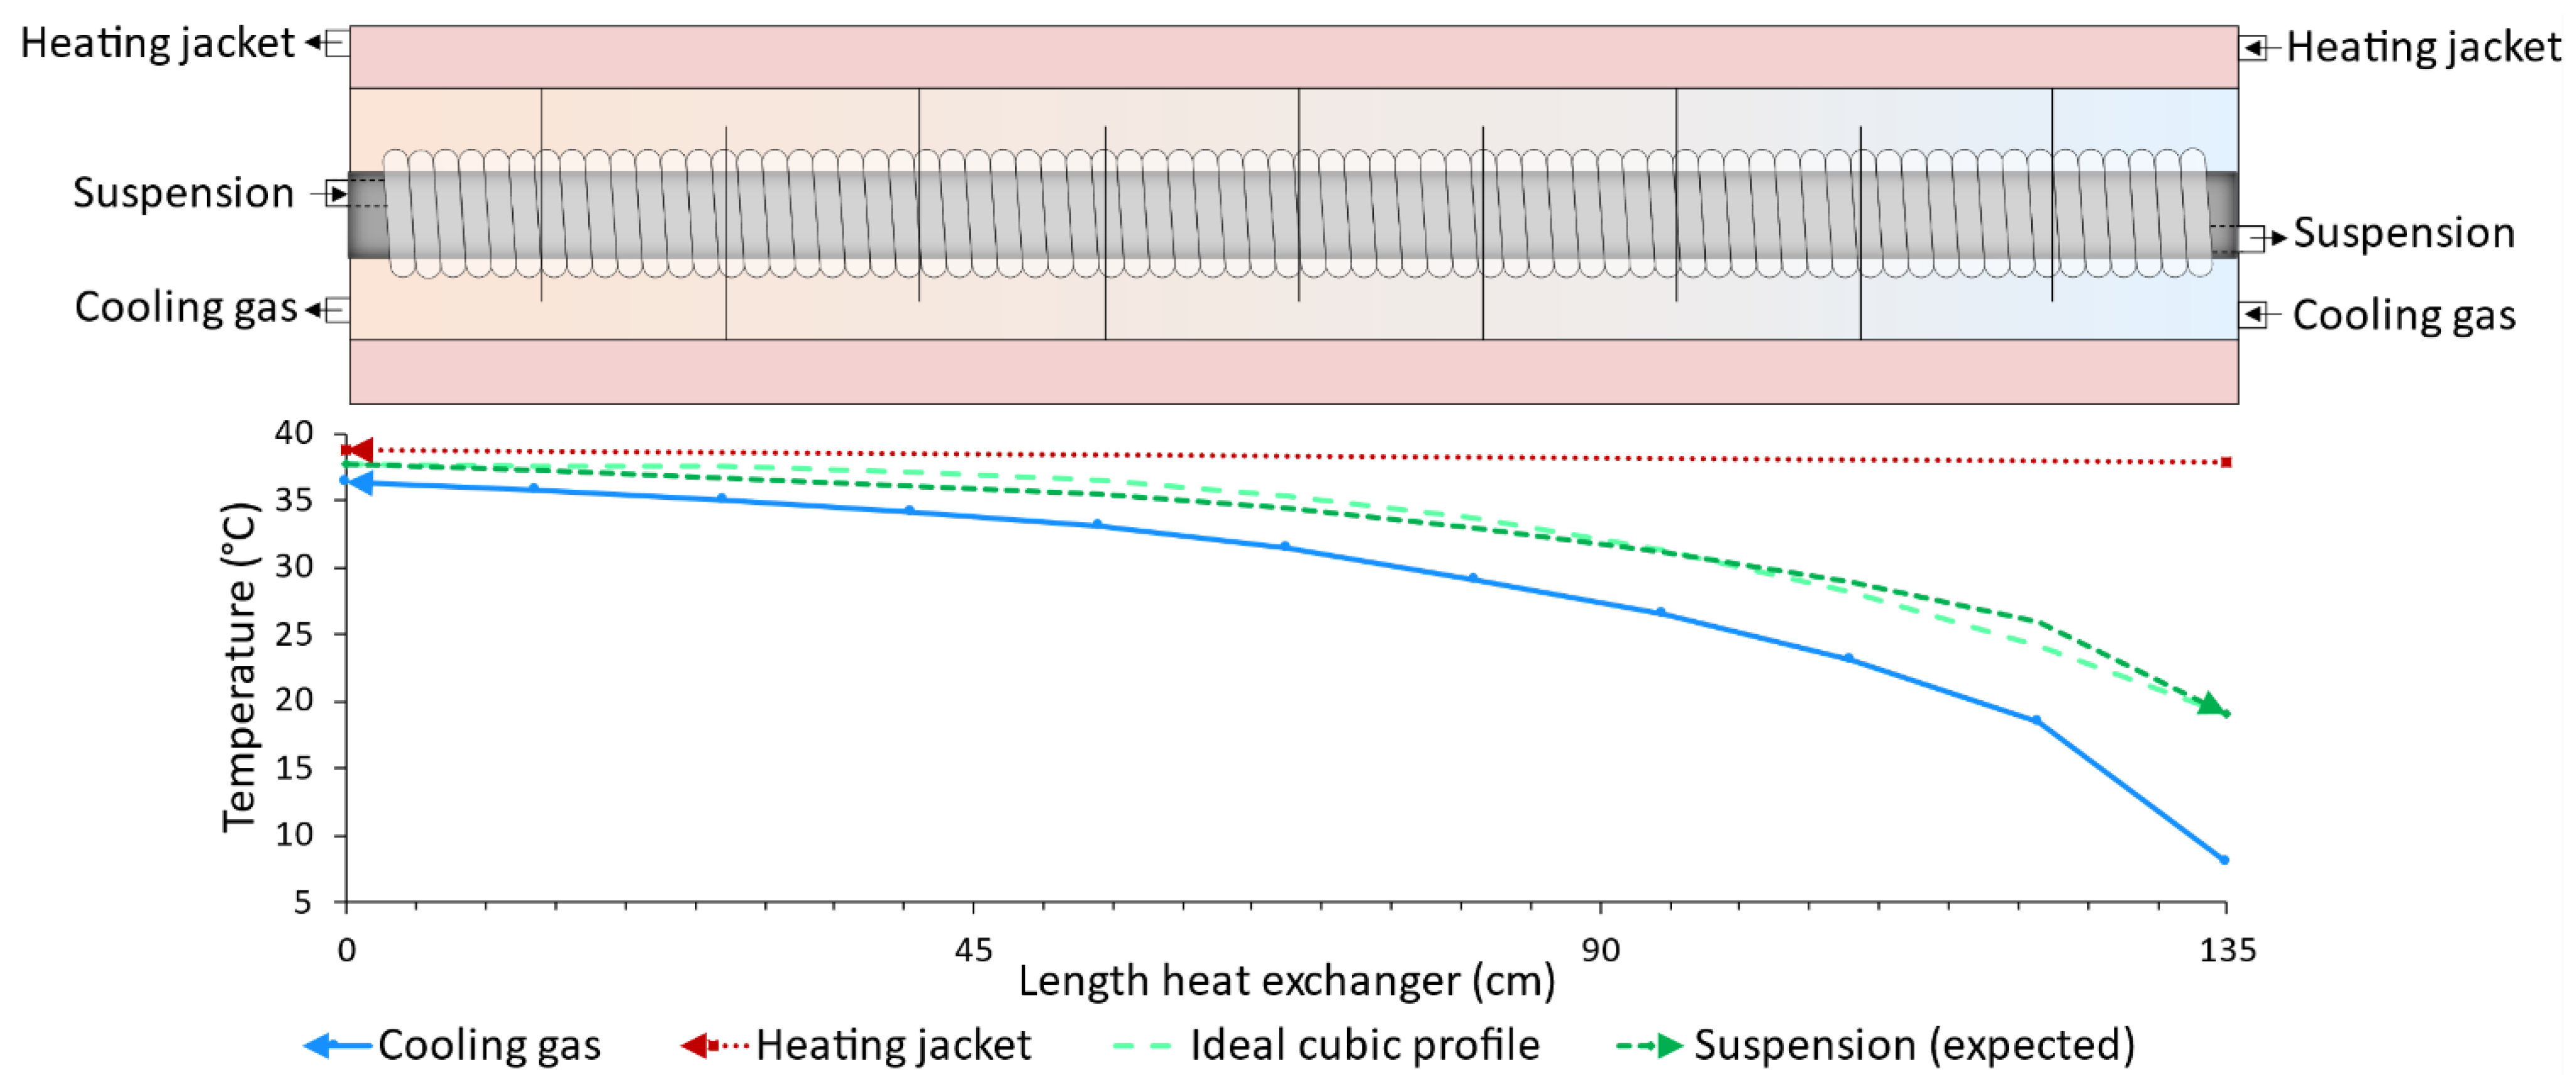
3. Cubic Cooling Profile

Figure 3 shows the heat exchanger that was used to obtain a cubic cooling profile in the growth zone. The heat exchanger exists out of 37 m of perfluoroalkoxy alkane (PFA) tubing with an inner diameter of 4 mm and outer diameter of 6 mm, which corresponds to a volume of 465 mL, through which the suspension flows. The PFA tubing is coiled tightly around a 1.35 m polycarbonate (PC) pipe with an outer diameter of 50 mm. This pipe is placed in another PC pipe with an outer diameter of 90 mm and a wall thickness of 3.2 mm. This pipe is surrounded by another PC pipe with an inner diameter and outer diameter of 140 mm and 150 mm respectively. There are 9 baffles between the inner- and middle-pipe to improve heat transfer, at each baffle a thermocouple is placed that is in contact with the PFA tube. The temperature of the heating jacket and the suspension is measured at the in- and outlet.
Hot water of 40 °C flows through the heating jacket, which is situated between the middle- and outer-pipe. This hot water flows at a sufficiently high flow rate so that the temperature decrease over the heat exchanger is only 0.9 °C, which is negligible. Cooling air flows through the middle pipe. A gas was used as it has a low heat transfer coefficient which is ideal to make temperature changes more gradual and avoid supersaturation peaks. The gas starts at a low temperature of 8 °C and is heated mainly by the heating jacket because of the large difference in temperature and the large contact area. As stated by Newton’s law of cooling, the gas will follow an exponential trajectory, heating up quickly initially but slowing down with a decreasing difference in temperature. From the opposite direction, in countercurrent, this closely resembles a cubic cooling profile. The suspension is cooled in countercurrent by the cooling gas, and follows due to its low flow rate (15–45 mL/min) the temperature profile of the cooling gas. Therefore, a cubic cooling profile is established in the suspension during the growth phase.
Figure 3 also shows the heat trajectories of the suspensions, cooling gas and the heating jacket along the length of the crystallizer. The temperature of the heating jacket remains constant while it heats up the cooling gas according to a natural heating profile, as evidenced by the temperature measurements. While the temperature of the actual suspension is only measured at the inlet and outlet it must follow the temperature of the cooling gas as it is surrounded by it. Therefore, it is expected that the cooling profile of the suspension is proportional to the profile of the gas, which is a cubic cooling profile as it flows in countercurrent. This is further evidenced in the crystallization experiments as fouling is distributed relatively evenly over the length of the reactor indicating a constant supersaturation over the length of the reactor.

4. Results and Discussion

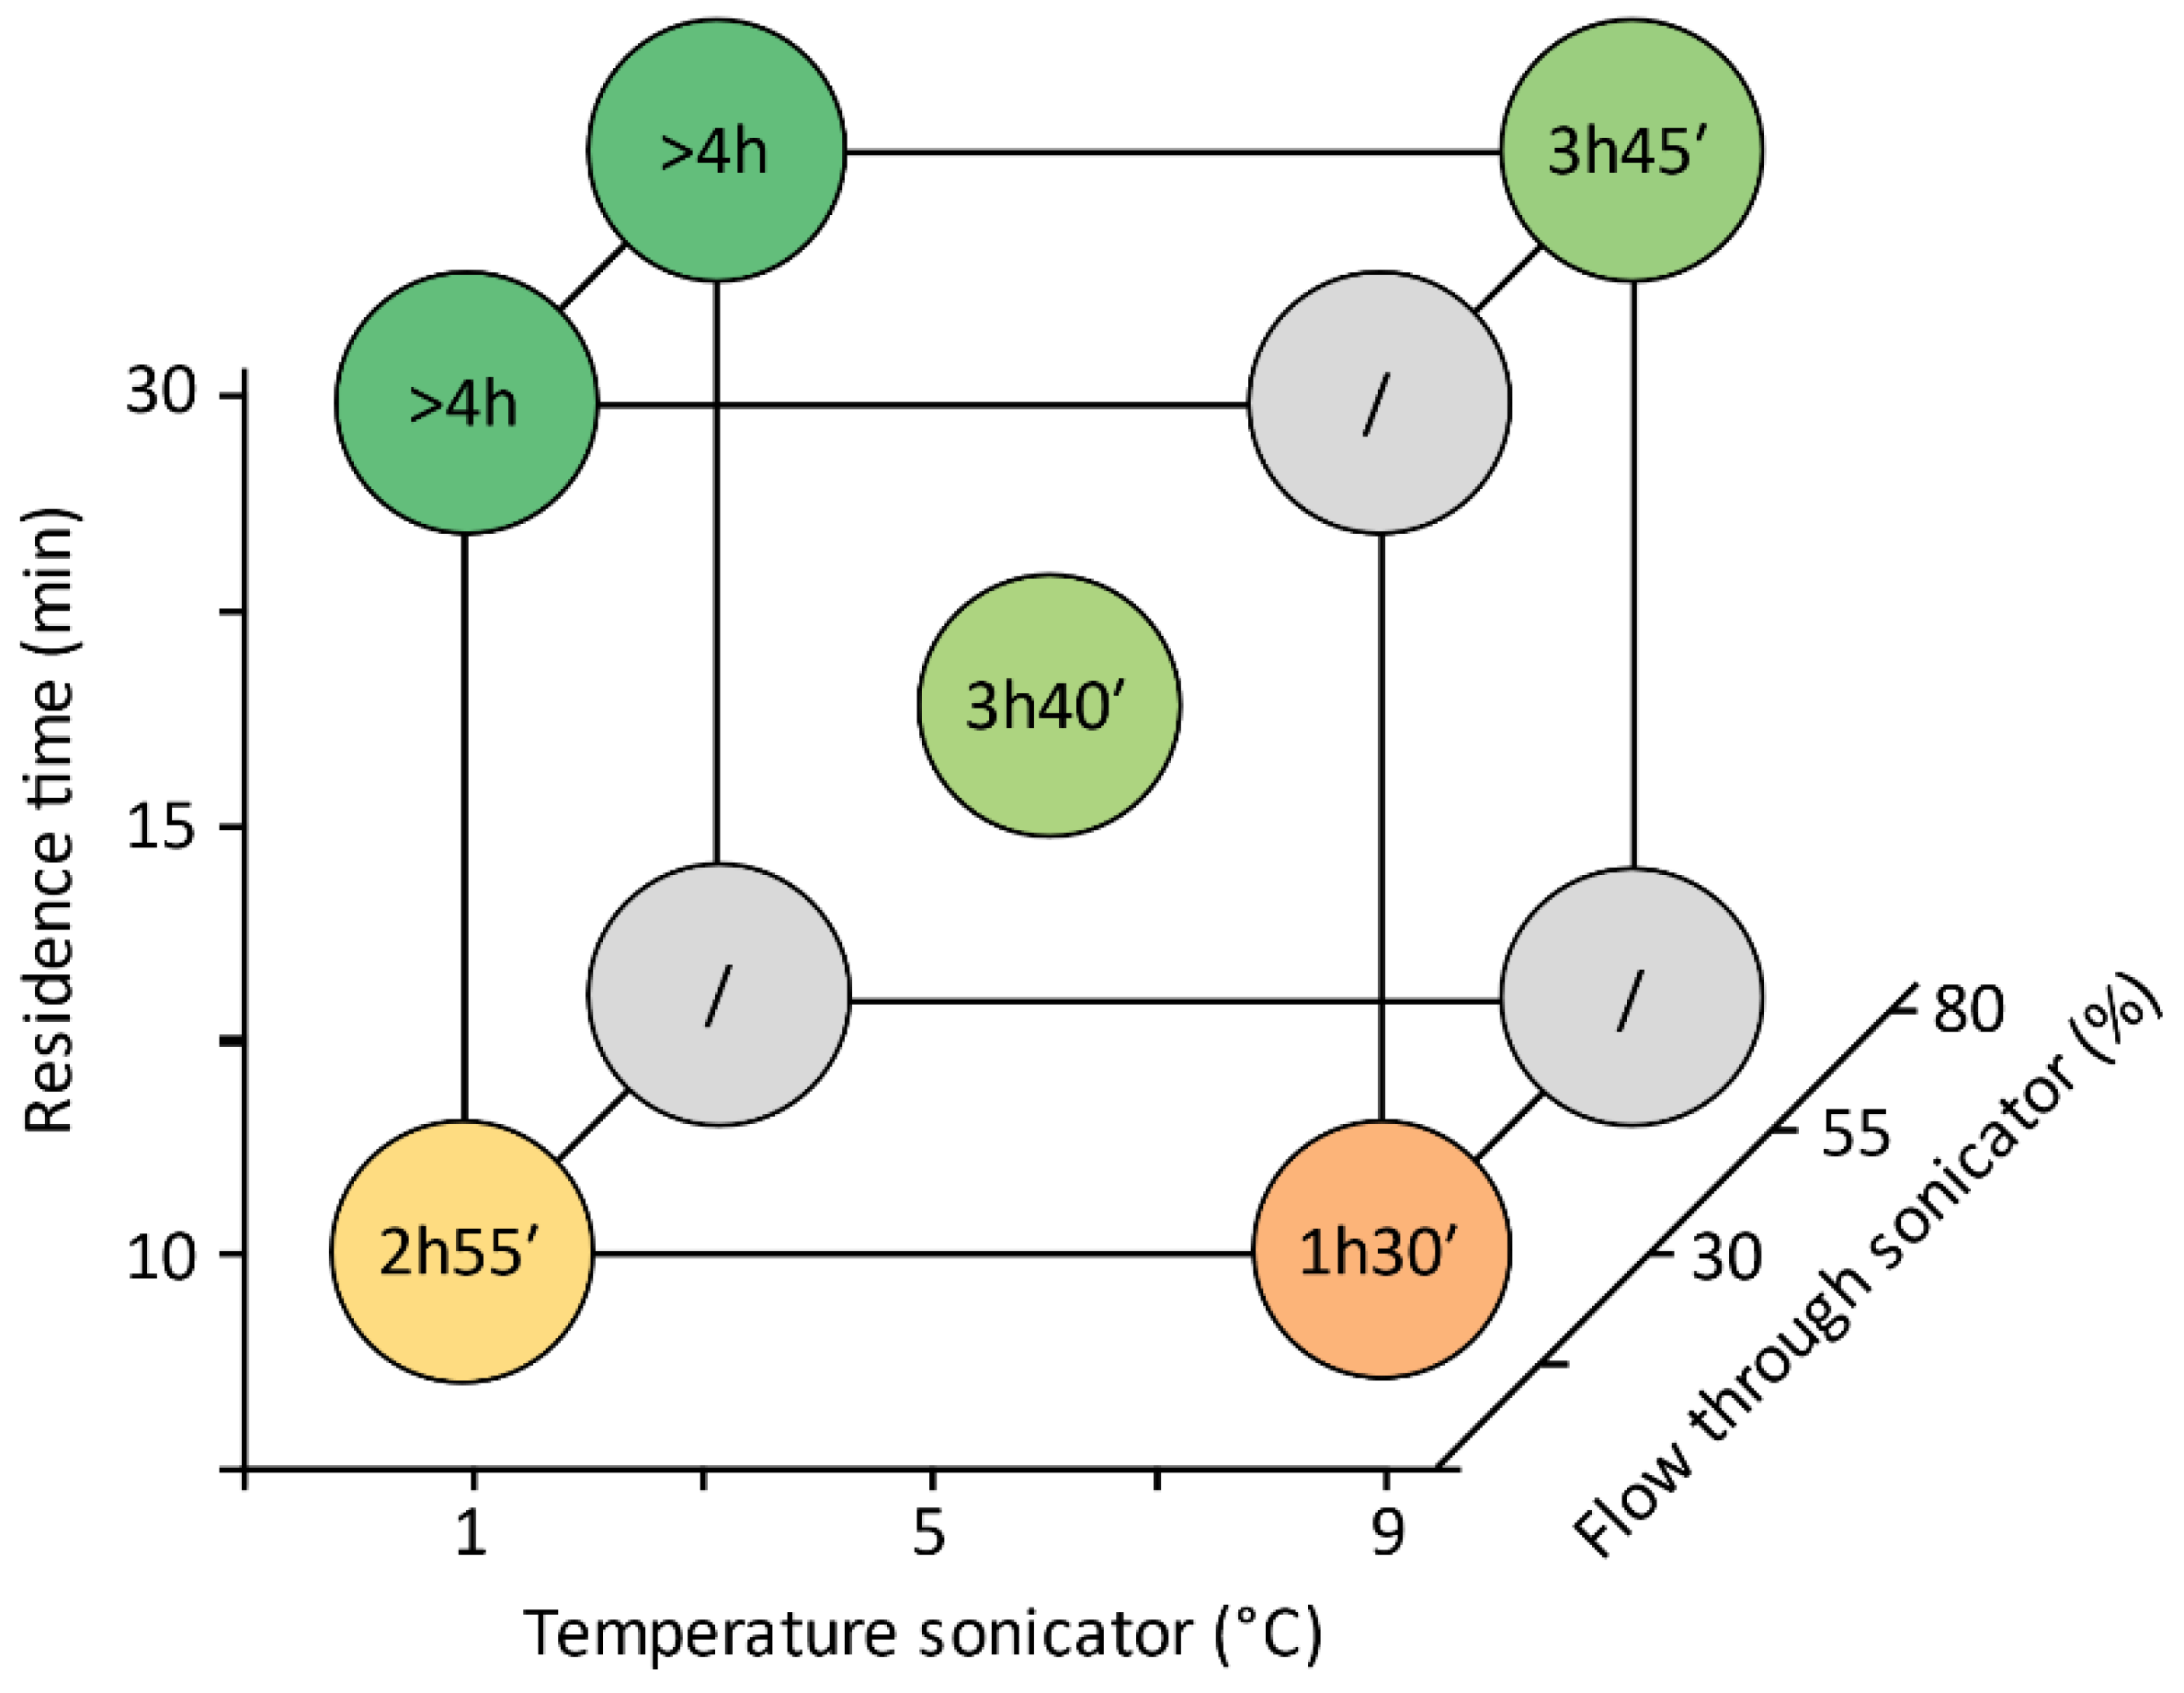
4.1. Operating Times

Figure 4 shows the operating time, which is the time until clogging, at the different settings of the parameters. The conditions at which the crystallizer is able to operate for more than 4 h are when long residence times of 30 min in the growth zone are combined with low sonicator temperatures of 1 °C. At low sonicator temperatures, the supersaturation for nucleation is higher and therefore more nuclei will be formed [17], more nuclei will result in more crystals that grow and deplete supersaturation and therefore the overall supersaturation in the growth zone of the crystallizer will be lower and will result in less fouling. This effect is seen at all 3 points. At higher residence times, and thus, lower flow rates, there are two effects that are beneficial for the operation time. First, less adipic acid is processed in a certain amount of time and thus there is less adipic acid that can deposit on the wall. Second, supersaturation is generated far slower, and therefore, the overall supersaturation in the crystallizer is lower as supersaturation is also constantly being depleted. Unfortunately, the obtained data does not allow to differentiate which of these two reasons is more influential. Generally, the influence of the percentage of flow going through the sonicator is less pronounced and point specific. In a few points no crystallization occurred, at these points the nucleation did not occur sufficiently in the sonicator or the nuclei dissolved before entering the growth zone. The former occurred in the experiments with a high percentage of the flow going through the sonicator and a low residence time, which resulted in a high flow rate and short residence time in the sonication zone. At these high flow rates the nucleation is not able to sustain itself, which has been shown before in earlier work [17]. The latter case occurred at the high sonicator temperature, high residence time and low percentage of flow going through the sonicator as the crystals, which were observed visually, redissolved between the sonicator and growth zone due to the relatively long residence time and high temperature between the sonicator and growth zone. It has to be noted that in all experiments fouling in the heat exchanger was observed. This fouling started somewhere between 1 h and 2.5 h for the different experiments, the exact times can be found in the supplementary information, Table S1. If blockages were observed, the clogging mechanism was the slow and gradual constriction of the tube by fouling which eventually led to blockages. All in all, while 4 h of operating time is far from long for a continuous process, it is among the longest reported operating times in literature and is orders of magnitudes longer than the operating times reported in preliminary experiments which were in the minute range [26].

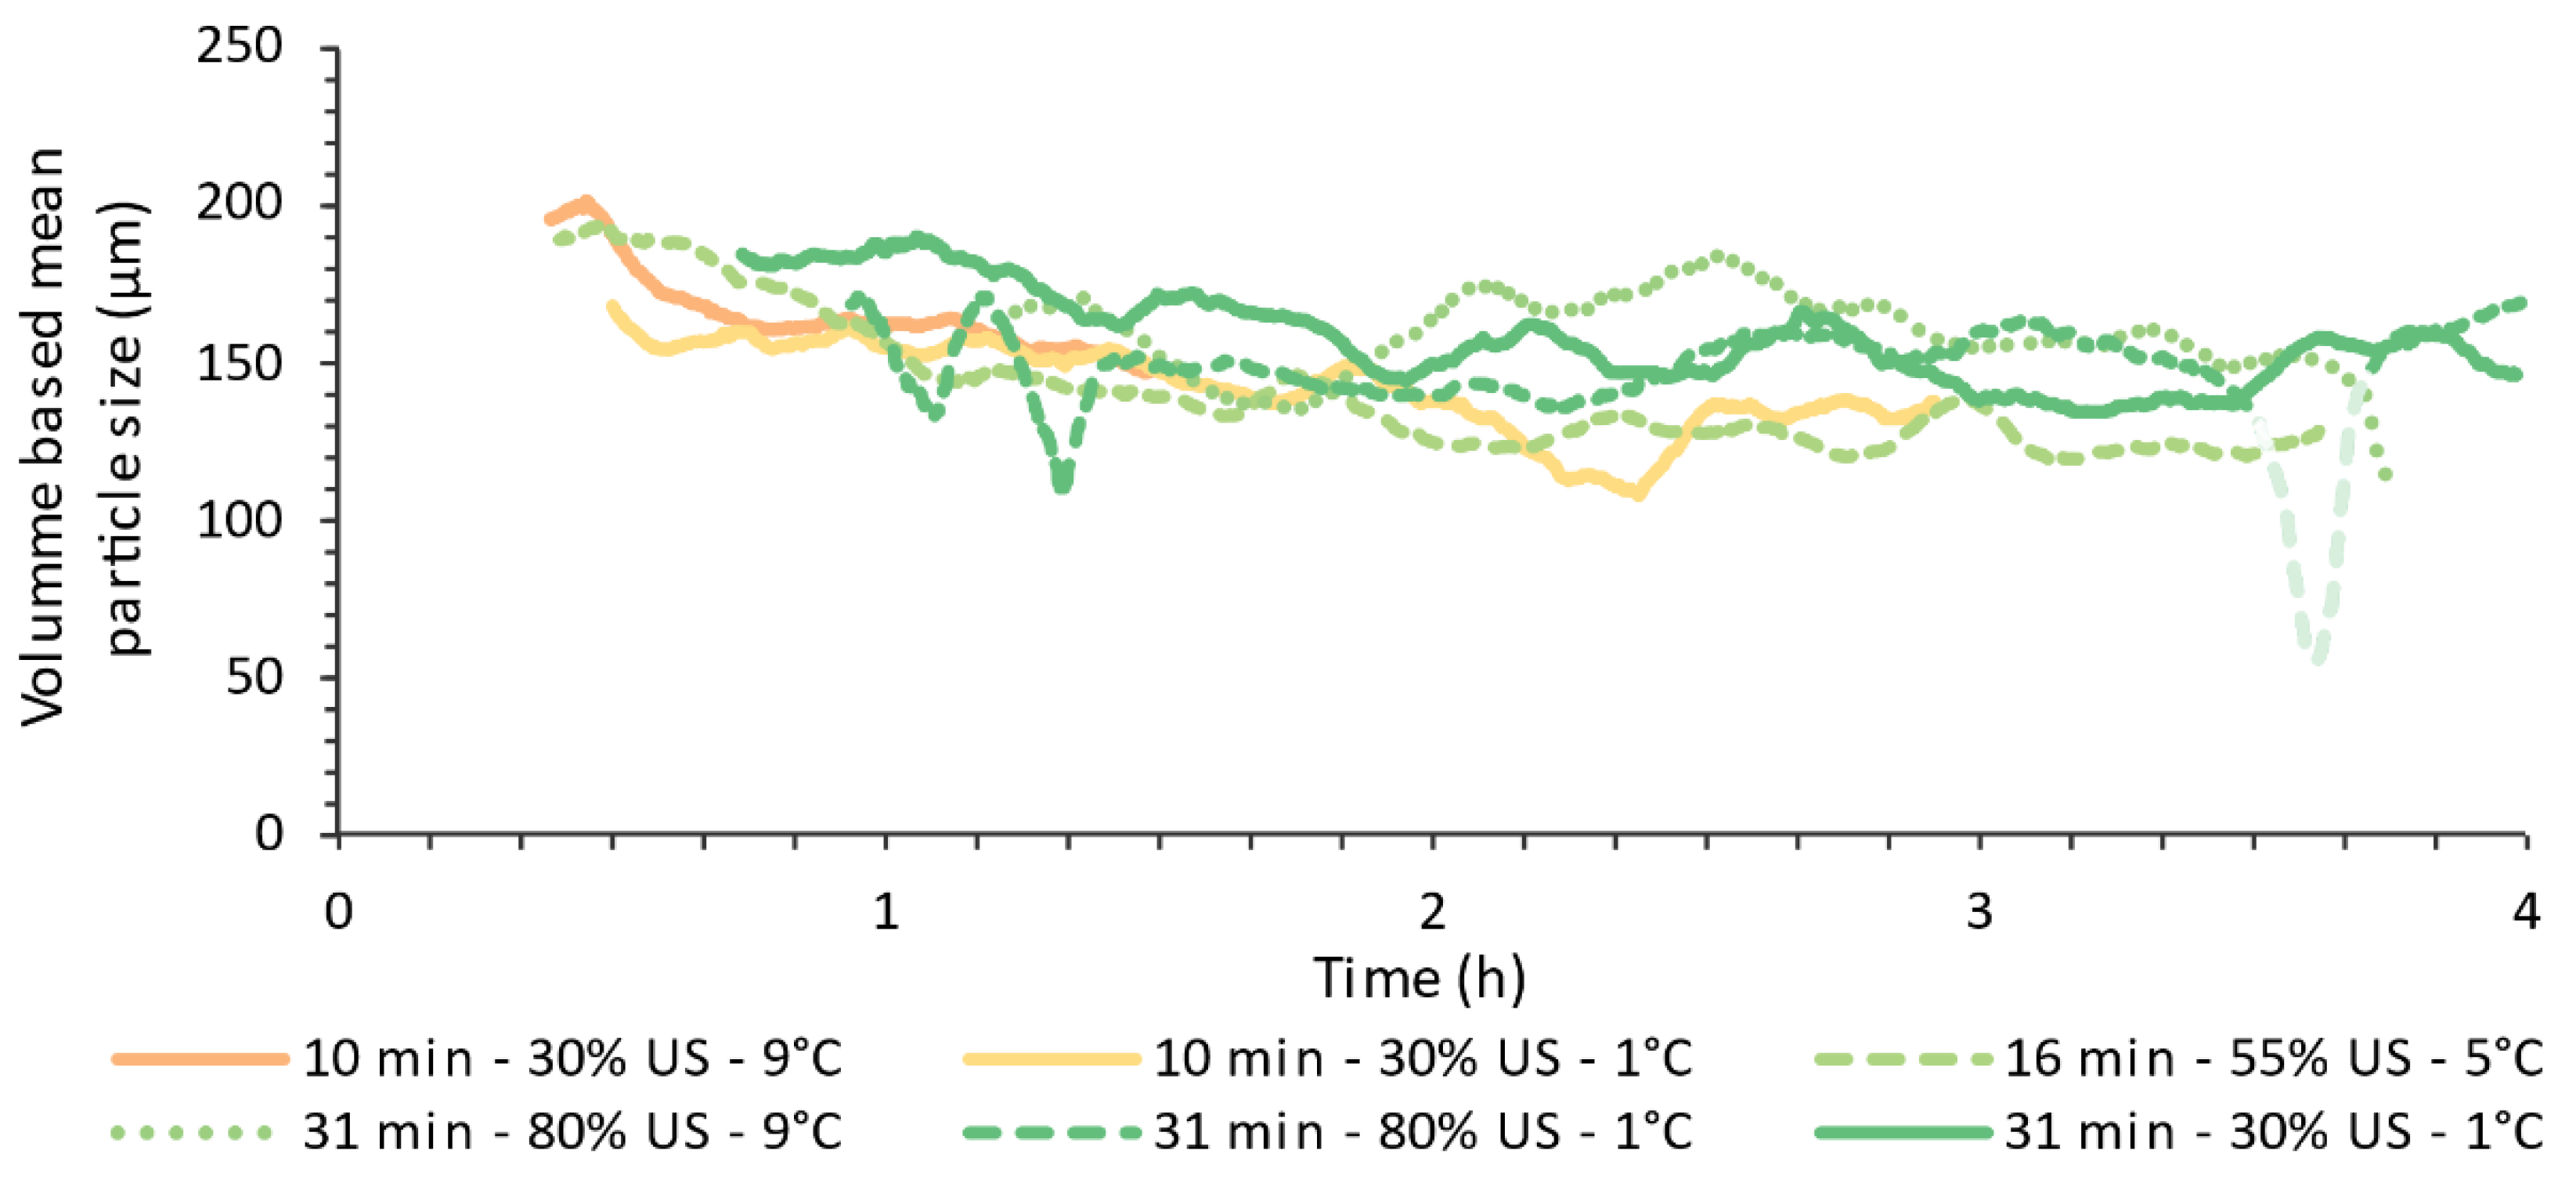
4.2. Online Particle Size Measurements

Figure 5 shows online images of the crystals three residence times after start-up of the process. The crystals in all experiments are agglomerated, the agglomerates exist out of dozens of primary crystals which are far smaller than the agglomerates, however, the agglomerates determine the particle size. Visually, there are no clear differences between the experiments and it is unclear if these crystals are loosely agglomerated, further referred to as soft agglomerates, or are cemented together, further referred to as hard agglomerates [27].
Figure 6 gives the cumulative particle size distributions that were measured online using the microscope, the distribution was made using all the images that were taken during the experiment. The crystals all have a similar particle size distribution with a D50 median diameter between 140 and 170 µm and a narrow span between 1 and 1.2. As mentioned above, the size is determined by agglomeration and the size of the primary crystals is far smaller, however, the data does not show if these primary crystals can be deagglomerated. It is likely that the different conditions of the DOE have little effect on the agglomeration of the crystals. Finally, it has to be considered that oscillatory flow is absent in the tubes towards the microscope, which might explain part of the agglomeration as it is expected that pulsation reduces agglomeration. All in all, the crystals are relatively small for a cooling crystallization, which is desired.
Figure 7 shows the evolution of the D4,3 volume based mean particle size during the experiments. After reaching steady state the particle size remains constant during all experiments, which is desired. The fluctuations in the graph are due to the heavy influence agglomerates can have on the volume based mean diameter.

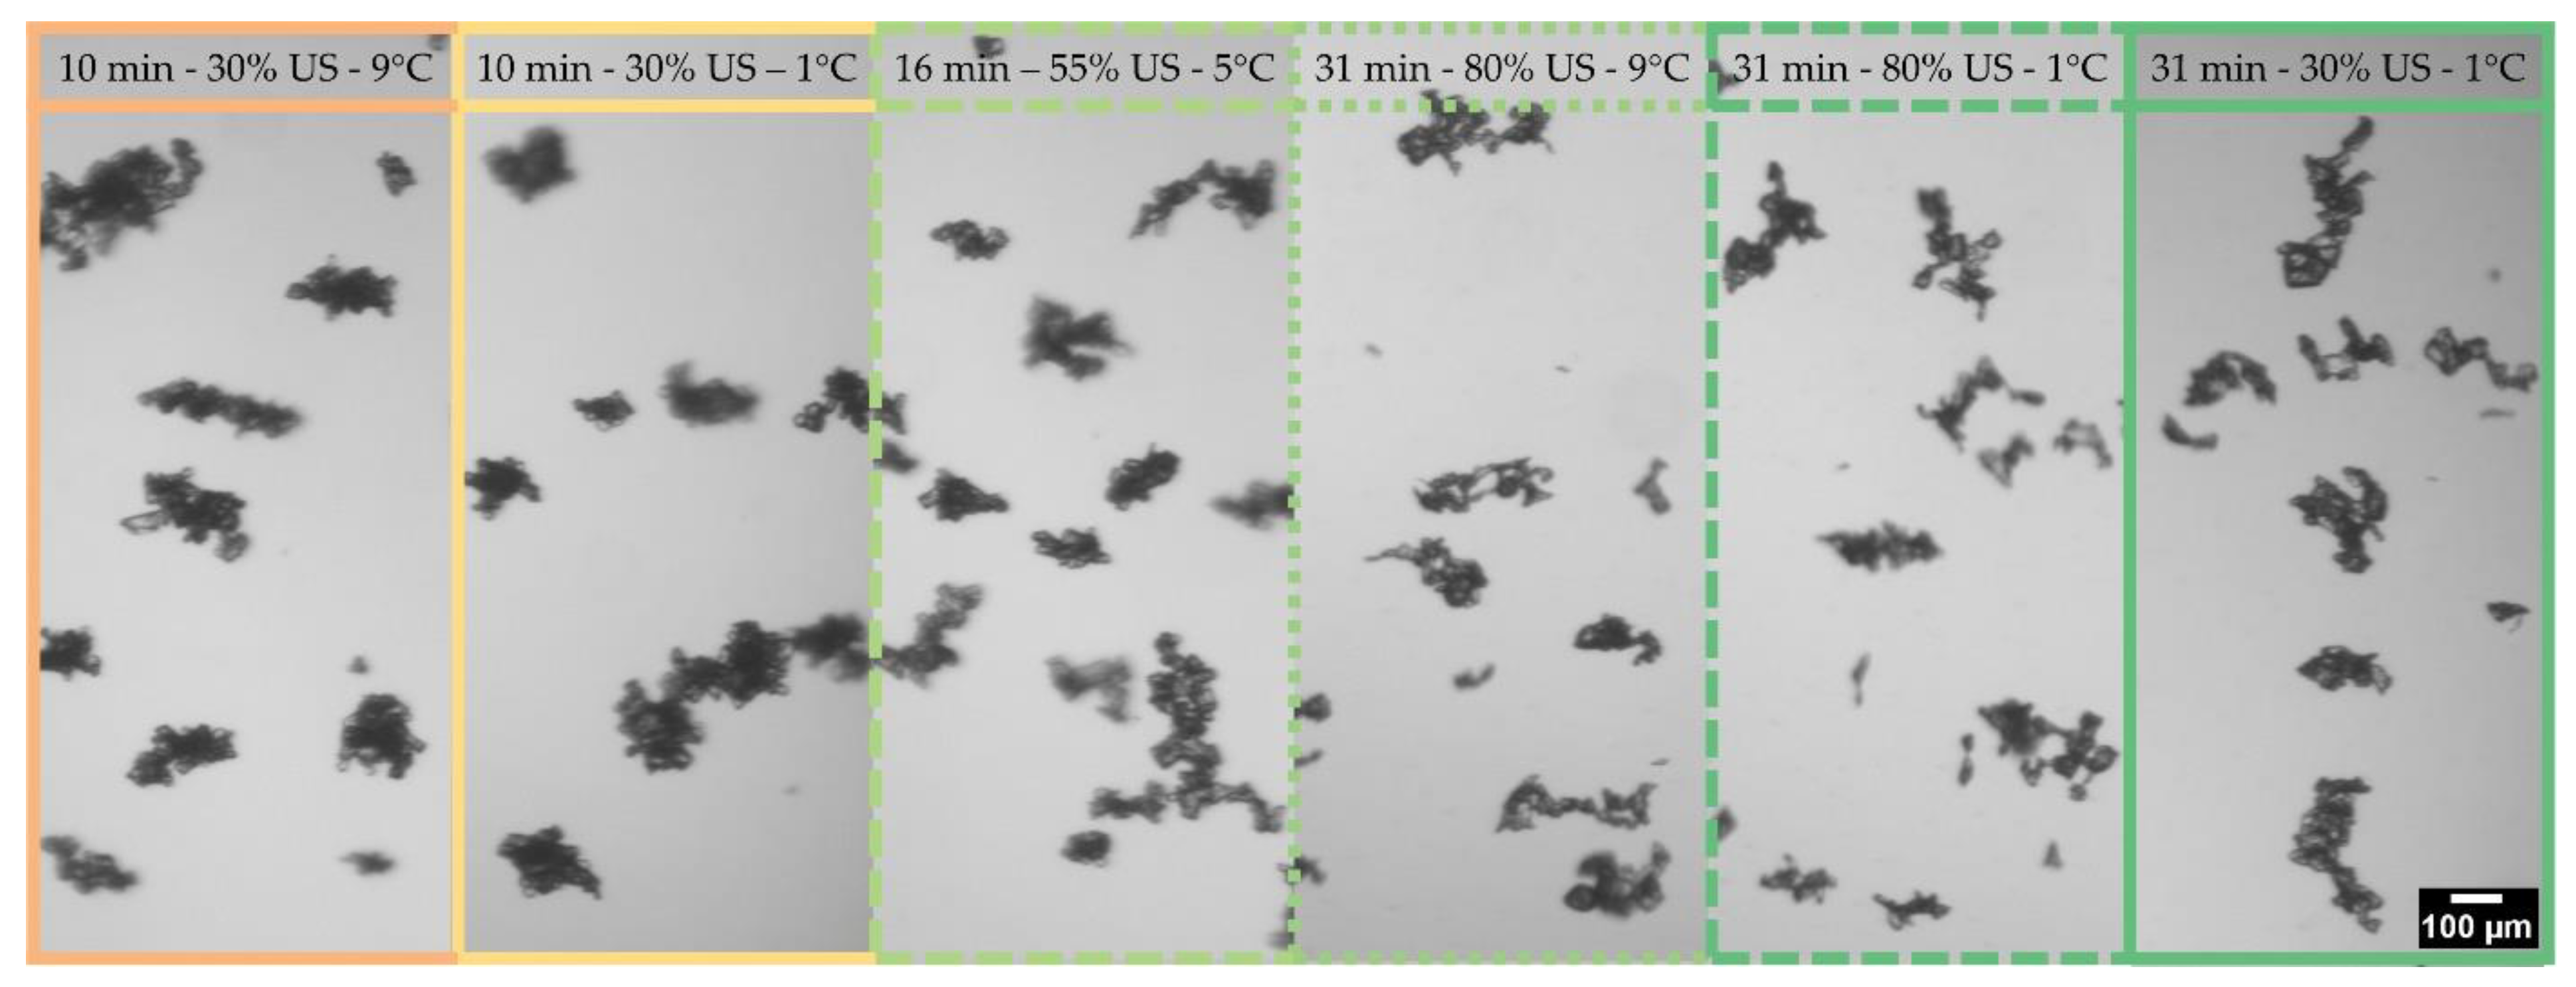
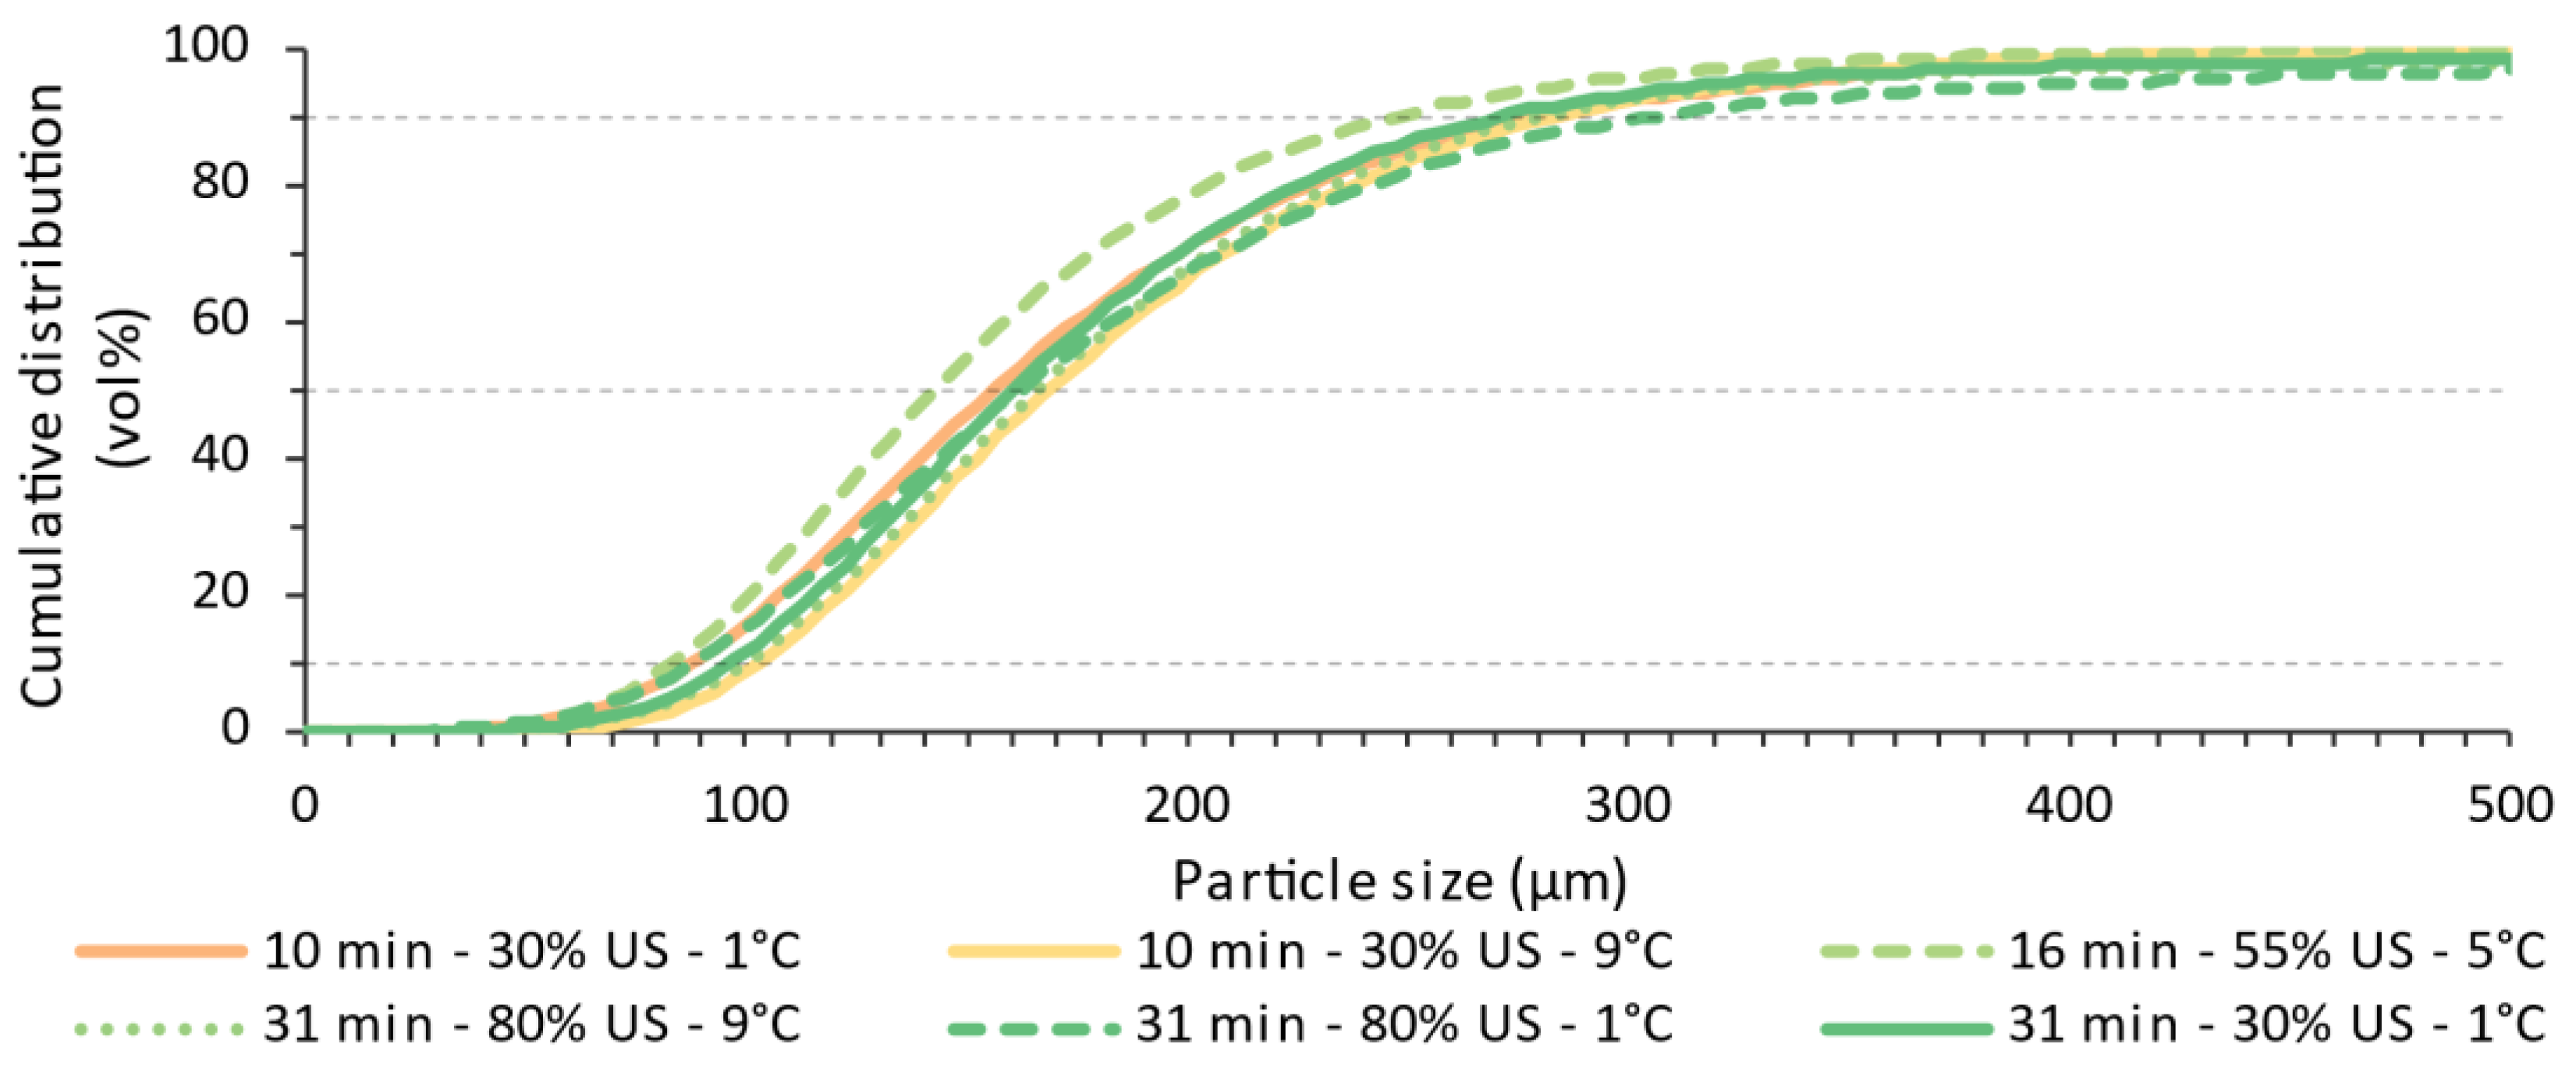
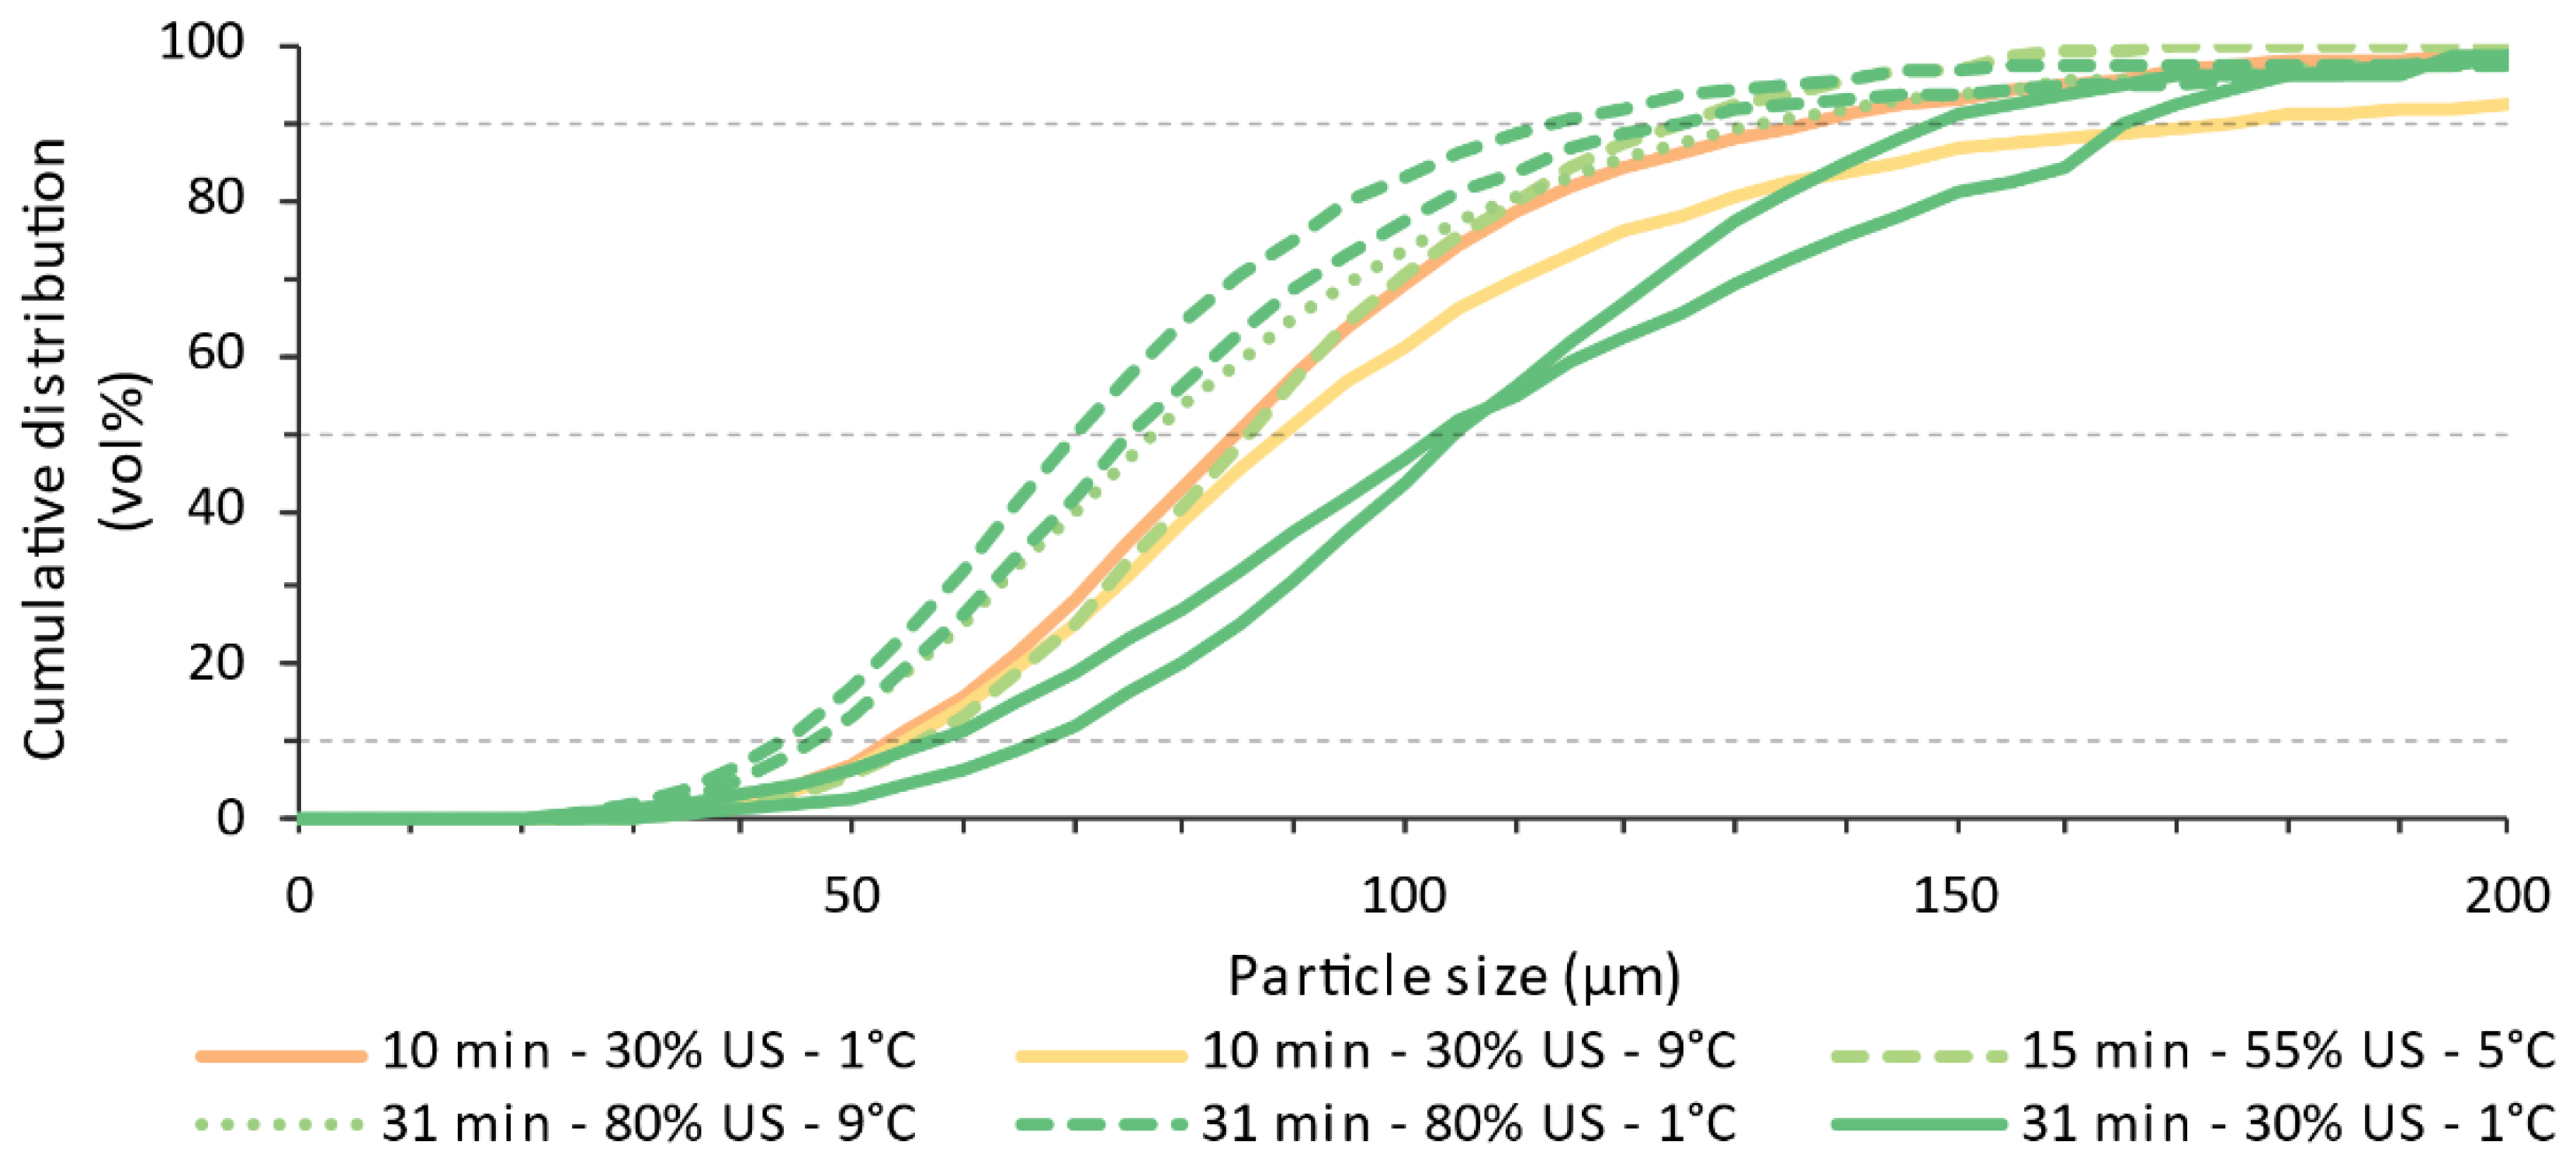
4.3. Offline Particle Sizes Distributions
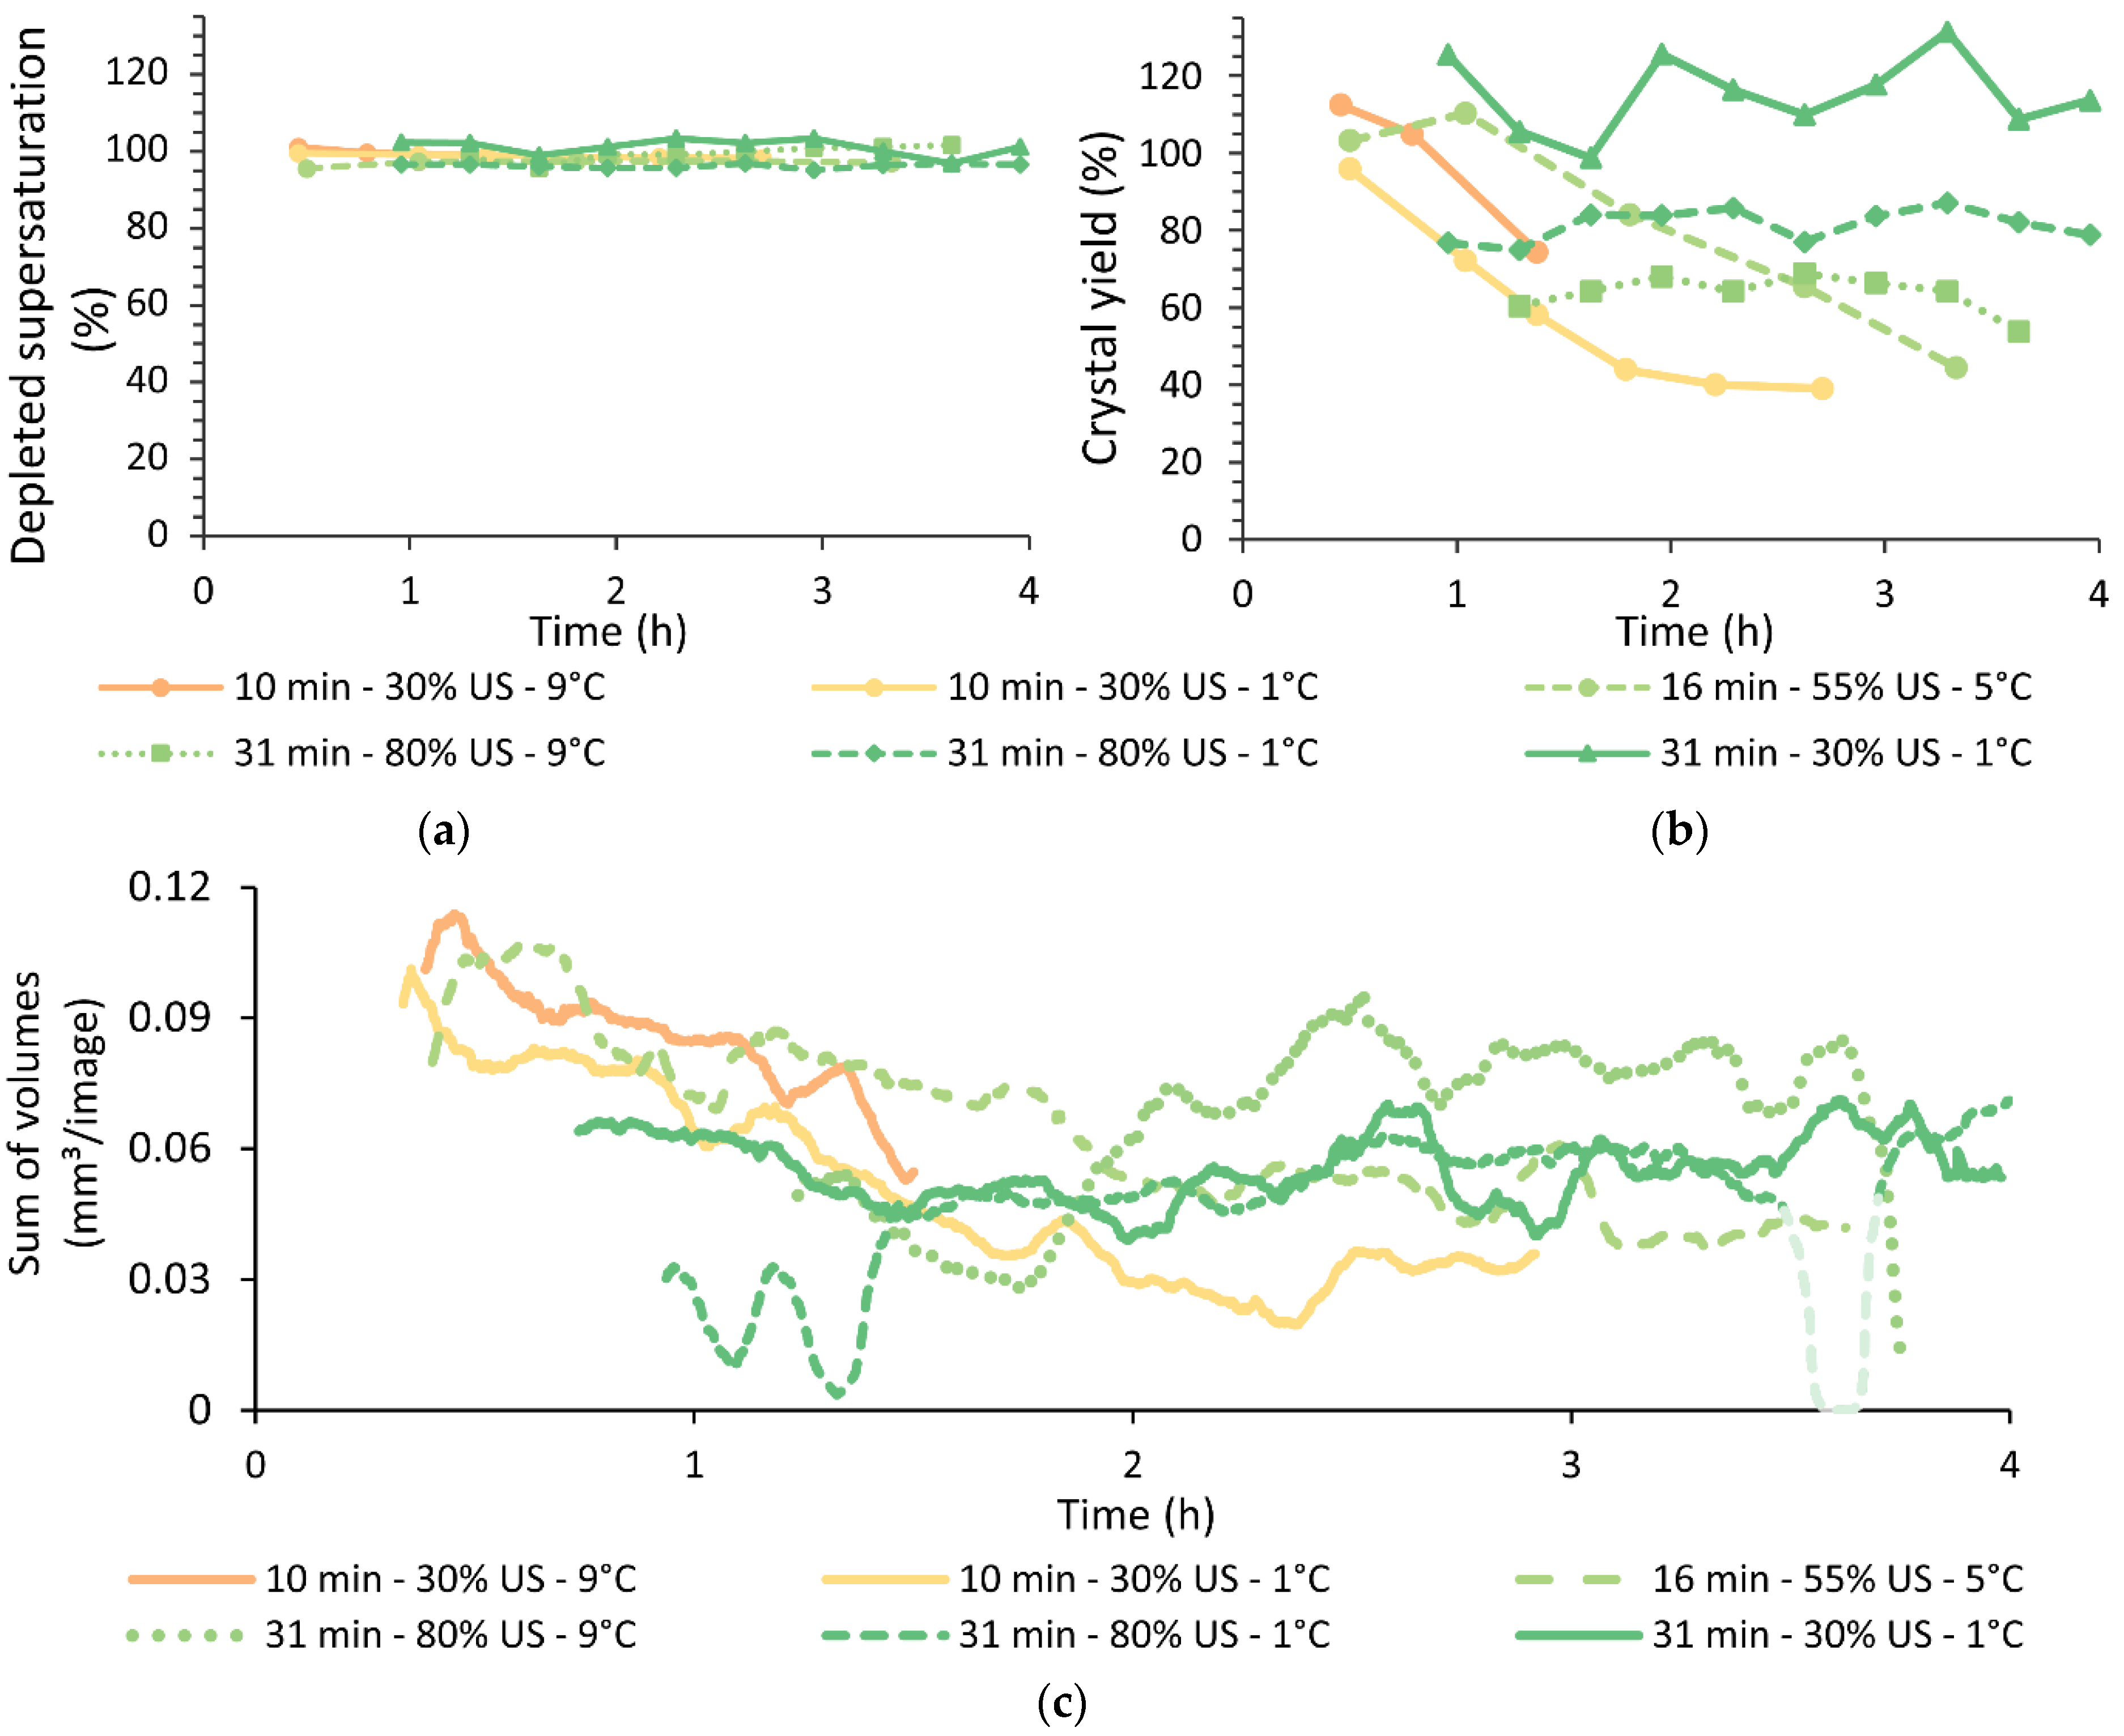
Figure 8 shows images of the filtered crystals suspended in heptane with lecithin as a surfactant. Adipic acid disperses better in heptane, therefore, these images give more information about the degree of agglomeration of the crystals. The images show that the crystals are clearly less agglomerated after suspension in heptane, thus, establishing that sizeable parts of the agglomerated are only loosely connected. Conversely, as the crystals are still quite agglomerated in heptane, it also means a sizeable part of the crystals are hard agglomerates. Overall, there are little visual differences between the images, only the experiment with the shortest operating time (10 min—30% US—9 °C) shows slightly more agglomeration than the other experiments, this would not be unexpected as it clogged the earliest.
The particle size distributions of these samples suspended in heptane are shown in Figure 9. Generally, the crystals have a volume based median size between 75 and 105 µm, which is almost half of what was measured online, highlighting that a big part of the agglomerates that were detected online are not cemented together. Notably, the two experiments with 31 min residence time and 1 °C in the sonicator, which both ran for more than 4 h, have contrasting particle sizes. The experiment in which 80% of the total flow is sonicated showed smaller particle sizes of 75 µm than the experiment where only 30% of the flow was sonicated, which has a median particle size of 105 µm. This suggests that the particle size is controllable by varying the percentage of sonicated flow, although the difference seems to come from a difference in agglomeration degree. Eder et al. also showed that this method could be used to tune the particle size. However, it is unclear why this only occurred in the experiments with a varying percentage of flow going through the sonicator since this effect would be expected more in the experiment with different nucleation temperatures, as this is expected to have a bigger influence of the nucleation. Overall, the offline particle size distributions nuance the agglomeration issues, but the effect of the different parameters on the tunability of the particle size needs further investigation.

4.4. Yield

The yield is measured using three different methods. Figure 10a shows the obtained yield based on the amount of remaining adipic acid concentration in the mother liquor or the percentage of supersaturation that is depleted. In all experiments 95% to 100% of the adipic acid supersaturation is depleted. Additionally, these values remain constant over time.
Figure 10b shows the obtained yield based on the mass of crystals on the filter. The precision and accuracy of this method is suboptimal as evidenced by the fluctuating values. This is likely due to the unequal distribution of flow between the microscope and the filter, which was irrelevant for the first method. However, the measurements do show clear trends. The experiments that have a residence time in the heat exchanger of 31 min, and ran the longest, show a constant yield during the experiment. While the other experiments, that clogged more quickly, showed a decreasing yield during the experiment.
The trends shown in Figure 10b are further supported by the sum of volumes that was measured under the microscope and is shown in Figure 10c. The sum of volumes calculates the volume of all the particles detected under the microscope by assuming they are spheres. Again, the three experiments with the longest operating times show a relatively constant yield while the other three experiments show a decreasing yield. This decrease can be explained by fouling as the more fouling grows the faster it can deplete supersaturation. Since the yield in Figure 10a is only determined by the depleted supersaturation, it is unaffected by this effect. Thus, while practically all supersaturation is depleted in the crystallizer, part of the adipic acid is lost to fouling and this is problematic in the experiments with a short operating time, as these experiments clearly suffered from fouling, which was also observed visually. However, it was not a problem for the experiments with long operating times as they had limited fouling. Finally, the crystal yield should be similar to the amount of depleted supersaturation since the crystal yield remains constant during the experiments that ran 4 h, and since there was no observable fouling for the first 1.75 h and 2.5 h in these experiments, Table S1. Thus, it can be concluded that the obtained yields are excellent.

4.5. Design Discussion

The objectives set out in this work were accomplished, however, there are still several considerations that need to be made going further. First of all—the operating time, it is unlikely that the crystallizer is able to work indefinitely without clogging as evidenced by fouling that, in the best case, already started after 2.5 h of operation. While the system was far from clogging, once fouling has started it is only a matter of time according to our experience. Therefore, the idea is to periodically clean the crystallizer by heating the API suspension above the solubility, dissolve all fouling, and recycle it to the feed. This would allow cleaning without yield losses. Furthermore, it is expected that longer operating times are possible by further enhancing the oscillatory flow or the processing conditions. The process conditions would need to emphasize on minimizing the supersaturation in non-sonicated zones of the reactor, as high supersaturations lead to fouling. This could be obtained by further enhancing the nucleation to maximize supersaturation depletion or by increasing the residence time to minimize the supersaturation generation. All in all, the proposed design has one of the longest reported operating times for a tubular crystallizer.
Second, the crystals were agglomerated in the crystallizer and are still quite agglomerated after filtration, and while this is likely related to the small size of the primary crystals, the compound and the solvent, it heavily influences the obtained particle size and hinders control of the particle size. Additionally, agglomeration reduces the available surface area, slowing down supersaturation depletion which increases fouling. While agglomeration is mainly decided by the particle-particle and particle-solvent interactions, there are other methods to control them. Fortunately, these methods often overlap with the methods to prevent fouling as high supersaturations also lead to agglomeration. Therefore, enhancing the nucleation rate [28] or increasing the residence time might also help reducing agglomeration. Increasing the intensity of the oscillatory flow might also be a good method to prevent agglomeration as it might break the aggregates. While the influence of oscillatory flow on agglomeration is yet to be systematically investigated, preliminary experiments already indicated a decrease in agglomeration when using pulsation. Additionally, it has been shown that increasing the mixing intensity in batch reactors can decrease agglomeration [28]. Another method entails the application of ultrasound to break the agglomerates [28].
Third, it has to be noted that the yield calculated here is relative to the solubility and not relative to the dissolved compound, as it is thermodynamically impossible to go below the solubility. In this work, only 60% of all dissolved adipic acid could crystallize thermodynamically due to the still relatively high solubility of adipic acid in water at room temperature. In order to increase this value, which would be necessary for an industrial process, the starting concentration, and the starting temperature, would need to increase. While this should not be too challenging, it might increase the cooling gradient/rate which could lead to faster fouling or might mean that the flow rate needs to be reduced.
On a final note, it is expected that scalability is a strength of this design. It has been shown before that ultrasound can be scaled-up according to a constant power/volume and constant residence time [17]. The pulsator and heat exchanger should be scalable without any foreseeable issues and the growth zone could be scaled up by using a larger tube, which would have the added benefit of a reduced pressure drop over the system. The second option would be to scale-up the tube by increasing both the length and the diameter of the tube by the cube root of the scale-up factor, which would result in a scale-up with a constant residence time, constant pressure drop, and constant shear rate.
While the setup was successful, based on the observations in the current setup several improvements can be made:
  • A pulsator with a faster discharge stroke and a slower suction stroke: The stroke length of the suction and discharge of the pulsator are currently equal. The speed of the pulsator is currently limited by the suction stroke as it would otherwise cause excessive cavitation that would dampen the discharge stroke. However, a faster and more powerful discharge stroke is expected to reduce fouling and agglomeration and improve mixing.
  • Using a single coil for the dissolution step instead of two separate ones for simplicity.
  • Splitting up the flow to the sonicator after the sonicator instead of from the beginning so that all flow goes through the pulsator, which will minimize gas buildup through cavitation here.

5. Conclusions

The development of continuous crystallizers is gaining a lot of attention recently. This tubular crystallizer, with a cubic cooling profile, ultrasound assisted nucleation and oscillatory flow is able to run for more than 4 h at 15 mL/min with 95% to 100% of the available supersaturation depleted. In general, the proposed equipment allows the supersaturation to be gradually depleted with minimal fouling and sedimentation. In order to minimize fouling and reach steady state operation, it is critical that enough nuclei, and thus surface area, is created during the nucleation phase to deplete supersaturation fast enough. The most important process setting to accomplish this was the temperature in the sonicator, which determined the amount of nucleation. The particle size in the crystallizer is for all investigated conditions dominated by agglomeration. The agglomerates have a volume based mean size of around 155 µm while the primary particles are far smaller. After filtration and dispersing the particles well in heptane, the resulting agglomerates have a mean diameter of 80 µm. The span is in each case around 1, indicating a narrow distribution and suggesting a good filterability. Overall, these results are promising for continuous crystallization as it shows that tubular crystallizers can be operated in steady state at a high yield, while maintaining small and narrow particle size distribution. Future work should focus on evaluating different crystallization compounds and improving the design. Particularly, work focusing on increasing the intensity of the oscillatory flow or pulsed ultrasound could be especially interesting.

Supplementary Materials

The following are available online at https://0-www-mdpi-com.brum.beds.ac.uk/article/10.3390/pr9122268/s1, Table S1: time until first observation of fouling in the heat exchanger. Table S2: parameters used for the image analysis. Figure S1: picture of the setup.

Author Contributions

Conceptualization: A.V. and L.B.; funding acquisition, L.C.J.T. and L.B.; investigation, A.V. and W.D.B.; methodology, A.V. and W.D.B.; project administration, A.V. and L.B.; software, A.V.; supervision, L.B.; validation, A.V. and W.D.B.; visualization, A.V.; writing—original draft, A.V.; writing—review and editing, W.D.B., T.V.G., L.C.J.T. and L.B. All authors have read and agreed to the published version of the manuscript.

Funding

This research was funded by the Agency for Innovation and Entrepreneurship (VLAIO) and Catalisti Grant Number MMICAS HBC.2020.2627.

Data Availability Statement

Not applicable.

Conflicts of Interest

The authors declare no conflict of interest.

References

  1. Wood, B.; Girard, K.P.; Polster, C.S.; Croker, D.M. Progress to Date in the Design and Operation of Continuous Crystallization Processes for Pharmaceutical Applications. Org. Process Res. Dev. 2019, 23, 122–144. [Google Scholar] [CrossRef]
  2. Ferguson, S.; Morris, G.; Hao, H.; Barrett, M.; Glennon, B. Characterization of the anti-solvent batch, plug flow and MSMPR crystallization of benzoic acid. Chem. Eng. Sci. 2013, 104, 44–54. [Google Scholar] [CrossRef]
  3. Alvarez, A.J.; Myerson, A.S. Continuous plug flow crystallization of pharmaceutical compounds. Cryst. Growth Des. 2010, 10, 2219–2228. [Google Scholar] [CrossRef]
  4. Eder, R.J.P.; Schrank, S.; Besenhard, M.O.; Roblegg, E.; Gruber-Woelfler, H.; Khinast, J.G. Continuous sonocrystallization of acetylsalicylic acid (ASA): Control of crystal size. Cryst. Growth Des. 2012, 12, 4733–4738. [Google Scholar] [CrossRef]
  5. Jiang, M.; Papageorgiou, C.D.; Waetzig, J.; Hardy, A.; Langston, M.; Braatz, R.D. Indirect ultrasonication in continuous slug-flow crystallization. Cryst. Growth Des. 2015, 15, 2486–2492. [Google Scholar] [CrossRef]
  6. Vetter, T.; Burcham, C.L.; Doherty, M.F. Regions of attainable particle sizes in continuous and batch crystallization processes. Chem. Eng. Sci. 2014, 106, 167–180. [Google Scholar] [CrossRef]
  7. Acevedo, D.; Yang, X.; Liu, Y.C.; O’Connor, T.F.; Koswara, A.; Nagy, Z.K.; Madurawe, R.; Cruz, C.N. Encrustation in Continuous Pharmaceutical Crystallization Processes—A Review. Org. Process Res. Dev. 2019, 23, 1134–1142. [Google Scholar] [CrossRef]
  8. Furuta, M.; Mukai, K.; Cork, D.; Mae, K. Continuous crystallization using a sonicated tubular system for controlling particle size in an API manufacturing process. Chem. Eng. Process. Process Intensif. 2016, 102, 210–218. [Google Scholar] [CrossRef]
  9. Ezeanowi, N.; Pajari, H.; Laitinen, A.; Koiranen, T. Monitoring the Dynamics of a Continuous Sonicated Tubular Cooling Crystallizer. Cryst. Growth Des. 2020, 20, 1458–1466. [Google Scholar] [CrossRef]
  10. Kreimer, M.; Zettl, M.; Aigner, I.; Mannschott, T.; van der Wel, P.; Khinast, J.G.; Krumme, M. Performance characterization of static mixers in precipitating environments. Org. Process Res. Dev. 2019, 23, 1308–1320. [Google Scholar] [CrossRef]
  11. Rossi, D.; Gavriilidis, A.; Kuhn, S.; Candel, M.A.; Jones, A.G.; Price, C.; Mazzei, L. Adipic acid primary nucleation kinetics from probability distributions in droplet-based systems under stagnant and flow conditions. Cryst. Growth Des. 2015, 15, 1784–1791. [Google Scholar] [CrossRef] [Green Version]
  12. Rossi, D.; Jamshidi, R.; Saffari, N.; Kuhn, S.; Gavriilidis, A.; Mazzei, L. Continuous-Flow Sonocrystallization in Droplet-Based Microfluidics. Cryst. Growth Des. 2015, 15, 5519–5529. [Google Scholar] [CrossRef]
  13. Nagasawa, H.; Mae, K. Development of a new microreactor based on annular microsegments for fine particle production. Ind. Eng. Chem. Res. 2006, 45, 2179–2186. [Google Scholar] [CrossRef]
  14. Termühlen, M.; Etmanski, M.M.; Kryschewski, I.; Kufner, A.C.; Schembecker, G.; Wohlgemuth, K. Continuous slug flow crystallization: Impact of design and operating parameters on product quality. Chem. Eng. Res. Des. 2021, 170, 290–303. [Google Scholar] [CrossRef]
  15. Vancleef, A.; Seurs, S.; Jordens, J.; Van Gerven, T.; Thomassen, L.C.J.; Braeken, L. Reducing the Induction Time Using Ultrasound and High-Shear Mixing in a Continuous Crystallization Process. Crystals 2018, 8, 326. [Google Scholar] [CrossRef] [Green Version]
  16. Yazdanpanah, N.; Nagy, Z.K. The Handbook of Continuous Crystallization; The Royal Society of Chemistry: London, UK, 2020; ISBN 9788578110796. [Google Scholar]
  17. Vancleef, A.; Van Gerven, T.; Thomassen, L.C.J.; Braeken, L. Ultrasound in Continuous Tubular Crystallizers: Parameters affecting the Nucleation Rate. Crystals 2021, 11, 1054. [Google Scholar] [CrossRef]
  18. Gielen, B. Particle Engineering by Targeted Application of Ultrasound; KU LEUVEN: Leuven, Belgium, 2017. [Google Scholar]
  19. Mullin, J.W. Crystallization; Elsevier: Amsterdam, The Netherlands, 2001; ISBN 9781626239777. [Google Scholar]
  20. Han, B.; Ezeanowi, N.C.; Koiranen, T.O.; Häkkinen, A.T.; Louhi-Kultanen, M. Insights into Design Criteria for a Continuous, Sonicated Modular Tubular Cooling Crystallizer. Cryst. Growth Des. 2018, 18, 7286–7295. [Google Scholar] [CrossRef]
  21. Regensburg, S.I. Cooling Crystallization in an Oscillatory Flow Baffled Crystallizer (OFBC)—Influence of Fluid Dynamics on Crystal Product. Master’s Thesis, Delft University of Technology, Delft, The Netherlands, 2015. [Google Scholar]
  22. Besenhard, M.O.; Neugebauer, P.; Ho, C.-D.; Khinast, J.G. Crystal Size Control in a Continuous Tubular Crystallizer. Cryst. Growth Des. 2015, 15, 1683–1691. [Google Scholar] [CrossRef]
  23. Doyle, B.J.; Gutmann, B.; Bittel, M.; Hubler, T.; Macchi, A.; Roberge, D.M. Handling of Solids and Flow Characterization in a Baffleless Oscillatory Flow Coil Reactor. Ind. Eng. Chem. Res. 2020, 59, 4007–4019. [Google Scholar] [CrossRef]
  24. Gaivoronskii, A.N.; Granzhan, V.A. PHYSICOCHEMICAL STUDIES OF SYSTEMS AND PROCESSES Solubility of Adipic Acid in Organic Solvents and Water. Russ. J. Appl. Chem. 2005, 78, 404–408. [Google Scholar] [CrossRef]
  25. Vancleef, A.; Maes, D.; Van Gerven, T.; Thomassen, L.C.J.; Braeken, L. Flow-through microscopy and image analysis for crystallization processes. Chem. Eng. Sci. 2021, 248, 117067. [Google Scholar] [CrossRef]
  26. Vancleef, A.; Vanhemel, J.; Van Gerven, T.; Thomassen, L.; Braeken, L. Anti-Fouling Strategies for Tubular Flow Crystallizers. In Proceedings of the Second International Process Intensification Conference, Leuven, Belgium, 27–29 May 2019. [Google Scholar]
  27. Nichols, G.; Byard, S.; Bloxham, M.J.; Botterill, J.; Dawson, N.J.; Dennis, A.; Diart, V.; North, N.C.; Sherwood, J.D. A review of the terms agglomerate and aggregate with a recommendation for nomenclature used in powder and particle characterization. J. Pharm. Sci. 2002, 91, 2103–2109. [Google Scholar] [CrossRef] [PubMed]
  28. Gielen, B.; Jordens, J.; Thomassen, L.C.J.; Braeken, L.; Van Gerven, T. Agglomeration control during ultrasonic crystallization of an active pharmaceutical ingredient. Crystals 2017, 7, 40. [Google Scholar] [CrossRef] [Green Version]
Figure 1. Visualization of common cooling profiles.
Processes 09 02268 g001
Figure 2. Experimental setup.
Processes 09 02268 g002
Figure 3. Design of the heat exchanger and the obtained temperature profiles in the heat exchanger. Note that the expected suspension profile is a proportional projection of the cooling gas profile.
Processes 09 02268 g003
Figure 4. Operating times of the crystallizer at different conditions.
Processes 09 02268 g004
Figure 5. Online microscopic images of the crystals after three residence times.
Processes 09 02268 g005
Figure 6. Volume based particle size distributions of the crystals measured online.
Processes 09 02268 g006
Figure 7. Evolution of the volume based mean particle size during the experiments. The faded-out part of the graph is when an obstruction occurred in the microscope, without blocking the whole system.
Processes 09 02268 g007
Figure 8. Offline microscopic images of the crystals after suspending them in heptane.
Processes 09 02268 g008
Figure 9. Offline particle size analysis after suspending the filtered crystals in heptane.
Processes 09 02268 g009
Figure 10. Evolution of yield, relative to the solubility, during the experiments using different methods. (a) The yield based on the amount of supersaturation depleted. (b) The yield based on the mass of crystals collected. (c) The sum of volumes, which measures the volume of particles under the microscope and is used to follow up the yield qualitatively.
Processes 09 02268 g010
Publisher’s Note: MDPI stays neutral with regard to jurisdictional claims in published maps and institutional affiliations.

