
Effect of Biochar Prepared from Food Waste through Different Thermal Treatment Processes on Crop Growth


1
School of Energy and Environment, Southeast University, Nanjing 210096, China
2
Key Laboratory of Energy Thermal Conversion and Control of Ministry of Education, Nanjing 210096, China
*
Author to whom correspondence should be addressed.
Processes 2021, 9(2), 276; https://0-doi-org.brum.beds.ac.uk/10.3390/pr9020276
Submission received: 18 December 2020
/
Revised: 11 January 2021
/
Accepted: 19 January 2021
/
Published: 1 February 2021
(This article belongs to the Special Issue Anaerobic Processes, Monitoring and Intelligence Control)
Abstract
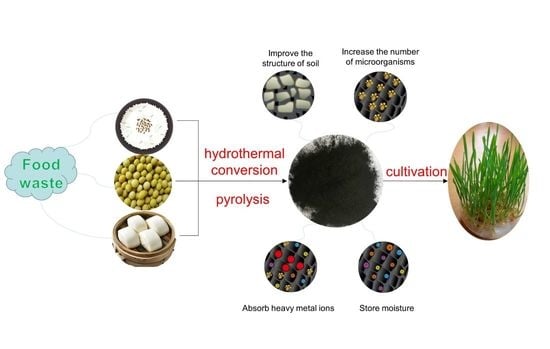
:Biochar is generally accepted and increasingly valued in scientific circles as solid products in the thermochemical conversion of biomass, mainly because of its rich carbon content. The purpose of this research is to investigate the impact of biochar from different sources on wheat growth. In particular, this work focused on the effect of different preparation methods and raw material of biochar on the growth of wheat and aim to find a potential soil substitute that can be used for crop cultivation. Two synthetic methods were evaluated: hydrothermal conversion and pyrolysis. The characterization of biochar was determined to explore the impact of its microstructure on wheat growth. The results show that the yield of biochar produced from high-pressure reactor is significantly higher than that obtained by using microwave reactor. For example, the biochar yield obtained through the former is about six times that of the latter when using steamed bread cooked as biomass raw material. In addition, the growth trend of wheat indicates that biochar has different promoting effects on the growth of wheat in its weight and height. The pyrolyzed carbon is more suitable for wheat growth and is even more effective than soil, indicating that pyrolyzed biochar has more potential to be an alternative soil in the future. Moreover, this research tries to explore the reasons that affect crop growth by characterizing biochar (including scanning electron microscopy (SEM), biofilm electrostatic test (BET) and Fourier transform infrared (FT-IR)). The results indicate that the biochar containing more pits and less hydroxyl functional are more suitable for storing moisture, which is one of the significant factors in the growth of crops. This study provides evidence of the effects of biochar on crop growth, both in terms of microstructure and macroscopic growth trends, which provides significant benefits for biochar to grow crops or plants.
1. Introduction
Since the last century, biomass has been the focus of researchers around the world as a promising alternative energy, which is mainly driven by the following issues: the massive consumption of fossil energy, greenhouse gas emissions and a huge amount of potential waste biomass (forestry waste, municipal waste etc.) [1,2]. The selected biomass raw materials can produce solid, liquid or gas products after being treated by thermochemical conversion processes, which is considered to be the most promising method [3,4]. Compared to its solid products, namely biochar, many efforts are more devoted to exploring liquid products formed during the process of biomass conversion. Liquid fuels, namely bio-oils, can be conveniently produced by methods such as pyrolysis and hydrothermal conversion (HTC), which are considered as substitutes for petroleum fuels and can be further extracted from high-value chemicals [5,6]. However, biochar, as another essential product produced by biomass conversion, has received increasingly attention in scientific circles due to its rich carbon content [7]. Biochar is a porous, low-density carbon-rich material [8] with a condensed aromatic structure [9] that allows it to be converted into more high-end applications. For example, the development of biochar as a soil amendment can neutralize acidic soils, increase water holding capacity and fix microorganisms, and provide essential trace elements for plants [10]. In addition, this solid product can also be used to treat sewage containing heavy metals due to its fluffy and porous nature [11].
One of the major applications of biomass-converted solid products is that it can be transformed into a magnetic porous adsorbent to purify wastewater, and therefore, slow down the influence of pollutants such as metal ions in soil, abating climate change. A large quantity of oxygen-containing functional groups is distributed in the micropores on the surface of biochar, in which carboxyl and hydroxyl groups play a critical role in the sorption of pollutants contained in the soil [12]. For example, Saqib et al. used rice straw, rice hull and maize stover as raw materials to produce three different types of biochar and then investigated the effect of these biochar on the mobility of Cd and soil chemical and biochemical properties. A significantly decrease was found in the concentration of Cd ion by 24–32%, 19–23% and 22–27% for rice straw biochar, rice hull biochar, and maize stover biochar, respectively, at the 1.5% and 3% rate [13]. Moreover, Mohan et al. studied biochar produced from fast pyrolysis of wood and bark as absorbents to remove the toxic metals ions (Cd2+, Pb2+, As3+) from wastewater and compared it with the effect of commercial activated carbon. They found that biochar produced from pyrolysis of oak bark can nearly remove 100% of the heavy metal and about 70% of arsenic and almost half of cadmium from aqueous solutions. The ability of biochar from pyrolysis of oak bark to remove Pb2+ and Cd2+ is remarkable compared to commercial activated carbon when considering the amount of metal absorbed per unit surface area [14]. In addition, biochar, in combination with its storage in soil, has been suggested as an effective method due to its climate-mitigation potential of reducing the concentration of CO2 in the atmosphere [15,16,17], which can slow the rate of photosynthetically fixed carbon returning to the atmosphere owing to its highly recalcitrant nature [18,19,20].
One of another significant applications of biomass-converted solid products is to be used as soil amendments to increase crop yields. A large number of studies [21,22,23,24,25] have shown that the addition of biomass-converted solid products to the soil has a significant effect on increasing crop yield, as shown in Table 1. The loose texture and alkaline nature allow the distribution and connectivity of the pores of biochar to help maintain soil moisture [26]. Glaser et al. found that soils with added biochar had a three-fold higher specific surface area than normal soils, and that biochar increased soil water storage by 18%, which is one of the reasons that biochar is considered to promote plant growth [27]. For example, Zhang et al. carried out a field trial to investigate the effect of biochar on rice yield. Their study involved the effects of three biochar (0, 10, 40 t/ha) with/without N fertilization on the yield of rice and the emissions of CH4 and N2O. The results indicate that the yield of rice has significantly increased and the emission of N2O has greatly decreased while the total emission of CH4 has also increased [21]. Rondon et al. did a field trial relating to the effect of different proportion of biochar (0, 30, 60 and 90 g/kg soil) added to the soil on the potential, magnitude and causes of enhanced biological N2 fixation in normal bean plants. The results showed that the yield of bean and biomass increased more than 46% and 39%, respectively, when the ratio of biochar to soil is controlled at 90 and 60 g/kg [25]. Steiner et al. tested 15 different amendment combinations produced from soil and other different biochar derived from charcoal, chicken manure, compost and forest litter and studied the influence of these mixture of soil and biochar on the growth and yield of rice plants in repeated trials. They found that application of biochar can significantly increase the production of some crops in acidic or highly arid regions through increasing nutrient reserves in crop root and avoiding the loss of nutrients and water [22]. In addition, biomass-derived solid products can also be used as soil amendments combination with fertilizer to increase crop field. Recently, Agegnehu et al. published a review of the results of 634 publications on the effects of biochar and biochar-compost mixtures as soil amendments on agriculture over the past decade, showing the result that the improvement effect is different due to the regional difference [28].
Though biochar, as an effective soil amendment, has been confirmed in many previous studies, better growth of crops after soil addition of biochar may be the result of a combination of factors, such as microbial reproduction and development [29,30]. In addition, the complex climate and environmental conditions in the actual field will also show certain differences from the results in the laboratory environment. Moreover, there have been a few reports of the effects of biochar produced from different food wastes (FW) on crop growth. It is well known that water plays a pivotal role on various photochemical processes of plants such as leaf photosynthesis [31], which is regulated by plant water status and soil moisture content and availability [32]. It is reported that biochar derived from waste food has huge advantages in water storage capacity than soil [26,33,34,35,36,37]. Thus, it is expected that biochar derived from food waste may have better effect on plant growth. In this study, wheat was directly cultured by using different biochar in a laboratory environment to explore its effects on plant growth. To make the experimental results more obvious, four experiments of soil, water environment (namely blank group), silica and pure biochar culture were set up. Two commonly used HTC processes, including pyrolysis and hydrothermal conversion, are seen as potential pathways for the preparation of bio-oil. The hydrothermal carbonization of biomass has drawn significant attention from scientific and industrial circles in recent years, especially the supercritical water gasification (SCWG) process [38,39]. Kruse et al. found that water fulfills every possible role in the hydrothermal conversion process, such as solvent, catalyst or catalyst precursor and even reactant [40]. The properties of hydrothermal carbon have been greatly improved due to the increase in fixed carbon and carbon content, which is significantly beneficial for the carbonization of food waste with water content [39]. However, the water content is greatly reduced after the drying process of biomass; the production of biochar at lower temperature and pressure shows great advantages over SCWG process. Therefore, solid products were prepared by these method of the typical biomass (food waste (FW)) in China. In addition, chemical and physical properties of the solid samples were characterized by several techniques, including Fourier Transform infrared spectroscopy (FT-IR), scanning electron microscope (SEM) and biofilm electrostatic test (BET) analysis, which promote the study on the role of biochar or modified biochar in wheat culture. This study will help researchers to understand the huge difference in the yield of biochar produced by different treatment methods of food waste and its impact on crop growth, which will promote further research and application of biochar.
2. Materials and Methods
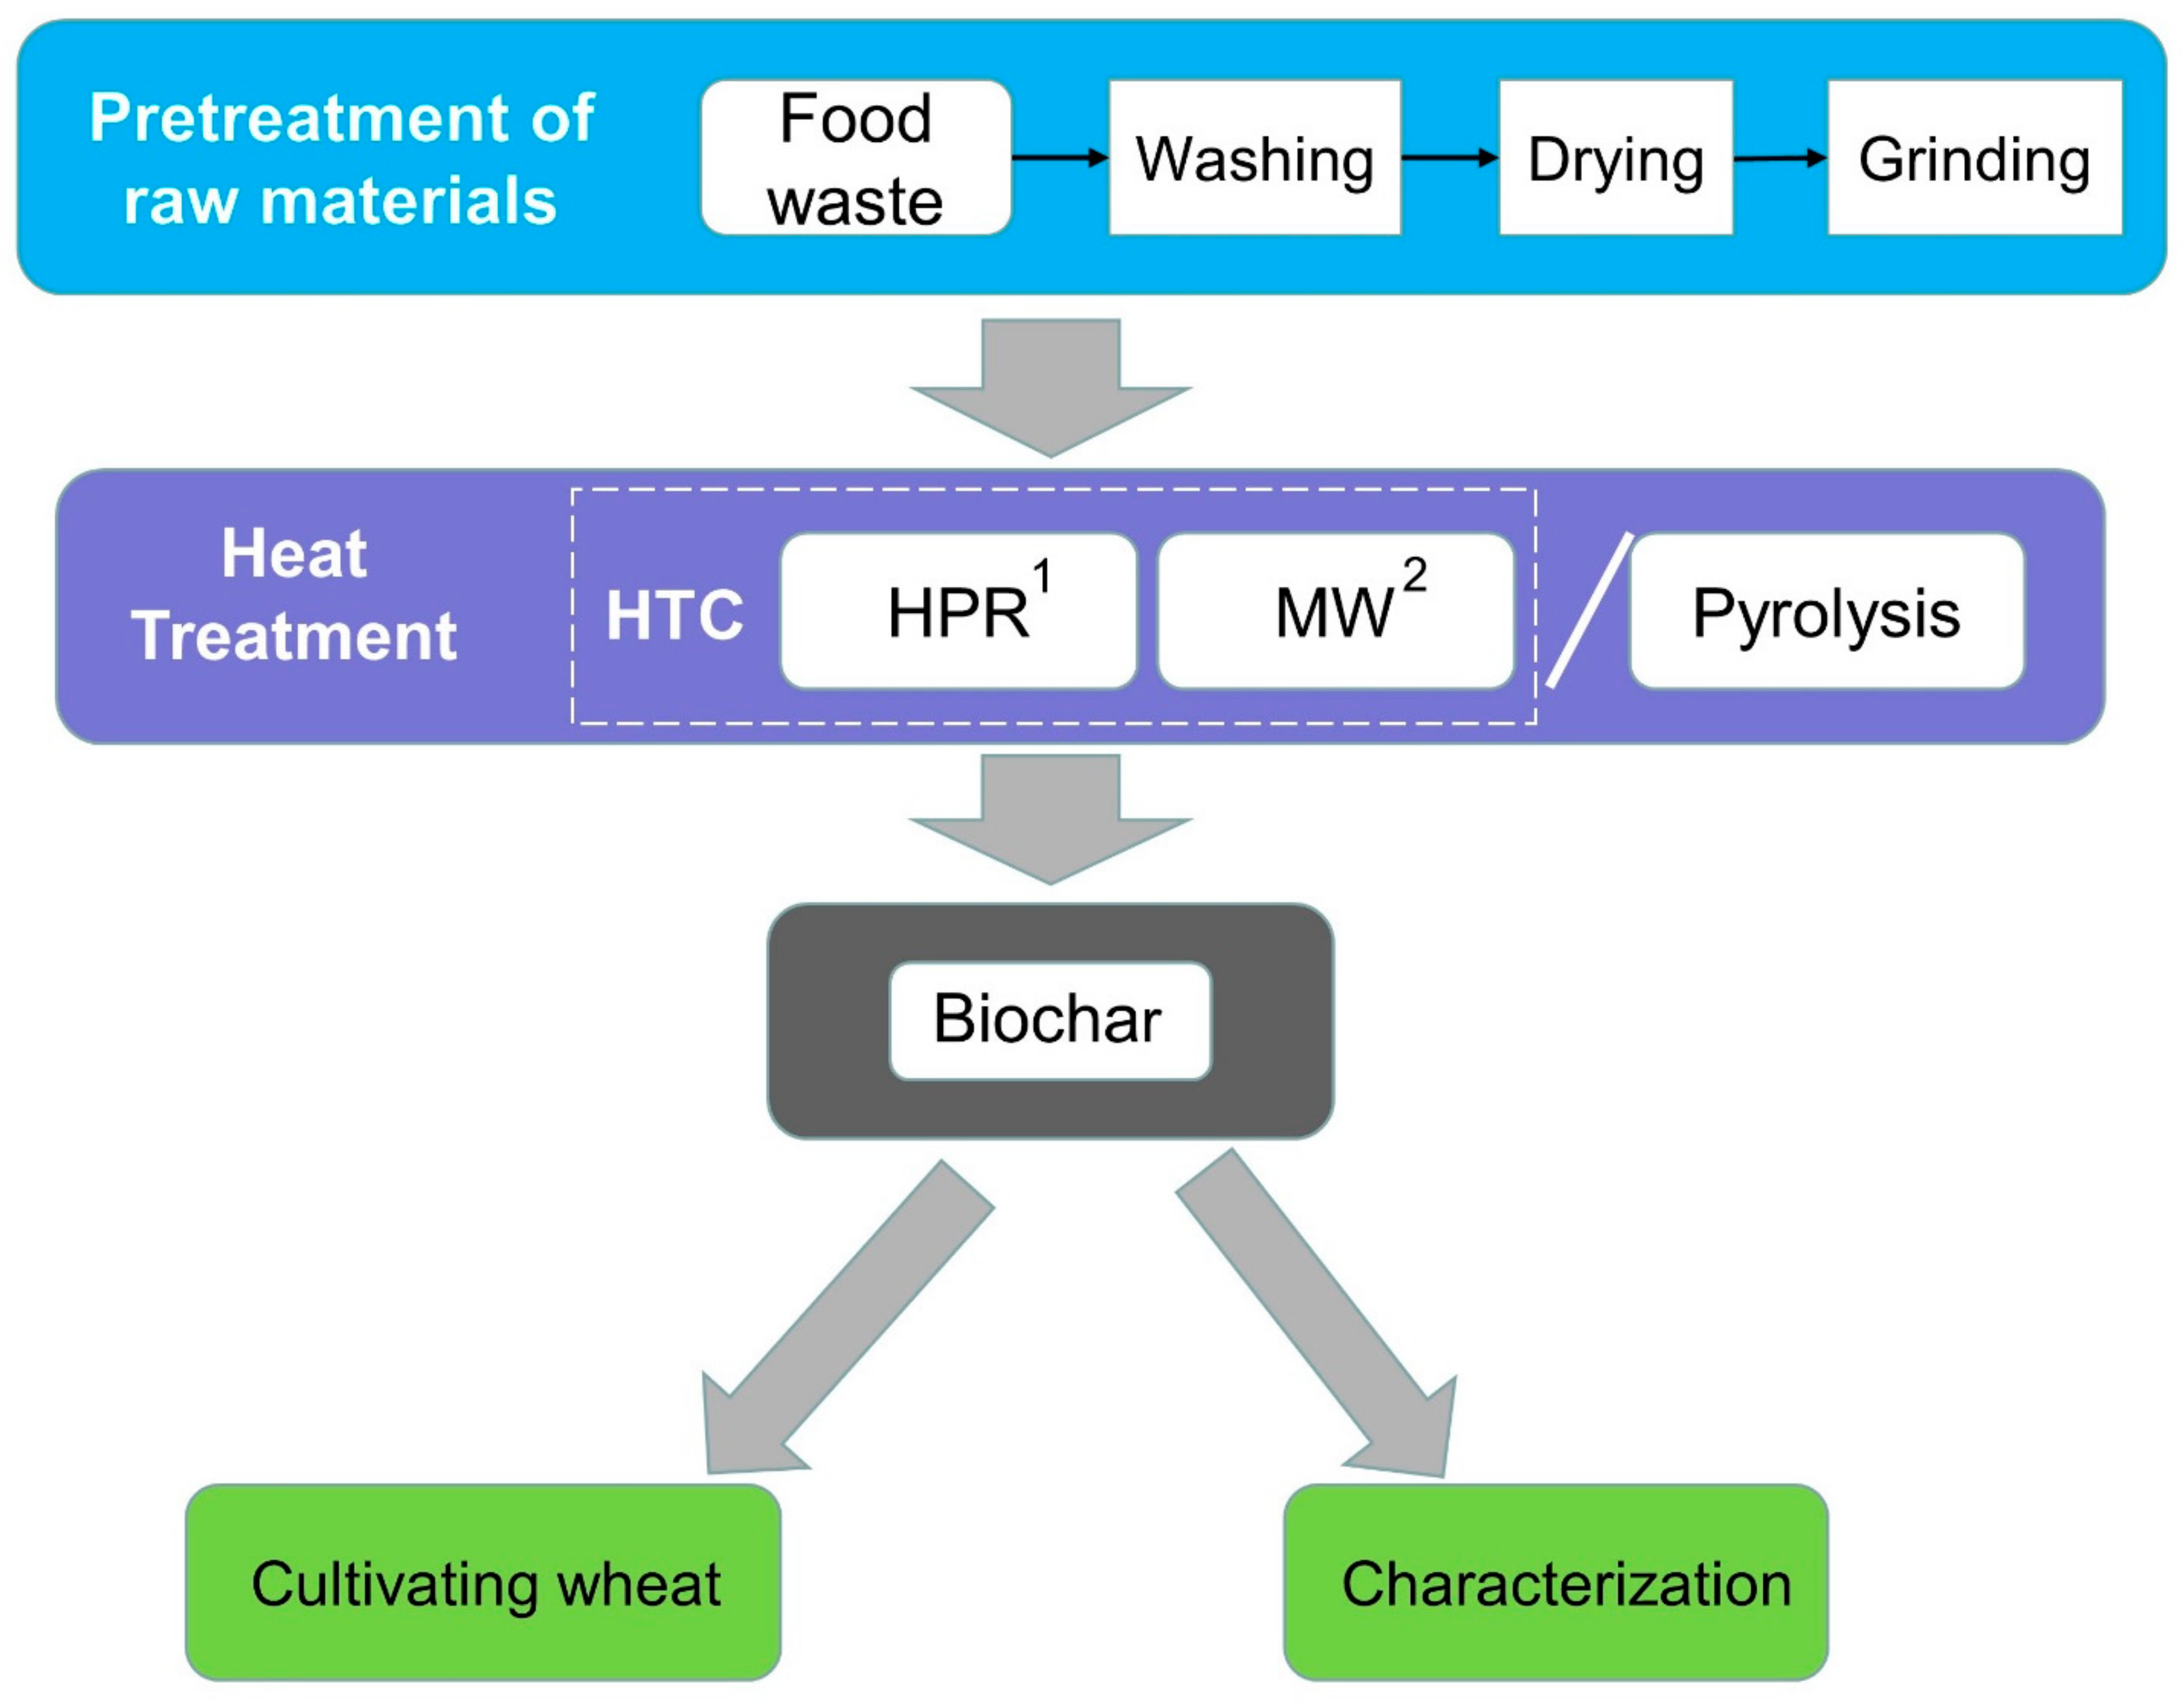
FW was taken from the dining hall of the Southeast University (Nanjing, China) and washed several times with clear water to wash away the oil stains. All of these biomass feedstocks were processed and used as soon as they were obtained. In this experiment, wheat was selected for cultivation, and the wheat seeds were derived from Changfeng 2112 wheat seeds of Shaanxi Changfeng Seed Co., Ltd., Shaanxi province of China. The experimental setup design is shown in Figure 1.
2.1. Raw Material Selection and Processing
In order to produce enough biochar, the raw materials are FW containing a high proportion of carbohydrates, proteins and lipids, which have more carbon elements. Rice, steamed bread with high carbohydrate content and soybean with high protein content were selected as FW for research. Its moisture content was determined by moisture meter (HE53/02), and the results are shown in Table 2. Although the moisture-containing sample is more suitable for HTC treatment [41], in order to compare with the pyrolysis product, a freeze dryer (FDU-1200) was used for moisture removal of all biomass. The drying time was set to 48 h to better remove moisture and some small molecule compounds. The dried sample was ground into a powder (as shown in Figure S1) using a high-speed multi-function pulverizer (CS-700). The powder sample was sealed and stored in the refrigerator.
2.2. Hydrothermal Conversion
Biomass is converted to a carbon-rich solid product at 180–260 °C during HTC treatment, while producing some liquid by-products and negligible gases [42]. The study used a microwave (MW) (Model: MDS-6G purchased from Sineo Microwave Chemistry Technology (China) Co., Ltd., Shanghai, China) and high-pressure reactor (HPR) (Model: SLM-100 purchased from Beijing Century Senlang Experimental Instrument Co., Ltd., Beijing, China) to treat the feedstock at different treatment times, temperatures and acid additions to obtain a solid product. By comparing biochar yields under different conditions, the reaction conditions of the maximum biochar yield were confirmed to prepare more biochar to plant wheat. The maximum temperature of MW used in this experiment is limited to 210 °C because there is a risk of explosion when the pressure is greater than 2.5 Mpa. The initial reaction temperature is 160 °C, 180 °C and 200 °C. Due to the fast rate of microwave heating and reaction, the reaction time was set to 15 min, 20 min and 25 min. In addition, the heating of HPR is relatively slow and a higher reaction temperature can be used. Some homothetic biomass has been processed at 180 °C, 210 °C and 240 °C as treatment temperatures in previous studies [43,44], as was done in this study. To obtain food waste-based hydrocarbon, after being washed, dried and ground, 1–2 g of treated powder was subsequently dispersed in 15–30 mL of deionized water (or 2% and 3% (v/v%) of H2SO4 solution) and placed in a 100 mL Teflon-lined stainless steel autoclave reactor/microwave reactor equipped with a pressure gauge as shown in Figure 2. The reactor was then sealed and flushed with nitrogen for 10 min to remove air, heated up by 10 °C/min to 160–240 °C and maintained for 15–90 min at this temperature. The hydrothermal reaction was run under a water-saturated pressure of 6–34 bars. After the reaction, the reactor was gradually cooled to the room temperature and the solid products was filtered, washed with deionized water and finally dried at 70 °C for 48 h in a vacuum drying oven.
2.3. Pyrolysis
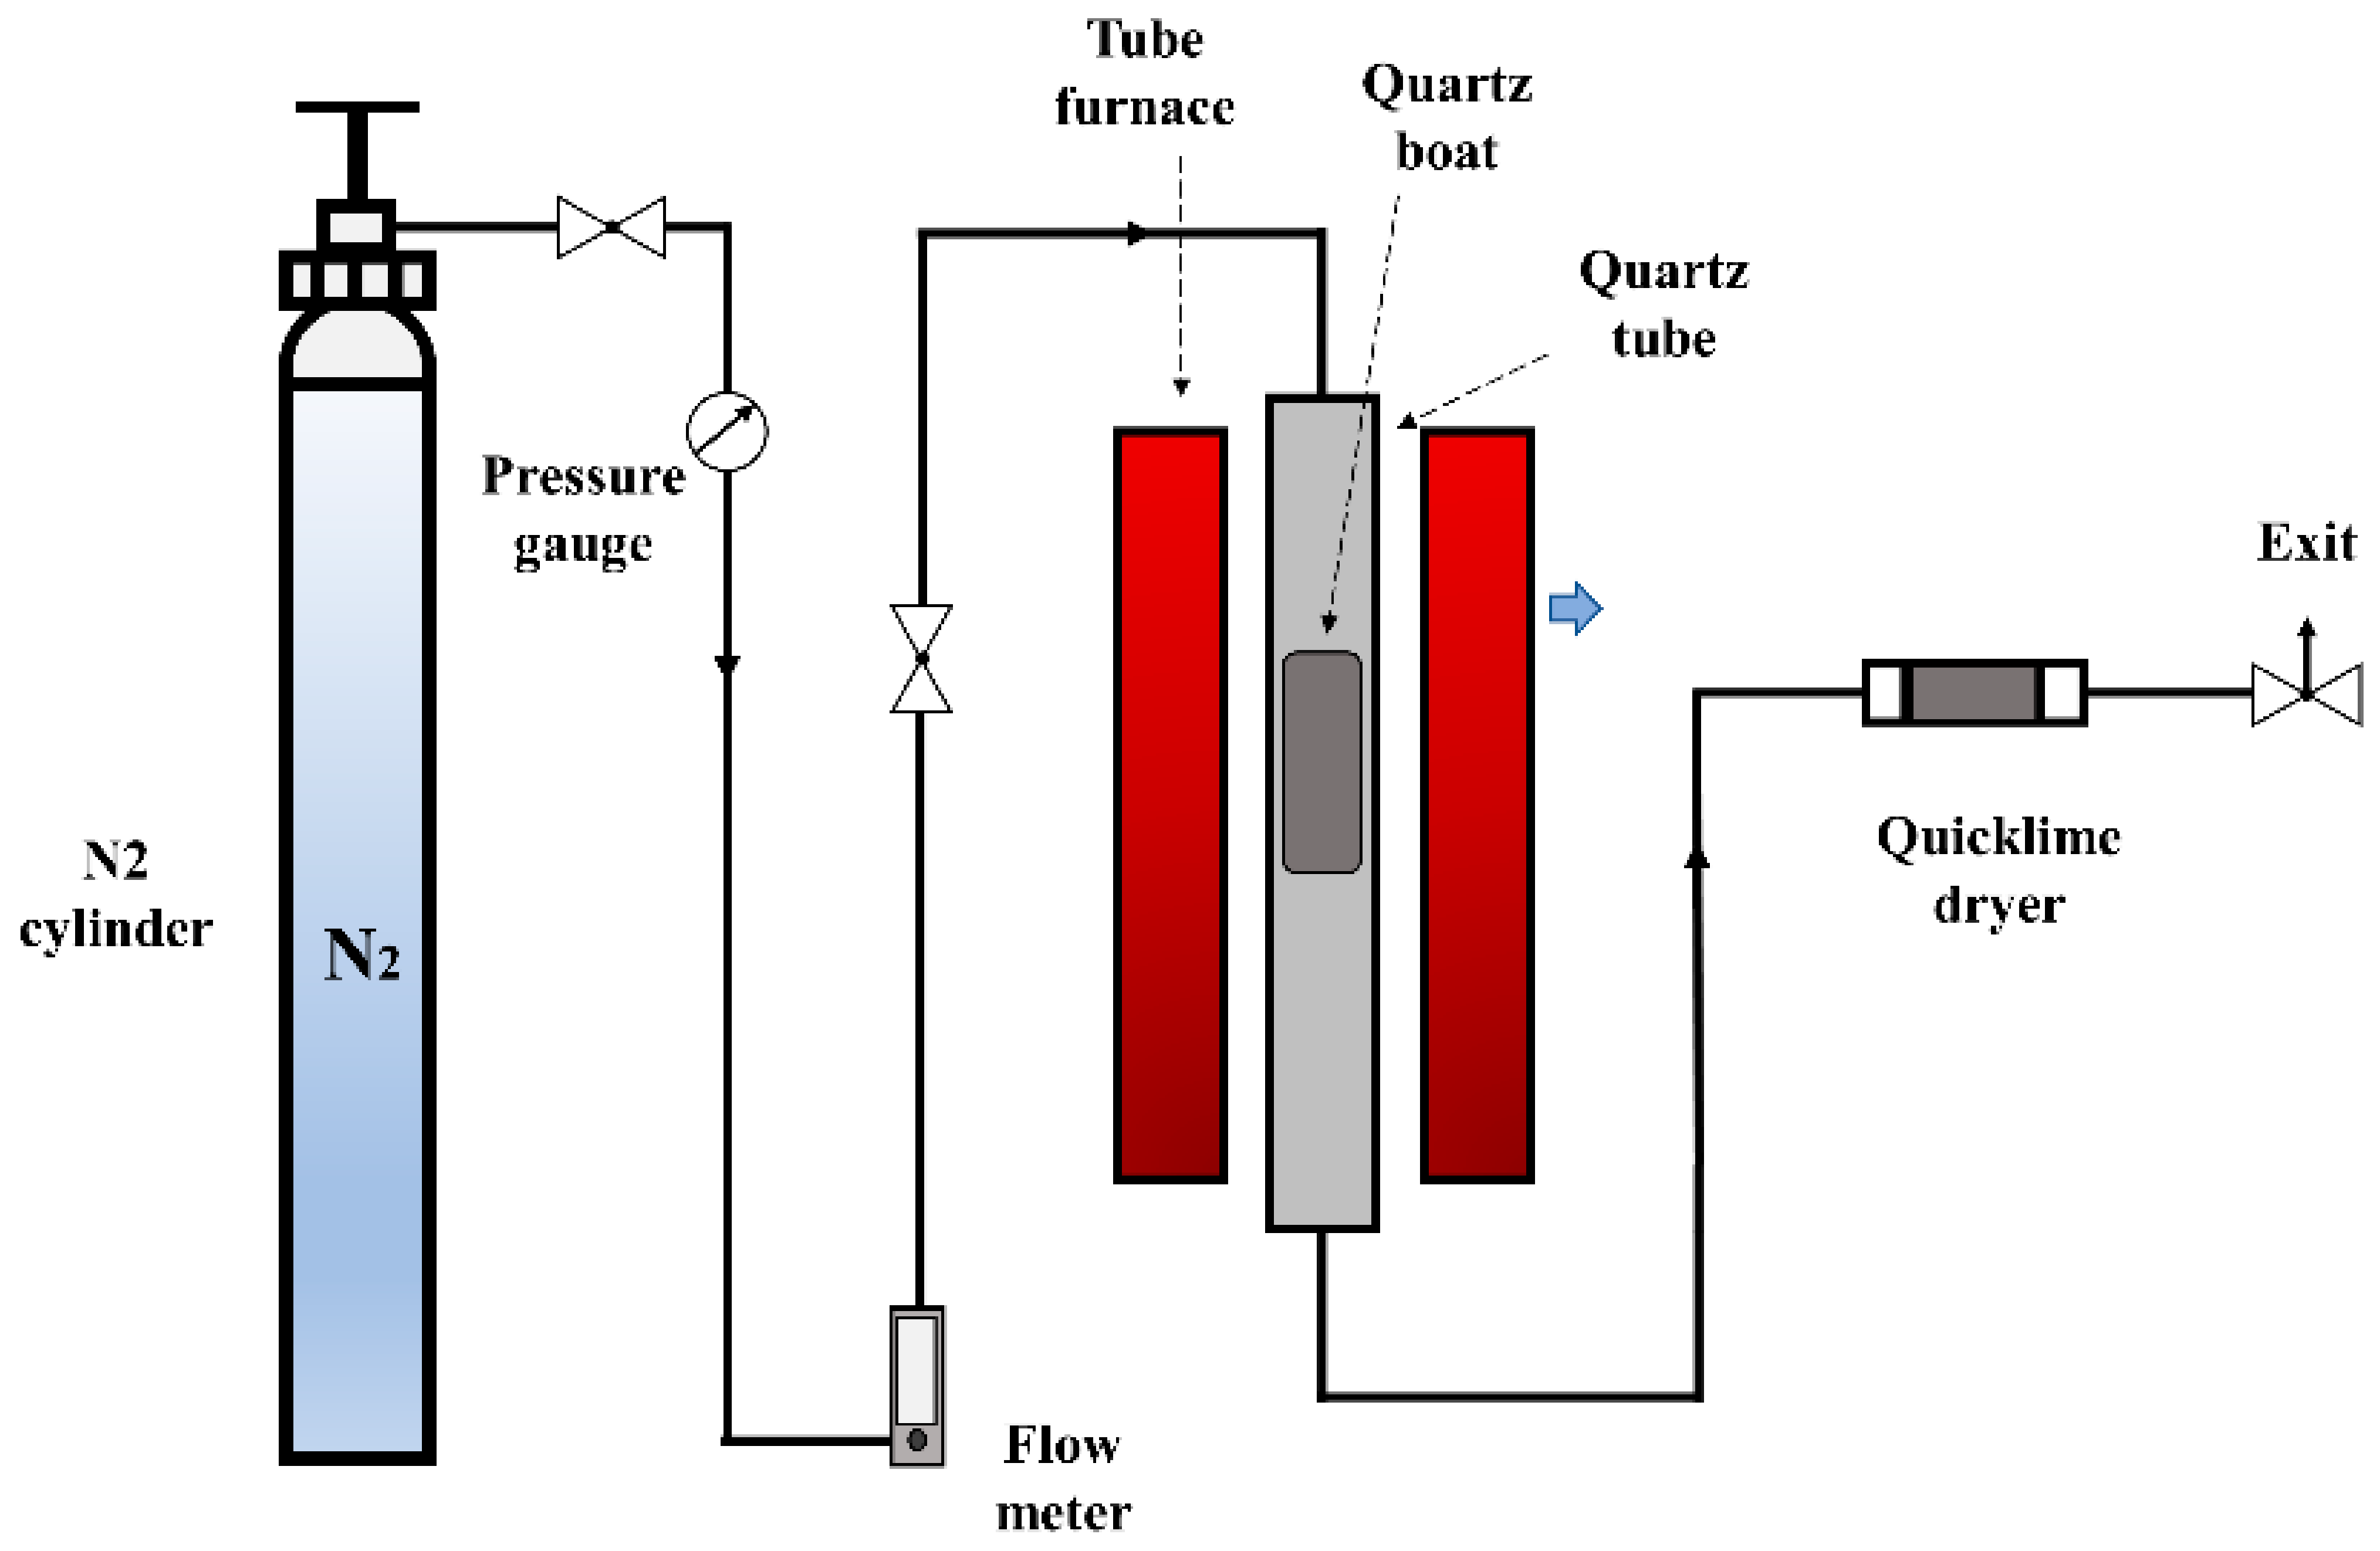
Pyrolysis is a thermochemical conversion process that is often an efficient method for producing liquid fuels from solid biomass feedstocks and also produces carbon-rich solid by-product-biochar [45]. In this study, the pyrolysis experiments of sample powder were carried out under N2 atmosphere in a horizontal tubular reactor (60 mm (ID) × 1000 mm (L)), and its schematic diagram is displayed in Figure 3. The quartz boat filled with 5 g of sample powder was first placed inside the quartz tube embedded in the tube groove inside the electric furnace (Model: DTF-1200X purchased from Hefei Kejing materials technology Co., Ltd., Anhui province, China). Then, the quartz tube was connected to the N2 cylinder through the gas pipe and continuously flushed with nitrogen at a flow rate of 200 mL/min for 10 min to eliminate any oxygen in the tube. The initial temperature was room temperature and was raised to 400 °C for 20 min through the control program; this temperature was maintained for 20 min to ensure the pyrolysis is fully completed. The biochar obtained should be naturally cooled to room temperature and then collected for use in the next stage after pyrolysis is finished.
2.4. Biochar Treatment
The solid products (namely biochar) were dried for 48 h at a pressure and temperature of 25 kPa and 70 degrees in vacuum drying oven, respectively. The biochar obtained under different experimental conditions was weighed after drying to calculate the yield by Formula (1). The resulting products were used to calculate biochar yield and cultivate wheat as well as structural characterization:
2.5. Plant Cultivation
The wheat seeds were immersed in pure water for 12 h, and then removed for shading germination. The wheat seeds from which the shoots grew were transplanted into a petri dish containing various biochar for cultivation. About 2 g of biochar was uniformly spread in a petri dish with a diameter of 6 cm and a height of 1.5 cm, with an area of approximately 2.8 cm2 assigned to each seed. The cultivation of wheat was carried out in a small constant temperature incubator (MGC-450HP purchased from Shanghai Shupei Laboratory Equipment Co., Ltd., Shanghai, China) at 25 °C and 60% humidity. The experiment uses a method of controlling variables, and the only variable is the type of biochar that is used to cultivate wheat. It has been found in previous reports that the effect of biochar on agricultural growth was consistent regardless of whether or not fertilizer was added [46]. Moreover, the addition of biochar can reduce the amount of fertilizer applied [46]. Therefore, water was applied during the growth of wheat without adding fertilizer in this study. Repeated experiments were carried out by planting 10 seeds for each biochar group and the control group. Wheat was watered 5 mL at 9 am and 9 pm every day. The height of the two highest and the other six well-growing wheats were measured and recorded each watering time on the second day after transplantation. The top two wheats were numbered H1-2, while the other six wheats were recorded as H6. After seven days of recording, the weight of these wheats was weighed and recorded.
2.6. Characterization of Biochar
Biochar was determined by using FT-IR, SEM and BET. The morphology of biomass-converted solid was examined by SEM (FEI Inspect F50) with an acceleration voltage of 20 kV. The specific surface area and pore volume of this solid product were determined by using ASAP 2020M. At a temperature of 77.7 K, the nitrogen adsorption isotherm and mercury porosimetry were performed while the BET surface area was calculated using the adsorption point at the appropriate p/p0. The surface functional groups of the biochar were determined by using a PerkinElmer Spectrum One FT-IR spectrometer with a resolution of 4 cm−1, and a total of 32 scans were performed for each sample of 4000 cm−1 to 400 cm−1.
2.7. Statistical Analysis
The findings were expressed as mean ± standard deviation (SD). The main effects were calculated by using a fully randomized design (SAS Institute, Cary, NC, USA) analysis of variance. All the recorded and calculated data were summarized and analyzed through general linear model (GLM) univariate analysis of variance (ANOVA), and a Least Significant Difference (LSD) Test was performed for determining the significant difference using GENSTAT 9.1 software (Lawes Agricultural Trust, Rothamsted, UK, 2006). To analyze the comparison of growth curves, the log-rank (Mantel-Cox) test was applied. Statistical significance was taken into account at p-values < 0.05.
3. Results and Discussion
3.1. The Conditions of Optimum Biochar Yield for Biochar Prepared from Food Waste
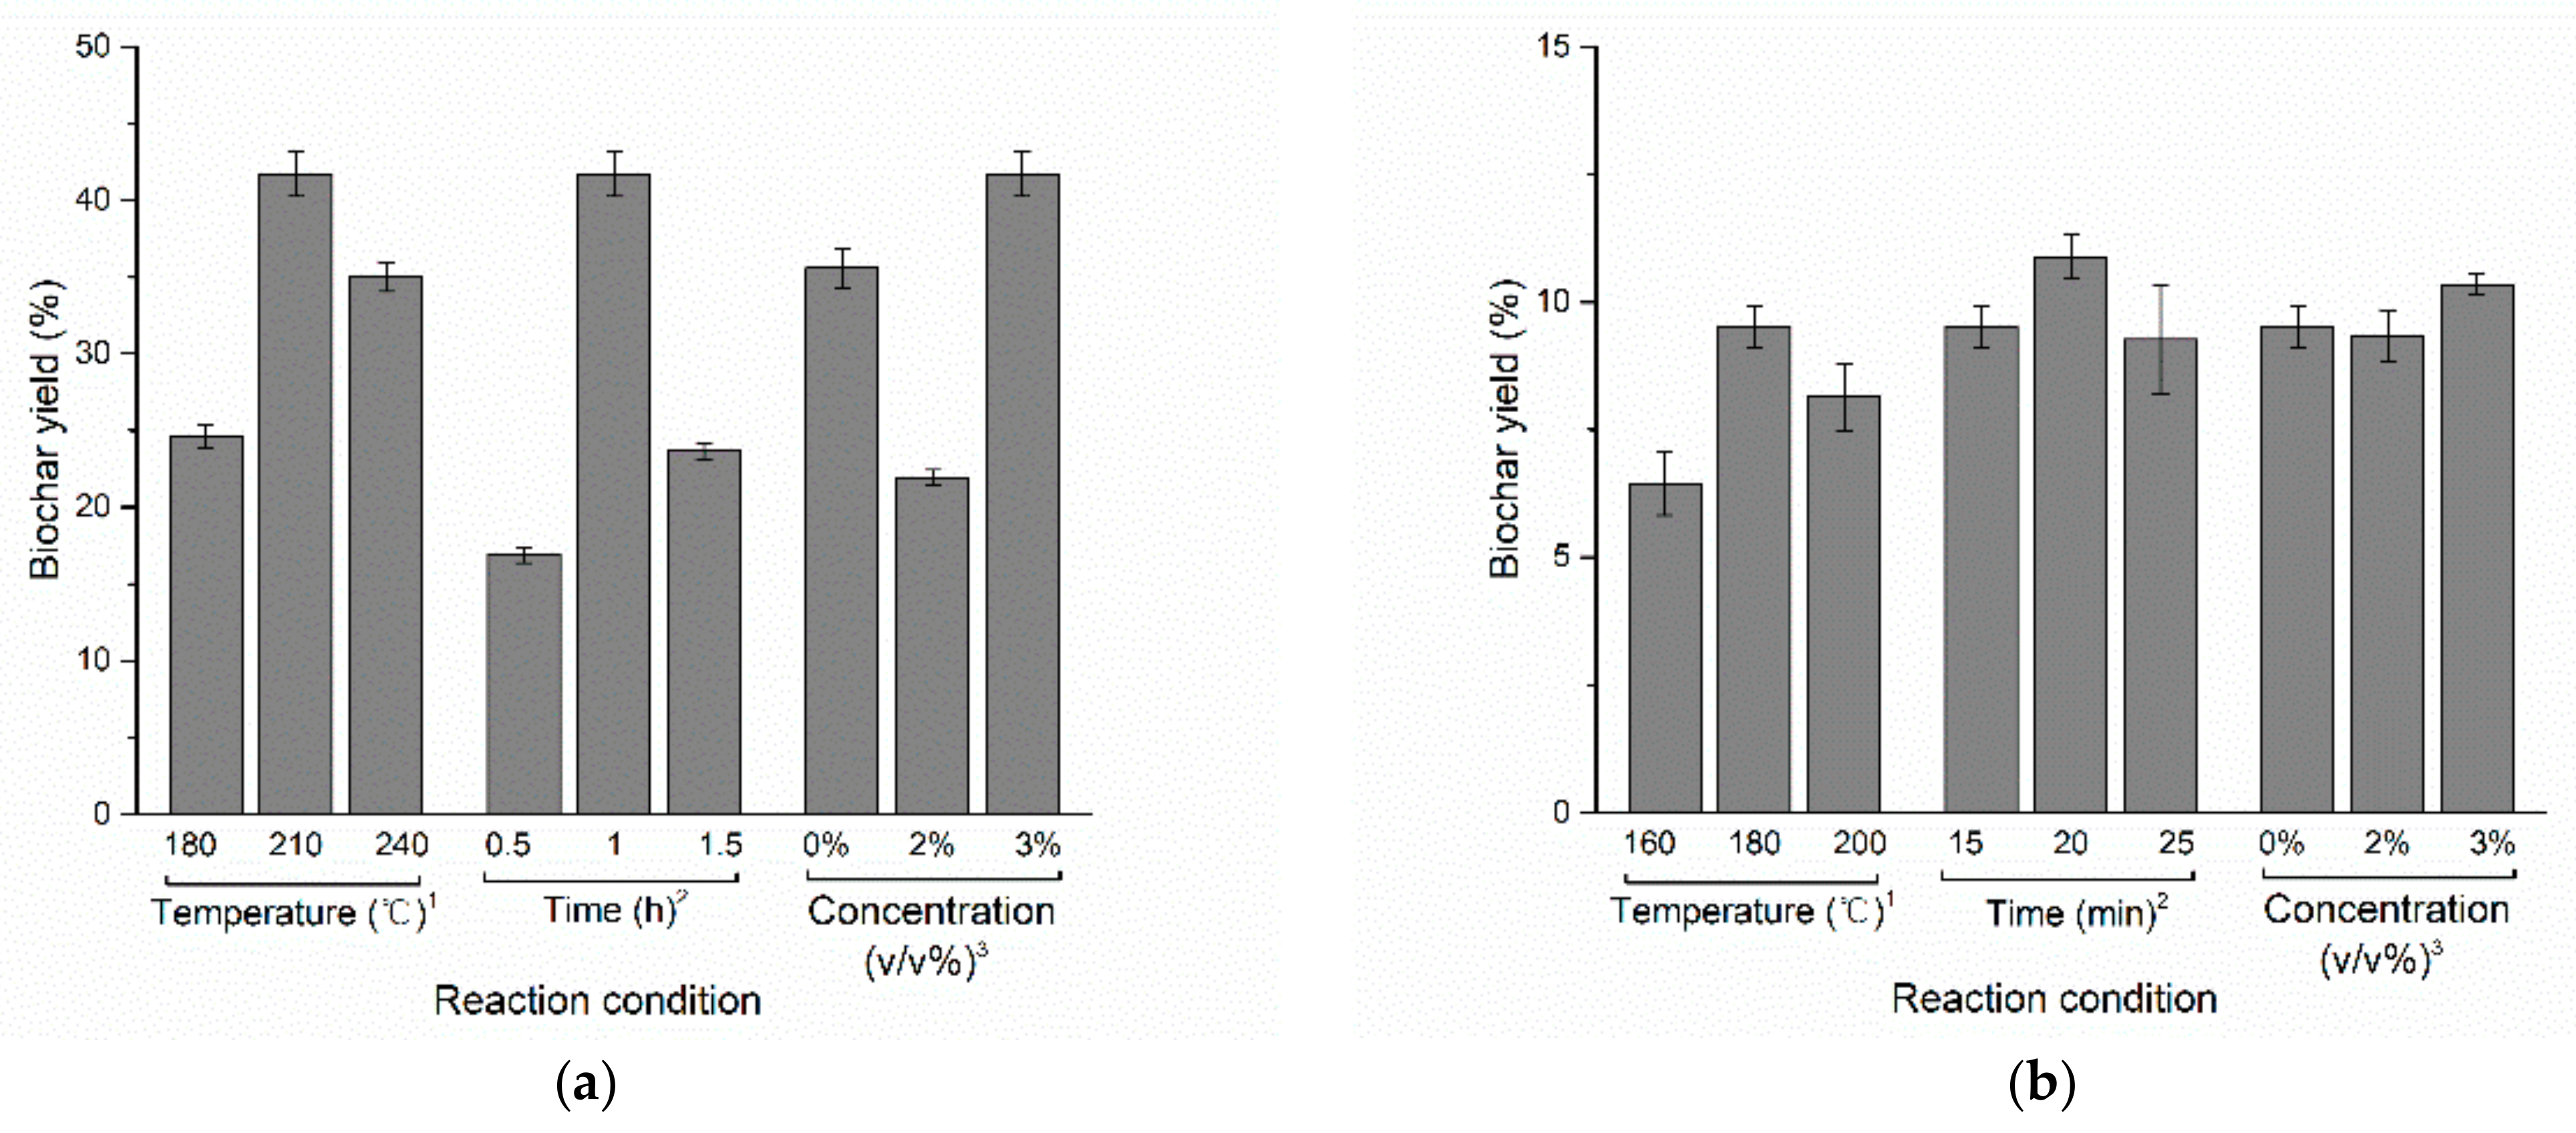
Recently, more and more attention has been placed on the thermochemical conversion of forestry waste, but a few studies have focused on the conversion of FW, especially the HTC process [47]. In this study, the focus was on the effect of biochar produced from FW on wheat growth. Therefore, the experimental conditions for obtaining the best biochar yield are required in the early stage. This section is to show the results of the previous optimization. As shown in Tables S1 and S2, the observed solids under various reaction conditions were described in terms of shape characteristics, which shows that all solid products exhibit a black or brownish black color with different shapes. Most of these products are in powder form, while others are in the form of granular and block. As can be seen from the results of the biochar yield of cooked rice shown in Figure 4, more biochar was prepared, using HPR as a reactor, with its yield reaching a maximum at 210 °C (41.71 ± 1.45% for 1 h, 3 v/v% sulfuric acid). This phenomenon is consistent with the conclusions of Yao et al. [48]. Whether for HPR or MW as a carrier for the HTC process, the addition of 3 v/v% concentrated sulfuric acid facilitated the production of biochar when using cooked rice as the raw material. In the experiment, for MW and HPR, more biochar was produced in 20 min (the yield of biochar: 10.89 ± 0.44%) and 60 min, respectively.
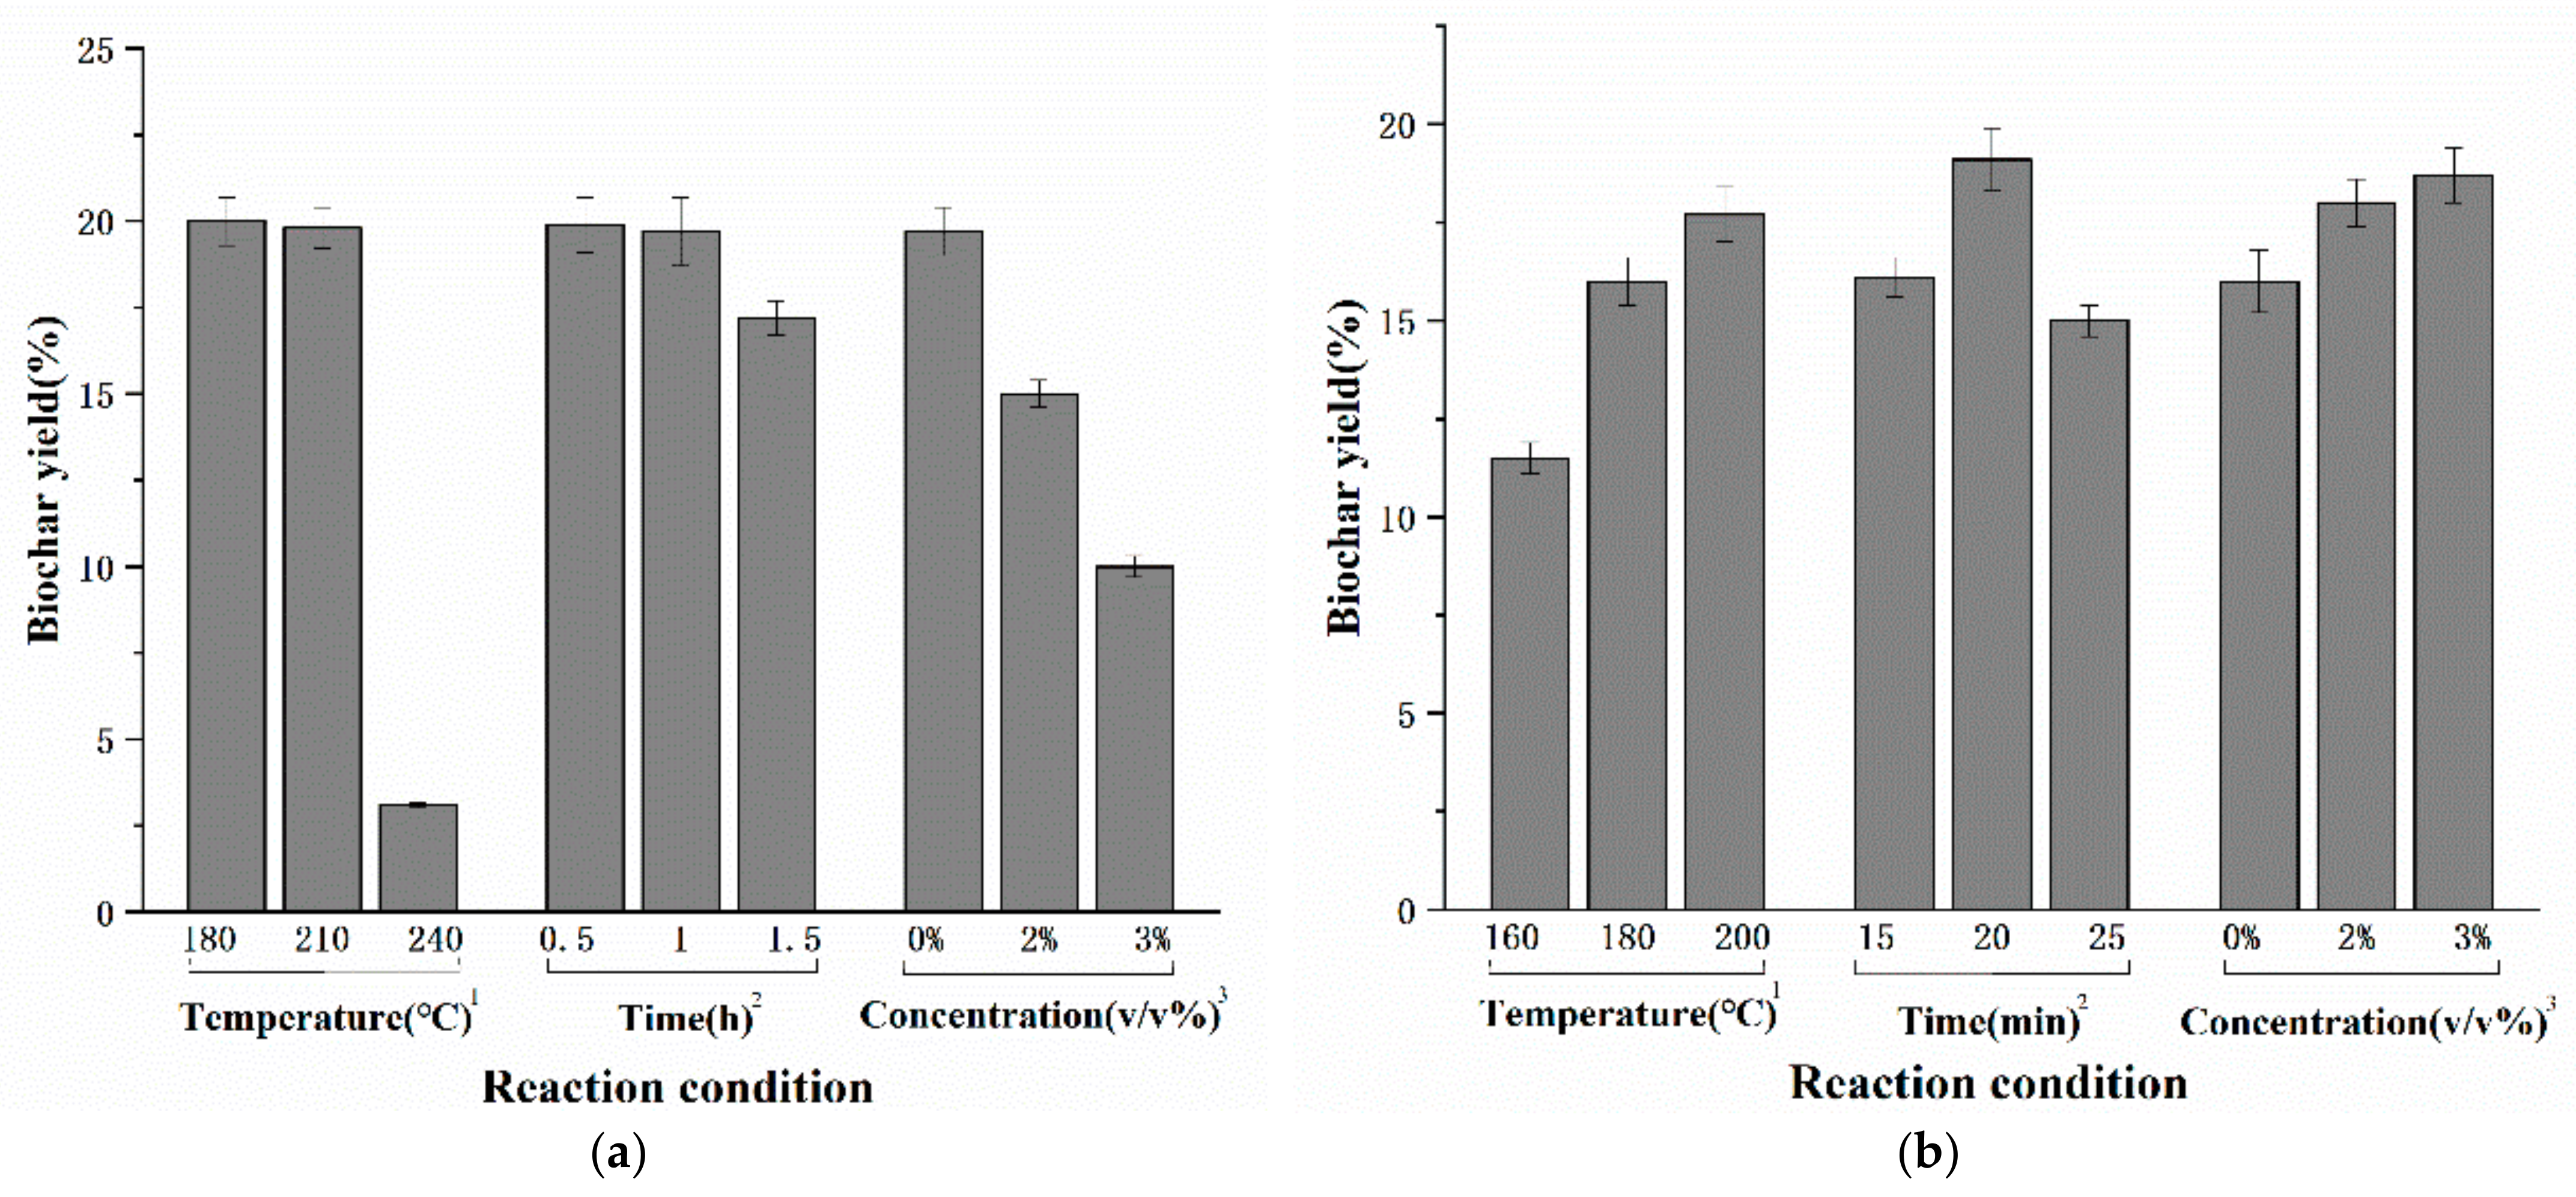
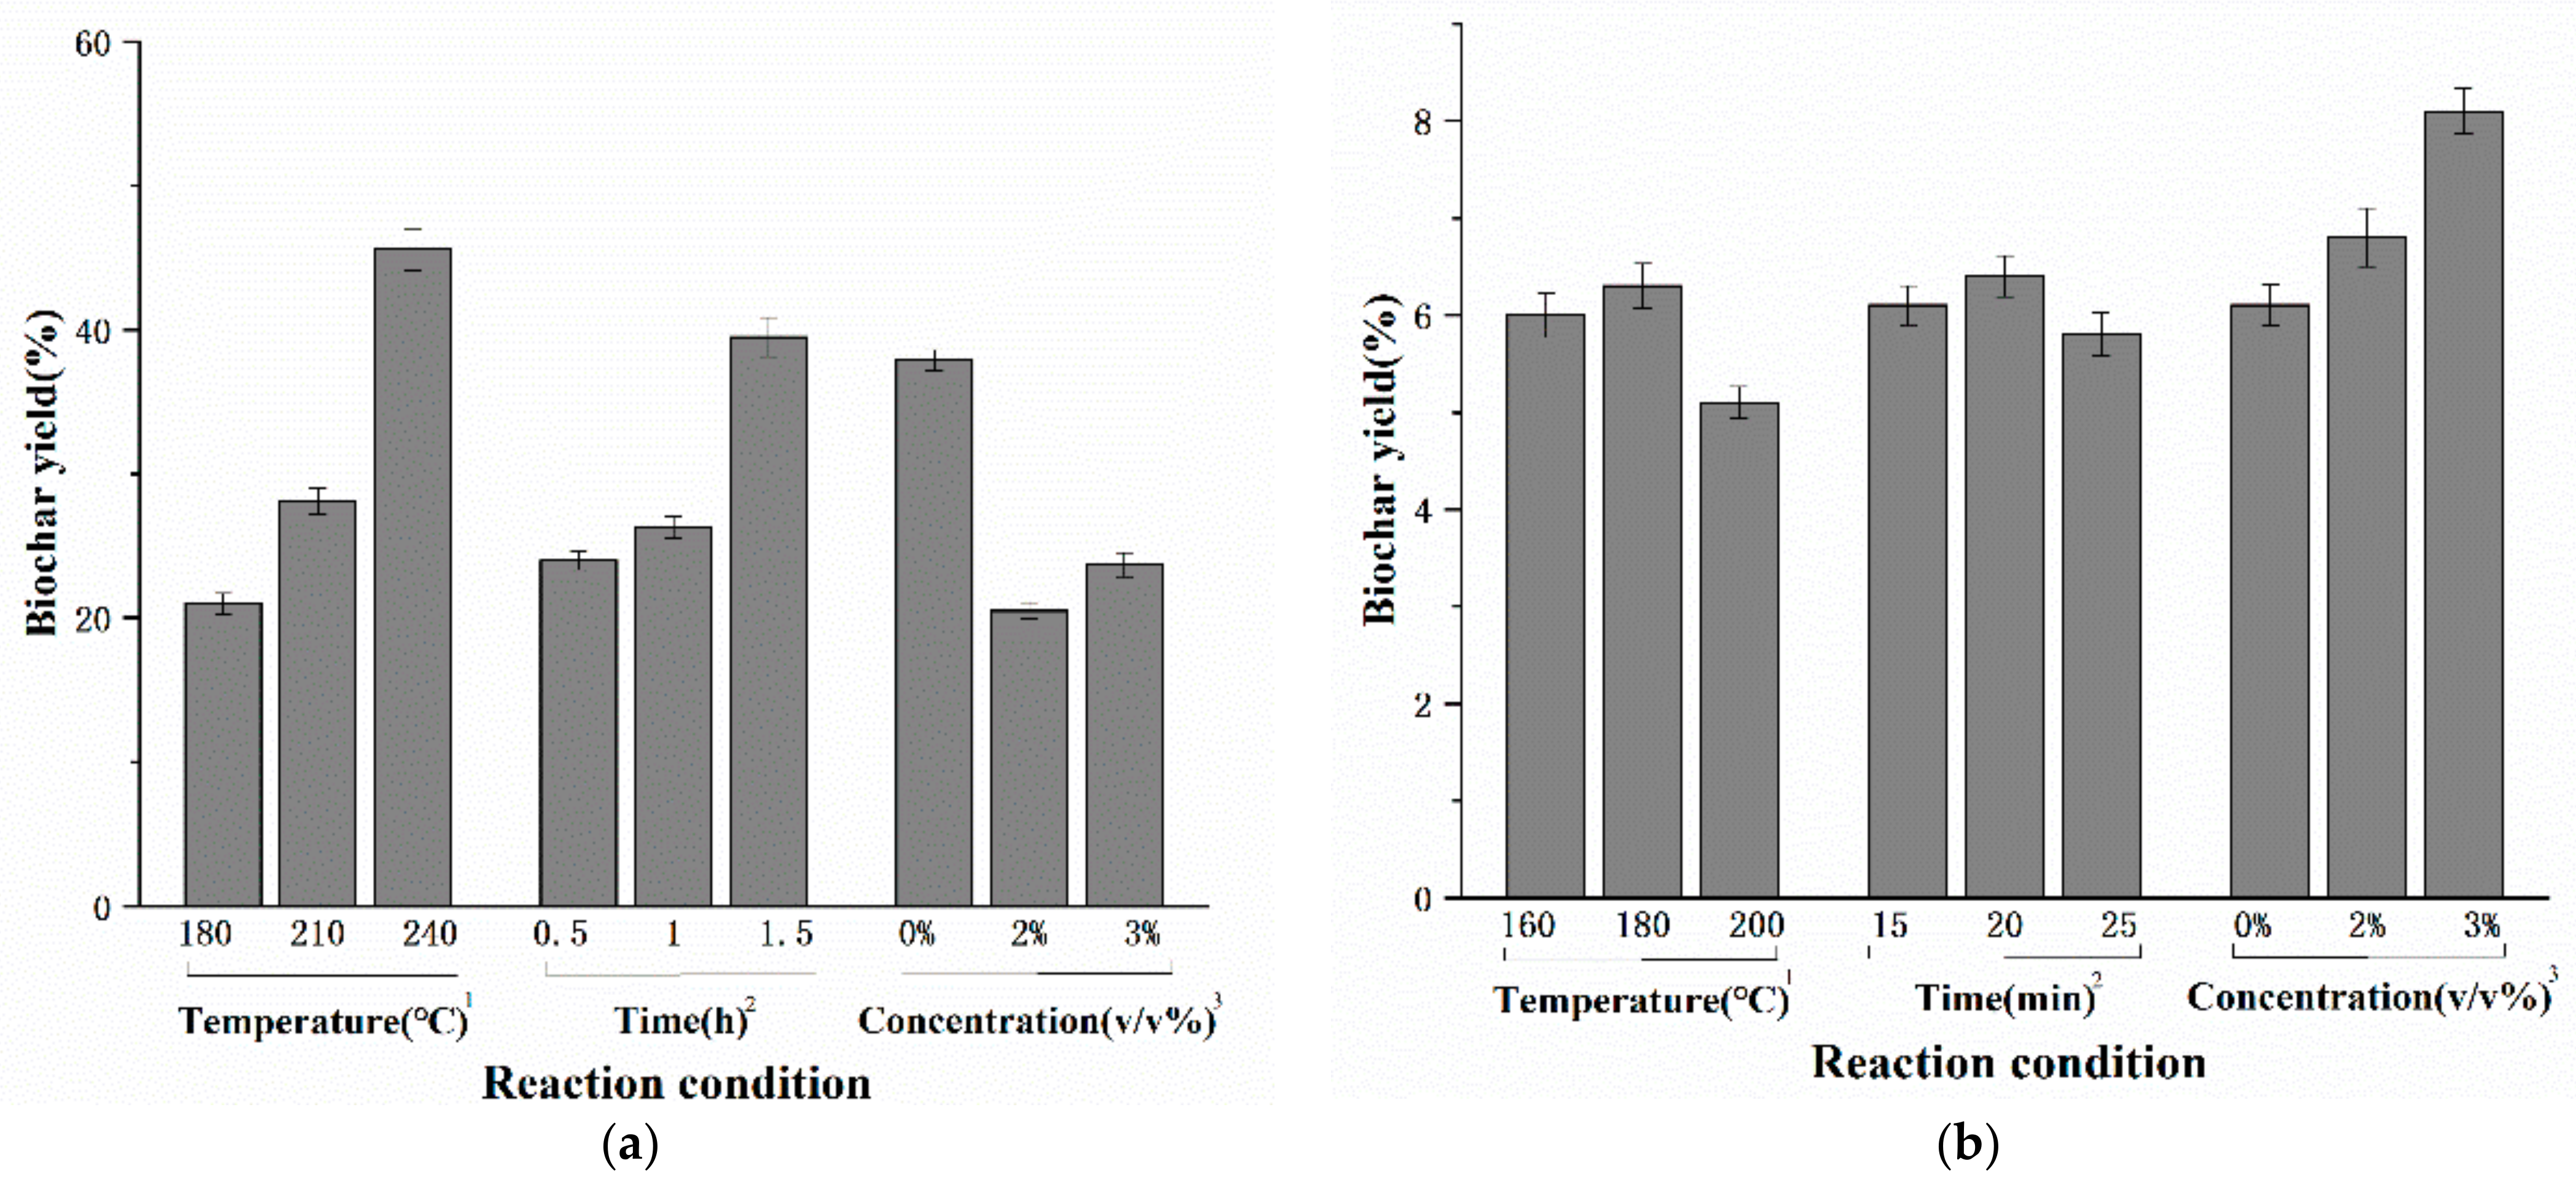
In addition, information on the optimal preparation of carbon-enriched products can be obtained from the results of cooked soybeans (as shown in Figure 5). Different from the above results, cooked soybeans were more prone to biochar production at lower temperatures (the yield of biochar: 20.00 ± 0.21% for 180 °C), less time (the yield of biochar: 19.85 ± 0.14% for 0.5 h) and without acid (the yield of biochar: 19.38 ± 0.18%) when using HPR (Figure 5a), which is consistent with the results of previous studies [43,44]. However, the phenomenon was different when using MW (Figure 5b), which is manifested in the reaction time, reaction temperature and acid concentration different from the above to obtain the best biochar yield. The results show that the reaction conditions of 200 °C and 20 min combined with 3 v/v% sulfuric acid were more favorable for the preparation of the solid product (the yield of biochar: 17.35 ± 0.22%). Contrary to the results of experiments conducted with cooked soybeans in HPR, cooked steamed bread produced more solid products at higher temperatures (the yield of biochar: 44.10 ± 1.14% in 240 °C) and longer times (the yield of biochar: 38.07 ± 1.55% for 1.5 h) with no sulfuric acid added (the yield of biochar: 21.73 ± 1.07%) (shown in Figure 6a). When employing MW for research, both higher temperatures and lower temperatures were not conducive to the preparation of biochar, as was reaction time (shown in Figure 6b). Therefore, the experimental conditions for the preparation of biochar in this study can be determined by the above results, which are summarized in Table 3. The results indicate that HPR is a better process to convert biomass into valuable biochar when the cooked rice or steamed cooked bread in food waste accounts for the majority due to the huge advantage of HPR method in the yield versus MW method. In addition, the carbon-rich solids prepared by these conditions are shown in Figure 7.
3.2. Analysis of Cultivation of Wheats Using Biochar Prepared from FW
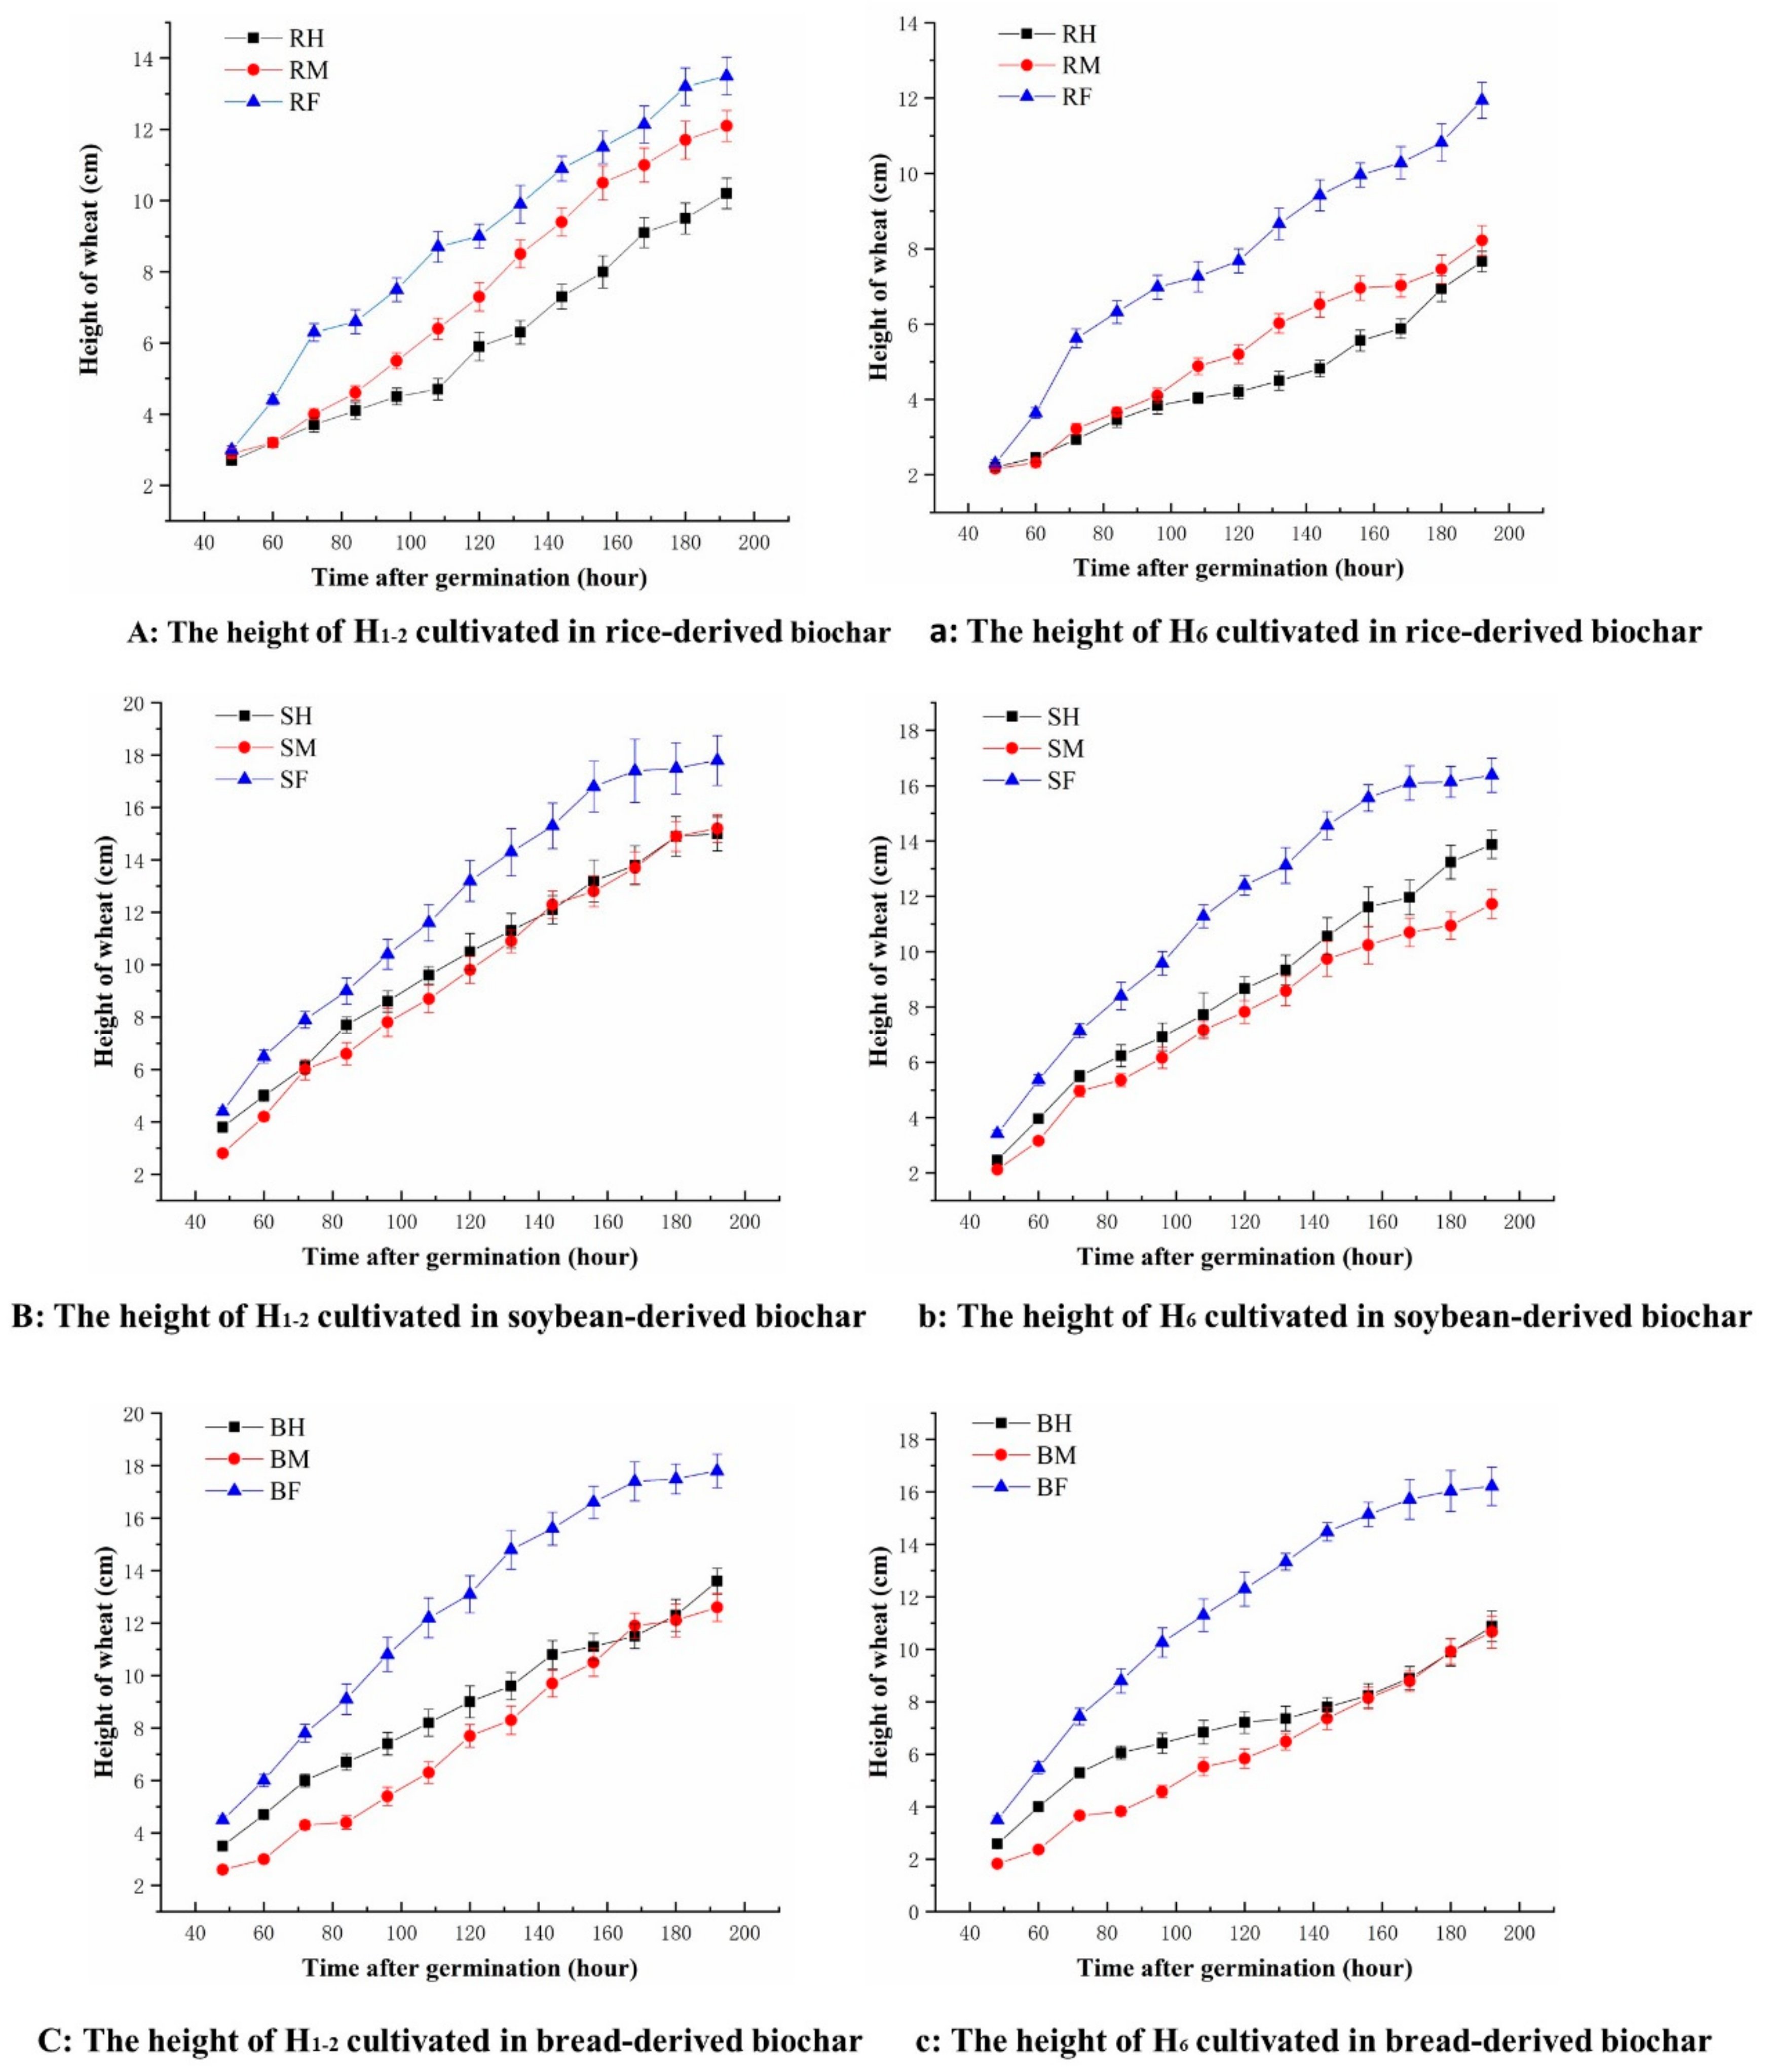
The selected FW samples were converted to biochar using the optimized experimental conditions obtained above. In addition, these biomass feedstocks were heated in tube furnace (TF) for 20 min to 300 °C and held at this temperature for 20 min, which produced the pyrolysis char used to cultivate wheat germ. The weight of different carbon-enriched solids used to cultivate crops is summarized in Table 4. The measurement results of the height of the six best growing wheats are shown in Figure 8, Figure 9 and Figure 10. Separate figures were performed according to different reactors for the preparation of biochar to facilitate reading the lines.
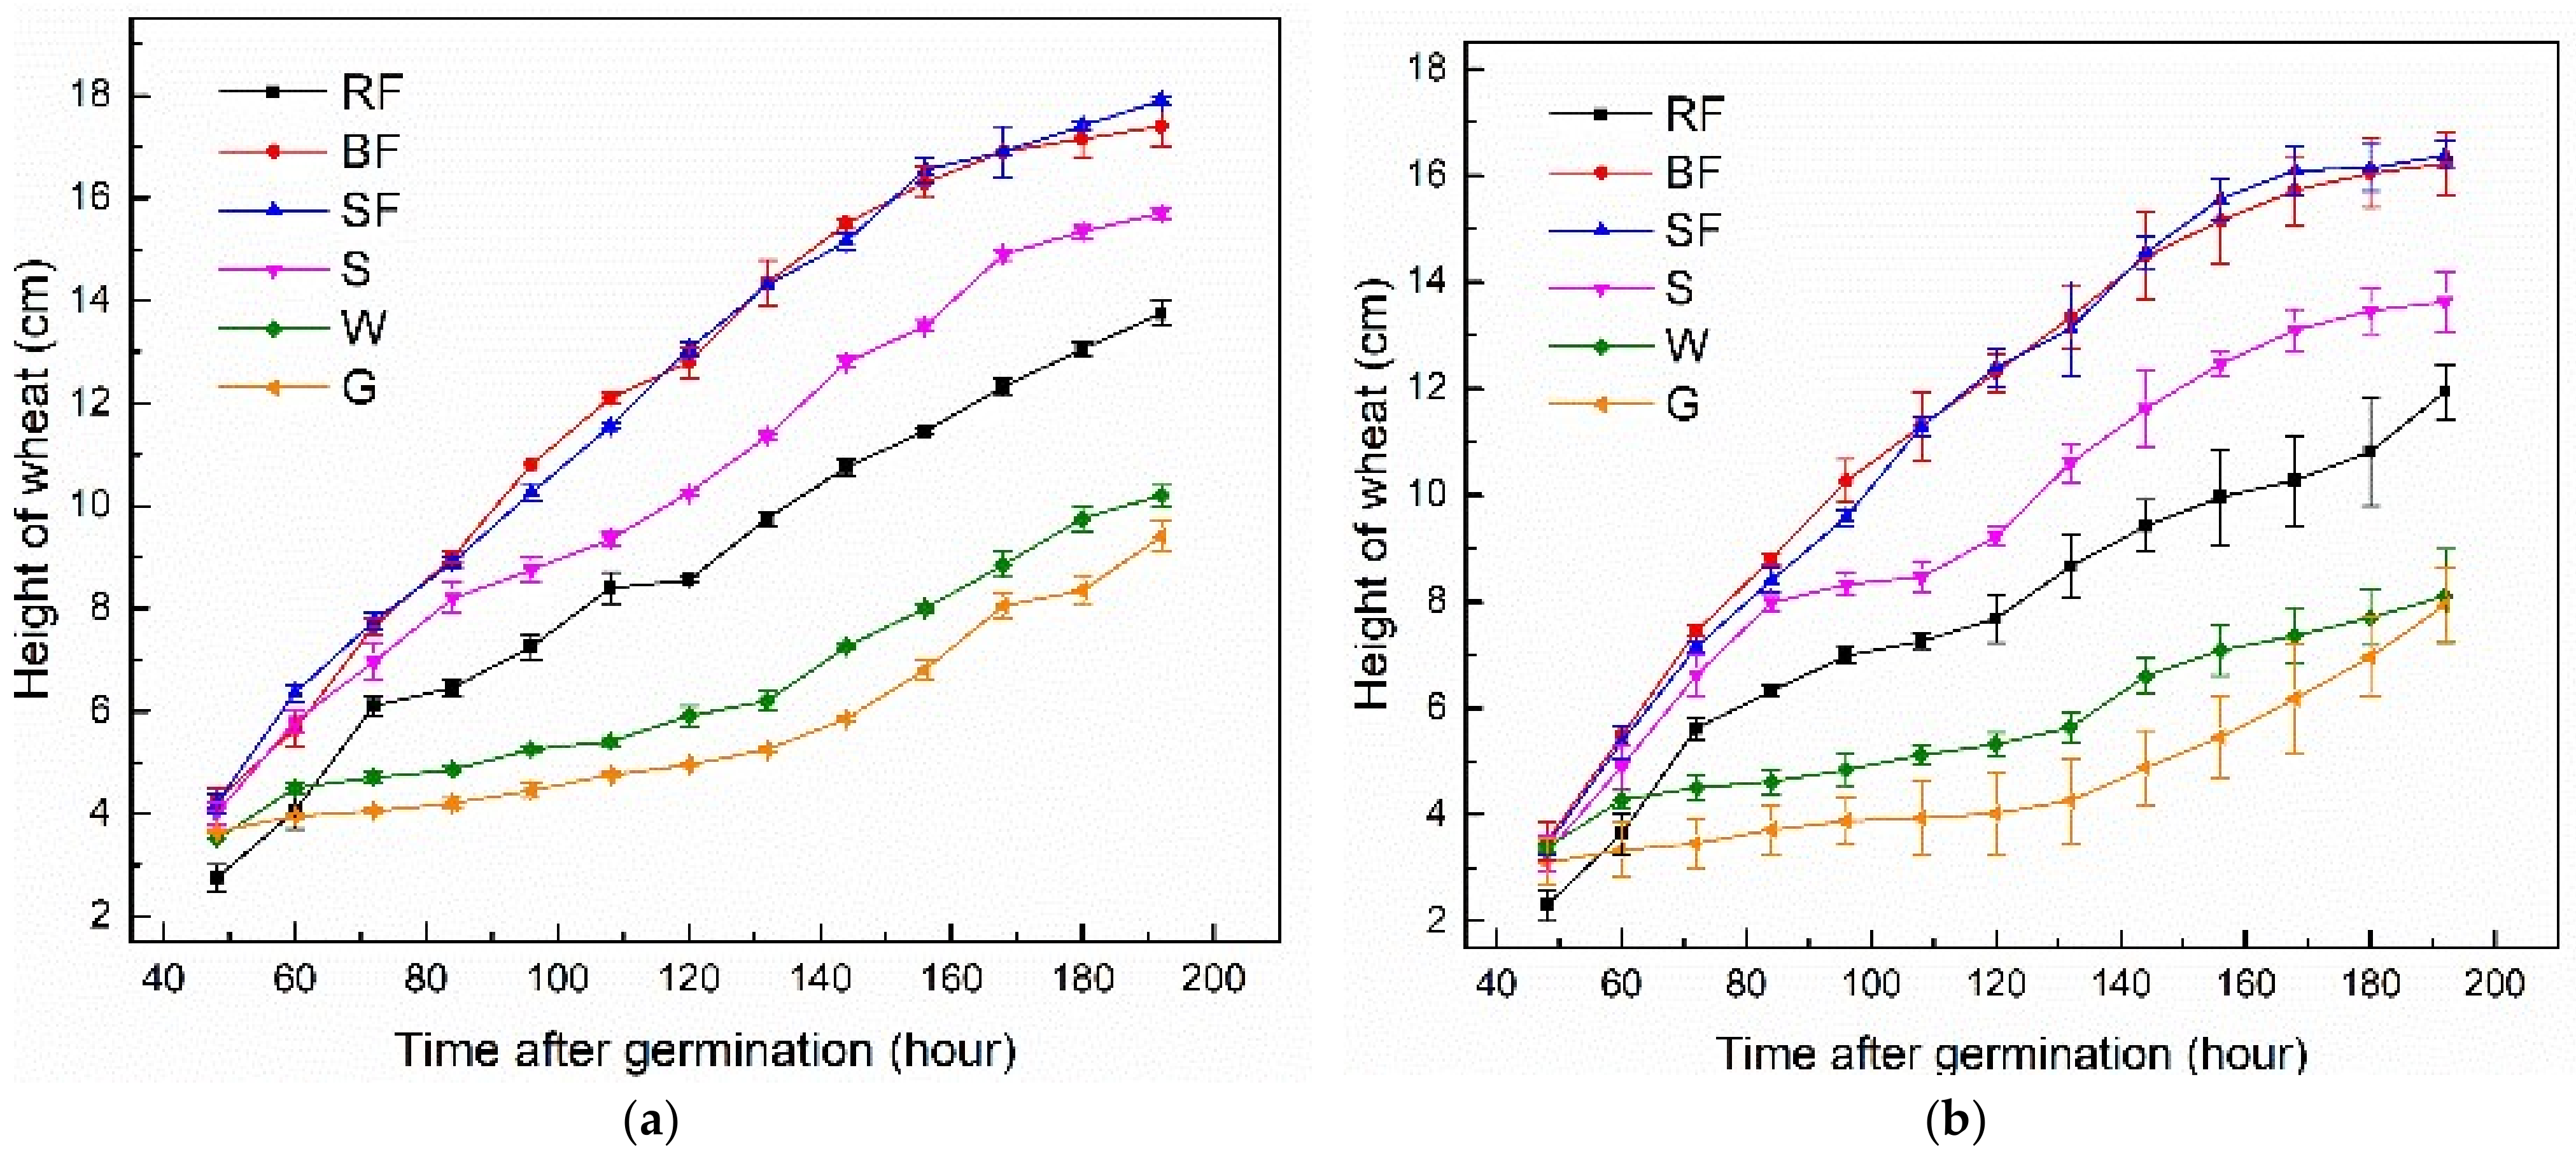
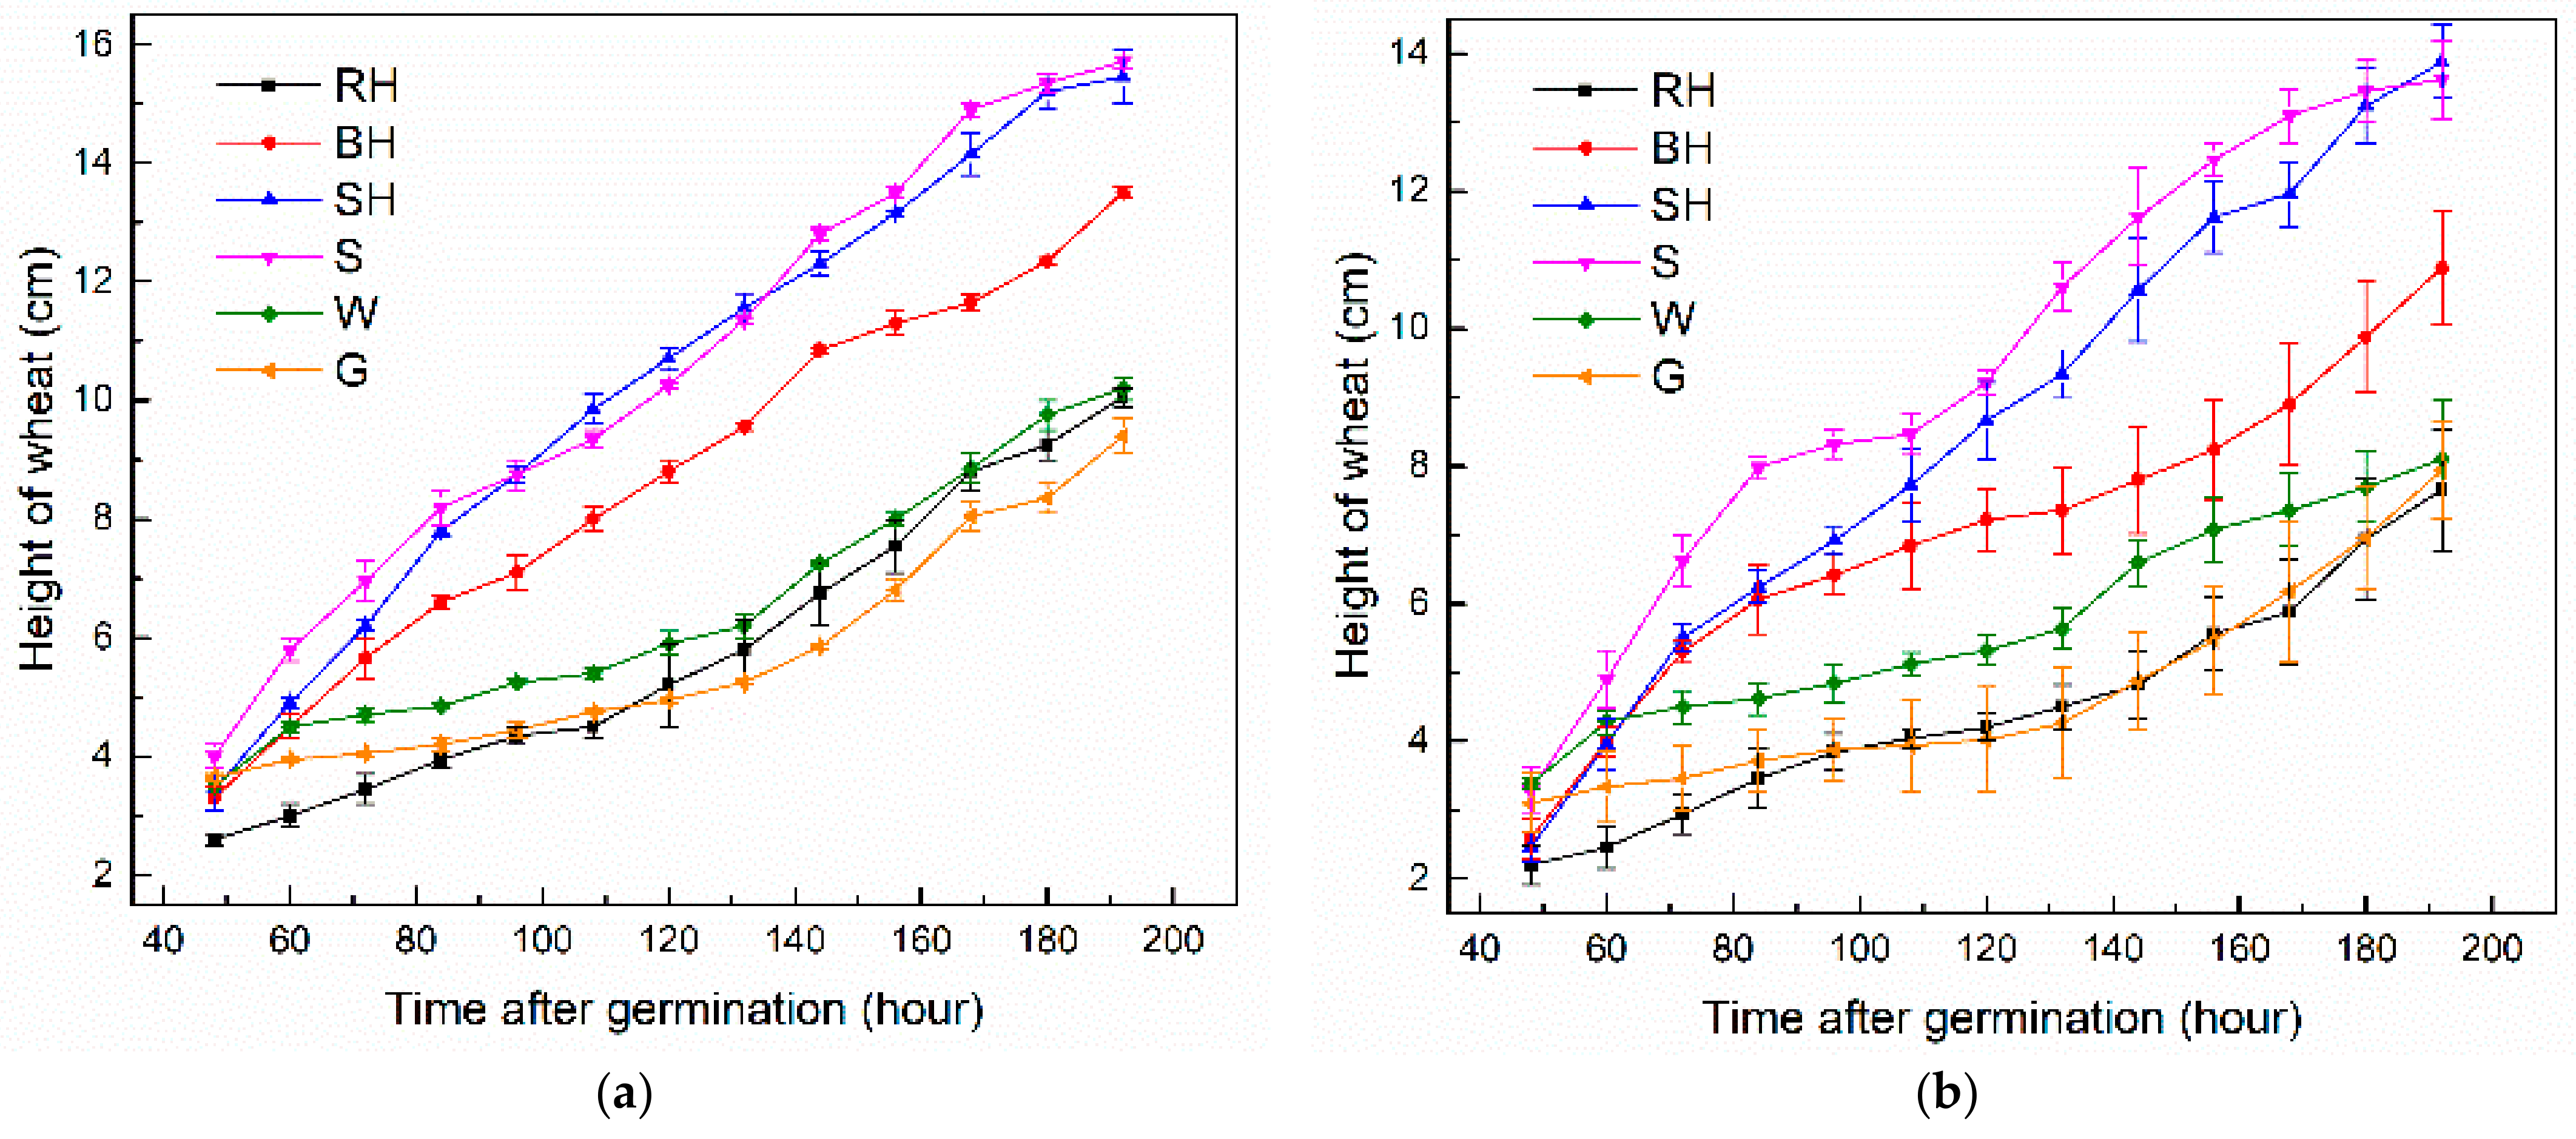
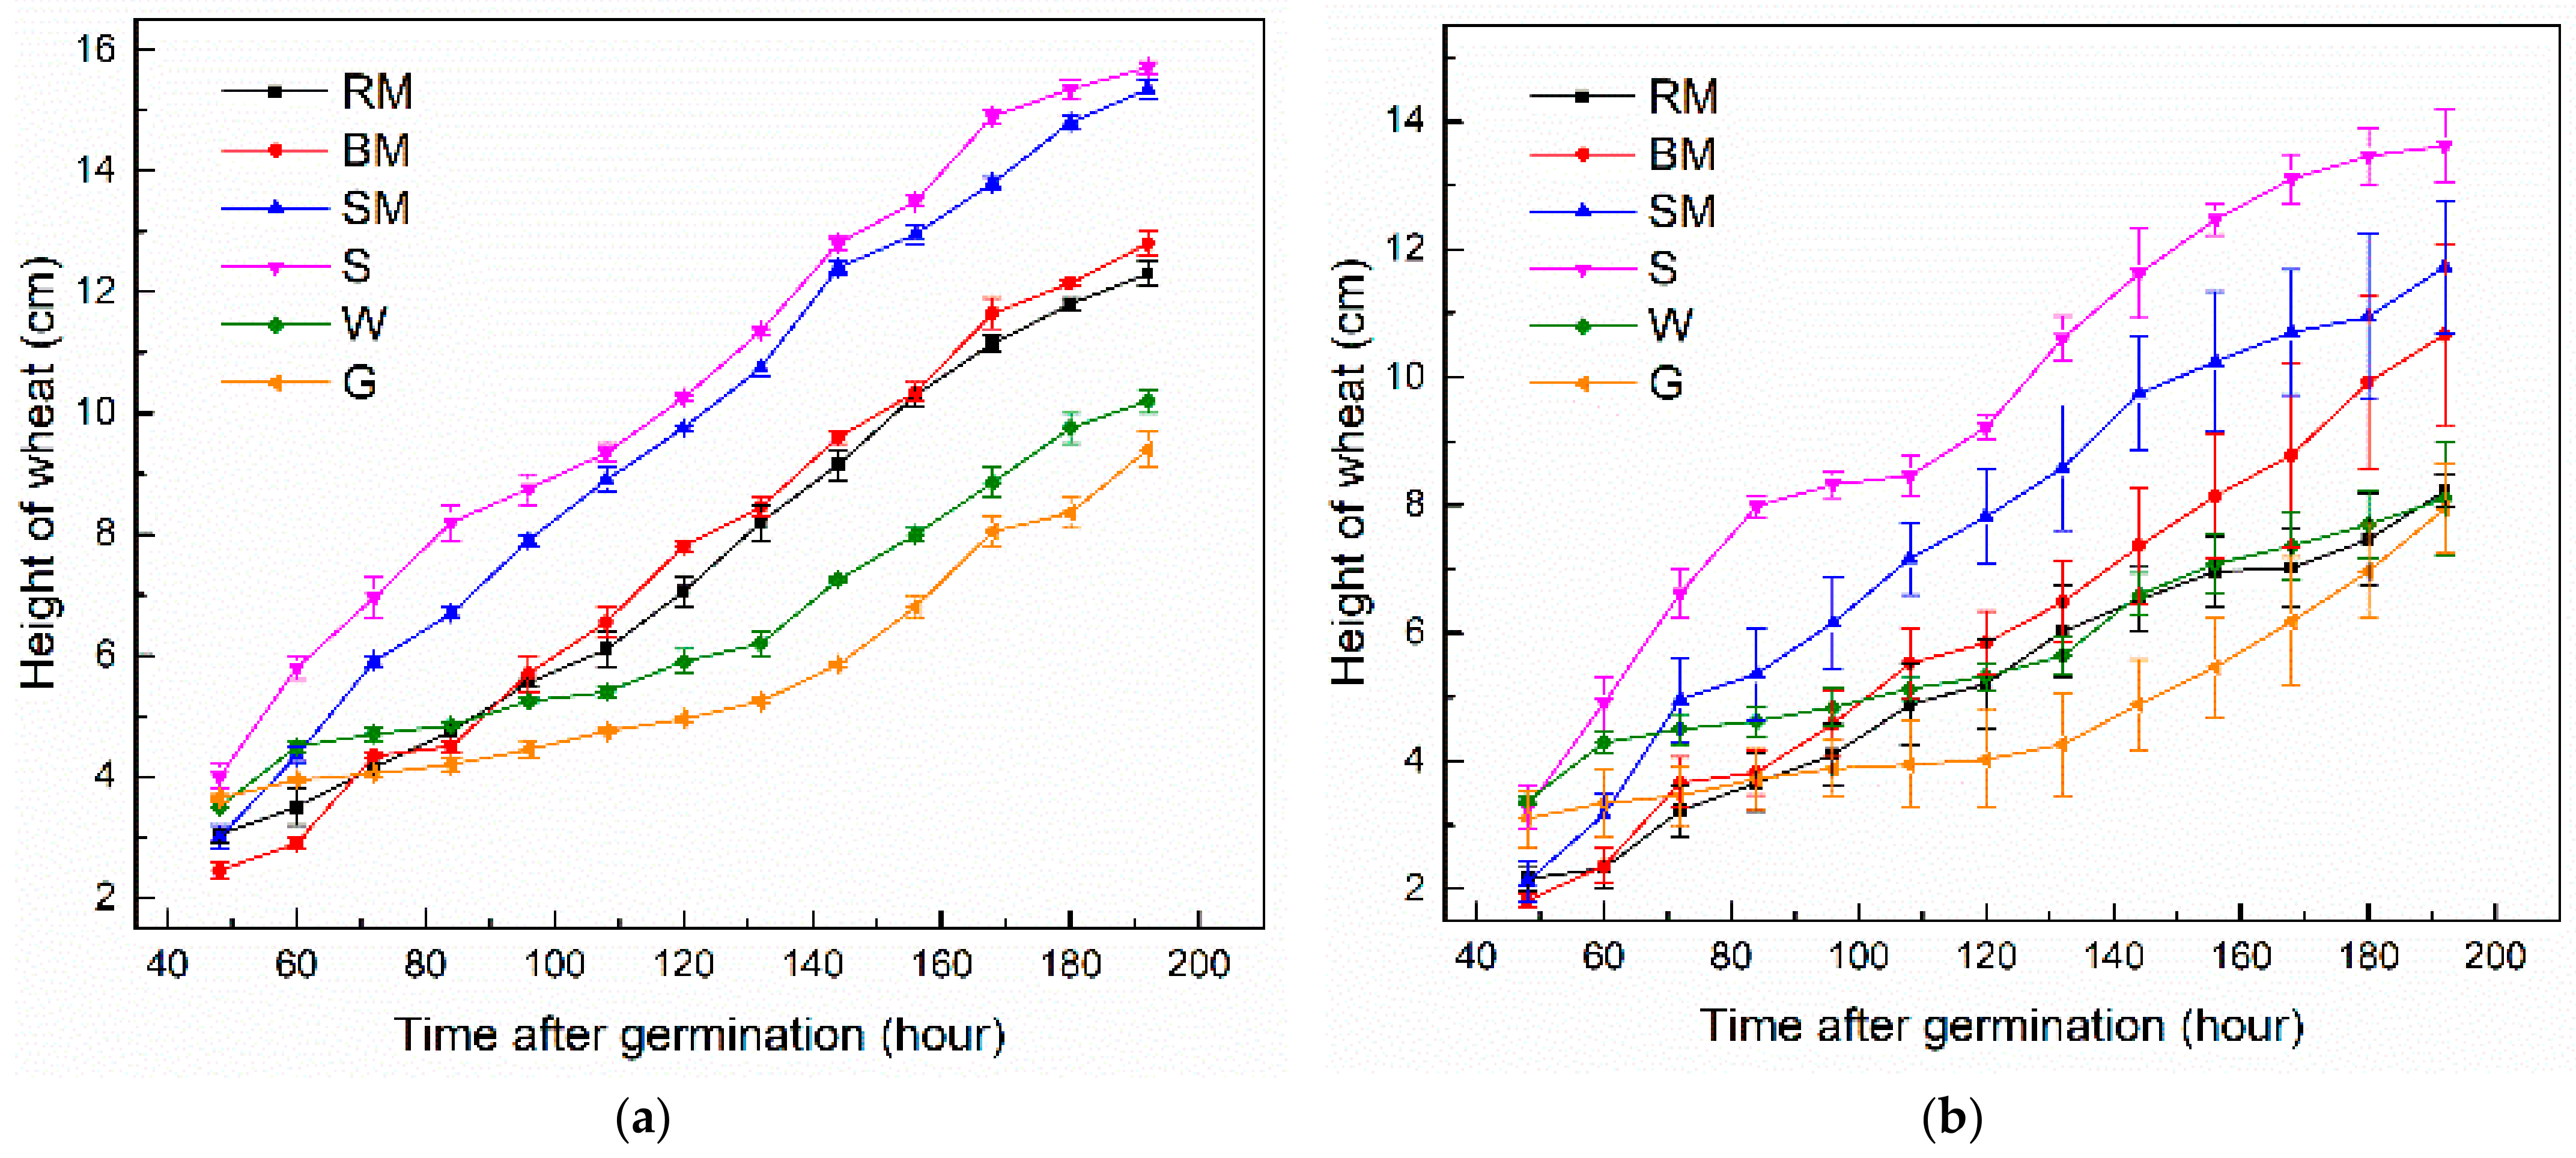
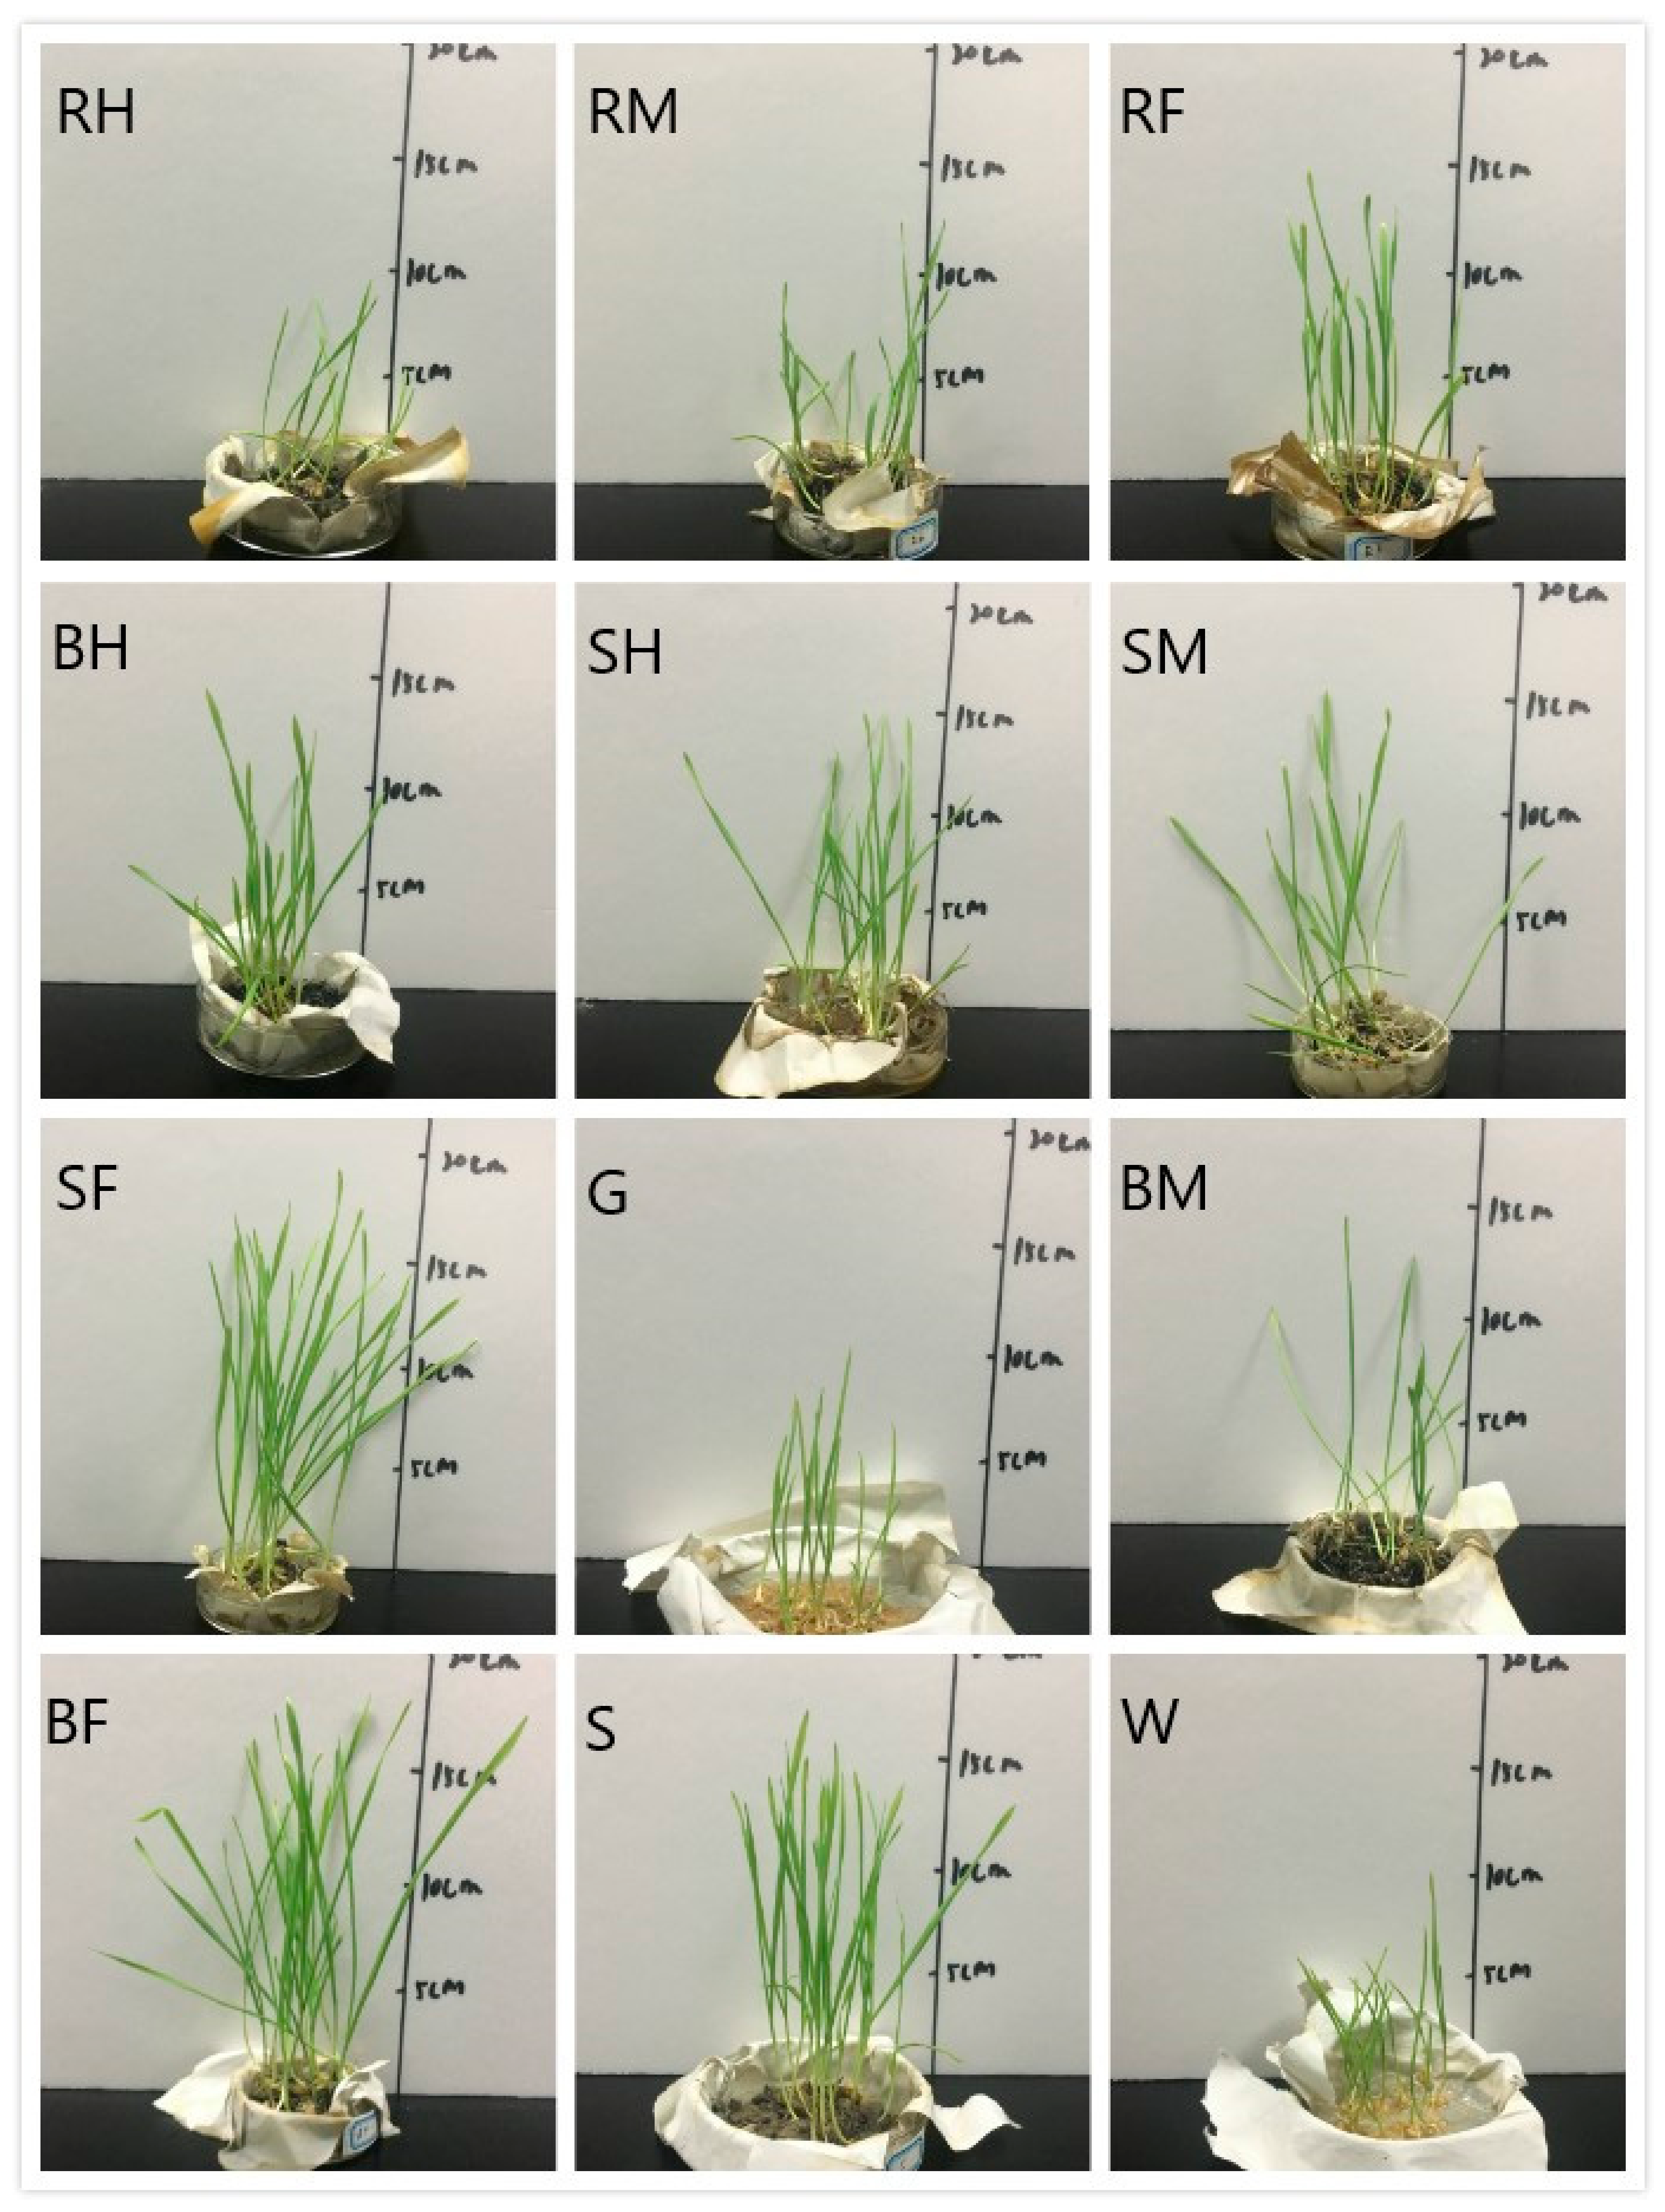
As can be seen in Figure 11, at the last measurement, most of the groups had more than nine seeds germinated, including RM, RF, BH, SH etc., during the growth of the plants. However, there were also some groups of wheat that were not in good condition, with only eight seeds germinated in the RH group. For H1-2 and H6 wheat, the height growth trend in different groups is significantly different over time (p < 0.05). Moreover, different biochar can cause a high degree of difference in wheat growth (p < 0.05), indicating that different biochar has different effects on the growth of wheat. During the growth of wheat, only six groups of growth were found to be relatively uniform, including the RF, SF, BF, G, W and S groups, while the remaining groups of wheat were uneven. This phenomenon can also be seen in Figure 8, Figure 9 and Figure 10, showing that the H1-2 plant differs from that of other plants, which indicates that the biochar used in these groups is capable of maintaining the uniformity of plant growth. In addition, for the highest plants, even some groups of wheat (RH, RM, BM and RF) were lower in height than the G and W groups at the beginning. However, due to their faster growth rate, these group of wheat gradually caught up with two reference group in the later growth process. Moreover, it can be seen that all groups of wheat grew faster than the W groups, which means that biochar can accelerate the growth of wheat, probably due to the presence of some required compounds. It can be seen from (a) in Figure 8, Figure 9 and Figure 10 that the height of the plants other than the RH group exceeded the G and W groups at a later stage, and the RH group can only reach a level which is flat with the W group. It can just confirm the role played by microorganisms and trace ions in the soil, which is consistent with the conclusions of Hossain et al. [46]. It also indicates that the carbon-enriched solid products used in the experiments can promote the growth of wheat due to the presence of compounds which can be absorbed by plants or store water, which in turn shows that all biochar cultured wheat had higher height than the W group or would soon exceed it. Interestingly, wheat cultured with biochar prepared by cooked soybean and steamed bread using TF, namely BF and SF groups, showed nearly the same growth trend, which exceeded that of wheat cultivated in soil. Furthermore, the above two groups of plants had a higher height than the S group. Planting crops using soil may be caused by a variety of factors, such as microbes. The growth phenomena of the BF and SF groups indicate that these two types of biochar have a better environment for wheat growth than soil, which means that they promote plant growth more than other factors such as microorganisms. In addition, the same conclusion can be obtained by analyzing the height of H6 plants.
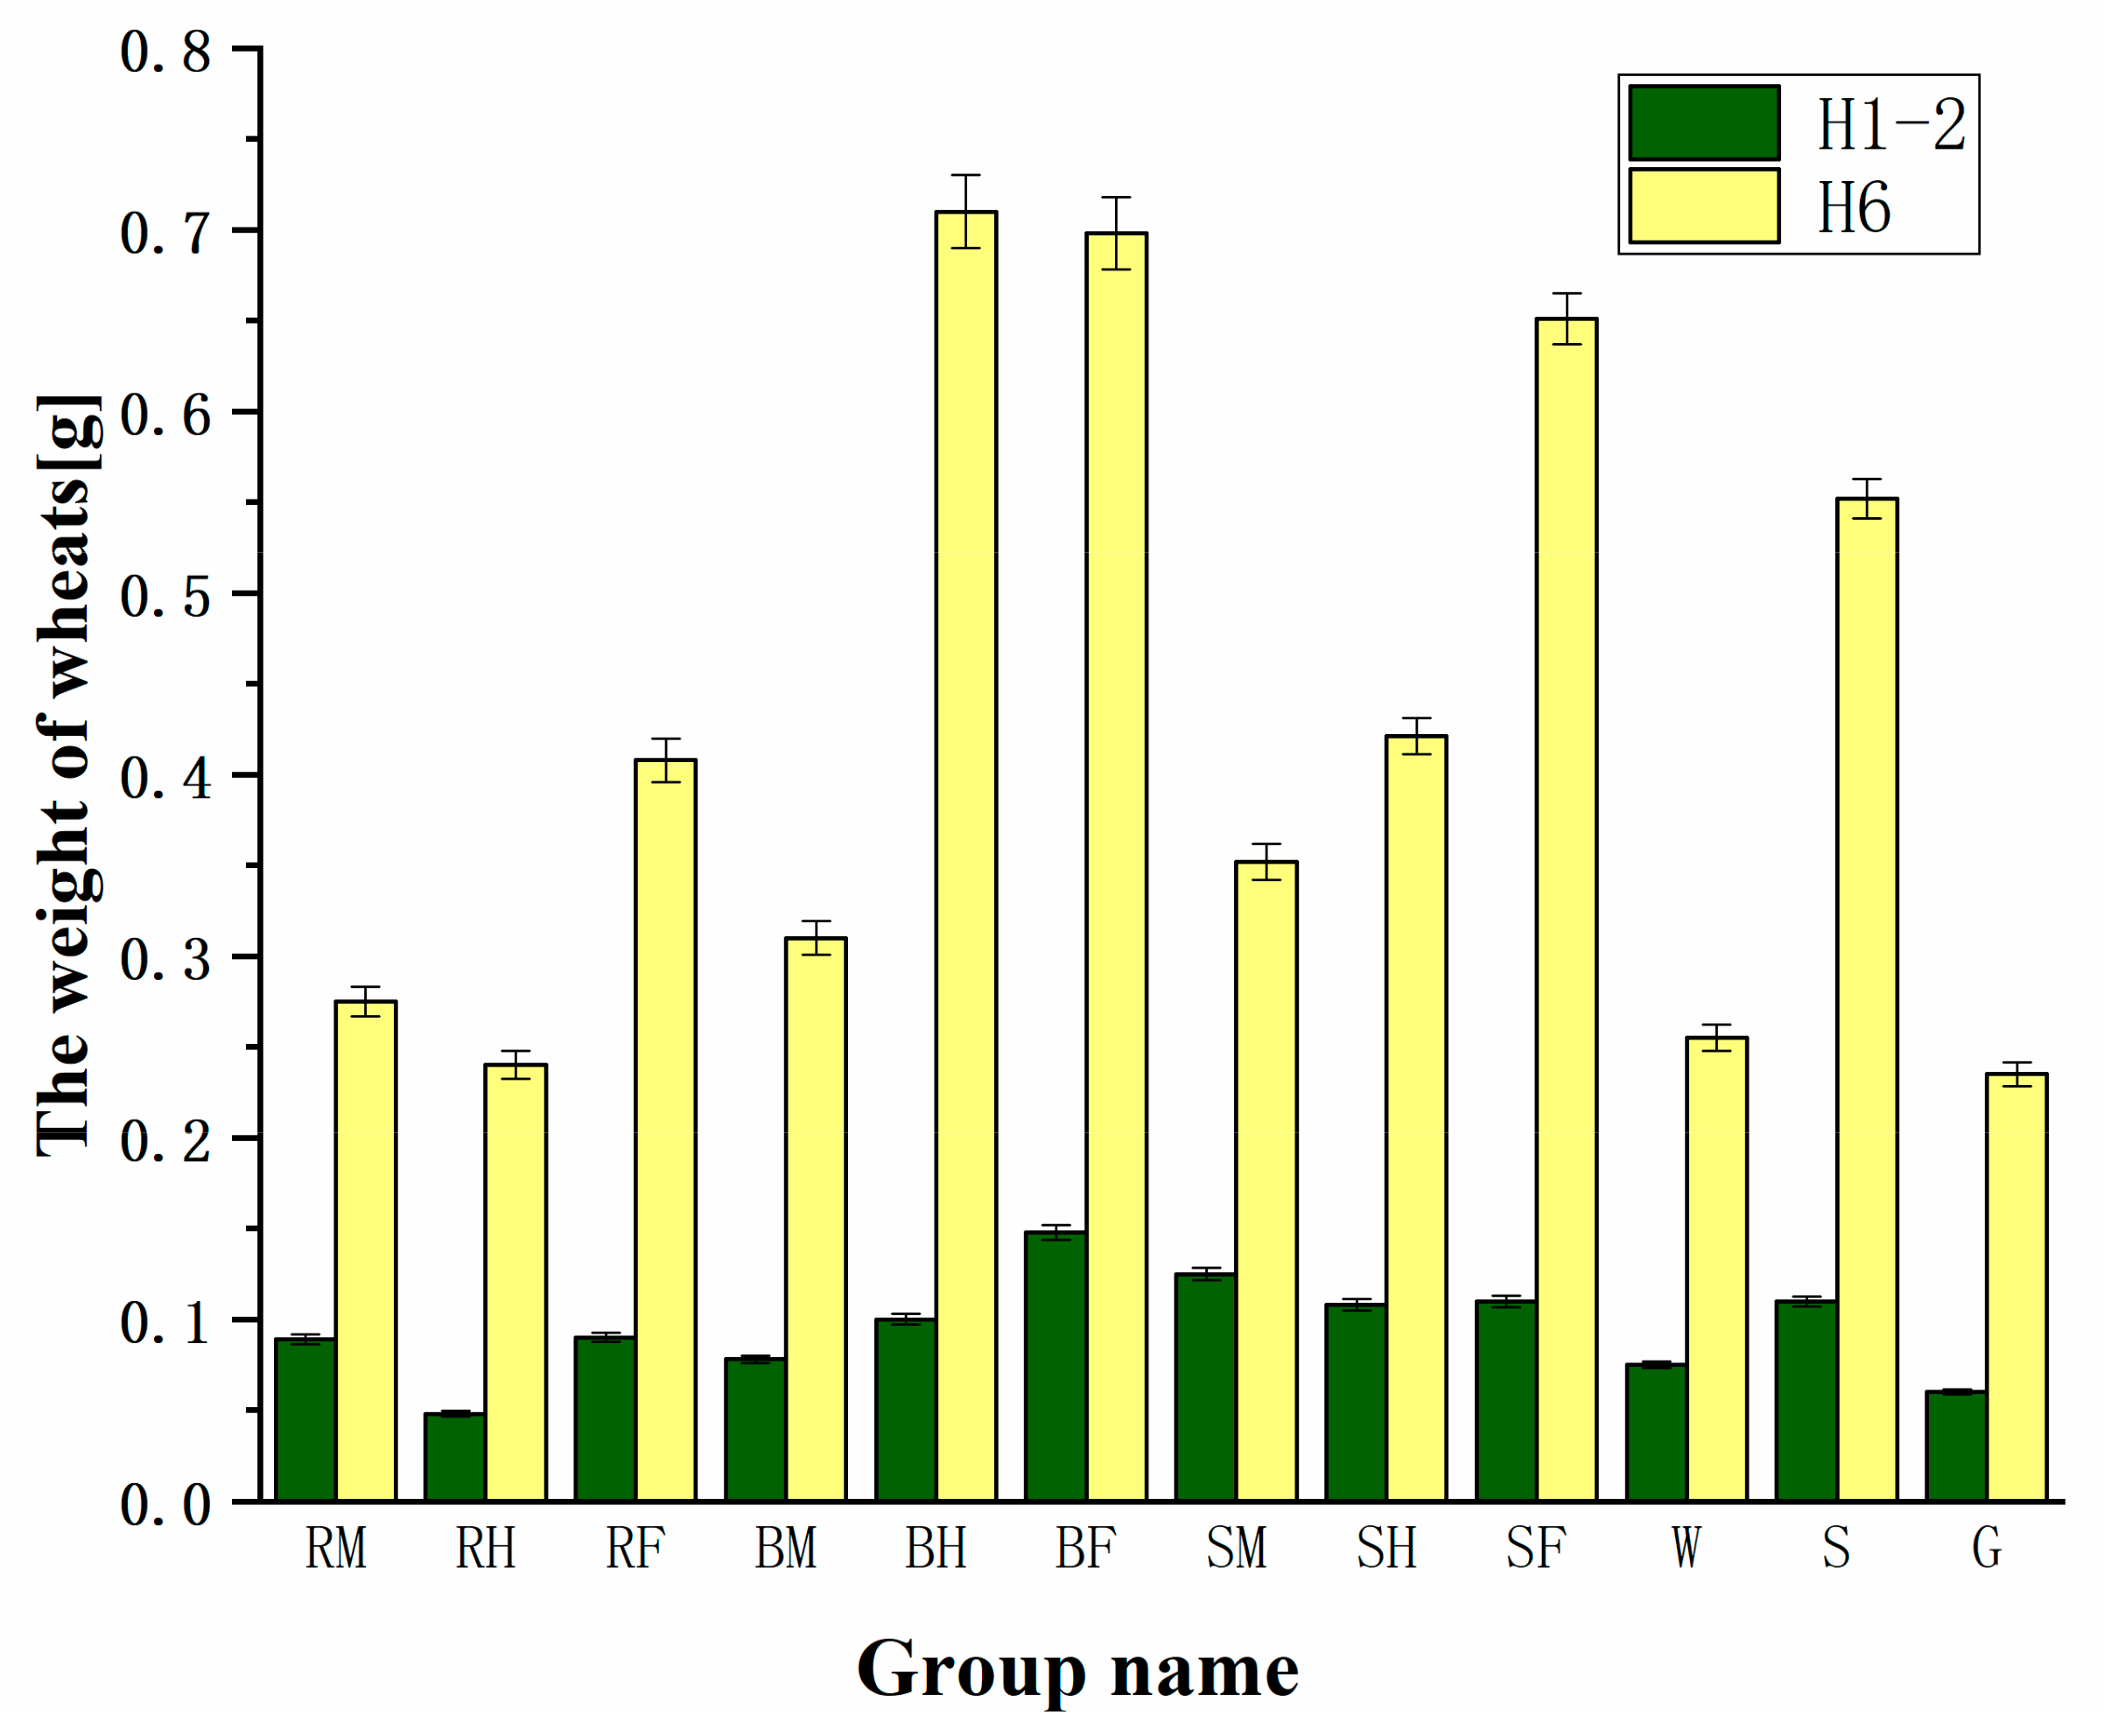
In addition to measuring the height of plants, the above-mentioned wheat that was measured in the experiment was also weighed after the completion of the planting with the results shown in Figure 12. For H1-2 and H6 plants, almost all groups (except the RH group) have heavier wheats than the S and G groups, which is the same as the height measurement. According to the study of Yan et al., the heavier wheat plants are the superior competitors in the system, which indicates that they had a higher ability to acquire and use resources. For example, it can facilitate the accumulation and remobilization of dry matter, which contributes to the yield of wheat [49]. In addition, Vandeleur and Gill indicate that there is a significant positive correlation between the height of wheat and its yield [50], which was also supported by the founding of several previous literatures [51,52,53]. Hence, combining the measurement results of the height and weight of wheat plants, it can be determined that these types of biochar (BH, BF and SF) were more effective than soil in wheat cultivation, which indicates they are better suited to growing crops than microbial environments.
Biochar used in this study has a promoting effect on the growth of crops and can accelerate the growth of wheat, which has significant difference for different carbon-rich solids. Therefore, this biomass-converted biochar can be used as an additive to the soil to provide a good growing environment for crops. Moreover, among all the biochar used, the heat-transformed solid products of BH, BF and SF are more effective in enhancing the growth of plants, which has exceeded the soil culture results. Therefore, the above three types of biochar have promising potential to replace the soil as an environment for growing crops. In addition, for different FW raw materials, the biochar prepared by the cooked soybeans is more conducive to the growth of crops, followed by the cooked steamed bread, which shows that the growth curve of S in Figure 8, Figure 9 and Figure 10 is higher than the others. It can be seen that biochar produced by any of the reactors using cooked rice showed a lower ability to promote wheat growth, which may mean that the FW-prepared biochar with a higher protein content is more suitable as an alternative soil. Moreover, for different reactors (shown in Figure 13), TF-prepared biochar is more suitable for wheat growth, the growth rate and final height of wheat plants cultivated in biochar obtained from pyrolysis method far exceed those of the other two treatment methods, indicating that pyrolysis has more potential to produce suitable solid products for crop cultivation than HTC processes. In addition, for the two different processing methods in the HTC process, the biochar produced from the two raw materials (cooked rice and steamed bread cooked) has little difference in the growth of wheat plants, whether it is the growth rate or the final plant height, while the biochar obtained from HPR treatment shows a little advantage on the growth rate and final height of wheat plants when using cooked soybean as raw material.
3.3. Analysis of Characterization Results of Biochar
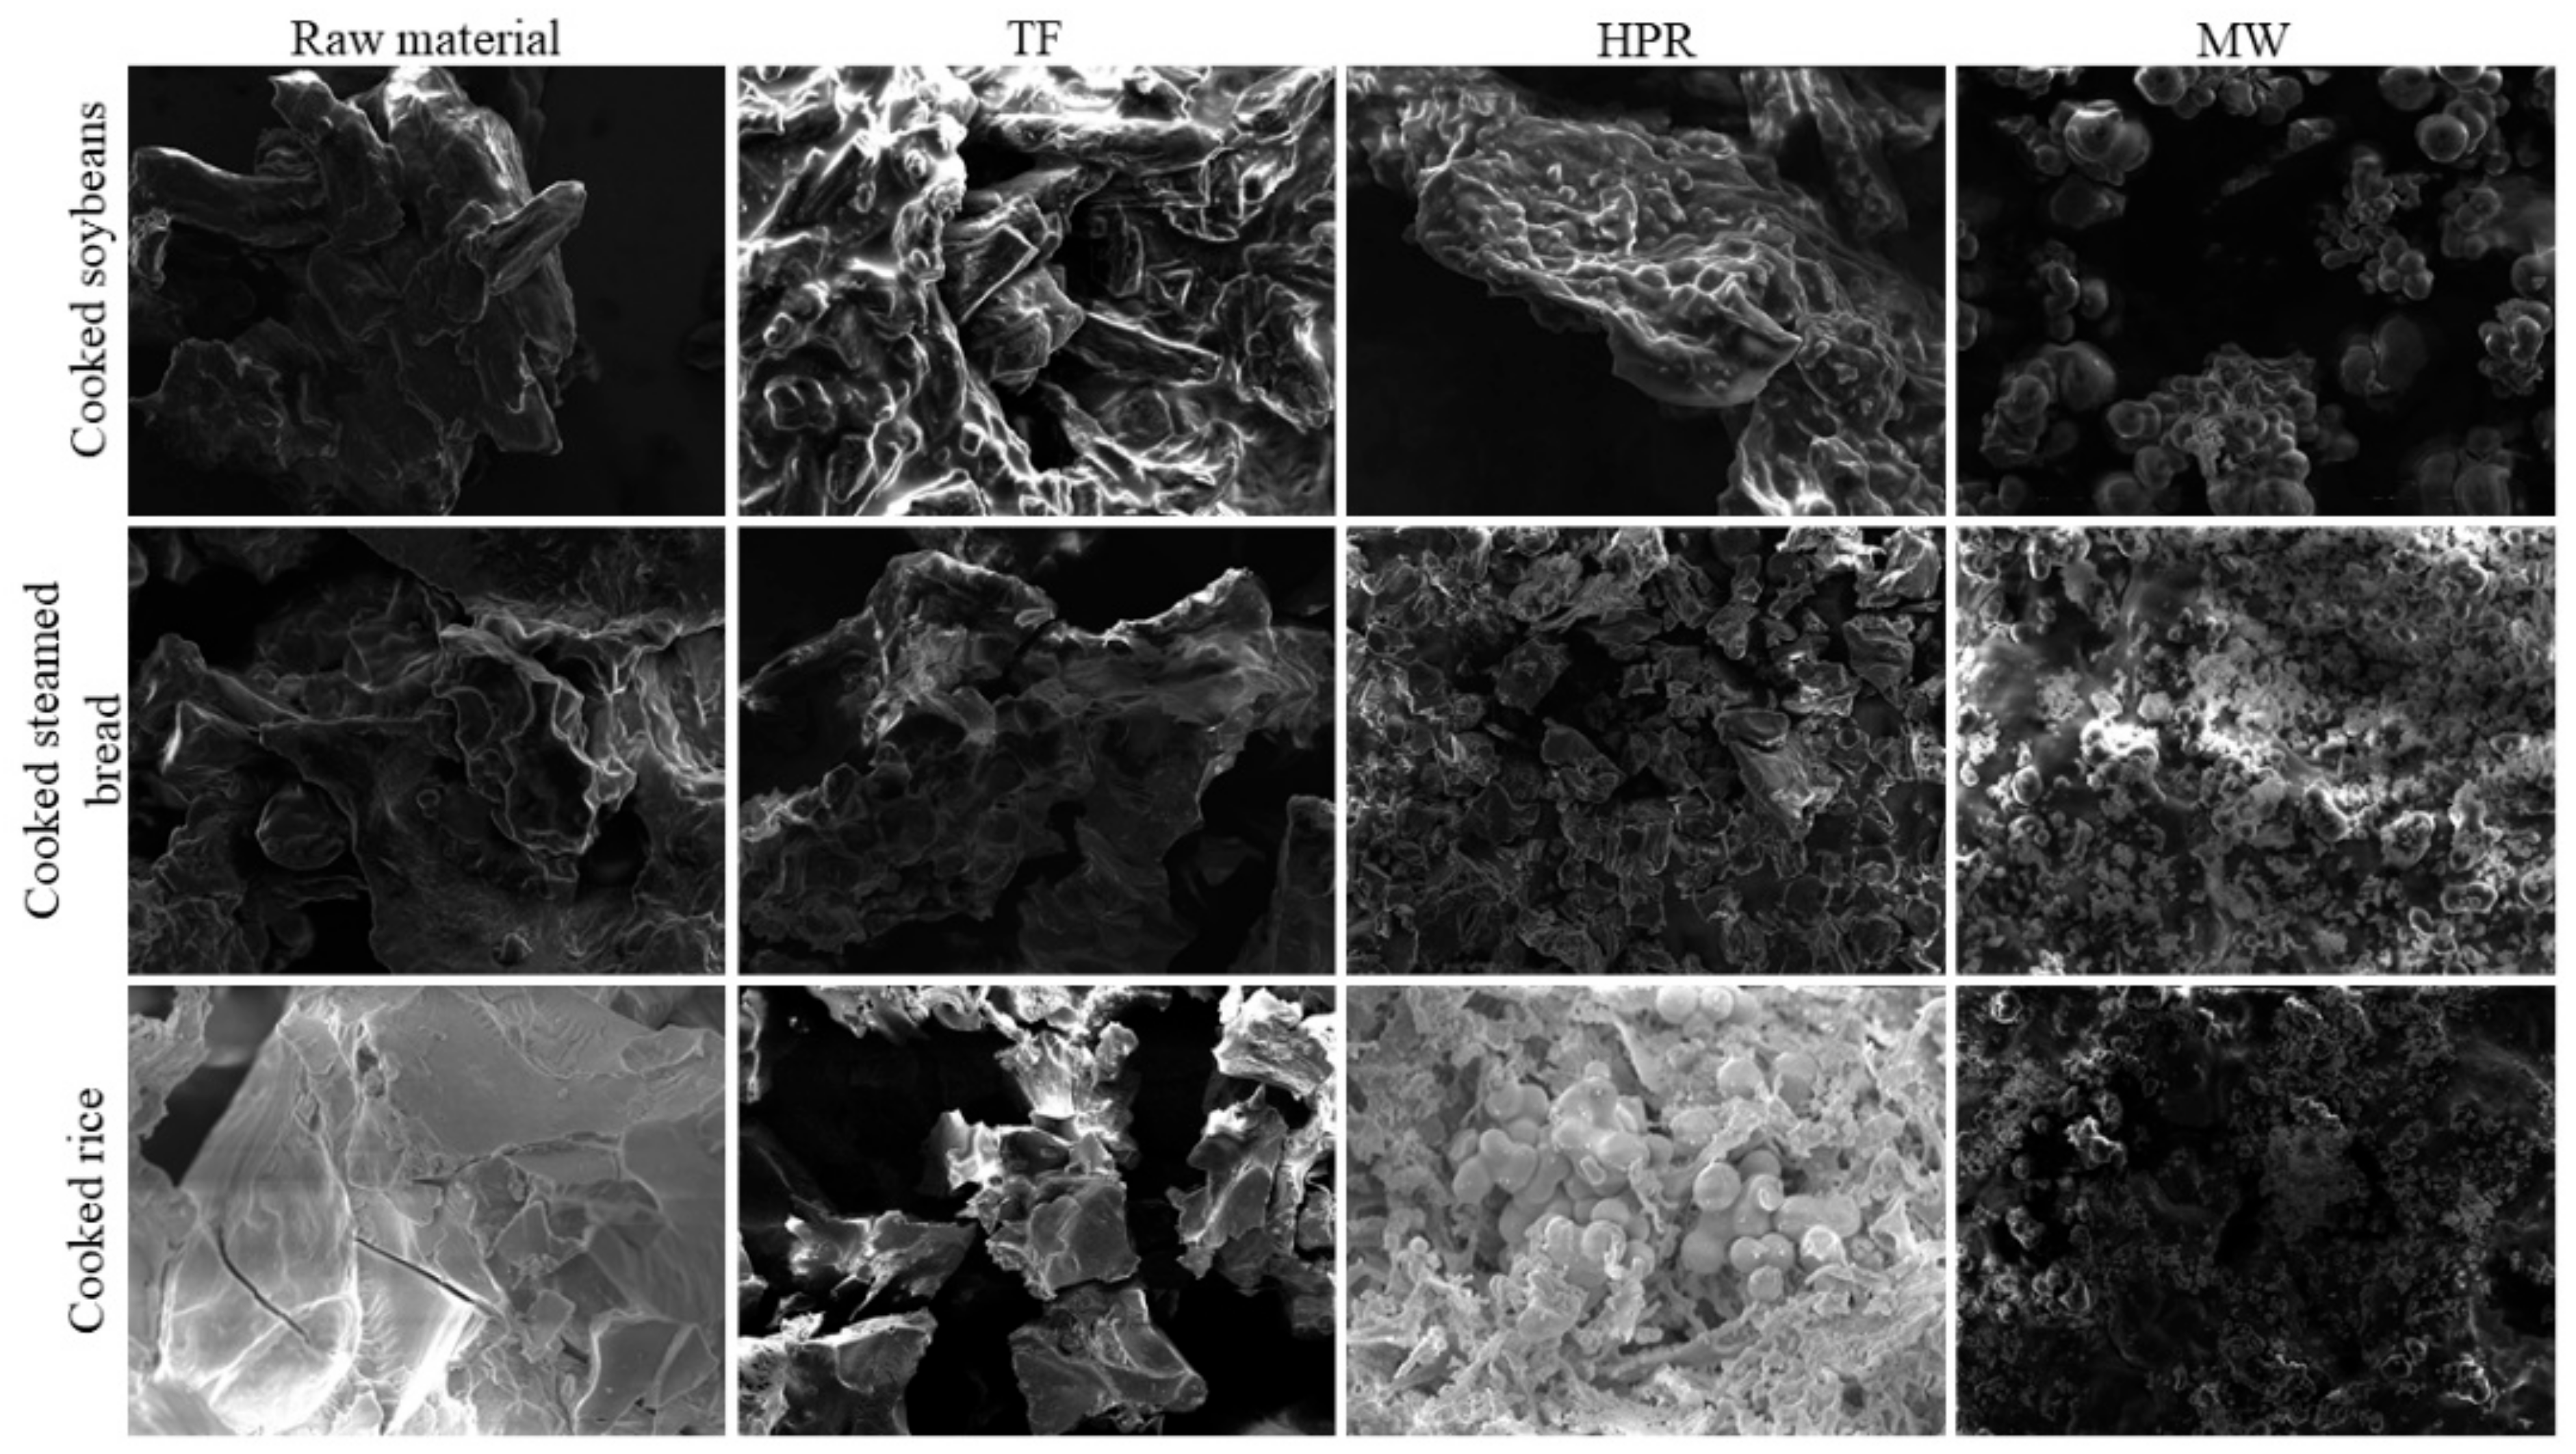
To fully understand the relationship between the effect of biochar on crops and its structure, this carbon-rich solid was characterized, including SEM, BET and FT-IR. The microstructure of the FW raw material and the prepared biochar can be analyzed by the results of the SEM with results shown in Figure 14. Obviously, the microstructure of the FW underwent a macroscopic change after HTC or pyrolysis treatment, which is different under different processing conditions. As can be seen from Figure 14, FW raw materials were layered and had few holes, which became irregular after thermal transformation [54]. Although biochar retained its original shape after pyrolysis, it split into many pieces and had many small holes, which provides significant help in fixing more moisture. Therefore, such biochar provides sufficient moisture for the growth of crops by reducing the loss of moisture, as evidenced by the above trends in wheat growth in pyrolytic carbon. Bruun et al. showed that the biochar prepared from wheat straw was rugged and porous [9], which is consistent with the results of this study. In addition, the MW-treated samples contained many numerous microspheres, which is quite different from the microscopic morphology of pyrolysis carbon. Hydro char is too shred to cause moisture to escape from the microspheres, which does not store water-like pits. It indicates that the carbon-enriched product produced by MW has a smaller promoting effect on the growth of crops than TF, which is consistent with the previous analysis. As can be seen from the photomicrograph of the solid product obtained from HPR, it was more fragmented than the pyrolysis carbon with micro-block but less dispersive than the biochar produced from the MW method (except RH). Consequently, its promoting effect on wheat growth is between the solid products obtained by the other two conversion method. However, the microsphere structure of RH determines that it does not have better crop growth enhancement compared to other HPR-treated samples, which makes the height of the cultivated wheat flat or even lower than the RM group. Thus, the ability of the pit to store water is more conducive to the cultivation of crops, while the shape of the microspheres is reversed.
The BET test method provides detailed information on the specific surface area of a powder or porous material, which is very meaningful for studying the properties of biochar. The results of the FW raw material and the produced biochar used in this experiment as measured by this characterization method are shown in Table 5, and only the BET surface area is considered here. Furthermore, the final height of wheat plants cultivated in different biochar mentioned above in the Table 5. An interesting phenomenon was found in which the solid product obtained by pyrolysis has a smaller specific surface area than the raw material, whereas the hydrothermal carbon is the opposite with a larger value. In a review published by Jain et al. [55], the specific surface area of the hydrate increased significantly after the HTC process, confirming the view of this study. However, more research has focused on biochar as an additive to improve the soil, thus requiring a larger specific surface area to adsorb more contaminants. In this study, plants were directly cultured using biochar, which produced different results. As can be seen in Table 5, the use of the pyrolysis method to produce biochar for the same biomass raw material has a more significant promotion effect on plant height. For example, the average plant height of BF group increased by 51.85% from 10.81 cm to 16.40 cm compared with the BM group. The results of BET are also mutually proved with the above SEM images. The product obtained by the MW treatment is microsphere-shaped as viewed by SEM, and thus, has a larger specific surface area, while the uneven pyrolysis carbon is reversed. It also confirms the point presented in this study that microsphere biochar is not as good as an uneven layer in wheat cultivation. The sample is broken into microspheres that are not conducive to moisture retention, which is because fine soil is prone to penetrate resulting in water loss. In addition, it is possible to easily adsorb some substances in the air due to a large specific surface area, which is disadvantageous for the growth of crops. Therefore, the biochar obtained from the process of pyrolysis have a superior effect on promoting growth of wheat compared with other methods, which can be confirmed by the results of the final height of wheat plants (H6) summarized in Table 5.
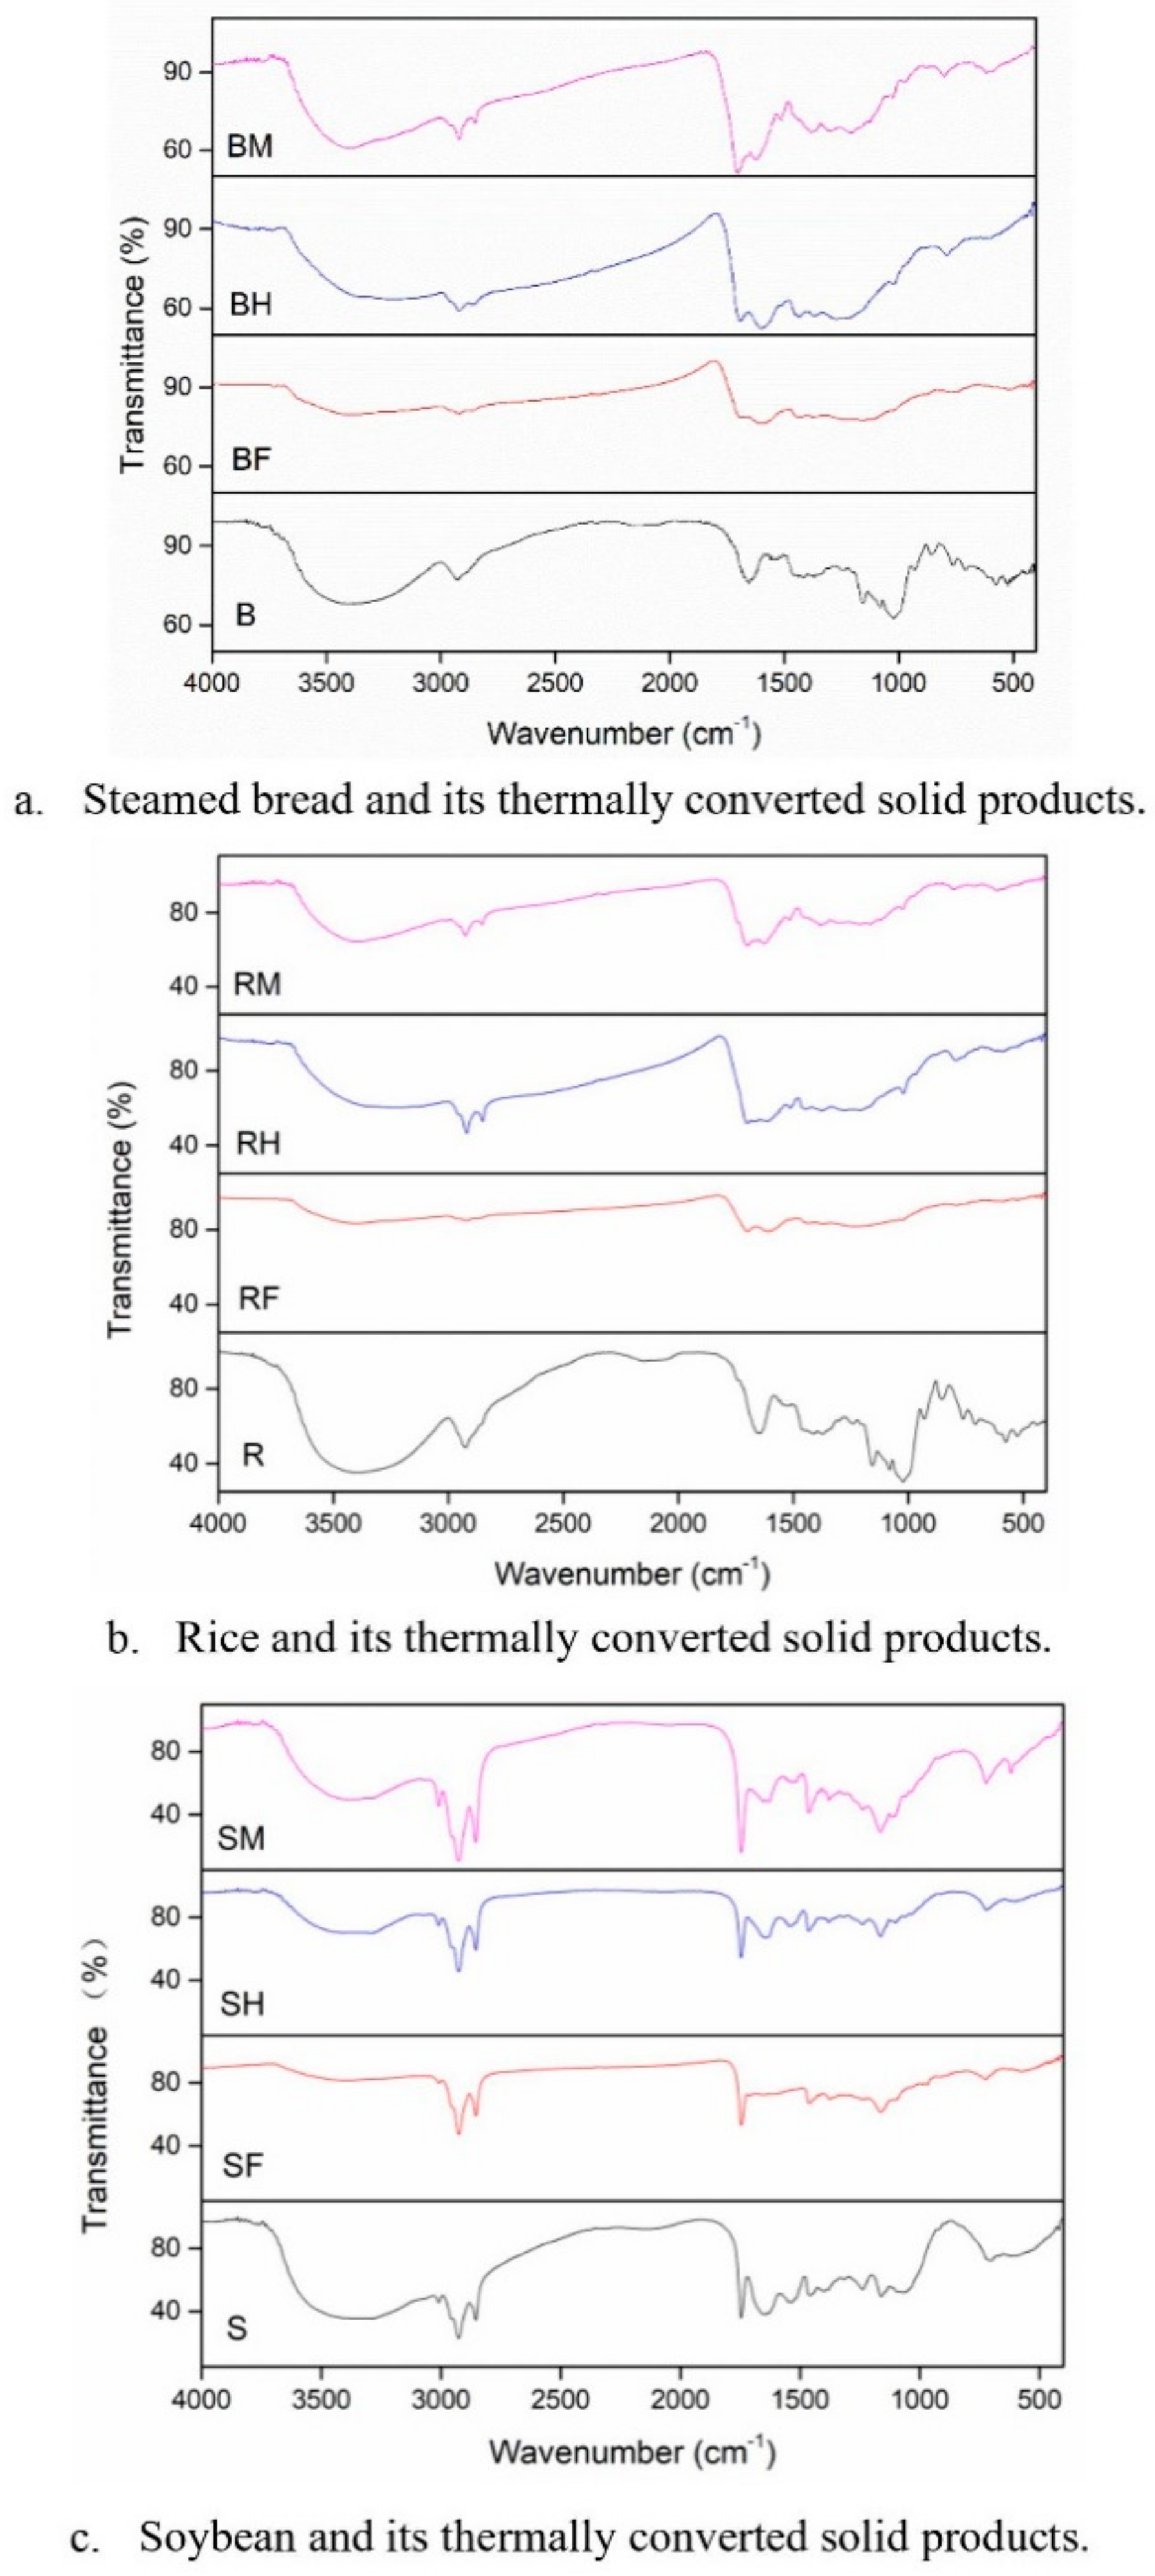
The FT-IR spectra of different biochar and FW feedstocks are shown in Figure 15 with the assignment of different peaks mentioned in literature [56]. As can be seen in Figure 15, the results of cooked steamed bread and rice and their thermal conversion products are similar due to the same composition in these two raw materials. The pyrolyzed solids have fewer peaks and higher transmission than the HTC-treated and MW-treated samples, while the cooked soybean converted biochar has more peaks in the spectrum. In addition, the peaks at 2926 cm−1 and 2851 cm−1 indicate asymmetric stretching vibrations of aliphatic C-H bond [57], which are more significant in the products of cooked soybean transformation. It indicates that the biochar prepared from cooked rice and steamed bread contains less of this structure, especially in their pyrolysis products. The peaks at 1601 cm−1 and 1498 cm−1 in the spectrum exhibit stretching vibrations, which are attributed to the presence of the aromatic ring C = C bond [58] with more in the presence of hydro char. The SM, SH and SF samples showed different peaks at 1740 cm−1 than other biochar samples due to the vibration of C = O in the fatty acids [59], which resulted in the growth advantage of the cultured wheat. However, this functional group is not the dominant factor. In addition, the stretching vibration of the C-O bond in the region of 1300 cm−1 to 1000 cm−1 proves the presence of alcohol and phenol, which is stronger in the HTC-treated product. The broad peak near 3390 cm−1 indicates that the sample contains intermolecular and free bonded hydroxyl OH [57], which is more pronounced in the original FW sample. Obviously, this peak weakens greatly after thermal conversion, while the TF pyrolyzed solid product shows weaker stretching vibrations in all products. A decrease in the hydroxyl content of the biochar means an increase in hydrophobicity, which is advantageous in helping to improve the stability and strength of the polymer [60]. It further facilitates the long-term storage of organic carbon while reducing the evaporation of water to some extent [59]. Moreover, this effect is more significant in dry areas driven by its ability to maintain soil moisture and fertility. Therefore, biochar produced from pyrolysis method are not prone to loss of moisture, which also demonstrates the ability to promote crop growth followed by MW and HPR converted carbon-rich solids. This point is also consistent with previous wheat growth trends, SEM micrographs and BET test results.
4. Conclusions
The utilization of biochar derived from food waste for agronomic purpose is a potential sustainable waste management option for the growth of crops in dry land and water-polluted areas as alternative soil. In this work, we have studied the differences in the yield of biochar produced from various food waste using different thermal conversion methods (including HPR, MW and pyrolysis) and its effect on the growth of cultivation of crop. In addition, the possible reason behind this phenomenon was initially explored. Regarding the effect of different food waste and thermal processing methods on the yield of biochar, it may be concluded that different raw materials have a huge impact on the yield of biochar, and the yield of biochar obtained by HPR method is significantly higher than that produced by MW method. For example, the yield of biochar is up to six times higher using the HPR method than the MW method when steamed bread was used as raw material. In term of the effect of biochar on the growth of wheat, biochar has a certain promoting effect, which is different due to the processing condition and raw materials. In addition, the BH, BF and SF group are more effective in promoting crops growth, which has exceeded soil culture results. The average weight of plants increased by 24.28% under these conditions. It shows the potential of biochar to be an alternative soil for growing crops. In addition, from the perspective of wheat growth trends, cooked soybeans processed by the pyrolysis method are suitable for the production that can be used as a substitute for soil. Furthermore, SEM images of biochar show that these samples mentioned above have more pits in order to store moisture, which is well documented in the BET test results. Additionally, the spectrum of FT-IR indicate that the surface of biochar contains less hydroxyl functional groups representing better hydrophobicity, which is more pronounced in pyrolyzed solid products. Hydrophobicity is an important manifestation of water storage capacity, which was demonstrated by the results of wheat growth trends and other characterization of biochar in this study. Thus, the results of this study verify the hypotheses proposed in the introduction section. This study provides evidence of the effects of biochar on crop growth, both in terms of microstructure and macroscopic growth trends, which provides significant benefits for biochar to grow crops or plants.
Supplementary Materials
The following are available online at https://0-www-mdpi-com.brum.beds.ac.uk/2227-9717/9/2/276/s1, Figure S1: Biomass samples used in the experiment (a: rice (cooked); b: steamed bread (cooked); c: soybean (cooked)); Table S1: Shape characteristics of solid products produced from FW using HPR; Table S2: Shape characteristics of solid products produced from FW using MW.
Author Contributions
All of the authors contributed significantly to the completion of this article, but they had different roles in all aspects. Conceptualization, H.B. and H.J.; methodology, H.B.; software, H.J.; validation, H.J.; formal analysis, H.J.; investigation, F.W.; visualization, H.J.; supervision, H.J.; project administration, H.B.; funding acquisition, H.B. All authors have read and agreed to the published version of the manuscript.
Funding
This research was funded by National Science Foundation of China, grant number 51706044. The APC was funded by Southeast University.
Institutional Review Board Statement
Not applicable.
Informed Consent Statement
Not applicable.
Data Availability Statement
The study did not report any data.
Acknowledgments
The authors would like to acknowledge the financial support from the National Science Foundation of China (51706044), and the Recruitment Program for Young Professionals in China. The APC was funded by the Southeast University.
Conflicts of Interest
The authors declare no conflict of interest.
References
- Ragauskas, A.J.; Williams, C.K.; Davison, B.H.; Britovsek, G.; Cairney, J.; Eckert, C.A.; Frederick, W.J.; Hallett, J.P.; Leak, D.J.; Liotta, C.L.; et al. The path forward for biofuels and biomaterials. Science 2006, 311, 484–489. [Google Scholar] [CrossRef] [PubMed] [Green Version]
- Ragauskas, A.J.; Beckham, G.T.; Biddy, M.J.; Chandra, R.; Chen, F.; Davis, M.F.; Davison, B.H.; Dixon, R.A.; Gilna, P.; Keller, M.; et al. Lignin Valorization: Improving Lignin Processing in the Biorefinery. Science 2014, 344, 709. [Google Scholar] [CrossRef] [PubMed]
- Anex, R.P.; Aden, A.; Kazi, F.K.; Fortman, J.; Swanson, R.M.; Wright, M.M.; Satrio, J.A.; Brown, R.C.; Daugaard, D.E.; Platon, A.; et al. Techno-economic comparison of biomass-to-transportation fuels via pyrolysis, gasification, and biochemical pathways. Fuel 2010, 89 (Suppl. S1), S29–S35. [Google Scholar] [CrossRef]
- Chen, W.-H.; Lin, B.-J.; Huang, M.-Y.; Chang, J.-S. Thermochemical conversion of microalgal biomass into biofuels: A review. Bioresour. Technol. 2015, 184, 314–327. [Google Scholar] [CrossRef] [PubMed]
- Ben, H.; Wu, Z.; Han, G.; Jiang, W.; Ragauskas, A. In-situ evaluation for upgrading of biomass model compounds over noble metal catalysts by isotopic tracing and NMR monitoring (vol 137, pg 253, 2019). J. Anal. Appl. Pyrolysis 2019, 142. [Google Scholar] [CrossRef]
- Ben, H.; Wu, Z.; Han, G.; Jiang, W.; Ragauskas, A. Pyrolytic Behavior of Major Biomass Components in Waste Biomass. Polymers 2019, 11, 324. [Google Scholar] [CrossRef] [Green Version]
- Chan, K.Y.; Van Zwieten, L.; Meszaros, I.; Downie, A.; Joseph, S. Agronomic values of greenwaste biochar as a soil amendment. Aust. J. Soil Res. 2007, 45, 629–634. [Google Scholar] [CrossRef]
- Shu, T.; Lu, F.; Wang, Q.; Lu, P. Study on Pore Structure Properties of Steam Activated Biomass Chars; Springer: Berlin/Heidelberg, Germany, 2012; pp. 216–219. [Google Scholar]
- Bruun, E.W.; Ambus, P.; Egsgaard, H.; Hauggaard-Nielsen, H. Effects of slow and fast pyrolysis biochar on soil C and N turnover dynamics. Soil Biol. Biochem. 2012, 46, 73–79. [Google Scholar] [CrossRef]
- Sohi, S.P. Carbon Storage with Benefits. Science 2012, 338, 1034–1035. [Google Scholar] [CrossRef]
- Woolf, D.; Amonette, J.E.; Street-Perrott, F.A.; Lehmann, J.; Joseph, S. Sustainable biochar to mitigate global climate change. Nat. Commun. 2010, 1. [Google Scholar] [CrossRef] [Green Version]
- Bogusz, A.; Oleszczuk, P.; Dobrowolski, R. Application of laboratory prepared and commercially available biochars to adsorption of cadmium, copper and zinc ions from water. Bioresour. Technol. 2015, 196, 540–549. [Google Scholar] [CrossRef] [PubMed]
- Bashir, S.; Shaaban, M.; Mehmood, S.; Zhu, J.; Fu, Q.L.; Hu, H.Q. Efficiency of C3 and C4 Plant Derived-Biochar for Cd Mobility, Nutrient Cycling and Microbial Biomass in Contaminated Soil. Bull. Environ. Contam. Toxicol. 2018, 100, 834–838. [Google Scholar] [CrossRef]
- Mohan, D.; Pittman, C.U., Jr.; Bricka, M.; Smith, F.; Yancey, B.; Mohammad, J.; Steele, P.H.; Alexandre-Franco, M.F.; Gomez-Serrano, V.; Gong, H. Sorption of arsenic, cadmium, and lead by chars produced from fast pyrolysis of wood and bark during bio-oil production. J. Colloid Interface Sci. 2007, 310, 57–73. [Google Scholar] [CrossRef] [PubMed]
- Sombroek, W.G.; Nachtergaele, F.O.; Hebel, A. Amounts, dynamics and sequestering of carbon in tropical and subtropical soils. Ambio 1993, 22, 417–426. [Google Scholar]
- Zhou, G.; Zhou, X.; Zhang, T.; Du, Z.; He, Y.; Wang, X.; Shao, J.; Cao, Y.; Xue, S.; Wang, H.; et al. Biochar increased soil respiration in temperate forests but had no effects in subtropical forests. For. Ecol. Manag. 2017, 405, 339–349. [Google Scholar] [CrossRef]
- Xu, L.; Fang, H.; Deng, X.; Ying, J.; Lv, W.; Shi, Y.; Zhou, G.; Zhou, Y. Biochar application increased ecosystem carbon sequestration capacity in a Moso bamboo forest. For. Ecol. Manag. 2020, 475. [Google Scholar] [CrossRef]
- Kuzyakov, Y.; Subbotina, I.; Chen, H.; Bogomolova, I.; Xu, X. Black carbon decomposition and incorporation into soil microbial biomass estimated by C-14 labeling. Soil Biol. Biochem. 2009, 41, 210–219. [Google Scholar] [CrossRef]
- Cheng, C.-H.; Lehmann, J.; Thies, J.E.; Burton, S.D. Stability of black carbon in soils across a climatic gradient. J. Geophys. Res. Biogeosci. 2008, 113. [Google Scholar] [CrossRef] [Green Version]
- Schmidt, M.W.I.; Noack, A.G. Black carbon in soils and sediments: Analysis, distribution, implications, and current challenges. Glob. Biogeochem. Cycles 2000, 14, 777–793. [Google Scholar] [CrossRef]
- Zhang, A.; Cui, L.; Pan, G.; Li, L.; Hussain, Q.; Zhang, X.; Zheng, J.; Crowley, D. Effect of biochar amendment on yield and methane and nitrous oxide emissions from a rice paddy from Tai Lake plain, China. Agric. Ecosyst. Environ. 2010, 139, 469–475. [Google Scholar] [CrossRef]
- Steiner, C.; Teixeira, W.G.; Lehmann, J.; Nehls, T.; de Macedo, J.L.V.; Blum, W.E.H.; Zech, W. Long term effects of manure, charcoal and mineral fertilization on crop production and fertility on a highly weathered Central Amazonian upland soil. Plant. Soil 2007, 291, 275–290. [Google Scholar] [CrossRef] [Green Version]
- Chan, K.Y.; Van Zwieten, L.; Meszaros, I.; Downie, A.; Joseph, S. Using poultry litter biochars as soil amendments. Aust. J. Soil Res. 2008, 46, 437–444. [Google Scholar] [CrossRef]
- Lai, C.; Yang, Y.; Tao, C.; Wang, Y.; Guo, J.; Wang, B.; Ruan, Y.; Zhao, Y. Effects of replanted banana after rotation of different crops on banana production and soil fertility quality. Jiangsu J. Agric. Sci. 2018, 34, 299–306. [Google Scholar]
- Rondon, M.A.; Lehmann, J.; Ramirez, J.; Hurtado, M. Biological nitrogen fixation by common beans (Phaseolus vulgaris L.) increases with bio-char additions. Biol. Fertil. Soils 2007, 43, 699–708. [Google Scholar] [CrossRef]
- Uzoma, K.C.; Inoue, M.; Andry, H.; Fujimaki, H.; Zahoor, A.; Nishihara, E. Effect of cow manure biochar on maize productivity under sandy soil condition. Soil Use Manag. 2011, 27, 205–212. [Google Scholar] [CrossRef]
- Glaser, B.; Lehmann, J.; Zech, W. Ameliorating physical and chemical properties of highly weathered soils in the tropics with charcoal—A review. Biol. Fertil. Soils 2002, 35, 219–230. [Google Scholar] [CrossRef]
- Agegnehu, G.; Srivastava, A.K.; Bird, M.I. The role of biochar and biochar-compost in improving soil quality and crop performance: A review. Appl. Soil Ecol. 2017, 119, 156–170. [Google Scholar] [CrossRef]
- Steinbeiss, S.; Gleixner, G.; Antonietti, M. Effect of biochar amendment on soil carbon balance and soil microbial activity. Soil Biol. Biochem. 2009, 41, 1301–1310. [Google Scholar] [CrossRef]
- Anderson, C.R.; Condron, L.M.; Clough, T.J.; Fiers, M.; Stewart, A.; Hill, R.A.; Sherlock, R.R. Biochar induced soil microbial community change: Implications for biogeochemical cycling of carbon, nitrogen and phosphorus. Pedobiologia 2011, 54, 309–320. [Google Scholar] [CrossRef]
- Ciais, P.; Reichstein, M.; Viovy, N.; Granier, A.; Ogée, J.; Allard, V.; Aubinet, M.; Buchmann, N.; Bernhofer, C.; Carrara, A.; et al. Europe-wide reduction in primary productivity caused by the heat and drought in 2003. Nature 2005, 437, 529–533. [Google Scholar] [CrossRef]
- Zhang, T.; Cao, Y.; Chen, Y.; Liu, G. Non-structural carbohydrate dynamics in Robinia pseudoacacia saplings under three levels of continuous drought stress. Trees Struct. Funct. 2015, 29, 1837–1849. [Google Scholar] [CrossRef]
- Utomo, W.; Islami, T.; Wisnubroto, E.I.; Suhartini. Biochar as a carrier for nitrogen plant nutrition: 2, The growth of maize (Zea mays L.) applied with nitrogen enriched biochar on different soil texture. Biosci. Res. 2018, 15, 1749–1756. [Google Scholar]
- Li, C.; Li, X. Effect of biochar preparation and its application amount on soil carbon pool and plant growth. J. South. Argic. 2015, 46, 1786–1791. [Google Scholar]
- Prapagdee, S.; Tawinteung, N. Effects of biochar on enhanced nutrient use efficiency of green bean, Vigna radiata L. Environ. Sci. Pollut. Res. 2017, 24, 9460–9467. [Google Scholar] [CrossRef]
- Zhou, Z.; Bu, X.; Wu, Y.; Xue, J. Research advances in biochar effects on soil microbial properties. J. Nanjing For. Univ. Nat. Sci. Ed. 2016, 40, 1–8. [Google Scholar]
- Lin, Q.; Zhang, L.; Riaz, M.; Zhang, M.; Xia, H.; Lv, B.; Jiang, C. Assessing the potential of biochar and aged biochar to alleviate aluminum toxicity in an acid soil for achieving cabbage productivity. Ecotoxicol. Environ. Saf. 2018, 161, 290–295. [Google Scholar] [CrossRef]
- Liu, Z.; Balasubramanian, R. Upgrading of waste biomass by hydrothermal carbonization (HTC) and low temperature pyrolysis (LTP): A comparative evaluation. Appl. Energy 2014, 114, 857–864. [Google Scholar] [CrossRef]
- Magdeldin, M.; Kohl, T.; De Blasio, C.; Jarvinen, M.; Park, S.W.; Giudici, R. The BioSCWG Project: Understanding the Trade-Offs in the Process and Thermal Design of Hydrogen and Synthetic Natural Gas Production. Energies 2016, 9, 838. [Google Scholar] [CrossRef] [Green Version]
- Kruse, A.; Dahmen, N. Water—A magic solvent for biomass conversion. J. Supercrit. Fluids 2015, 96, 36–45. [Google Scholar] [CrossRef]
- Kaushik, R.; Parshetti, G.K.; Liu, Z.; Balasubramanian, R. Enzyme-assisted hydrothermal treatment of food waste for co-production of hydrochar and bio-oil. Bioresour. Technol. 2014, 168, 267–274. [Google Scholar] [CrossRef]
- Zhang, Y.; Jiang, Q.; Xie, W.; Wang, Y.; Kang, J. Effects of temperature, time and acidity of hydrothermal carbonization on the hydrochar properties and nitrogen recovery from corn stover. Biomass Bioenergy 2019, 122, 175–182. [Google Scholar] [CrossRef]
- Yao, Z.; Ma, X. Effects of hydrothermal treatment on the pyrolysis behavior of Chinese fan palm. Bioresour. Technol. 2018, 247, 504–512. [Google Scholar] [CrossRef] [PubMed]
- Yao, Z.; Ma, X. Hydrothermal carbonization of Chinese fan palm. Bioresour. Technol. 2019, 282, 28–36. [Google Scholar] [CrossRef] [PubMed]
- Antal, M.J.; Gronli, M. The art, science, and technology of charcoal production. Ind. Eng. Chem. Res. 2003, 42, 1619–1640. [Google Scholar] [CrossRef]
- Hossain, M.K.; Strezov, V.; Chan, K.Y.; Nelson, P.F. Agronomic properties of wastewater sludge biochar and bioavailability of metals in production of cherry tomato (Lycopersicon esculentum). Chemosphere 2010, 78, 1167–1171. [Google Scholar] [CrossRef]
- McKendry, P. Energy production from biomass (part 2): Conversion technologies. Bioresour. Technol. 2002, 83, 47–54. [Google Scholar] [CrossRef]
- Yao, Z.; Ma, X.; Lin, Y. Effects of hydrothermal treatment temperature and residence time on characteristics and combustion behaviors of green waste. Appl. Therm. Eng. 2016, 104, 678–686. [Google Scholar] [CrossRef]
- Fang, Y.; Liu, L.; Xu, B.-C.; Li, F.-M. The relationship between competitive ability and yield stability in an old and a modern winter wheat cultivar. Plant. Soil 2011, 347, 7–23. [Google Scholar] [CrossRef]
- Vandeleur, R.K.; Gill, G.S. The impact of plant breeding on the grain yield and competitive ability of wheat in Australia. Aust. J. Agric. Res. 2004, 55, 855–861. [Google Scholar] [CrossRef]
- Yenish, J.R.; Young, F.L. Winter wheat competition against jointed goatgrass (Aegilops cylindrica) as influenced by wheat plant height, seeding rate, and seed size. Weed Sci. 2004, 52, 996–1001. [Google Scholar] [CrossRef]
- Mason, H.; Goonewardene, L.; Spaner, D. Competitive traits and the stability of wheat cultivars in differing natural weed environments on the northern Canadian Prairies. J. Agric. Sci. 2008, 146, 21–33. [Google Scholar] [CrossRef]
- Murphy, K.M.; Dawson, J.C.; Jones, S.S. Relationship among phenotypic growth traits, yield and weed suppression in spring wheat landraces and modern cultivars. Field Crop. Res. 2008, 105, 107–115. [Google Scholar] [CrossRef]
- Kannan, S.; Gariepy, Y.; Raghavan, G.S.V. Optimization and characterization of hydrochar produced from microwave hydrothermal carbonization of fish waste. Waste Manag. 2017, 65, 159–168. [Google Scholar] [CrossRef] [PubMed]
- Jain, A.; Balasubramanian, R.; Srinivasan, M.P. Hydrothermal conversion of biomass waste to activated carbon with high porosity: A review. Chem. Eng. J. 2016, 283, 789–805. [Google Scholar] [CrossRef]
- Tandy, S.; Healey, J.R.; Nason, M.A.; Williamson, J.C.; Jones, D.L.; Thain, S.C. FT-IR as an alternative method for measuring chemical properties during composting. Bioresour. Technol. 2010, 101, 5431–5436. [Google Scholar] [CrossRef] [PubMed]
- Jin, J.; Li, Y.; Zhang, J.; Wu, S.; Cao, Y.; Liang, P.; Zhang, J.; Wong, M.H.; Wang, M.; Shan, S.; et al. Influence of pyrolysis temperature on properties and environmental safety of heavy metals in biochars derived from municipal sewage sludge. J. Hazard. Mater. 2016, 320, 417–426. [Google Scholar] [CrossRef] [PubMed]
- Bajwa, D.S.; Adhikari, S.; Shojaeiarani, J.; Bajwa, S.G.; Pandey, P.; Shanmugam, S.R. Characterization of bio-carbon and ligno-cellulosic fiber reinforced bio-composites with compatibilizer. Constr. Build. Mater. 2019, 204, 193–202. [Google Scholar] [CrossRef]
- Liu, Z.; Han, G. Production of solid fuel biochar from waste biomass by low temperature pyrolysis. Fuel 2015, 158, 159–165. [Google Scholar] [CrossRef]
- Liu, Z.; Quek, A.; Hoekman, S.K.; Balasubramanian, R. Production of solid biochar fuel from waste biomass by hydrothermal carbonization. Fuel 2013, 103, 943–949. [Google Scholar] [CrossRef]
Figure 1.
The flowchart of experimental setups. (1. HPR: High-pressure reactor; 2. MW: Microwave.)

Figure 2.
Diagram of hydrothermal carbonization of food waste powder. (HTC: hydrothermal conversion).
Figure 2.
Diagram of hydrothermal carbonization of food waste powder. (HTC: hydrothermal conversion).

Figure 3.
Schematic diagram of the pyrolysis experiment.

Figure 4.
The yield of biochar produced from cooked rice after the HTC process. (a): the HTC process is performed in HPR; (b): the HTC process is performed in MW. Values are presented as mean ± SD from three experiments. 1 Only the reaction temperature changed in the reaction conditions. The reaction time was 1 h, and the sulfuric acid concentration was 3 v/v%. 2 Only the reaction time changed in the reaction conditions. The reaction temperature was 210 °C/180 °C, respectively, and the sulfuric acid concentration was 3 v/v%. 3 Only the concentration of sulfuric acid changed in the reaction conditions. The reaction temperature was 210 °C/180 °C, respectively, and the reaction time was 1 h.

Figure 5.
The yield of biochar produced from cooked soybean after the HTC process. (a): The HTC process is performed in HPR; (b): the HTC process is performed in MW. Values are presented as mean ± SD from three experiments. 1 Only the reaction temperature changed in the reaction conditions. The reaction time was 1 h, and the sulfuric acid concentration was 3 v/v%. 2 Only the reaction time changed in the reaction conditions. The reaction temperature was 210 °C/180 °C, respectively, and the sulfuric acid concentration was 3 v/v%. 3 Only the concentration of sulfuric acid changed in the reaction conditions.

Figure 6.
The yield of biochar produced from cooked steamed bread after the HTC process. (a): The HTC process is performed in HPR; (b): the HTC process is performed in MW. Values are presented as mean ± SD from three experiments. 1 Only the reaction temperature changed in the reaction conditions. The reaction time was 1 h, and the sulfuric acid concentration was 3 v/v%. 2 Only the reaction time changed in the reaction conditions. The reaction temperature was 210 °C/180 °C, respectively, and the sulfuric acid concentration was 3 v/v%. 3 Only the concentration of sulfuric acid changed in the reaction conditions.

Figure 7.
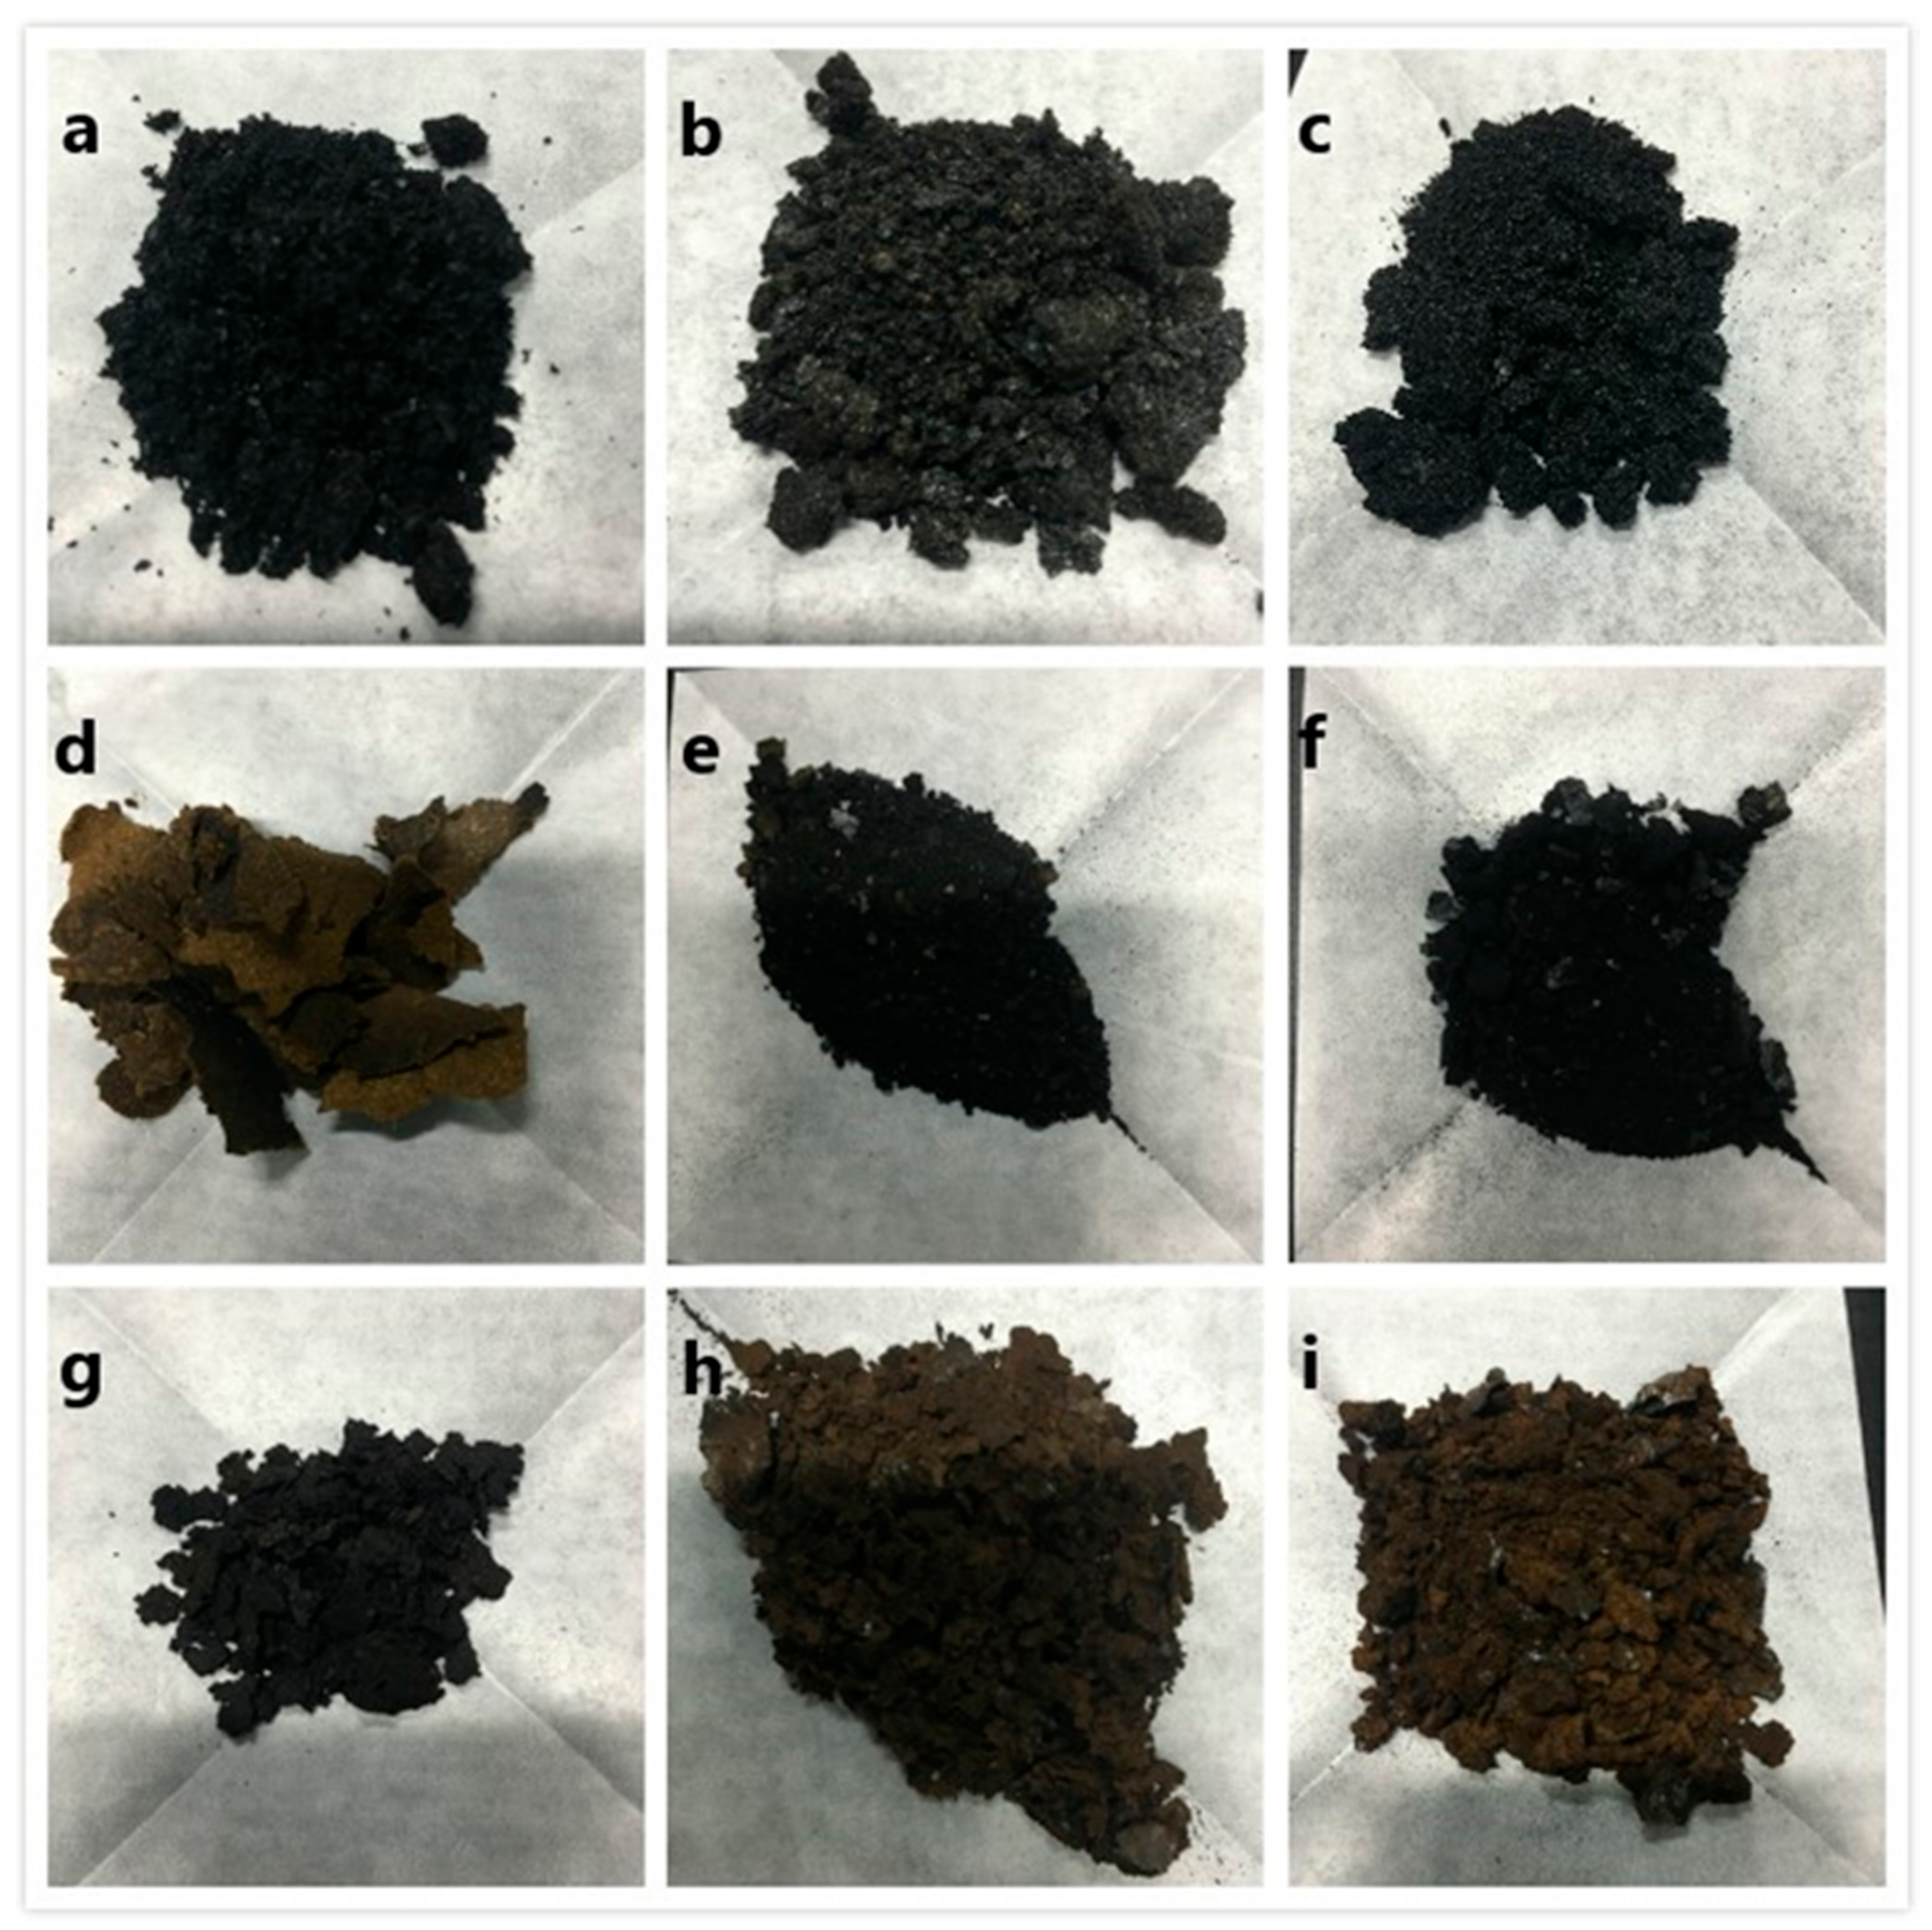
Different carbon-rich solids prepared by optimal conditions ((a): BF; (b): BH; (c): BM; (d): RF; (e): RH; (f): RM; (g): SF; (h): SH; (i): SM). The abbreviation for the type of biochar consists of two uppercase letters. The first capital letter represents the FW material for the preparation of biochar (S: cooked soybean; B: cooked steamed bread; R: cooked rice). The second capital letter represents the reactor for the preparation of bi-ochar (M: microwave; H: high pressure reactor; F: tube furnace). For example, RH represents the biochar produced from cooked rice in a high-pressure reactor after using the above experimental conditions.
Figure 7.
Different carbon-rich solids prepared by optimal conditions ((a): BF; (b): BH; (c): BM; (d): RF; (e): RH; (f): RM; (g): SF; (h): SH; (i): SM). The abbreviation for the type of biochar consists of two uppercase letters. The first capital letter represents the FW material for the preparation of biochar (S: cooked soybean; B: cooked steamed bread; R: cooked rice). The second capital letter represents the reactor for the preparation of bi-ochar (M: microwave; H: high pressure reactor; F: tube furnace). For example, RH represents the biochar produced from cooked rice in a high-pressure reactor after using the above experimental conditions.

Figure 8.
Height of wheats grown in biochar prepared using MW. (a) The top two highest plants (numbered as H1-2); (b) the other six plants except the top two (numbered as H6). Values are presented as mean ± SD.
Figure 8.
Height of wheats grown in biochar prepared using MW. (a) The top two highest plants (numbered as H1-2); (b) the other six plants except the top two (numbered as H6). Values are presented as mean ± SD.

Figure 9.
Height of wheats grown in biochar prepared using HPR. (a) The top two highest plants (numbered as H1-2); (b) the other six plants except the top two (numbered as H6). Values are presented as mean ± SD.
Figure 9.
Height of wheats grown in biochar prepared using HPR. (a) The top two highest plants (numbered as H1-2); (b) the other six plants except the top two (numbered as H6). Values are presented as mean ± SD.

Figure 10.
Height of wheats grown in biochar prepared using TF. (a) The top two highest plants (numbered as H1-2); (b) the other six plants except the top two (numbered as H6). Values are presented as mean ± SD.
Figure 10.
Height of wheats grown in biochar prepared using TF. (a) The top two highest plants (numbered as H1-2); (b) the other six plants except the top two (numbered as H6). Values are presented as mean ± SD.

Figure 11.
The growth status of wheats at the end of cultivation.

Figure 12.
The weight of wheats plants (both H1-2 and H6) cultivated in different conditions.

Figure 13.
The height curves of wheat plants under different biochar conditions. The heights of H1-2 are labeled in capital letters; the heights of H6 are labeled in lowercase letters.
Figure 13.
The height curves of wheat plants under different biochar conditions. The heights of H1-2 are labeled in capital letters; the heights of H6 are labeled in lowercase letters.

Figure 14.
SEM image of biochar obtained with different treatments and its raw materials (1500×).

Figure 15.
The FT-IR spectra of different biochar and FW feedstocks.


Table 1.
Study on the effect of biochar on crop yield.
| Crops | Yield Increase Rate | Biochar Addition | Literature |
|---|---|---|---|
| Paddy | +12%, +14% | 10 t/hm2, 40 t/hm2 | [21] |
| Paddy and sorghum | +75% | 11 t/hm2 | [22] |
| Radish | +42%, +96% | 10 t/hm2, 50 t/hm2 | [23] |
| Perennial ryegrass | +20%, +52% | 30 t/hm2, 60 t/hm2 | [24] |
| Soybean | +46% | 90 g/kg | [25] |
Table 2.
Raw material moisture analysis.
| Biomass Species | Moisture Content/wt% |
|---|---|
| Rice (cooked) | 56.76 |
| Soybean (cooked) | 61.15 |
| Steamed bread (cooked) | 42.97 |
Table 3.
The experimental conditions for the preparation of biochar from FW through HTC treatment.
| Sample | Reactor | Temperature (℃) | Time (min) | Concentration of Sulfuric Acid (v/v%) | Biochar Yield (%) | Biochar Naming |
|---|---|---|---|---|---|---|
| Rice cooked | HPR | 210 | 60 | 3 | 41.71 ± 1.45 | RH |
| MW | 180 | 20 | 3 | 10.34 ± 0.20 | RM | |
| Soybean cooked | HPR | 180 | 30 | 0 | 20.00 ± 0.60 | SH |
| MW | 200 | 20 | 3 | 17.35 ± 0.72 | SM | |
| Steamed bread cooked | HPR | 240 | 90 | 0 | 42.56 ± 1.86 | BH |
| MW | 180 | 20 | 3 | 6.83 ± 0.64 | BM |
Table 4.
The weight of biochar prepared by FW for wheat culture.
| The Type of Biochar | Weight of Biochar Used to Directly Cultivate Wheat [g] |
|---|---|
| RH | 2.0096 |
| RM | 2.0069 |
| RF | 2.0073 |
| BH | 2.0089 |
| BM | 2.0030 |
| BF | 2.0052 |
| SH | 2.0078 |
| SM | 2.0079 |
| SF | 2.0068 |
| S(Soil) | -- |
| W(Water) | -- |
| G(Silica) | -- |
Table 5.
The surface area of biochar and FW determined by BET and the final height of wheat plants based on them.
Table 5.
The surface area of biochar and FW determined by BET and the final height of wheat plants based on them.
| Sample Name | B | BF | BH | BM | R | RF |
|---|---|---|---|---|---|---|
| BET surface area (m2/g) | 0.0244 | 0.0142 | 1.0959 | 2.7996 | 0.0766 | 0.0063 |
| The height of H6 (cm) | -- | 16.40 | 10.92 | 10.81 | -- | 12.00 |
| Sample name | RH | RM | S | SF | SH | SM |
| BET surface area (m2/g) The height of H6 (cm) | 0.6856 7.82 | 2.6872 8.26 | 0.0822 -- | 0.0058 16.40 | 0.0966 13.93 | 0.1758 11.85 |
Publisher’s Note: MDPI stays neutral with regard to jurisdictional claims in published maps and institutional affiliations. |
© 2021 by the authors. Licensee MDPI, Basel, Switzerland. This article is an open access article distributed under the terms and conditions of the Creative Commons Attribution (CC BY) license (http://creativecommons.org/licenses/by/4.0/).
Share and Cite
MDPI and ACS Style
Jia, H.; Ben, H.; Wu, F. Effect of Biochar Prepared from Food Waste through Different Thermal Treatment Processes on Crop Growth. Processes 2021, 9, 276. https://0-doi-org.brum.beds.ac.uk/10.3390/pr9020276
AMA Style
Jia H, Ben H, Wu F. Effect of Biochar Prepared from Food Waste through Different Thermal Treatment Processes on Crop Growth. Processes. 2021; 9(2):276. https://0-doi-org.brum.beds.ac.uk/10.3390/pr9020276
Chicago/Turabian StyleJia, Hang, Haoxi Ben, and Fengze Wu. 2021. "Effect of Biochar Prepared from Food Waste through Different Thermal Treatment Processes on Crop Growth" Processes 9, no. 2: 276. https://0-doi-org.brum.beds.ac.uk/10.3390/pr9020276
Note that from the first issue of 2016, this journal uses article numbers instead of page numbers. See further details here.