
Determination of Transformers’ Insulating Paper State Based on Classification Techniques


Electrical Engineering Department, College of Engineering, Taif University, Taif 21944, Saudi Arabia
Processes 2021, 9(3), 427; https://0-doi-org.brum.beds.ac.uk/10.3390/pr9030427
Submission received: 7 February 2021
/
Revised: 18 February 2021
/
Accepted: 23 February 2021
/
Published: 27 February 2021
(This article belongs to the Special Issue Power System Expansion Planning)
Abstract
:The continuity of transformer operation is very necessary for utilities to maintain a continuity of power flow in networks and achieve a desired revenue. Most failures in a transformer are due to the degradation of the insulating system, which consists of insulating oil and paper. The degree of polymerization (DP) is a key detector of insulating paper state. Most research in the literature has computed the DP as a function of furan compounds, especially 2-furfuraldehyde (2-FAL). In this research, a prediction model was constructed based on some of most periodical tests that were conducted on transformer insulating oil, which were used as predictors of the insulating paper state. The tests evaluated carbon monoxide (CO), carbon dioxide (CO2), breakdown voltage (VBD), interfacial tension (IF), acidity (ACY), moisture (M), oil color (OC), and 2-furfuraldehyde (2-FAL). The DP, which was used as the key indicator for the paper state, was categorized into five classes labeled 1, 2, 3, 4, and 5 to express the insulating paper normal aging rate, accelerating aging rate, excessive aging danger zone, high risk of failure, and the end of expected life, respectively. The classification techniques were applied to the collected data samples to construct a prediction model for the insulating paper state, and the results revealed that the fine tree was the best classifier of the data samples, with a 96.2% prediction accuracy.
1. Introduction
The power transformer is one of the most important assets in a power system. Malfunctions often occur in a transformer insulating system due to electrical and thermal stresses, and then electrical utilities incur tremendous losses due to the switching off operation of the transformer to repair its faults [1,2,3,4]. The health index (HI) is an indicator to the transformer condition. It is computed based on the electrical, physical, and chemical parameters of the oil and insulating paper, and it is related to the ability of the transformer to withstand failure [3]. To detect and analyze transformer faults, some necessary tests must be performed on insulating oil samples to interpret the source of their faults. The test categories are electrical, physical, and chemical. These tests include those for dissolved gases, especially carbon monoxide (CO) and carbon dioxide (CO2) in part per million (ppm), the breakdown voltage (VBD) that measures the dielectric strength of the oil in kV/cm, the interfacial tension (IF) in millinewton per m, the oil acidity (ACY) in potassium hydroxide/gm (KOH/g), the moisture content (M) in ppm (which dramatically reduce the strength of the insulating system), the oil color (OC) that refers to the decomposing of the oil, and the dissolved furan compounds (especially 2-furfuraldehyde (2-FAL)) in ppm. The influence of these test parameters on the degree of polymerization (DP), which is the key indicator for insulating paper condition, has been investigated in several publications [5,6,7,8].
The degradation of insulating paper can be evaluated by a DP measurement, where an actual insulating paper sample is claimed from a transformer to measure the DP while considering international electrotechnical commission IEC 60450-2007 [9], but this is impractical due to the difficulty of switching off a transformer from its service. Several DP formulas, which are based on the correlation between the magnitude of the DP and the 2-FAL, can be used to measure paper degradation [10,11,12,13,14]. Several degradation types, such as hydrolytic, thermal, and oxidative degradation, occur in insulating paper. These degradation types lead to 2-FAL formation in insulating oil, which is used as an indicator of the DP value and information about insulating paper state. 2-FAL can be measured using HPLC [15].
Most researchers have interpreted insulating paper condition based on the DP value, which is based on 2-FAL in the insulating oil [12,13,14,15]. The interpretation has some shortcomings [16,17] for the following reasons: (i) the reduced concentration of the 2-FAL in some insulating paper fails because the paper is adsorbed to 2-FAL, thus making the results of the 2-FAL concentration in the transformer oil incorrect [16,18], (ii) the logarithmic relationship between the DP and 2-FAL reveal that a significant change in the DP can result from a small change of 2-FAL concentration [16,19], and (iii) the measurement technique for 2-FAL cannot indicate the real state of the insulating paper for the initial aging stage [16]. Therefore, correlating the insulating paper state based on the magnitude of the DP while considering the 2-FAL concentration is not accurate.
Attributing the value of the DP and then the insulating paper state to a single indicator can lead to inconsistent results for the same oil–paper sample due to the poor accuracy of the mathematical model to correlate the individual indicator with the DP value. Most research has utilized the 2-FAL as an indicator of the DP value, but each model can provide different results because a single indicator fails to provide an accurate value of the DP [4]. Therefore, in this study, classification techniques were used to construct a prediction model for the insulating paper degradation rate. The MATLAB classification learner tool was used to get the best classification techniques that could provide a high accuracy for categorizing insulating paper state classes. The constructed model was built based on the DP value of several oil samples (131 samples) that were tested for different electrical, physical, and chemical parameters. Eight parameters—CO, CO2, VBD, IF, ACY, M, OC, and 2-FAL—to avoid poor accuracy using a single DP indicator. The insulating paper state was categorized into five classes to express the insulating paper’s normal aging rate, accelerating aging rate, excessive aging danger zone, high risk of failure, and the end of expected life. These classification categories were categorized as shown in Table 1 [20,21]. The results revealed that the fine tree was the best classification technique because it provided an accuracy of 96.2% in detecting the insulating paper state.
2. Experimental Work
In this section, the important tests conducted on insulating oil to investigate the state of insulating paper of the power transformer are explained. All oil tests have been explained in detail in the literature. Most important tests and their procedures, such as the dissolved gas analysis (DGA) test that is used to determine the concentration of the dissolved gas (especially CO and CO2, which generate with the degradation of the insulating paper), have been illustrated. The determination of the furan compound dissolved in the oil, especially 2-FAL, has also been explained.
The chromatographic analysis of dissolved gases in transformer oils is considered to the most common method for detecting a very small amount of dissolved gases in insulating oils. This analysis indicates the condition of the transformer and the beginning of any faults that have occurred so that the transformers can be preserved, avoid an increase of the faults, and be repaired before the complete breakdown of the transformer. The accuracy of the results of a chromatographic analysis depends on the method of drawing the oil sample from the transformer, extracting the dissolved gases from it, and adjusting the analyzer device. The recommendation is to do this analysis at the beginning of transformer operation, thus making the test results a reference. A chromatographic analysis is defined as a physical separation method where the components to be separated are distributed between two layers; one is the stationary phase, and the other is the mobile phase, which passes through the stationary layer [22]. The procedures of DGA in insulating oil using gas chromatography (GC) is explained in American Society for Testing and Materials ASTM D3612-2 [23]. GC consists of a carrier gas source, a regulator for pressure, flow meters, a single injection port, and chromatography columns, detectors, recording integrators, or recorders. GC has the means to control and measure temperatures of an adsorption column, an inlet port, and a detector up to 65.5 °C.
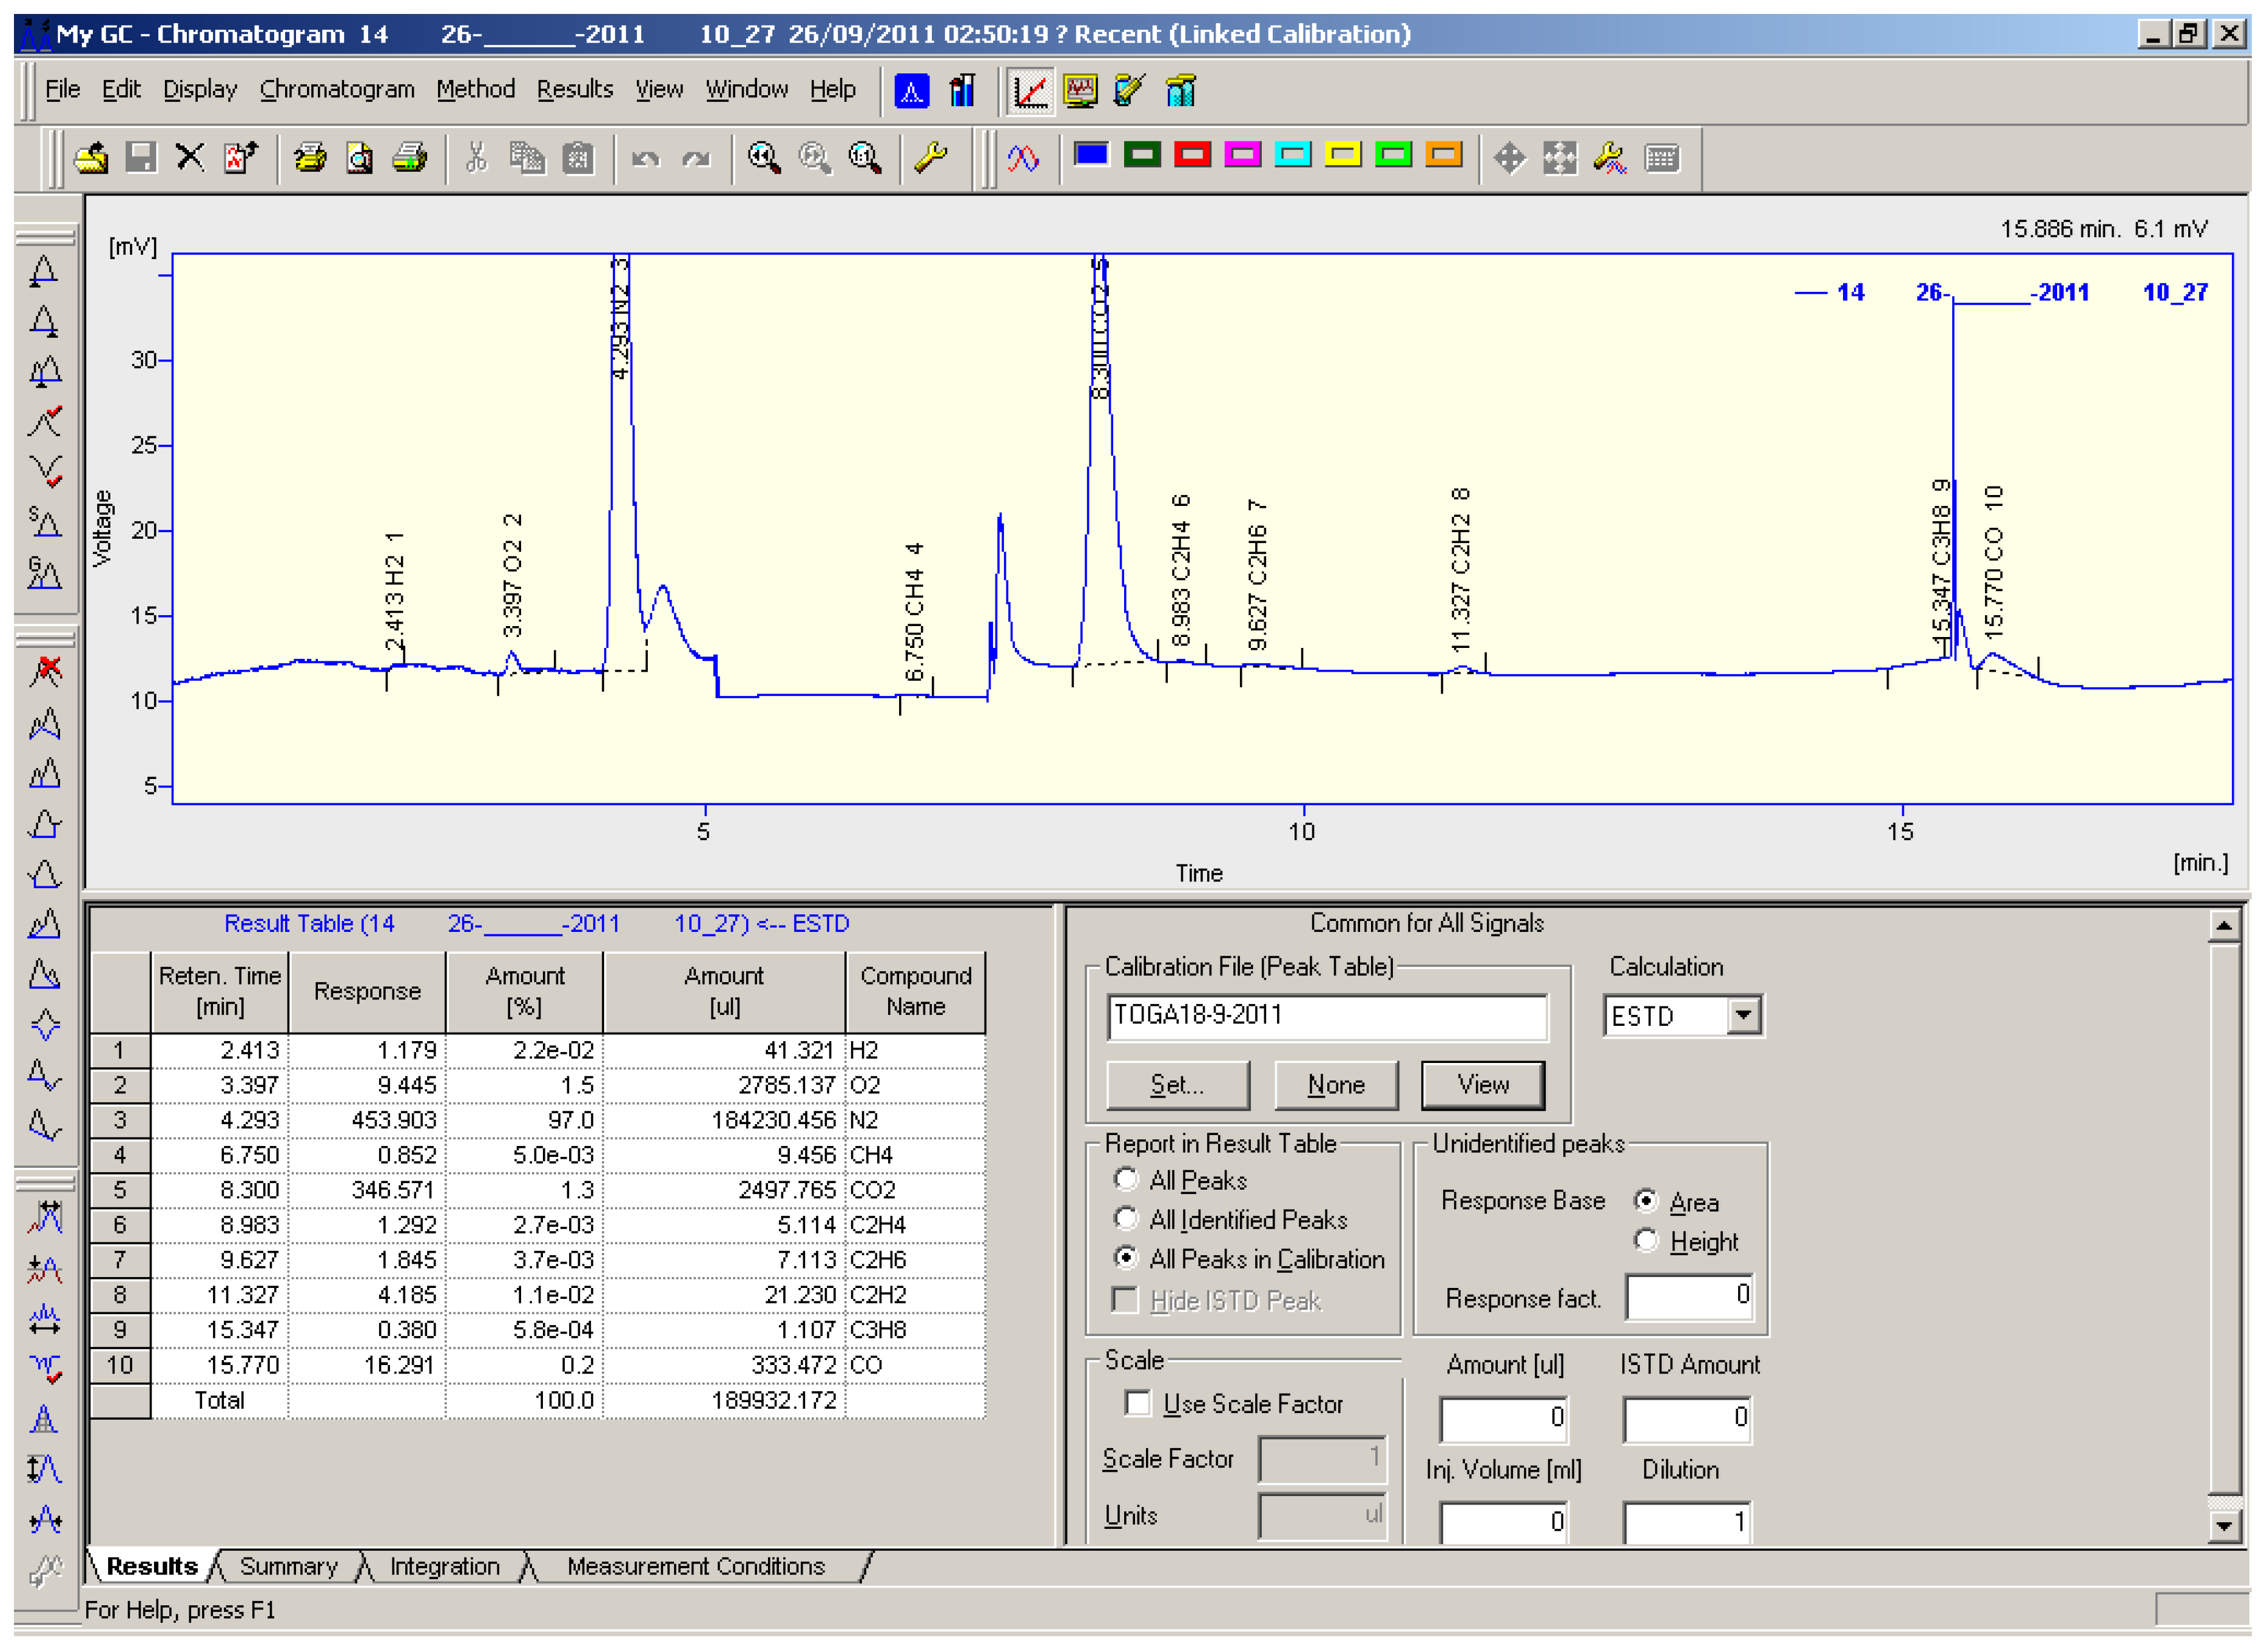
Here, oil samples were prepared and placed in special glass containers (vials) by a sampling device and then placed into an autosampler unit, which started analyzing the samples one by one after inserting them into the oven at a temperature of 80 °C. The dissolved gases were extracted from the oil sample inside the vials by increasing the temperature with continuous movement of the sample, which was left in the oven for 30 min. Then, the extracted gases were injected into the chromatography device (GC), where they were analyzed before the curves for each sample were drawn separately [23]. Figure 1 depicts the results analysis of the GC, including the chart that illustrates the time required to extract each gas and its concentration in ppm. Each of the dissolved gases appears at the peaks of the curves within a minute. The table in the screenshot also illustrates the percent of each gas as a percentage of the concentration of the total gases.
To measure the furanic compounds, high performance liquid chromatography (HPLC), was used. The procedures to measure furanic compounds complied with ASTM D5837 [24]. The preparation of the samples was as follows.
- We weighed out of 0.1 g of the five furan compounds.
- These were dissolved in in toluene and volumetrically diluted to 100 mL.
- These were thoroughly mixed so that all five furan compounds were completely dissolved.
- Then, 1 mL of the stock solution was volumetrically diluted to 1 L using new uninhibited electrical insulating oil of the original mineral.
- This solution of the furan compounds in oil became a concentration of about 1 mg/L (ppm) or 1000 mg/L (ppb).
- We volumetrically prepared 1, 0.5, and 0.25 ppm from the 1 mg/L standard solution, as per requirements.
- The standard solution was stored in a clean and dark plastic bottle, not in a glass bottle.
- Each of the five furan compounds—toluene, new inhibited transformer oil, acetonitrile, hexane, and water—were prepared according to HPLC grade with vacuum manifold, Si cartridge liners, and 0.5 mm filters.
The procedures to extract the solid phase extraction (SPE) were as follows.
- We inserted the SPE column into vacuum manifold and passed 5 mL of hexane through each SPE column under vacuum. We did not dry the column.
- We mixed 10 mL of the oil sample (specimen) with 10 mL of hexane and passed it through the SPE column at a rate of no faster than 3 mL/min.
- We passed 20 mL of hexane through the SPE column to raise out residual oil and dried the column under vacuum for 5 minutes before discarding all elutes.
- The elute retained compounds from the SPE column using 10 mL of an acetonitrile/water (20:80) mixture composed of the same properties as in the HPLC system mobile phase.
- We collected the first 10 mL of eluting from the SPE column.
- If the elute was cloudy, we filtered it with 0.5 mm filters.
- We placed the elute in a 2 mL vial, put it in the autosampler, and then ran the HLPC to analyze the sample.
The results of the test samples were collected from the Saudi Electricity Company. All tests were conducted in a chemical laboratory with experts and with modern test devices. A total of 131 test data samples were collected, including the test parameters of CO, CO2, VBD, IF, ACY, M, OC, 2-FAL, and the DP. The classification of the insulating paper state was categorized based on the value of the DP, as seen in Table 1. The distribution of the 131 dataset samples is as illustrated in Table 2. In this table, a total of 86 data samples were categorized as category 1 that referred to the normal aging rate, 15 for accelerating aging rate, 7 for excessive aging danger zone, 3 for high risk of failure, and 20 for the end of expected life. Table 3 depicts the test results of some samples in this study.
3. Classification Techniques
The used classification was supervised machine learning, where a constructed classification model learns to classify new observations based on the training process of trained samples. Several classification algorithms can be used in classification learner applications in MATLAB software. The classification process depends on the feature data and their corresponding responses. The different classifiers in classification learner application in MATLAB are decision trees (DTs), discriminant analysis (DA), support vector machine (SVM), logistic regression (LR), nearest neighbors (KNNs), naïve Bayes (NB), and ensemble classification (ENC). A constructed model can be exported to a workspace to test new observations and compute model accuracy based on testing samples.
3.1. Decision Trees (DTs)
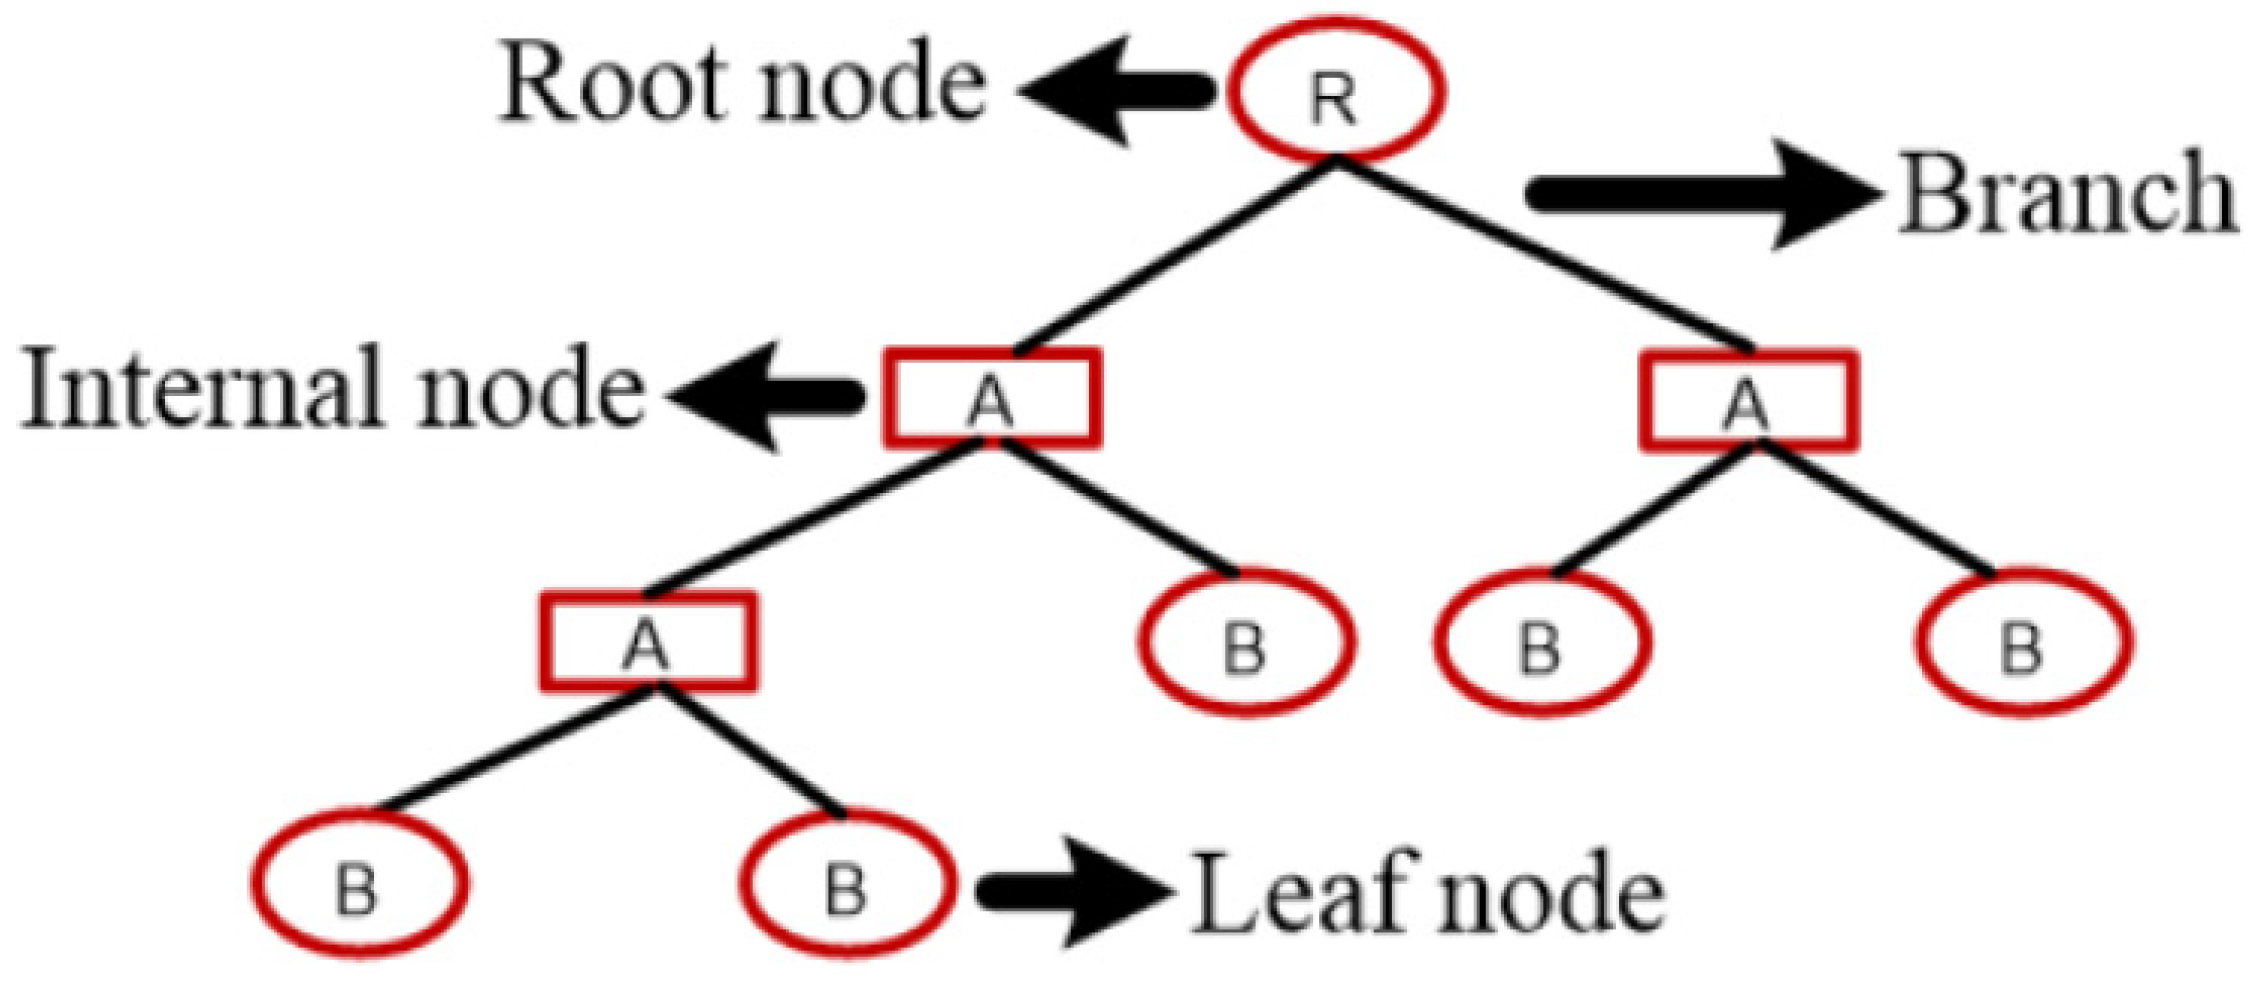
The decision trees’ classifiers predict the response to the new observations based on the training process of the classifier on training data samples containing the feature variables and the corresponding responses. The detection process in the decision tree follows the decisions from the beginning nodes (roots) down to a leaf node, which includes a response of true or false. Figure 2 depicts the construction of the decision tree, which consists of the root node (R), the internal nodes (A), and the leaf nodes (B), and all nodes are connected via branches. The root node has logic statements that help to determine the flow of the decisions, and each internal node identifies a new decision path based on new logic statements before reaching to the leaf node that expresses the final decision or the predicted response by considering a numeric class [25,26].
3.2. Discriminant Analysis (DA) or Fisher Discriminant
DA is a method that classes generate data based on different Gaussian distributions. In this method, the fitting functions evaluate the Gaussian distribution parameters for each class. It is considered to be a description and predictive classifier that seeks the factors separating two groups based on a set of features in which the group membership is known [27,28]. In regression techniques, a real value expresses the output, but in discriminant analysis, the output refers to the class label. Moreover, the discriminant analysis can be linear and tries to find the line to separate between different categories, or it can use different curve configurations, as shown in Figure 3.
3.3. Support Vector Machine (SVM)
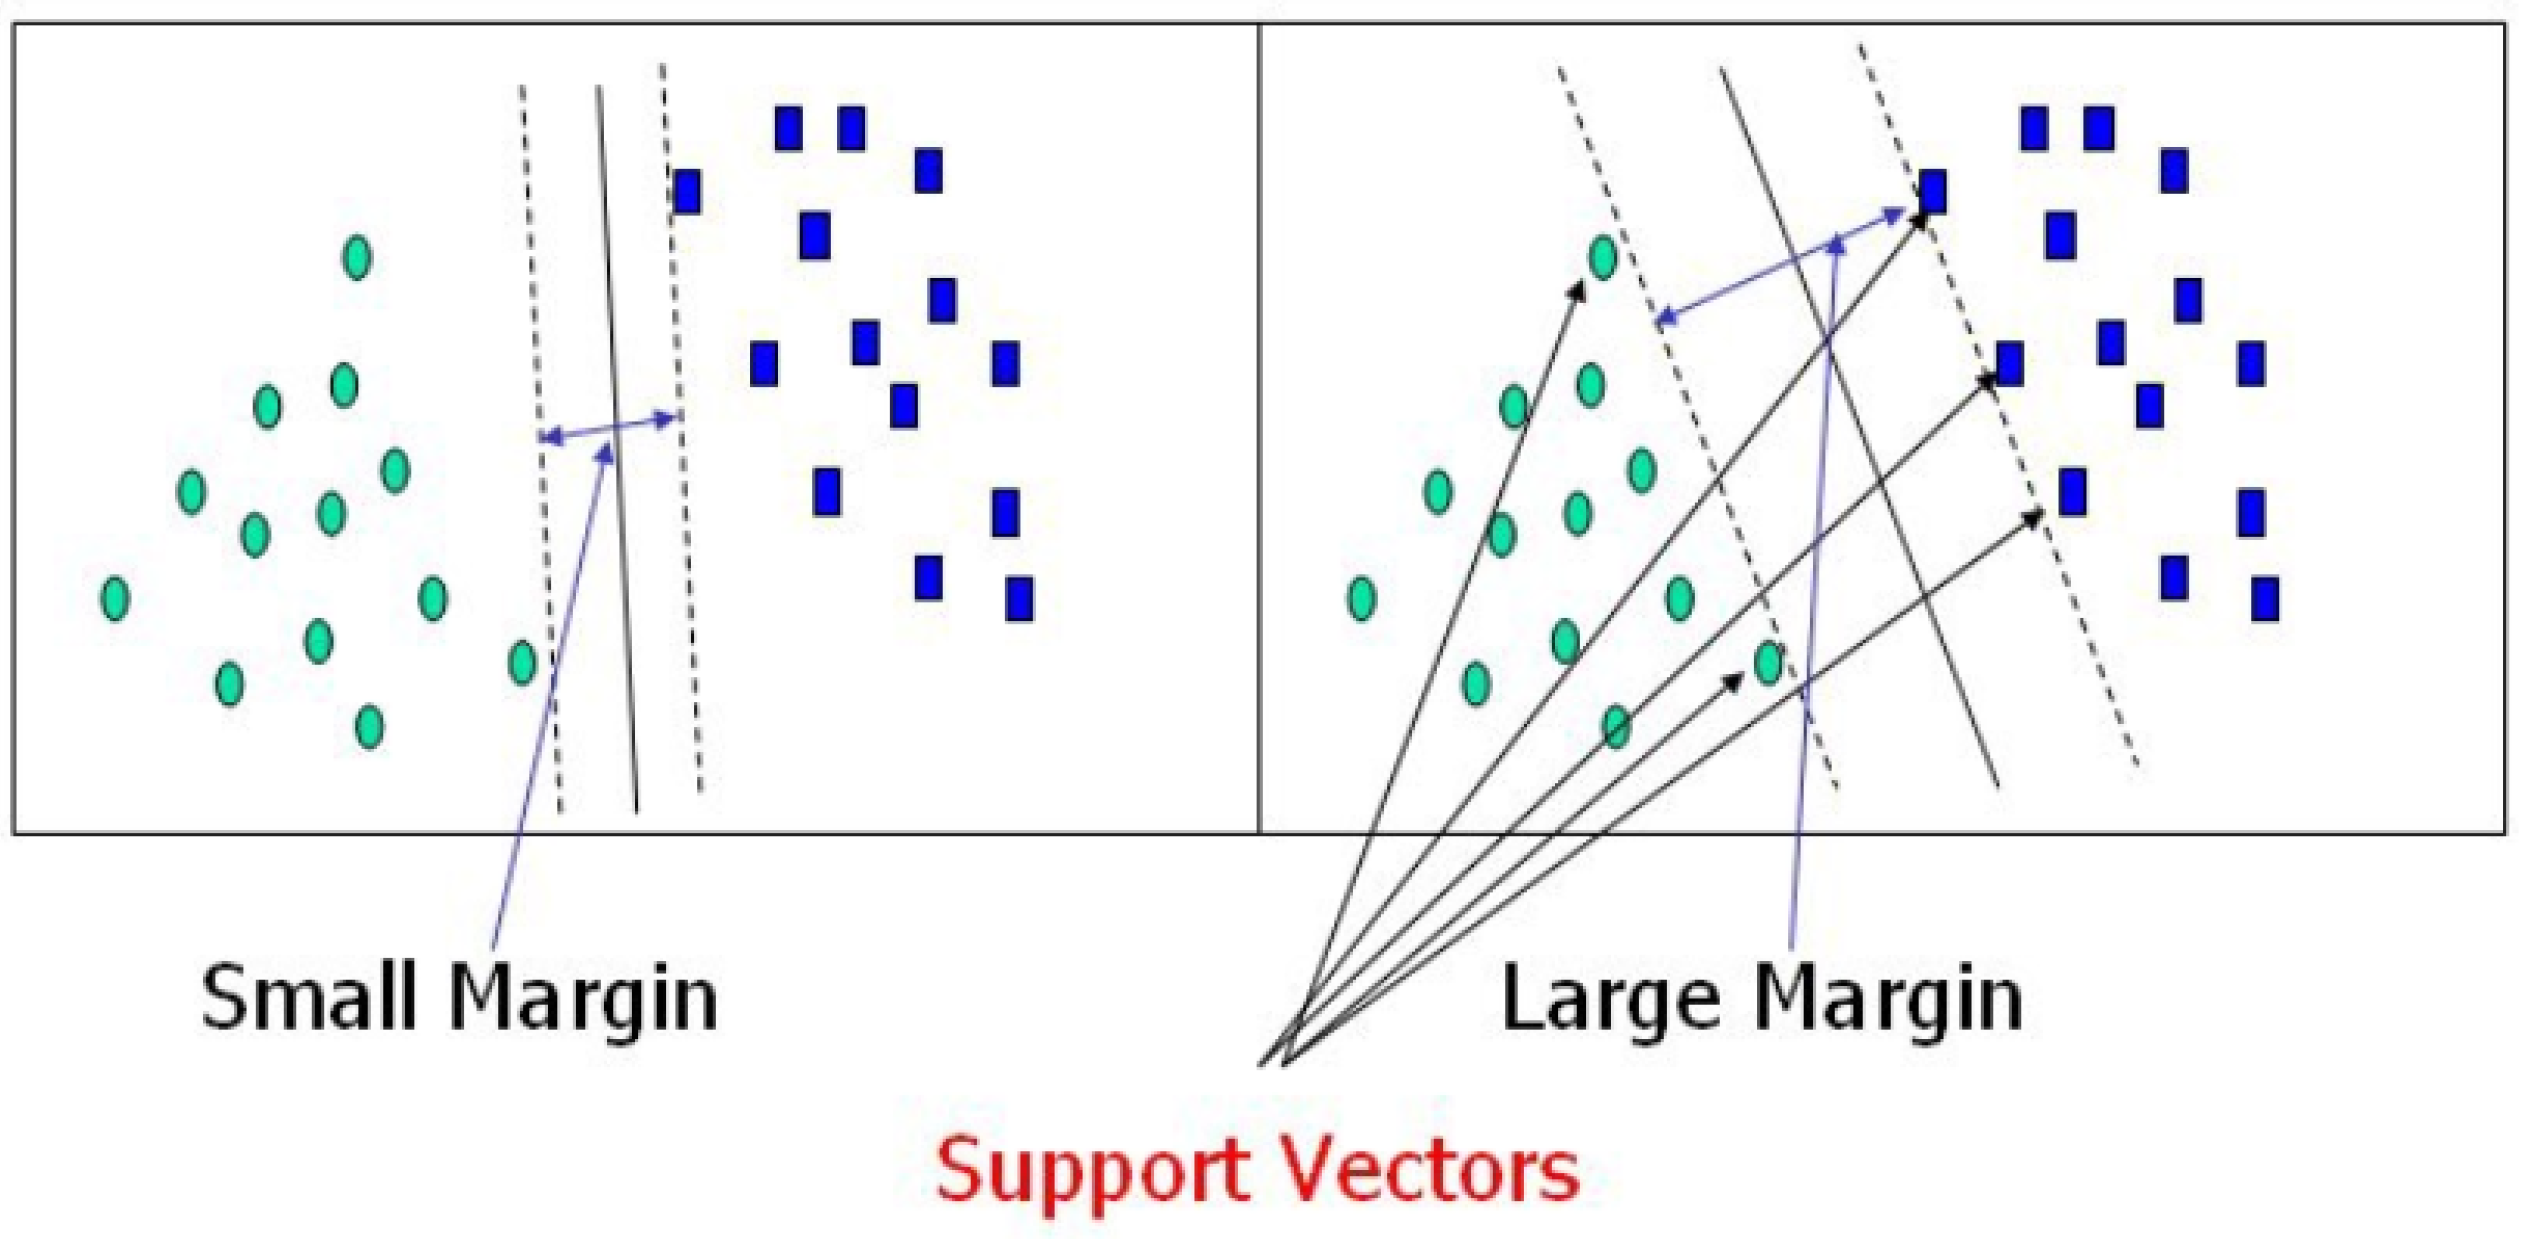
An SVM is a type of machine learning that is used to separate two classes of data points by a hyperplane, which satisfies the maximum distance between the points of each class. Therefore, new observations can be accurately classified. The points outside the hyperplane margin belong to different classes. The number of input features identifies the dimensions of the hyperplane. A hyperplane is both a line that can separate two input features and a plane that can be used to separate among three features; when the input features increase to more than three features, the separation process becomes difficult. Support vectors refer to the points close to the hyperplane and have a great effect on the position and orientation of the hyperplane; they can be used to maximize the margin of a classifier. Support vectors are the main points that are needed to set up an SVM model. Figure 4 depicts the margin condition that can be built by support vectors, where the large margin indicates the ability of the SVM model to provide good classification accuracy with new observations [29,30].
3.4. Ensemble Trees (ENT)
Ensemble methods are used to take advantage of decision trees and to reduce overfit, although they may sometimes become very complex. Decision trees are used in classification and regression operations, but their most common use is for classification operations. They are non-parameterized, do not include any assumptions about how the input data are distributed, and depend only on the input data for the input and response. They are suitable when there are a lot of data but there is not a lot of information surrounding that data. The results of a decision tree can be interpreted and thus used in constructing models to make inferences about data—not just to make predictions. Ensemble methods are quick due to their simplicity and are useful for initial understanding data. With decision trees, data processing is easy because there is no need to scale the data since the splits that occur at each node are only associated with one feature at a time and there is no need to perform coding operations for the splits, features, and categorizations. The two most common ensemble techniques are bagging and boosting ensemble trees. Boosting models are better than bagging models if the hyperparameters are precisely adjusted, but they consume more time in the classification process. Bagging models prevent overfitting even though they may not give better bias. Additionally, the boosting models generate models with few errors but are prone to overfitting because a single model that modifies itself is created, and the bagging models create multiple models that are parallel to each other [31,32,33]. Figure 5 illustrates the difference between bagging and boosting, where the bagging generates a parallel model for the classification process to prevent overfitting and the boosting generates only one model that is improved every time to reduce classification errors.
4. Classification Results and Discussion
For the first table, the data were prepared in columns to include the test results for eight test measures of CO, CO2, VBD, IF, ACY, M, OC, and 2-FAL, and the response (DP) was scaled as classes that refer to the state of insulating paper. According to the difference of the eight test inputs in units, the standardization of all data input was very crucial.
Data standardization is used to convert data to a common format to be easy to process and analyze. Data can be collected from different data sources, which may lead to problems if they are not standardized, thus resulting in difficulties in the future, especially with data regarding dashboards, visualization, decision-making… etc. Therefore, for a good training process, the standardization process had to be performed for the data in this study. The standard score, as shown in Equation (1), was used to standardize the data:
where Xst is the standardized value, X is the actual value, m is the mean of each input column, and s is the standard deviation in each input column.
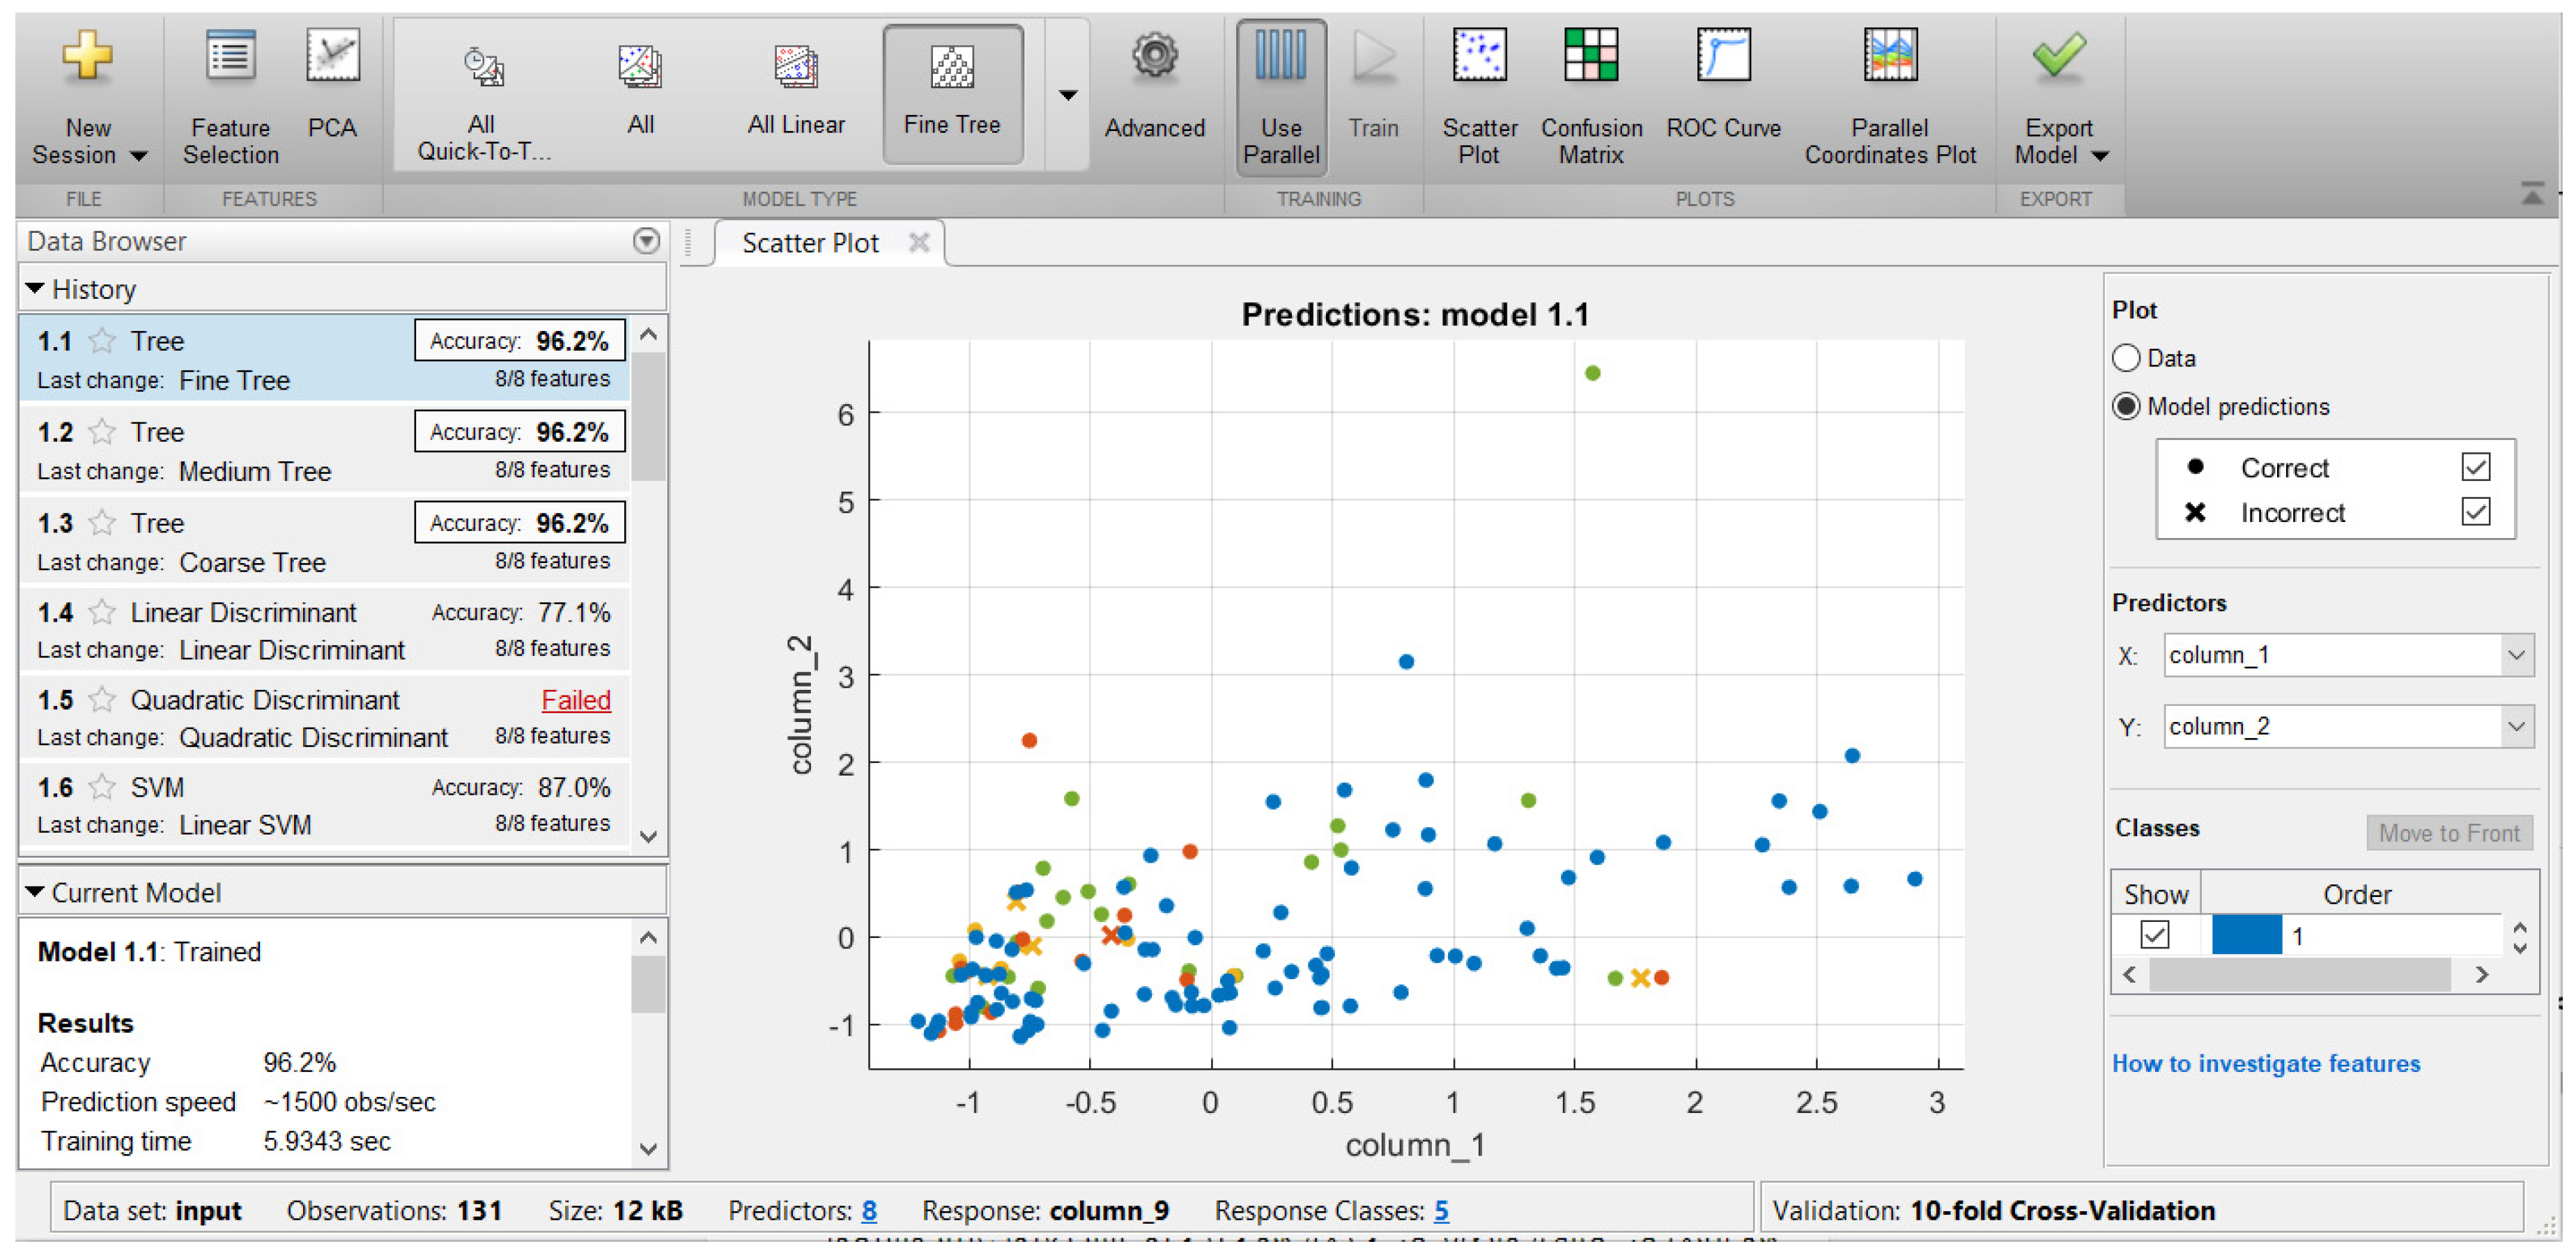
The classification techniques were applied to the prepared standardized data, and the results of each technique, based on 10-fold cross-validation, are illustrated in Table 4. The cross-validation statistical method was used as an optional tool in the classifier learners to estimate the ability and robustness of the machine learning models. It divided the data samples into a partition to use for the training and testing processes of the constructed model. The partition process was randomly performed to turn the data samples into k equal-size subsamples in which a single subsample was retained as validation data for testing the model and the remaining k-1 subsamples were used only for the training process. This process was repeated k-times, and each subsample was used as a validation sample and the others were used for training. The results of testing each subsample were averaged to provide the accuracy of the model. Then, each model’s merit was decided based on utilizing all data samples for both training and validation processes [34]. For the classification learner to solve the classification problem, stratified k-fold cross-validation was used so that the folds randomly included the same features of each categorized class. Figure 6 depicts the classification accuracy of the decision tree classifiers, i.e., 96.2%. The scatter plot indicates that the distribution of all observations (131 samples) explained the correct and incorrect detection class. The accuracy results were based on the eight predictors of the data samples (CO, CO2, VBD, IF, ACY, M, OC, and 2-FAL) and the corresponding paper state class (which was based on the DP magnitude, as a response). The classification accuracy was based on the averaging of the 10-fold cross-validation method results.
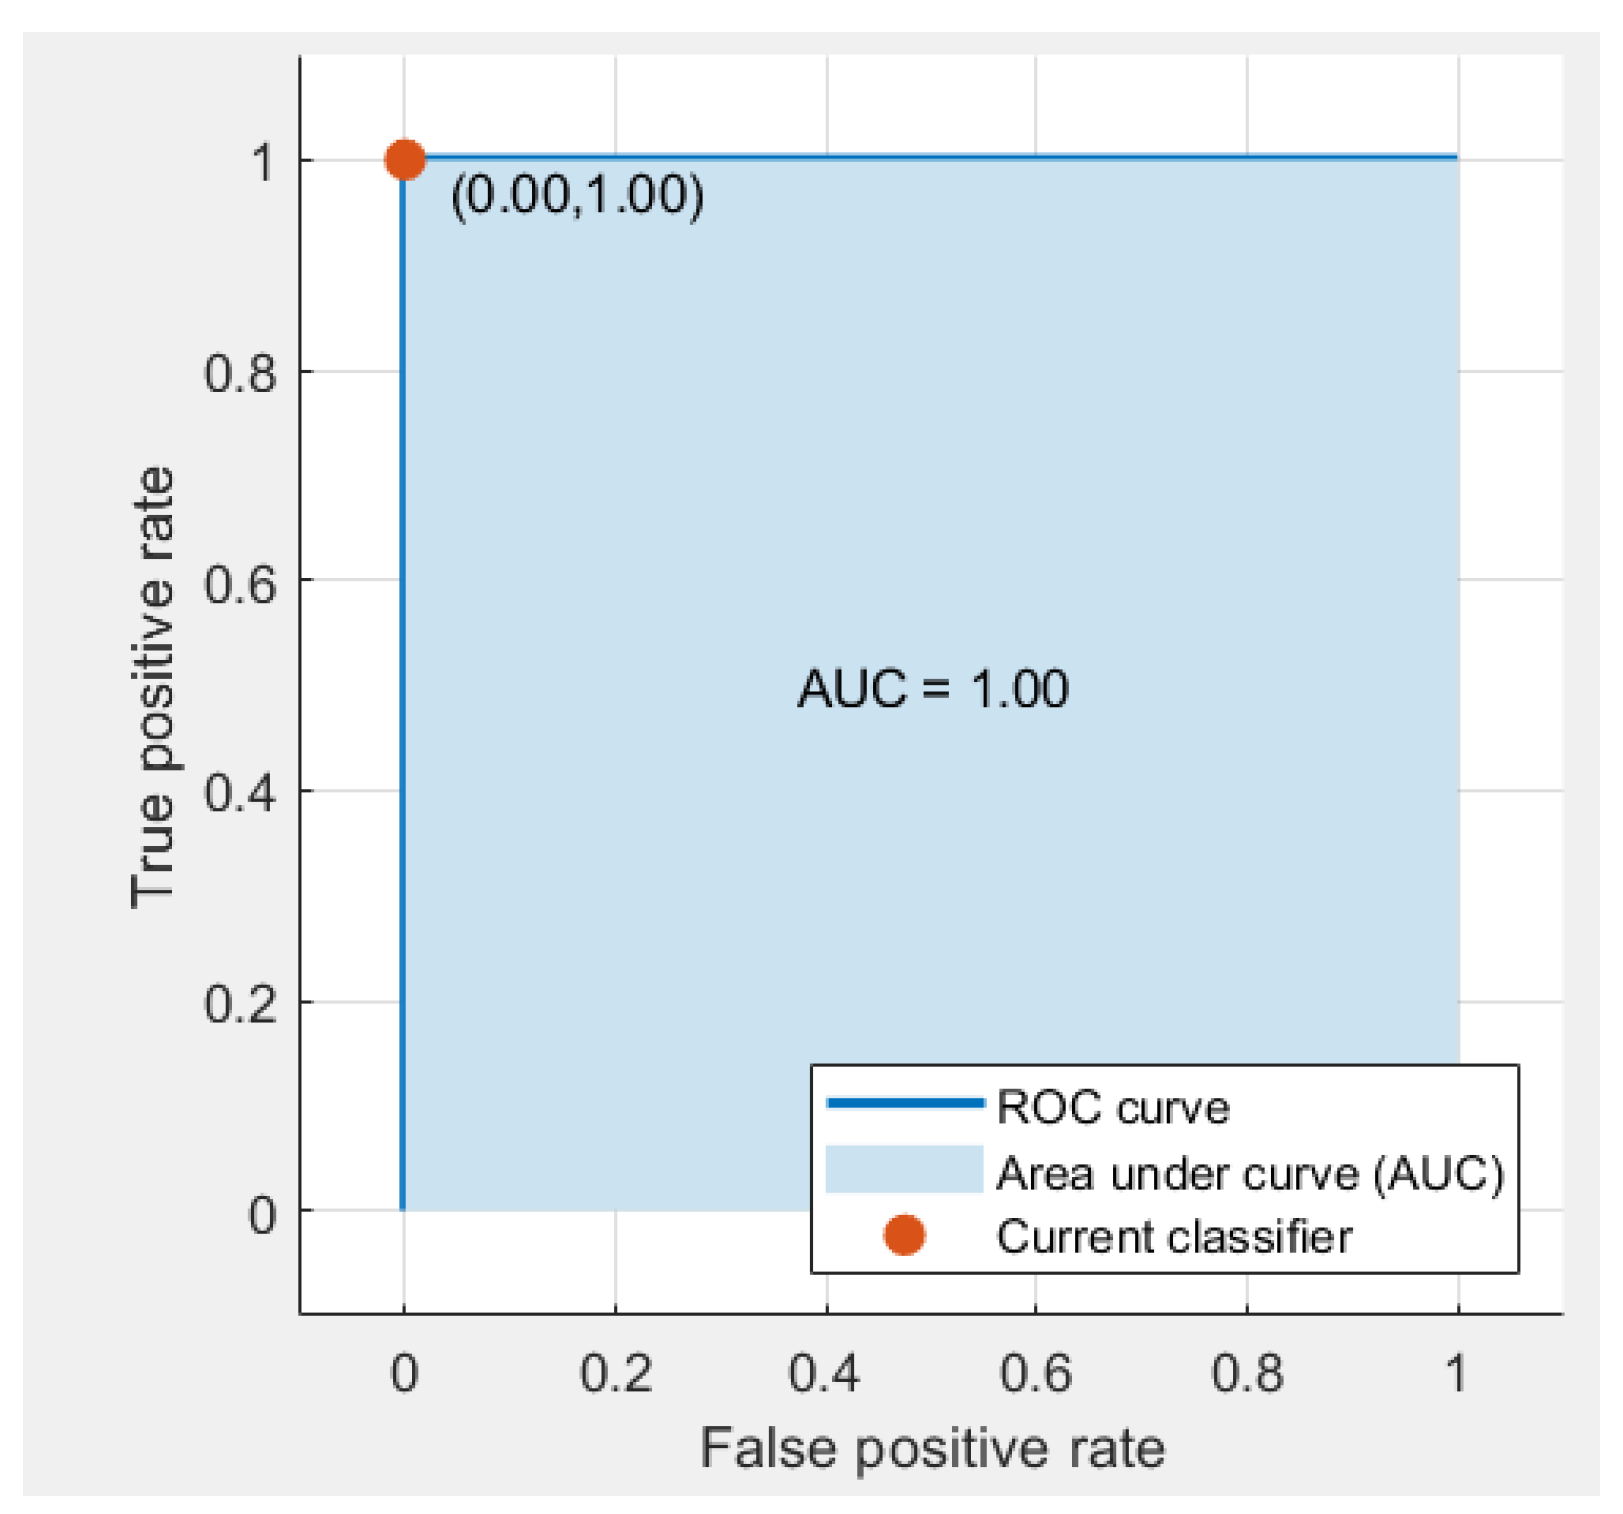
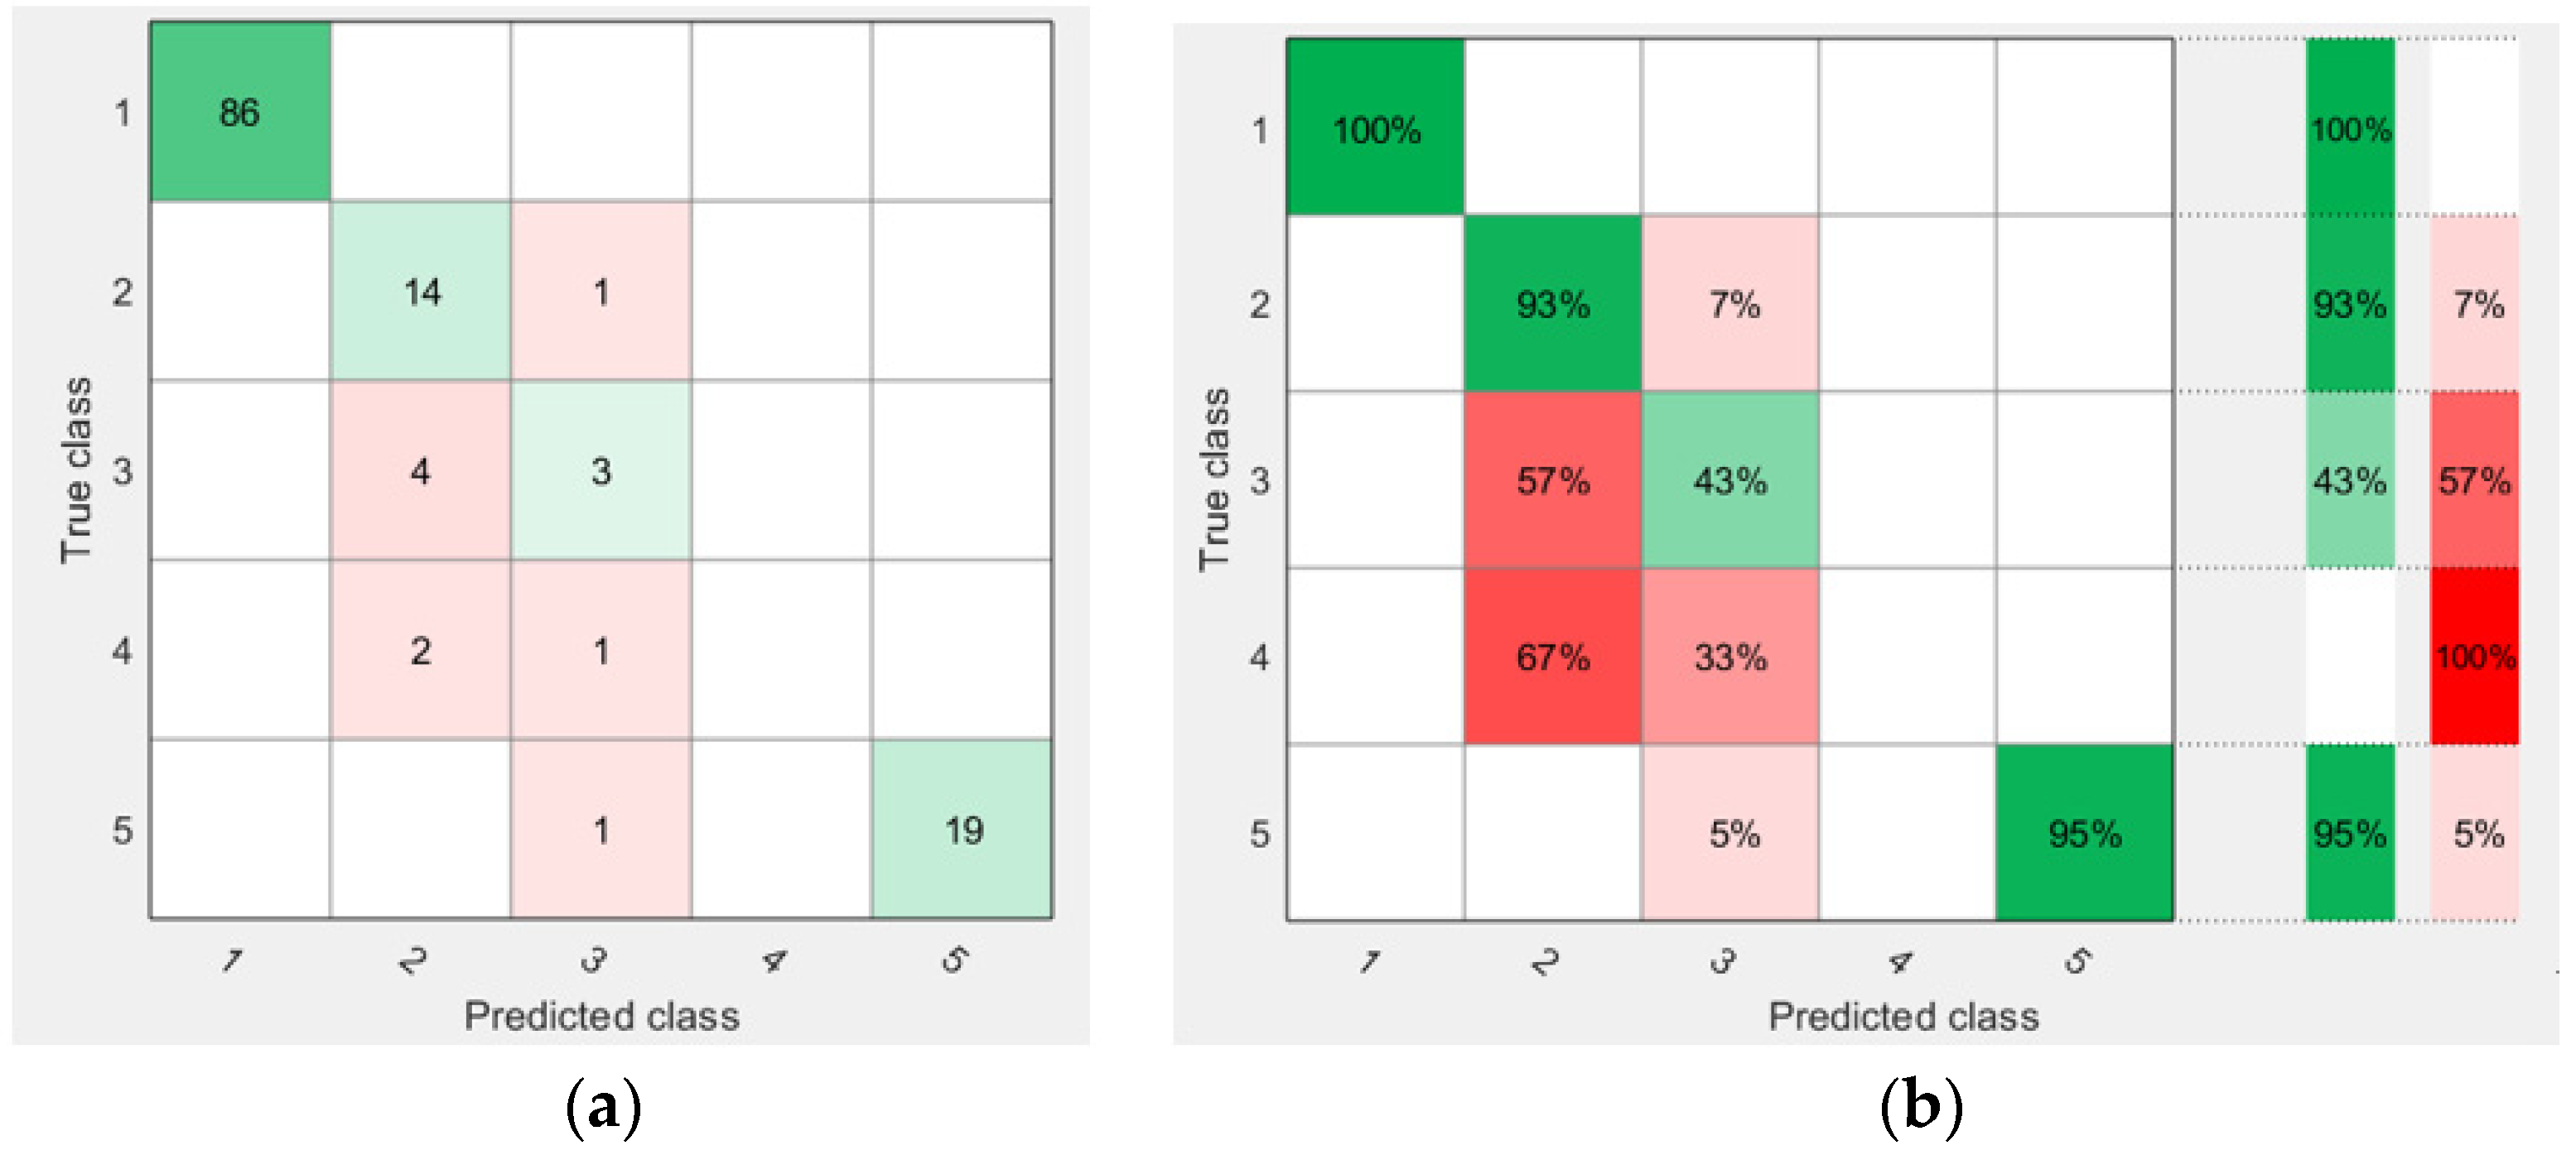
Figure 7 illustrates the confusion matrix of the classification accuracy of the decision tree classifier, which provided the best classification accuracy among all trained classifiers in the classification learner tool. Figure 7a shows the correct number of classifications in each classified class; for class 1, a total number of 86/86 samples were correctly classified, and for class 3, a total number of 6/7 samples were correctly classified. Figure 7b illustrates the classification accuracy of each class, where it can be seen that the predicted classification accuracy of class 1 was 100% (86/86 corrected samples), the predicted correct number of classified samples was 14/15 with a 93% classification accuracy for class 2; the false predicted classification accuracy of this class was 1/15 with a 7% classification accuracy. For class 3, the positive predictive accuracy was 60% (6 correct from a total number of 10 samples that were predicted for class 3) and the false predictive accuracy was 40% (4 wrong samples of the total number of 10 samples that were predicted for class 3). Figure 8 shows the receiver operating characteristic (ROC) curve of the positive class 1 that shows the performance of the classifier at the threshold of classification. The area under the curve (AUC) refers to the performance across all possible classification thresholds. The AUC indicates the 100% correct predictive classification of class 1, so the AUC was 1.
Figure 9 illustrates the confusion matrix of the ensemble bagged tree classifier, where the predictive accuracy of the classes was 93.1%, thus making this the best second classifier in the study. Figure 9a depicts the number of correct classification samples for each class, e.g., the number of correctly predicted samples for class 3 was 3/7 samples with a 43% classification accuracy (Figure 9b) and the number of wrongly predicted samples for class 3 was 4/7 with a 57% diagnostic accuracy (Figure 9b).
5. Conclusions
The results of this study are very valuable for determining the state of the insulating paper in a power transformer. The state of such paper is based on the magnitude of the DP, which correlates with several important tests. Most research in the literature has related the DP and the insulating paper state to 2-FAL concentration, but this correlation can provide a wrong indication about the insulating paper state due to the adsorption of the paper to the 2-FAL that leads to a reduced 2-FAL concentration that may not accurately detect the insulating oil of a transformer. Therefore, using several periodic tests to indicate the state of insulating oil is better than using 2-FAL as a single indicator. We applied several classification techniques to collected data samples while using 10-fold cross-validation to build a classification model to identify insulating paper class, as categorized in Table 1. The results revealed that the decision tree was the best classifier for the collected data samples, with a 96.2% classification accuracy. Some other classification techniques, such as ensemble bagged tree (93.1%), also provided a reasonable accuracy. The utilization of the classification techniques to derive the DP and insulating paper state based on several electrical, physical, and chemical tests provided more reliable results than a technique that only utilizes one parameter such as 2-FAL.
Funding
This research was funded by TAIF UNIVERSITY RESEARCHERS SUPPORTING PROJECT, grant number TURSP-2020/34 and “The APC was funded by SHERIF GHONEIM”.
Institutional Review Board Statement
Not applicable.
Informed Consent Statement
Not applicable.
Data Availability Statement
Not applicable.
Acknowledgments
The author would like to acknowledge the financial support received from Taif University Researchers Supporting Project Number (TURSP-2020/34), Taif University, Taif, Saudi Arabia. The author also appreciates the Saudi Electricity company for supplying the data for this research.
Conflicts of Interest
The author declares no conflict of interest. The funders had no role in the design of the study; in the collection, analyses, or interpretation of data; in the writing of the manuscript; or in the decision to publish the results.
References
- IEEE Standard C57. 104-2008. IEEE Guide for the Interpretation of Gases Generated in Oil-Immersed Transformers; IEEE: New York, NY, USA, February 2009. [Google Scholar]
- Ghoneim, S.S.M. The Degree of Polymerization in a Prediction Model of Insulating Paper and the Remaining Life of Power Transformers. Energies 2021, 14, 670. [Google Scholar] [CrossRef]
- Scatiggio, F.; Calcara, L.; Pompili, M. Risk Prevention for HV Transformers: Beyond the Health Index. In Proceedings of the 2016 Electrical Insulation Conference (EIC), Montréal, QC, Canada, 19–22 June 2016. [Google Scholar]
- Li, S.; Ge, Z.; Abu-Siada, A.; Yang, L.; Li, S.; Wakimoto, K. A new technique to estimate the degree of polymerization of insulation paper using multiple aging parameters of transformer oil. IEEE Access 2019, 7, 157471–157479. [Google Scholar] [CrossRef]
- Abu Bakar, N.; Abu-Siada, A. Fuzzy Logic Approach for Transformer Remnant Life Prediction and Asset Management Decision. IEEE Trans. Diel. Elec. Insul. 2016, 23, 3199–3208. [Google Scholar] [CrossRef]
- Forouhari, S.; Abu-Siada, A. Application of Adaptive Neuro-Fuzzy Inference System to Support Power Transformer Life Estimation and Asset Management Decision. IEEE Trans. Diel. Elec. Insul. 2018, 25, 845–852. [Google Scholar] [CrossRef]
- Mulyodinoto, K.U.; Prasojo, R.A.; Abu-Siada, A. Applications of ANFIS to Estimate the Degree of Polymerization Using Transformer Dissolve Gas Analysis and Oil Characteristics. Polym. Sci. 2018, 4, 1–9. [Google Scholar]
- Nugraha, B.H.; Kinkeldey, T.; Münster, T.; Werle, P.; Suwarno. Algorithm for Estimating the Degree of Polymerization of Paper Insulation Impregnated with Inhibited Insulating Oil. In Proceedings of the 2019 2nd International Conference on High Voltage Engineering and Power Systems (ICHVEPS), Bali, Indonesia, 1–4 October 2019. [Google Scholar]
- IEC-60450. Measurement of the Average Viscometric Degree of Polymerization of New and Aged Cellulosic Electrically Insulating Materials; British Standards Institution: London, UK, 2007. [Google Scholar]
- El-Aal, R.A.A.; Helal, K.; Hassan, A.M.M.; Dessouky, S.S. Prediction of transformers conditions and lifetime using furan compounds analysis. IEEE Access 2019, 7, 102264–102273. [Google Scholar] [CrossRef]
- Gouda, O.E.; El Dein, A.Z. Prediction of aged transformer oil and paper insulation. Electr. Power Compon. Syst. 2019, 47, 406–419. [Google Scholar] [CrossRef]
- Cheim, L.; Platts, D.; Prevost, T.; Xu, S. Furan analysis for liquid power transformers. IEEE Electr. Insul. Mag. 2012, 28, 8–21. [Google Scholar] [CrossRef]
- Chendong, X.; Qiming, F.; Shiheng, X. To Estimate the Ageing Status of Transformers by Furfural Concentration in the Oil; CIGRE Study Committee 33 Colloquium: Leningrad, Russia, 1991. [Google Scholar]
- De Pablo, A. Furfural and ageing: How are they related. In Proceedings of the IEE Colloquium Insulating Liquids, Leatherhead, UK, 27 May 1999. [Google Scholar]
- Tang, X.; Cui, L.; He, J.; Su, Z.; Chen, P. Evaluation Method for Insulation Degradation Based on Furfural Content in 35 kV Field Transformer Oil. In Proceedings of the 2019 IEEE 3rd International Electrical and Energy Conference (CIEEC), Beijing, China, 7–9 September 2019. [Google Scholar]
- Peng, L.; Fu, Q.; Li, L.; Lin, M. Indirect Detection of DP for Insulating Paper Based on Methanol Content in Transformer Oil by Spectroscopic Approach. IEEE Trans. Diel. Elec. Insul. 2019, 26, 90–94. [Google Scholar] [CrossRef]
- Schaut, A.; Autru, S.; Eeckhoudt, S. Applicability of methanol as new marker for paper degradation in power transformers. IEEE Trans. Dielectr. Electr. Insul. 2011, 18, 533–540. [Google Scholar] [CrossRef]
- Yang, L.; Lin, Y.; Liao, R.; Zhao, X.; Sun, W.; Zhang, Y. Effects of temperature and aging on furfural partitioning in the oil-paper system of power transformers. IEEE Trans. Dielectr. Electr. Insul. 2016, 23, 1393–1401. [Google Scholar] [CrossRef]
- Saha, T.K. Review of modern diagnostic techniques for assessing insulation condition in aged transformers. IEEE Trans. Dielectr. Electr. Insul. 2003, 10, 903–917. [Google Scholar] [CrossRef] [Green Version]
- Baburao, K.; Bhangre, N.M.; Wagle, A.M.; Venkatasami, A.; Chaudhari, S.E. The Experience of DP and Furan in Remnant Life Assessment of Power Transformer. In Proceedings of the 2008 International Conference on Condition Monitoring and Diagnosis, Beijing, China, 21–24 April 2008. [Google Scholar]
- Sutan Chairul, I.; Ab Ghani, S.; Ahmad Khiar, M.S.; Md Thayoob, Y.H.; Ghazali, Y.Z.Y. Kraft Paper Insulation’s Life Assessment and Effects of Oxygen and Moisture to Paper Insulation’s Deterioration Rate. In Proceedings of the 2012 IEEE international conference on power and energy (PECon), Kota Kinabalu, Malaysia, 2–5 December 2012. [Google Scholar]
- IEC Publication 60567. Guide for the Sampling of Gases and Oil from Oil-Filled Electrical Equipment and for the Analysis of Free and Dissolved Gases; British Standards Institution: London, UK, 1992. [Google Scholar]
- ASTM. D3612-2 Standard Test Method for Analysis of Gases Dissolved in Electrical Insulating Oil by Gas Chromatography; ASTM: West Conshohocken, PA, USA, 2017. [Google Scholar]
- ASTM. D5837 Standard Test Method for Furanic Compounds in Electrical Insulating Liquids by High Performance Liquid Chromatography (HPLC); ASTM: West Conshohocken, PA, USA, 2005. [Google Scholar]
- Ghoneim, S.S.M.; Taha, I.B.M. Comparative Study of Full and Reduced Feature Scenarios for Health Index Computation of Power Transformers. IEEE Access 2020, 8, 181326–181339. [Google Scholar] [CrossRef]
- Yeh, D.-Y.; Cheng, C.-H.; Hsiao, S.-C. Classification knowledge discovery in mold tooling test using decision tree algorithm. J. Intell. Manuf. 2011, 22, 585–595. [Google Scholar] [CrossRef]
- Silva, A.P.D.; Stam, A. Discriminant analysis. In Reading and Understanding Multivariate Statistics; Grimm, L.G., Yarnold, P.R., Eds.; American Psychological Association: Washington, DC, USA, 1995; pp. 277–318. [Google Scholar]
- Hallinan, J.S. Chapter 2—Data Mining for Microbiologists. In Methods in Microbiology; Harwood, C., Wipat, A., Eds.; Academic Press: Cambridge, MA, USA, 2012; Volume 39, pp. 27–79. [Google Scholar]
- Classification. Available online: https://www.mathworks.com/help/stats/classification.html (accessed on 20 January 2021).
- Zhang, Y.; Li, J.; Fan, X.; Liu, J.; Zhang, H. Moisture Prediction of Transformer Oil-Immersed Polymer Insulation by Applying a Support Vector Machine Combined with a Genetic Algorithm. Polymers 2020, 12, 1579. [Google Scholar] [CrossRef]
- Hassan, A.N.; El-Hag, A. Two-Layer Ensemble-Based Soft Voting Classifier for Transformer Oil Interfacial Tension Prediction. Energies 2020, 13, 1735. [Google Scholar] [CrossRef] [Green Version]
- Liu, Y.; Li, J.; Qiao, L.; Chen, S.; Liu, S.; Liu, J. Fault diagnosis of power transformer based on tree ensemble model. IOP Conf. Series Mater. Sci. Eng. 2020, 715, 12032. [Google Scholar] [CrossRef]
- What Is the Difference between Bagging and Boosting? Available online: https://quantdare.com/what-is-the-difference-between-bagging-and-boosting/ (accessed on 20 January 2021).
- Taha, I.B.M.; Mansour, D.A.; Ghoneim, S.S.M.; Elkalashy, N.I. Conditional Probability-Based Interpretation of Dissolved Gas Analysis for Transformer Incipient Faults. IET Gen. Trans. Distr. 2016, 11, 943–951. [Google Scholar] [CrossRef]
Figure 1.
Analysis results of the dissolved gases using gas chromatography.

Figure 2.
Construction of the decision tree.

Figure 3.
A variety of curves that separate between two classes in a discriminant analysis classifier.
Figure 3.
A variety of curves that separate between two classes in a discriminant analysis classifier.

Figure 4.
Margins between two classes and the support vectors.

Figure 5.
Difference between bagging and boosting models.

Figure 6.
Screens shoot of the scatter plot of classification accuracy of the decision tree classifier.
Figure 6.
Screens shoot of the scatter plot of classification accuracy of the decision tree classifier.

Figure 7.
The confusion matrix of the classification accuracy of the decision tree classifier: (a) the correct number of the samples in each class and (b) the classification accuracy percentage of each class.
Figure 7.
The confusion matrix of the classification accuracy of the decision tree classifier: (a) the correct number of the samples in each class and (b) the classification accuracy percentage of each class.

Figure 8.
Receiver operating characteristic (ROC) curve of the results of a decision tree classifier.
Figure 8.
Receiver operating characteristic (ROC) curve of the results of a decision tree classifier.

Figure 9.
Confusion matrix of ensemble bagged tree: (a) the confusion matric explaining the correct number of samples in each class and (b) the classification accuracy of each class.
Figure 9.
Confusion matrix of ensemble bagged tree: (a) the confusion matric explaining the correct number of samples in each class and (b) the classification accuracy of each class.


Table 1.
The classification categories of the insulating paper state based on the degree of polymerization (DP) value and its description.
Table 1.
The classification categories of the insulating paper state based on the degree of polymerization (DP) value and its description.
| DP | >600 | <600–360 | <360–300 | <300–200 | <200 |
| Class | 1 | 2 | 3 | 4 | 5 |
| Description | Normal aging rate | Accelerating aging rate | Excessive aging danger zone | High risk of failure | End of expected life |
Table 2.
Distribution and number of the data samples that were used in this study.
| Category | Number of Samples |
|---|---|
| 1 | 86 |
| 2 | 15 |
| 3 | 7 |
| 4 | 3 |
| 5 | 20 |
Table 3.
Some of the dataset samples in the current study. CO: carbon monoxide; CO2: carbon dioxide; VBD: breakdown voltage; IF: interfacial tension; ACY: acidity; M: moisture; OC: oil color; 2-FAL: 2-furfuraldehyde.
Table 3.
Some of the dataset samples in the current study. CO: carbon monoxide; CO2: carbon dioxide; VBD: breakdown voltage; IF: interfacial tension; ACY: acidity; M: moisture; OC: oil color; 2-FAL: 2-furfuraldehyde.
| CO (ppm) | CO2 (ppm) | VBD (kV/cm) | IF (mN/m) | ACY (KOH/g) | M (ppm) | OC | 2-FAL (ppm) | DP |
|---|---|---|---|---|---|---|---|---|
| 187 | 2887 | 38 | 21 | 0.08 | 4 | 3.9 | 2.062 | 357 |
| 164 | 2650 | 28 | 20 | 0.08 | 9 | 3.9 | 3.929 | 277 |
| 326 | 5263 | 57 | 18 | 0.24 | 6 | 4.9 | 13.236 | 127 |
| 110 | 2657 | 47 | 17 | 0.11 | 21 | 3.49 | 13.872 | 121 |
| 1 | 2120 | 40 | 28 | 0.01 | 6 | 0.49 | 0.005 | 1105 |
Table 4.
Accuracy of the classification techniques on the collected test data.
| Classification Method | Type | Accuracy % |
|---|---|---|
| Decision Tree | Fine | 96.2 |
| Medium | 96.2 | |
| Coarse | 96.2 | |
| Linear Discriminant | Linear Discriminant | 77.1 |
| Support Vector Machine (SVM) | Linear | 87 |
| Quadratic | 84 | |
| Cubic | 86 | |
| Coarse Gaussian | 82.4 | |
| Ensemble Trees | Boosted Trees | 65.6 |
| Bagged Trees | 93.1 |
Publisher’s Note: MDPI stays neutral with regard to jurisdictional claims in published maps and institutional affiliations. |
© 2021 by the author. Licensee MDPI, Basel, Switzerland. This article is an open access article distributed under the terms and conditions of the Creative Commons Attribution (CC BY) license (http://creativecommons.org/licenses/by/4.0/).
Share and Cite
MDPI and ACS Style
Ghoneim, S.S.M. Determination of Transformers’ Insulating Paper State Based on Classification Techniques. Processes 2021, 9, 427. https://0-doi-org.brum.beds.ac.uk/10.3390/pr9030427
AMA Style
Ghoneim SSM. Determination of Transformers’ Insulating Paper State Based on Classification Techniques. Processes. 2021; 9(3):427. https://0-doi-org.brum.beds.ac.uk/10.3390/pr9030427
Chicago/Turabian StyleGhoneim, Sherif S. M. 2021. "Determination of Transformers’ Insulating Paper State Based on Classification Techniques" Processes 9, no. 3: 427. https://0-doi-org.brum.beds.ac.uk/10.3390/pr9030427
Note that from the first issue of 2016, this journal uses article numbers instead of page numbers. See further details here.