
Pervaporation of Aqueous Ethanol Solutions through Rigid Composite Polyvinyl-Alcohol/Bacterial Cellulose Membranes


 ,
,  and
and
Abstract
:1. Introduction
2. Materials and Methods
2.1. Materials
2.2. Membrane Preparation
2.3. Pervaporation Tests
2.4. Process Parameters
3. Results and Discussions
4. Conclusions
Supplementary Materials
Author Contributions
Funding
Institutional Review Board Statement
Informed Consent Statement
Data Availability Statement
Conflicts of Interest
References
- Smitha, B.; Suhanya, D.; Sridhar, S.; Ramakrishna, M. Separation of organic-organic mixtures by pervaporation—A Review. J. Membr. Sci. 2004, 241, 1–21. [Google Scholar] [CrossRef]
- Shao, P.; Huang, R.Y.M. Polymeric membrane pervaporation. J. Membr. Sci. 2007, 287, 162–179. [Google Scholar] [CrossRef]
- Chapman, P.D.; Oliveira, T.; Livingston, A.G.; Li, K. Membranes for the dehydration of solvents by pervaporation. J. Membr. Sci. 2008, 318, 5–37. [Google Scholar] [CrossRef]
- Leland, M.V. Review: Membrane materials for the removal of water from industrial solvents by pervaporation and vapour permeation. J. Chem. Technol. Biotechnol. 2019, 94, 343–365. [Google Scholar] [CrossRef]
- Strathmann, H. Membrane separation processes: Current relevance and future opportunities. AIChE J. 2001, 47, 1077–1087. [Google Scholar] [CrossRef]
- Malekpour, A.; Mostajeran, B.; Koohmareh, G.A. Pervaporation dehydration of binary and ternary mixture acetone, isopropanol and water using polyvinyl alcohol/zeolite membranes. Chem. Eng. Process 2017, 118, 47–53. [Google Scholar] [CrossRef]
- Ruckenstein, E.; Liang, L. Pervaporation of ethanol-water mixtures through polyvinyl alcohol-polyacrylamide interpenetrating polymer network membranes unsupported and supported on polyethersulfone ultrafiltration membranes: A comparison. J. Membr. Sci. 1996, 110, 99–107. [Google Scholar] [CrossRef]
- Win, N.N.; Bosch, P.; Friedl, A. Separation of ethanol-water mixture by pervaporation with organic composite membrane: Modelling of separation performance using model parameters derived from experimental data. ASEAN Eng. J. Part B 2013, 2, 28–36. [Google Scholar] [CrossRef]
- Dmitrenko, M.; Penkova, A.; Kuzminova, A.; Missyul, A.; Ermakov, S.; Roizard, D. Development and characterization of new pervaporation PVA membranes for the dehydration using bulk and surface modifications. Polymers 2018, 10, 571. [Google Scholar] [CrossRef] [PubMed] [Green Version]
- Hieu, N.H.; Duy, N.N.P. Fabrication, characterization, and pervaporation performance of graphene/poly(vinyl alcohol) nanocomposite membranes for ethanol dehydration. Chem. Eng. Trans. 2017, 56, 1693–1698. [Google Scholar] [CrossRef]
- Huang, Z.; Shi, Y.; Wen, R.; Guo, Y.H.; Su, J.F.; Matsuura, T. Multilayer poly(vinyl alcohol)–zeolite 4 a composite membranes for ethanol dehydration by means of pervaporation. Sep. Purif. Technol. 2006, 51, 126–136. [Google Scholar] [CrossRef]
- Figoli, A.; Santoro, S.; Galiano, F.; Basile, A. Pervaporation membranes: Preparation, characterization, and application. In Pervaporation, Vapour Permeation and Membrane Distillation; Basile, A., Figoli, A., Khayet, M., Eds.; Woodhead Publishing: Oxford, UK, 2015; pp. 19–63. [Google Scholar]
- Praptowidodo, V. Influence of swelling on water transport through PVA-based membrane. J. Mol. Struct. 2005, 739, 207–212. [Google Scholar] [CrossRef]
- Xu, S.; Shen, L.; Li, C.; Wang, Y. Properties and pervaporation performance of poly(vinyl alcohol) membranes crosslinked with various dianhydrides. J. Appl. Polym. Sci. 2018, 135, 46–159. [Google Scholar] [CrossRef]
- Rao, K.S.V.K.; Subha, M.C.S.; Sairam, M.; Mallikarjuna, N.N.; Aminabhavi, T.M. Blend membranes of chitosan and poly(vinyl alcohol) in pervaporation dehydration of isopropanol and tetrahydrofuran. J. Appl. Polym. Sci. 2007, 103, 1918–1926. [Google Scholar] [CrossRef]
- Cai, W.; Cheng, X.; Chen, X.; Li, J.; Pei, J. Poly(vinyl alcohol)-Modified membranes by Ti3C2Tx for ethanol dehydration via pervaporation. ACS Omega 2020, 5, 6277–6287. [Google Scholar] [CrossRef] [PubMed] [Green Version]
- Huang, Y.; Zheng, Y.; Song, W.; Ma, Y.; Wu, J.; Fan, L. Poly(vinyl pyrrolidone) wrapped multi-walled carbon nanotube/poly(vinyl alcohol) composite hydrogels. Compos. Part A Appl. Sci. 2011, 42, 1398–1405. [Google Scholar] [CrossRef]
- Dobre, T.; Stoica, A.; Pârvulescu, O.C.; Stroescu, M.; Iavorschi, G. Factors influence on bacterial cellulose growth in static reactors. Rev. Chim. 2008, 59, 591–594. [Google Scholar] [CrossRef]
- Stoica-Guzun, A.; Stroescu, M.; Jinga, S.; Jipa, I.; Dobre, T.; Dobre, L. Ultrasound influence upon calcium carbonate precipitation on bacterial cellulose membranes. Ultrason. Sonochem. 2012, 19, 909–915. [Google Scholar] [CrossRef]
- Stroescu, M.; Stoica-Guzun, A.; Jinga, S.I.; Dobre, T.; Jipa, I.M.; Dobre, L.M. Influence of sodium dodecyl sulfate and cetyl trimethylammonium bromide upon calcium carbonate precipitation on bacterial cellulose. Korean J. Chem. Eng. 2012, 29, 1216–1223. [Google Scholar] [CrossRef]
- Aljanabi, A.A.A.; Pârvulescu, O.C.; Dobre, T.; Ion, V.A. Pervaporation of aqueous ethanol solutions through pure and composite cellulose membranes. Rev. Chim. 2016, 67, 150–156. [Google Scholar]
- Pandey, L.K.; Saxena, C.; Dubey, V. Studies on pervaporative characteristics of bacterial cellulose membrane. Sep. Purif. Technol. 2005, 42, 213–218. [Google Scholar] [CrossRef]
- Dubey, V.; Pandey, L.K.; Saxena, C. Pervaporative separation of ethanol/water azeotrope using a novel chitosan-impregnated bacterial cellulose membrane and chitosan–poly (vinyl alcohol) blends. J. Membr. Sci. 2005, 251, 131–136. [Google Scholar] [CrossRef]
- Suratago, T.; Panitchakarn, P.; Kerdlarpphon, P.; Rungpeerapong, N.; Burapatana, V.; Phisalaphong, M. Bacterial cellulose-alginate membrane for dehydration of biodiesel-methanol mixtures. Eng. J. 2016, 20, 144–153. [Google Scholar] [CrossRef]
- Gea, S.; Bilotti, E.; Reynolds, C.T.; Soykeabkeaw, N.; Peijs, T. BC/PVA nanocomposite prepared by in-stiu process. Mater. Lett. 2010, 64, 901–904. [Google Scholar] [CrossRef]
- Tan, J.; Zheng, Y.; Peng, J.; Wu, J.; Gao, S.; Tian, R.; Chen, H.Y. Preparation and mechanical properties of layered BC nano-cellulose membrane/PVA composite hydrogels. Acta Polym. Sin. 2012, 4, 351–356. [Google Scholar] [CrossRef]
- Chiciudean, T.G.; Stoica-Guzun, A.; Dobre, T.; van Tooren, M. High-strength epoxy bacterial cellulose based composites. Mater. Plast. 2011, 48, 159–163. [Google Scholar]
- Chiciudean, T.G.; Stoica, A.; Dobre, T.; van Tooren, M. Synthesis and characterization of poly(vinyl alcohol)-bacterial cellulose nanocomposite. UPB Sci. Bull. Ser. B 2011, 73, 17–30. [Google Scholar]
- Dubey, V.; Saxena, C.; Singh, L.; Ramana, V.K.; Chauhan, S.R. Pervaporation of binary water-ethanol mixtures through bacterial cellulose membrane. Sep. Purif. Technol. 2002, 27, 163–171. [Google Scholar] [CrossRef]
- Jewprasat, S.; Saratago, T.; Phisalaphong, M. Pervaporation of ethanol/water mixtures using bacterial cellulose poly(vinyl alcohol) mebrane. Int. J. Chem. Environ. Biol. Sci. 2015, 3, 175–178. [Google Scholar]
- Kadlec, P.; Henke, S.; Bubnik, Z. Properties of ethanol-water solutions—Tables and Equations. Zucker Iindustrie/Sugar Ind. 2010, 135, 607–613. [Google Scholar] [CrossRef]
- Puspasari, T.; Chakrabarty, T.; Genduso, G.; Peinemann, K.V. Unique cellulose/polydimethylsiloxane blends as an advanced hybrid material for organic solvent nanofiltration and pervaporation membranes. J. Mater. Chem. A 2018, 28, 13685–13695. [Google Scholar] [CrossRef]
- Peng, P.; Shi, B.; Lan, Y.A. Review of membrane materials for ethanol recovery by pervaporation. Sep. Sci. Technol. 2010, 46, 234–246. [Google Scholar] [CrossRef]
- Néel, J.; Nguyen, Q.T.; Clément, R.; Lin, D.J. Influence of downstream pressure on the pervaporation of water-tetrahydrofurane mixtures through a regenerated cellulose membrane (Cuprophan). J. Membr. Sci. 1986, 27, 217–232. [Google Scholar] [CrossRef]
- Dobre, T.; Sanchez, J.M. Chemical Engineering: Modelling, Simulation and Similitude; Wiley-VCH: Weinheim, Germany, 2007; pp. 323–460. [Google Scholar]
- Cioroiu, D.R.; Pârvulescu, O.C.; Koncsag, C.I.; Dobre, T.; Răducanu, C. Rheological characterization of algal suspensions for bioethanol processing. Rev. Chim. 2017, 68, 2311–2316. [Google Scholar] [CrossRef]
- Ion, V.A.; Pârvulescu, O.C.; Dobre, T. Volatile organic compounds adsorption onto neat and hybrid cellulose. Appl. Surf. Sci. 2015, 335, 137–146. [Google Scholar] [CrossRef]
- Mao, Z.; Cao, Y.; Jie, X.; Kang, G.; Zhou, M.; Yuan, Q. Dehydration of isopropanol-water mixtures using a novel cellulose membrane prepared from cellulose/N-methylmorpholine-N-oxide/H2O solution. Sep. Purif. Technol. 2010, 72, 28–33. [Google Scholar] [CrossRef]


| cet (%wt) | nf | t (oC) | p (mm Hg) | V (mL) | ∆τ in Run | np | |||
|---|---|---|---|---|---|---|---|---|---|
| I | II | III | IV | ||||||
| 48 | 1.3592 | 50 | 210 | 2 | 66 | 63 | 66 | 72 | 1.3376 |
| 24 | 1.3485 | 60 | 280 | 2 | 61 | 48 | 45 | 45 | 1.3345 |
| 24 | 1.3485 | 60 | 140 | 2 | 45 | 35 | 17 | 10 | 1.3335 |
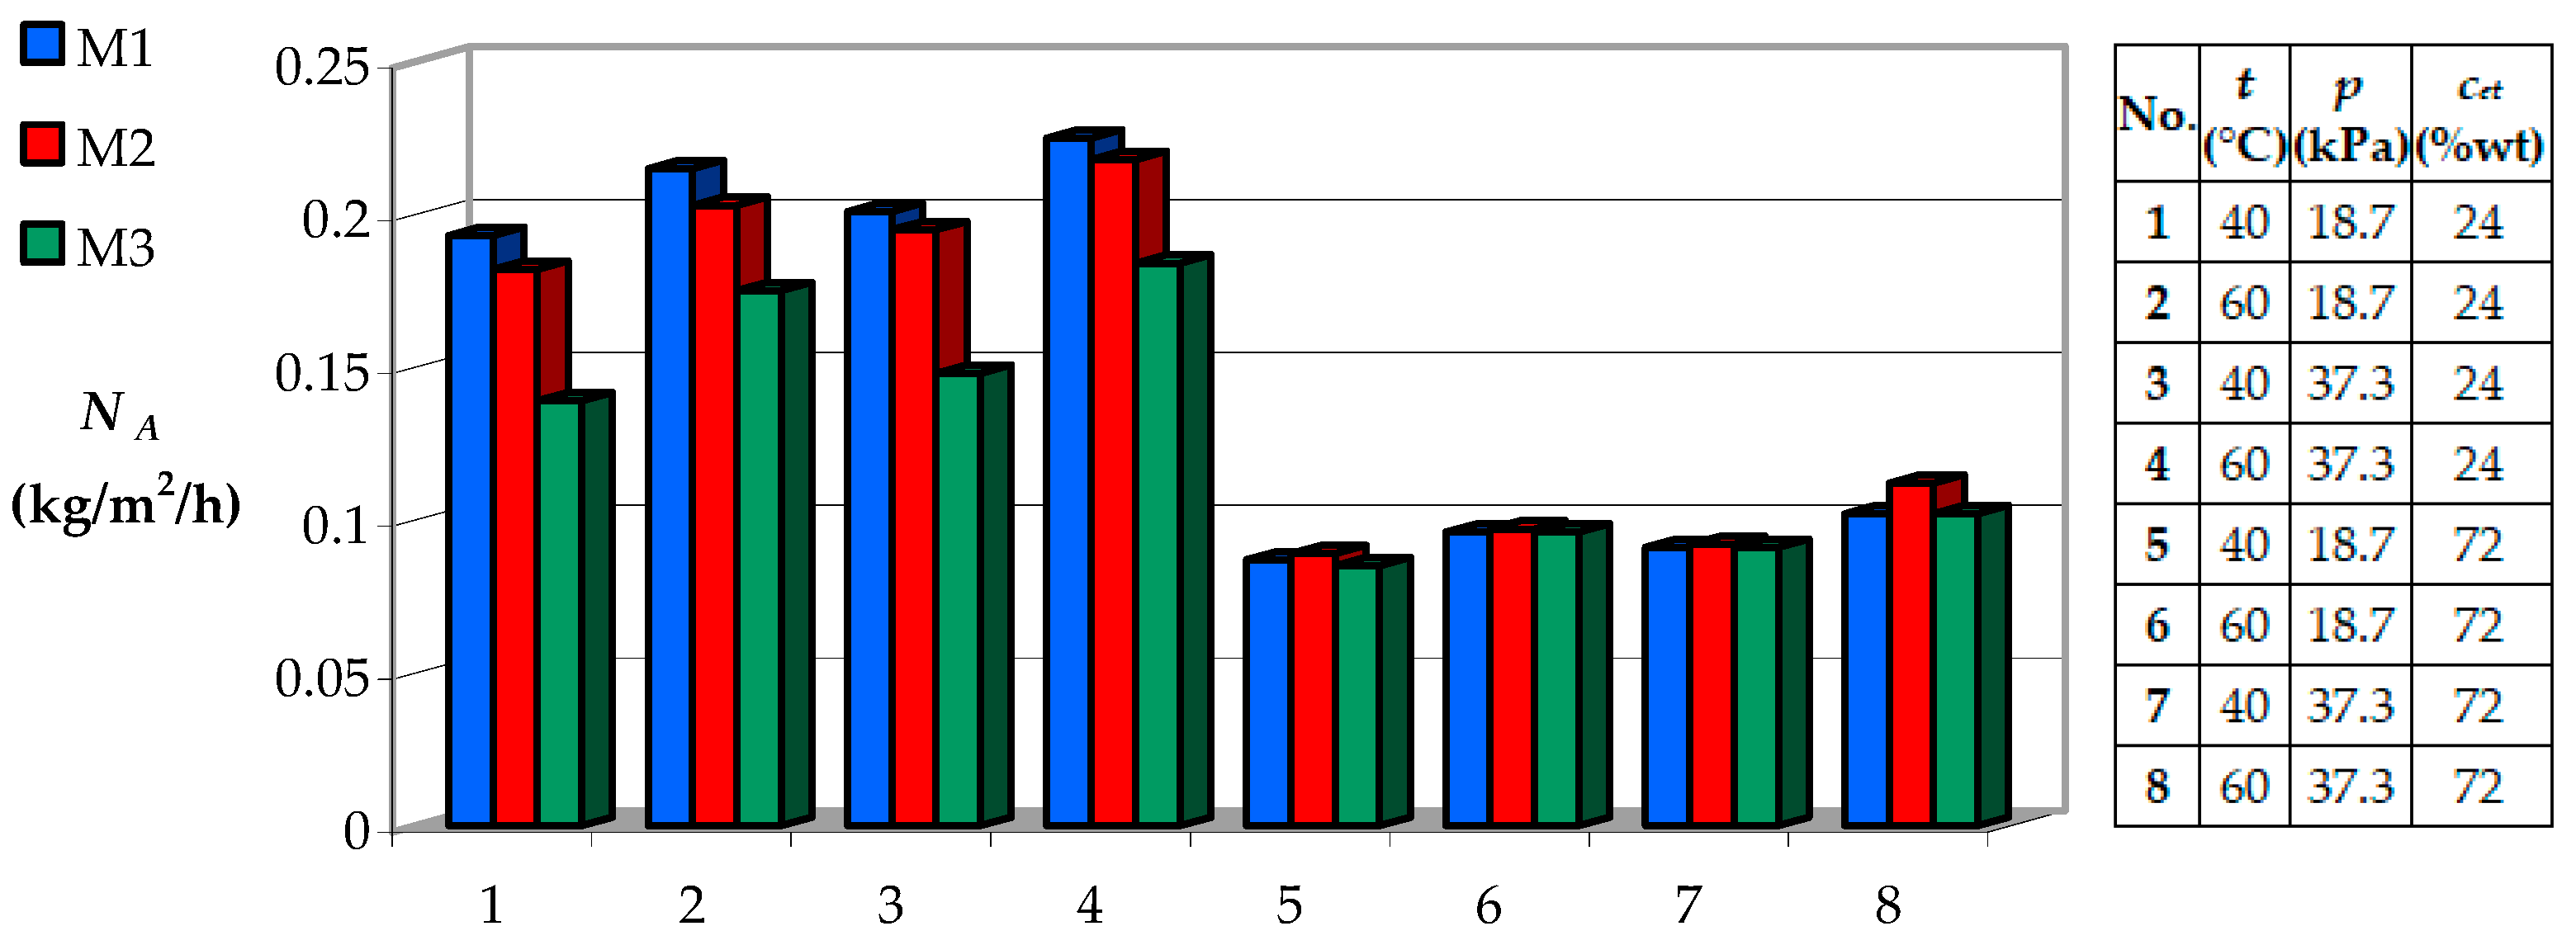
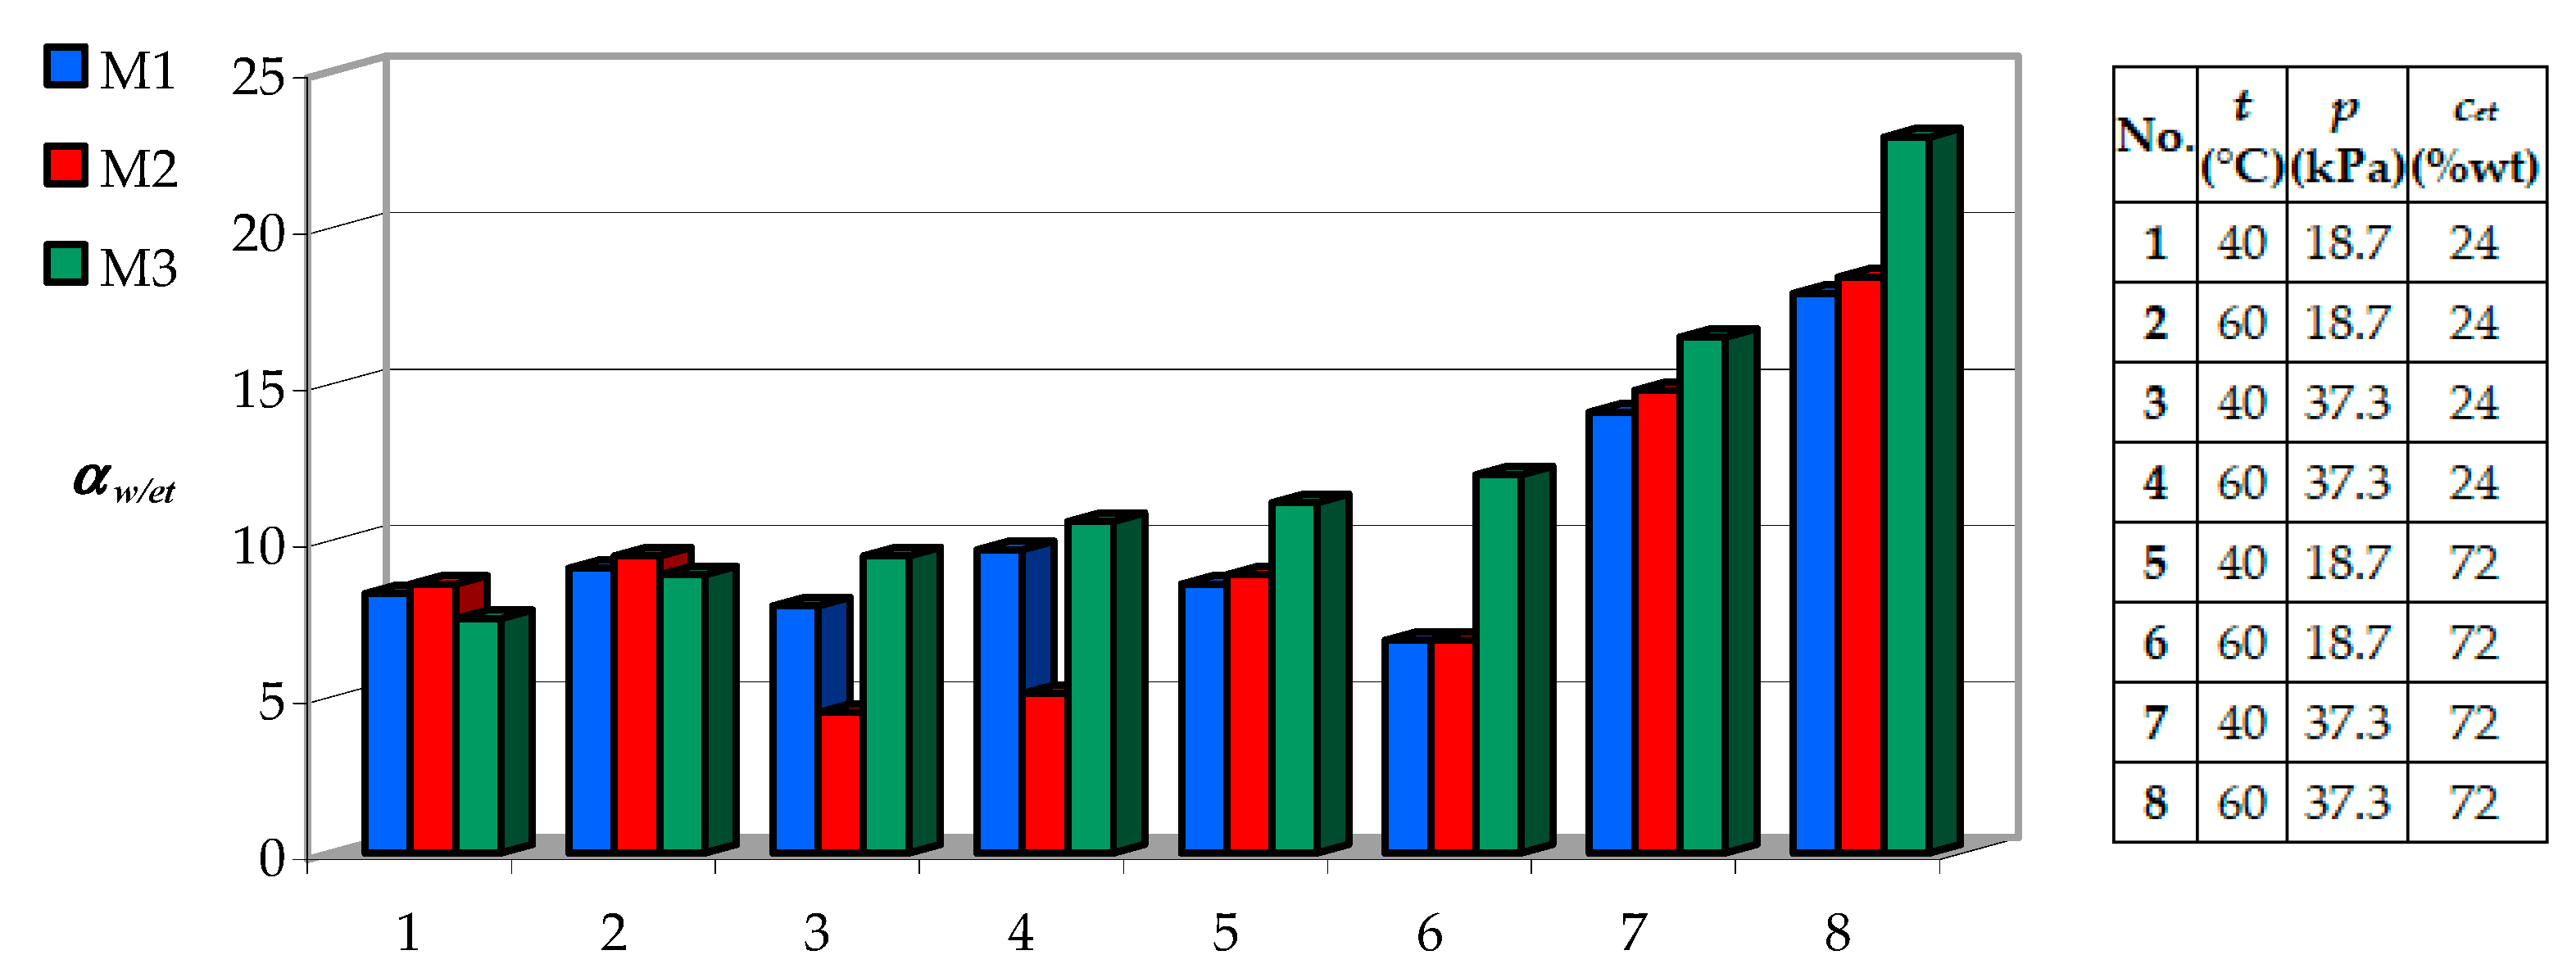
| No. | t (°C) | x1 | p (kPa) | x2 | cet (%wt) | x3 | NA (kg/m2/h) | cEtp (%wt) | αw/et |
|---|---|---|---|---|---|---|---|---|---|
| 1 | 40 | −1 | 18.7 | −1 | 24 | −1 | 0.182 | 3.18 | 8.6 |
| 2 | 60 | 1 | 18.7 | −1 | 24 | −1 | 0.203 | 2.92 | 9.5 |
| 3 | 40 | −1 | 37.3 | 1 | 24 | −1 | 0.195 | 5.24 | 4.7 |
| 4 | 60 | 1 | 37.3 | 1 | 24 | −1 | 0.218 | 4.92 | 5.1 |
| 5 | 40 | −1 | 18.7 | −1 | 72 | 1 | 0.089 | 20.63 | 8.9 |
| 6 | 60 | 1 | 18.7 | −1 | 72 | 1 | 0.097 | 24.71 | 6.8 |
| 7 | 40 | −1 | 37.3 | 1 | 72 | 1 | 0.092 | 13.95 | 14.8 |
| 8 | 60 | 1 | 37.3 | 1 | 72 | 1 | 0.112 | 11.50 | 18.8 |
| 9 | 50 | 0 | 28 | 0 | 48 | 0 | 0.151 | 8.30 | 9.2 |
| 10 | 50 | 0 | 28 | 0 | 48 | 0 | 0.148 | 8.05 | 9.6 |
| 11 | 50 | 0 | 28 | 0 | 48 | 0 | 0.147 | 7.81 | 9.9 |
| Parameter | Membrane Type | Polynomial Regression Model βi(x4) = b0i + b1ix4 + b2ix42 | ||
|---|---|---|---|---|
| PVA-BC 12/6 (k = 1) | PVA-BC 12/12 (k = 2) | PVA-BC 12/18 (k = 3) | ||
| cBC (%wt) | 2.4 | 4.8 | 7.2 | - |
| x4 | –1 | 0 | 1 | - |
| β0k | 0.151 | 0.149 | 0.127 | 0.149 – 0.012x4 – 0.014x42 |
| β1k | 0.00825 | 0.009 | 0.012 | 0.009 + 0.056x4 + 0.055x42 |
| β2k | 0 | 0.00575 | 0 | 0.00575 – 0.00575x42 |
| β3k | –0.057 | –0.051 | −0.034 | –0.051 + 0.012x4 + 0.0055x42 |
| β13k | 0 | 0 | 0.00625 | 0.0031x4 + 0.0031x42 |
| Parameter | Membrane type | Polynomial Regression Model αj(x4) = a0j + a1jx4 + a2jx42 | ||
|---|---|---|---|---|
| PVA-BC 12/6 (k = 1) | PVA-BC 12/12 (k = 2) | PVA-BC 12/18 (k = 3) | ||
| cBC (%wt) | 2.4 | 4.8 | 7.2 | - |
| x4 | −1 | 0 | 1 | - |
| α0k | 10.3 | 9.58 | 12.4 | 9.58 + 1.05x4 + 1.77x42 |
| α1k | 0 | 0 | 1.225 | 0.613x4 + 0.613x42 |
| α2k | 2.1 | 1.27 | 2.475 | 1.127 + 0.188x4 + 1.161x42 |
| α3k | 1.55 | 2.65 | 3.275 | 2.65 + 0.862x4 − 0.238x42 |
| α12k | 0.825 | 0.68 | 0.05 | 0.68 − 0.388x4 − 0.243x42 |
| α23k | 2.05 | 3.25 | 1.55 | 3.25 − 0.25x4 − 1.45x42 |
| α123k | 0 | 0.75 | 0 | 0.75 − 0.75x42 |
| Run | t (°C) | p (kPa) | cet (%wt) | cBC (%wt) | NA (kg/m2/h) | αw/et | ||
|---|---|---|---|---|---|---|---|---|
| Experimental (ex) | Predicted (pr) by Equation (15) | Experimental (ex) | Predicted (pr) by Equation (16) | |||||
| 1 | 55 | 32.7 | 60 | 6 | 0.153 | 0.1458 | 13.9 | 13.911 |
| 2 | 0.139 | 15.1 | ||||||
| 3 | 0.146 | 14.9 | ||||||
| 4 | 0.161 | 13.4 | ||||||
| 5 | 0.151 | 14.2 | ||||||
| Pex,mn | 0.150 | kg/m2/h | 14.3 | - | ||||
| SD | 0.0082 | kg/m2/h | 0.7036 | - | ||||
| SE | 0.0037 | kg/m2/h | 0.3146 | - | ||||
| CV | 5.46 | % | 4.92 | % | ||||
| df | 4 | 4 | ||||||
| T | 1.147 | 1.236 | ||||||
Publisher’s Note: MDPI stays neutral with regard to jurisdictional claims in published maps and institutional affiliations. |
© 2021 by the authors. Licensee MDPI, Basel, Switzerland. This article is an open access article distributed under the terms and conditions of the Creative Commons Attribution (CC BY) license (http://creativecommons.org/licenses/by/4.0/).
Share and Cite
Dobre, T.; Patrichi, C.A.M.; Pârvulescu, O.C.; Aljanabi, A.A.A. Pervaporation of Aqueous Ethanol Solutions through Rigid Composite Polyvinyl-Alcohol/Bacterial Cellulose Membranes. Processes 2021, 9, 437. https://0-doi-org.brum.beds.ac.uk/10.3390/pr9030437
Dobre T, Patrichi CAM, Pârvulescu OC, Aljanabi AAA. Pervaporation of Aqueous Ethanol Solutions through Rigid Composite Polyvinyl-Alcohol/Bacterial Cellulose Membranes. Processes. 2021; 9(3):437. https://0-doi-org.brum.beds.ac.uk/10.3390/pr9030437
Chicago/Turabian StyleDobre, Tănase, Claudia Ana Maria Patrichi, Oana Cristina Pârvulescu, and Ali A. Abbas Aljanabi. 2021. "Pervaporation of Aqueous Ethanol Solutions through Rigid Composite Polyvinyl-Alcohol/Bacterial Cellulose Membranes" Processes 9, no. 3: 437. https://0-doi-org.brum.beds.ac.uk/10.3390/pr9030437