
Sustainable Development in EU Countries in the Framework of the Europe 2020 Strategy


Faculty of Management, University of Prešov in Prešov, Konštantínova 16, 080 01 Prešov, Slovakia
*
Author to whom correspondence should be addressed.
Processes 2021, 9(3), 443; https://0-doi-org.brum.beds.ac.uk/10.3390/pr9030443
Submission received: 4 February 2021
/
Revised: 23 February 2021
/
Accepted: 25 February 2021
/
Published: 28 February 2021
(This article belongs to the Special Issue Process Design and Sustainable Development)
Abstract
:The Europe 2020 Strategy was proposed with a long-term vision to ensure prosperity, development, and competitiveness for the member countries. This strategy is divided into three main areas named “growth”. One of these is sustainable growth. This is an area of sustainability, where the partial targets are referred to as the “20-20-20 approach”, and includes a reduction of greenhouse gas emissions, an increase in energy efficiency, and the sharing of renewable energy sources. However, questions arise, including: How do member states meet these targets? Which countries are leaders in this area? According to these stated questions, the aim of this article is to assess how EU countries are meeting the set targets for sustainable growth resulting from the Europe 2020 strategy and to identify the countries with the best results in this area. We looked for answers to these questions in the analysis of sustainable indicators, which were transformed into a synthetic measure for comparability of the resulting values. Finally, we identified the Baltic states, Nordic countries (European Union members), Romania, and Croatia as the best countries in fulfilling the sustainable growth aims. As sustainable development and resource efficiency are crucial areas for the future, it is important to consider these issues.
1. Introduction
The Lisbon Strategy was launched in Lisbon in March 2000, formulated and agreed to by the heads of state and governments of all European Union (EU) member states. It is a 10-year strategy with an ambitious goal of growth and jobs, at the end of which Europe would become the world’s most dynamically knowledge-based economy capable of sustainable growth and able to compete worldwide [1,2]. In 2005, due to the unsatisfactory results of the previous period, this strategy was renamed and innovated as the Growth and Jobs Strategy, or the renewed Lisbon Strategy. This strategy enables the weakest countries to catch up with the living standards of the most developed countries in the EU. Only through rapid and long-term economic growth can such a goal be achieved [3].
The main problems leading to failure included many set goals and insufficient focus on them, the inconsistent pursuit of these goals, the reluctance of some states to meet these goals (as, in some cases, they required unpopular measures), and the fact that not all goals suited all countries, as each country has its own level of economy and reformation. The strategy was better fulfilled by states that already had reforms in place within their country [4]. A major problem that created significant regional disparities at the national level was the ability to adopt new technologies.
This problem is especially true for the new EU member states and lagging regions. The creation of regional disparities hampers the development of the EU as a whole; therefore, it is important to set up the system in such a way that it mainly supports the development of the new EU member states. The ability to adopt new technologies is followed by policies such as science, research, and innovation policies. There is a real concern that more developed regions, which have better and quantitatively more room to adapt to change, will benefit from the promotion of innovation, the knowledge economy, and electronics.
While less developed countries are devoting resources to attracting investment in new technologies, developed countries will move forward, thus widening the regional disparities. Unfortunately, European policies do not address the specific problems of lagging regions or the possible effects of increasing or decreasing regional disparities [5]. "Following the more or less unsuccessful completion of the Lisbon Strategy, the EU adopted a new strategy in 2010 that aims to improve the European competitiveness of the Union and its Member States" [6].
The new strategy, called the Europe 2020 Strategy, aims to eliminate disparities between member countries. Much research is dedicated to this area and evaluates the achieved results of countries based on individual indicators, such as [1,7,8,9,10,11,12]. The Europe 2020 Strategy contains several areas for which objectives are specified for improving the current situation in EU member states. But only a few studies, e.g., [13,14,15,16,17], are dedicated to the field of sustainable growth. Therefore, we are interested in how individual countries are meeting their goals in this very specific area, which is linked to many areas of economics and human life. So, our goal is to assess how each country is achieving its goals as the 10-year period is slowly coming to an end and the results should be clear.
In the field of sustainability, the Europe 2020 Strategy has specified an area called 20-20-20, which sets out the priorities and goals that EU countries have to meet by 2020 [18]. They are:
- To increase the share of renewable energy sources in final energy consumption to 20%,
- To reduce greenhouse gas emissions by at least 20% compared to 1990 levels, and
- A 20% increase in energy efficiency, associated with a reduction in energy consumption.
2. Literature Review
The current reform agenda, focusing mainly on growth and jobs, is the Europe 2020 Strategy [9]. This global policy strategy, proposed with a long-term vision, was proposed by the European Commission and subsequently endorsed by the European Council in June 2010. The year 2010 was a new beginning for the European Union. Following the previous Lisbon Strategy and the consequences of the economic crisis, Europe wanted to emerge from this crisis, both financially and economically stronger. This is why the European Union decided to launch a new Europe 2020 Strategy, the main aim of which was to build a highly innovative and competitive economy throughout the EU. The Europe 2020 Strategy was launched by the European Commission as a 10-year plan, the short-term priority of which was to emerge from the crisis and, at the same time, achieve a sustainable future with an ever-evolving world economy. In designing the Europe 2020 Strategy, the lessons learned from the implementation of the Lisbon Strategy were taken into account, inspired by its strengths but also by its weaknesses [7].
This strategy aimed to help Europe recover from the economic crisis and transform it into a smart, sustainable, and inclusive economy with high levels of employment, productivity, and social cohesion, and to re-strengthen the EU’s position as a major player in global governance [10]. Sustainable growth consists of efforts to improve countries in the areas of renewable energy, CO2 emissions and energy consumption [8]. The basic goal of the strategy was to increase the sustainable, inclusive, and smart growth of the European Union; therefore, the European Commission proposed to set five measurable and ambitious goals, which have gradually become national goals, in the following areas: employment, research and innovation, climate change and energy, education, and poverty and social exclusion.
Sustainable growth is made up of three main objectives, as mentioned above. One is to increase the share of renewable energy sources in final energy consumption to 20%. To achieve this goal, certain underlying issues in related areas need to be taken into account, such as objectives in transport, temperature, and electricity regulation; energy policy measures to combine different types of renewable technologies; and the use of business mechanisms to promote joint support schemes and joint projects between member states [19].
According to Gogkoz and Guvercin [20], geographical mismatches between the main centers of energy production and consumption lead to higher vulnerability of the energy exporting and importing countries to various risks. Wars, political tensions, and technical failures can reduce energy supplies. In this respect, renewable energy is the key to ensuring energy security. Renewable energy is typically provided by local natural resources, which are constantly replenished and environmentally friendly. As a result, renewable energy is available for each region and can take into account its geographical and natural specifics and use them in this area.
Renewable energy sources can be divided into two groups, namely common and emerging energy technologies. Common energy technologies include hydro and wind energy, solar energy, biomass, biofuels, and geothermal energy. The group of emerging energy technologies includes marine energy, concentrated solar photovoltaics, improved geothermal energy, cellulose ethanol, and artificial photosynthesis [21]. In order for renewables to be sustainable, they should be unlimited; however, at the same time it is good to keep in mind that they should not harm the environment. Another typical attribute of renewable energy sources is the price, and so this energy should be cheap in the long run.
Global warming is one of the most significant changes in the world today. Global warming is caused by the increased concentration of greenhouse gases in the atmosphere and leads to a phenomenon commonly known as the "greenhouse effect" [22]. Anthropogenic greenhouse gas emissions disrupt the radioactive balance of the atmosphere, resulting in a change in climatic patterns. Carbon dioxide (CO2) emissions produce changes that are visible in the natural environment, e.g., they change the alternation and course of individual seasons, and they disrupt the habitats of marine ecosystems.
In addition, we can see the effects of increasing CO2 emissions on the climate, even with the increase and yield of rainfall. Current policies in this area aim to reduce extreme weather events, and thus avoid the danger of climate change. As climate change caused by carbon dioxide has been predicted to be irreversible for approximately 1000 years, efforts are being made to reduce the concentration of these emissions in the atmosphere [23]. Many countries are taking action against climate change. There are currently approximately 1800 laws and regulations in the world addressing the need to protect the environment. No country in the world does not have at least one law on environmental protection [24]. The Europe 2020 Strategy sets out the priority of reducing greenhouse gas emissions by at least 20% compared to 1990 levels.
Several authors have stated that climate change is occurring with increasing energy consumption. Energy-related activities are the main source of greenhouse gas emissions [25]. Studies have confirmed that two-thirds of greenhouse gases generally come from fossil-energy-related greenhouse gas emissions, and that these emissions are on the rise. Therefore, the first step in reducing greenhouse gas emissions is to reduce energy consumption or increase energy efficiency [26,27]. Various types of primary energy include oil, coal, gas, hydropower, and other renewable energy sources [28].
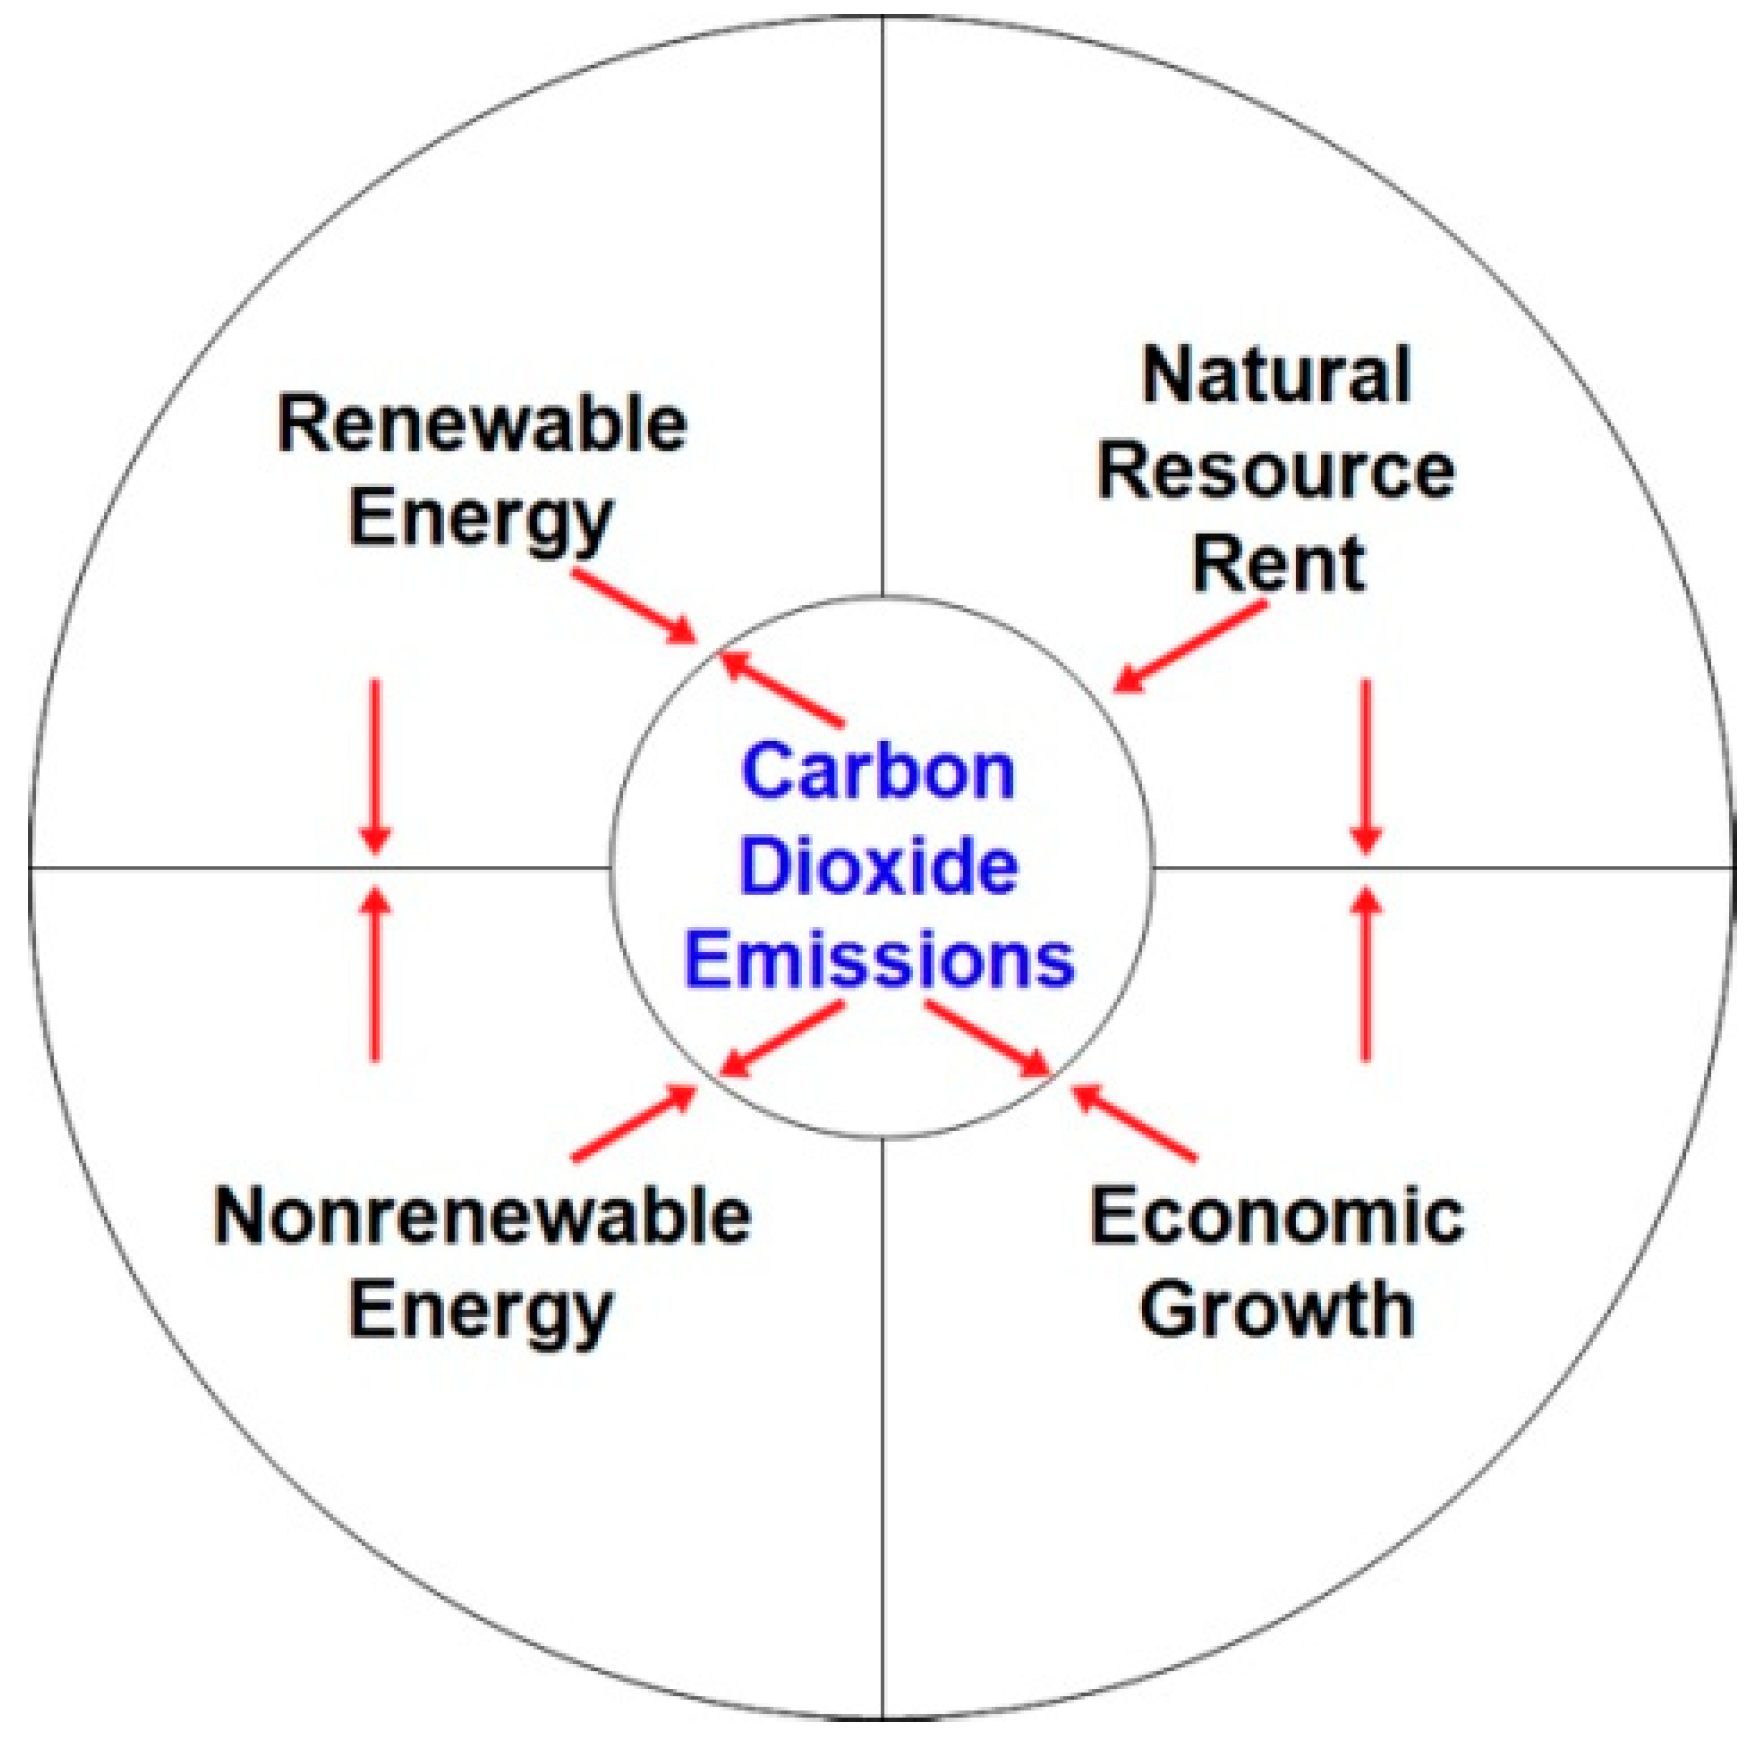
The authors Bekun, Alola, and Sarkodie [29] suggested an interrelationship between carbon dioxide emissions, economic growth, natural resource rent, renewable energy, and non-renewable energy consumption. The links between these individual elements can be seen in Figure 1. The authors stated that the consumption of non-renewable energy and economic growth increased carbon emissions, while the consumption of energy from renewable sources decreased. Positive effects can be deduced from ecological energy sources, especially considering the goals of sustainable development.
Addressing climate and environmental issues is a crucial challenge today with a vision for the years to come. This will be a challenging period that requires interventions in the functioning of an energy self-sufficiency economy. These changes affect all sectors. At the same time, this offers an opportunity to modernize and streamline the economy [18]. The Europe 2020 Strategy is a strategy for smart, sustainable, and inclusive growth that distinguishes the following major factors that contribute to the strengthening of the economy [30,31]. Sustainable growth represents the promotion of a more resource-efficient, greener, and more competitive economy. The specific objectives of this strategy in the area of sustainability are to reduce greenhouse gas emissions by at least 20% compared to 1990 levels; increase the share of renewable energy sources in final energy consumption to 20%; and increase energy efficiency by 20% [18].
The EU’s strategic document Europe 2030 follows Europe 2020 for the next decade. According to the nature of the 2030 Agenda issued by the European Commission, creativity and innovation in particular are considered to be key elements of development. They are the driving forces behind the personal, social, and economic development of Europe. The terms “creative solutions” and “innovative practices” are considered to be catalysts for the growth and prosperity of the regions of the European Union.
Agenda 2030 is a plan designed to ensure prosperity for the people of the EU. In today’s world of many economic, political, and social challenges, the program supports world peace and also helps to eradicate poverty in all its forms. Poverty is one of the biggest challenges in the world today. Agenda 2030 can be described as a comprehensive approach that fills a gap with a multilateral approach, and is also an important frame of reference for the protection of values, nature, humanity, and human rights. In the current context of Agenda 2030, indicators to monitor the achievement of the sustainable development goals are becoming essential [32].
Innovation is needed to achieve the goals of sustainable development. Green knowledge management processes have a special role to play in sustainable development, especially in the field of the creation, acquisition, exchange, and use of knowledge, as well as its impact on green technologies, eco-innovation, and the socio-economic dimension of sustainable development [30]. Over the last 15 years, the field of sustainability has aroused interest among many authors. Many sustainability concepts are based on the three pillars, namely, environmental, economic, and social [33]. Many authors have different approaches with defining the terms of sustainable development. Jabareen [34] stated that the definitions of sustainable development are vague and that there is a lack operative definition of this term. Daly [35] pointed out the utility for future generations. Development might be better defined as utility per throughput of GDP growth. We can find the ethical concept of this term in the work of Ebner and Baumgartner [36]. Sustainable development is explained as a balance between the pillars of sustainable development, which are the environmental, social, and economic pillars; however, some authors also add a fourth cultural pillar, or a pillar of good governance [37].
To ensure the benefits of sustainable growth, the entire world economy must grow. This is mainly due to the fact that if rich countries do not grow rapidly, they will not have a surplus to invest in poor countries, nor any additional income that can be used to buy exports from poor countries [35].
Every economy that wants to be successful and competitive must pay attention to its performance. The country’s competitive position in a sustainable environment is a key element. Competitiveness in today’s world is an important aspect of every country. In the case of long-term periods, it is important to build a sustainable economy. Based on this, we set out the main aim of the article as follows: to assess how EU countries are meeting the set targets for sustainable growth resulting from the Europe 2020 Strategy and to identify the countries with the best results in this area.
3. Materials and Methods
The sustainability of the overall development of the EU community is emphasized by the Europe 2020 Strategy. This strategy has set priorities and targets that EU countries are scheduled to meet by 2020. One of them is sustainable growth. This is a summary term for three targets, named 20-20-20 [18].
We divided these goals into two groups according to the nature of their consequences, where the first group is formed by the stimulating factor (share of renewable energy) and the second group is formed by non-stimulating factors (the remaining two goals).
As a sample of countries, we chose the countries forming the EU. The selection was also conditioned by the commitment of the EU member states to the Europe 2020 Strategy. The current contribution also includes the United Kingdom within the EU, as we evaluated a period of 14 years, i.e., from 2005 to 2018. During this period the UK was a full member of the EU and had the resulting obligations.
Methods of multicriteria analysis originated in the 1960s. They were used as a decision tool. Today, these methods are becoming more popular [38]. Multicriteria analysis provides a systematic approach to combining different information inputs to rank project alternatives. It is also used to quantify decision makers to compare alternatives. There are many approaches that fall under the multicriterial decision analysis, each of which includes different structures for their representation, algorithms for their combination, and processes for interpretation [14,39].
We have a set of data related to our research problem. We analyzed data on Europe 2020 indicators from the field of climate change and energy. For the needs of our analyses, we worked with this data: share of renewable energy [40], greenhouse gas emissions [41], and primary energy consumption [42]. This data was obtained mainly from Eurostat databases. In the first step, we ordered the data into a matrix, where we have m values in n objects [43,44,45].
The indicators represent the different units; therefore, it is a problem to compare them in various units, and they should be normalized into standardized values (SV). We chose different formulas for stimulating and non-stimulating factors [46], which take into account their specificities.
where SVij represents the standardized value of xij; xij represents the actual value of the ith value in jth country; and max and min refer to the maximum and minimum value [47].
The evaluation and comparison of various indicators respecting countries to each other is an important issue in recent years [48]. Regions are compared according to several criteria to determine the most successful one. This topic will continue to be an important challenge for the coming years. In this context, the calculation of the synthetic measure is one of the offered options. The advantage is that this is one of the most recognized alternatives, because the output is very simple and clear [49,50] and ultimately supports the comparability of the examined objects. This index is based on the taxonomic distances of a chosen indicator from the best object, where the best object has the highest parameters according to the character of the indicator [51,52].
The aim of the research of the synthetic measure is to measure complex groups of variables [53] that are determined to describe the state from several perspectives [54]. This method has recently gained popularity, especially in applied sciences such as economics. Synthetic measures use a statistical methodology equipped with the necessary mathematical formalization to define a synthetic measure from a group of ordinal and dichotomous variables [49].
Based on the above knowledge of the benefits of this approach, we also decided to use this synthetic measure for our research. The construction of the synthetic measure (SM) was as follows:
Finally, the results of the synthetic measure are comparable and complex, because they create a picture of the country on the basis of a summary of several facts or indicators. They represent the summary data of the country in a given year.
According to obtained values in the synthetic measure, the four groups were created. The individual groups were formed with respect to the methodology used by Stec and Grzebyk [46]. They analyzed, in their study, the fulfillment of all five fundamental objectives of the Europe 2020 Strategy in a period of six years, specifically 2009–2014. Molina, Fernández, and Martín [55] divided the countries into three groups, according to results of their synthetic measure. However, we determined that a four-group division was more effective. It contains several groups that can take into account the fine specifics in the obtained results, and thus more accurately divide the analyzed countries. Based on Stec and Grzebyk [46], the groups are as follows:
where SM is the synthetic measure obtained by countries, oSM is the overall synthetic measure, and STD is the standard deviation.
Group I: SM ≥ oSM + STD
Group II: oSM + STD > SM ≥ oSM
Group III: oSM > SM ≥ oSM − STD
Group IV: oSM − STD > SM
The clarity, ease of processing, and classification of the results, and thus the countries, and last but not least the use in research similar to ours, have convinced us to use this approach rather than a cluster analysis. We also did not a use cluster analysis due to its negatives, which are mentioned by several authors, such as indistinctness, measurability [56], a large diversity of clustering algorithms [57,58], and the fact that clustering always provides groups, even if there is no group structure [59]. When using clusters, groups are assumed to exist. But it is this assumption that may be wrong or weak. Now, we will analyze the development of countries based on sustainable growth indicators. In conclusion, based on the recalculations and synthesis of the obtained data into a synthetic measure, we shall evaluate how the countries have done in this area. Finally, we identify the countries that are the strongest EU economies in this area and investigate how their positions have changed over time.
The share of renewable energy is a stimulating factor. It is desirable for EU countries to obtain the highest values in this indicator. In the table below (Table 1) [40], the highlighted values in bold and italics represent the status in which the countries have met the target. There are, of course, differences between countries in the target values. The lowest target value was set in Luxembourg, in the amount of 11%, and the highest was in Sweden, at about 49%. If we average the target values of the individual countries, we have 21%, which is slightly above the level of the set target of this indicator in the Europe 2020 Strategy. We can see that certain countries obtained the target value only in the last years (Greece, Cyprus, and Latvia). Croatia was the only country that obtained the target values in the whole analyzed period. The target value for this country was 20%. The remaining countries that met the target values did so mostly in the period 2011–2018.
Now, we focus on the situation in the EU. Data regarding greenhouse gas emissions [41] are presented in Table 2. Highlighted values in bold and italics represent the status in which the countries have met the target. In the case of this factor, all EU member states set the same value. It is highly desirable for each EU country to reduce greenhouse gas emissions by 20% to 80% compared to 1990. This aim is equal for all countries. Compared to the development of the previous indicator, we can see that the countries have been meeting this target for several years. There were no exceptions for countries reaching the required value in the whole monitored period. We can see this fact in Bulgaria, Czech Republic, Estonia, Latvia, Lithuania, Romania, and Slovakia. Even large economies, such as Germany, the UK, and Sweden have met the required values of the indicator for several years.
In Table 3, the highlighted values in bold and italics represent the status in which the countries have met the target. It is desirable for all EU countries to reduce their consumption [42]. In percentage terms compared to 2005, the average values should decrease to 80%. In Table 3, there are set data in million tonnes of oil equivalent. Three countries, namely, Estonia, Croatia, and Latvia, met the specified values during the whole monitored period. The Czech Republic, Denmark, Cyprus, Malta, Austria, Sweden, and the UK met the specified values only in one or two years. The remaining countries managed to reach the target in recent years. The Europe 2020 Strategy has set target values to be met by 2020. Therefore, it is very desirable to identify the countries that in recent years have grown closer to meeting the specified values. Almost all achieved values in EU countries had a declining trend. If we look at the aggregate values of the indicators for all 28 countries, the values already achieved in 2018 were close to the set target amount.
4. Results and Discussion
4.1. Evaluation of the Performance of EU Countries in the Context of Sustainable Indicators
The share of renewable energy is a stimulating factor. Renewable energy sources are currently unevenly and insufficiently exploited in the European Union [60]. Energy is crucial for economic progress. The current growth of the world’s population requires more energy. The transition to renewable energy produced from renewable natural sources is an opportunity to meet growing demand, promote energy security, and contribute to tackling global warming and climate change [21].
It is desirable for all countries to obtain the highest values of this indicator. The target for all EU countries is to reach 20%. In addition to this goal, all member states have set their own specific goal in this area. The aim is higher than the overall set value of 20%, in the case of 10 countries.
Overall, we can say that the values of the share of renewable energy in gross final energy consumption are increasing every year. This is true in the case of countries that already meet the set values and in the case of countries that still lack a few percentage points to reach them. If we examine the average values for all EU countries, there is also an increase in the shares of renewable energy in gross final energy consumption. In the last analyzed year, the value of the EU average was over 18%, which is close to the set target value of 20%.
Many scientists assume that increasing the share of renewable energy will lead to a reduction of CO2 emissions [61]. The current situation in the area of greenhouse gas emissions is as follows. The six largest producers of greenhouse gases in the world together account for 62% of total production. These are China (26%), the United States (13%), the European Union (about 9%), India (7%), the Russian Federation (5%), and Japan (almost 3%). Three of them showed a decrease in greenhouse gas emissions in 2019, namely the European Union (−3.0%), the USA (−1.7%), and Japan (−1.6%) [62].
In the case of this factor, all EU member states set the same value. It is highly desirable for each EU country to reduce greenhouse gas emissions by 20%. This aim is equal for all countries. Compared to the development of the previous indicator, we can see in Table 2 that 15 countries have been meeting this target for several years.
Primary energy consumption was a non-stimulating factor. For this reason, it is desirable for each country to reduce the achieved values of this indicator to at least the set target value, possibly even below this level. Even for this indicator, each country has its own target value, taking into account its specificities and capabilities. We can notice that in the case of this indicator, compared to the previous ones, most of the EU countries met the set values. The lowest volume of primary energy consumption was given for Malta, while the highest was for Germany.
In Table 1, Table 2 and Table 3 we marked the names of the selected countries in colour. In this case, these are countries that reached the target values in at least one year in all three analyzed sustainable development indicators. These countries are the Czech Republic, Denmark, Estonia, Croatia, Latvia, Lithuania, Hungary, Romania, Finland, and Sweden.
4.2. Evaluation of the Results of EU Countries
As the data on individual indicators are of a different nature (stimulating and non-stimulating factors), and the countries reached different values in the observed period, it is problematic to compare countries on the basis of such data. In addition, for some indicators, countries had individual targets [13,63]. Thus, the evaluation of absolute values does not allow us comparability. To resolve this issue, we had to convert this data to a standardized value for each indicator.
The question is how to compare countries with each other if we consider all the analyzed indicators. We used a synthetic measure to solve this problem. It is calculated as follows:
This synthetic measure can reach the values [0,1]. The results obtained with the synthetic measure in the analyzed countries are below, in Table 4.
Based on the calculated synthetic measure (SM), we already had comparable data available for the analyzed countries. As we analyzed 28 EU member states over a period of 14 years, we decided to classify the calculated values into groups. We determined the groups with regard to the achieved results of the country. We created four groups, where group I represents the formation of the most developed countries, which concerns the indicators we examined. Conversely, group IV was formed of the weakest countries, or countries that had the greatest difficulty in meeting the targets and individual targets for sustainable growth set out in the Europe 2020 Strategy.
For better comparability, with respect to sketching the progress between the individual countries, we classified the countries into the four groups mentioned in 2005, 2010, and 2018. That is, in the first analyzed year (2005), as a reference to the starting point situation, in the year 2010, as the first year of implementation of the Europe 2020 Strategy, and in the last analyzed year (2018), where we wanted to point out the progress of some countries. Countries that improved their positions in 2010 and 2018 by moving to a higher group are highlighted.
The individual groups were formed with respect to the methodology used by Stec and Grzebyk [46]. This four-group division contains several groups that can take into account the fine specifics in the obtained results, and thus more accurately divide the analyzed countries. Based on Stec and Grzebyk [46] and the obtained results from our research, the groups are as follows:
where SM is the synthetic measure obtained by countries.
Group I: SM ≥ 0.7386
Group II: 0.7386 > SM ≥ 0.5926
Group III: 0.5926 > SM ≥ 0.4467
Group IV: 0.4467 > SM
Table 5 provides us with a clear order of countries according to defined groups, namely in 2005 as the first analyzed year, in 2010 as the first year of implementation of the Europe 2020 Strategy, and in 2018 as the last analyzed year.
In 2005, there were only three Baltic countries in group I of the high level countries. After 14 years, this group grew by five other countries, namely the Nordic countries, Croatia, and Romania. The last two countries may come as a surprise for many readers, as they are not significantly strong EU economies. However, these countries deserved their position, because they met the required values in the monitored indicators in the area of sustainable growth. In addition, their individual targets were set at approximately the same levels as the EU average targets. Romania entered group I after five years, together with Sweden, while Croatia achieved this in 2018.
Group II, the medium-high level countries, consisted of the same number of countries in 2005 and 2018. However, there were changes in the representation of countries within this group. Some countries that were included in this group in 2005 improved their position in 2010 and 2018 and moved to group I. They were Romania and Sweden in 2010, and Denmark, Croatia, Finland in 2018.
The representation of the largest number of countries is in group III. In the years 2005, 2010, and 2018, Belgium, the Netherlands, Luxembourg, Malta, Ireland, and Poland entered this group. These are countries with both smaller and larger populations and, therefore, different goals. However, these countries met the set targets only in some years for selected indicators, and mostly had difficulty meeting the set quotas of the Europe 2020 Strategy.
Finally, in the last analyzed year, group IV was reduced to three countries, compared to six in 2005 and 2010. This is a good development. There were the same countries in 2005 and 2010. We can divide this group into two parts in the years 2005 and 2010. First, these countries include some of the EU’s largest economies, which also have targets set at higher levels than other countries. On the other side are the weakest economies, including countries with more problems and lower economic performance.
The trend of the decreasing number of countries in the weakest group is desirable. It provides a positive report in moving of individual countries in terms of fulfilling and ensuring sustainable growth. In this regard, we can see the considerable progress that countries have made in the 14 years. Not only was there a decrease in the number of countries belonging to the weakest group in the last year, but there was also a consistent shift upward between the individual groups to higher groups. A shift in the opposite direction was not found.
5. Conclusions
The area of sustainable growth is a very important issue that has been addressed intensively for several years. This is an area that has an impact on the future, whose challenges have recently become very urgent. We can usually observe changes in the climate that will certainly have an effect on virtually everyone. Therefore, it is very important that countries also work together as a whole to minimize the negative impacts and try to pay attention and take measures to improve the future situation.
When we started the analyses, we were concerned about how the countries would cope with the ambitious goals arising from the Europe 2020 Strategy. Over a period of 14 years, we can see a significant improvement in individual countries, which also contributes to meeting the goals of this strategy. It is advisable to focus on a longer period of time, because the processes are demanding, and we cannot expect to see results after a year or two. We can see that countries are attempting to take these concerns seriously. Many countries can be admired for meeting the strategy’s stated objectives in recent years only on the basis of a systematic approach over several years.
In the analysis of individual indicators, we identified countries that met the set criteria throughout the period. There were countries that met the required targets only in some years. In the end, there were countries that did not meet the set values for a single year, although they were constantly approaching them. These countries had another two years to meet the set targets, at least at the end of the set period, in 2020.
For some targets (e.g., primary energy consumption), the required values were reached by more countries than other targets. Setting goals is also important. In the case of greenhouse gas emissions, there was a single goal for all countries, while in other cases, the goals were adapted to the conditions of a given country, of course with regard to the fulfillment of the overall EU goal. The countries that reached the target values in at least one year in all three analyzed sustainable development indicators were the Czech Republic, Denmark, Estonia, Croatia, Latvia, Lithuania, Hungary, Romania, Finland, and Sweden.
Based on the synthetic measure, we comprehensively evaluated the resulting performances of the countries in the entire period. After the subsequent division of the countries into development stages, we identified the most successful countries in the area of strategy implementation. In the last year they were Latvia, Lithuania, Estonia, Denmark, Finland, Sweden, Croatia, and Romania. Except for the Czech Republic and Hungary, these were all countries that reached the target values in all three indicators simultaneously. As far as individual groups are concerned, a shift can be seen from 2018 compared to 2005.
Significantly more countries reached higher groups, and at the same time, the number of countries in the weakest group decreased. This trend of a decreasing number of countries in the weakest group is desirable. It provides a positive report in the moving of individual countries in terms of fulfilling and ensuring sustainable growth. In this regard, we can see the considerable progress that countries have made in 14 years. Not only did the number of countries belonging to the weakest group in the last year decrease, but there was also a consistent shift upward between the individual groups to higher groups. A shift in the opposite direction was not found.
An important area for further research in continuing this work may be analyses of changes in the Europe 2030 Strategy in the area of sustainable growth. What are the other specific targets for this area for the next 10 years? What are the other, new targets in this area? How will individual countries continue to succeed in meeting the set goals and improving the overall situation in this area? How will these improvements help companies and individuals, and how this will affect a country’s overall performance? All these suggestions are possible directions for future research in this area. It is still necessary to examine this area and pay close attention, as this will provide the foundation for the future of humanity and future generations.
Author Contributions
Conceptualization, E.Š., I.K.V., M.D., and R.K.; methodology, E.Š. and R.K.; software, E.Š.; validation, E.Š.; formal analysis E.Š.; investigation, E.Š., R.K., and I.K.V.; resources, E.Š., M.D., R.K. and, I.K.V.; data curation, E.Š.; writing—original draft preparation, E.Š., I.K.V., M.D., and R.K.; writing—review and editing, E.Š., I.K.V., M.D., and R.K.; visualization, E.Š. and R.K.; supervision, E.Š., and R.K.; project administration, R.K.; funding acquisition, R.K. All authors have read and agreed to the published version of the manuscript.
Funding
This research was funded by the Cultural and Educational Grant Agency of the Ministry of Education, Science, Research and Sport of the Slovak Republic, grant numbers KEGA 011PU-4/2019 and KEGA 024PU-4/2020; by the Scientific Grant Agency of the Ministry of Education, Science, Research, and Sport of the Slovak Republic and the Slovak Academy of Sciences, grant number VEGA 1/0648/21.
Institutional Review Board Statement
“Not applicable” for studies not involving humans or animals.
Informed Consent Statement
“Not applicable” for studies not involving humans.
Data Availability Statement
Acknowledgments
The authors also thank the journal editor and anonymous reviewers for their guidance and constructive suggestions.
Conflicts of Interest
The authors declare no conflict of interest. The funders had no role in the design of the study; in the collection, analyses, or interpretation of data; in the writing of the manuscript, or in the decision to publish the results.
References
- Dul’ováSpišáková, E.; Mura, L.; Gontkovičová, B.; Hajduova, Z. R&D in the Context of Europe 2020 in Selected Countries. Econ. Comput. Econ. Cybern. Studies Res. 2017, 51, 243–244. [Google Scholar]
- Pereira, J. Europe 2020–The European Strategy for Sustainable Growth. What Does it Look Like from Outside; Friedrich Ebert Stiftung: Bonn, Germany, 2011; ISBN 978-3-86872-886-6. [Google Scholar]
- Mikloš, I. Stratégia konkurencieschopnosti Slovenska do roku 2010 (Competitoveness strategy of the Slovakia till 2010). Available online: http://www.vuvh.sk/download/VaV/Vyznamne%20dokumenty%20EU/Narod_Lisabonska_strategia.pdf (accessed on 3 January 2021).
- Veselovski, A.; Vaňová, L. Implementácia Lisabonskej stratégie v podmienkach SR (Implementation of Lisbon strategy in Slovakia). pp. 312–315. Available online: http://www.agris.cz/Content/files/main_files/72/150765/57Veselovski.pdf (accessed on 10 November 2020).
- Világi, A.; Bilčík, V.; Klamár, R.; Benč, V. Kohézna politika EÚ na roky 2007–2013 a Lisabonská stratégia; (EU Cohesion Policy 2007–2013 and the Lisbon Strategy); Výskumné centrum SFPS: Bratislava, Slovakia, 2007; p. 39. [Google Scholar]
- Gabrielová, H. Stratégia Európa 2020 a Podmienky na Formovanie štruktúry Slovenskej Ekonomiky (Europe 2020 Strategy and Conditions for Dorminh the Structure of Slovakia); Working Papers; Ekonomický ústav SAV: Bratislava, Slovakia, 2014; ISSN 1337-5598. Available online: http://www.ekonom.sav.sk/uploads/journals/271_wp66_gabrielova.pdf (accessed on 18 December 2020).
- Staníčková, M. Can the implementation of the Europe 2020 Strategy goals be efficient? The challenge for achieving social equality in the European Union. Equilib. Q. J. Econ. Econ. Policy 2017, 12, 383–398. [Google Scholar]
- Tural, K.; Abuzarli, U.; Laman, M. Climate change and energy--Europe 2020 Strategy. Qual. Access Success 2018, 19, 552–555. [Google Scholar]
- Radulescu, M.; Fedajev, A.; Sinisi, C.I.; Popescu, C.; Iacob, S.E. Europe 2020 implementation as driver of economic performance and competitiveness. Panel analysis of CEE countries. Sustainability 2018, 10, 566. [Google Scholar] [CrossRef] [Green Version]
- Ayllón, S.; Gábos, A. The interrelationships between the Europe 2020 poverty and social exclusion indicators. Soc. Indic. Res. 2017, 130, 1025–1049. [Google Scholar] [CrossRef]
- Širá, E. Fulfillment of strategy Europe 2020 on the example of the Slovak Republic. In Management Mechanisms and Development Strategies of Economic Entities in Conditions of Institutional Transformations of the Global Environment; ISMA University: Riga, Latvia, 2019; pp. 313–321. [Google Scholar]
- Bley, S.J.; Hametner, M.; Dimitrova, A.; Ruech, R.; De Rocchi, A.; Gschwend, E.; Umpfenbach, K. Smarter, Greener, More Inclusive? Indicators to Support the Europe 2020 strategy-2017 Edition; Publications Office of the European Union: Luxembourg, 2017; ISBN 978-92-79-70105-4. [Google Scholar]
- Vavrek, R.; Chovancová, J. Assessment of economic and environmental energy performance of EU countries using CV-TOPSIS technique. Ecol. Indic. 2019, 106, 105519. [Google Scholar] [CrossRef]
- Pili, S.; Grigoriadis, E.; Carlucci, M.; Clemente, M.; Salvati, L. Towards sustainable growth? A multi-criteria assessment of (changing) urban forms. Ecol. Indic. 2017, 76, 71–80. [Google Scholar] [CrossRef]
- Štreimikienė, D.; Strielkowski, W.; Bilan, Y.; Mikalauskas, I. Energy dependency and sustainable regional development in the Baltic states: A review. Geogr. Pannonica 2016, 20, 79–87. [Google Scholar] [CrossRef]
- Onofrei, M.; Cigu, E. Regional economic sustainable development in EU: Trends and selected issues. In Proceedings of the EURINT 2015, Regional Development and Integration: New Challenges for the EU, Iasi, Romania, 22–23 May 2015; pp. 268–280. [Google Scholar]
- Lipińska, D. Resource-Efficcent Growth In The Eu’s Sustainable Development–A Comparative Analysis Based On Selected Indicators. Comp. Econ. Res. 2016, 19, 101–117. [Google Scholar] [CrossRef] [Green Version]
- Barroso, J.M. Europe 2020-A Strategy for Smart, Sustainable and Inclusive Growth. 2010. Available online: https://ec.europa.eu/eu2020/pdf/COMPLET%20EN%20BARROSO%20%20%20007%20-%20Europe%202020%20-%20EN%20version.pdf (accessed on 17 January 2020).
- Saint Akadiri, S.; Alola, A.A.; Akadiri, A.C.; Alola, U.V. Renewable energy consumption in EU-28 countries: Policy toward pollution mitigation and economic sustainability. Energy Policy 2019, 132, 803–810. [Google Scholar] [CrossRef]
- Gökgöz, F.; Güvercin, M.T. Energy security and renewable energy efficiency in EU. Renew. Sustain. Energy Rev. 2018, 96, 226–239. [Google Scholar] [CrossRef]
- Armeanu, D.Ş.; Vintilă, G.; Gherghina, Ş.C. Does renewable energy drive sustainable economic growth? multivariate panel data evidence for EU-28 countries. Energies 2017, 10, 381. [Google Scholar] [CrossRef]
- Hussain, S.; Peng, S.; Fahad, S.; Khaliq, A.; Huang, J.; Cui, K.; Nie, L. Rice management interventions to mitigate greenhouse gas emissions: A review. Environ. Sci. Pollut. Res. 2015, 22, 3342–3360. [Google Scholar] [CrossRef] [PubMed]
- Malik, A.; Lan, J.; Lenzen, M. Trends in global greenhouse gas emissions from 1990 to 2010. Environ. Sci. Technol. 2016, 50, 4722–4730. [Google Scholar] [CrossRef] [PubMed]
- Eskander, S.M.; Fankhauser, S. Reduction in greenhouse gas emissions from national climate legislation. Nat. Clim. Chang. 2020, 10, 750–756. [Google Scholar] [CrossRef]
- Adamišin, P.; Huttmanová, E. The analysis of the energy intensity of economies by selected indicators of sustainability (Rio+ 20). J. Econ. Dev. Environ. People 2013, 2, 7–18. [Google Scholar] [CrossRef] [Green Version]
- Liobikienė, G.; Butkus, M. The European Union possibilities to achieve targets of Europe 2020 and Paris agreement climate policy. Renew. Energy 2017, 106, 298–309. [Google Scholar] [CrossRef]
- Cao, X.; Dai, X.; Liu, J. Building energy-consumption status worldwide and the state-of-the-art technologies for zero-energy buildings during the past decade. Energy Build. 2016, 128, 198–213. [Google Scholar] [CrossRef]
- Valadkhani, A.; Smyth, R.; Nguyen, J. Effects of primary energy consumption on CO2 emissions under optimal thresholds: Evidence from sixty countries over the last half century. Energy Econ. 2019, 80, 680–690. [Google Scholar] [CrossRef]
- Bekun, F.V.; Alola, A.A.; Sarkodie, S.A. Toward a sustainable environment: Nexus between CO2 emissions, resource rent, renewable and nonrenewable energy in 16-EU countries. Sci. Total Environ. 2019, 657, 1023–1029. [Google Scholar] [CrossRef]
- Guo, M.; Nowakowska-Grunt, J.; Gorbanyov, V.; Egorova, M. Green Technology and Sustainable Development: Assessment and Green Growth Frameworks. Sustainability 2020, 12, 6571. [Google Scholar] [CrossRef]
- Adamisin, P.; Pukala, R.; Chovancova, J.; Novakova, M.; Bak, T. Fullfilment of environmental goal of the strategy Europe 2020. Is it realistic? In Proceedings of the 3rd International Multidisciplinary Scientific Conference on Social Sciences and Arts, SGEM 2016, Vienna, Austria, 22–31 August 2016; pp. 181–188. [Google Scholar]
- Firoiu, D.; Ionescu, G.H.; Băndoi, A.; Florea, N.M.; Jianu, E. Achieving sustainable development goals (SDG): Implementation of the 2030 Agenda in Romania. Sustainability 2019, 11, 2156. [Google Scholar] [CrossRef] [Green Version]
- Paolotti, L.; Gomis, F.D.C.; Torres, A.A.; Massei, G.; Boggia, A. Territorial sustainability evaluation for policy management: The case study of Italy and Spain. Environ. Sci. Policy 2019, 92, 207–219. [Google Scholar] [CrossRef]
- Jabareen, Y. A new conceptual framework for sustainable development. Environ. Dev. Sustain. 2008, 10, 179–192. [Google Scholar] [CrossRef]
- Daly, H.E. Sustainable development—definitions, principles, policies. In The Future of Sustainability; Springer: Dordrecht, The Netherlands, 2006; pp. 39–53. [Google Scholar]
- Ebner, D.; Baumgartner, R.J. The relationship between sustainable development and corporate social responsibility. In Corporate Responsibility Research Conference; Queens University: Belfast, Northern Ireland, 2006; Volume 4. [Google Scholar]
- Adamišin, P.; Huttmanová, E.; Chovancová, J. Evaluation of sustainable development in EU countries using selected indicators. Reg. Dev. Cent. East. Eur. Ctries. 2015, 2, 188. [Google Scholar]
- Borza, S.; Inta, M.; Serbu, R.; Marza, B. Multi-criteria analysis of pollution caused by auto traffic in a geographical area limited to applicability for an eco-economy environment. Sustainability 2018, 10, 4240. [Google Scholar] [CrossRef] [Green Version]
- Huang, I.B.; Keisler, J.; Linkov, I. Multi-criteria decision analysis in environmental sciences: Ten years of applications and trends. Sci. Total Environ. 2011, 409, 3578–3594. [Google Scholar] [CrossRef]
- Share of Renewable Energy. Available online: https://ec.europa.eu/eurostat/databrowser/view/t2020_31/default/table?lang=en (accessed on 27 December 2020).
- Greenhouse Gas Emissions. Available online: https://ec.europa.eu/eurostat/databrowser/view/t2020_30/default/table?lang=en (accessed on 27 December 2020).
- Primary Energy Consumption in Million Tonnes of Oil Equivalent. Available online: https://ec.europa.eu/eurotat/databrowser/view/t2020_33/default/table?lang=en (accessed on 27 December 2020).
- Hindls, R.; Hronová, S.; Seger, J.; Fisher, J. Statistika Pro Ekonomy (Statistics for Eoconomists); Professional Publishing: Praha, Czech Republic, 2017; ISBN 978-80-86946-43-6. [Google Scholar]
- Kukuła, K. Metoda Unitaryzacji Zerowanej; PWN: Warsaw, Poland, 2000. [Google Scholar]
- Rimarčík, M. Štatistika Pre Prax (Statistic for Practice). Košice, Slovakia. 2007. Available online: https://books.google.sk/books?hl=sk&lr=&id=n9a86Nb9EZ8C&oi=fnd&pg=PA45&dq=rimarcik&ots=11arS0uhjO&sig=xnvVa-r0FmGtIxmXwaxb9PWDRn0&redir_esc=y#v=onepage&q=rimarcik&f=false (accessed on 4 January 2021).
- Stec, M.; Grzebyk, M. The implementation of the Strategy Europe 2020 objectives in European Union countries: The concept analysis and statistical evaluation. Qual. Quant. 2018, 52, 119–133. [Google Scholar] [CrossRef] [Green Version]
- Lu, C.; Yang, J.; Li, H.; Jin, S.; Pang, M.; Lu, C. Research on the Spatial–Temporal Synthetic Measurement of the Coordinated Development of Population-Economy-Society-Resource-Environment (PESRE) Systems in China Based on Geographic Information Systems (GIS). Sustainability 2019, 11, 2877. [Google Scholar] [CrossRef] [Green Version]
- Vavrek, R. Evaluation of the Impact of Selected Weighting Methods on the Results of the TOPSIS Technique. Int. J. Inf. Technol. Decis. Mak. 2019, 18, 1821–1843. [Google Scholar] [CrossRef]
- Boccuzzo, G.; Caperna, G. Evaluation of life satisfaction in Italy: Proposal of a synthetic measure based on poset theory. In Complexity in Society: From Indicators Construction to Their Synthesis; Springer: Cham, Switzerland, 2017; pp. 291–321. [Google Scholar]
- Vaňková, I.; Vavrek, R. Evaluation of local accessibility of homes for seniors using multi-criteria approach–Evidence from the Czech Republic. Health Soc. Care Community 2020. [Google Scholar] [CrossRef] [PubMed]
- Siedlecki, R.; Papla, D. Conditional correlation coefficient as a tool for analysis of contagion in financial markets and real economy indexes based on the synthetic ratio. Procedia-Soc. Behav. Sci. 2016, 220, 452–461. [Google Scholar] [CrossRef] [Green Version]
- Vavrek, R.; Bečica, J. Capital City as a Factor of Multi-Criteria Decision Analysis—Application on Transport Companies in the Czech Republic. Mathematics 2020, 8, 1765. [Google Scholar] [CrossRef]
- Godin, B. The Knowledge Economy: Fritz Machlup’s Construction of a Synthetic Concept. In The Capitalization of Knowledge: A Triple Helix of University-Industry-Government; 2010; p. 261. Available online: http://www.chairefernanddumont.ucs.inrs.ca/wp-content/uploads/2013/01/Godin_37.pdf (accessed on 10 January 2021).
- Kononova, O.; Prokudin, D. Synthetic Method in Interdisciplinary Terminological Landscape Research of Digital Economy. In Proceedings of the SHS Web of Conferences, Samara, Russia, 26–27 November 2018; Volume 50, p. 01082. [Google Scholar]
- Molina, M.D.M.H.; Fernández, J.A.S.; Martín, J.A.R. A synthetic indicator to measure the economic and social cohesion of the regions of Spain and Portugal. Revista Economía Mundial 2015, 39, 223–239. [Google Scholar]
- Tvaronaviciene, M.; Razminiene, K.; Piccinetti, L. Aproaches towards cluster analysis. Econ. Sociol. 2015, 8, 19. [Google Scholar] [CrossRef] [PubMed] [Green Version]
- Xu, D.; Tian, Y. A comprehensive survey of clustering algorithms. Ann. Data Sci. 2015, 2, 165–193. [Google Scholar] [CrossRef] [Green Version]
- Lukač, J.; Freňaková, M.; Manová, E.; Simonidesová, J.; Daneshjo, N. Use of Statistical Methods as an Educational Tool in the Financial Management of Enterprises in the Implementation of International Financial Reporting Standards. TEM J. 2019, 8, 819. [Google Scholar]
- Madhulatha, T.S. An overview on clustering methods. J. Eng. 2012, 2, 719–725. [Google Scholar] [CrossRef]
- Menegaki, A.N. Growth and renewable energy in Europe: Benchmarking with data envelopment analysis. Renew. Energy 2013, 60, 363–369. [Google Scholar] [CrossRef]
- Bilan, Y.; Streimikiene, D.; Vasylieva, T.; Lyulyov, O.; Pimonenko, T.; Pavlyk, A. Linking between renewable energy, CO2 emissions, and economic growth: Challenges for candidates and potential candidates for the EU membership. Sustainability 2019, 11, 1528. [Google Scholar] [CrossRef] [Green Version]
- Olivier, J.G.; Peters, J.A.H.W. Trends in global CO2 and total greenhouse gas emissions: 2020 Report. PBL Neth. Environ. Assess. Agency 2017, 5, 2020. [Google Scholar]
- Širá, E.; Vavrek, R.; Kravčáková Vozárová, I.; Kotulič, R. Knowledge economy indicators and their impact on the sustainable competitiveness of the EU countries. Sustainability 2020, 12, 4172. [Google Scholar] [CrossRef]
Figure 1.
Factors influencing carbon dioxide emissions [29].
Figure 1.
Factors influencing carbon dioxide emissions [29].


Table 1.
Share of renewable energy in gross final energy consumption.
| 2005 | 2006 | 2007 | 2008 | 2009 | 2010 | 2011 | 2012 | 2013 | 2014 | 2015 | 2016 | 2017 | 2018 | |
|---|---|---|---|---|---|---|---|---|---|---|---|---|---|---|
| BG | 9.173 | 9.415 | 9.098 | 10.345 | 12.005 | 13.927 | 14.152 | 15.837 | 18.898 | 18.5 | 18.261 | 18.76 | 18.701 | 20.592 |
| CZ | 7.115 | 7.363 | 7.895 | 8.674 | 9.978 | 10.514 | 10.945 | 12.813 | 13.926 | 15.073 | 15.067 | 14.924 | 14.796 | 15.138 |
| DK | 15.956 | 16.334 | 17.748 | 18.544 | 19.949 | 21.889 | 23.39 | 25.466 | 27.174 | 29.323 | 30.866 | 32.052 | 34.677 | 35.413 |
| EE | 17.429 | 15.972 | 17.056 | 18.672 | 22.941 | 24.599 | 25.347 | 25.521 | 25.321 | 26.141 | 28.528 | 28.715 | 29.168 | 29.993 |
| EL | 7.277 | 7.458 | 8.249 | 8.183 | 8.731 | 10.077 | 11.153 | 13.741 | 15.326 | 15.683 | 15.69 | 15.39 | 17.3 | 18.051 |
| HR | 23.691 | 22.668 | 22.161 | 21.986 | 23.596 | 25.103 | 25.389 | 26.757 | 28.4 | 27.817 | 28.969 | 28.267 | 27.28 | 28.047 |
| IT | 7.549 | 8.328 | 9.807 | 11.492 | 12.775 | 13.023 | 12.881 | 15.441 | 16.741 | 17.082 | 17.525 | 17.415 | 18.267 | 17.775 |
| CY | 3.131 | 3.263 | 4.004 | 5.134 | 5.925 | 6.173 | 6.261 | 7.137 | 8.456 | 9.172 | 9.929 | 9.859 | 10.503 | 13.898 |
| LV | 32.264 | 31.141 | 29.615 | 29.811 | 34.317 | 30.375 | 33.478 | 35.709 | 37.037 | 38.629 | 37.538 | 37.138 | 39.019 | 40.029 |
| LT | 16.77 | 16.889 | 16.482 | 17.825 | 19.798 | 19.64 | 19.944 | 21.438 | 22.69 | 23.594 | 25.75 | 25.613 | 26.039 | 24.695 |
| HU | 6.931 | 7.433 | 8.575 | 8.564 | 11.673 | 12.742 | 13.972 | 15.53 | 16.205 | 14.618 | 14.495 | 14.377 | 13.543 | 12.535 |
| RO | 17.571 | 17.096 | 18.195 | 20.204 | 22.157 | 22.834 | 21.186 | 22.825 | 23.886 | 24.845 | 24.785 | 25.032 | 24.454 | 23.875 |
| FI | 28.814 | 30.043 | 29.561 | 31.235 | 31.198 | 32.294 | 32.664 | 34.341 | 36.728 | 38.78 | 39.321 | 39.013 | 40.917 | 41.16 |
| SE | 40.265 | 42.04 | 43.551 | 44.288 | 47.476 | 46.595 | 48.135 | 50.027 | 50.792 | 51.817 | 52.947 | 53.328 | 54.157 | 54.651 |
| BE | 2.332 | 2.633 | 3.101 | 3.59 | 4.715 | 6.002 | 6.275 | 7.088 | 7.65 | 8.043 | 8.026 | 8.752 | 9.113 | 9.478 |
| DE | 7.167 | 8.466 | 10.039 | 10.072 | 10.851 | 11.667 | 12.453 | 13.543 | 13.76 | 14.385 | 14.906 | 14.889 | 15.476 | 16.673 |
| IE | 2.822 | 3.073 | 3.519 | 3.992 | 5.246 | 5.781 | 6.57 | 7.006 | 7.582 | 8.568 | 9.044 | 9.165 | 10.465 | 10.888 |
| ES | 8.442 | 9.155 | 9.669 | 10.749 | 12.978 | 13.831 | 13.247 | 14.314 | 15.347 | 16.156 | 16.259 | 17.423 | 17.563 | 17.454 |
| FR | 9.599 | 9.337 | 10.242 | 11.189 | 12.216 | 12.672 | 10.858 | 13.274 | 13.908 | 14.422 | 14.861 | 15.501 | 15.904 | 16.444 |
| LU | 1.402 | 1.469 | 2.725 | 2.809 | 2.929 | 2.85 | 2.856 | 3.114 | 3.499 | 4.469 | 4.987 | 5.361 | 6.198 | 8.973 |
| MT | 0.123 | 0.149 | 0.177 | 0.195 | 0.221 | 0.979 | 1.85 | 2.862 | 3.76 | 4.744 | 5.119 | 6.208 | 7.219 | 7.968 |
| NL | 2.478 | 2.778 | 3.298 | 3.596 | 4.266 | 3.917 | 4.524 | 4.659 | 4.691 | 5.415 | 5.668 | 5.802 | 6.456 | 7.34 |
| AT | 24.355 | 26.277 | 28.145 | 28.79 | 31.041 | 31.207 | 31.553 | 32.736 | 32.666 | 33.553 | 33.502 | 33.374 | 33.141 | 33.806 |
| PL | 6.9 | 6.888 | 6.93 | 7.711 | 8.699 | 9.3 | 10.354 | 10.97 | 11.463 | 11.614 | 11.888 | 11.4 | 11.117 | 11.477 |
| PT | 19.526 | 20.794 | 21.914 | 22.934 | 24.411 | 24.155 | 24.607 | 24.578 | 25.703 | 29.511 | 30.518 | 30.868 | 30.614 | 30.206 |
| SI | 19.773 | 18.369 | 19.615 | 18.569 | 20.661 | 20.95 | 20.773 | 21.304 | 22.855 | 22.125 | 22.428 | 21.454 | 21.105 | 20.912 |
| SK | 6.36 | 6.584 | 7.766 | 7.723 | 9.368 | 9.099 | 10.348 | 10.453 | 10.133 | 11.713 | 12.882 | 12.029 | 11.465 | 11.896 |
| UK | 1.281 | 1.488 | 1.734 | 2.814 | 3.448 | 3.862 | 4.392 | 4.461 | 5.524 | 6.737 | 8.385 | 9.032 | 9.858 | 11.138 |
Where BG—Bulgaria, CZ—Czech Republic, DK—Denmark, EE—Estonia, EL—Greece, HR—Croatia, IT—Italy, CY—Cyprus, LV—Latvia, LT—Lithuania, HU—Hungary, RO—Romania, FI—Finland, SE—Sweden, BE—Belgium, DE—Germany, IE—Ireland, ES—Spain, FR—France, LU—Luxembourg, MT—Malta, NL—Netherlands, AT—Austria, PL—Poland, PT—Portugal, SI—Slovenia, SK—Slovakia, UK—United Kingdom.
Table 2.
Greenhouse gas emissions, base year 1990.
| 2005 | 2006 | 2007 | 2008 | 2009 | 2010 | 2011 | 2012 | 2013 | 2014 | 2015 | 2016 | 2017 | 2018 | |
|---|---|---|---|---|---|---|---|---|---|---|---|---|---|---|
| BE | 100.19 | 98.38 | 96.17 | 96.33 | 87.61 | 92.63 | 85.76 | 83.61 | 83.48 | 79.77 | 82.81 | 81.96 | 82.14 | 82.67 |
| BG | 63.1 | 63.63 | 67.42 | 66.12 | 57.18 | 59.74 | 64.88 | 59.93 | 54.78 | 57.74 | 60.93 | 58.52 | 60.88 | 57.16 |
| CZ | 75.13 | 75.76 | 76.68 | 74.28 | 69.75 | 71.07 | 70.28 | 68.14 | 65.46 | 64.41 | 65.13 | 66.06 | 65.56 | 64.82 |
| DK | 95.48 | 106.07 | 99.77 | 94.84 | 90.58 | 90.89 | 83.78 | 77.52 | 79.88 | 74.35 | 70.66 | 73.74 | 70.67 | 70.69 |
| DE | 80.56 | 81.24 | 79.2 | 79.44 | 74.05 | 76.64 | 74.73 | 75.25 | 76.68 | 73.49 | 73.8 | 74.17 | 73.22 | 70.44 |
| EE | 47.42 | 45.67 | 54.98 | 49.72 | 41.18 | 52.3 | 52.48 | 49.89 | 54.46 | 52.5 | 45.22 | 48.98 | 52.26 | 49.98 |
| HR | 93.22 | 94.41 | 98.85 | 96.19 | 88.77 | 87.51 | 86.55 | 80.99 | 76.7 | 74.34 | 75.62 | 76.15 | 78.71 | 75.23 |
| LV | 43.7 | 45.6 | 47.48 | 45.89 | 43.38 | 47.6 | 44.62 | 43.97 | 43.76 | 43.26 | 43.41 | 43.55 | 43.94 | 45.95 |
| LT | 47.38 | 48.03 | 52.63 | 50.82 | 41.68 | 43.44 | 44.67 | 44.59 | 42.09 | 42.02 | 42.64 | 42.77 | 43.24 | 42.64 |
| HU | 80.69 | 79.38 | 77.63 | 75.56 | 69.04 | 69.43 | 67.72 | 63.62 | 60.64 | 61.33 | 64.95 | 65.48 | 68.25 | 67.82 |
| RO | 61 | 61.33 | 62.32 | 60.42 | 51.64 | 50.11 | 52.03 | 50.66 | 46.83 | 46.96 | 47.08 | 46.29 | 47.39 | 46.84 |
| SK | 69.87 | 69.76 | 67.4 | 68.13 | 62.24 | 63.25 | 62.3 | 58.85 | 58.39 | 55.6 | 57.04 | 57.72 | 59.31 | 59.16 |
| FI | 98.59 | 114.53 | 112.53 | 101.51 | 96.18 | 107.11 | 96.8 | 89.12 | 89.8 | 84.01 | 79.06 | 83.16 | 79.59 | 81.41 |
| SE | 94.55 | 94.13 | 92.85 | 89.94 | 83.56 | 91.82 | 86.07 | 82.01 | 79.79 | 77.4 | 77.11 | 76.99 | 76.52 | 75.28 |
| UK | 89.73 | 88.89 | 87.38 | 84.8 | 77.67 | 79.33 | 73.68 | 75.63 | 73.97 | 69.03 | 66.9 | 63.76 | 62.7 | 61.59 |
| IE | 127.69 | 126.82 | 125.74 | 124.38 | 113.15 | 112.47 | 104.76 | 105.23 | 105.41 | 105.34 | 109.56 | 113.34 | 113.29 | 113.6 |
| EL | 131.44 | 127.92 | 130.56 | 127.41 | 120.39 | 114.48 | 111.82 | 108.44 | 99.42 | 96.53 | 92.98 | 89.74 | 93.62 | 90.84 |
| ES | 154.68 | 152.43 | 156.4 | 144.77 | 130.96 | 126.21 | 126.38 | 123.77 | 114.87 | 115.77 | 119.83 | 116.51 | 121.49 | 119.74 |
| FR | 102.48 | 100.44 | 98.67 | 97.32 | 93.64 | 94.78 | 89.76 | 89.78 | 89.96 | 84.41 | 85.28 | 85.44 | 86.35 | 83.1 |
| IT | 114.36 | 112.59 | 111.37 | 108.88 | 98.19 | 100.44 | 98.12 | 94.43 | 87.63 | 83.71 | 86.3 | 85.8 | 85.05 | 84.41 |
| CY | 159.6 | 162.99 | 168.15 | 171 | 166.42 | 161.52 | 156.65 | 147.73 | 135.68 | 141.56 | 142.01 | 151 | 155.75 | 153.81 |
| LU | 108.82 | 106.9 | 103.13 | 102.29 | 97.71 | 102.38 | 100.82 | 98.04 | 93.98 | 91.21 | 88.67 | 87.98 | 90.88 | 94.16 |
| MT | 117.04 | 119.32 | 123.35 | 121.73 | 114.59 | 118.84 | 119.43 | 126.67 | 115.91 | 118 | 94.18 | 83.84 | 93.45 | 96.14 |
| NL | 99.72 | 97.55 | 96.93 | 96.71 | 93.84 | 99 | 92.95 | 91.04 | 90.96 | 87.73 | 91.63 | 91.57 | 90.78 | 88.58 |
| AT | 118.92 | 116 | 112.78 | 112.05 | 103.39 | 109.19 | 106.41 | 102.82 | 103.25 | 98.68 | 101.6 | 103.05 | 106.17 | 102.66 |
| PL | 85.21 | 88.49 | 88.45 | 87.17 | 83.13 | 87.1 | 86.9 | 85.35 | 84.64 | 82.02 | 82.73 | 84.56 | 87.7 | 87.42 |
| PT | 146.22 | 138.51 | 134.95 | 131.1 | 125.57 | 118.96 | 116.78 | 113.69 | 110.69 | 110.82 | 118.01 | 115.32 | 123.78 | 118.9 |
| SI | 109.96 | 110.92 | 111.92 | 115.86 | 105.09 | 105.2 | 105.23 | 102.21 | 98.51 | 89.22 | 90.18 | 94.69 | 93.47 | 94.35 |
Table 3.
Primary energy consumption in million tonnes of oil equivalent.
| 2005 | 2006 | 2007 | 2008 | 2009 | 2010 | 2011 | 2012 | 2013 | 2014 | 2015 | 2016 | 2017 | 2018 | |
|---|---|---|---|---|---|---|---|---|---|---|---|---|---|---|
| CZ | 42.51 | 43.49 | 43.65 | 42.5 | 40.14 | 42.66 | 41.03 | 40.59 | 40.94 | 39.16 | 39.74 | 40.04 | 40.35 | 40.39 |
| DK | 19.45 | 20.84 | 20.37 | 19.91 | 18.91 | 20.2 | 18.52 | 17.82 | 17.84 | 16.93 | 16.92 | 17.57 | 17.85 | 17.96 |
| EE | 5.5 | 4.93 | 5.54 | 5.37 | 4.74 | 5.58 | 5.6 | 5.42 | 5.98 | 5.7 | 5.33 | 5.9 | 5.65 | 6.17 |
| IE | 14.95 | 15.12 | 15.98 | 15.65 | 14.9 | 14.7 | 13.53 | 13.7 | 13.8 | 13.24 | 13.92 | 14.61 | 14.39 | 14.54 |
| EL | 30.17 | 30.14 | 30.18 | 30.35 | 29.32 | 27.11 | 26.55 | 26.39 | 23.28 | 23.14 | 23.23 | 22.9 | 23.12 | 22.42 |
| ES | 136.56 | 136.74 | 139.35 | 134.44 | 123.38 | 123.34 | 122.98 | 123.41 | 116.06 | 114.2 | 118.6 | 119.29 | 125.79 | 124.63 |
| HR | 9.14 | 9.11 | 9.44 | 9.2 | 8.95 | 8.86 | 8.65 | 8.18 | 8 | 7.6 | 7.96 | 8.5 | 8.33 | 8.18 |
| IT | 180.83 | 178.95 | 178.67 | 176.12 | 164.08 | 167.28 | 162 | 156.56 | 152.05 | 142.66 | 149.12 | 147.97 | 148.95 | 147.24 |
| CY | 2.48 | 2.57 | 2.7 | 2.85 | 2.77 | 2.68 | 2.65 | 2.5 | 2.18 | 2.22 | 2.28 | 2.43 | 2.53 | 2.55 |
| LV | 4.49 | 4.66 | 4.77 | 4.58 | 4.43 | 4.56 | 4.28 | 4.44 | 4.36 | 4.36 | 4.27 | 4.29 | 4.47 | 4.69 |
| LT | 8.5 | 7.89 | 8.1 | 8.26 | 7.82 | 6.17 | 5.91 | 5.98 | 5.8 | 5.75 | 5.79 | 6.4 | 6.16 | 6.33 |
| LU | 4.77 | 4.69 | 4.61 | 4.61 | 4.34 | 4.61 | 4.53 | 4.42 | 4.3 | 4.19 | 4.14 | 4.15 | 4.29 | 4.46 |
| HU | 26.35 | 25.99 | 25.39 | 25.16 | 23.95 | 24.62 | 24.39 | 23.13 | 22.41 | 21.99 | 23.3 | 23.74 | 24.5 | 24.49 |
| MT | 0.92 | 0.92 | 0.95 | 0.96 | 0.88 | 0.93 | 0.93 | 0.97 | 0.87 | 0.88 | 0.75 | 0.71 | 0.81 | 0.82 |
| AT | 32.71 | 32.62 | 32.18 | 32.47 | 30.64 | 32.86 | 31.97 | 31.64 | 32.11 | 30.8 | 31.62 | 31.9 | 32.81 | 31.8 |
| PL | 87.96 | 92.35 | 91.9 | 93.09 | 89.53 | 96.56 | 96.55 | 93.1 | 93.53 | 89.49 | 90.06 | 94.83 | 99.16 | 101.06 |
| PT | 24.85 | 24.4 | 23.85 | 23.59 | 23.62 | 22.64 | 22 | 21.4 | 21.3 | 20.68 | 21.64 | 21.76 | 22.82 | 22.64 |
| RO | 36.01 | 37.53 | 37.44 | 37.32 | 32.66 | 32.97 | 33.55 | 33.26 | 30.41 | 30.5 | 30.73 | 30.62 | 32.37 | 32.48 |
| SI | 7.1 | 7.2 | 7.3 | 7.49 | 6.8 | 7 | 7.8 | 6.81 | 6.63 | 6.37 | 6.32 | 6.54 | 6.73 | 6.67 |
| SK | 17.41 | 17.24 | 16.43 | 16.98 | 15.52 | 16.66 | 15.97 | 15.59 | 15.69 | 14.83 | 15.22 | 15.37 | 16.15 | 15.79 |
| FI | 33.56 | 36.67 | 36.03 | 34.57 | 32.39 | 35.5 | 34.25 | 33.02 | 32.04 | 32.7 | 31.15 | 32.43 | 32.09 | 32.99 |
| SE | 49.26 | 47.96 | 47.65 | 47.49 | 43.33 | 48.59 | 47.62 | 47.59 | 46.44 | 46.03 | 44.32 | 45.41 | 46.45 | 46.78 |
| UK | 223.48 | 220.41 | 214.5 | 211.8 | 195.99 | 205.09 | 190.09 | 195.15 | 191.63 | 180.72 | 183.11 | 179.01 | 176.87 | 176.27 |
| BE | 51.56 | 51.41 | 50.32 | 51.13 | 50.47 | 54.14 | 50.52 | 47.78 | 49.34 | 45.7 | 46.06 | 49.18 | 49.09 | 46.84 |
| BG | 19.22 | 19.85 | 19.51 | 19.02 | 16.91 | 17.4 | 18.57 | 17.84 | 16.51 | 17.27 | 17.96 | 17.68 | 18.34 | 18.36 |
| DE | 321.62 | 332.75 | 315.79 | 320.76 | 299.92 | 315.15 | 297.8 | 301.12 | 308.29 | 293.6 | 295.93 | 297.63 | 298.12 | 291.75 |
| FR | 260.92 | 256.17 | 252.66 | 255.39 | 246.32 | 254.45 | 249.19 | 249.15 | 250.37 | 239.77 | 244.4 | 240.11 | 239.15 | 238.91 |
| NL | 70.11 | 69.52 | 69.37 | 69.88 | 67.63 | 71.72 | 67.05 | 66.75 | 66.21 | 62.32 | 63.74 | 64.77 | 65.08 | 64.71 |
Table 4.
Synthetic measure.
| 2005 | 2006 | 2007 | 2008 | 2009 | 2010 | 2011 | 2012 | 2013 | 2014 | 2015 | 2016 | 2017 | 2018 | |
|---|---|---|---|---|---|---|---|---|---|---|---|---|---|---|
| BE | 0.4776 | 0.4842 | 0.4939 | 0.4956 | 0.5256 | 0.5169 | 0.5398 | 0.5530 | 0.5552 | 0.5708 | 0.5626 | 0.5660 | 0.5679 | 0.5710 |
| BG | 0.6471 | 0.6466 | 0.6353 | 0.6467 | 0.6820 | 0.6866 | 0.6736 | 0.6974 | 0.7307 | 0.7171 | 0.7095 | 0.7190 | 0.7120 | 0.7330 |
| CZ | 0.5803 | 0.5792 | 0.5799 | 0.5920 | 0.6140 | 0.6113 | 0.6176 | 0.6350 | 0.6483 | 0.6598 | 0.6573 | 0.6538 | 0.6540 | 0.6579 |
| DK | 0.6052 | 0.5789 | 0.6042 | 0.6222 | 0.6428 | 0.6527 | 0.6816 | 0.7111 | 0.7155 | 0.7437 | 0.7626 | 0.7613 | 0.7850 | 0.7893 |
| DE | 0.2865 | 0.2815 | 0.3134 | 0.3080 | 0.3475 | 0.3305 | 0.3576 | 0.3596 | 0.3501 | 0.3769 | 0.3769 | 0.3741 | 0.3797 | 0.4005 |
| EE | 0.7521 | 0.7478 | 0.7299 | 0.7535 | 0.8021 | 0.7828 | 0.7869 | 0.7948 | 0.7813 | 0.7916 | 0.8253 | 0.8162 | 0.8108 | 0.8212 |
| IE | 0.4467 | 0.4503 | 0.4550 | 0.4617 | 0.4989 | 0.5042 | 0.5300 | 0.5312 | 0.5349 | 0.5410 | 0.5324 | 0.5227 | 0.5310 | 0.5326 |
| EL | 0.4491 | 0.4592 | 0.4573 | 0.4648 | 0.4872 | 0.5128 | 0.5268 | 0.5514 | 0.5874 | 0.5971 | 0.6062 | 0.6130 | 0.6145 | 0.6270 |
| ES | 0.2897 | 0.2997 | 0.2900 | 0.3314 | 0.3916 | 0.4090 | 0.4054 | 0.4182 | 0.4547 | 0.4592 | 0.4450 | 0.4600 | 0.4415 | 0.4465 |
| FR | 0.3060 | 0.3144 | 0.3280 | 0.3345 | 0.3593 | 0.3510 | 0.3581 | 0.3729 | 0.3751 | 0.4031 | 0.3989 | 0.4067 | 0.4078 | 0.4197 |
| HR | 0.6687 | 0.6594 | 0.6445 | 0.6505 | 0.6797 | 0.6922 | 0.6967 | 0.7198 | 0.7388 | 0.7439 | 0.7473 | 0.7416 | 0.7287 | 0.7424 |
| IT | 0.3433 | 0.3545 | 0.3670 | 0.3862 | 0.4336 | 0.4261 | 0.4365 | 0.4671 | 0.4971 | 0.5186 | 0.5082 | 0.5100 | 0.5161 | 0.5165 |
| CY | 0.3792 | 0.3712 | 0.3624 | 0.3618 | 0.3785 | 0.3927 | 0.4058 | 0.4342 | 0.4735 | 0.4627 | 0.4661 | 0.4425 | 0.4341 | 0.4598 |
| LV | 0.8529 | 0.8410 | 0.8267 | 0.8322 | 0.8663 | 0.8312 | 0.8582 | 0.8733 | 0.8820 | 0.8931 | 0.8861 | 0.8833 | 0.8936 | 0.8944 |
| LT | 0.7451 | 0.7444 | 0.7299 | 0.7425 | 0.7785 | 0.7747 | 0.7737 | 0.7829 | 0.7972 | 0.8029 | 0.8145 | 0.8131 | 0.8143 | 0.8075 |
| LU | 0.4967 | 0.5022 | 0.5196 | 0.5223 | 0.5350 | 0.5223 | 0.5264 | 0.5352 | 0.5481 | 0.5613 | 0.5710 | 0.5751 | 0.5726 | 0.5810 |
| HU | 0.5811 | 0.5879 | 0.6000 | 0.6054 | 0.6424 | 0.6473 | 0.6594 | 0.6807 | 0.6932 | 0.6822 | 0.6708 | 0.6683 | 0.6553 | 0.6503 |
| MT | 0.4717 | 0.4660 | 0.4558 | 0.4600 | 0.4786 | 0.4723 | 0.4761 | 0.4636 | 0.4969 | 0.4975 | 0.5611 | 0.5943 | 0.5757 | 0.5734 |
| NL | 0.4611 | 0.4691 | 0.4740 | 0.4759 | 0.4896 | 0.4701 | 0.4940 | 0.5001 | 0.5010 | 0.5176 | 0.5077 | 0.5077 | 0.5134 | 0.5248 |
| AT | 0.5831 | 0.6024 | 0.6225 | 0.6281 | 0.6659 | 0.6498 | 0.6599 | 0.6767 | 0.6747 | 0.6932 | 0.6845 | 0.6798 | 0.6694 | 0.6835 |
| PL | 0.5075 | 0.4945 | 0.4954 | 0.5022 | 0.5222 | 0.5086 | 0.5156 | 0.5268 | 0.5312 | 0.5429 | 0.5422 | 0.5297 | 0.5156 | 0.5166 |
| PT | 0.4913 | 0.5197 | 0.5359 | 0.5523 | 0.5755 | 0.5918 | 0.6009 | 0.6096 | 0.6242 | 0.6475 | 0.6342 | 0.6431 | 0.6188 | 0.6290 |
| RO | 0.6870 | 0.6817 | 0.6860 | 0.7033 | 0.7424 | 0.7502 | 0.7346 | 0.7484 | 0.7676 | 0.7735 | 0.7721 | 0.7758 | 0.7677 | 0.7654 |
| SI | 0.6039 | 0.5928 | 0.5978 | 0.5809 | 0.6220 | 0.6233 | 0.6220 | 0.6333 | 0.6525 | 0.6721 | 0.6716 | 0.6538 | 0.6546 | 0.6512 |
| SK | 0.6144 | 0.6162 | 0.6303 | 0.6276 | 0.6542 | 0.6489 | 0.6596 | 0.6695 | 0.6686 | 0.6863 | 0.6894 | 0.6823 | 0.673 9 | 0.6773 |
| FI | 0.6617 | 0.6251 | 0.6280 | 0.6680 | 0.6836 | 0.6591 | 0.6891 | 0.7203 | 0.7341 | 0.7609 | 0.7785 | 0.7648 | 0.7859 | 0.7818 |
| SE | 0.7263 | 0.7395 | 0.7524 | 0.7645 | 0.8045 | 0.7727 | 0.7978 | 0.8198 | 0.8314 | 0.8442 | 0.8535 | 0.8551 | 0.8603 | 0.8662 |
| UK | 0.3254 | 0.3320 | 0.3433 | 0.3592 | 0.3973 | 0.3864 | 0.4192 | 0.4095 | 0.4238 | 0.4549 | 0.4680 | 0.4842 | 0.4941 | 0.5054 |
where BE—Belgium, BG—Bulgaria, CZ—Czechia, DK—Denmark, DE—Germany, EE—Estonia, IE—Ireland, EL—Greece, —Spain, FR—France, HR—Croatia, IT—Italy, CY—Cyprus, LV—Latvia, LT—Lithuania, LU—Luxembourg, HU—Hungary, MT—Malta, NL—Netherlands, AT—Austria, PL—Poland, PT—Portugal, RO—Romania, SI—Slovenia, SK—Slovakia, FI—Finland, SE—Sweden, UK—United Kingdom.
Table 5.
Distribution of countries into individual groups according to the performance of the synthetic measure.
Table 5.
Distribution of countries into individual groups according to the performance of the synthetic measure.
| Group | 2005 | 2010 | 2018 |
|---|---|---|---|
| I. High level | Estonia Lithuania Latvia | Estonia Lithuania Latvia Romania Sweden | Estonia Lithuania Latvia Romania Sweden Croatia Finland Denmark |
| II. Medium-high level | Bulgaria Denmark Croatia Romania Slovenia Slovakia Finland Sweden | Bulgaria Denmark Croatia Slovenia Slovakia Finland Czech Republic Hungary Austria | Bulgaria Slovenia Slovakia Czech Republic Hungary Austria Greece Portugal |
| III. Medium-low level | Belgium Ireland Greece Portugal Luxembourg Hungary Malta Netherlands Austria Poland Czech Republic | Belgium Ireland Greece Portugal Luxembourg Malta Netherlands Poland | Belgium Ireland Luxembourg Malta Netherlands Poland Cyprus Italy United Kingdom |
| IV. Low level | Germany Spain France Italy Cyprus United Kingdom | Germany Spain France Italy Cyprus United Kingdom | Germany Spain France |
Publisher’s Note: MDPI stays neutral with regard to jurisdictional claims in published maps and institutional affiliations. |
© 2021 by the authors. Licensee MDPI, Basel, Switzerland. This article is an open access article distributed under the terms and conditions of the Creative Commons Attribution (CC BY) license (http://creativecommons.org/licenses/by/4.0/).
Share and Cite
MDPI and ACS Style
Širá, E.; Kotulič, R.; Kravčáková Vozárová, I.; Daňová, M. Sustainable Development in EU Countries in the Framework of the Europe 2020 Strategy. Processes 2021, 9, 443. https://0-doi-org.brum.beds.ac.uk/10.3390/pr9030443
AMA Style
Širá E, Kotulič R, Kravčáková Vozárová I, Daňová M. Sustainable Development in EU Countries in the Framework of the Europe 2020 Strategy. Processes. 2021; 9(3):443. https://0-doi-org.brum.beds.ac.uk/10.3390/pr9030443
Chicago/Turabian StyleŠirá, Elena, Rastislav Kotulič, Ivana Kravčáková Vozárová, and Monika Daňová. 2021. "Sustainable Development in EU Countries in the Framework of the Europe 2020 Strategy" Processes 9, no. 3: 443. https://0-doi-org.brum.beds.ac.uk/10.3390/pr9030443
Note that from the first issue of 2016, this journal uses article numbers instead of page numbers. See further details here.