
Mechanical Response and Deformation Mechanisms of TB17 Titanium Alloy at High Strain Rates


1
State Key Laboratory of Powder Metallurgy, Central South University, Changsha 410083, China
2
Shenzhen Research Institute, Central South University, Shenzhen 518057, China
*
Authors to whom correspondence should be addressed.
Processes 2021, 9(3), 484; https://0-doi-org.brum.beds.ac.uk/10.3390/pr9030484
Submission received: 2 February 2021
/
Revised: 3 March 2021
/
Accepted: 5 March 2021
/
Published: 8 March 2021
(This article belongs to the Section Materials Processes)
Abstract
:The mechanical response and deformation mechanisms of TB17 titanium alloy were studied at room temperature by the split-Hopkinson pressure bar test. The ultimate compression strength increases from 1050 MPa to 1400 MPa, as the strain rate increases from 2000 s−1 to 2800 s−1. The adiabatic shear failure occurred at strain rate 2800 s−1. When the strain rate was 2000 s−1, only {10 9 3}<331>β type II high index deformation twins, a small number of α” martensite, and interfacial ω phase were detected. When the strain rate was 2400 s−1 and above, multiple deformation mechanisms, including the primary {10 9 3}<331>β type II high index deformation twins, secondary {332}<113>β deformation twins, and α” martensite were identified. The deformation mechanism changes from primary deformation twins and α” martensite to multiple deformation mechanisms (primary and secondary deformation structure) with the increase of strain rates.
Keywords:
near-β titanium alloy; SHPB; deformation mechanism; twins; martensite; interfacial ω phase1. Introduction
Metastable β titanium alloys with low stacking fault energy have attracted considerable attraction due to their combination of extraordinary strength and ductility through different deformation mechanisms, such as dislocation slip, deformation twinning, and α” martensite transformation [1,2,3,4,5]. The generation of different deformation mechanisms [5,6,7,8,9], has a great influence on the obtained microstructure and the mechanical performance of the metastable β titanium alloys [10,11,12,13]. Several studies [13,14,15,16] have reported significant improved ductility by deformation twins and stress-induced phases. The β stability has a great influence on the deformation mechanism of metastable β titanium alloys. Min et al. [8] studied Ti-15Mo-5Zr and Ti-10Mo-2Fe alloys. It was found that the {332}<113>β twin was the main deformation mode in low Mo equivalent content, while slip was the main deformation mode in high Mo equivalent content. The deformation parameters, such as temperature, strain level, and strain rate, also influence the deformation mechanism of metastable β-Ti alloys greatly [7,9,11]. Gao et al. [7] carried out tensile tests on a Ti-23Nb-0.7Ta-2Zr-0.5N alloy and systematically studied the samples with Electron Backscattered Diffraction(EBSD) and Transmission electron microscope(TEM) corresponding changes of 1.3%, 5%, and 16%. The results indicated that deformation mechanisms were dominated by {332}<113>β and {112}<111>β twinning. Ahmed et al. [11] studied the Ti-10V-3Fe-3Al-0.27O (wt.%) metastable β alloy and found that when the strain rate was lower than 10−3 s−1 the deformation mode was dominated by the a” martensite transformation. At a strain rate of 101 s−1 and above, the dominant deformation mechanism changes to deformation twins (DTs). When the strain rate is between 10−3≤ ε ≤101, the deformation mechanism is a mix of α” martensite and DTs.
There are relatively few studies on the deformation mechanism of metastable β alloys at high strain rates. In this study, TB17 titanium alloys was deformed by using the split-Hopkinson pressure bar (SHPB) method. The influence of different high strain rates on the mechanical response and deformation mechanism was investigated and new methods for designing titanium alloys in extreme environments were explored.
2. Materials and Methods
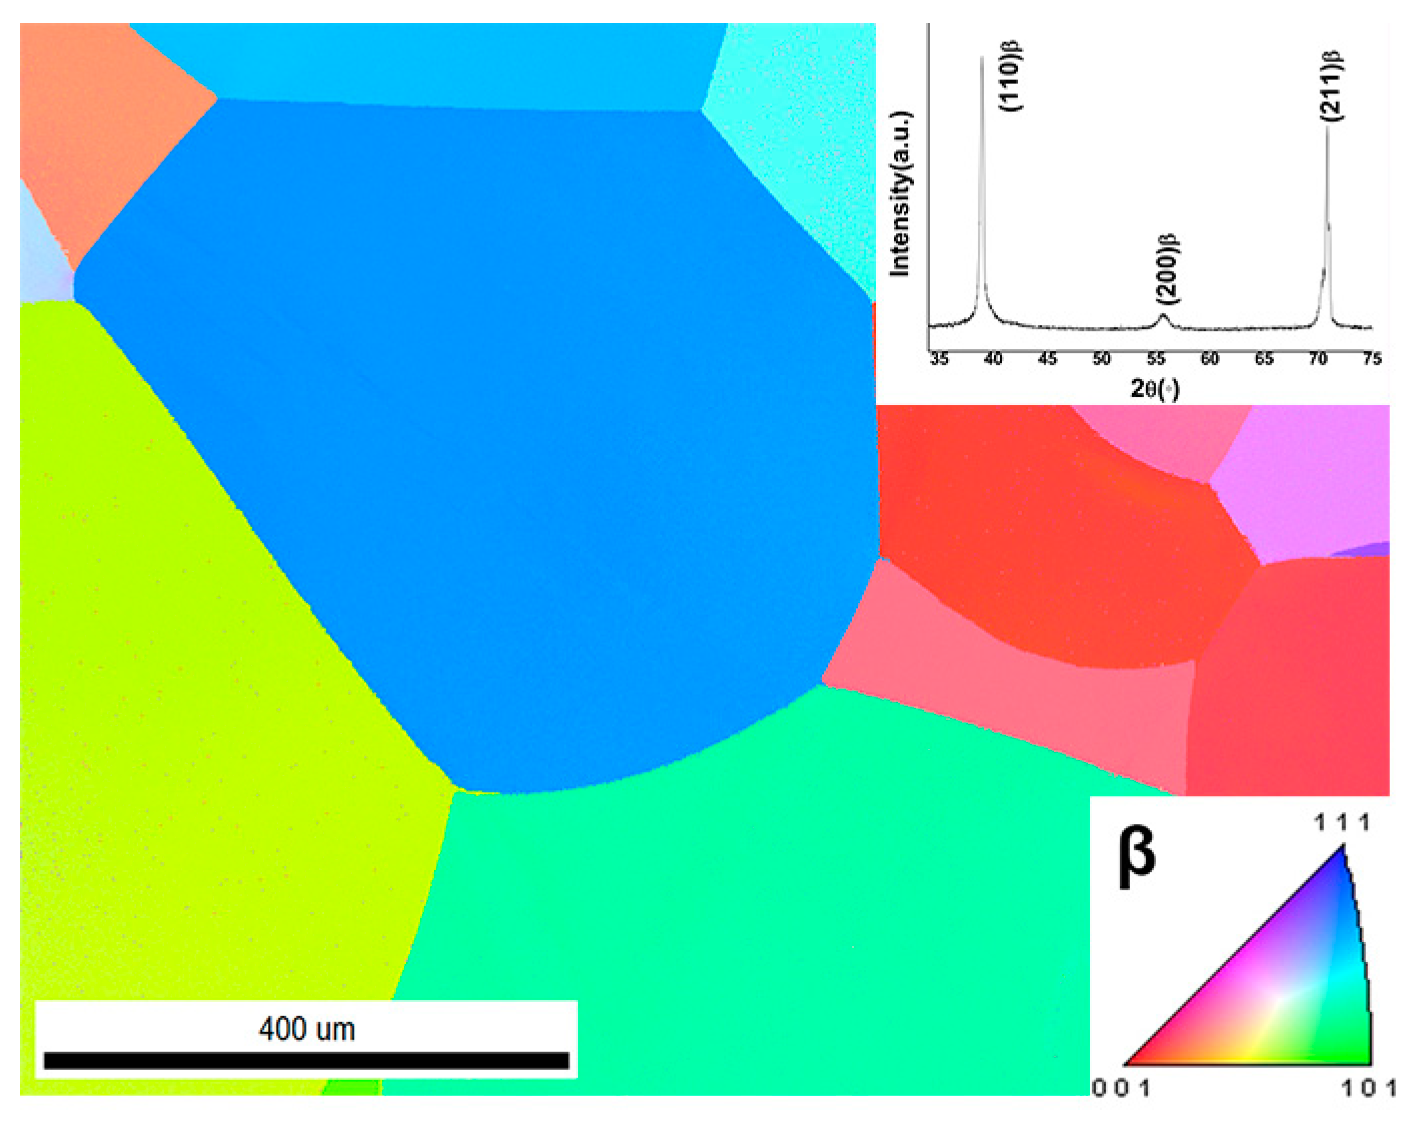
TB17 near-β titanium alloy with a target composition of Ti-4.5Al-6.5Mo-2Cr-2.5Nb-2Zr-1Sn (wt.%) and βtrans of 845 °C was selected in this study. The β solution heat-treatment was set at 920 °C for 60 min, followed by water quenching. Figure 1 shows the microstructure of TB17 after solution heating. The average grain size is 300~500 μm. Only β phase peaks are detected in the XRD pattern. The lattice parameter of the β phase was measured as aβ = 0.3268 nm. Then, Φ6 mm × 6 mm samples were cut from the solution treatment(ST) sample for split-Hopkinson pressure bar (SHPB) tests. The SHPB tests were conducted at ambient temperature with strain rates of 2000 s−1, 2400 s−1, and 2800 s−1, and the corresponding samples were marked as S-2000, S-2400, and S-2400.
The samples for EBSD and TEM were both prepared by twin-jet electro-polishing at –30 °C in an electrolyte that consisted of HClO4 (5%), CH3(CH2)3OH (35%), and CH3OH (vol.%). The EBSD was performed with a Helios Nanolab G3UC dual-beam microscope system (FEI, Czech Republic) equipped with an EBSD detector (EDAX, USA), at 25 kV and 15 nA with a step length of 50–200 nm. A FEI Talos F200X series field emission transmission electron microscope was used for selected area electron diffraction (SAED) patterns, bright-field images, and dark-field images at 200 kV. The phase analysis was determined by X-ray diffraction (D/max 2550 VB) using Cu Kα radiation (40 kV, scanning speed 3 deg/min).
3. Results and Discussion
3.1. Mechanical Response during SHPB
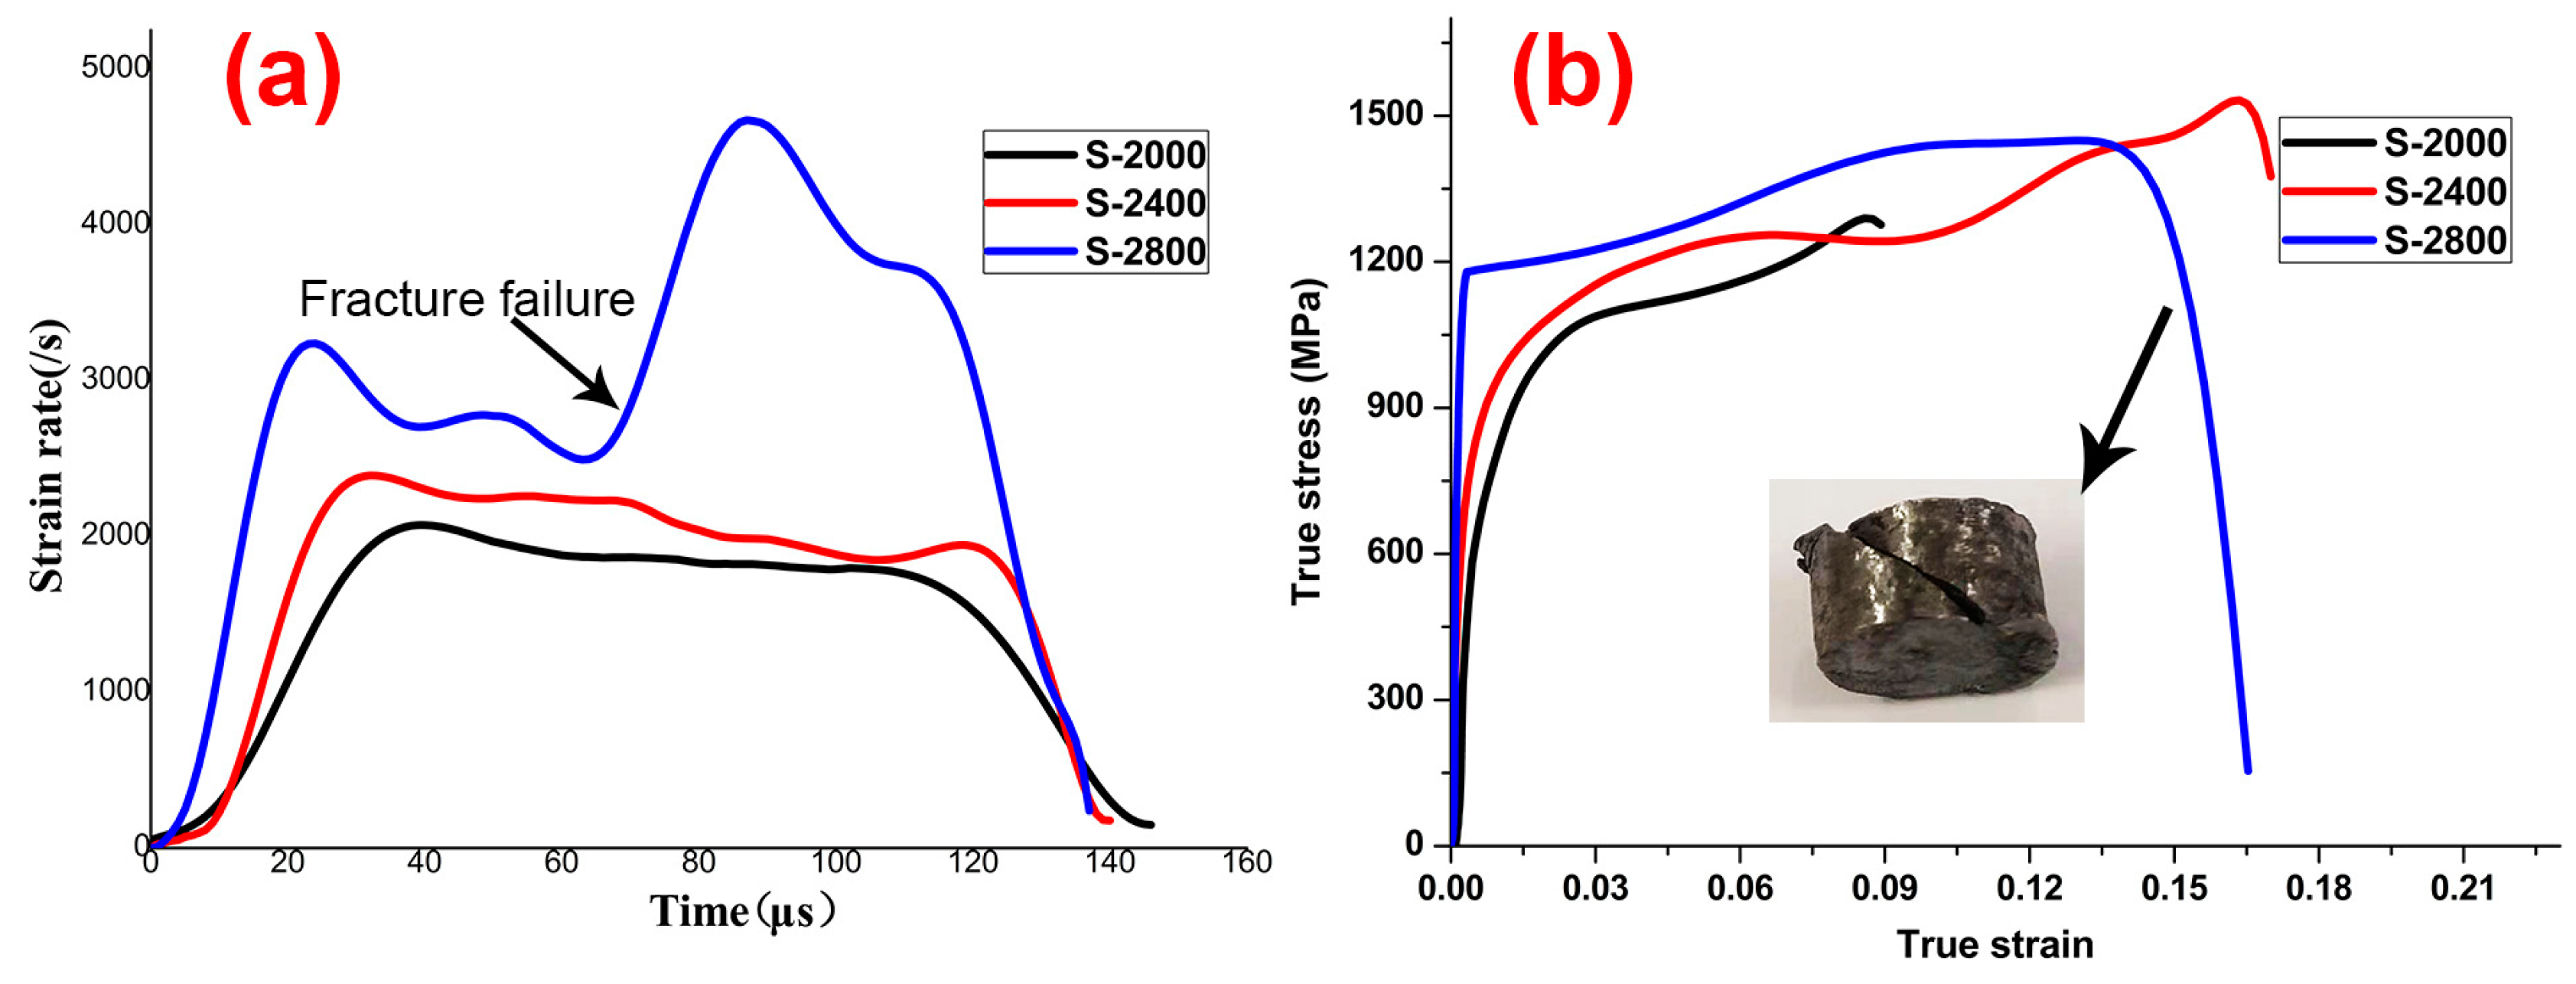
Figure 2 shows the curves of (a) strain rate versus time and (b) true stress versus true strain at different SHPB conditions. In Figure 2a, Strain rate changes over time. The value at relative stable plateau can be regarded as an average strain rate, so the average strain rates at different conditions can be confirmed as 2000 s−1, 2400 s−1, and 2800 s−1, respectively, and the final strains are 7.1%, 12.6%, and 24.3%, respectively. Figure 2b shows that with strain rate increases from 2000 s−1 to 2800 s−1, the ultimate compression strength increases from 1200 MPa to 1400 MPa. When the strain rate is 2800/s, adiabatic shear failure occurs: fracture to the compression axis of 45° as shown in Figure 2b. Compared with other alloys reported in [9,15,16,17], the TB17 alloy exhibits good ultimate compression strength and adiabatic shear failure resistance.
3.2. Phase Composition after SHPB
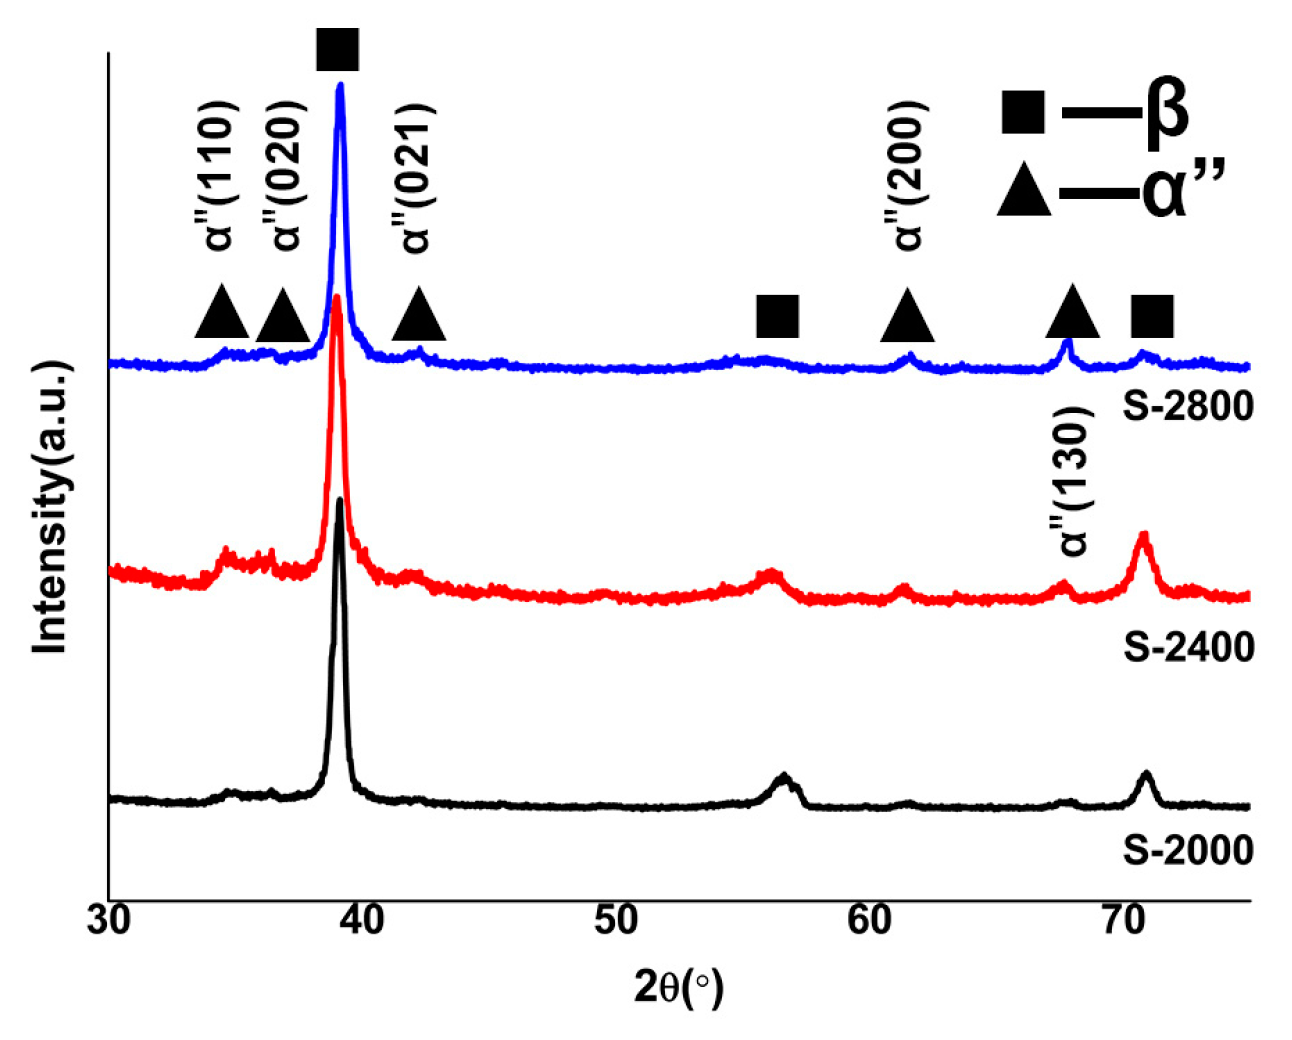
Figure 3 shows the XRD patterns at different SHPB conditions. A small amount of α” martensite phase can be detected in all samples. The lattice parameters of α” martensite are measured as α”a = 0.3032 nm, α”b = 0.4930 nm, and α”c = 0.4302 nm.
3.3. Microstructure Characterization
3.3.1. Primary Deformation Twins and α” Martensite
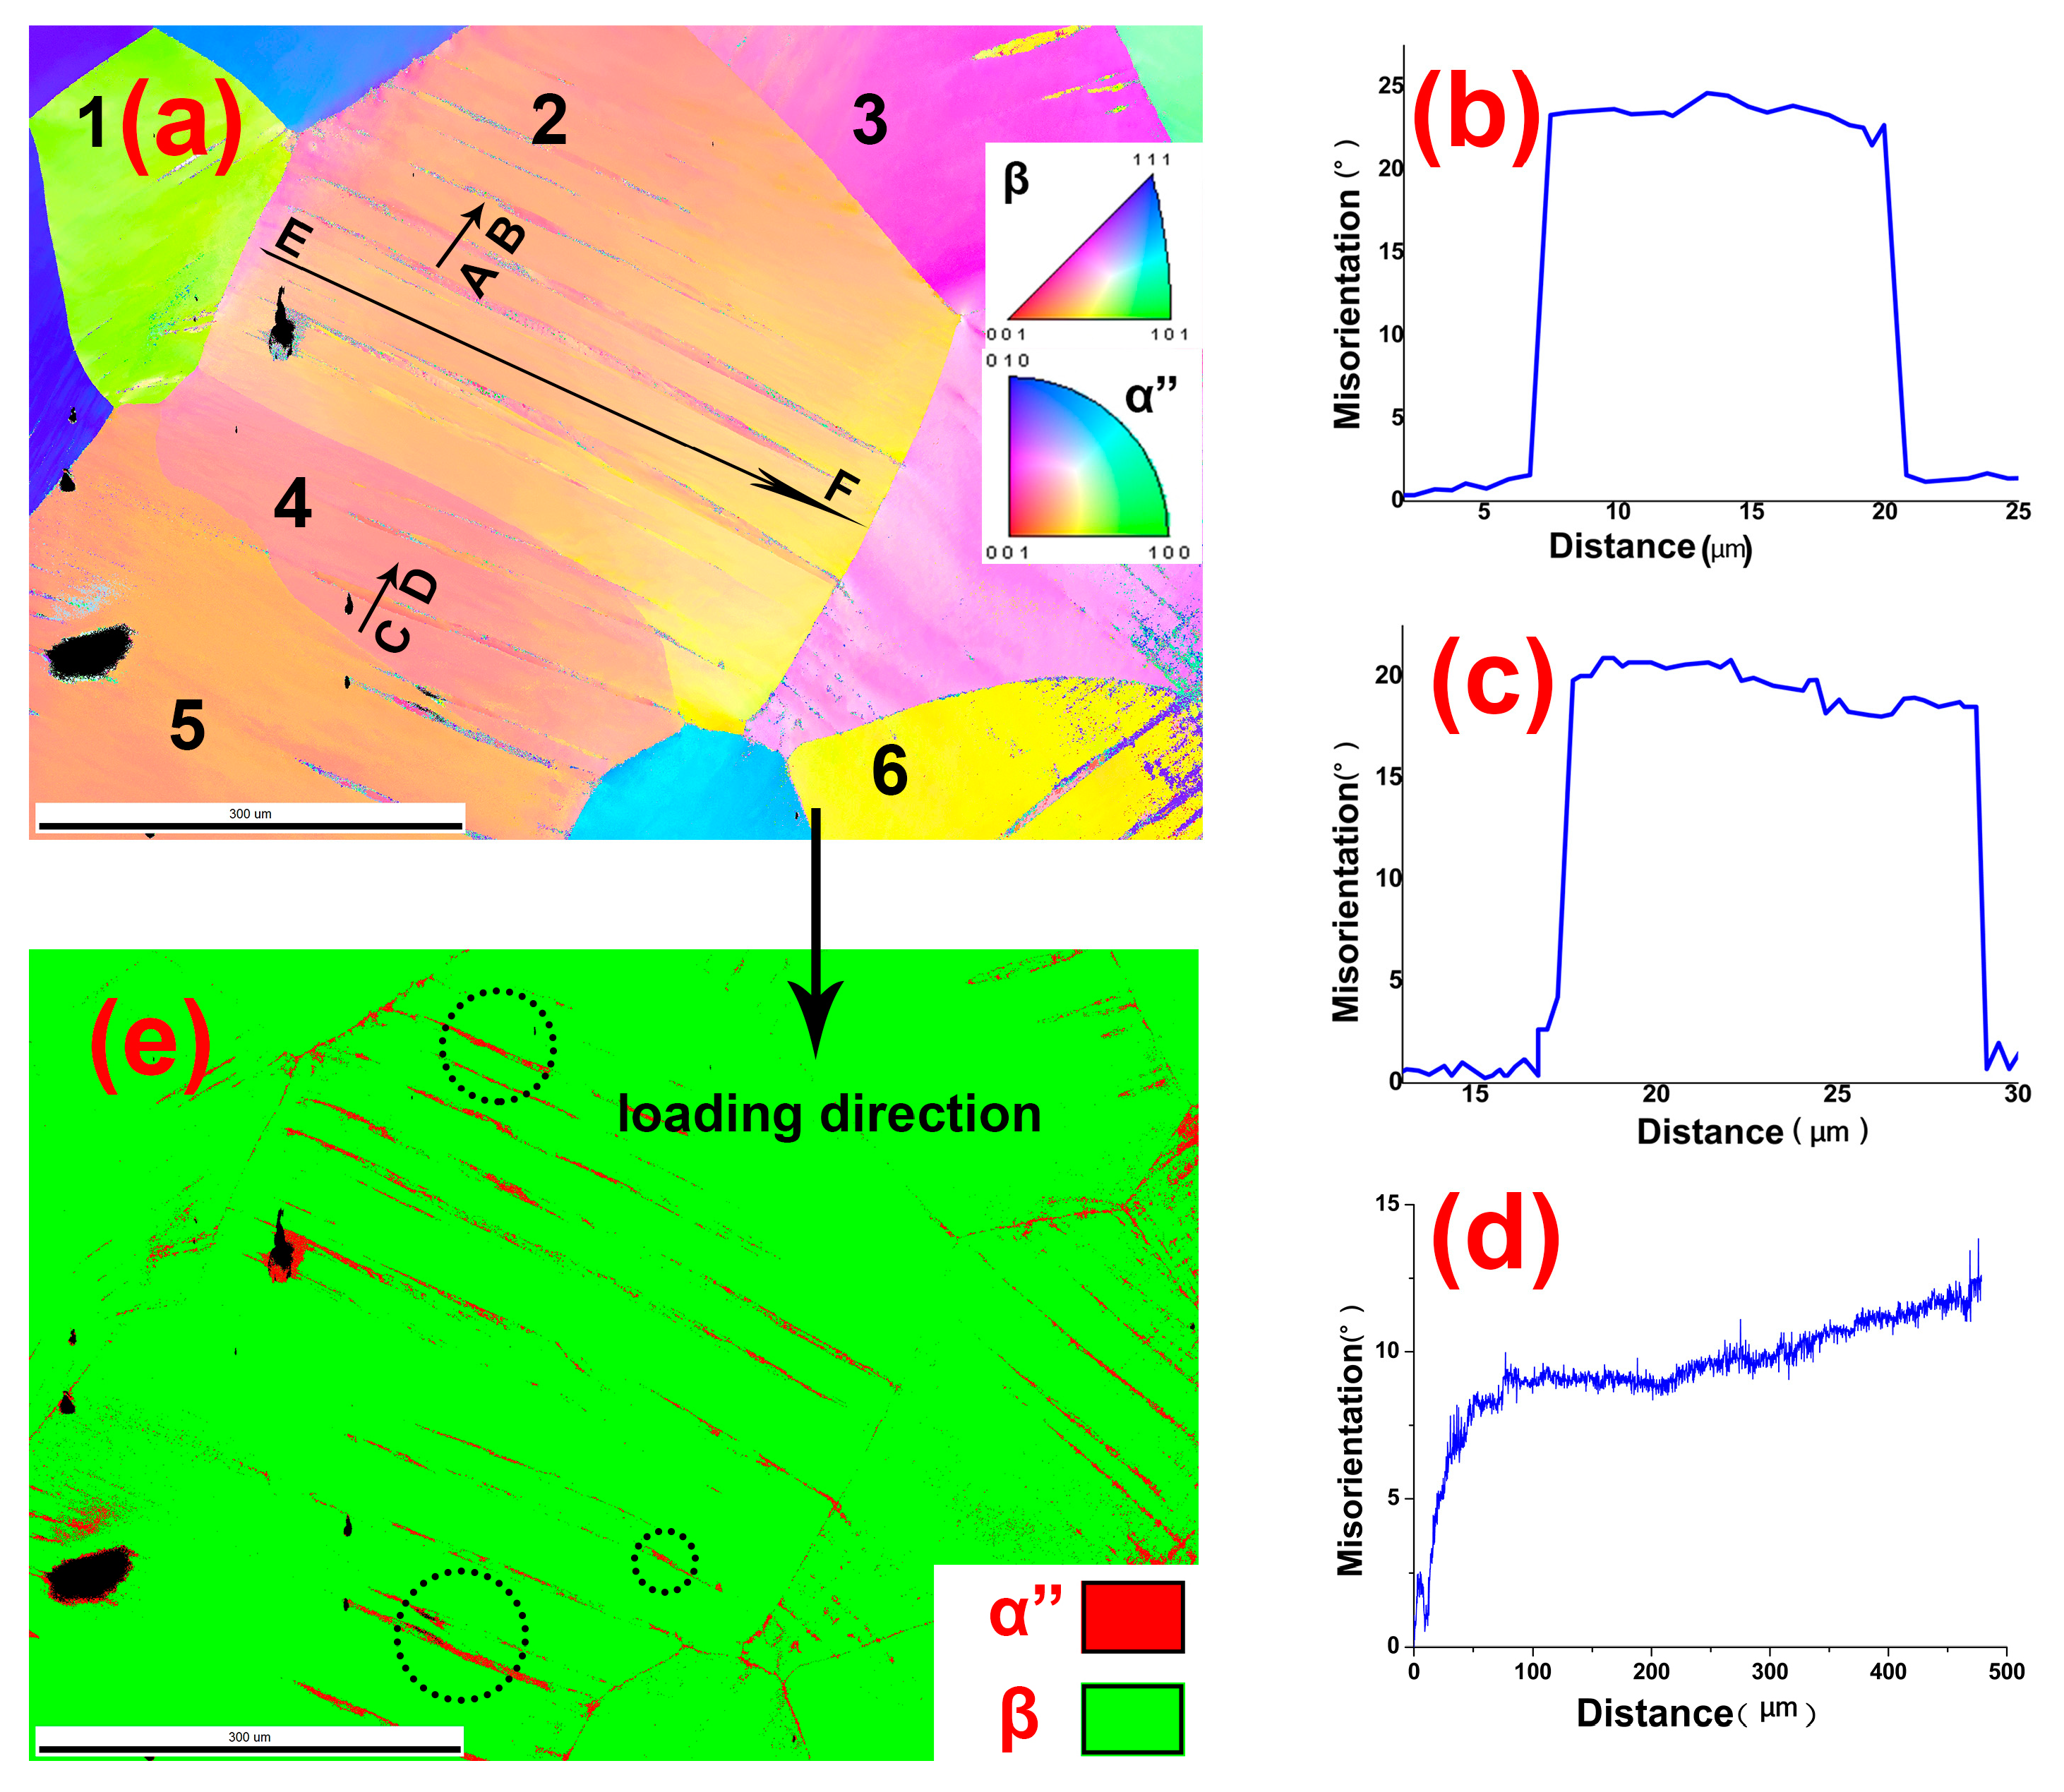
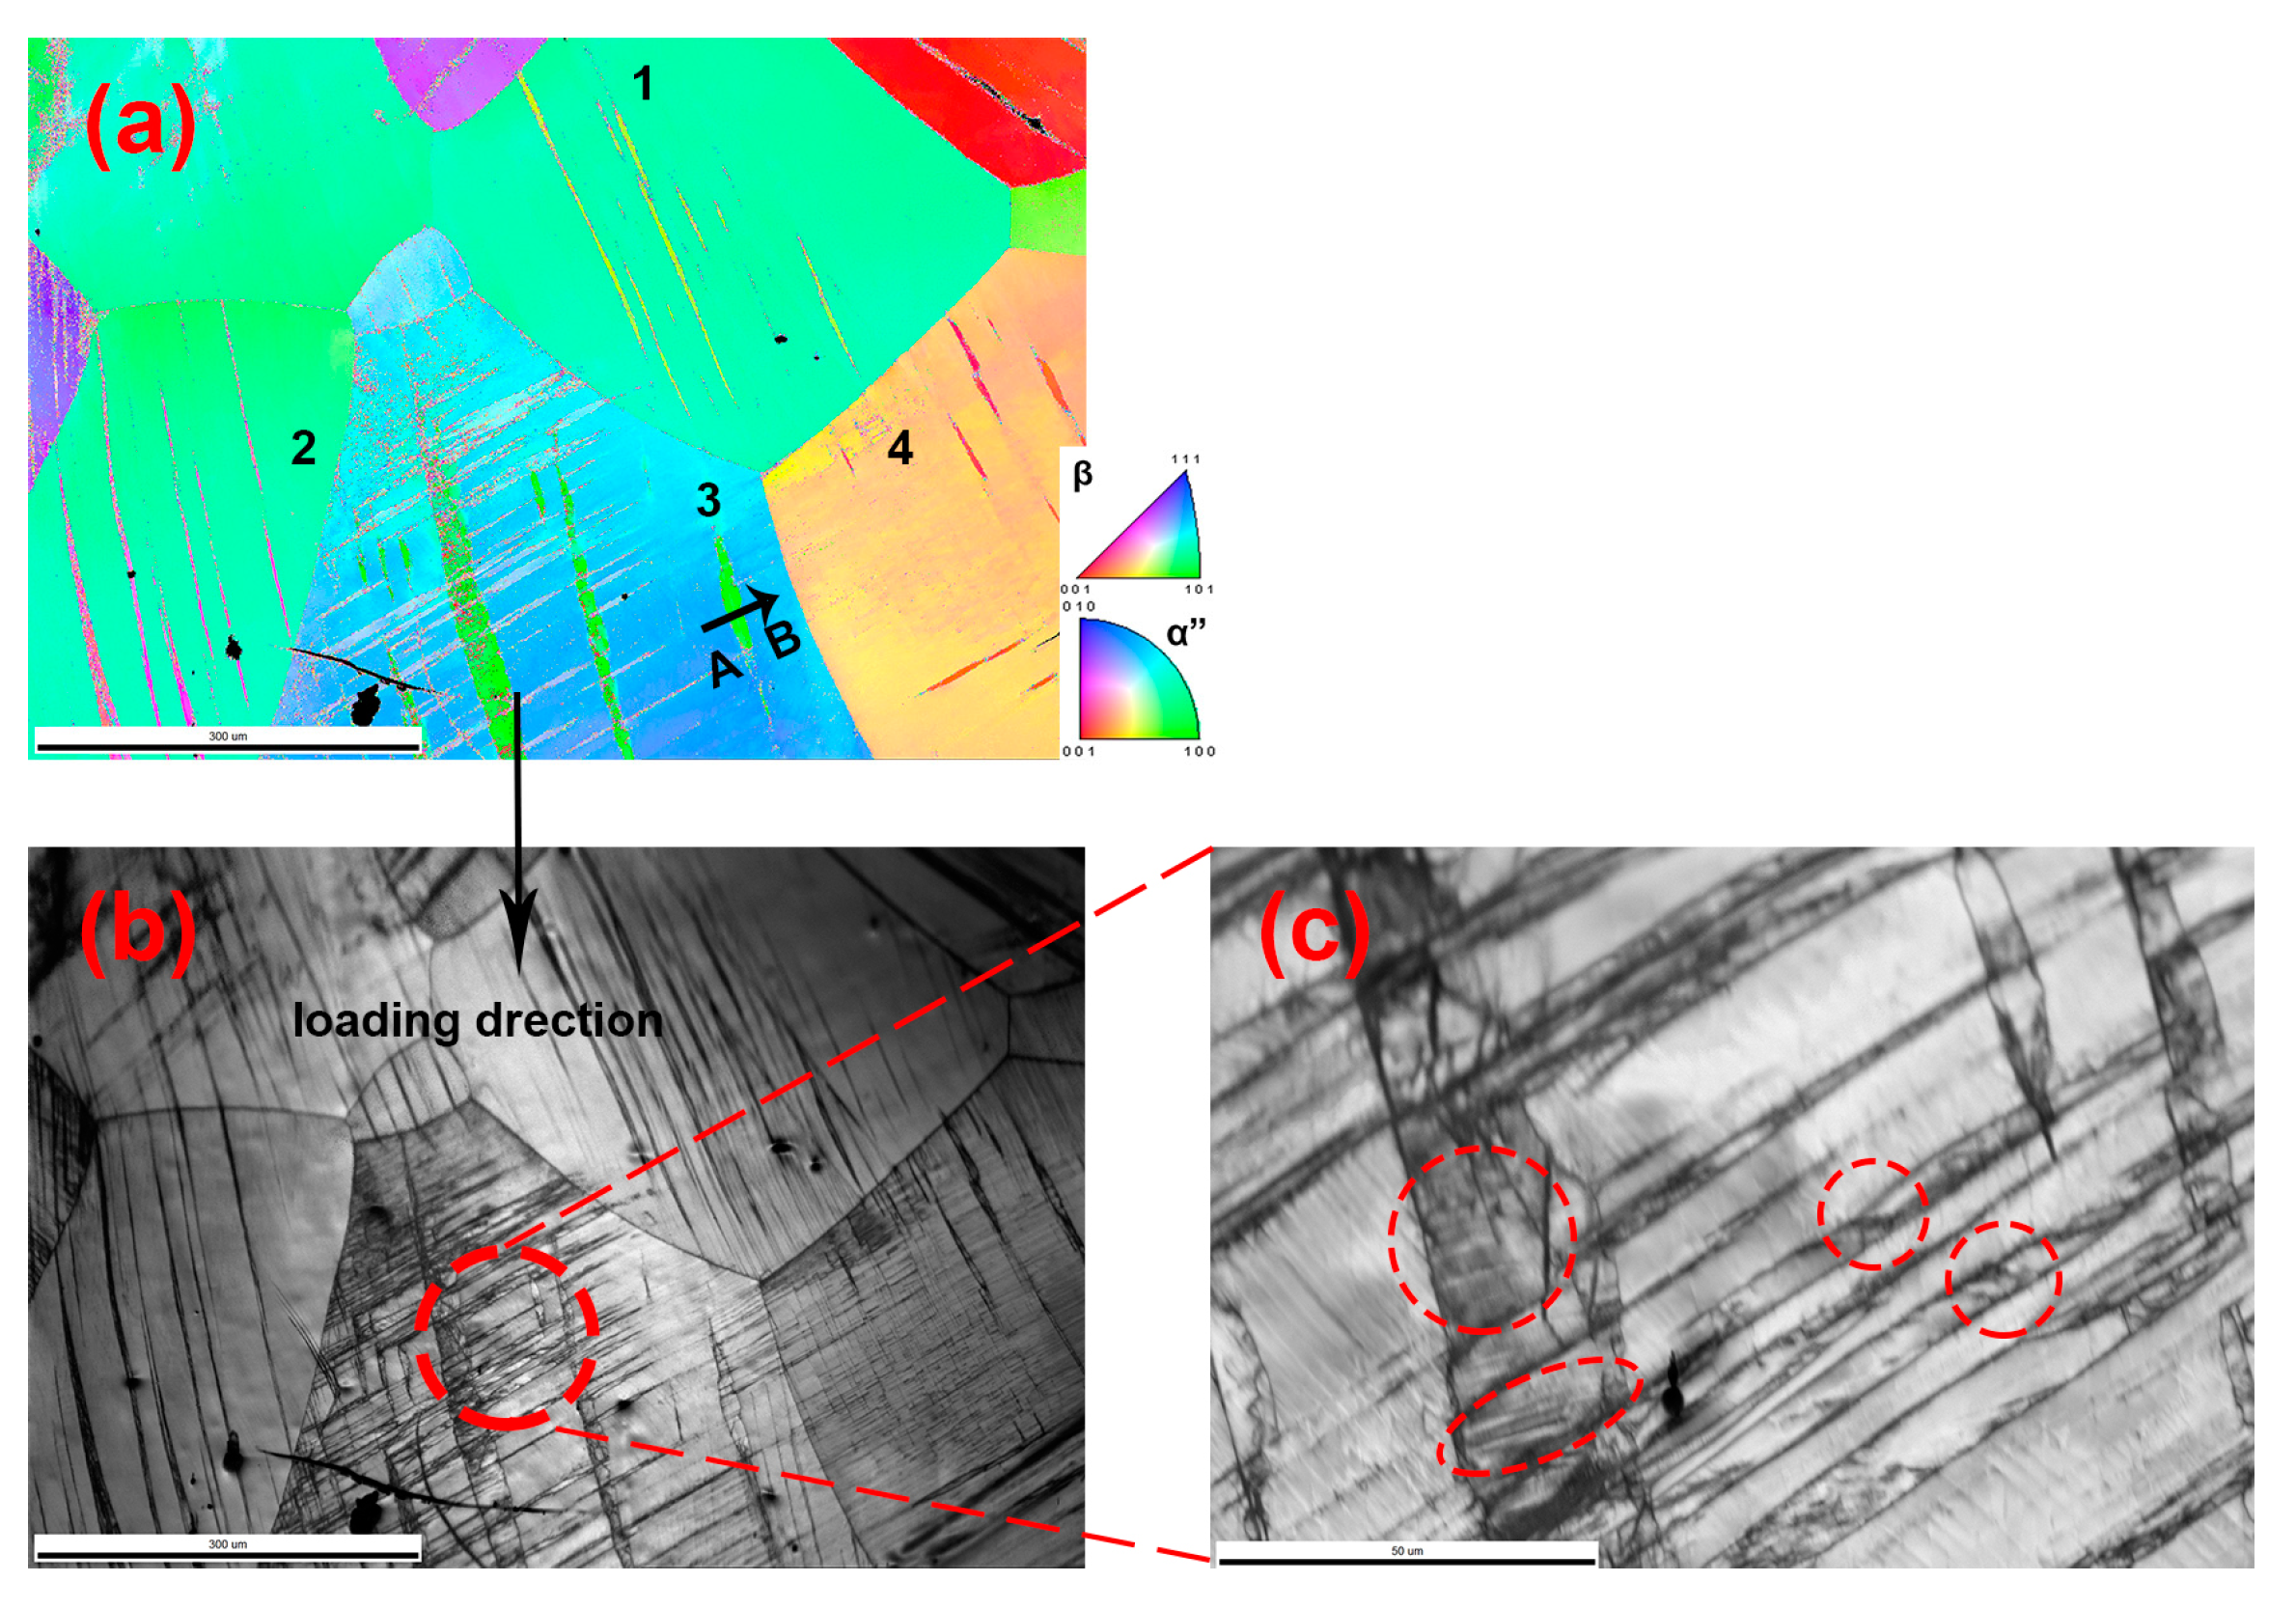
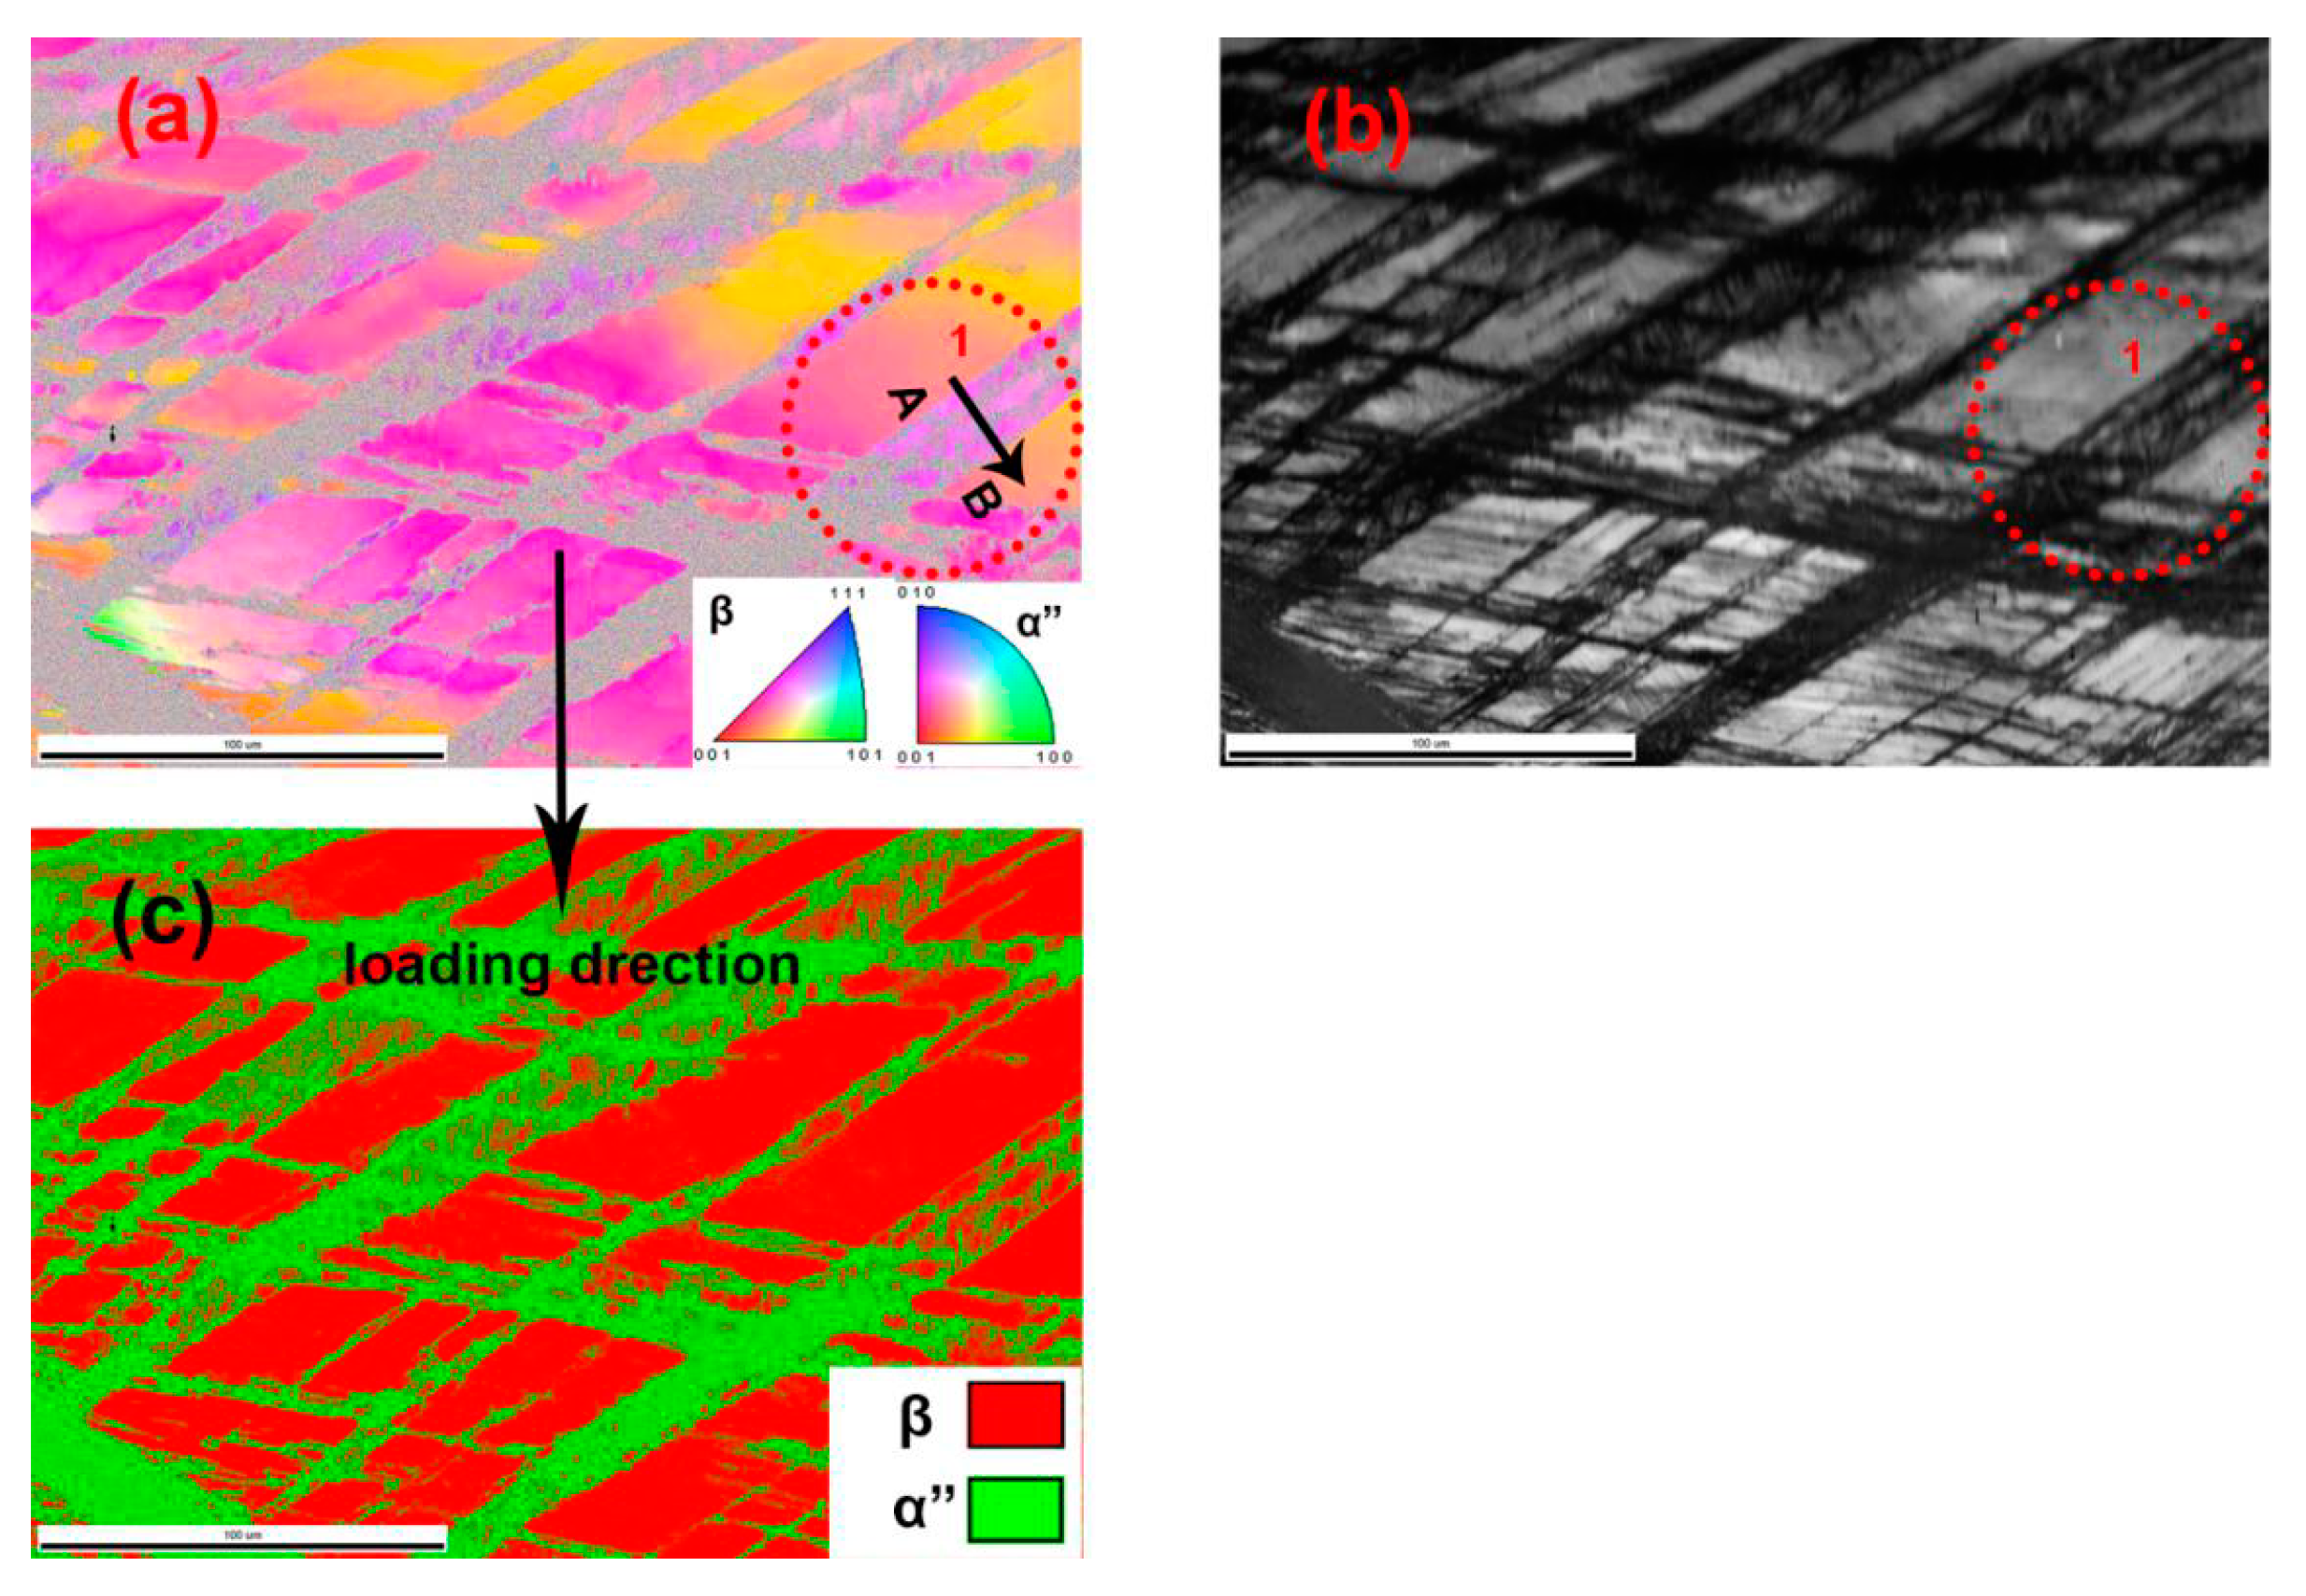
Figure 4 shows the EBSD results of the S-2000 sample with the lowest strain rate of 2000 s−1. In Figure 4a (IPF), the parallel deformation bands are detected in every grain. To analyze the different misorientations between every β grain and its deformation bands, some β grains have been numbered as 1–6. As for Grain-2, the point-to-origin misorientation profile in Figure 4b along A–B in Figure 4a confirms a misorientation angle of 25° between Grain-2 and its deformation band. A similar misorientation angle can also be detected in Grain-1 and Grain-6. The point-to-origin misorientation profile (Figure 4c) between C–D in Figure 4a confirms a misorientation angle of 20° between Grain-4 and its deformation band. A similar misorientation angle is also detected in Grain-3 and Grain-5. The point-to-origin misorientation profile (Figure 4d) between E–F in Figure 4a confirms a misorientation angle of 12° along the deformation bands direction in Grain-2. The misorientation angle (12°) in Grain-2 indicates that a large amount of residual stress exists in deformed samples. The point-to-origin misorientation profiles of grains(Grains-1, -3, -5, and -6) and their internal deformation bands are provided in the Supplementary Data.
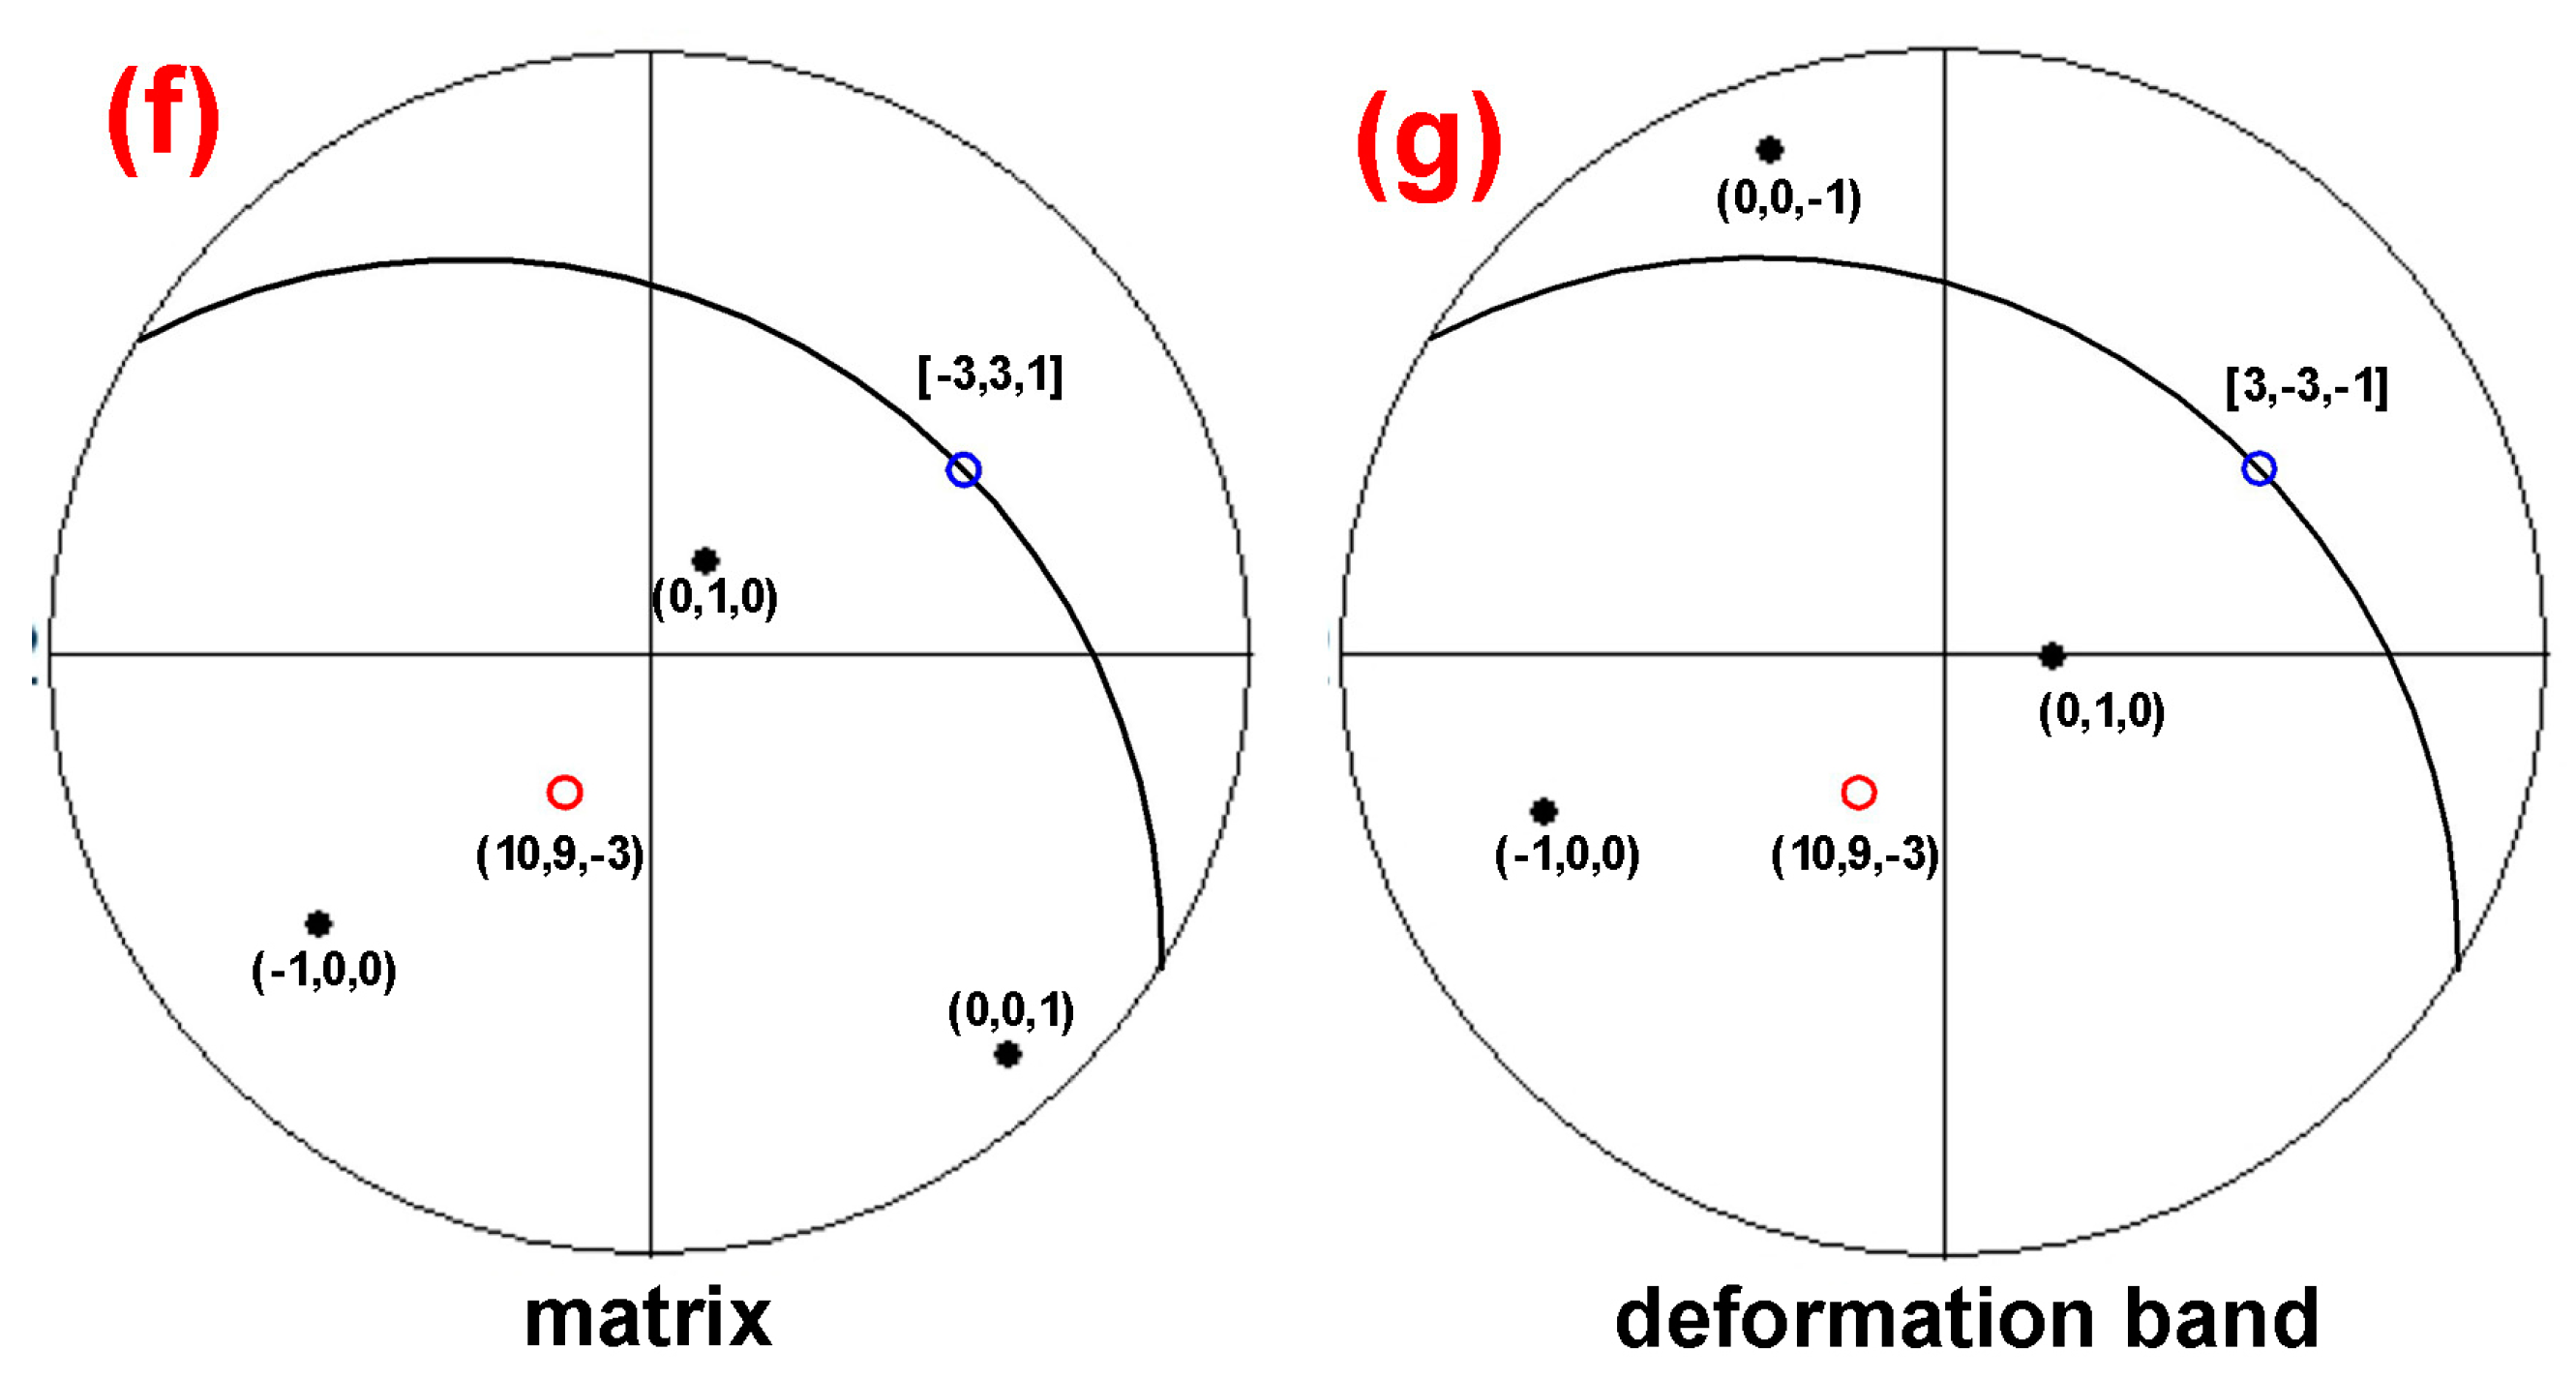
In order to determine the orientation relationship between the β matrix and the β deformation band, and further determine the possible twinning system in the deformation process, the stereographic projections of two crystallographic orientations shown in Figure 4f,g are drawn from EBSD data. On each stereogram (Figure 5f,g), only some interesting poles and traces were represented to ensure better readability. Figure 4f,g shows that the β matrix and β deformation band share a {10 9 3}β pole and a <331>β direction. Indeed, the operation of a rotation of 180° around the [-331] direction of the β matrix leads to the β deformation band. Therefore, the β matrix and the β deformation band are in the {10 9 3}<331>β type II twinning mode. These results show that the relationship of Grains-1, -2, and -6 and their internal deformation bands belong to the {10 9 3}<331>β type II high-index DT. The {10 9 3}β high-index DT has been reported in Ti-5Al-5Mo-3Cr-0.5Fe (wt.%) metastable β titanium alloy [18]. There is an interesting phenomenon occurring here. The misorientation angles between Grains-3, -4, and -5 and their internal deformation bands are between 20–22°, only 3–5° different from the misorientation angle found in Grain-2. The reason for this phenomenon may be due to high strain rate, residual stress, and high-density dislocation. Thus, the relationships between Grains-3, -4, and -5 and their internal deformation bands are still {10 9 3}<331>β type II high-index DTs.
Many references related to the β phase twinning system in titanium alloys have been reported [19,20,21,22,23]. Each twinning system has a particular misorientation angle, such as 60° corresponding {112}<111>β twinning [19,20], 50° corresponding {332}<113>β twinning [21,22,23], 36° corresponding to {5 8 11}<135>β high-index DTs [20,23], and 26° corresponding to {10 9 3}<331>β high-index DTs [18]. The observation of this invariable plane, such as {11 8 5}β, {10 9 3}β, indicates that high-index DTs can be generated by mechanical deformation in metastable β titanium alloys. A small number of α” martensite (highlighted in black circle) have also been observed in {10 9 3}β primary DTs as shown in Figure 4e. The primary deformation bands start at the grain boundary and are composed of α” martensite/βtwin/α” martensite/βtwin in sequence along the length direction. This transition structure of α” martensite and primary DT has also been reported in other studies [24]. Lai et al. found that the transition structure seemed to imply that the α” martensite band is first formed and then β-twin began to form in the α” martensite band.
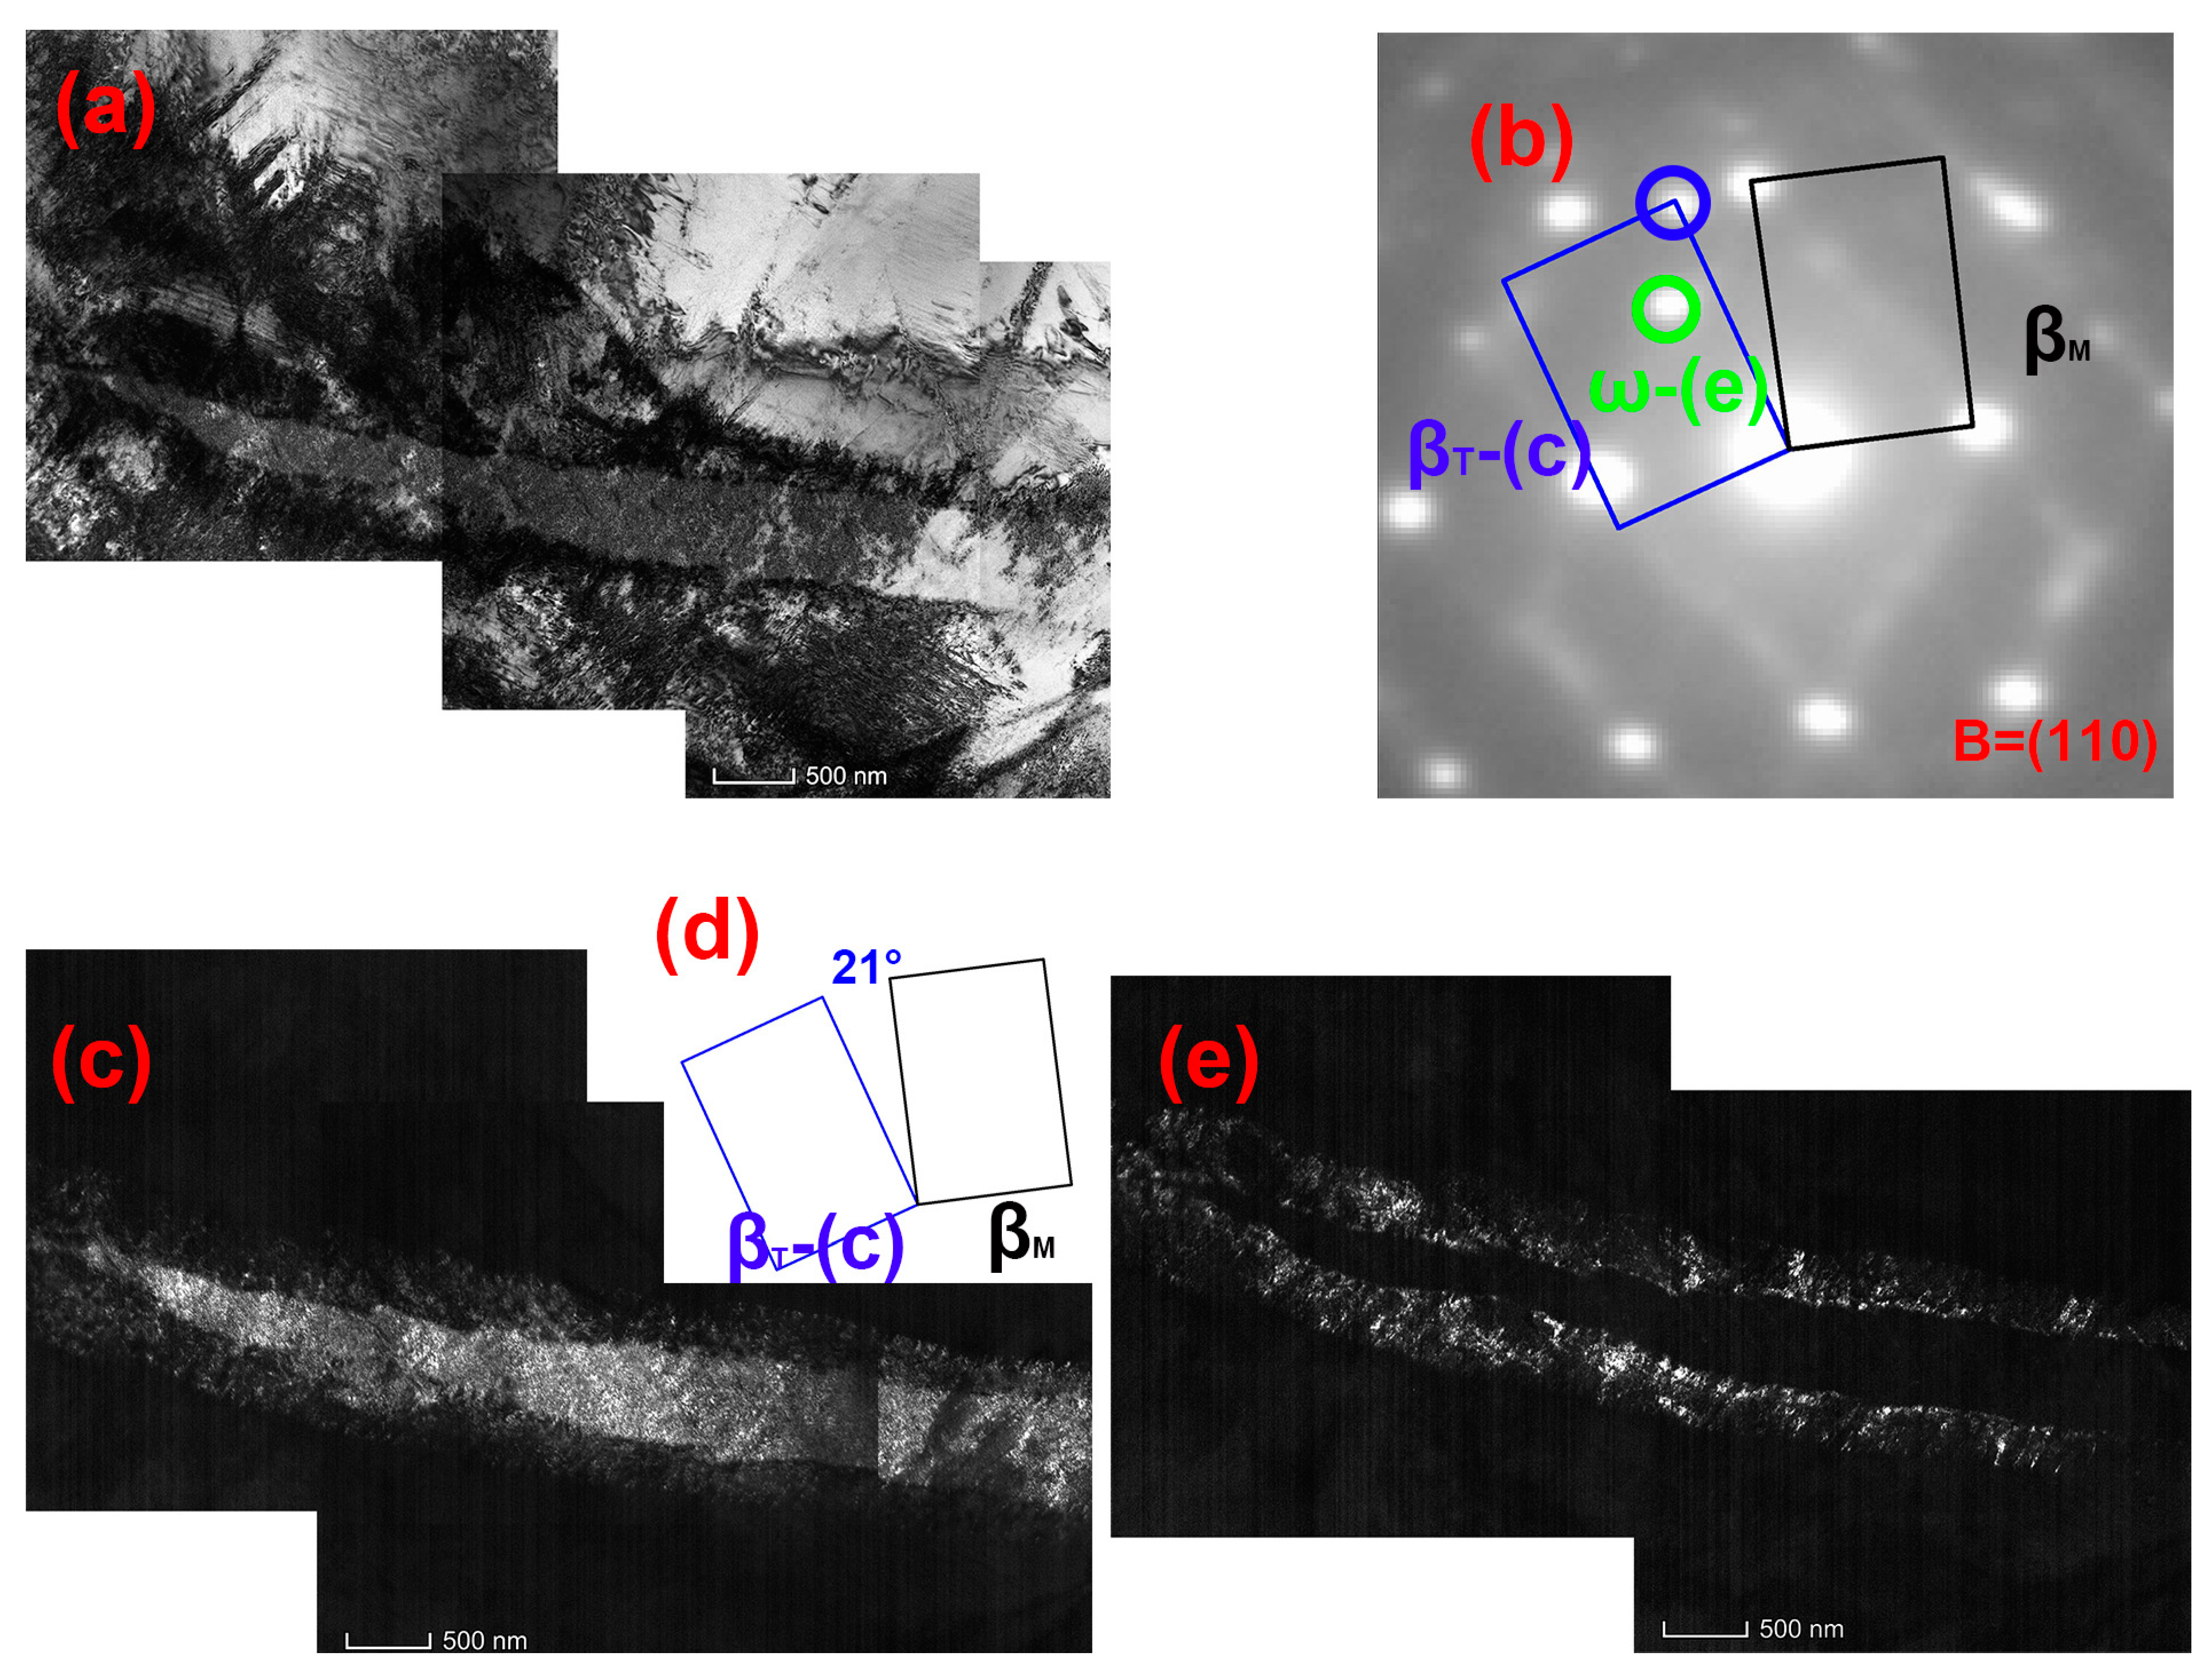
The TEM results shown in Figure 5 are intended to further confirm the {10 9 3}β DT in S-2000 samples. A deformation band with a complex internal structure is shown in a bright-field image (Figure 5a). Figure 5b shows the selected area electron diffraction (SAED) pattern near the [110] zone axis obtained from a deformation band and β parent region. Three groups of diffraction patterns appear and are highlighted with solid lines of different colors. Figure 5c shows the dark-field image taken from the blue circle in Figure 5b. The schematic diagram (Figure 5d) shows a β-twin relationship between β matrix and Figure 5c, and a ~20° rotation between two groups of body-centered cubic lattice reflections is revealed. This misorientation angle (20°) is 5° different from the misorientation angle of the {10 9 3} twin system, but the relationship between the β matrix and the deformation band (Figure 5c) remains as one that belongs to {10 9 3}β DT. The cause of this difference of 5° may be due to high strain rate, large residual stress, and high-density dislocation.
The dark-field images (Figure 5e) taken from the green circle in Figure 5b show that another deformation structure has been generated within the primary deformation band. After analysis, the structure shown in Figure 5e may be the interfacial ω phase. Similar observed were also reported in other studies [23,24]. Castany et al. [24] studied a Ti-27Nb metastable β titanium alloy and found that the {332}<113>β twinning system is shown to be the consequence of the reversion of a parent {130}<310>α” twinning in stress-induced α” martensite, and the interfacial ω phase was found at the boundary of {332}<113>β twinning system. Castany et al. conducted a detailed analysis of this interfacial ω phase and speculated that this ω-phase can be interpreted as the product of a relaxation of strains due to a mismatch of lattice parameters between α” and β phases during the reverse transformation.
3.3.2. Secondary Deformation Twins
Figure 6 shows the EBSD results of the S-2400 sample with a strain rate of 2400 s−1. Some parallel deformation bands are observed in every grain in Figure 6a. To analyze the different misorientation angle between each β grain and its deformation bands, some β grains are numbered as 1–4. The point-to-origin misorientation profiles of grains (Grains-1, -2, -3, and -4) and their internal deformation bands are provided in the Supplementary Data. The relationship between all grains and their internal deformation bands are {10 9 3}β high-index DTs. Some black lines (fine secondary products) have been produced inside the primary high-index DT, as shown by the red circle in Figure 6c. These secondary deformation products will be confirmed in the following TEM results (Figure 7).
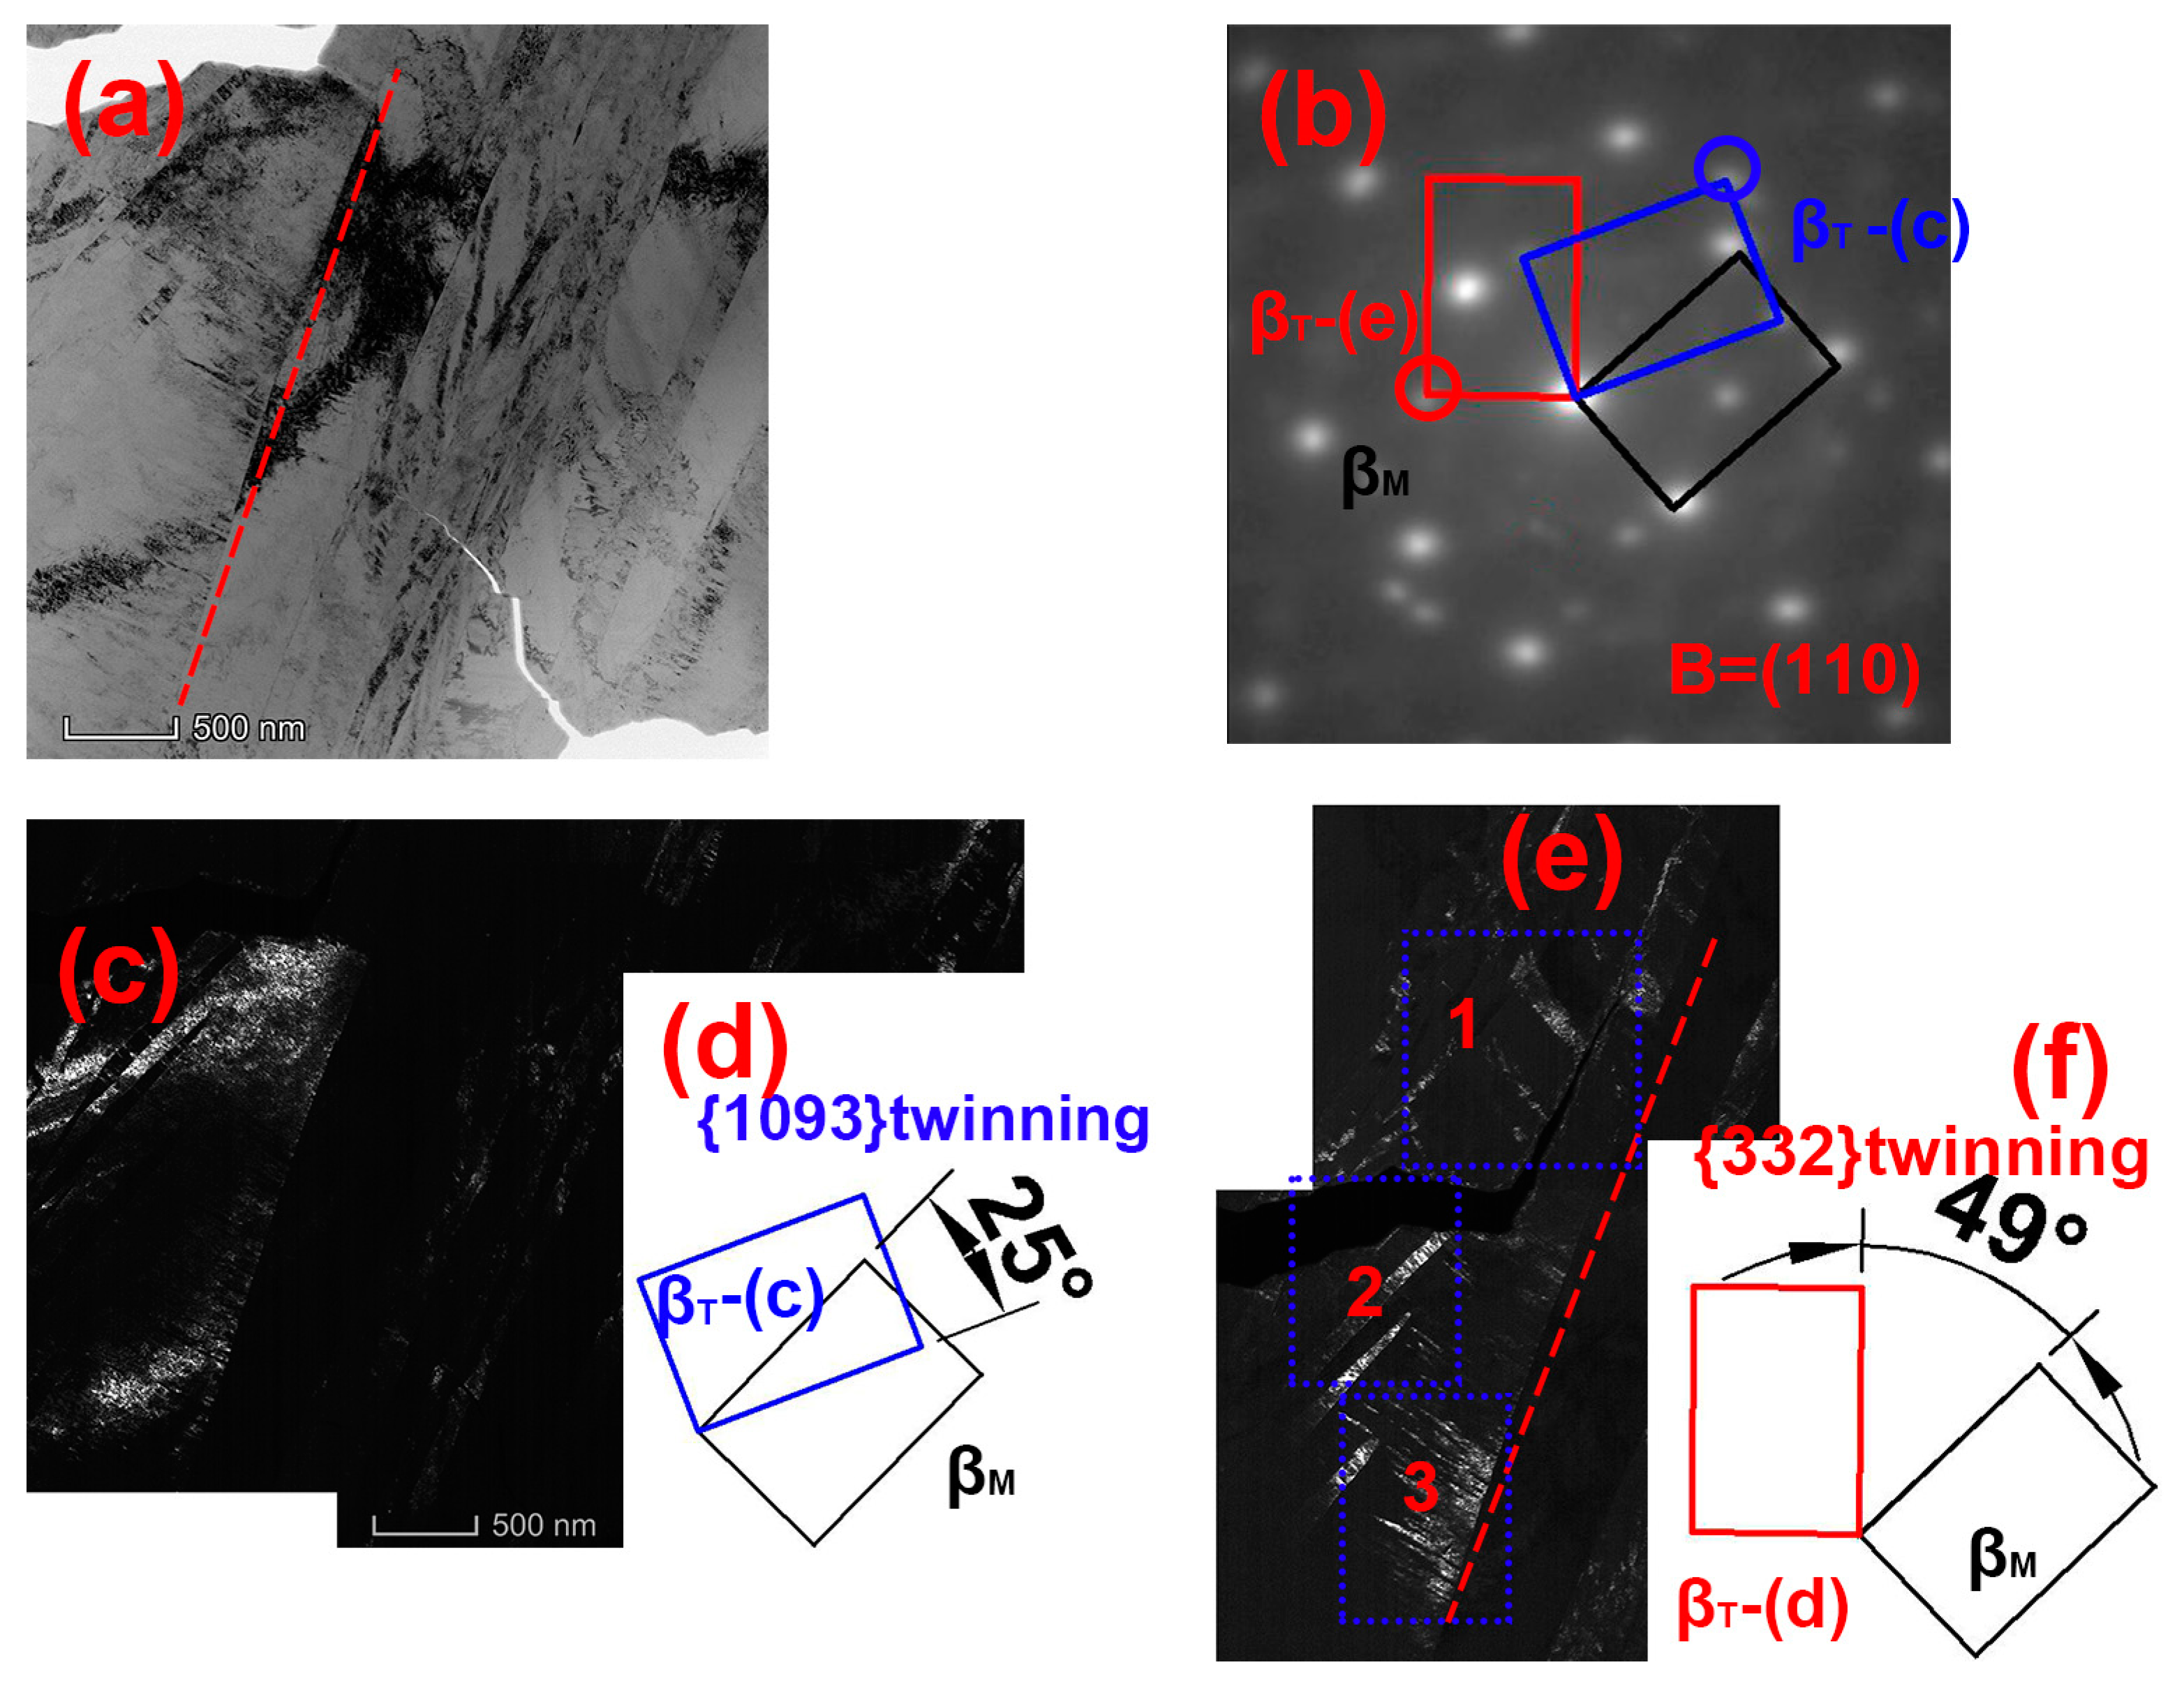
Using the TEM results of the S-2400 samples (Figure 7), the fine secondary products in primary deformed twins are confirmed. The secondary deformation structure within the primary deformation band is observed in the bright-field image (Figure 7a). The red dashed-lines in Figure 7a are the visual-assisted β matrix/primary deformation band boundary. The dark-field image (Figure 7c) taken from the blue solid circle in Figure 7b reveals a primary deformation band. The schematic diagram (Figure 7d) reveals a ~25° rotation between the two sets of body-centered cubic lattice reflections. This rotation angle (25°) corresponding to the {10 9 3} twin system has been found in a previous report [18]. The dark-field image (Figure 7e), taken from the red circle in the SAED pattern, shows some fine secondary products (marked with red number) within primary {10 9 3}<331>β type II high-index DT. The schematic diagram (Figure 7f) shows the rotation angle of the secondary deformation structure and the β matrix is 49°. According to previous studies [21,22,23,24], this rotation angle is consistent with {332}<113> twins, and the difference is only 1.6° (the reason for this phenomenon may be that there are large residual stress and high-density dislocations). Thus, the relationship between the β matrix and secondary fine secondary products was confirmed as being {332}<113>β twin. The above results prove that the fine secondary products found in the EBSD results (Figure 6c) have a {332}<113>β twinning relationship with the β matrix.
3.3.3. Secondary α” Martensite
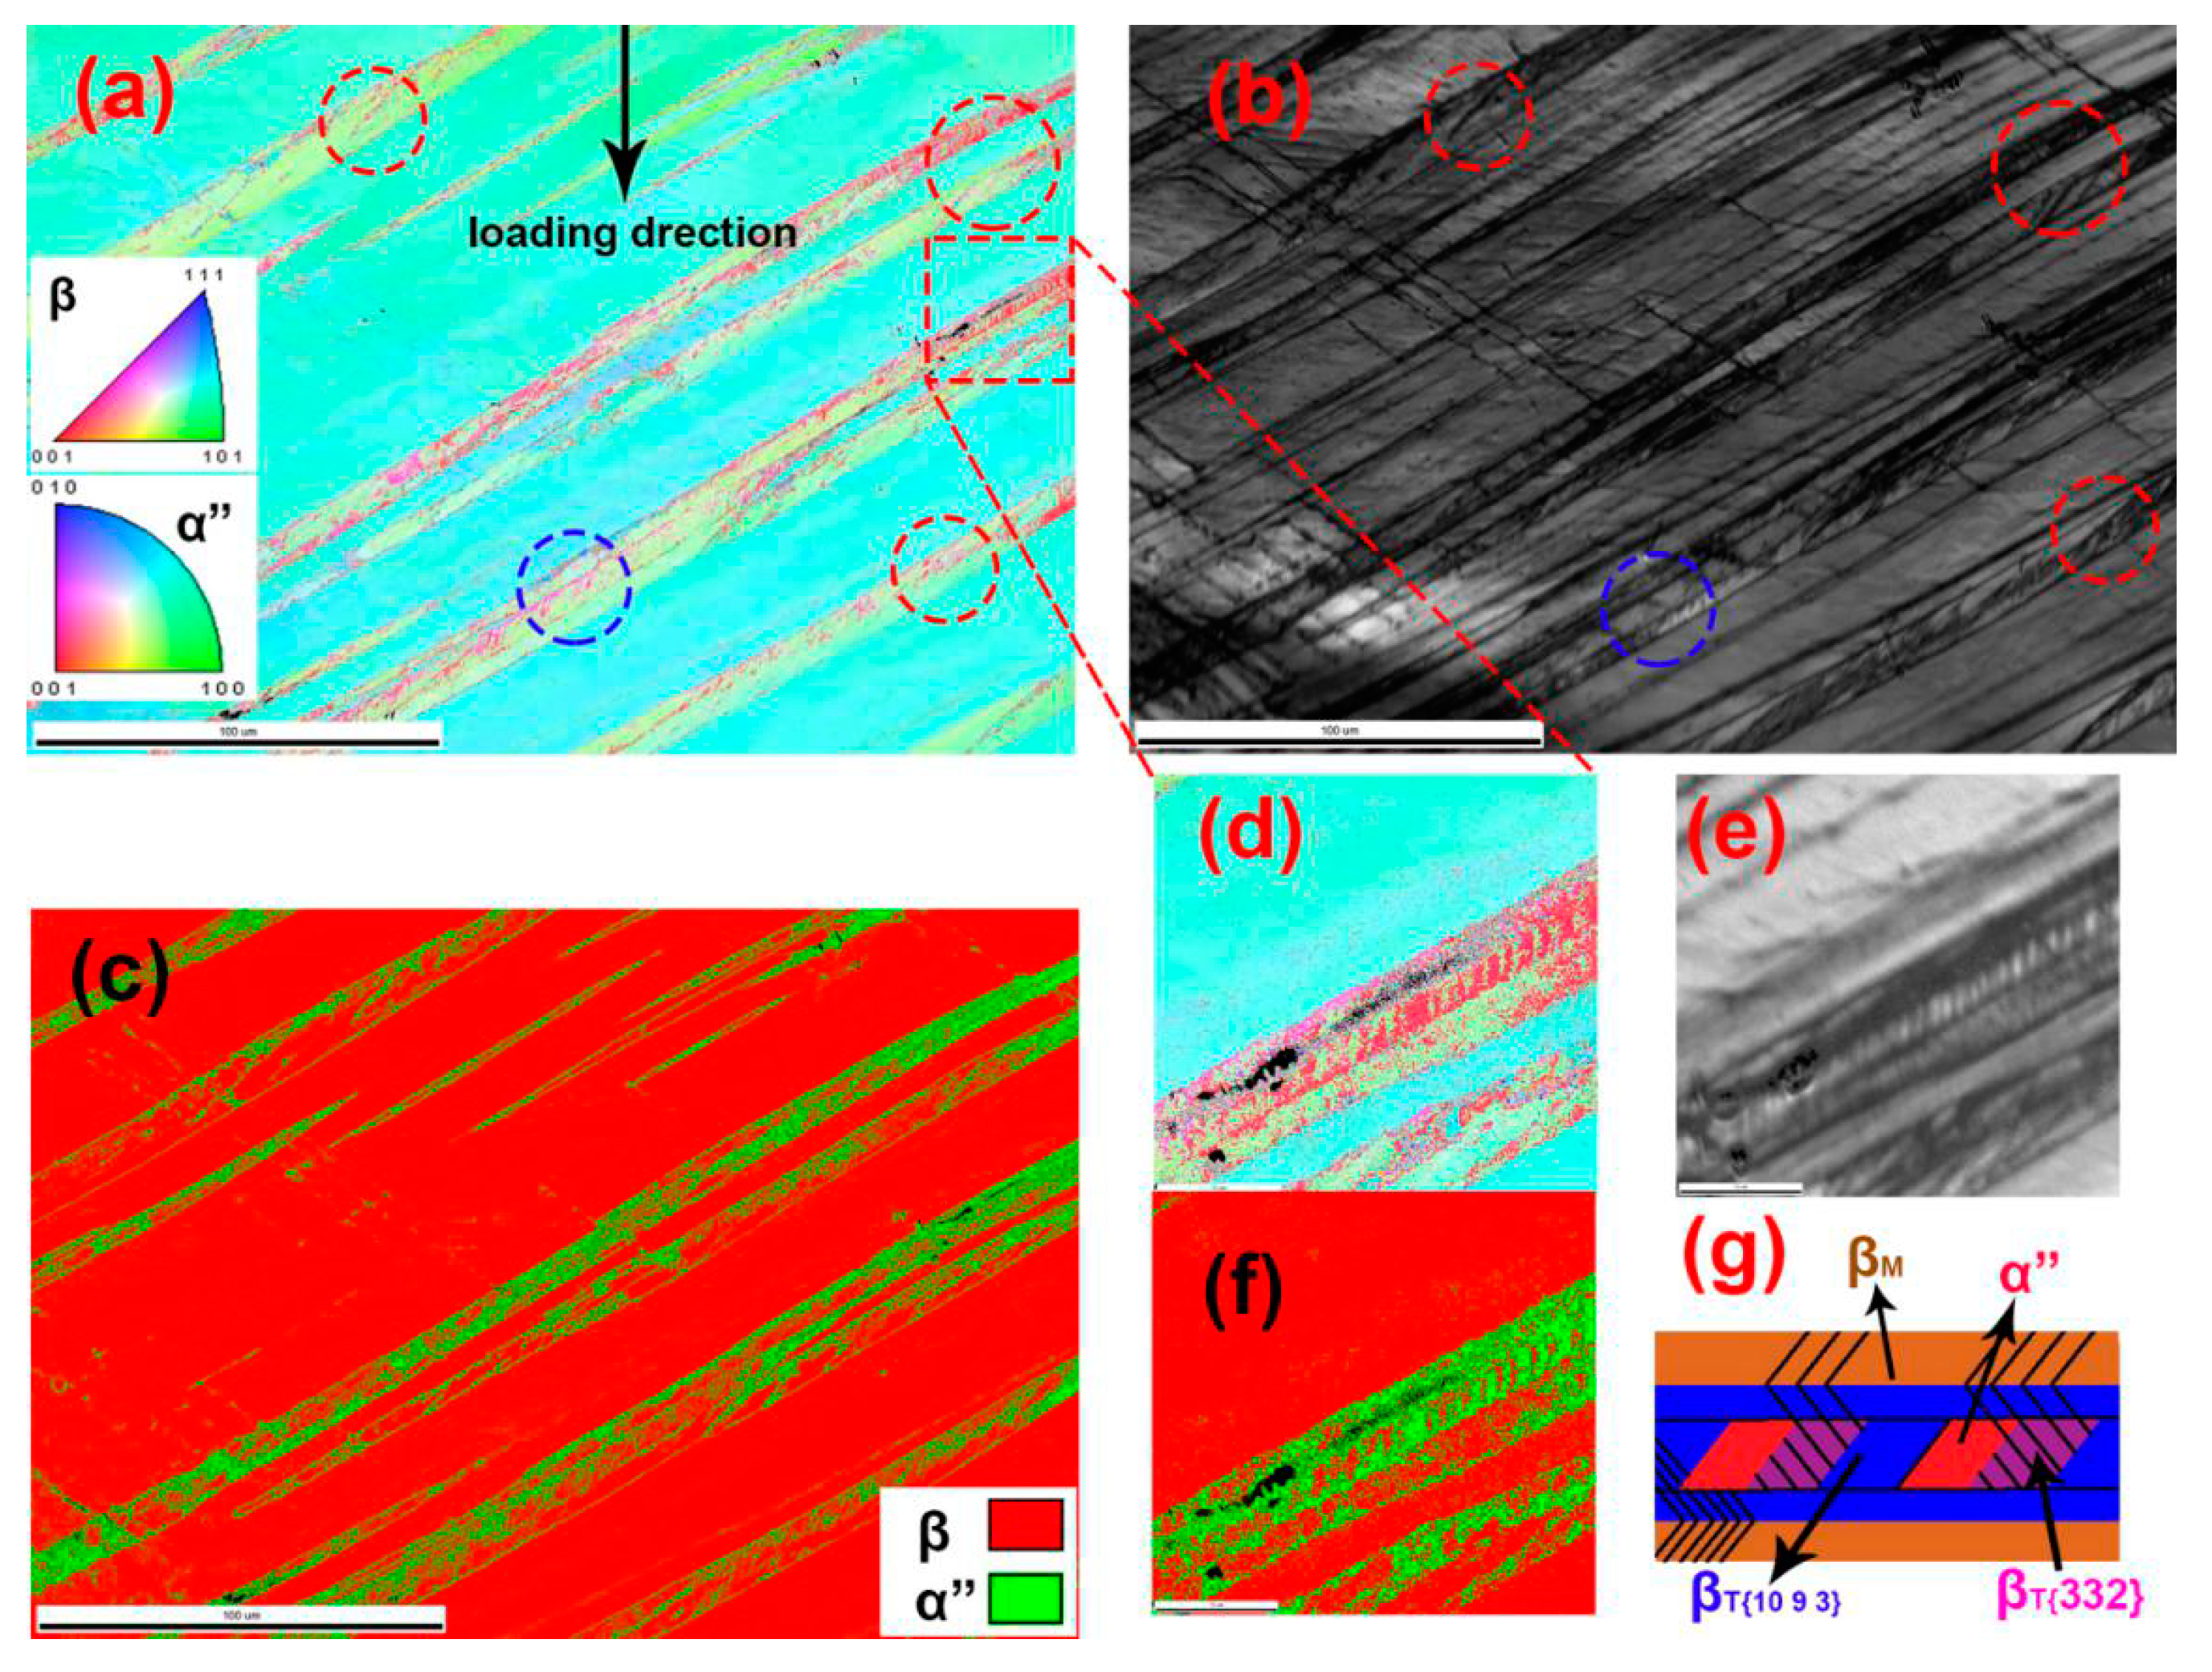
Figure 8 shows the EBSD results of the S-2400 sample. Some parallel deformation twins that are observed in Figure 8a belong to {10 9 3}β DTs. The point-to-origin misorientation profile of the β matrix and internal deformation band is provided in the Supplementary Data. The IQ map (Figure 8b) shows that the secondary {332}<113>β DTs (marked red circles) have been generated within primary {0 9 3}β DTs. The α” martensite (secondary α” martensite) is observed in the primary DTs. The α” martensite mainly exists on the boundary of primary DTs or secondary DTs. Ahmed et al. [11] also found that the α” martensite nucleates preferably at the interface of the β matrix and primary DTs. In this study, when the strain rate is 2400 s−1, both the secondary DTs and the α” martensite can be activated. The nucleation of the secondary α” martensite preferentially occurs on the boundary of the primary DTs and secondary DTs. The activation of the secondary deformation structure (DTs and α” martensite) is related to the modified orientation factor of the plane of the secondary DTs [19,25,26,27,28,29]. Figure 8d,f highlights the characteristic structure of the IPF map (Figure 8a). Figure 8d shows a deformation twin consisting of three thin deformed bands with similar colors. An alternated band structure of α” martensite and β phase is observed in the middle of the deformation band. The IQ map (Figure 8e) shows that fine secondary products (secondary {332}<113>β DTs) are found nearby the α” martensite. The activation of secondary α” martensite may be related to the {332}<113>β secondary DT. Figure 8g shows the schematic diagram of the complex structure in IPF (Figure 8d).
Figure 9 shows the EBSD results for the S-2800 sample with the highest strain rate of 2800 s−1. The primary deformation bands are in a state of disorderly structures, and only a small number of residual β phase is observed as shown in Figure 9a. The point-to-origin misorientation profile of the residual β phase and β matrix along A–B is provided in the Supplementary Data. The misorientation angle between the residual β phase in the primary deformation band and the β matrix is mainly at 10°–25°. Complicated secondary deformation products have been generated inside of the primary deformation twins as shown in Figure 9b. The phase map (Figure 9c) shows that the primary deformation twins have been identified as α” martensite and only a small number of β phases.
3.4. Deformation Mechanism under High Strain Rates
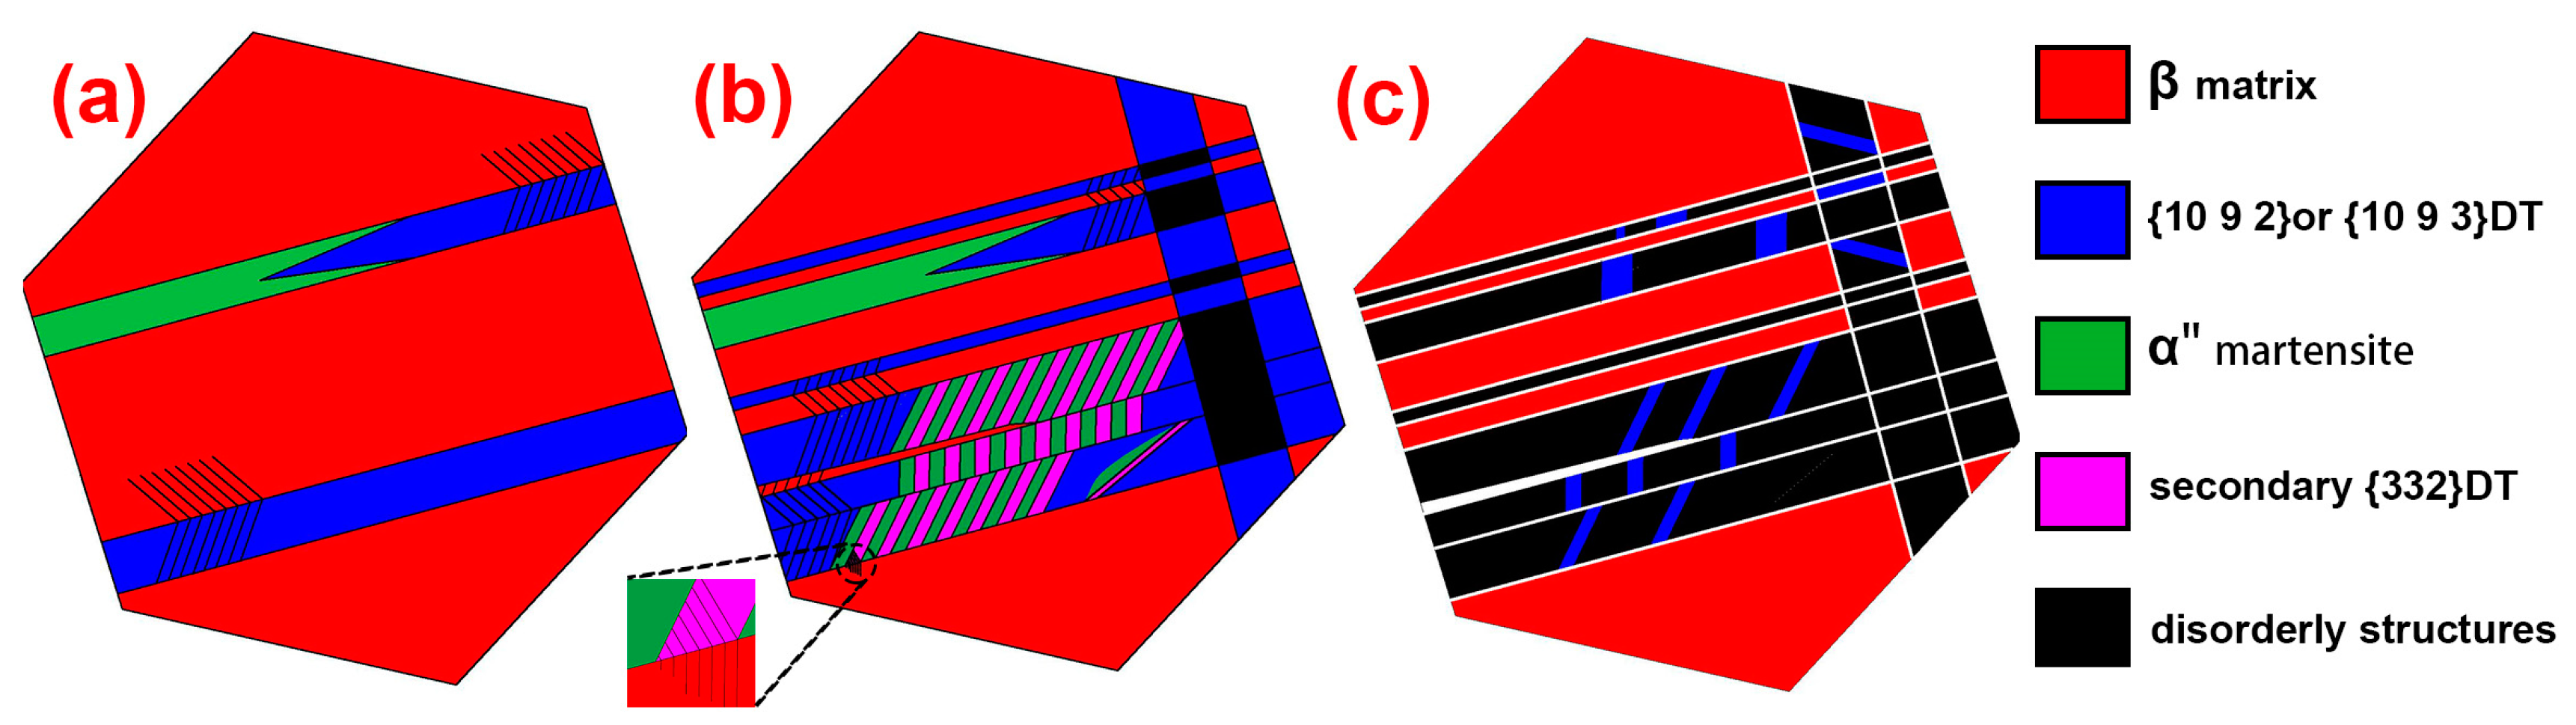
Dislocation slip, deformation twinning, and α” martensite transformations or combinations of them are common mechanisms, which are the response modes of titanium alloy during plastic deformation. Ahmed et al. [11] found that at a strain rate of 101 s−1 and above the dominant deformation mechanism was deformation twins. However, different conclusions have been drawn in this study. The deformation twins and α” martensite occurred at all strain rates 2000–2800 s−1. The deformation mechanisms of TB17 can be concluded from Section 3.3 as follows: primary {10 9 3}<331>β type II high-index DT and a small amount of primary α” martensite were detected when the strain rate was 2000/s, as show in Figure 10a. Multiple deformation mechanisms, including the primary {10 9 3}<331>β type II high-index DT, secondary {332}β deformation twins, and α” martensite, were identified in the S-2400 sample when the strain rate was 2400/s (Figure 10b). When the strain rate was 2800/s, a large number of deformation bands with disordered structures were formed inside of the S-2800 sample, as show in Figure 10c. Under high strain rates, the deformation process of the TB17 alloy with multiple deformation mechanisms shows good ultimate compressive strength. This multiple deformation mechanism can effectively coordinate deformation at high strain rates and provides a theoretical insight into the design of new titanium alloys used in future extreme environments (high strain rate).
4. Conclusions
The deformation mechanisms of a solution-treated TB17 alloy under high strain rates were investigated in this study. The conclusions are as follows:
TB17 with a single β phase shows the good ultimate compression strength in the SHPB test. As the strain rate increases from 2000 s−1 to 2800 s−1, the ultimate compression strength increases from 1050 MPa to 1400 MPa. The excellent mechanical properties of the TB17 alloy are mainly affected by the deformation mechanism.
Primary {10 9 3}<331>β type II high-index DT and a small number of α” martensite have been found in all sample. Secondary {332}<113>β deformation twins and α” martensite were identified inside of the primary deformation twins when the strain rates were 2400 s−1 and above. The formation of the secondary twins and martensite can effectively coordinate deformation.
The deformation mechanisms under different strain rates are summarized as follows. Only primary {10 9 3}<331>β type II high-index DTs and a small number of α” martensite were generated as the strain rate was 2000 s−1. Multiple deformation mechanisms, including the primary {10 9 3}<331>β high index deformation twins, secondary {332}β deformation twins (inside of primary deformation twins), and α” martensite were identified when the strain rate was 2400 s−1 and above. TB17 alloys have good ultimate compressive strengths at high strain rates due to their multiple deformation mechanisms.
Supplementary Materials
The following are available online at https://0-www-mdpi-com.brum.beds.ac.uk/2227-9717/9/3/484/s1.
Author Contributions
X.C. designed all the experiments in the article, analyzed the experimental data, wrote the first draft, wrote the comments, and edited the manuscript. X.Z. designed the experiment to help analyze the experimental data. C.C. designed the detection scheme to help analyze the experimental data. K.Z. helped to analyze the experimental data, write comments and edit manuscripts. All authors have read and agreed to the published version of the manuscript.
Funding
This research was funded by the National Natural Science Foundation of China (No. 51871242), Scientific and Technological Innovation Projects of Hunan Province, China (No. 2017GK2292), the National Key R&D Program of China (2018YFB0704100), and Guangdong Province Key-Area Research and Development Program of China (2019B010943001).
Institutional Review Board Statement
Not applicable.
Informed Consent Statement
Informed consent was obtained from all subjects involved in the study.
Data Availability Statement
The data presented in this study are available in this article.
Acknowledgments
The authors would like to acknowledge financial support from the National Natural Science Foundation of China (No. 51871242), Scientific and Technological Innovation Projects of Hunan Province, China (No. 2017GK2292), the National Key R&D Program of China (2018YFB0704100) and the Guangdong Province Key-Area Research and Development Program of China (2019B010943001). The authors also thank the Advanced Research Center of Central South University for performing the HRTEM examinations.
Conflicts of Interest
The authors declare no conflict of interest.
References
- Lutjering, G.; Williams, J.C. Titanium, 2nd ed.; Springer: Berlin/Heidelberg, Germany, 2007. [Google Scholar]
- Cotton, J.D.; Briggs, R.D.; Boyer, R.R.; Tamirisakandala, S.; Russo, P.; Shchetnikov, N.; Fanning, J.C. State of the Art in Beta Titani-um Alloys for Airframe Applications. JOM 2015, 67, 1281–1303. [Google Scholar] [CrossRef] [Green Version]
- Sun, F.; Zhang, J.Y.; Marteleur, M.; Gloriant, T.; Vermaut, P.; Laill, D.; Castany, P.; Curfs, C.; Jacques, P.J.; Prima, F. Investigation of early stage deformation mechanisms in a metastable b titanium alloy showing combined twinning-induced plasticity and transformation-induced plasticity effects. Acta Mater. 2013, 61, 6406–6417. [Google Scholar] [CrossRef] [Green Version]
- Gao, J.; Huang, Y.; Guan, D.; Knowles, A.J.; Ma, L.; Dye, D.; Rainforth, W.M. Deformation mechanisms in a metastable beta titanium twinning induced plasticity alloy with high yield strength and high strain hardening rate. Acta Mater. 2018, 152, 301–314. [Google Scholar] [CrossRef]
- Xu, Y.; Gao, J.; Huang, Y.; Rainforth, W.M. A low-cost metastable beta Ti alloy with high elastic admissible strain and en-hanced ductility for orthopaedic application. J. Alloy. Compd. 2020, 835, 155–391. [Google Scholar] [CrossRef]
- Saito, T.; Furuta, T.; Hwang, J.H.; Kuramoto, S.; Nishino, K.; Suzuki, N.; Chen, R.; Yamada, A.; Ito, K.; Seno, Y.; et al. Multifunctional alloys obtained via a dislocation-free plastic deformation mechanism. Science 2003, 300, 464–467. [Google Scholar] [CrossRef] [Green Version]
- Castany, P.; Gordin, D.M.; Drob, S.I.; Vasilescu, C.; Mitran, V.; Cimpean, A.; Gloriant, T. Deformation Mechanisms and Biocompatibility of the Superelastic Ti–23Nb–0.7Ta–2Zr–0.5N Alloy. Shap. Mem. Superelasticity 2016, 2, 18–28. [Google Scholar] [CrossRef] [Green Version]
- Min, X.; Tsuzaki, K.; Emura, S.; Tsuchiya, K. Enhancement of uniform elongation in high strength Ti–Mo based alloys by combination of deformation modes. Mater. Sci. Eng. A 2011, 528, 4569–4578. [Google Scholar] [CrossRef]
- Xiao, J.F.; Nie, Z.H.; Tan, C.W.; Zhou, G.; Chen, R.; Li, M.R.; Yu, X.D.; Zhao, X.C.; Hui, S.X.; Ye, W.J.; et al. The dynamic re-sponse of the metastable β titanium alloy Ti-2Al-9.2Mo-2Fe at ambient temperature. Mater. Sci. Eng. A 2019, 751, 191–200. [Google Scholar] [CrossRef]
- Matsumoto, H.; Watanabe, S.; Hanada, S. Microstructures and mechanical properties of metastable β TiNbSn alloys cold rolled and heat treated. J. Alloy. Compd. 2007, 439, 146–155. [Google Scholar] [CrossRef]
- Ahmed, M.; Wexler, D.; Casillas, G.; Savvakin, D.G.; Pereloma, E.V. Strain rate dependence of deformation-induced transfor-mation and twinning in a metastable titanium alloy. Acta Mater. 2016, 104, 190–200. [Google Scholar] [CrossRef]
- He, G.; Eckert, J.; Loser, W.; Schultz, L. Novel Ti-base nanostructureedendrite composite with enhanced plasticity. Nat. Mater. 2003, 2, 33–37. [Google Scholar] [CrossRef] [PubMed]
- Zhang, Y.; Liu, H.; Yi, D.; Wang, B.; Jiang, Y.; Hu, T.; Xiao, Y.; Yang, Q.; Wang, J.; Gao, Q. Stress-induced α″ phase in a beta Ti–19Nb–1.5Mo–4Zr–8Sn alloy. Mater. Charact. 2018, 140, 247–258. [Google Scholar] [CrossRef]
- Mantri, S.A.; Sun, F.; Choudhuri, D.; Alam, T.; Gwalani, B.; Prima, F.; Banerjee, R. Deformation Induced Hierarchical Twinning Coupled with Omega Transformation in a Metastable β-Ti Alloy. Sci. Rep. 2019, 9, 1334. [Google Scholar] [CrossRef] [Green Version]
- Yang, H.; Wang, D.; Zhu, X.; Fan, Q. Dynamic compression-induced twins and martensite and their combined effects on the adiabatic shear behavior in a Ti-8.5Cr-1.5Sn alloy. Mater. Sci. Eng. A 2019, 759, 203–209. [Google Scholar] [CrossRef]
- Buzaud, E.; Wang, L.; Liu, A.; Dai, H.; Xu, F.; Min, X.; Cosculluela, A.; Couque, H.; Cadoni, E. Shock-induced Martensite phase trans-formation and its effects of metastable near β Ti-5553 titanium alloy. EPJ Web Conf. 2018, 183, 03029. [Google Scholar]
- Zhang, C.; Mu, A.; Wang, Y.; Zhang, H. Study on Dynamic Mechanical Properties and Constitutive Model Construction of TC18 Titanium Alloy. Metals 2019, 10, 44. [Google Scholar] [CrossRef] [Green Version]
- Antonov, S.; Kloenne, Z.; Gao, Y.; Wang, D.; Feng, Q.; Wang, Y.; Fraser, H.L.; Zheng, Y. Novel deformation twinning system in a cold rolled high-strength metastable-β Ti-5Al-5V-5Mo-3Cr-0.5Fe alloy. Materialia 2020, 9, 100614. [Google Scholar] [CrossRef]
- Bertrand, E.; Castany, P.; Péron, I.; Gloriant, T. Twinning system selection in a metastable β-titanium alloy by Schmid factor analysis. Scr. Mater. 2011, 64, 1110–1113. [Google Scholar] [CrossRef] [Green Version]
- Zhang, Y.J.; Sun, F.; Chen, Z.; Yang, Y.; Shen, B.; Li, J.; Prima, F. Strong and ductile beta Ti–18Zr–13Mo alloy with multimodal twinning. Mater. Res. Lett. 2019, 251, 2166–3831. [Google Scholar] [CrossRef] [Green Version]
- Min, X.H.; Tsuzaki, K.; Emura, S.; Sawaguchi, T.; Ii, S.; Tsuchiya, K. {332} Twinning system selection in a β-type Ti–15Mo–5Zr polycrystalline alloy. Mater. Sci. Eng. A 2013, 579, 164–169. [Google Scholar] [CrossRef]
- Gutierrez-Urrutia, I.; Li, C.L.; Emura, S.; Min, X.; Tsuchiya, K. Study of {332} twinning in a multilayered Ti-10Mo-xFe (x = 1–3) alloy by ECCI and EBSD. Sci. Technol. Adv. Mater. 2016, 17, 220–228. [Google Scholar] [CrossRef] [Green Version]
- Yang, Y.; Castany, P.; Hao, Y.L.; Gloriant, T. Plastic deformation via hierarchical nano-sized martensitic twinning in the met-astable β Ti-24Nb-4Zr-8Sn alloy. Acta Mater. 2020, 194, 27–39. [Google Scholar] [CrossRef]
- Castany, P.; Yang, Y.; Bertrand, E.; Gloriant, T. Reversion of a Parent {130} α” Martensitic Twinning System at the Origin of {332} β Twins Observed in Metastable β Titanium Alloys. Phys. Rev. Lett. 2016, 117, 245501. [Google Scholar] [CrossRef]
- Lai, M.J.; Tasan, C.C.; Raabe, D. On the mechanism of {332} twinning in metastable β titanium alloys. Acta Mater. 2016, 111, 173–186. [Google Scholar] [CrossRef]
- Christian, J.W.; Mahajan, S. Deformation twinning. Prog. Mater. Sci. 1995, 39, 1–157. [Google Scholar] [CrossRef]
- Müllner, P.; Romanov, A. Internal twinning in deformation twinning. Acta Mater. 2000, 48, 2323–2337. [Google Scholar] [CrossRef]
- Yu, Q.; Wang, J.; Jiang, Y.; McCabe, R.J.; Li, N.; Tomé, C.N. Twin-twin interactions in magnesium. Acta Mater. 2014, 77, 28–42. [Google Scholar] [CrossRef]
- Pond, R.; Hirth, J. Topological model of type II deformation twinning. Acta Mater. 2018, 151, 229–242. [Google Scholar] [CrossRef]
Figure 1.
Inverse pole figure(IPF) map and XRD pattern of solution heating sample.

Figure 2.
Curves of (a) strain rate versus time and (b) true stress versus true strain at different split-Hopkinson pressure bar (SHPB) conditions.
Figure 2.
Curves of (a) strain rate versus time and (b) true stress versus true strain at different split-Hopkinson pressure bar (SHPB) conditions.

Figure 3.
XRD patterns of TB17 at different SHPB conditions.

Figure 4.
Electron backscatter diffraction (EBSD) analysis of the S-2000: (a) IPF map; (b) misorientation profile along the black line between A and B in IPF map; (c) misorientation profile along the black line between C and D in IPF map; (d) misorientation profile along the black line between E and F in IPF map; (e) phase map; (f) stereographic projections of matrix near arrow A–B in Figure 4a; (g) stereographic projections of deformation band near arrow A–B in Figure 4a.


Figure 5.
TEM analysis of the S-2000 sample: (a) bright-field TEM image; (b) selected area electron diffraction (SAED) pattern along near the [110] zone axis; (c) dark-field TEM image of primary {10 9 3}β twinning relation between the matrix and primary twinning; (d) schematic of the diffraction spot of primary {10 9 3}β twinning; (e) dark-field TEM image of ω phase obtained from the green circle in (b).

Figure 6.
EBSD analysis of the S-2400 sample: (a) IPF map; (b) Image Quality(IQ) map; (c) highlighted IQ map in (b).
Figure 6.
EBSD analysis of the S-2400 sample: (a) IPF map; (b) Image Quality(IQ) map; (c) highlighted IQ map in (b).

Figure 7.
TEM analysis of the S-2400 sample: (a) bright-field TEM image; (b) SAED pattern along the [110] zone axis; (c) dark-field TEM image of the primary {10 9 3}β twinning relation between the β matrix and primary twinning; (d) schematic of diffraction spots of the β matrix primary deformation structure; (e) dark-field TEM image of the second {332}β twinning relation between the primary twinning and second twinning; (f) schematic of diffraction spots of the secondary deformation structure.

Figure 8.
EBSD analysis of the S-2400 sample: (a) IPF map; (b) IQ map; (c) phase map; (d) IPF map; (e) IQ map; (f) phase map; (g) twinning and α” martensite schematic diagram.
Figure 8.
EBSD analysis of the S-2400 sample: (a) IPF map; (b) IQ map; (c) phase map; (d) IPF map; (e) IQ map; (f) phase map; (g) twinning and α” martensite schematic diagram.

Figure 9.
EBSD analysis of the S-2800 sample: (a) IPF map; (b) IQ map; (c) phase map.

Figure 10.
Schematic diagram of the sample after the SHPB test: (a) S-2000 sample; (b) S-2400 sample; (c) S-2800 sample.
Figure 10.
Schematic diagram of the sample after the SHPB test: (a) S-2000 sample; (b) S-2400 sample; (c) S-2800 sample.

Publisher’s Note: MDPI stays neutral with regard to jurisdictional claims in published maps and institutional affiliations. |
© 2021 by the authors. Licensee MDPI, Basel, Switzerland. This article is an open access article distributed under the terms and conditions of the Creative Commons Attribution (CC BY) license (http://creativecommons.org/licenses/by/4.0/).
Share and Cite
MDPI and ACS Style
Chen, X.; Zhang, X.; Chen, C.; Zhou, K. Mechanical Response and Deformation Mechanisms of TB17 Titanium Alloy at High Strain Rates. Processes 2021, 9, 484. https://0-doi-org.brum.beds.ac.uk/10.3390/pr9030484
AMA Style
Chen X, Zhang X, Chen C, Zhou K. Mechanical Response and Deformation Mechanisms of TB17 Titanium Alloy at High Strain Rates. Processes. 2021; 9(3):484. https://0-doi-org.brum.beds.ac.uk/10.3390/pr9030484
Chicago/Turabian StyleChen, Xinchi, Xiaoyong Zhang, Chao Chen, and Kechao Zhou. 2021. "Mechanical Response and Deformation Mechanisms of TB17 Titanium Alloy at High Strain Rates" Processes 9, no. 3: 484. https://0-doi-org.brum.beds.ac.uk/10.3390/pr9030484
Note that from the first issue of 2016, this journal uses article numbers instead of page numbers. See further details here.