
Optimization and Validation of Rancimat Operational Parameters to Determine Walnut Oil Oxidative Stability


Department of Biological & Agricultural Engineering, University of California, Davis, One Shields Ave., Davis, CA 95616, USA
*
Author to whom correspondence should be addressed.
Processes 2021, 9(4), 651; https://0-doi-org.brum.beds.ac.uk/10.3390/pr9040651
Submission received: 25 March 2021
/
Revised: 2 April 2021
/
Accepted: 6 April 2021
/
Published: 8 April 2021
(This article belongs to the Special Issue Extraction and Fractionation Processes of Functional Components in Food Engineering)
Abstract
:This study was performed to optimize and validate Rancimat (Metrohm Ltd., Herisau, Switzerland) operational parameters including temperature, air-flow, and sample weight to minimize Induction-Time (IT) and IT-Coefficient-of-Variation (CV), using Response Surface Methodology (RSM). According to a Box–Behnken experimental design, walnut oil equivalent to 3-, 6-, or 9-g was added to each reaction vessel and heated to 100, 110, or 120 °C, while an air-flow equal to 10-, 15-, or 20-L·h−1 was forced through the reaction vessels. A stationary point was found per response variable (IT and CV), and optimal parameters were defined considering the determined stationary points for both response variables at 100 °C, 25 L·h−1, and 3.9 g. Optimal parameters provided an IT of 5.42 ± 0.02 h with a CV of 1.25 ± 0.83%. RSM proved to be a useful methodology to find Rancimat operational parameters that translate to accurate and efficient values of walnut oil IT.
1. Introduction
Oxidative deterioration, commonly known as lipid oxidation or rancidity, causes off-flavors, discoloration, unpleasant odors, and decreases edible oil nutritional value. Lipid oxidation is a problem of economic concern to the walnut industry, as it decreases the nuts positive quality characteristics (e.g., flavor, smell, and color) and shortens their shelf life [1]. Walnuts are particularly susceptible to oxidation-induced rancidity because of their high oil content (60 to 70%) and elevated content (~70%) of polyunsaturated fatty acids (PUFA), such as linoleic (56.5–57.5%) and linolenic (11.6–13.2%) fatty acids, and monounsaturated (~21%) fatty acids, mainly composed by including oleic acid (21.0–21.2%) [2,3]. Nuts with lower PUFA content have a longer shelf life [4] like hazelnut and macadamia, which contain around 13.6% and 3.7%, respectively [5].
In order to evaluate rancidity in walnut oil, extracted from fresh walnut kernels, it is necessary to determine the oil oxidative stability. Walnut rancidity in fresh walnut samples is highly variable [6]. Therefore, it is preferred to estimate the oil rancidity, instead of its corresponding fresh ground samples, as oil is a better and more uniform representation of a large batch of walnuts. The quantification of free fatty acids (FFA) and peroxides or peroxide value (PV), p-Anisidine, and test of thiobarbituric acid (TBA) are important measurements that have been used for decades to evaluate oil oxidative stability [1]. However, these tests provide information regarding a temporal fat oxidative state, and rely on the use of toxic solvents [7] and manual titration that may lead to erroneous results [8,9]. Considering that lipid oxidation is a dynamic process, a forward path in directly evaluating rancidity is to use an accelerated oxidation method to determine the lipid’s relative oxidative stability, also known as the Induction Time (IT), which is defined as the resistance of lipids to be oxidized [9]. The Rancimat equipment is widely used by the edible and pharmaceutical oils industries, as it does not require the use of hazardous materials and intensive labor in comparison to other accelerated oxidation methods, such as the Active Oxygen Method (AOCS Method Cd 12-57) [9,10].
The Rancimat equipment (Metrohm Ltd., Herisau, Switzerland) automatically determines the IT by measuring conductivity changes as volatile compounds are generated through an accelerated oxidation method or aging test. The Rancimat accelerated oxidation method consists of exposing an oil sample to a constant high temperature (between 50 and 200 °C), and airflow (between 1 and 25 L·h−1) to guarantee a sufficient oxygen supply to rapidly induce lipid oxidation. Operational parameters are typically established by the Rancimat equipment manufacturer, suggesting that parameters to estimate walnut oil IT are 3 g of sample, using a temperature of 110 °C, and an airflow equal to 20 L·h−1 [11]. Nonetheless, others studies that have evaluated walnut oil IT, using the Rancimat equipment, have used a broad range of sample weights (2.5 to 5 g), temperatures (100 to 110 °C), and airflows (15 to 20 L·h−1) [2,4]. Unfortunately, none of the previous studies including the suggested manufacturer parameters properly describe how the operational parameters were optimized and validated. Therefore, results are widely variable, inconsistent, and incomparable. Therefore, there is a clear need to accurately describe how walnut Rancimat equipment IT determination can be optimized and validated, as described in this study. Additionally, there are currently no studies properly describing the effect of differences in the Rancimat operational parameters in the IT determination. This study provides an in-depth understanding of this effect, providing valuable information to those in need of properly estimating walnut oil oxidative stability.
Response Surface Methodology (RSM) is a multivariate statistic technique used to develop and improve processes in which several input variables may have an effect in the process performance and output [12]. RSM statistical designs offer quadratic response surfaces, which include central composite, Doehlert matrix, three level full factorial, and Box–Behnken designs. Overall, the Box–Behnken design has proven to be one of the most efficient, as it requires a fewer number of experiments than the minimum required for a complete three level factorial design [13]. By using Box–Behnken experimental design, Donis-González, Guyer [14] successfully optimized the computed tomography image scanning parameters (voltage, current, and slice thickness) to predict chestnut (Castanea spp.) internal quality. Rodríguez-González, Femenia [15] also used a Box–Behnken experimental design to resolve the parameters (plant age, pasteurization temperature, and time) that maximized alcohol swelling, water retention capacity, and fat absorption capacity of Aloe vera as a polysaccharide-rich food ingredient extract.
Therefore, the objective of this study was to use the RSM statistical technique in combination with a Box–Behnken experimental design to optimize and validate the Rancimat operational parameters (sample weight, temperature, and airflow), and establish a standard for future walnut oil IT estimations. The goal was to minimize the IT Coefficient-of-Variation (CV) within the same oil sample, and report the yielded IT measurements. A minimized CV within the same oil is reflected as a minimum error in IT estimation.
2. Materials and Methods
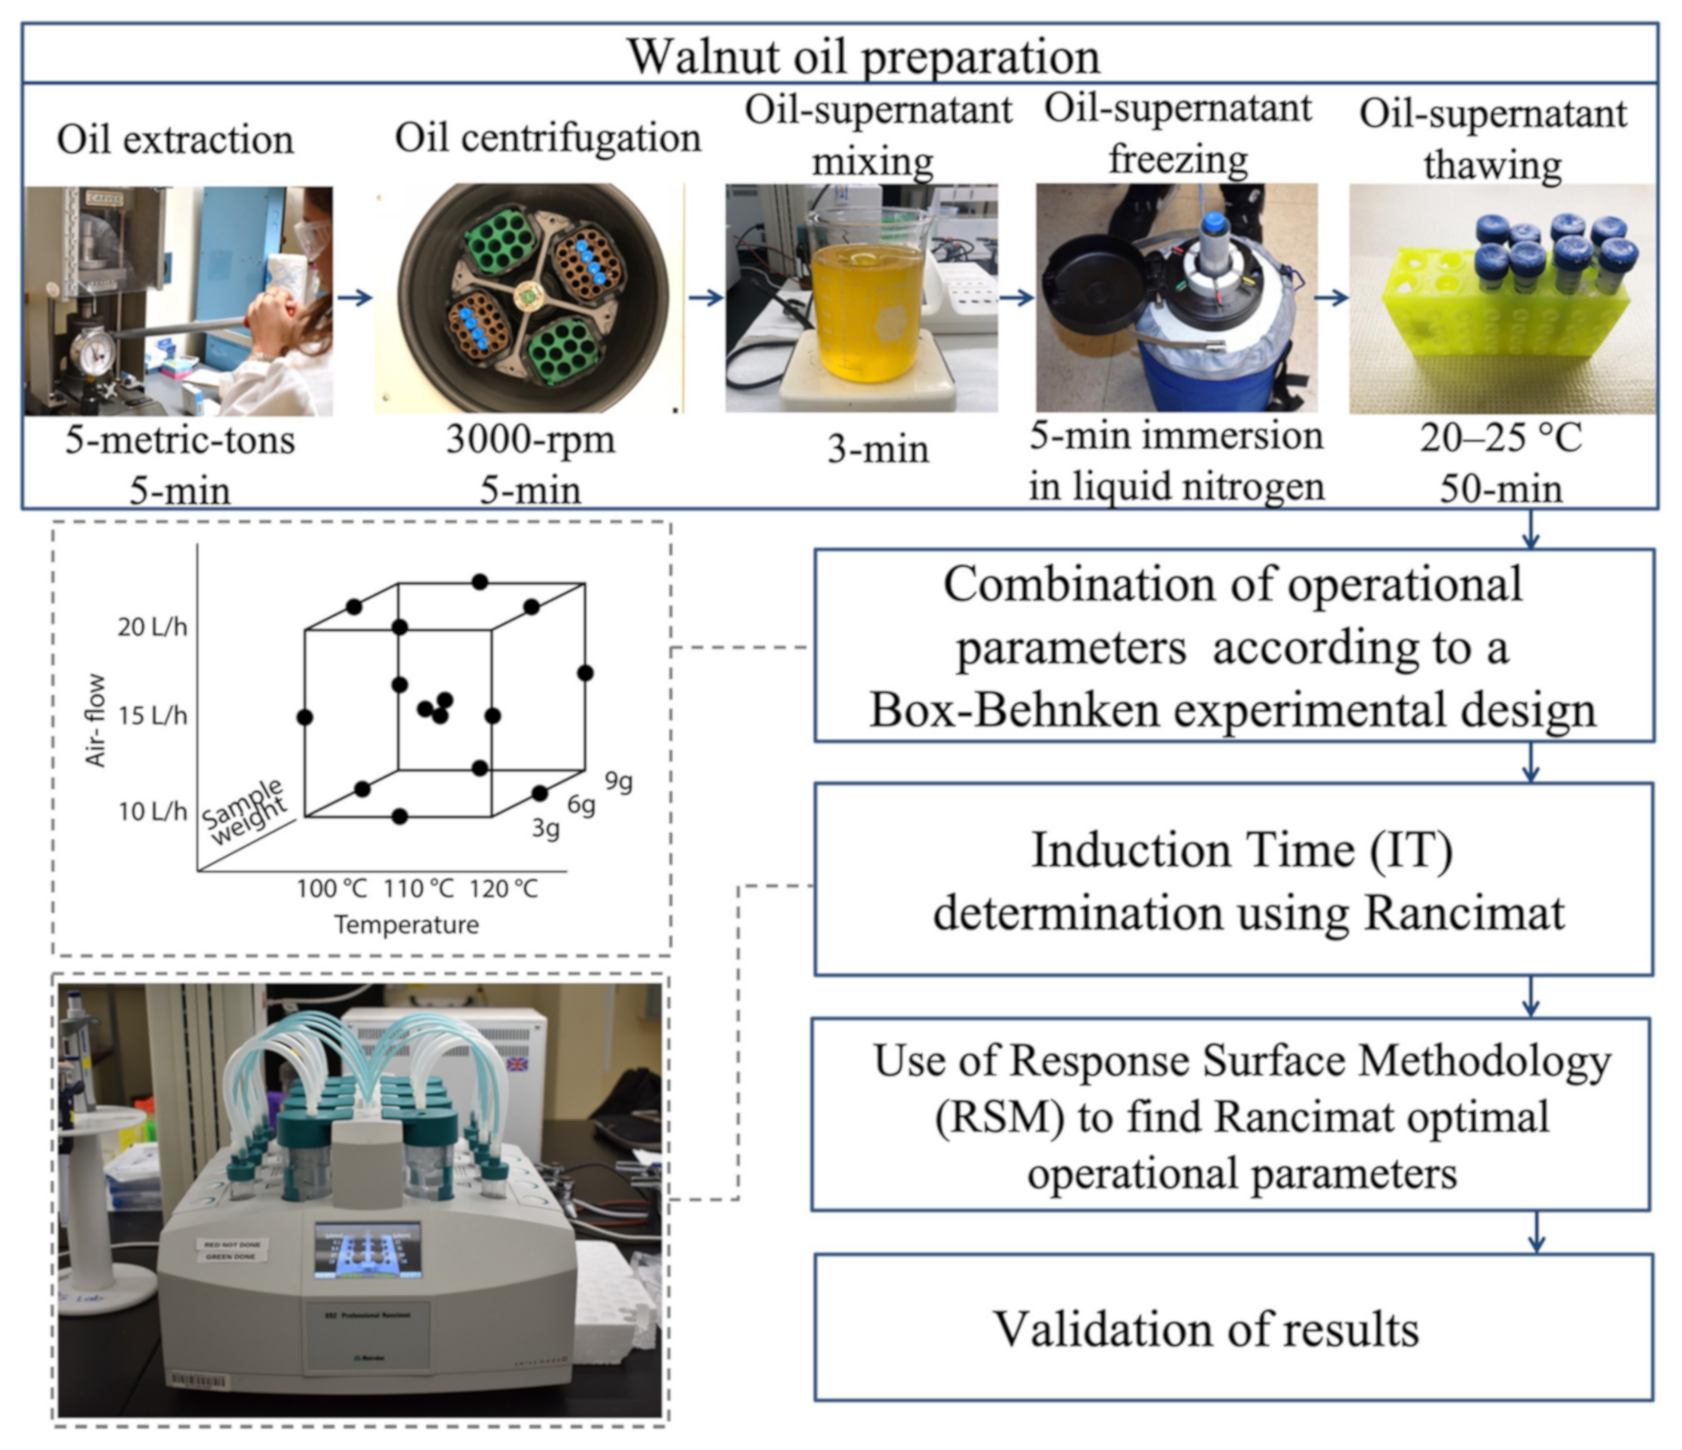
Figure 1 shows a schematic representation of the methodology followed in this study.
2.1. Walnut Collection, Oil Extraction and Storage
Walnuts (Juglans regia L.) var. “Howards” and “Tulare” were collected during the 2017 harvesting season from two walnut hullers/driers located at Meridian and Visalia, California. Walnuts were dehydrated in a six-column convective dryer at 43 °C for 48 h, to achieve an in-shell moisture content of around 6 to 8% wet basis (MCwb), as specified by Khir, Pan [16]. In-shell walnuts were stored in burlap bags at ambient conditions (8–20 °C, and 53–93% relative humidity) for six months, before oil extraction.
Six kg of walnuts were manually shelled using a walnut cracker, and shells were disposed of. Walnut kernels were placed inside Ziploc bags, manually crushed with a hammer, and strained through a 1.70 mm sieve. Forty g batches of the crushed walnut kernels retained on a secondary sieve (710 µm) were placed in a stainless-steel oil extraction cylinder (5.7 cm diameter by 7.6 cm height) to extract their oil. Walnut oil was extracted using a Carver Press Model 3351 by applying a constant force of 5 metric tons (MT) for 5 min (Carver Inc., Wabash, IN, USA). On average, 15 mL of walnut oil were collected per batch in a stainless-steel pan.
For this study, oil extraction was repeated for approximately 70 batches, producing a total of 1 L of oil. The extracted oil was divided into 50 mL centrifuge tubes, and centrifuged at 3000 rpm for 5 min to precipitate the solid particles from the supernatant. Oil supernatant was collected to avoid the potential influence of solid particles on IT estimation. To ensure uniformity, the oil was poured in a 2 L glass beaker and stirred for 3 min on a stirring plate. Thereafter, the walnut oil was divided into 15 mL polypropylene vials and immediately immersed in liquid nitrogen for 5 min and stored at −80 °C for further analysis.
2.2. Optimization of Rancimat Operational Parameters (Independent Variables) Using Response Surface Methodology (RSM) and Box-Behnken Experimental Design
RSM using a three factor, three level Box–Behnken statistical design was used to optimize the Rancimat operational parameters (sample weight, temperature, and airflow) by maximizing the CV−1 [14]. In parallel, a model for the effect of operational parameters on the IT was also generated. The latter was performed to offer an in-depth understanding of the effect of optimized operational parameters in the walnut oil IT, and their implementation feasibility. R (V1.3.1093, R Development, Core Team, Vienna, Austria) software was used to develop the models. The models with coded-factors for the experimental design is described in Equation (1).
where the index n in Y refers to each response (dependent) variable (Y1 = CV−1 and Y2 = IT); is the regression intercept; through are the regression coefficients; and X1, X2, and X3 are the Rancimat operational parameters (sample weight, temperature, and airflow) or independent variables [12].
Yn = b0 + b1X1 + b2X2 + b3X3 + b12X1X2 + b13X1X3 + b23X2X3 + b11 X12 + b22X22 + b33X32
2.3. Walnut Oil IT and CV (RSM Models Dependent Variables)
Walnut oil IT was evaluated using a Metrohm Rancimat Model 892 (Metrohm Ltd., Herisau, Switzerland). Eight vials containing walnut oil were removed at a time from storage (−80 °C), as this is the maximum number of samples that Rancimat can analyze at the same time. Before analysis, closed vials were thawed at room temperature (between 20 to 25 °C) for approximately 50 min. According to the Box–Behnken experimental design (Table 1a,b), walnut oil equivalent to 3, 6, or 9 g was added to each reaction vessel, and heated to 100, 110, or 120 °C, while 10, 15, or 20 L·h−1 of filtered air was forced through the oil within the reaction vessels. Each operational parameter combination (run) was carried out in triplicate (n). Glass and plastic vessels were used and cleaned as described by the Rancimat manufacturer Metrohm [17]. The IT CV was calculated per run, as specified in Farhoosh [18], using Equation (2).
where CV is the Coefficient-Of-Variation of the IT measurements per run (Table 1b), and n is the number of replications per run (3).
Values for the CV were expected to be near zero, as the oil samples and corresponding replicates were obtained from the same batch of oil and were exposed to the same handling and storage conditions. To facilitate data visualization and statistical analysis, the response variable (CV) was inversed (CV−1).
2.4. Validation of Optimal Rancimat Operational Parameters
To validate the RSM model optimization results, an independent test was ran, in duplicate, using the optimized operational parameters (sample weight, temperature, and airflow) that correspond to the RSM stationary point as the CV−1 was maximized (validations-1). In addition, an independent test was run, in duplicate, after the effect of the optimized parameters onto the IT were considered (validations-2).
The same walnut oil was used to optimize and perform model validation-1 and -2. Ultimately, a paired t-test at 95% confidence was performed to evaluate if there was a significant difference in the CV and IT between validation-1 and -2. R (V1.3.1093, R Development, Core Team, Vienna, Austria) software was used to perform the t-test.
3. Results and Discussion
3.1. Optimization of Rancimat Operational Parameters (Independent Variables)
As shown in Table 2, the results for the lack of fit test were non-significant (p-value > 0.05), suggesting that for each model (RSM for CV−1 and IT), the second order non-linear models adequately described the relationship between the operational parameters (sample weight, temperature, and airflow) and the response variables (IT and CV−1) [12]. This is an indicator that the RSM stationary points are relevant and models were properly developed [19].
The regression coefficients for the CV−1 optimization model (Table 2) suggested that none of the operational parameters (sample weight, temperature, and airflow) or interaction of these significantly contributed to the model, as the p-values for all terms were significant (p-values ≤ 0.05). The mathematical relationship between the response (dependent variable) and operational parameters can be understood by interpreting the regression coefficients of the polynomial equation (Table 2) [14]. The coefficients represent the expected change in the response per unit change in each operational parameter (independent variable), when the remaining operational parameters are held constant [12].
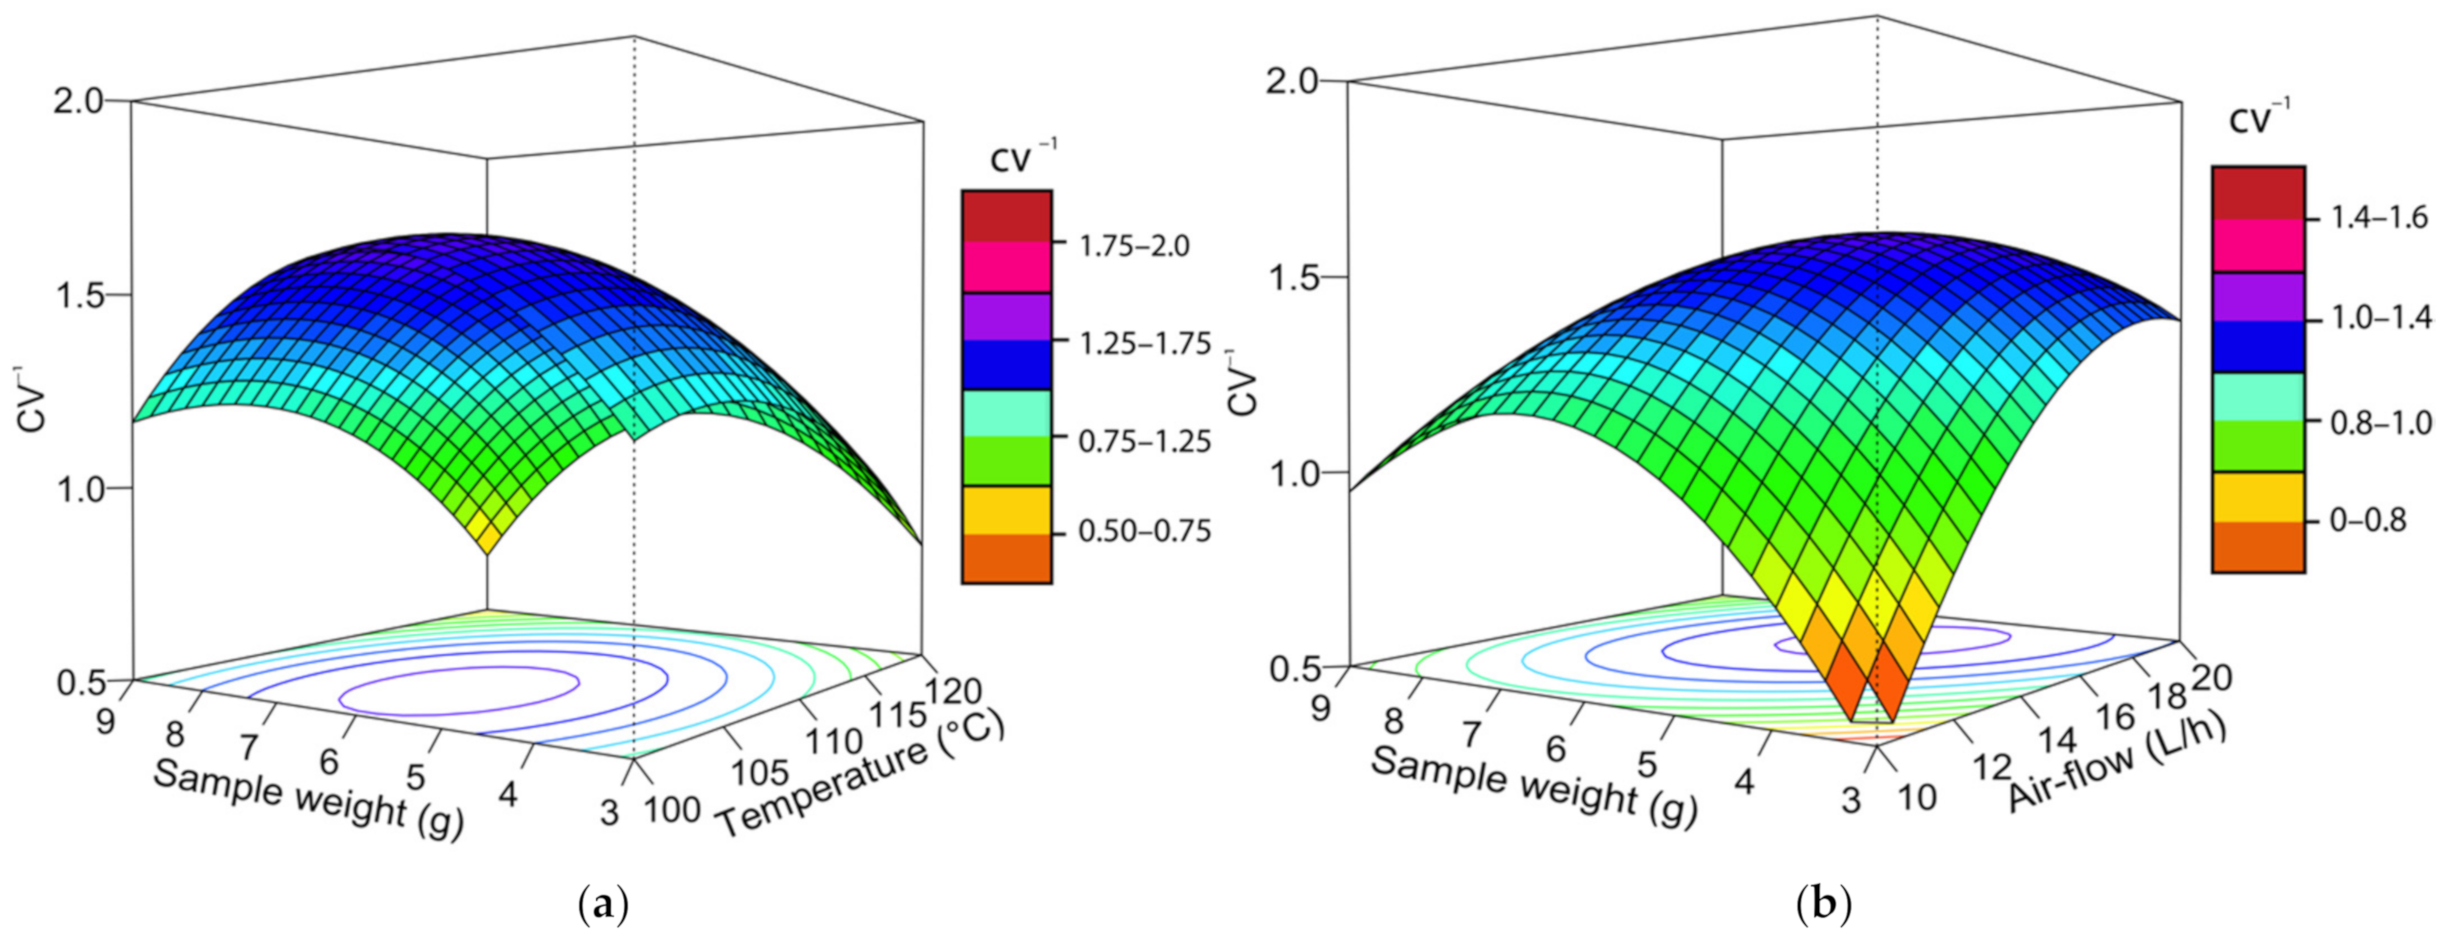
Table 3 displays the results of ANOVA for the CV−1 model, where an R2 of 57.8% and an R2adj of −12.4% were obtained. According to Myers, Montgomery [12], when R and R2adj differ dramatically, there is a high probability that non-significant terms have been included into the model [12]. The fact that none of the regression coefficients were significant could explain why R2 and R2adj values differ substantially. The previous also indicates that the CV is highly variable within the range of evaluated parameters. Table 3 shows that for the CV−1 model none of the linear, quadratic, and polynomial order terms were significant as the three terms yielded a p-values > 0.05. This confirms that none of the operational parameters significantly contributed to the CV−1 model, and reiterates that the Rancimat equipment performs with high accuracy and consistency, regardless of operational parameters setup [12]. Nevertheless, a CV−1 maximum stationary point was discerned, as an indicator of low variation within a specific range of operation parameters, as three negative eigenvalues were obtained (Table 4) [12]. The optimized response (lowest variation) for CV−1 was established at 3.9 g for sample weight, 85.5 °C for temperature, and 26.7 L·h−1 for airflow. The stationary point for sample weight was inside the experimental region, while the stationary points for temperature and airflow were outside the experimental region. In RSM, it is possible to find a stationary point that is beyond the experimental region. This is called a rising or falling ridge. Therefore, if possible, further experiments need to be explored following the ridge path.
The surface regression plots in Figure 2a–c show that at a lower temperature and higher airflow, the CV−1 increases, therefore decreasing the CV. This indicates that the conditions under which walnut oil oxidizes are more variable as temperature increases and airflow decreases [18]. A rising ridge in the direction of a lower temperature and a higher airflow can also be observed, indicating further analysis must be performed on those directions [12,19]. However, the maximum airflow set point for the Rancimat equipment is 25 L·h−1 and it is impossible to perform studies above that value. Regardless, this study demonstrated that at the optimized stationary point for a high sample weight (3.9 g), low temperature (85.5 °C), and high airflow (26.7 L·h−1) air has the potential to evenly saturate the walnut oil, yielding a less variable IT [18]. This result agrees with the reported by Farhoosh [18], and Jebe and Matlock [20] that concluded that a reduction in temperature leads to a decrease in the IT CV.
If optimized conditions to minimize the CV are considered, it can be predicted that the IT will equal 21.31 ± 0.80 h. The previous was concluded, based on the generated IT model, as the IT at the lowest evaluated temperature (100 °C) equaled 5.33 ± 0.20 h. IT at the optimized conditions, which reflects the time of each test, is high and not practical for researcher and industrial application, especially as many samples need to be evaluated at once. In addition; even though a stationary point for the CV−1 optimized model was resolved, because none of the operational parameters (sample weight, temperature, and airflow) or interaction of these significantly contributed to the model, it is required to further explore the effect of operation parameters on the IT model.
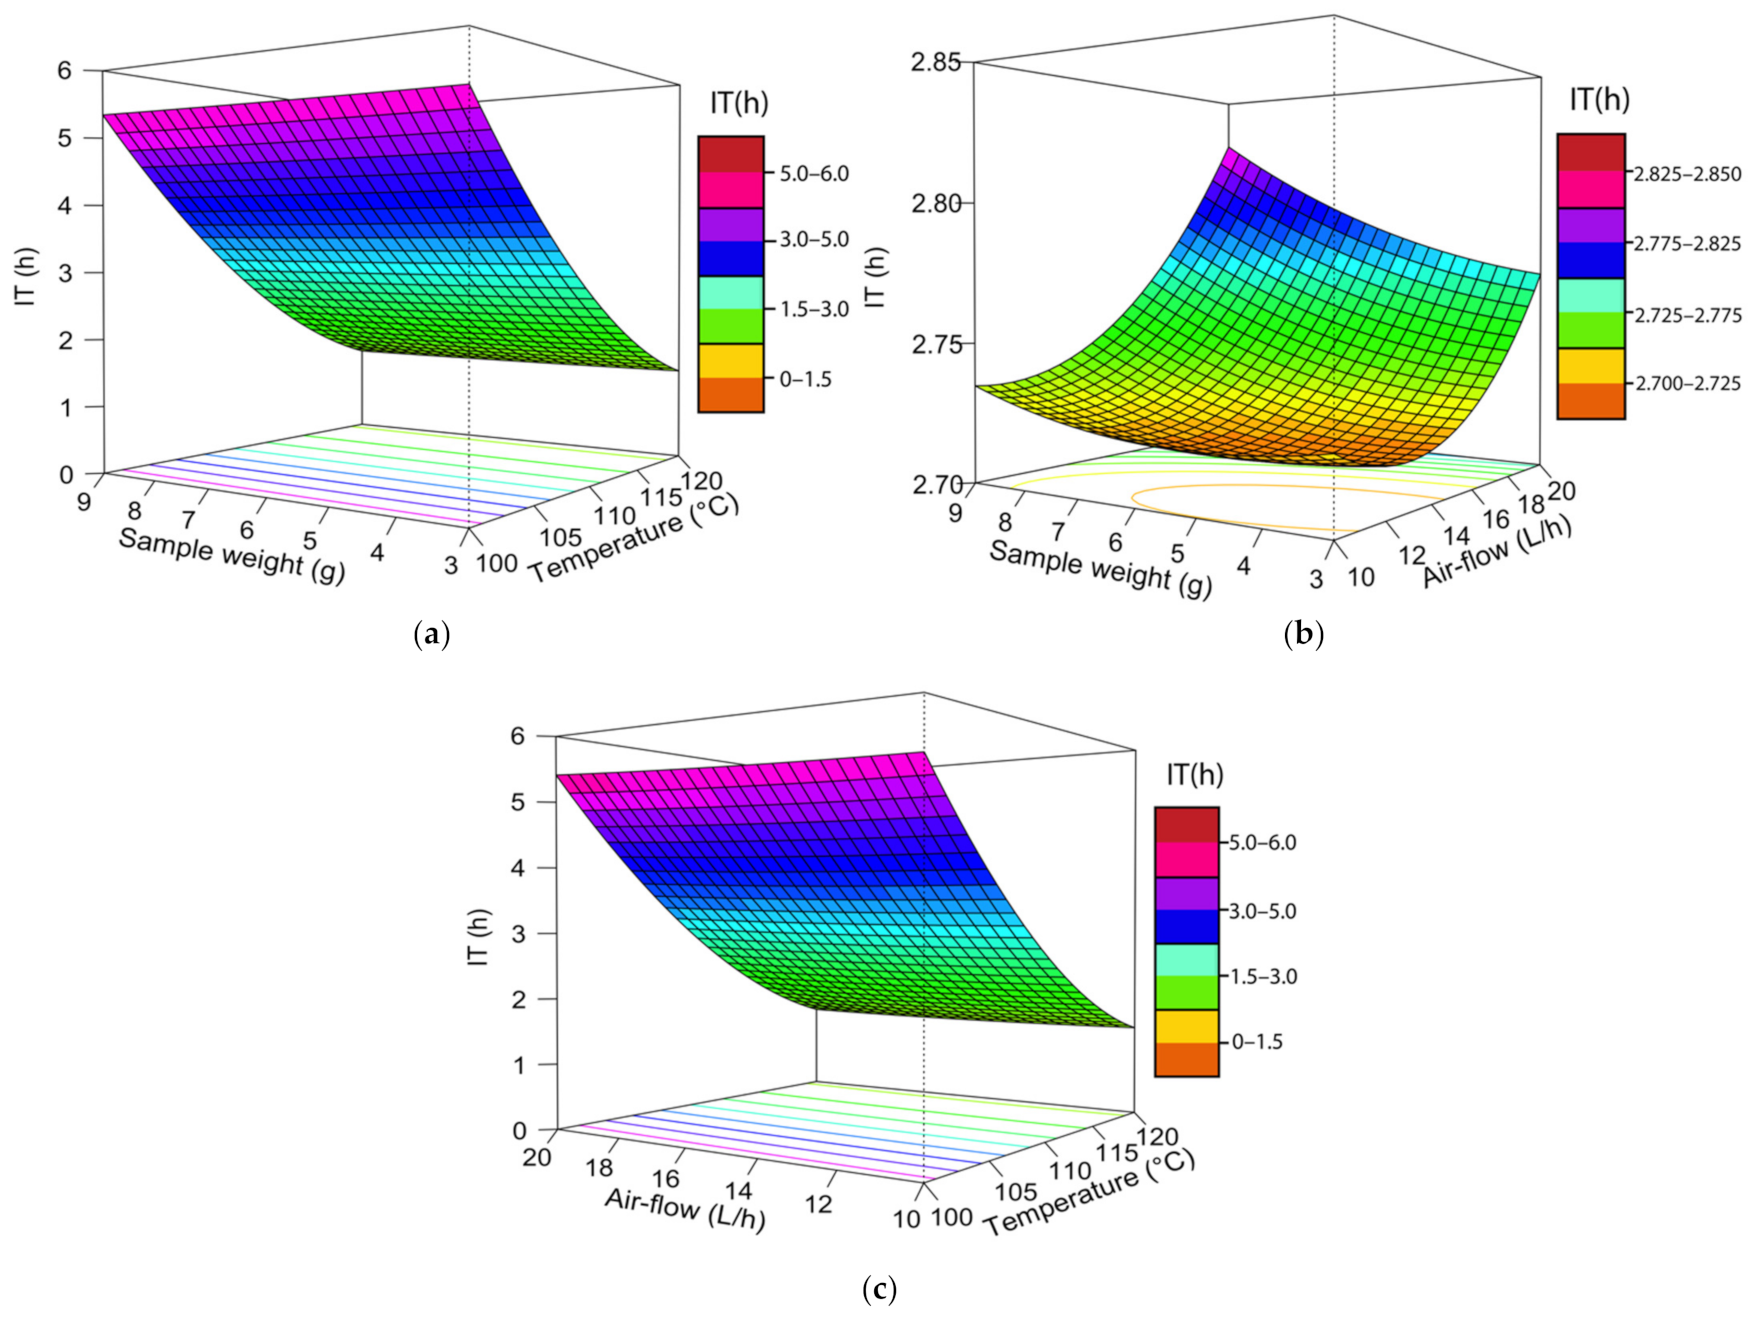
Regarding the IT model, the p-value for the temperature regression coefficient was <0.05, suggesting that the effect of temperature in the IT was statistically significant. Sample weight, and airflow appeared to be non-significant, and no interaction of parameters was significant (p-value > 0.05). The temperature regression coefficient yielded a negative value, indicating that temperature has an antagonistic effect in the response, or the IT significantly decreases at a higher temperature. The IT response surface plots (Figure 3a–c) visually confirm that temperature was the only variable that significantly affected the IT, and that the IT decreases with an increase in temperature. This behavior was expected, as it is known that the rate of an oxidation reaction is exponentially related to temperature [9,21]. These results coincided with those obtained by [10,18,21], who found a similar relationship between the IT and temperature.
The results of the ANOVA for IT are shown in Table 3. It was determined that the R2 and R2adj (adjusted for degrees of freedom) were 99.9% and 99.8%, respectively. This means that the operational parameters (sample weight, temperature, and airflow) significantly explained the variation in the IT [14]. Moreover, the p-value for the first and polynomial order terms were <0.05. Therefore, the hypothesis that none of the parameters significantly contribute to the model was rejected [12]. In other words, the canonical analysis or relationship between the response and operational parameters was relevant [12,14].
For the IT model, a ridge is present in the sample weight equal to 2.8 g, and a temperature of 125.9 °C, advising that sample sizes below 2.8 g, and temperatures above 125.9 °C should be explored. The Rancimat upper achievable temperature limit is 120 °C; therefore, it is not possible to perform an experiment at temperatures above 125.9 °C. Moreover, previous studies have determined that temperature stabilization is unreliable at a sample below 2.5 g. It is hypothesized that air-saturation cannot be maintained for a low sample weight, when exposed to high airflow rates [10,20]. Figure 3b shows that the IT increases from 2.72 to 2.82 h, as the sample weight and airflow increase to their maximum values. A potential reason is that as the sample weight increases, the airflow becomes limited, making it impossible to maintain the air-saturated conditions, as required to uniformly induce the oil oxidation [10]. For these reasons, it was concluded that exploring additional conditions for the IT model was not feasible and will not lead to a significant improvement. Hence, if only the IT model was to be considered, the IT would be at its minimum when a sample weight, temperature, and airflow equaled 2.8 g, 125.9 °C, and 17.4 L·h−1, respectively.
Studying and analyzing the relationship between operation parameters on both response variables (CV−1 and IT) was crucial to properly optimize the Rancimat method to accurately and feasible evaluate walnut oil IT. Optimized operational parameters need to consider the Rancimat equipment capabilities, and analysis time, while minimizing the IT CV (model that maximizes the CV−1). Therefore, final optimized parameters for sample weight, temperature, and airflow were established at 3.9 g, 100 °C, and 25 L·h−1, respectively (Table 4). Table 4, shows that the final optimized parameters are close to the arithmetic mean of operational parameters that minimize the IT, which ultimately defines the sample analysis time, and maximize the CV−1 (sample weight = 3.3 g, temperature = 105 °C, and airflow = 22 L·h−1). As it was determined through the IT RSM model that the sample weight and airflow do not have a significant effect on the IT, values for these two parameters were selected whenever they minimize the CV, while falling within the experimental region and the Rancimat equipment capabilities.
3.2. Validation of optimal Rancimat Operational Parameters
As shown in Table 5, a CV of 0.966 ± 0.851%, and an IT of 16.261 ± 0.360 h were observed, when applying the operational parameters that exclusively maximized the CV−1 (validation-1). On the other hand, the final operational parameters yielded a CV and an IT equal to 1.259 ± 0.838 and 5.421 ± 0.016, respectively. The CV obtained in validation-1 and validation-2 were not significantly different (p-value > 0.05, df = 1.99, t-statistic = −0.34), while the IT was significantly different (p-value ≤ 0.05, df = 1.00, t-statistic = 42.46). These results are illustrated in Figure 4. The IT from validation-2, is approximately a third of the IT from validation-1, without significantly increasing the results variability (CV). A lower IT, as observed in the final operational parameters, represents an advantage as a significantly larger number of samples can be evaluated within the same timeframe.
4. Conclusions
Using the second-order RSM prediction models for each individual response variable (CV−1 and IT) yielded an optimized combination of Rancimat operational parameters for sample weight, temperature, and airflow equal to 3.9 g, 100 °C, and 25 L-h−1, respectively. Final operational parameters yielded a CV of 1.259 ± 0.838%, and IT of 5.421 ± 0.016 h. RSM proved to be a useful methodology to properly optimize the Rancimat operational parameters (sample weight, temperature, and air flow) that allow us to precisely, accurately, and efficiently determine walnut oil IT. Choosing the appropriate temperature level is pivotal in determining walnut oil IT using the Rancimat equipment, while the airflow rate and sample size proved to not have a significant effect.
Even though the Rancimat equipment evaluates the relative oxidative stability of walnut oil, the application of the optimized operational parameters, as a standard method for future walnut oil IT determination, can lead to comparable results between studies. In addition, having access to a reliable and accurate method of determining walnut rancidity will facilitate the application of alternative postharvest and food processing techniques to improve walnut quality, lipid stability, and nutritional value.
Supplementary Materials
The following are available online at https://0-www-mdpi-com.brum.beds.ac.uk/article/10.3390/pr9040651/s1.
Author Contributions
Experimental studies, investigation, validation, and writing—original draft preparation, L.F.-P.; conceptualization, methodology, funding acquisition, writing—review and editing, I.R.D.-G. Both authors have read and agreed to the published version of the manuscript.
Funding
This research was funded by the California Walnut Board and Commission.
Institutional Review Board Statement
Not applicable.
Informed Consent Statement
Not applicable.
Data Availability Statement
The data presented in this study is available in the section “Supplementary Material”.
Conflicts of Interest
The authors declare no conflict of interest.
References
- Miraliakbari, H.; Shahidi, F. Oxidative stability of tree nut oils. J. Agric. Food Chem. 2008, 56, 4751–4759. [Google Scholar] [CrossRef] [PubMed]
- Oliveira, R.; Rodrigues, M.F.; Bernardo-Gil, M.G. Characterization and supercritical carbon dioxide extraction of walnut oil. J. Am. Oil Chem. Soc. 2002, 79, 225–230. [Google Scholar] [CrossRef]
- Maguire, L.S.; O’Sullivan, S.M.; Galvin, K.; O’Connor, T.P.; O’Brien, N.M. Fatty acid profile, tocopherol, squalene and phytosterol content of walnuts, almonds, peanuts, hazelnuts and the macadamia nut. Int. J. Food Sci. Nutr. 2004, 55, 171–178. [Google Scholar] [CrossRef] [PubMed]
- Savage, G.; Dutta, P.; McNeil, D. Fatty acid and tocopherol contents and oxidative stability of walnut oils. J. Am. Oil Chem. Soc. 1999, 76, 1059–1063. [Google Scholar] [CrossRef]
- Madawala, S.; Kochhar, S.; Dutta, P. Lipid components and oxidative status of selected specialty oils. Int. J. Fats Oils 2012, 63, 143–151. [Google Scholar] [CrossRef] [Green Version]
- Greve, L.C.; Labavitch, J.M. Development of rancidity in walnuts. Walnut Res. Rep. Walnut Mktg. Board Sacram. Calif. 1985, 245, 235. [Google Scholar]
- Mahesar, S.A.; Sherazi, S.T.H.; Khaskheli, A.R.; Kandhro, A.A.; Uddin, S. Analytical approaches for the assessment of free fatty acids in oils and fats. Anal. Methods 2014, 6, 4956–4963. [Google Scholar] [CrossRef]
- Kwon, C.W.; Park, K.-M.; Park, J.W.; Lee, J.; Choi, S.J.; Chang, P.-S. Rapid and Sensitive Determination of Lipid Oxidation using the reagent kit based on spectrophotometry (FOODLABfat System). J. Chem. 2016, 2016, 1–6. [Google Scholar] [CrossRef] [Green Version]
- Läubli, M.W.; Bruttel, P.A. Determination of the oxidative stability of fats and oils: Comparison between the active oxygen method (AOCS Cd 12-57) and the Rancimat method. J. Am. Oil Chem. Soc. 1986, 63, 792–795. [Google Scholar] [CrossRef]
- Pawar, N.; Purohit, A.; Gandhi, K.; Arora, S.; Singh, R. Effect of operational parameters on determination of oxidative stability measured by rancimat method. Int. J. Food Prop. 2014, 17, 2082–2088. [Google Scholar] [CrossRef]
- Metrohm. Oxidation Stability of Walnut Oil. Available online: https://www.metrohm.com/en-us/applications/AN-R-013 (accessed on 25 March 2020).
- Myers, R.H.; Montgomery, D.C.; Anderson-Cook, C.M. Response Surface Methodology: Process and Product Optimization Using Designed Experiments; John Wiley & Sons: Hoboken, NJ, USA, 2016. [Google Scholar]
- Ferreira, S.C.; Bruns, R.; Ferreira, H.; Matos, G.; David, J.; Brandão, G.; Da Silva, E.; Portugal, L.; Dos Reis, P.; Souza, A.; et al. Box-Behnken design: An alternative for the optimization of analytical methods. Anal. Chim. Acta 2007, 597, 179–186. [Google Scholar] [CrossRef] [PubMed]
- Donis-González, I.R.; Guyer, D.E.; Pease, A. Application of Response Surface Methodology to systematically optimize image quality in computer tomography: A case study using fresh chestnuts (Castanea spp.). Comput. Electron. Agric. 2012, 87, 94–107. [Google Scholar] [CrossRef]
- Rodríguez-González, V.; Femenia, A.; Minjares-Fuentes, R.; González-Laredo, R.F. Functional properties of pasteurized samples of Aloe barbadensis Miller: Optimization using response surface methodology. Lwt-Food Sci. Technol. 2012, 47, 225–232. [Google Scholar] [CrossRef]
- Khir, R.; Pan, Z.; Atungulu, G.G.; Thompson, J.F.; Shao, D. Size and moisture distribution characteristics of walnuts and their components. Food Bioprocess Technol. 2013, 6, 771–782. [Google Scholar] [CrossRef]
- Metrohm. 892 Professional Rancimat Manual M; Metrohm AG: Herisau, Switzerland, 2017. [Google Scholar]
- Farhoosh, R. The effect of operational parameters of the Rancimat method on the determination of the oxidative stability measures and shelf-life prediction of soybean oil. J. Am. Oil Chem. Soc. 2007, 84, 205–209. [Google Scholar] [CrossRef]
- Lenth, R.V. Response-Surface Methods in R, using rsm. J. Stat. Softw. 2009, 32, 1–17. [Google Scholar] [CrossRef] [Green Version]
- Jebe, T.A.; Matlock, M.G.; Sleeter, R.T. Collaborative study of the oil stability index analysis. J. Am. Oil Chem. Soc. 1993, 70, 1055–1061. [Google Scholar] [CrossRef]
- Reynhout, G. The effect of temperature on the induction time of a stabilized oil. J. Am. Oil Chem. Soc. 1991, 68, 983–984. [Google Scholar] [CrossRef]
Figure 1.
Description of the followed methodology to optimize Rancimat operational parameters.

Figure 2.
Surface and contour plots for the inverse of the coefficient of variation (CV−1) versus (a) sample weight (g) and temperature (°C); (b) sample weight (g) and airflow (L·h−1); and (c) airflow (L·h−1) and temperature (°C).
Figure 2.
Surface and contour plots for the inverse of the coefficient of variation (CV−1) versus (a) sample weight (g) and temperature (°C); (b) sample weight (g) and airflow (L·h−1); and (c) airflow (L·h−1) and temperature (°C).


Figure 3.
Surface and contour plots for the induction time (IT-h) versus (a) sample weight (g) and temperature (°C), (b) sample weight (g) and airflow (L·h−1), and (c) air-flow and temperature.
Figure 3.
Surface and contour plots for the induction time (IT-h) versus (a) sample weight (g) and temperature (°C), (b) sample weight (g) and airflow (L·h−1), and (c) air-flow and temperature.

Figure 4.
Box-plots showing: (a) The CV (%); and (b) IT (h) distributions in Validation-1 and Validation-2. The median is represented as a thick horizontal black line, upper and lower quartiles as a box with the maximum and minimum measurements as lines protruding from these. Box-plots followed by a different letter within each boxplot set are significantly different between each other (p-value ≤ 0.05).


Table 1.
(a) Box–Behnken statistical design factors. (b) Combination of factors in Box–Behnken statistical design.
Table 1.
(a) Box–Behnken statistical design factors. (b) Combination of factors in Box–Behnken statistical design.
| (a) | |||
| Levels (coded)/uncoded | |||
| Operational parameters (units) | Low (−1) | Medium (0) | High (+1) |
| Sample weight (g) | 3 | 6 | 9 |
| Temperature (°C) | 100 | 110 | 120 |
| Airflow (L·h−1) | 10 | 15 | 20 |
| (b) | |||
| Block 1 | |||
| Independent variables (operational parameters) | |||
| Run | Sample weight (g) | Temperature (°C) | Airflow (L·h−1) |
| 1 | 3 | 110 | 10 |
| 2 | 3 | 100 | 15 |
| 3 | 3 | 120 | 15 |
| 4 | 3 | 110 | 20 |
| 5 | 6 | 100 | 10 |
| 6 | 6 | 120 | 10 |
| 7 | 6 | 110 | 15 |
| 8 | 6 | 110 | 15 |
| 9 | 6 | 110 | 15 |
| 10 | 6 | 100 | 20 |
| 11 | 6 | 120 | 20 |
| 12 | 9 | 110 | 10 |
| 13 | 9 | 100 | 15 |
| 14 | 9 | 120 | 15 |
| 15 | 9 | 110 | 20 |
| Block 2 | |||
| Independent variables (operational parameters) | |||
| Run | Sample weight (g) | Temperature (°C) | Airflow (L·h−1) |
| 16 | 3 | 100 | 10 |
| 17 | 9 | 120 | 20 |
Table 2.
Regression coefficients and p-value a for each non-linear response variable model.
| Term (Code) | CV−1 | IT (h) | ||
|---|---|---|---|---|
| Coeff. | p-Value | Coeff. | p-Value | |
| Intercept (b0) | 1.1908 | 0.0110 a | 2.7166 | 4.137 × 10⁻¹⁰ a |
| Block effect | 0.8066 | 0.2939 | 0.0255 | 0.7557 |
| Sample weight (X1) | −0.0306 | 0.8746 | 0.0165 | 0.4565 |
| Temperature (X2) | −0.2111 | 0.2999 | −1.9661 | 9.570 × 10⁻¹¹ a |
| Airflow (X3) | 0.1911 | 0.3442 | 0.0362 | 0.1330 |
| Temperature x sample weight (X2X1) | −0.0337 | 0.9093 | −0.0025 | 0.9400 |
| Airflow x sample weight (X3X1) | −0.2764 | 0.3685 | 0.0117 | 0.7248 |
| Temperature x airflow (X2X3) | −0.3699 | 0.2410 | −0.0317 | 0.3572 |
| Sample weight (X12) | −0.4239 | 0.2020 | 0.0086 | 0.8025 |
| Temperature (X22) | −0.2150 | 0.4948 | 0.6221 | 1.475 × 10⁻⁶ a |
| Airflow (X32) | −0.2759 | 0.3872 | 0.0279 | 0.4319 |
a ANOVA for each term at p = 0.05. Statistically significant values (p-value ≤ 0.05) are in bold text.
Table 3.
ANOVA table for the inverse of coefficient of variation (CV−1), induction time (IT), and non-linear response models.
Table 3.
ANOVA table for the inverse of coefficient of variation (CV−1), induction time (IT), and non-linear response models.
| Term | SS | MS | F-Value | p-Value a | |||||
|---|---|---|---|---|---|---|---|---|---|
| df | CV−1 | IT | CV−1 | IT | CV−1 | IT | CV−1 | IT | |
| Block | 1 | 0.159 | 0.170 | 0.159 | 0.170 | 0.492 | 41.950 | 0.509 | 0.0064 |
| Linear | 3 | 0.661 | 38.261 | 0.220 | 12.753 | 0.681 | 3144.644 | 0.594 | 5.616 × 10⁻¹⁰ a |
| Quadratic | 3 | 0.857 | 0.005 | 0.285 | 0.0015 | 0.883 | 0.378 | 0.500 | 0.772 |
| Polynomial | 3 | 0.985 | 1.436 | 0.328 | 0.4787 | 1.015 | 118.029 | 0.449 | 1.006 × 10⁻⁵ a |
| Residuals | 6 | 0.941 | 0.024 | 0.323 | 0.0041 | ||||
| Lack of fit | 4 | 0.865 | 0.018 | 0.216 | 0.0044 | 0.402 | 1.293 | 0.801 | 0.478 |
| Pure error | 2 | 1.075 | 0.007 | 0.537 | 0.0034 | ||||
a ANOVA for each term at p-value = 0.05. Statistically significant values (p-value ≤ 0.05) are in bold text.
Table 4.
Stationary maximized points in original units for each non-linear response variable model.
| Response Variable | Operational Parameters | Eigenvalues | ||||
|---|---|---|---|---|---|---|
| Sample Weight (g) | Temperature (°C) | Airflow (L·h−1) | Sample Weight (g) | Temperature (°C) | Airflow (L·h−1) | |
| CV−1 | 3.9 | 85.5 | 26.7 | −0.550 | −0.041 | −0.323 |
| IT | 2.8 | 125.9 | 17.3 | 0.006 | 0.622 | 0.029 |
| Mean | 3.3 | 105.7 | 22.0 | |||
| Max | 3.9 | 125.9 | 26.7 | |||
| Min | 2.8 | 85.5 | 17.3 | |||
| Optimized | 3.9 | 100 | 25 | |||
Table 5.
Mean and standard deviation of the IT (h), CV (%), and CV−1 obtained from the validation of operational parameters at the stationary point (Validation-1) and optimal parameters (Validation-2).
Table 5.
Mean and standard deviation of the IT (h), CV (%), and CV−1 obtained from the validation of operational parameters at the stationary point (Validation-1) and optimal parameters (Validation-2).
| Validation | Sample Weight (g) | Temperature (°C) | Air Flow (L·h−1) | IT (h) | CV (%) | CV−1 |
|---|---|---|---|---|---|---|
| Validation-1 (Validation at the maximized stationary point for CV−1) | 3.9 | 85 | 25 | 16.261 ± 0.360 | 0.966 ± 0.851 | 1.688 ± 1.486 |
| Validation-2 (Validation at final optimal parameters) | 3.9 | 100 | 25 | 5.421 ± 0.016 | 1.259 ± 0.838 | 1.020 ± 0.679 |
Publisher’s Note: MDPI stays neutral with regard to jurisdictional claims in published maps and institutional affiliations. |
© 2021 by the authors. Licensee MDPI, Basel, Switzerland. This article is an open access article distributed under the terms and conditions of the Creative Commons Attribution (CC BY) license (https://creativecommons.org/licenses/by/4.0/).
Share and Cite
MDPI and ACS Style
Félix-Palomares, L.; Donis-González, I.R. Optimization and Validation of Rancimat Operational Parameters to Determine Walnut Oil Oxidative Stability. Processes 2021, 9, 651. https://0-doi-org.brum.beds.ac.uk/10.3390/pr9040651
AMA Style
Félix-Palomares L, Donis-González IR. Optimization and Validation of Rancimat Operational Parameters to Determine Walnut Oil Oxidative Stability. Processes. 2021; 9(4):651. https://0-doi-org.brum.beds.ac.uk/10.3390/pr9040651
Chicago/Turabian StyleFélix-Palomares, Lucía, and Irwin R. Donis-González. 2021. "Optimization and Validation of Rancimat Operational Parameters to Determine Walnut Oil Oxidative Stability" Processes 9, no. 4: 651. https://0-doi-org.brum.beds.ac.uk/10.3390/pr9040651
Note that from the first issue of 2016, this journal uses article numbers instead of page numbers. See further details here.