Article

Removal of Phenol from Aqueous Solution Using Internal Microelectrolysis with Fe-Cu: Optimization and Application on Real Coking Wastewater

1
Thai Nguyen University of Education, Thai Nguyen University, Thai Nguyen City 250000, Vietnam
2
Institute of Chemistry and Materials, Ha Noi 100000, Vietnam
3
Department of Chemistry, Ho Chi Minh City University of Education, Ho Chi Minh City 700000, Vietnam
4
NTT Hi-Tech Institute, Nguyen Tat Thanh University, Ho Chi Minh City 700000, Vietnam
5
Institute of Environmental Sciences, Nguyen Tat Thanh University, Ho Chi Minh City 700000, Vietnam
6
Faculty of Environmental and Food Engineering, Nguyen Tat Thanh University, Ho Chi Minh City 700000, Vietnam
*
Authors to whom correspondence should be addressed.
Submission received: 6 March 2021 / Revised: 14 April 2021 / Accepted: 16 April 2021 / Published: 19 April 2021

Abstract

:
Fe-Cu materials were synthesized using the chemical plating method from Fe powder and CuSO4 5% solution and then characterized for surface morphology, composition and structure by scanning electron microscopy (SEM), energy dispersive X-ray spectroscopy (EDS) and X-ray diffraction (XRD), respectively. The as-synthesized Fe-Cu material was used for removal of phenol from aqueous solution by internal microelectrolysis. The internal electrolysis-induced phenol decomposition was then studied with respect to various parameters such as pH, time, Fe-Cu material weight, phenol concentration and shaking speed. The optimal phenol decomposition (92.7%) was achieved under the conditions of (1) a pH value of phenol solution of 3, (2) 12 h of shaking at the speed of 200 rpm, (3) Fe-Cu material weight of 10 g/L, (4) initial phenol concentration of 100.98 mg/L and (5) at room temperature (25 ± 0.5 °C). The degradation of phenol using Fe-Cu materials obeyed the second-order apparent kinetics equation with a reaction rate constant of k of 0.009 h−1L mg−1. The optimal process was then tested against real coking wastewater samples, resulting in treated wastewater with favorable water indicators. Current findings justify the use of Fe-Cu materials in practical internal electrolysis processes.

1. Introduction

In recent years, the process of industrialization and modernization in Vietnam has taken place rapidly, promoting socio-economic development of the country and accompanying problems of environmental pollution. Phenol is a hazardous pollutant and is listed as one of 129 pollutants that need to be pre-treated, according to US Environmental Protection guidelines. Phenol is often generated in the waste streams of industries such as petrochemicals, oil refining, plastics, steel, textile, paper and pulp, pesticides, pharmaceuticals, synthetic resins, and coking plants [1,2,3]. Phenol is a less biodegradable chemical that can cause cancer, gene mutation and teratogen. Phenol contaminates water sources, causing tremendous harm to humans and organisms; thus, eradication of phenol pollution in wastewater is being studied in many countries, including Vietnam. In order to treat phenols, physicochemical methods, such as adsorption, flocculation and sedimentation have been used as a traditional treatment. However, they are found to be not very effective.
Internal electrolysis (IE) has been proposed as a remedy for this issue. Usually, based on the electron material used, there are four types of IE, including Fe-Cu, Fe-C, Al-Cu and Al-C. Among them, the Fe-C and Fe-Cu systems are widely used in actual projects. The principle of IE involves two materials with different electrode potentials that generate microelectrode pairs when being in contact. For Fe-C, the Fe-Cu iron system acts as an anode and copper or carbon acts as a cathode, similar to the micro-battery pair in metal corrosion. With a micro-battery with a voltage of about 1.2 V, a small power circuit of µA appears, which acts as a redox agent in the decomposition reaction of adsorbed organic compounds on the electrode surface. Due to this principle, Fe-C and Fe-Cu electrolytic processes are also known as internal microelectrolysis. Therefore, it is possible to dissolve iron without the use of an external current by placing micro-battery pairs as composites of Fe-C and Fe-Cu, providing an advantage in internal microelectrolysis technology in wastewater pretreatment applications [1,2,3,4,5,6,7,8,9,10,11,12,13,14,15,16,17,18,19,20,21,22,23,24,25,26]. The reactions that occur during internal microelectrolysis are as follows [27].
The reaction at the anode (Fe):
Fe → Fe2+ + 2e      E0(Fe2+/Fe) = −0.44 V
The reaction at the cathode (Cu):
2H+ + 2e → 2[H] = H2      E0(H+/H2) = 0.00 V
Fe and Cu: H2O → HO* + H+ + e
Organic substances that exist in the solution, such as RX (organochlorine compound) and RNO2 (aromatic ring nitro compound) then receive electrons from the anode surface (metal Fe) and are reduced by the chlorine and amine reaction. The resulting pollutants would become non-toxic or less toxic products, hence being more easily biodegradable.
The internal microelectrolysis process holds two main advantages. First, it could be applied to treat various types of industrial wastewater, including polyester-containing effluent [15], dyes [11,13,16], discharge from coal gasification [12], plant protection products [3,25], nitrate contamination [19], mixed industry (textile, dyeing, paper, plating, mechanic) [6,7,8,9], high organic matter [4,17,18], oil contamination [14], TNT and RDX contamination [10]. Second, internal microelectrolysis exhibits high treatment efficiency, fast response time and low operating costs. Fan and Ma [4] used a Fe-Cu electrode system to treat mixed industrial wastewater in Taopu, Shanghai at the capacity of 60,000 m3/day, achieving a COD removal efficiency of 40%. Yin et al. [12] used this method to connect an external current to treat 4-chlorophenol, reaching a removal efficiency that was higher than 90% after 36 min. Yang et al. [5] also reported that internal electrolysis could be used to treat polyester wastewater, achieving the COD removal efficiency of 58%. The COD of the wastewater decreased from 3353.2 mg/L to 1391.6 mg/L and its BOD5/COD ratio also increased from 0.27 to 0.42 after treatment. Zhu [17] combined internal microelectrolysis and a bio-membrane to treat mixed industry wastewater, reducing the COD from 150,000 mg/L to 500 mg/L.
Recent trends in enhancing the decomposition of organic pollutants have shifted to the use of bimetallic internal microelectrolytic materials prepared by the deposition of second transition metals on the iron surface. Previous studies showed that transition metals such as Ni, Cu and Co can enhance the catalytic activity of FeO [28]. Two types of catalytic mechanisms of bimetallic internal electrolytic materials have been proposed: (a) indirect reduction by atomic hydrogen ([H] abs) absorbed on the material’s surface in bimetallic and transition metal additives form that facilitates the generation of surface-linked hydrogen atoms ([H] abs), and (b) direct reduction on the catalytic active site by receiving electrons during FeO oxidation and surface additives (i.e., transition of metals) to increase FeO oxidation through the formation of a multitude of micro-battery pairs [29,30].
In many studies, Fe-Cu and Fe-C materials are usually made from scrap, iron granules, copper and carbon powder with different sizes or prepared by second transition metal deposition on the surface of Fe, thus offering modest degradation efficiency against pollutants [5,28,29,30,31]. However, it has been suggested that the use of chemical plating of Cu on the Fe surface might result in materials with significantly improved degradation capacities for internal microelectrolysis [22]. For example, Xu et al. (2008) fabricated Fe-Cu material using the chemical plating method and used it in treatment of nitrobenzene (100 mg/L) in aqueous solution [31]. The obtained material showed a removal efficiency of approximately 95% at optimal conditions, suggesting a better reactivity of the chemically galvanized Fe-Cu for internal electrolysis. Bo et al. (2014) used a micro-sized Fe-Cu internal electrolyte material prepared by chemical plating to pretreat p-nitrophenol in aqueous solution [22]. The material was prepared with the content of Cu on the surface varying from 30% to 95%. Remarkably, the results pointed out that the Fe-Cu ratio played a key role in degradation of p-nitrophenol.
In this work, we continued this research pathway by fabricating Fe-Cu materials using the chemical plating method and investigated the effect of some factors such as pH, treatment time, mass of Fe-Cu system, shaking rate, and the concentration to efficiency ratio of phenol degradation of Fe-Cu materials in aqueous medium. In addition, the internal electrolysis reaction was applied to treat real coking wastewater from a coal factory in Vietnam.

2. Materials and Methods

2.1. Fabrication of Cu-Fe Material

Fe powder with sizes smaller than 50 µm and 99.9% purity (PA, China) was immersed in 30% NaOH solution for 10 min to remove grease and clean the surface. The surface was activated by treating in HCl 7.4% wt for 3 min. The diluted HCl solution was prepared with an HCl solution concentration of 37% wt. The material was then washed several times with water, followed by drying at 105 °C for 2 h, allowed to cool and stored in a sealed glass jar. Fe-Cu samples were made using the chemical plating method in 5% CuSO4 solution (wt%). To be specific, a total of 100 g of Fe powder was added into 1 L of 5 wt% CuSO4 solution for a period of 2 min. The mixture was then washed several times with water and dried at 105 °C for 3 h under N2 gas. The material was then stored in a desiccator for further research.

2.2. Characterization of Structure, Composition, Physical Properties, Surface Characteristics of Fe-Cu Materials

The surface characteristics and components of the Fe-Cu material after fabrication were determined by scanning electron microscopy (SEM) and energy-dispersive X-ray spectroscopy (EDS) (on an SEM-EDS machine, JSM 6610 LA—JEOL, Tokyo, Japan), respectively. Measurements were made at the Institute of Materials Chemistry, Institute of Military Science and Technology, Vietnam. The structure of the material was determined by the method of X-ray diffraction (XRD) (on a Bruker D5000, Siemens, München, Germany). The measurement was conducted at the department of Chemistry—Hanoi University of Natural Sciences.

2.3. Study on Decomposition of Phenol

Factors affecting degradation of phenol were investigated, including pH, time, dosage of Fe-Cu materials, shaking rate and initial concentration of phenol. The experiments were carried out at room temperatures (25 ± 0.5 °C). Parameters for the experiments are shown in Table 1.
All experiments were conducted three times to check the repeatability. The result of each experiment is the average result of the three times, with P values less than 0.05 indicating a significant difference between the means.
The phenol degradation efficiency was calculated by the formula:
H % = ( C 0   C cb ) C 0   ×   100 %
In which: C0 is the concentration of the phenol solution before decomposition (mg/L), Ccb is the concentration of the phenol solution after decomposition (mg/L) and H is the degradation efficiency (%).
The initial and post-treatment phenolic concentrations were determined on the HPLC Waters Acquity Arc instrument at the University of Education, Thai Nguyen University, Thai Nguyen Province, Vietnam. The instrument was equipped with chromatographic column C18 Inertsil ODS (5 μm, 250 × 3 mm, GL Sciences Inc., Tokyo, Japan). The optimal conditions for the determination of phenol content are as follows: wavelength of 272 nm, ratio of phosphate buffer solution mixture (pH = 4) to acetonitrile solution (pH = 3) of 30:70 (v/v), flow rate of 1.0 mL/ min, column temperature of 30 °C. TSS, BOD5, COD, total N, total P and NH 4 + -N indicators were determined at the Thai Nguyen Center for Natural Resources and Environment Monitoring.

3. Results and Discussion

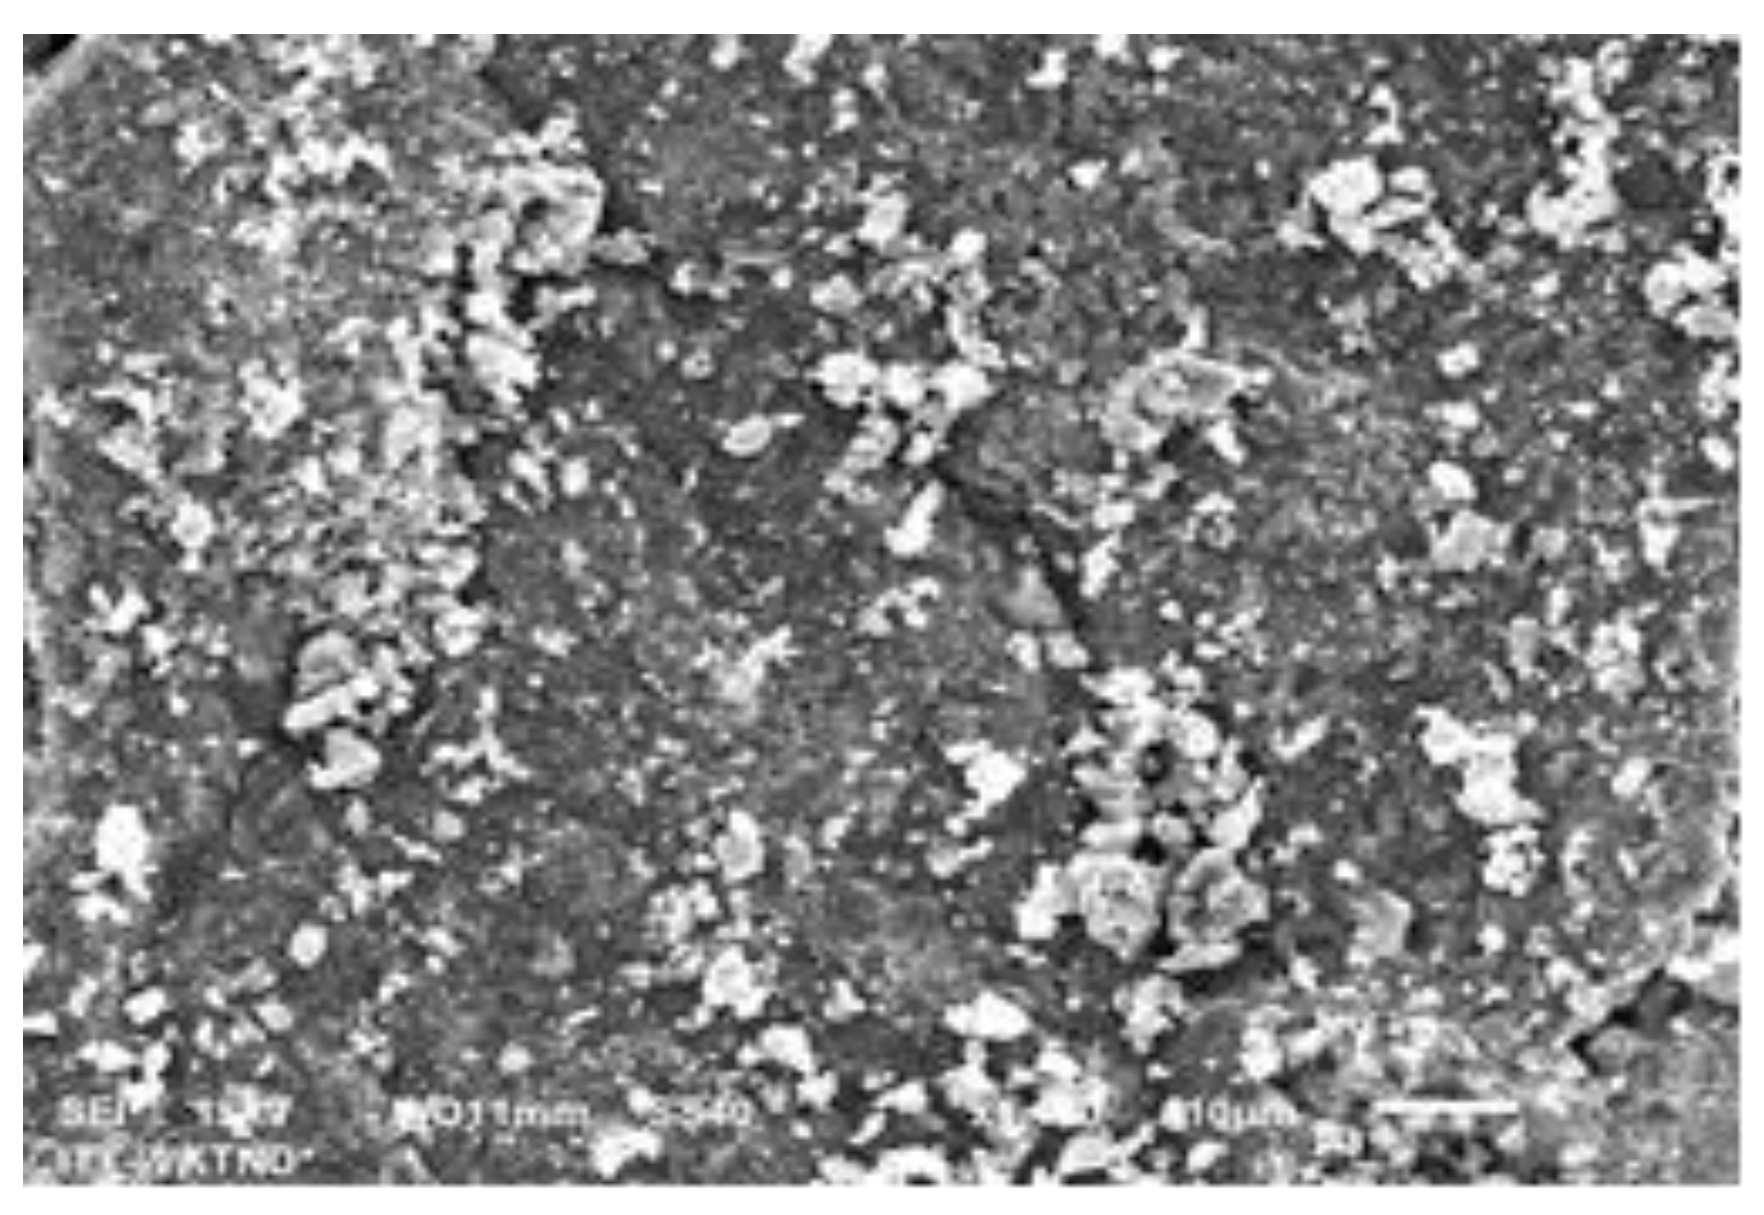
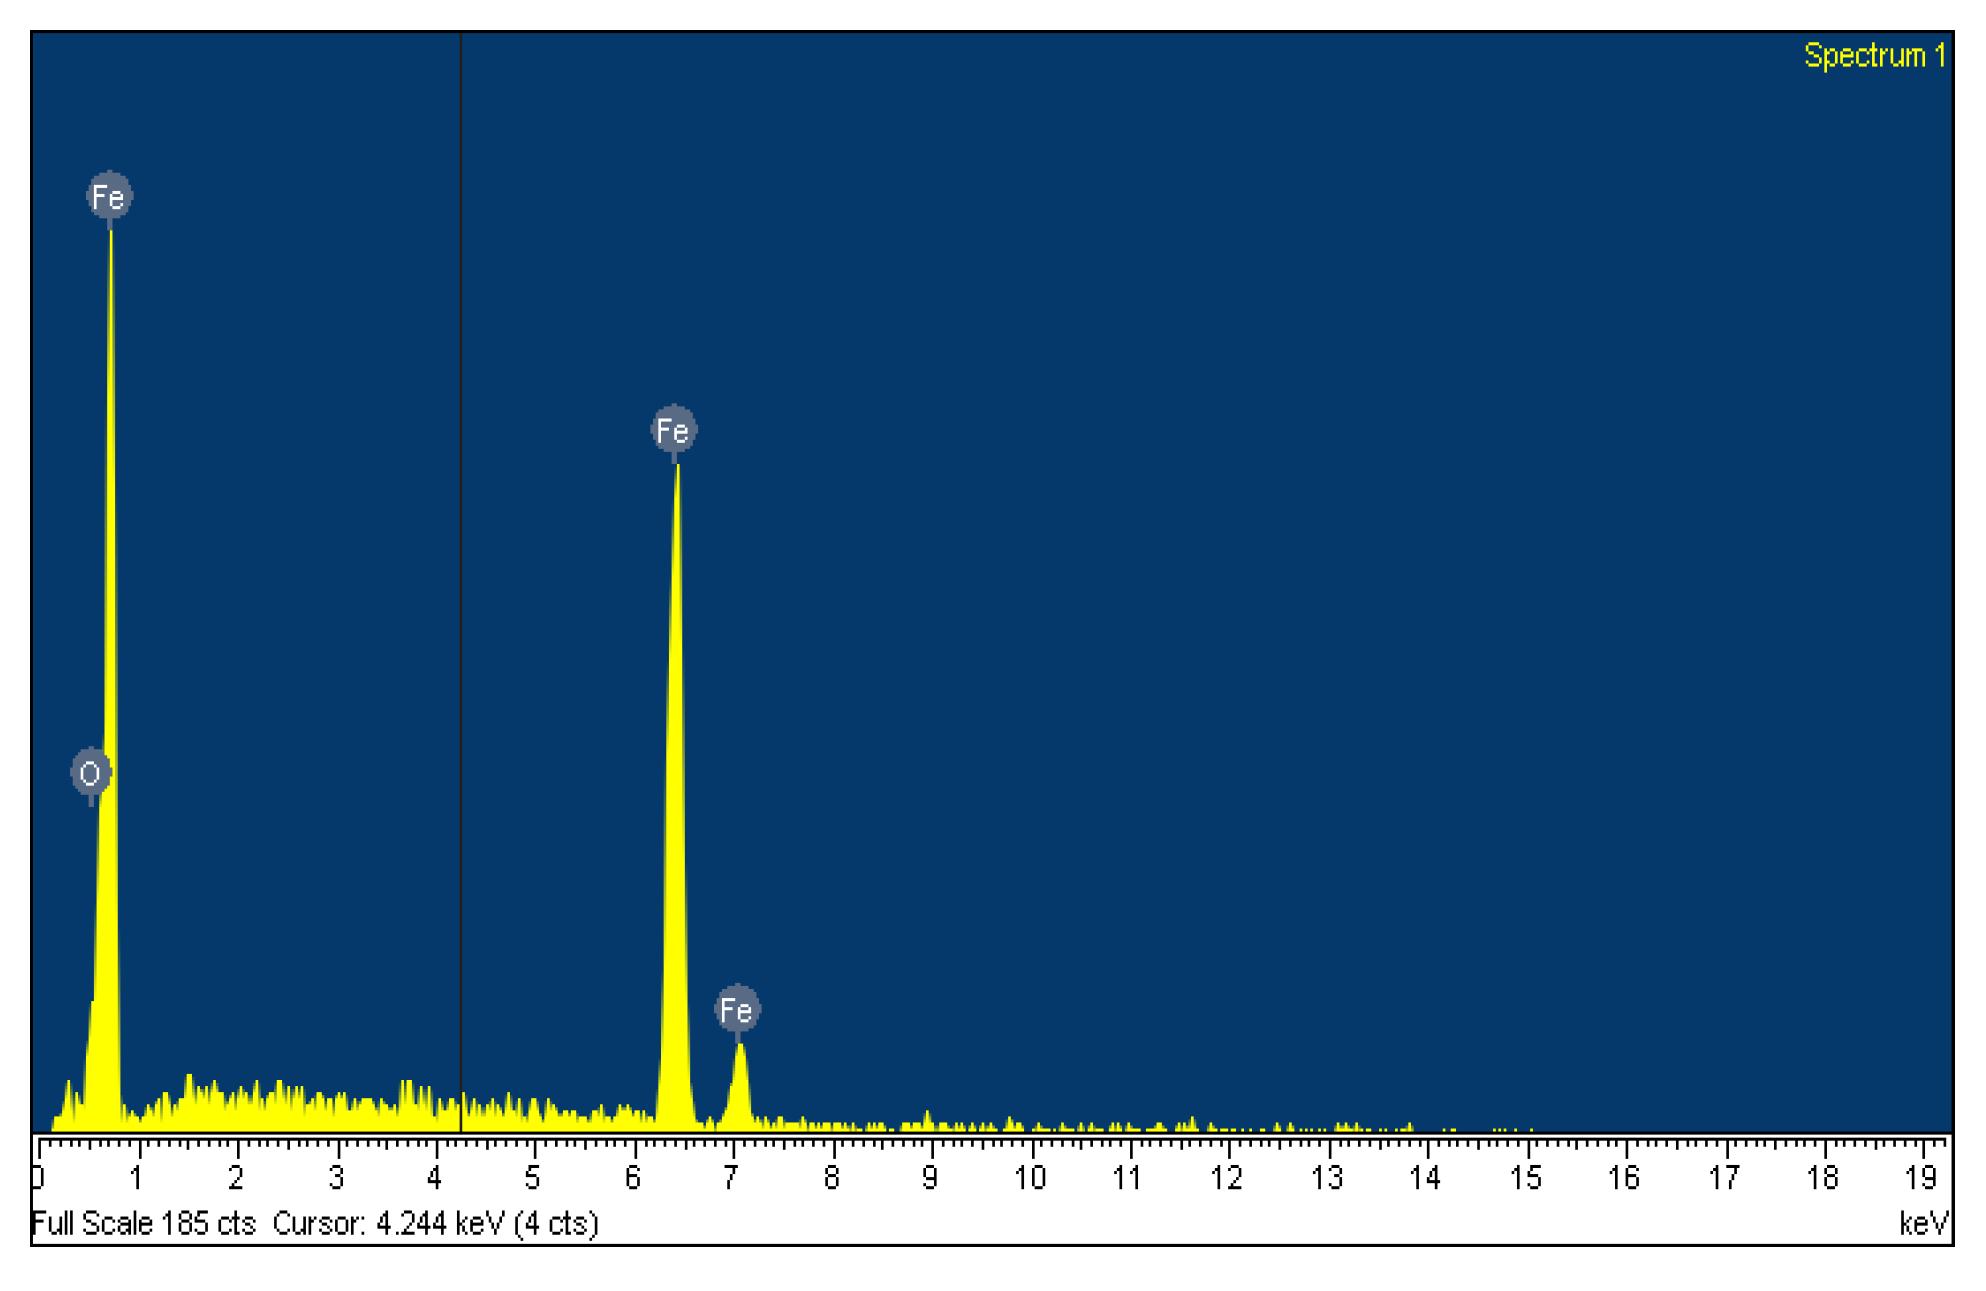
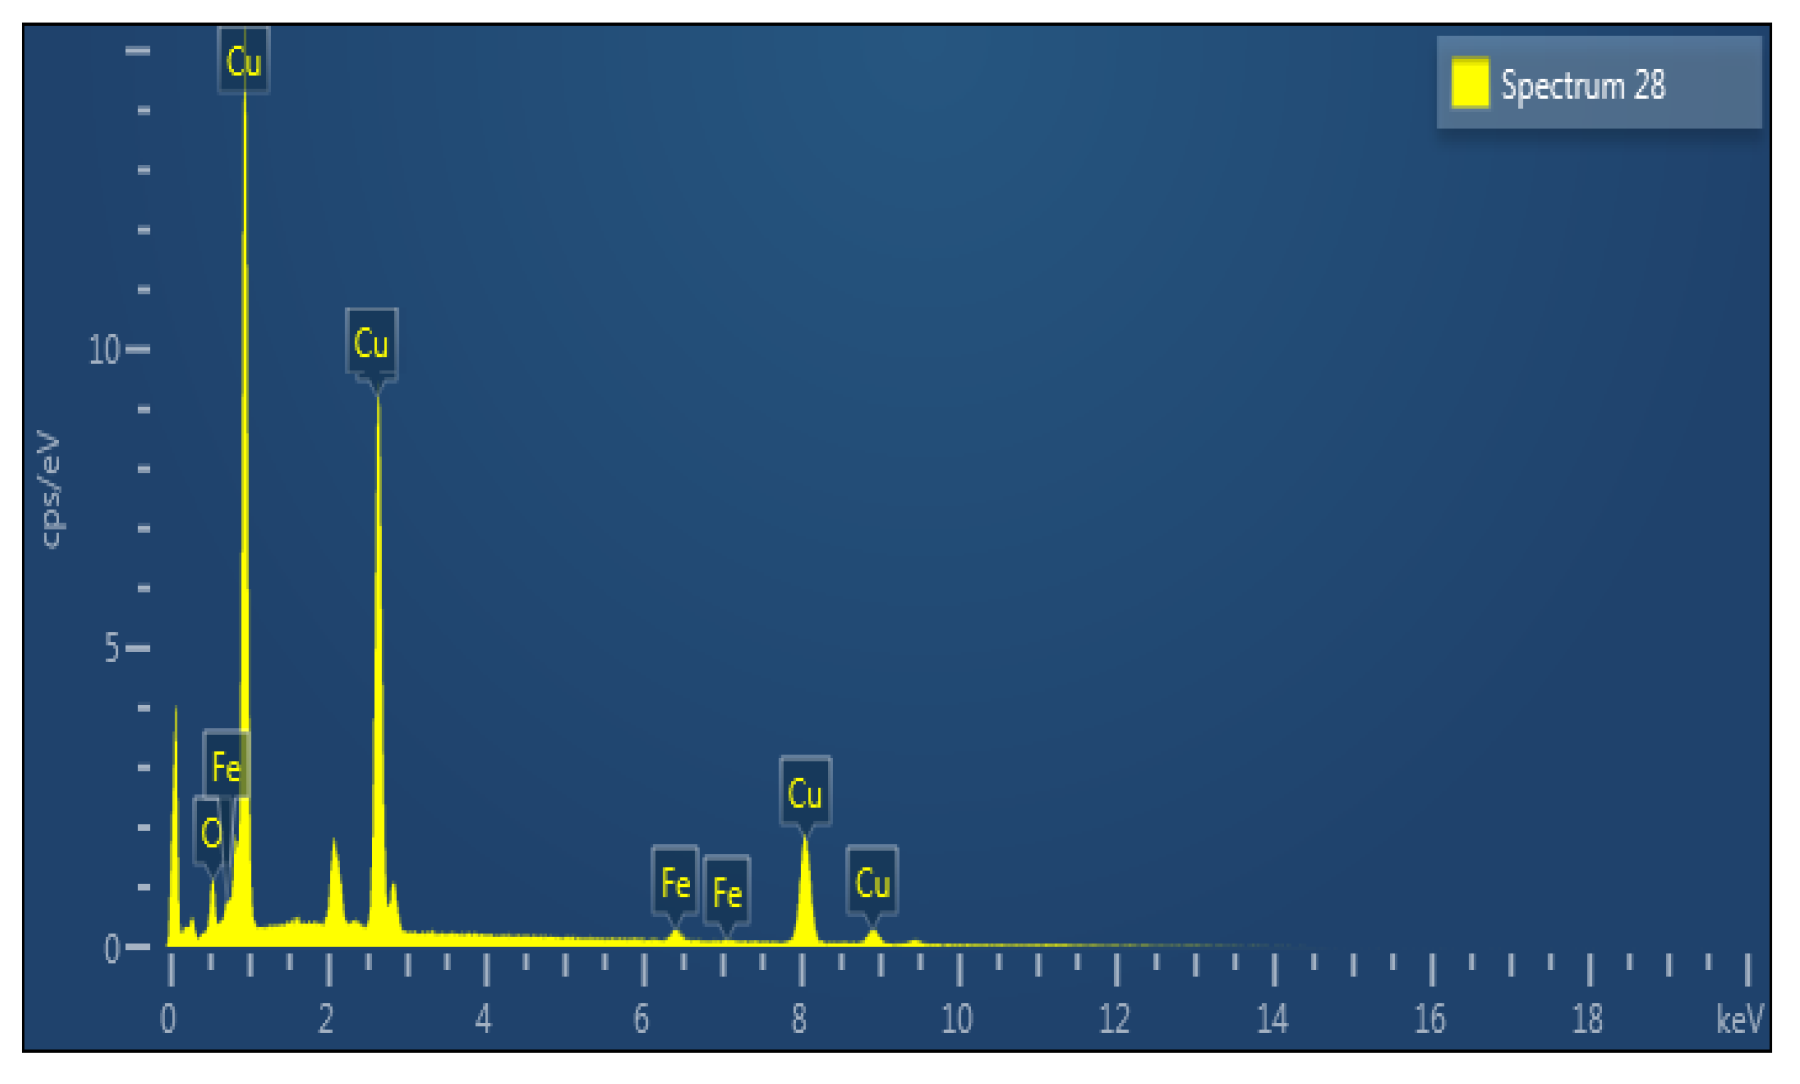
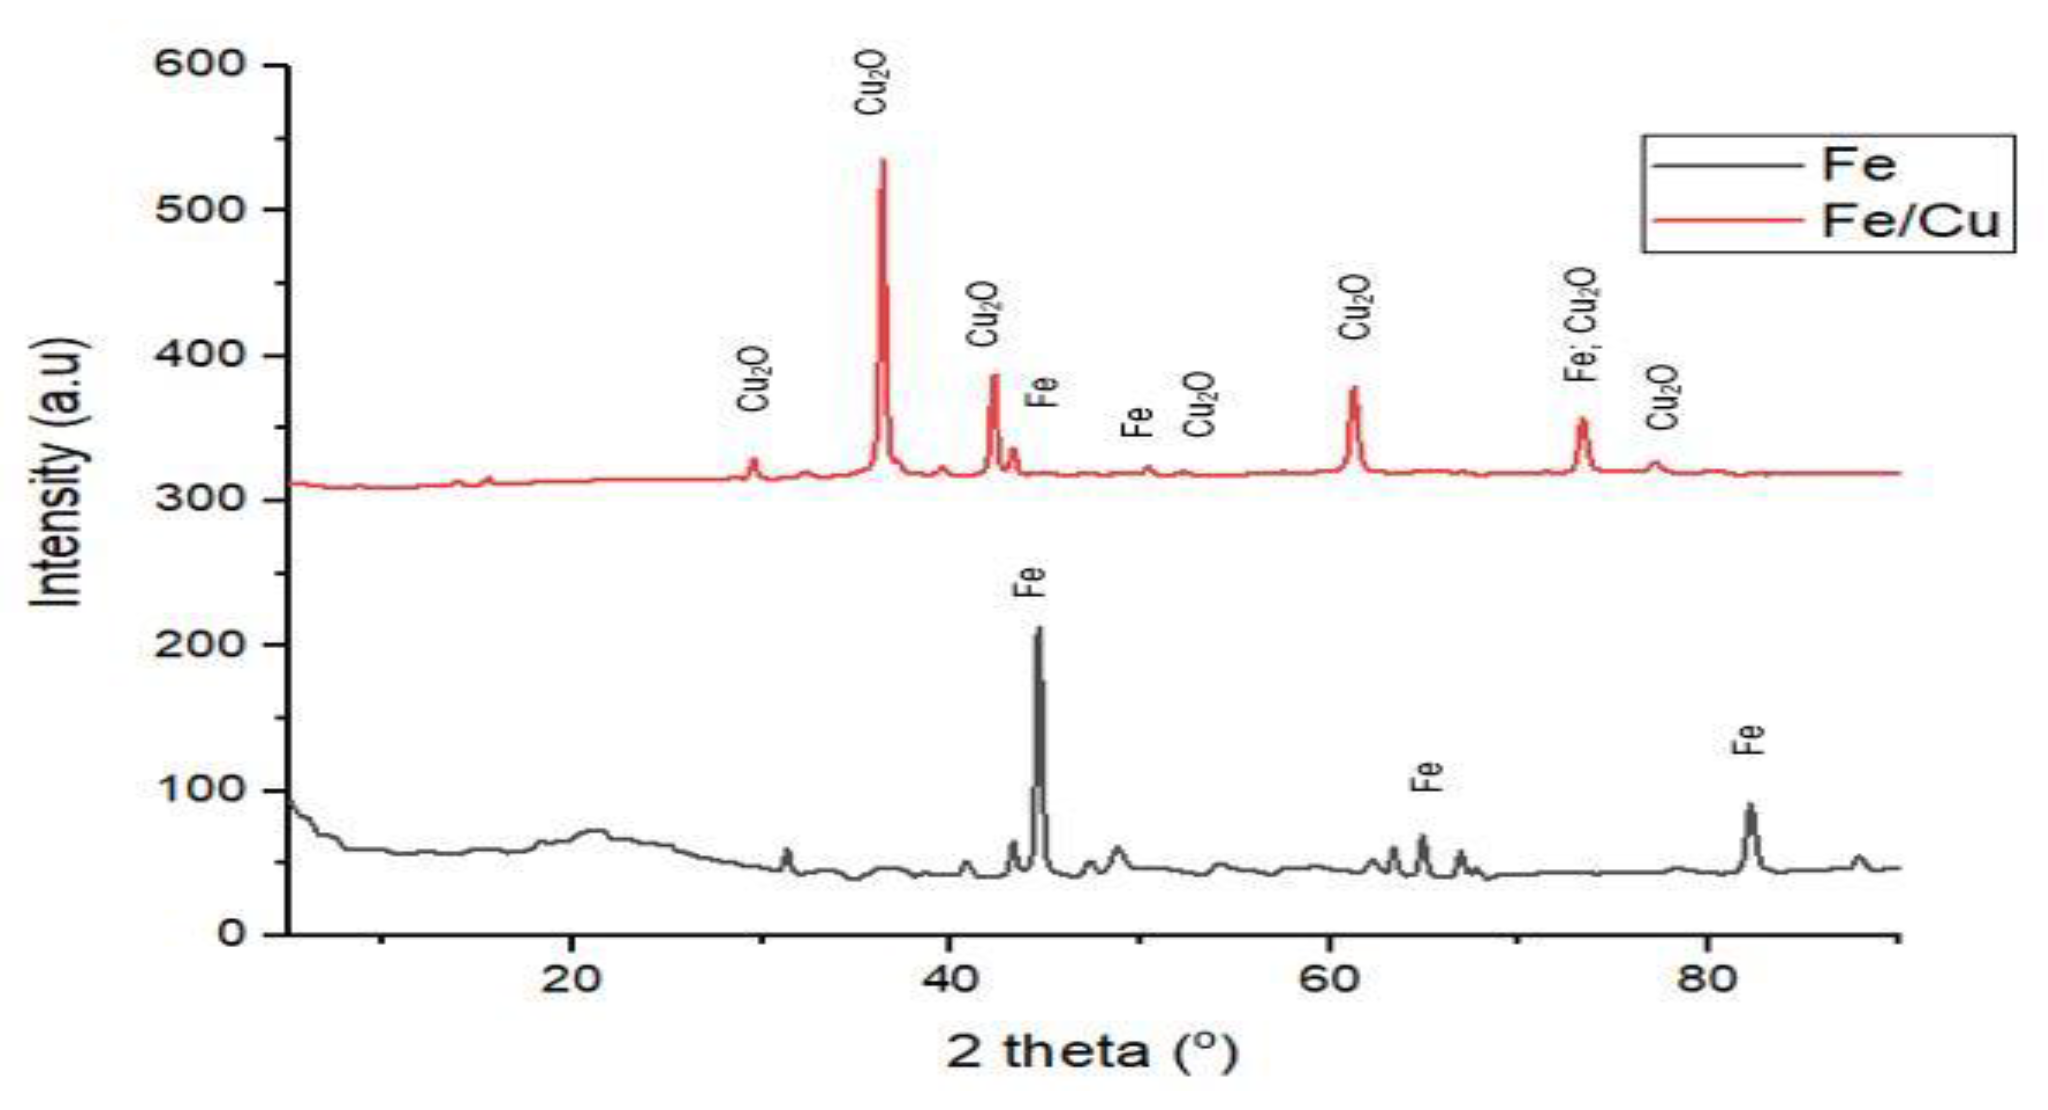
3.1. Survey Results on Surface Characteristics and Physical Properties of Fe-Cu Materials

From the analysis results of the SEM-EDS images of the materials and synthetic materials shown in Figure 1, Figure 2, Figure 3 and Figure 4, it was found that the surface composition of the synthetic materials was different from the original materials. The Fe powder particles were arranged overlapping each other in blocks, whereas the Fe and Cu powder particles in Fe-Cu material were distributed relatively evenly on the surface with sizes of less than 50 µm. This shows that there was an even distribution of Cu plating alternating Fe powder particles to form Fe-Cu micro-cell pairs. The results of analyzing the EDS spectrum of Fe and Fe-Cu materials shown in Figure 3 and Figure 4 and Table 2 and Table 3 show specifically the presence of the elements and their content in each sample.
Analysis of the EDS of the Fe-Cu samples has shown Cu appearance, which proves successful copper plating. The reaction in the process of dissolving and chemically plating copper follows the processes below:
Fe ⇌ Fe2+ + 2e
Fe2+ ⇌ Fe3 + + e (There may be a part of Fe2+ oxidized to Fe3+)
Cu2+ + 2e ⇌ Cu
On the other hand, the analysis of the structure of the synthesized Fe and Fe-Cu materials shown in Figure 5 shows that the components of the two spectra were distinctly different. The Fe accounted for 18.59% of the mass according to EDX. On the XRD pattern, the peaks assigned to Fe were quite weak, which suggests that Fe may be converted into other compounds such as Fe•Cu2O. However, this is not always the case because Fe might be present in the Fe-Cu materials in amorphous forms, which does not show up in XRD results. Therefore, further studies are needed to confirm the exact material composition.
This proves that the Fe-Cu bimetal material has been successfully fabricated and that Cu has coated the Fe surface to form Fe-Cu micro-battery pairs.

3.2. Decomposition of Phenol

3.2.1. Effect of pH

According to Equations (1) and (2), the pH value has a great influence on the reaction rate and the redox ability to create [H]. When the pH is lower, the amount of H+ provided for the reaction becomes adequate or excessive, therefore accelerating the internal electrolysis or the corrosion of the electrode system. A lower initial pH value is associated with a higher concentration of [H]. Furthermore, in the presence of O2, the cathode reduction of the internal electrolytic reaction can also occur in the following reaction:
O2 + 4H+ + 4e → 2O* + 4[H] → 2H2O; E0 (O2/H2O) = 1.23 V
Thus, more H+ would produce more [H] and O*, enhancing the ability to redox and reduce phenol and leading to a better phenol treatment efficiency. The initial pH value also affects the rate of corrosion reactions of Fe/Cu materials to form Fe2+, Fe3+, Fe (OH)2 and Fe(OH)3. In a more acidic environment than Fe2+, Fe3+ is easy to form, yet it is difficult to precipitate Fe(OH)2 and Fe(OH)3. Conversely, when the pH is high and in the presence of dissolved oxygen, Fe(OH)2 and Fe(OH)3 concentration could be increased gradually in response to reaction time. Iron hydroxides are also factors that indirectly remove the phenol part as well as the intermediate compounds of the treatment by adsorption, flocculation and precipitation.
The results shown in Figure 6 show that when the pH value increases from 4 to 9, the phenol decomposition efficiency decreases. This can be explained by three main phenol decomposition processes, including decomposition due to the impact of internal electrolyte materials, adsorption and coagulation with iron hydroxide. As the concentration of Fe (II) and Fe (III) ions exceeds 10−5 mol/L in the material, precipitates of Fe(OH)2 and Fe(OH)3 will appear at pH values higher than 3, which is favorable for the flocculation of Fe (II) and Fe (III). At high pH (pH > 3), the phenol decomposition process was hindered, and coagulation was accelerated. As a result, phenol decomposition efficiency was decreased. Therefore, a pH value of 3 gave the maximum phenol decomposition efficiency and was selected for further studies.

3.2.2. Effect of Time

Variations of phenol removal with respect to reaction time are illustrated in Figure 7. The results show that when increasing the time from the 2 to 12 h, the phenol decomposition efficiency increased rapidly to a maximum value of 92.39%. Thereafter, over a period from 12 to 24 h, decomposition efficiency decreased slowly and then became almost stable.
The current result is in line with that of a previous study [19], which used Fe-Cu to treat polyester wastewater. This can be explained as follows: when the time increases from 2 to 12 h, the ongoing occurrence of the interior microelectrolysis reactions accumulates ferrous and ferric hydroxides, thus promoting phenol degradation efficiency. However, increasing the time from 12 to 24 h also leads to increased precipitation of hydroxides on the Fe-Cu surface and impedes the electron transmission between Fe-Cu and wastewater, thereby neutralizing the Fe-Cu surface and terminating the internal electrolysis, so the phenol degradation efficiency is reduced [20]. Therefore, we chose 12 h as the optimal time for phenol decomposition of Fe-Cu materials.

3.2.3. Effect of Dosage of Material

Removal efficiencies achieved at different dosages are shown in Figure 8. As the dosage of Fe-Cu material increased from 0.25 to 1.0 g, the phenol decomposition efficiency increased gradually. Increasing the dosage from 1.0 to 6.0 g seemed to impair the phenol degradation efficiency. In general, increasing the dosage of Fe-Cu resulted in a higher generation of microscopic galvanic cells, possibly leading to improved phenol removal efficiency. However, excessive amount of Fe-Cu in the solution might cause particle agglomeration, thus reducing the contacting area among Fe-Cu and wastewater. Moreover, the excess iron would react with H+ present in the solution, leading to weakened reaction from Fe-Cu [21]. The Fe-Cu utilization efficiency would decrease remarkably if its dosage were too high. Therefore, the material weight of 1.0 g or 10 g/L was selected as the optimal material weight to decompose the phenol of Fe-Cu material.

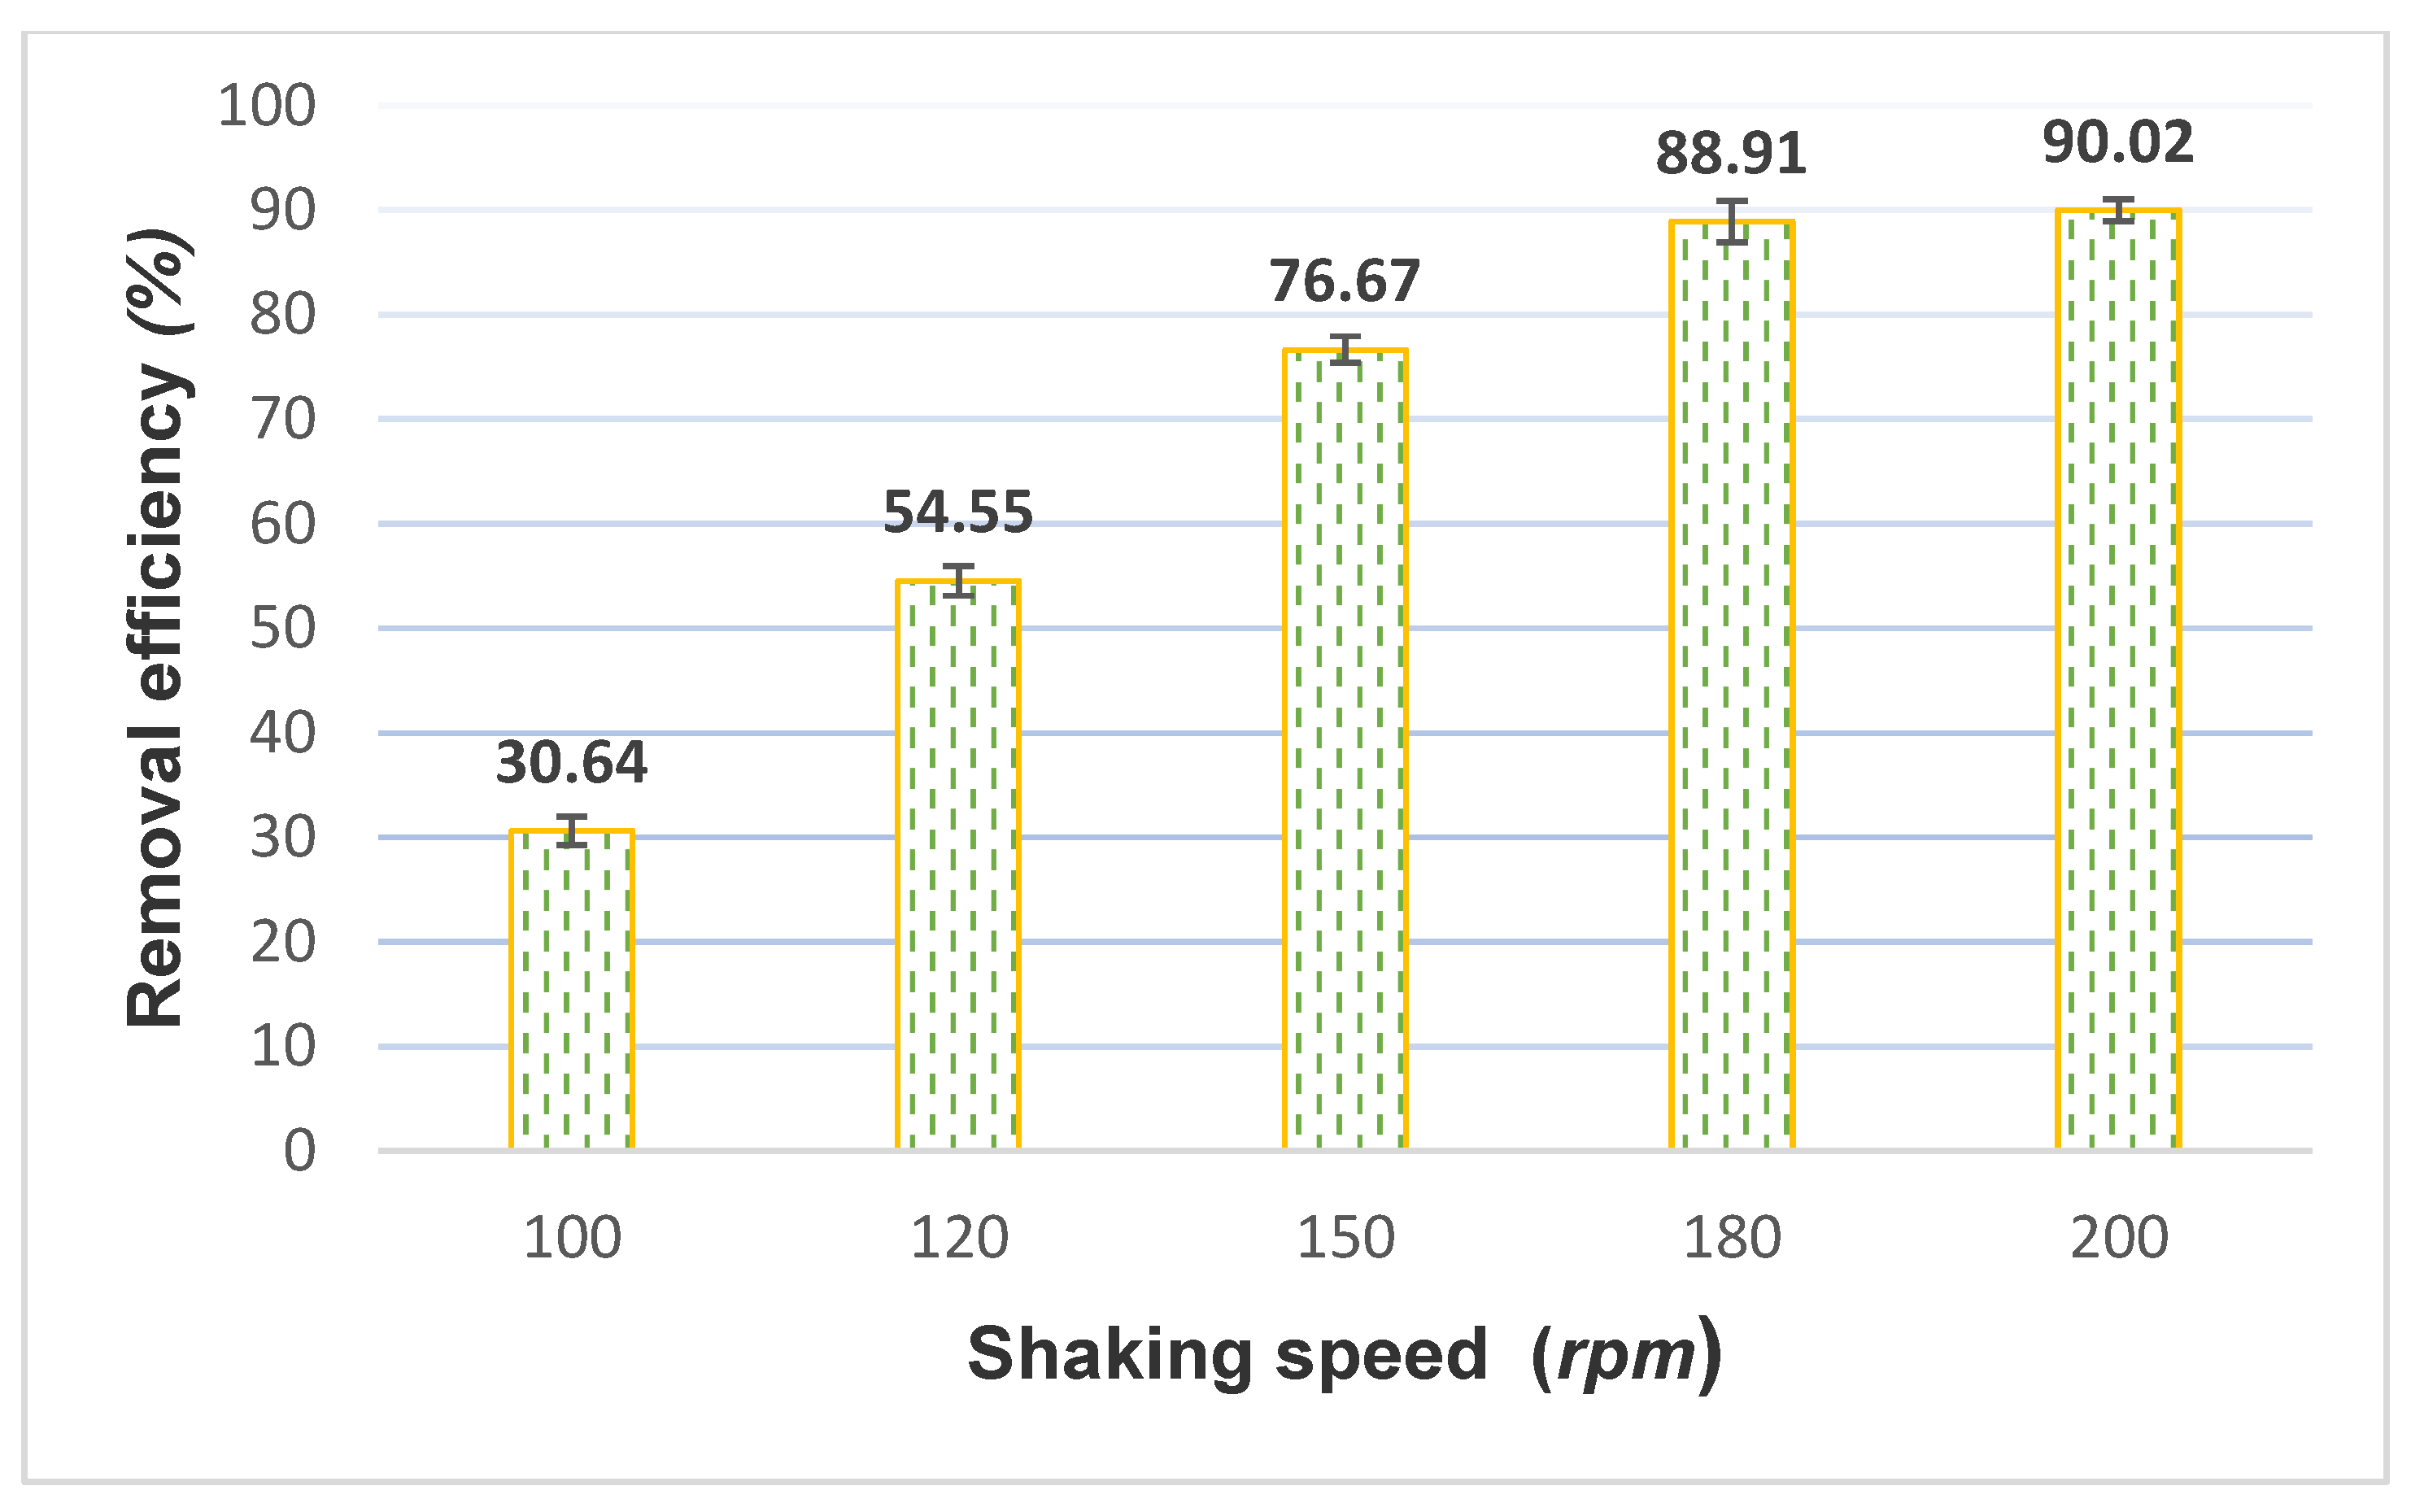
3.2.4. Effect of Shaking Speed

The effect of shaking speed on phenol decomposition efficiency is shown as in Figure 9. As the speed was accelerated, the phenol decomposition efficiency also improved. This can be explained as follows. The shaking speed increases the dissolved oxygen content into the solution and enhances the ability to diffuse pollutants to the surface in contact with the Fe-Cu electrode, as well as the rapid dispersion of the products treated at the electrode in the solution. However, in acidic environments with low pH, the dissolved oxygen content is lower than in alkaline media. The effect of dissolved oxygen content on phenol degradation efficiency can be explained by the following reasons:
(1)
When the shaking rate increases, the dissolved oxygen concentration in the electrolyte solution will also increase, in turn accelerating the subsequent cathode process when the pH changes to a neutral medium. This contributes to the corrosion rate as well as the rate of reaction with electrolytic internal materials [22].
(2)
Oxygen could combine with H+ to forms H2O2 hyperoxides, which then react with newly generated Fe2+ ions to form Fe(OH)2 and Fe(OH)3 ions. These are good phenol flocculation agents and intermediate products of phenol degradation.
(3)
One previous study [22] suggested that the increased shaking speed caused the decomposition of substance molecules and dispersion of the intermediate decomposition products in the solution. At that time, the possibility of contact between the decomposed substances and the intermediate products with the surface of the Fe-Cu electrode system are increased, causing oxidation in the solution, improving electrochemical reduction on the cathode surface, and improving processing speed and efficiency.
When shaking speed increased from 100 to 150 rpm, the phenol decomposition speed increased rapidly from 180 to 200 rpm. This could be the reason why at this time the dissolved oxygen concentration in the solution was almost saturated. Therefore, we chose the shaking speed of 200 rpm to proceed to subsequent experiments.

3.2.5. Effect of Initial Phenol Concentration

Phenol removal efficiencies at different initial phenol concentrations are shown as in Figure 10. The results from Figure 10 show that the phenol decomposition efficiency increased proportionally when the concentration increased from 53.38 to 100.98 mg/L. Afterwards, in the concentration range from 146.69 to 250.76 mg/L, the phenol decomposition performance decreased. At a phenol concentration value of 100.98 mg/L, the degradation efficiency reached the maximum value of 92.7%, which indicates almost complete phenol decomposition. There was a sharp decrease in performance at higher concentrations of phenols (higher than 100.98 mg/L), possibly due to higher required amount of internal electrolytic material. At low phenol concentrations, a low concentration gradient would obstruct the mass transportation. Simultaneously, the short lifetime of HO* is also a contributing factor to reduce the number of reactions with phenol. At higher phenol concentrations, it is more likely for phenol and HO* to mutually react, which results in improved phenol removal efficiency. However, at very high phenol concentrations (146.69 mg/L), the phenol removal efficiency decreased to 72.71% due to limited formation of HO* in the interior micro-electrolysis system Therefore, there should be further studies and surveys to handle phenol at high concentrations.

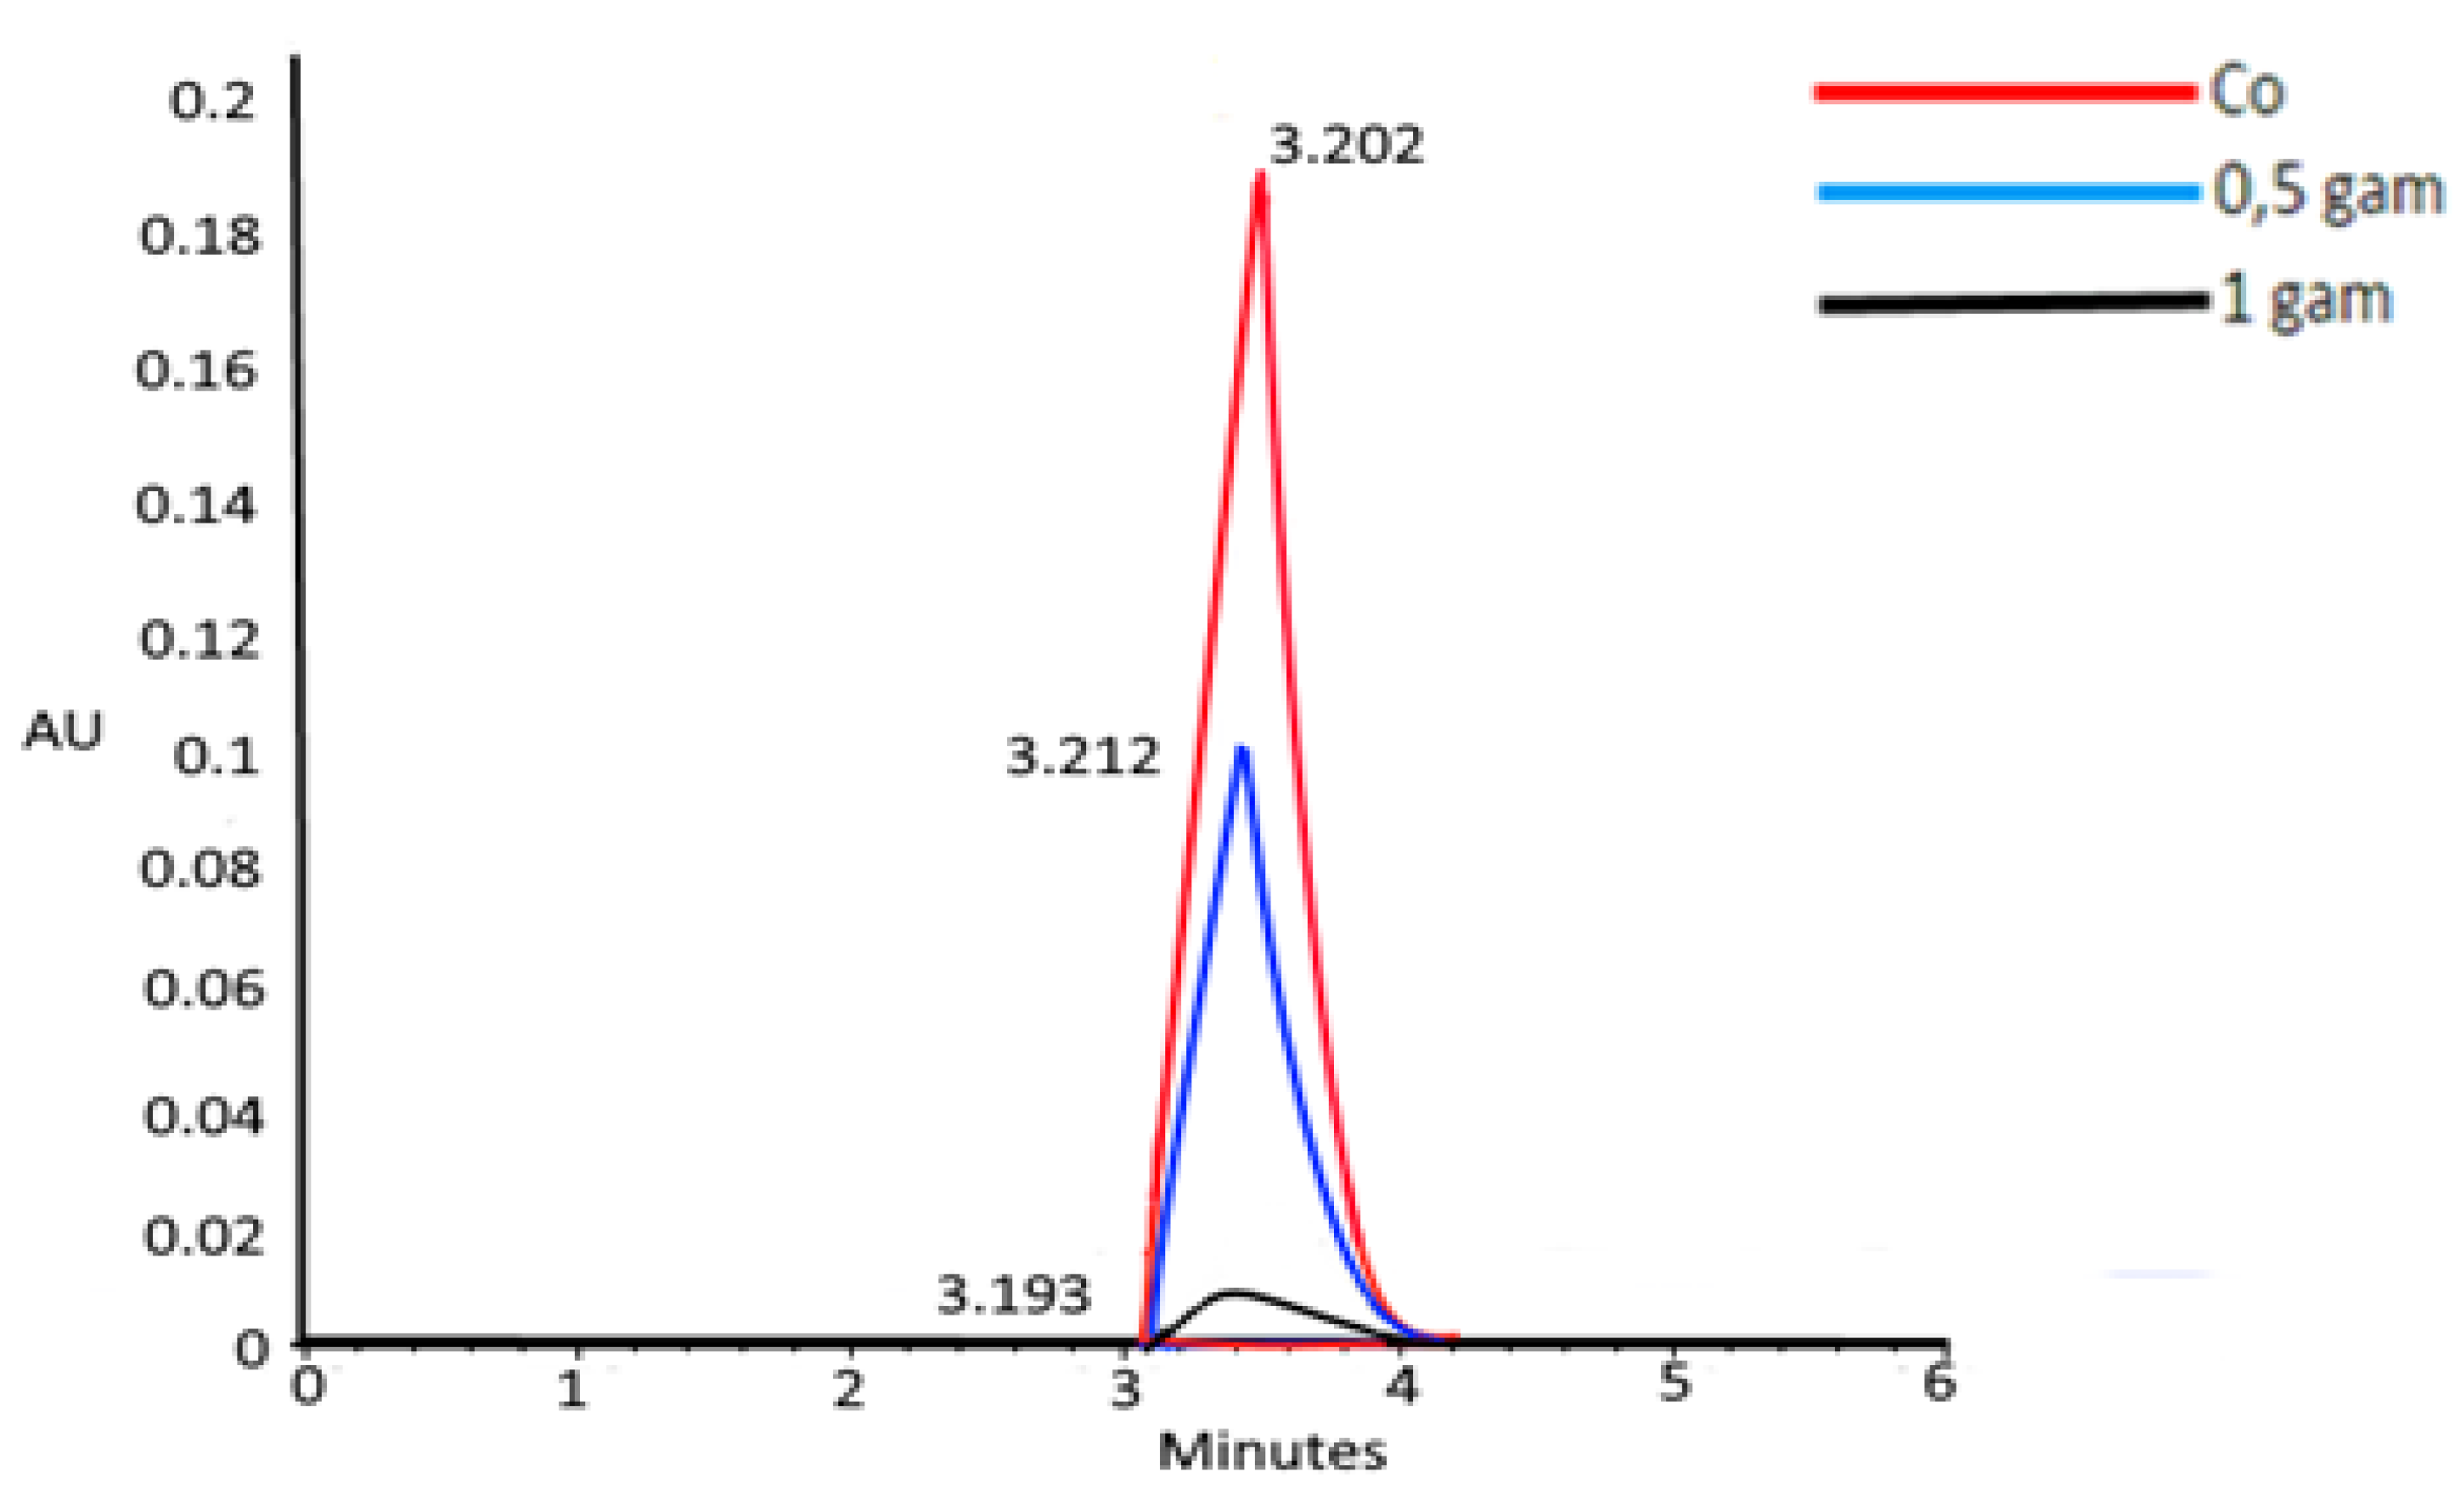
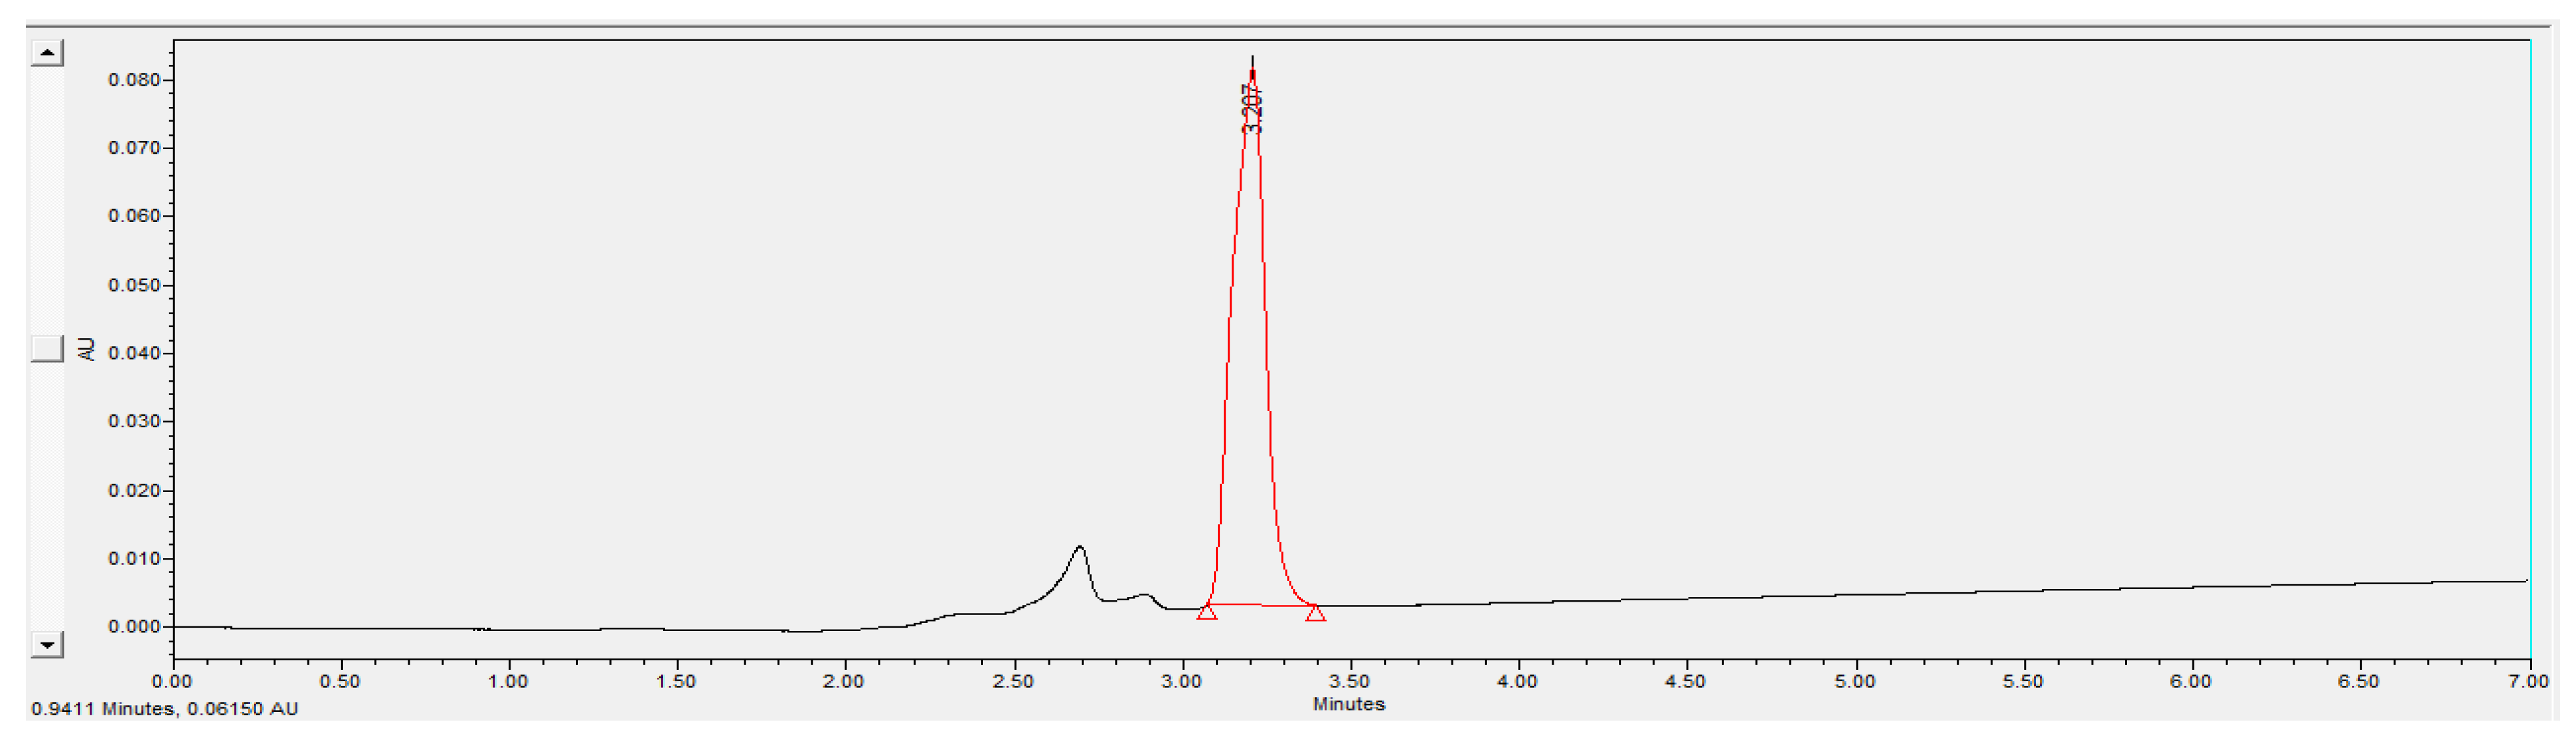
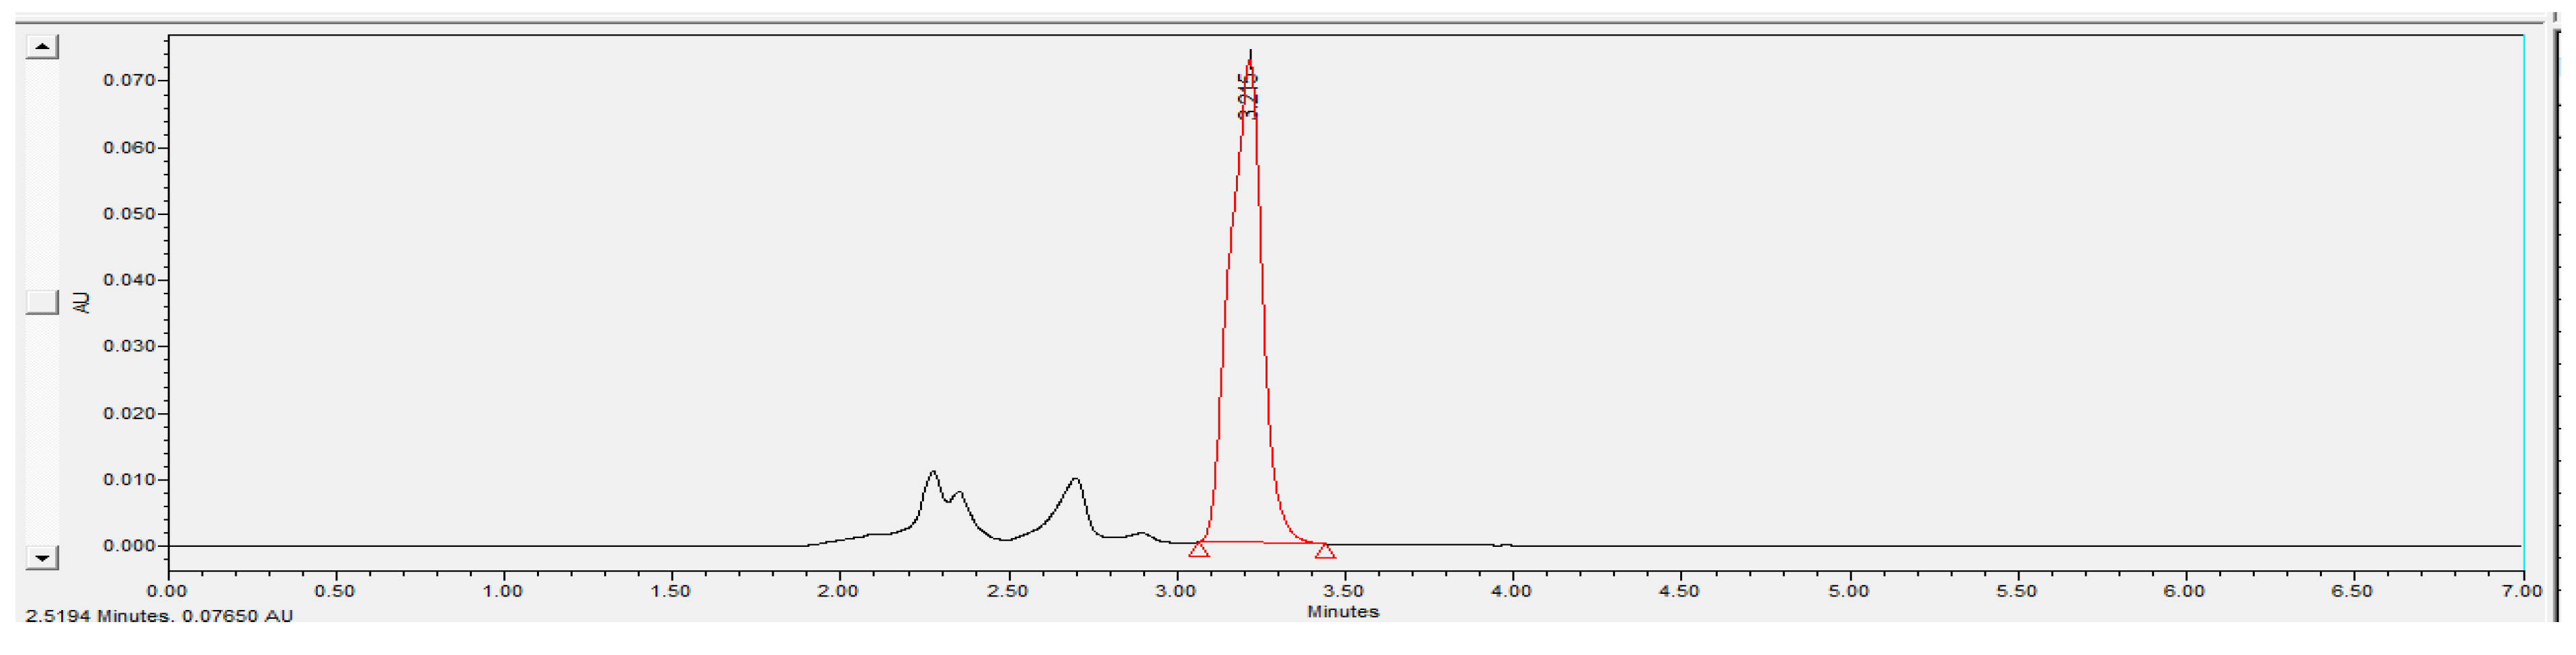
3.2.6. Decomposition Analysis Phenol Concentrations by HPLC

Figure 11 illustrates HPLC results of different phenol solutions (initial concentration of 100.98 mg/L) treated with different masses of Fe-Cu internal electrolysis material. It was indicated that phenol was completely decomposed when being treated with Fe-Cu material with the weight of 10 g/L, under 12 h of shaking at 200 rpm and at a pH value of 3.

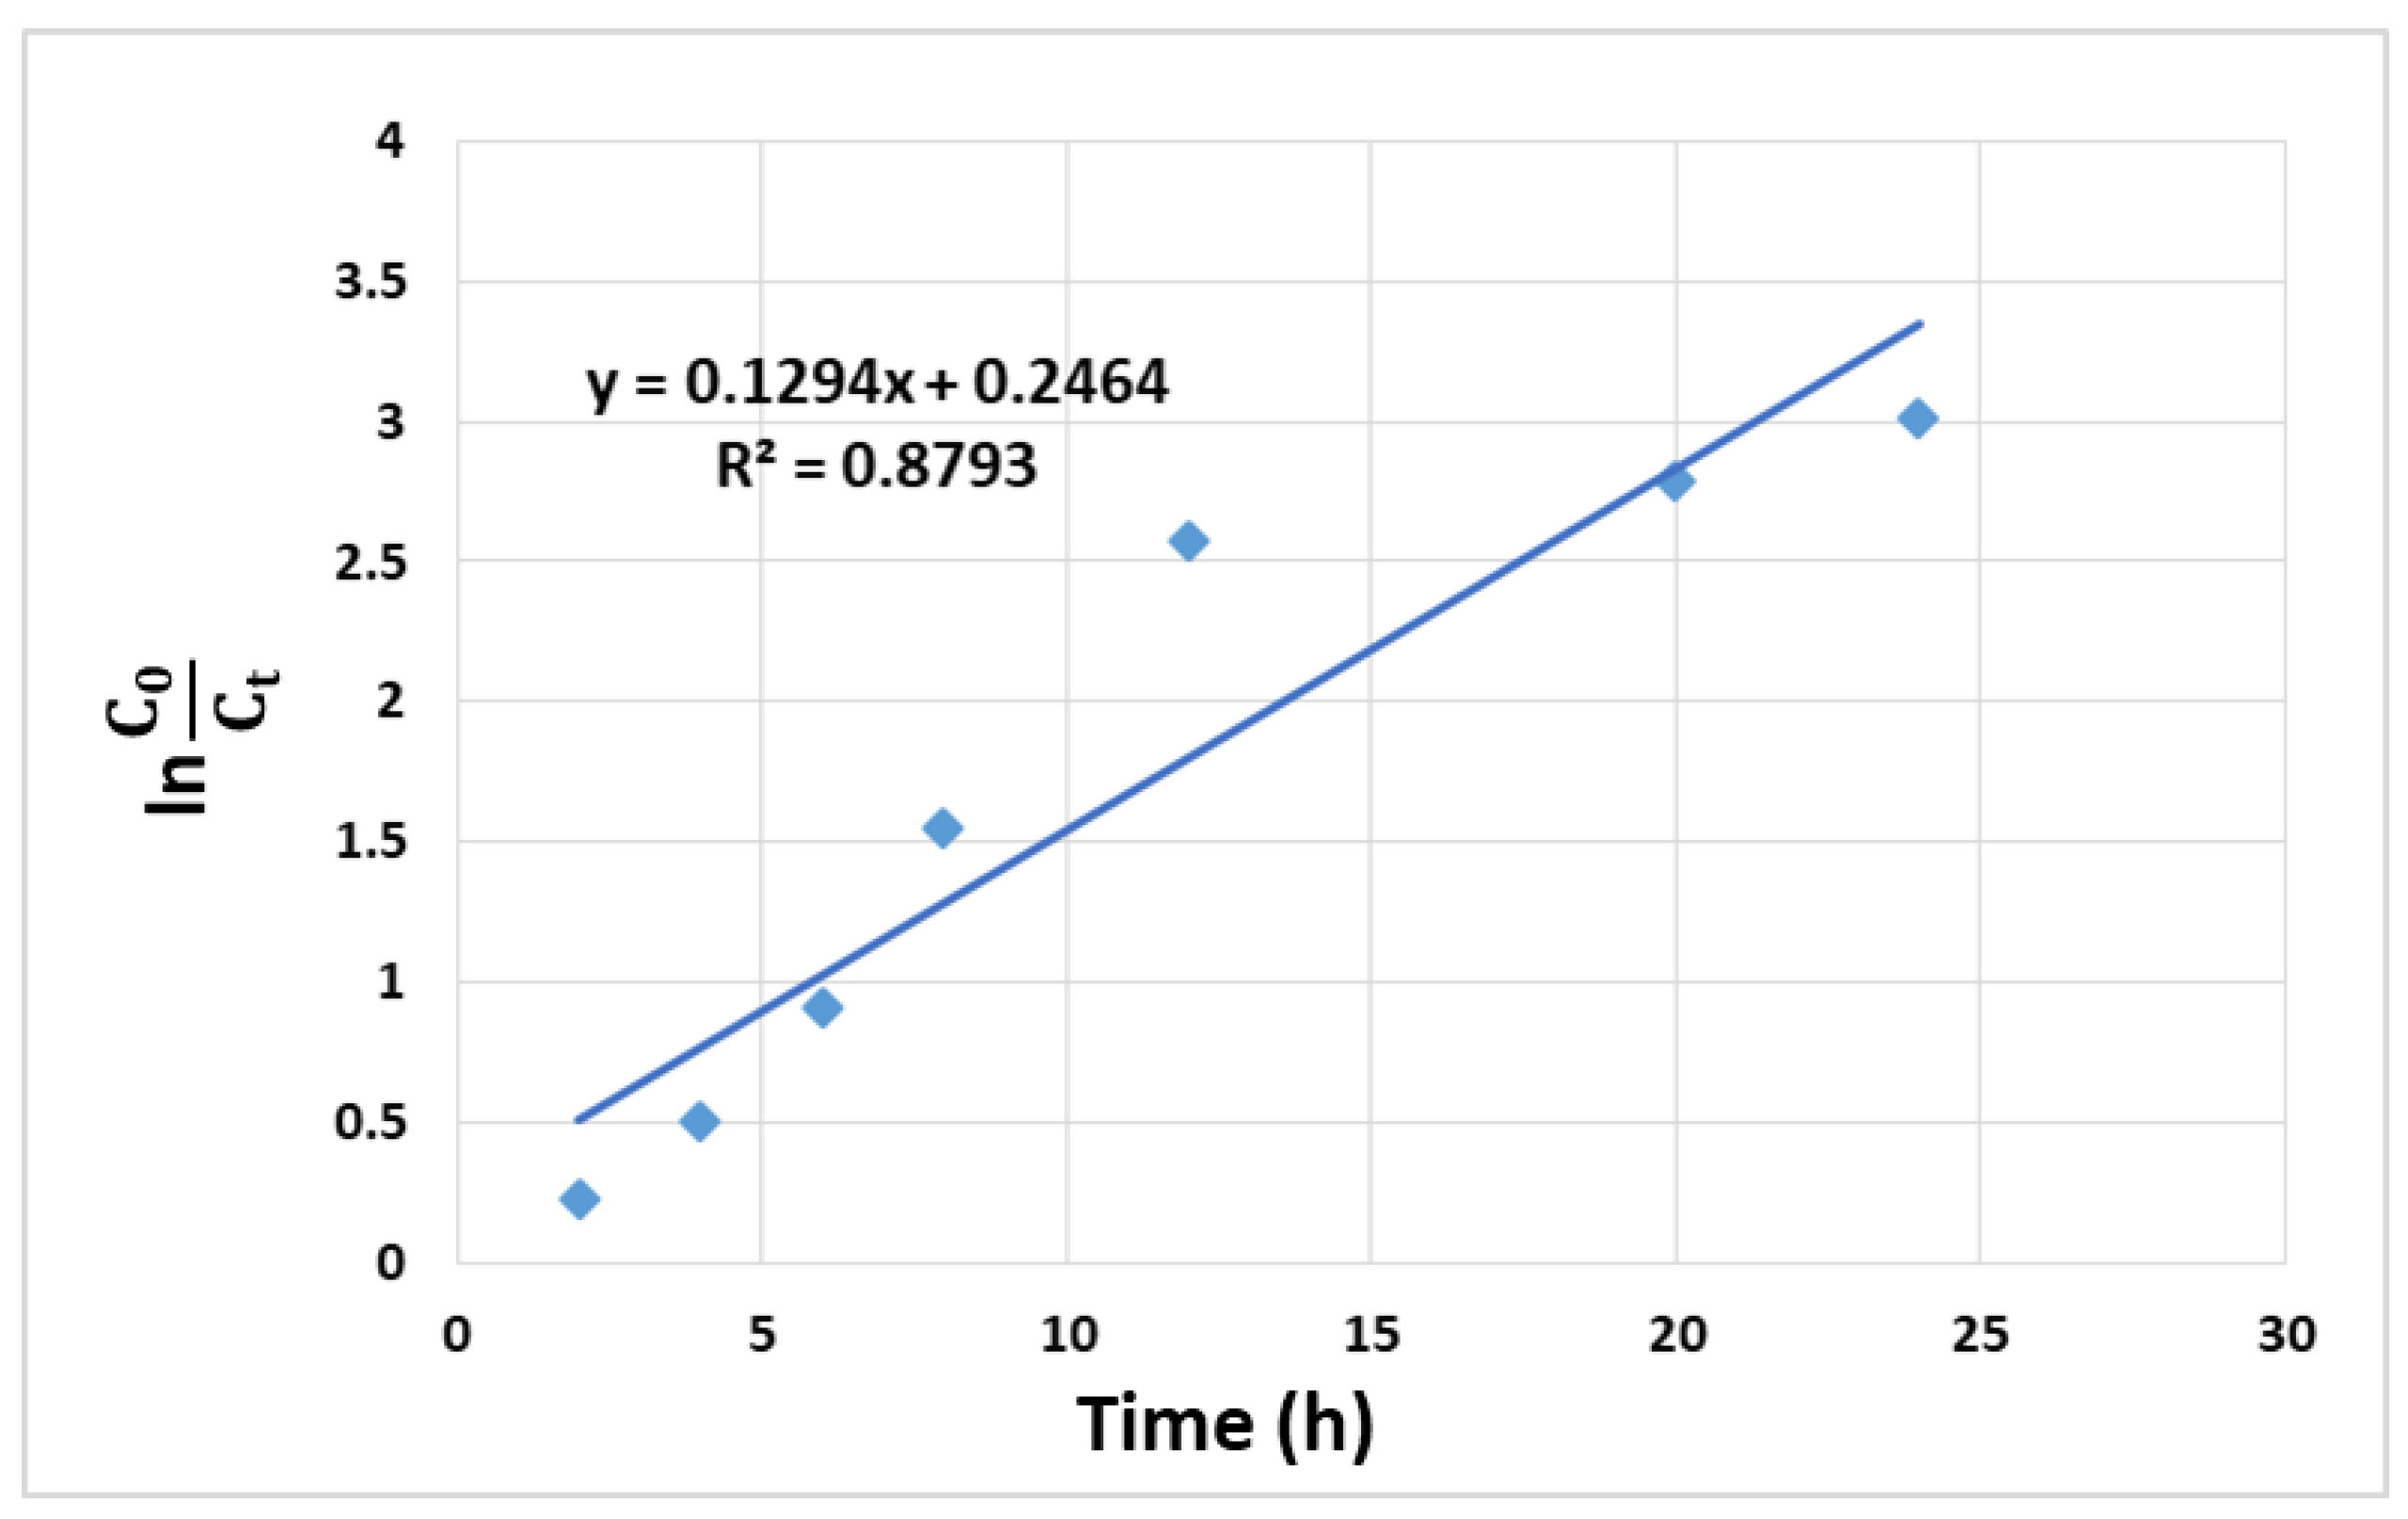
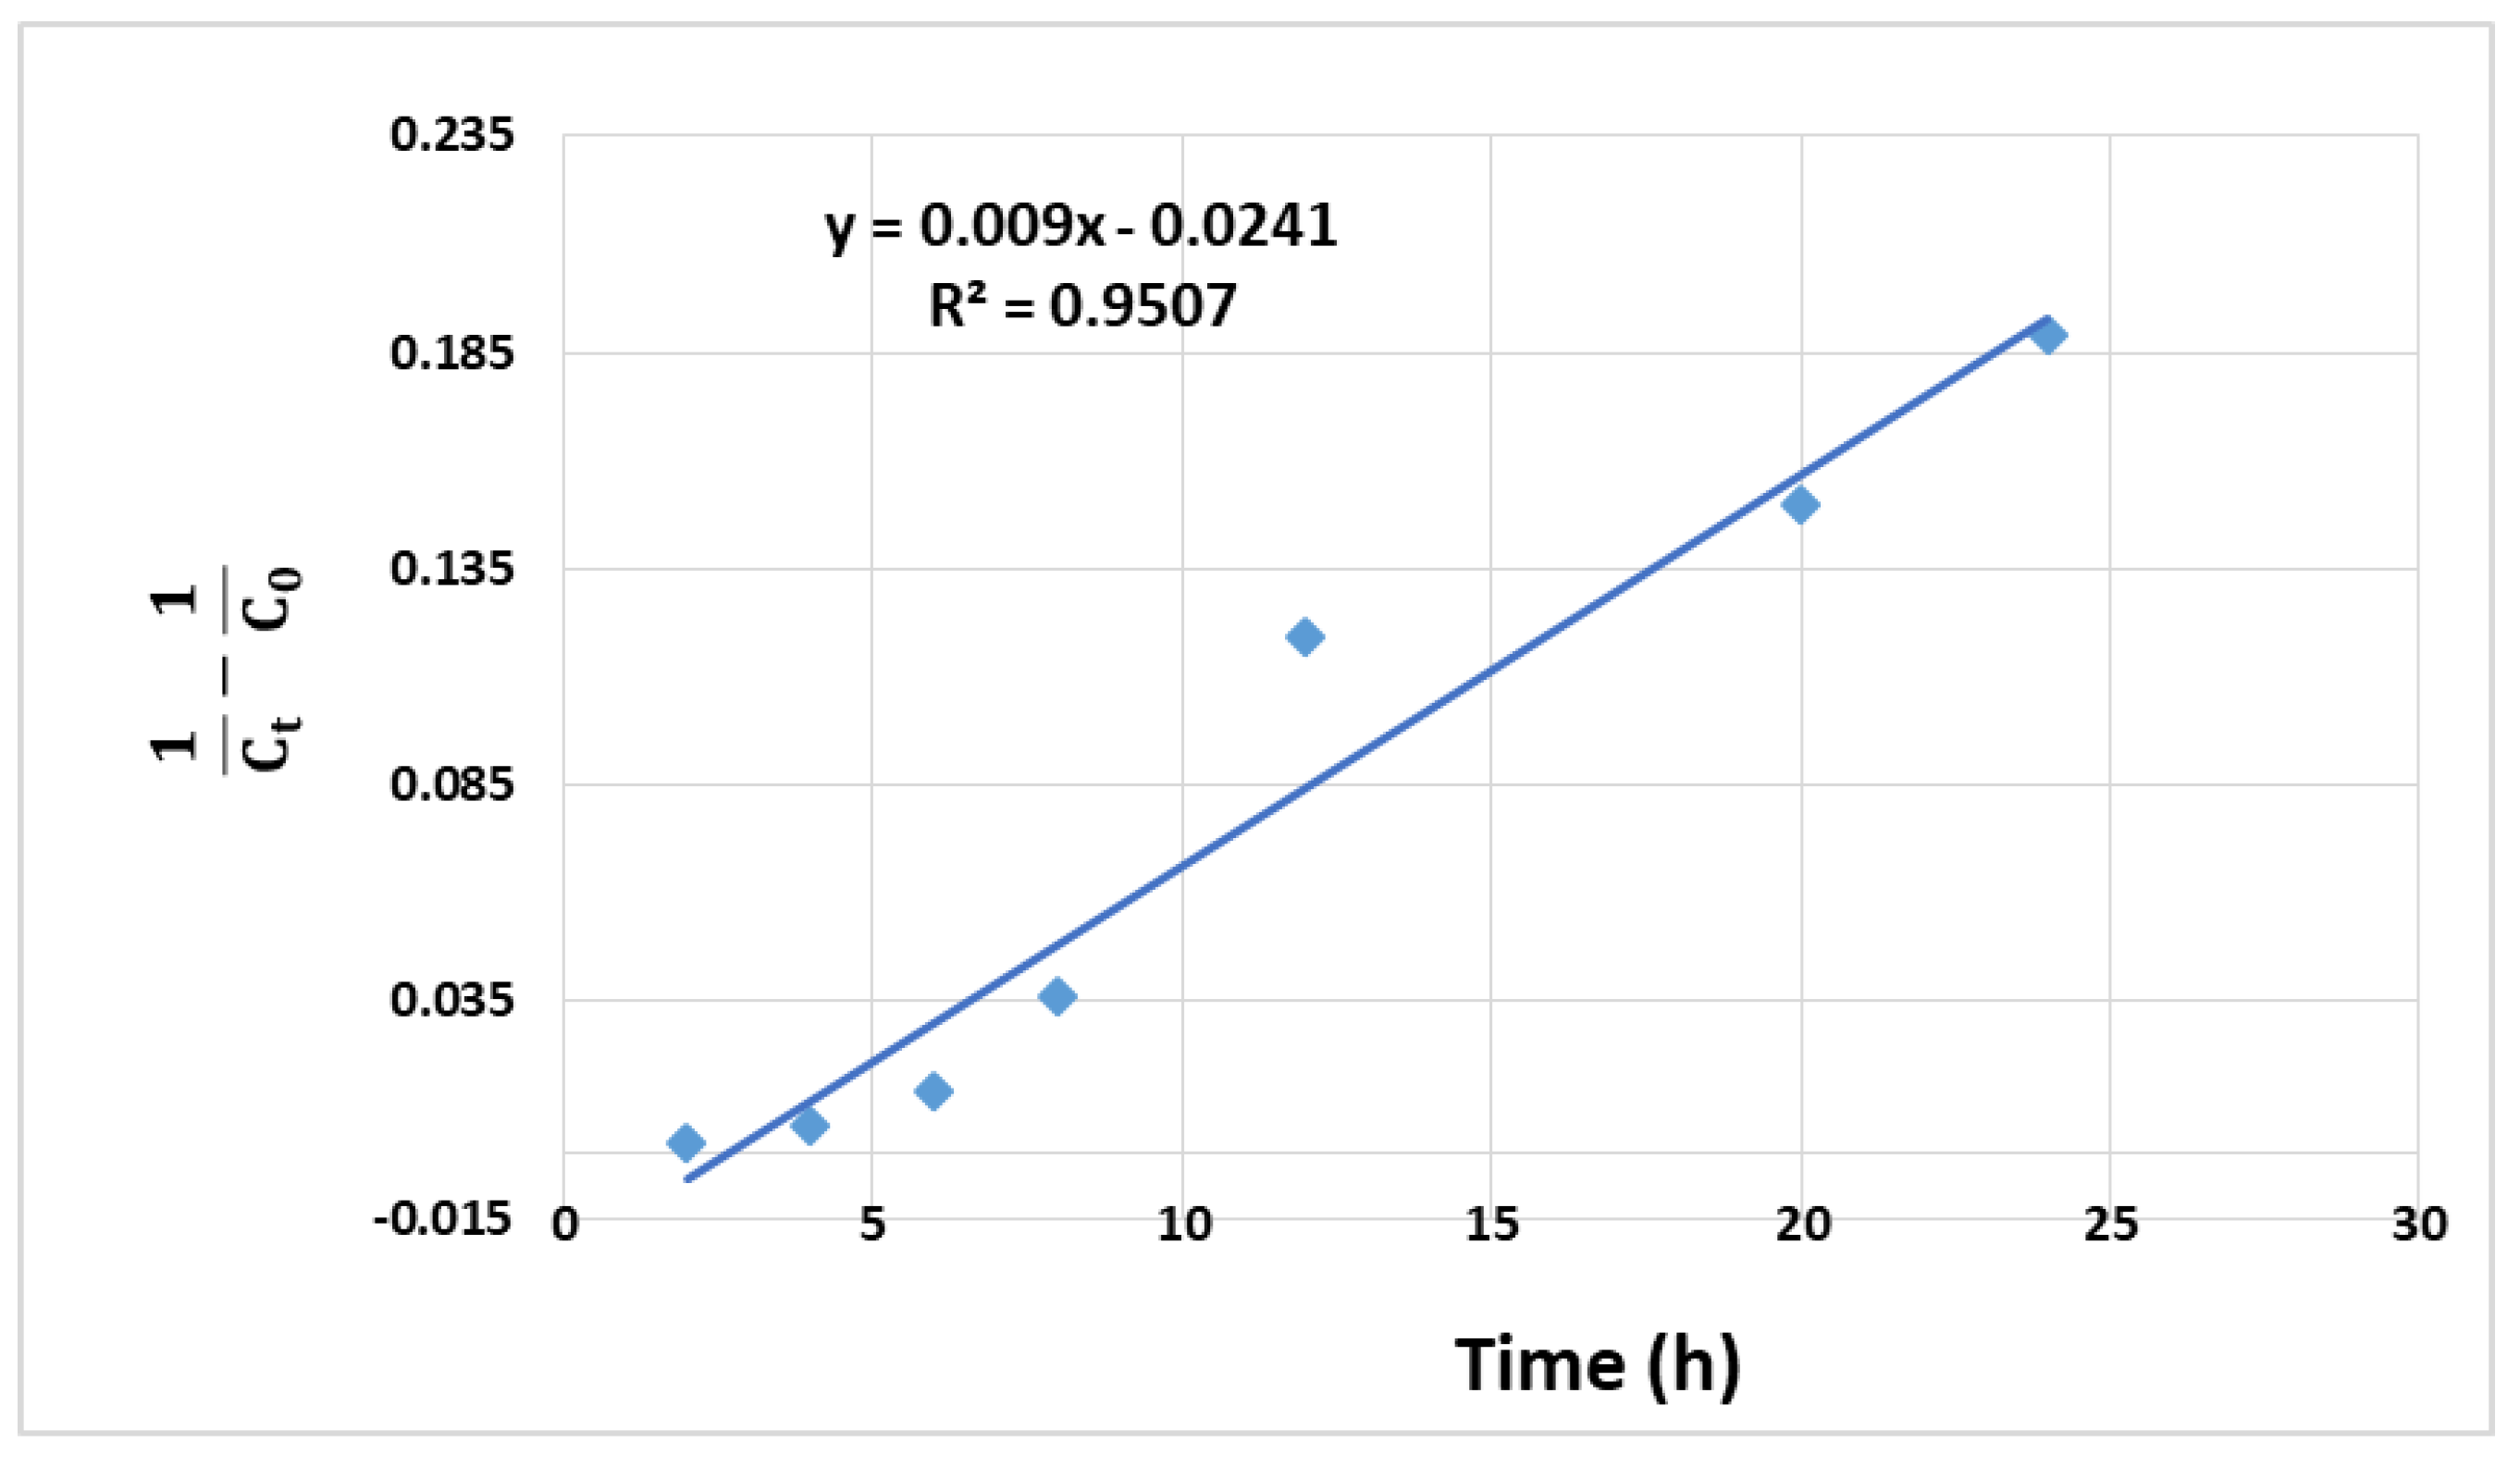
3.2.7. Degradation Kinetics of Phenol Using Fe-Cu Material

The classical kinetics is that of the first-order and second-order chemical reaction kinetics. The equations are shown as follows:
First-order kinetic model: lnCt = −k1·t + A1
Second-order kinetic model: 1/Ct = k2·t + A2
Third-order kinetic model: 1/Ct2 = 2k3·t + A3
where: k1 and k2 are the first-order and second-order reaction rate constants, respectively; A1, A2 and A3 are constants. C0 is the initial concentration of the phenol solution before decomposition (mg/L), which is 100 mg/L.
Based on the investigations on the efficiency of phenol degradation over time, we surveyed the kinetics of phenol degradation according to the first-, second-, and third-order kinetic equations, as shown in Figure 12, Figure 13 and Figure 14.
The results show that the degradation of phenol by internal microelectrolysis material of Fe-Cu seemed to follow the second-order apparent kinetics due to a higher linear regression coefficient (R2 = 0.9507) than those of other kinetics. The calculated reaction rate constant of k of the second-order model was 0.009 h−1Lmg−1.

3.2.8. Real Sample Analysis

In this study, the optimal experimental parameters, including a Fe-Cu mass of 10 g/L, a shaking time of 12 h, a pH of and a shaking rate of 200 rpm, were adopted for pre-treating real wastewater samples collected from a coal factory (Thai Nguyen Iron and Steel Joint Stock Company, Thai Nguyen Province, Vietnam). The results are shown in Figure 15 and Figure 16 and Table 4.
The mechanism of phenol degradation in the interior micro-electrolysis has been presented previously [25], and it involved the conversion of decomposed phenol into a less toxic intermediate compound. To be specific, during the micro-electrolysis process, radicals and oxidants are produced and oxidize organic compounds. This causes the destruction of structures of benzene ring and chemical bonds on its side chain, transforming toxic compounds into biodegradable intermediates [20]. Simultaneously, microelectron currents in the galvanic cell reaction also cause electron transfer, which promotes the growth and biodegradation capacity of microorganisms and stimulates active metabolic enzymes [32]. Furthermore, the justification of interior microelectrolysis technology for biological treatment is corroborated by its high degradation efficiency of refractory compounds and the ability to improve wastewater biodegradability [33].
The results in Table 3 show that the highest treatment efficiency was observed in the phenol parameter (70.07%), followed by the NH4+-N, BOD5 and COD. The remaining parameters exhibited lower removal efficiencies (<50%). Thus, further biological treatment methods are recommended in order to achieve steel industry wastewater standards [34].

4. Conclusions

A sample of Fe-Cu material for internal electrolysis was synthesized from Fe powder material by using the chemical plating method. The Cu content at the material surface reached 69.30% (by weight). The surface, structure and composition of the as-synthesized materials were characterized by scanning electron microscopy (SEM), energy-dispersive X-ray spectroscopy (EDS) and X-ray diffraction diagram (XRD), respectively.
The internal electrolysis-induced phenol decomposition was then studied with respect to various parameters, including pH, time, Fe-Cu material weight, phenol concentration and shaking speed. The optimal phenol decomposition (92.7%) was achieved at the pH value of 3, the shaking time of 12 h, the shaking speed of 200 rpm, the weight of Fe-Cu material of 10 g/L, the initial phenol concentration of 100.98 mg/L and at room temperature (25 ± 0.5 °C). The degradation of phenol using Fe-Cu materials obeyed the second-order apparent kinetics equation with a reaction rate constant of k of 0.009 L × mg−1h1. Further evaluation using real coking wastewater resulted in treated effluents with favorable water indicators, suggesting the suitability of Fe-Cu materials in practical processes to treat coking wastewater before biological treatment. Further studies should contemplate the evaluation of material stability through cyclic reactions.

Author Contributions

Investigation, D.T.H., N.V.T., D.T.T.A., N.A.T. and T.T.K.N.; supervision, L.V.T.; writing—original draft, D.T.H.; writing—review and editing, L.V.T. All authors have read and agreed to the published version of the manuscript.

Funding

This work was funded by the Ministry of Education and Training of Vietnam, under the project B2019-TNA-10.

Institutional Review Board Statement

Not applicable.

Informed Consent Statement

Not applicable.

Data Availability Statement

The data presented in this study are available on request from the corresponding author.

Acknowledgments

This work was completed with financial support from the Ministry of Education and Training of Vietnam, under the project B2019-TNA-10.

Conflicts of Interest

The authors declare no conflict of interest.

References

  1. Ma, L.; Zhang, W. Enhanced Biological Treatment of Industrial Wastewater with Bimetallic Zero-Valent Iron. Environ. Sci. Technol. 2008, 42, 5384–5389. [Google Scholar] [CrossRef] [Green Version]
  2. El-Gohary, F.A.; Kamel, G. Characterization and biological treatment of pre-treated landfill leachate. Ecol. Eng. 2016, 94, 268–274. [Google Scholar] [CrossRef]
  3. Visvanathan, C.; Abeynayaka, A. Developments and future potentials of anaerobic membrane bioreactors (AnMBRs). Membr. Water Treat. 2012, 3, 1–23. [Google Scholar] [CrossRef]
  4. Fan, J.-H.; Ma, L.-M. The pretreatment by the Fe–Cu process for enhancing biological degradability of the mixed wastewater. J. Hazard. Mater. 2009, 164, 1392–1397. [Google Scholar] [CrossRef]
  5. Yang, X.; Xue, Y.; Wang, W. Mechanism, kinetics and application studies on enhanced activated sludge by interior microelectrolysis. Bioresour. Technol. 2009, 100, 649–653. [Google Scholar] [CrossRef]
  6. Jin, Y.-Z.; Zhang, Y.-F.; Li, W. Micro-electrolysis technology for industrial wastewater treatment. J. Environ. Sci. 2003, 15, 334–338. [Google Scholar]
  7. Fan, L.; Ni, J.; Wu, Y.; Zhang, Y. Treatment of bromoamine acid wastewater using combined process of micro-electrolysis and biological aerobic filter. J. Hazard. Mater. 2009, 162, 1204–1210. [Google Scholar] [CrossRef]
  8. Zhu, Y.; Fang, Z.; Xia, Z. Study on the reaction materials for micro-electrolysis treatment of wastewater. Membr. Sci. Technol. Lanzhou 2001, 21, 56–60. [Google Scholar]
  9. Pan, L.; Wu, J.; Wang, J. Treatment of high mass concentration coking wastewater using enhancement catalytic iron carbon internal-electrolysis. J. Jiangsu Univ. Nat. Sci. Ed. 2010, 31, 348–352. [Google Scholar]
  10. Oh, S.-Y.; Chiu, P.C.; Kim, B.J.; Cha, D.K. Enhancing Fenton oxidation of TNT and RDX through pretreatment with zero-valent iron. Water Res. 2003, 37, 4275–4283. [Google Scholar] [CrossRef]
  11. Huang, L.; Sun, G.; Yang, T.; Zhang, B.; He, Y.; Wang, X. A preliminary study of anaerobic treatment coupled with micro-electrolysis for anthraquinone dye wastewater. Desalination 2013, 309, 91–96. [Google Scholar] [CrossRef]
  12. Yin, X.; Bian, W.; Shi, J. 4-chlorophenol degradation by pulsed high voltage discharge coupling internal electrolysis. J. Hazard. Mater. 2009, 166, 1474–1479. [Google Scholar] [CrossRef]
  13. Cui, D.; Guo, Y.-Q.; Lee, H.-S.; Wu, W.-M.; Liang, B.; Wang, A.-J.; Cheng, H.-Y. Enhanced decolorization of azo dye in a small pilot-scale anaerobic baffled reactor coupled with biocatalyzed electrolysis system (ABR–BES): A design suitable for scaling-up. Bioresour. Technol. 2014, 163, 254–261. [Google Scholar] [CrossRef] [PubMed]
  14. Li, G.; Guo, S.; Li, F. Treatment of oilfield produced water by anaerobic process coupled with micro-electrolysis. J. Environ. Sci. 2010, 22, 1875–1882. [Google Scholar] [CrossRef]
  15. Chen, R.; Chai, L.; Wang, Y.; Liu, H.; Shu, Y.; Zhao, J. Degradation of organic wastewater containing Cu–EDTA by Fe–C micro-electrolysis. Trans. Nonferrous Met. Soc. China 2012, 22, 983–990. [Google Scholar] [CrossRef]
  16. Qin, L.; Zhang, G.; Meng, Q.; Xu, L.; Lv, B. Enhanced MBR by internal micro-electrolysis for degradation of anthraquinone dye wastewater. Chem. Eng. J. 2012, 210, 575–584. [Google Scholar] [CrossRef]
  17. Zhu, Q.; Guo, S.; Guo, C.; Dai, D.; Jiao, X.; Ma, T.; Chen, J. Stability of Fe–C micro-electrolysis and biological process in treating ultra-high concentration organic wastewater. Chem. Eng. J. 2014, 255, 535–540. [Google Scholar] [CrossRef]
  18. Guan, X.; Xu, X.; Lu, M.; Li, H. Pretreatment of Oil Shale Retort Wastewater by Acidification and Ferric-Carbon Micro-Electrolysis. Energy Procedia 2012, 17, 1655–1661. [Google Scholar] [CrossRef] [Green Version]
  19. Yang, X. Interior microelectrolysis oxidation of polyester wastewater and its treatment technology. J. Hazard. Mater. 2009, 169, 480–485. [Google Scholar] [CrossRef] [PubMed]
  20. Cheng, H.; Xu, W.; Liu, J.; Wang, H.; He, Y.; Chen, G. Pretreatment of wastewater from triazine manufacturing by coagulation, electrolysis, and internal microelectrolysis. J. Hazard. Mater. 2007, 146, 385–392. [Google Scholar] [CrossRef]
  21. Ruan, X.C.; Liu, M.Y.; Zeng, Q.F.; Ding, Y.H. Degradation and decolorization of reactive red X-3B aqueous solution by ozone integrated with internal micro-electrolysis. Sep. Purif. Technol. 2010, 74, 195–201. [Google Scholar] [CrossRef]
  22. Bo, L.; Zhang, Y.; Chen, Z.Y.; Yang, P.; Zhou, Y.X.; Wang, J.L. Removal of p-nitrophenol (PNP) in aqueous solution by the micron-scale iron-copper (Fe/Cu) bimetallic particles. Appl. Catal. B Environ. 2014, 144, 816–830. [Google Scholar]
  23. Gang, Q.; Dan, G. Pretreatment of petroleum refinery wastewater by microwaveenhanced Fe0/GAC micro-electrolysis. Desalination Water Treat. 2014, 52, 2512–2518. [Google Scholar] [CrossRef]
  24. Xiaoying, Z.; Mengqi, J.; Xiang, Z.; Wei, C.; Dan, L.; Yuan, Z.; Xiaoyao, S. Enhanced removal mechanism of iron carbon micro-electrolysis constructed wetland on C, N, and P in salty permitted effluent of wastewater treatment plant. Sci. Total Environ. 2019, 1, 21–30. [Google Scholar]
  25. Weiwei, M.; Yuxing, H.; Chunyan, X.; Hongjun, H.; Wencheng, M.; Hao, Z.; Kun, L.; Dexin, W. Enhanced degradation of phenolic compounds in coal gasification wastewater by a novel integration of micro-electrolysis with biological reactor (MEBR) under the micro-oxygen condition. Bioresour. Technol. 2018, 251, 303–310. [Google Scholar] [CrossRef]
  26. Peng, L.; Zhipeng, L.; Xuegang, W.; Yadan, G.; Lizhang, W. Enhanced decolorization of methyl orange in aqueous solution using ironecarbon micro-electrolysis activation of sodium persulfate. Chemosphere 2017, 180, 100–107. [Google Scholar]
  27. Tianguo, L.; Zhengyang, D.; Ronggao, Q.; Xiaojun, X.; Bo, L.; Yue, L.; Ming, J.; Fangdong, Z.; Yongmei, H. Enhanced characteristics and mechanism of Cu(II) removal from aqueous solutions in electrocatalytic internal micro-electrolysis fluidized-bed. Chemosphere 2020, 126225. [Google Scholar] [CrossRef]
  28. Cwiertny, D.M.; Bransfield, S.J.; Livi, K.J.T.; Fairbrother, D.H.; Roberts, A.L. Exploring the Influence of Granular Iron Additives on 1,1,1- Trichloroethane Reduction. Environ. Sci. Technol. 2006, 40, 6837–6843. [Google Scholar] [CrossRef]
  29. Xu, W.Y.; Gao, T.Y. Dechlorination of carbon tetrachloride by the catalyzed Fe-Cu process. J. Environ. Sci. 2007, 19, 792–799. [Google Scholar] [CrossRef]
  30. Ma, L.M.; Ding, Z.G.; Gao, T.Y.; Zhou, R.F.; Xu, W.Y.; Liu, J. Discoloration of methylene blue and wastewater from a plant by a Fe/Cu bimetallic system. Chemosphere 2004, 55, 1207–1212. [Google Scholar] [CrossRef]
  31. Xu, W.Y.; Gao, T.Y.; Fan, J.H. Reduction of nitrobenzene by the catalyzed Fe/Cu process. J. Environ. Sci. 2008, 20, 915–992. [Google Scholar] [CrossRef]
  32. Yang, Z.; Ma, Y.; Liu, Y.; Li, Q.; Zhou, Z.; Ren, Z. Degradation of organic pollutants in near-neutral pH solution by Fe-C micro-electrolysis system. Chem. Eng. J. 2017, 315, 403–414. [Google Scholar] [CrossRef]
  33. Wu, S.; Qi, Y.; Fan, C.; Dai, B.; Huang, J.; Zhou, W.; He, S.; Gao, L. Improvement of anaerobic biological treatment effect by catalytic micro-electrolysis for monensin production wastewater. Chem. Eng. J. 2016, 296, 260–267. [Google Scholar] [CrossRef]
  34. Huong, D.T.; Nguyen, V.T.; Ha, X.L.; Nguyen Thi, H.L.; Duong, T.T.; Nguyen, D.C.; Nguyen Thi, H.-T. Enhanced Degradation of Phenolic Compounds in Coal Gasification Wastewater by Methods of Microelectrolysis Fe-C and Anaerobic-Anoxic—Oxic Moving Bed Biofilm Reactor (A2O-MBBR). Processes 2020, 8, 1258. [Google Scholar] [CrossRef]
Figure 1. SEM image of Fe material.
Processes 09 00720 g001
Figure 2. SEM image of Fe-Cu material.
Processes 09 00720 g002
Figure 3. The EDS spectrum of material Fe.
Processes 09 00720 g003
Figure 4. EDS spectrum of Fe-Cu material.
Processes 09 00720 g004
Figure 5. XRD spectrums of Fe and Fe-Cu materials.
Processes 09 00720 g005
Figure 6. Effect of pH on the phenol removal performance of Fe-Cu material.
Processes 09 00720 g006
Figure 7. The effect of time on the phenol removal performance of Fe-Cu material.
Processes 09 00720 g007
Figure 8. The effect of material dosage on phenol removal performance of Fe-Cu material.
Processes 09 00720 g008
Figure 9. The effect of shaking speed on the phenol removal efficiency of Fe-Cu material.
Processes 09 00720 g009
Figure 10. The effect of initial phenol concentration on the phenol removal capability of Fe-Cu material.
Processes 09 00720 g010
Figure 11. Chromatographic lines of a phenol solution sample depend on the amount of Fe-Cu material. Red curve: chromatogram of an untreated phenol sample (100.98 mg/L). Blue curve: chromatogram of a phenol sample treated with the following conditions: initial phenol concentration of 100.98 mg/L, Fe-Cu material weight of 5 g/L, shaking time of 12 h, shaking speed of 200 rpm, at pH = 3. Black curve: chromatogram of a phenol sample treated with the following conditions: initial phenol concentration of 100.98 mg/L, Fe-Cu material weight of 10 g/L, shaking time of 12 h, shaking speed of 200 rpm, at pH = 3.
Processes 09 00720 g011
Figure 12. Model of the first-order apparent kinetics.
Processes 09 00720 g012
Figure 13. Model of the second-order apparent kinetics.
Processes 09 00720 g013
Figure 14. Model of the third-order apparent kinetics.
Processes 09 00720 g014
Figure 15. Chromatograms of wastewater samples containing phenols before treatment using Fe-Cu internal microelectrolysis material.
Processes 09 00720 g015
Figure 16. Chromatograms of wastewater samples containing phenols after treatment using Fe-Cu internal microelectrolysis material.
Processes 09 00720 g016
Table 1. Parameters for single factor investigations.
InvestigationpHTime (h)Fe-Cu Dosage (g)Shaking Speed (rpm)Initial Phenol Concentration (mg/L)
Effect of pH2, 3, 4, 5, 6, 7 and 8121200100
Effect of time32, 4, 6, 8, 12, 20 and 241200100
Effect of material dosage3120.25, 0.5, 0.75, 1.0, 1.25 and 1.5200100
Effect of shaking speed3121100, 120, 150, 180 and 200100
Effect of initial phenol concentration312120050, 100, 150, 200, 250 and 300
Table 2. Results of analyzing Fe sample elements.
Elements% Mass% Atom
O8.9525.55
Fe91.0574.45
Total100.00100.00
Table 3. Results of analyzing Fe-Cu sample elements.
Elements% Mass% Atom
O12.1124.97
Fe18.5921.83
Cu69.3053.20
Total100.00100.00
Table 4. Parameters of coking wastewater before and after treatment using Fe-Cu materials.
ParametersUnitMethod of AnalysisResult (mg/L)Efficiency
H (%)
BeforeAfter
DOmg/LTCVN 7325:20040.62.8-
TSSmg/LSMEWW 2540 D:201212463.448.87
BOD5(20 °C)mg/LTCVN 6001-1:20081215540.655.50
CODmgO2/LSMEWW 5220C:20122379118950.02
Phenolmg/LTCVN 6216:1996173.7050.8670.07
CNmg/LSMEWW4500 CNB:20120.05<0.01-
Total Nmg/LTCVN 6638:200087664426.48
NH 4 + -Nmg/LTCVN 6179-1:1996473165.265.07
Total Pmg/LTCVN 6202:200815.69.340.38
Publisher’s Note: MDPI stays neutral with regard to jurisdictional claims in published maps and institutional affiliations.

