
Novel Strategy for the Calorimetry-Based Control of Fed-Batch Cultivations of Saccharomyces cerevisiae


1
School of Engineering and Architecture of Fribourg, HES-SO University of Applied Sciences and Arts Western Switzerland, CH-1700 Fribourg, Switzerland
2
School of Biotechnology, Dublin City University, Glasnevin, 9 Dublin, Ireland
*
Author to whom correspondence should be addressed.
Processes 2021, 9(4), 723; https://0-doi-org.brum.beds.ac.uk/10.3390/pr9040723
Submission received: 15 March 2021
/
Revised: 5 April 2021
/
Accepted: 14 April 2021
/
Published: 20 April 2021
(This article belongs to the Special Issue Bioreactor System: Design, Modeling and Continuous Production Process)
Abstract
:Typical controllers for fed-batch cultivations are based on the estimation and control of the specific growth rate in real time. Biocalorimetry allows one to measure a heat signal proportional to the substrate consumed by cells. The derivative of this heat signal is usually used to evaluate the specific growth rate, introducing noise to the resulting estimate. To avoid this, this study investigated a novel controller based directly on the heat signal. Time trajectories of the heat signal setpoint were modelled for different specific growth rates, and the controller was set to follow this dynamic setpoint. The developed controller successfully followed the setpoint during aerobic cultivations of Saccharomyces cerevisiae, preventing the Crabtree effect by maintaining low glucose concentrations. With this new method, fed-batch cultivations of S. cerevisiae could be reliably controlled at specific growth rates between 0.075 h−1 and 0.20 h−1, with average root mean square errors of 15 ± 3%.
1. Introduction
Biotechnology is a science that has developed remarkably in recent decades thanks to a wide range of applications including the production of complex organic molecules (biologics) with high selectivity, such as proteins for biomedical purposes [1], functional foods and alcohols via the industrial fermentation of Saccharomyces cerevisiae [2]. The application of on-line monitoring tools creates extensive opportunities for process modelling [3], automation [4], optimisation [5] and control [6]. Furthermore, process supervision is increasingly required by government regulations to ensure consistent product quality and improve early fault detection. With the vision of encouraging Quality by Design [7], the Federal Drug Administration (FDA) proposed in 2004 a uniform initiative named Process Analytical Technology (PAT), aiming to promote bioprocess monitoring to an integral component of all industrial processes [8].
As discussed by Dabros et al. (2010), the estimation and control of the specific growth rate is highly desirable in order to maximise cell growth or product formation; however, it proves difficult due to signal noise [9]. Since µ corresponds to the slope of the biomass concentration curve in time, the derivative amplifies the noise of the measurement. Therefore, there is a strong need for a more reliable technique that is less sensitive to the internal variations in the system. Since microorganisms release a specific amount of heat during their growth, biocalorimetry is a promising method to monitor bioprocesses [10]. The measured heat signal can be used for the direct control of fed-batch cultures [11] or coupled with other monitoring methods to consolidate data [12]. Crabtree-positive microorganisms such as S. cerevisiae experience a change in metabolism when the glucose concentration in the culture medium is increased above a critical value. Enthalpies of these metabolisms are significantly different and could be used to detect a change in metabolism during microbial cultures [13].
Over the last twenty years, many authors have focused on Crabtree-negative microorganisms to perform calorimetric measurements [13]. They have investigated calorimetry as a process analytical tool for batch and fed-batch cultures of Crabtree-negative microorganisms from small [14] to large scales [15] (2–200 L), operating only in aerobic conditions with high glucose concentrations. In 1985, Marison and von Stockar used, for the first time, a biocalorimeter to study the growth of E. coli in batch mode under aerobic conditions [16]. The heat flow is a good indicator of the metabolic activity [17]. This property allowed Larsson et al. (1991) to control fed-batch cultures of S. cerevisiae by biocalorimetry using an on/off-controller, and adding glucose only when the growth rate (hence the heat flow) was equal to zero [18]. Voisard et al. (1998) used reaction calorimetry to monitor and control both batch and fed-batch microbial cultures to produce two chemicals [19]. In a further work (2002), scale-up studies performed using a 300 L biocalorimeter proved that pilot-scale calorimetric measurements were possible with precisely characterised heat transfers [15]. Bacillus sphaericus was cultured using a calorimetry-based control system, and a power of 2250 W was achieved at the end of lag phase. With these experiments, they demonstrated the feasibility of biocalorimetry from bench to production scale.
Biener et al. (2010) applied biocalorimetry to follow a high cell density E. coli culture. The heat flow signal of an adapted bioreactor at 20 L scale was used to calculate the growth rate in real time, and to control the growth rate in order to follow a setpoint value (µsp) [20]. The growth rate was maintained at a low level to avoid the production of overflow metabolites (acetate was monitored), and all experiments were performed in aerobic mode. In a further study, Biener et al. (2012) adapted their experiment to S. cerevisiae [13]. Using the same control parameters as for E. coli, they successfully controlled a yeast culture. This experiment was also performed under aerobic conditions and the growth rate was kept low enough to avoid the production of fermentation metabolites. Similar experiments were conducted by Schuler et al. (2012). They controlled Crabtree-negative yeast cultures (three strains) in a BioRC1 [21] with a sensitivity range of 8 mW L−1. The growth rate was controlled by a PI feed-back controller, as described by Dabros et al. (2010) [9]. Errors smaller than 4% were reported with good robustness and stability. In 2017, Mohan et al. published a proof of concept study of the usage of a heat compensation calorimeter as a PAT tool to monitor cultures of P. pastoris and S. zooepidermicus with a high sensitivity (6.73 mW L−1) but without considering metabolisms [10]. In 2020, Katla et al. used biocalorimetry to monitor cultures of glycoengineered P. pastoris in a heat compensation calorimeter with different feeding strategies [22]. They used dielectric spectroscopy to confirm estimations made by calorimetry.
Recently, Bayer et al. (2020) indicated that rate-based microbial growth estimation could be highly problematic due to inherent measurement noise. Using simulated data, they proposed a new cubic spline filtering technique to manage analytical variances in the specific growth rate data more robustly, while removing the standard averaging time lag [23]. Other simulation studies were reported using cumulative process variables, including the cumulative oxygen consumption rate with artificial neural network (ANN) modelling to provide a more stable estimate of biomass for E. coli and S. cerevisiae cultures, which led to more stable specific growth rate estimation [24]. Furthermore, Galvanauskas et al. (2019) implemented ANN-based specific growth rate control to E. coli cultures [25]. Butkus et al. (2020) proposed a simulation of a fuzzy logic-based specific growth rate controller, comparing it with a PI controller performance. Their simulation studies determined that a successful PI control would require deep process knowledge, whereas soft-sensor-based approaches could produce a noise insensitive process response [26]. Previously steady-state control responses were reported for feed-forward/feedback PI controller simulations of fed-batch microbial bioprocess models [27]. Some progress has been made to apply a control methodology to high-concentration S. cerevisiae bioprocesses, including merging multiple batch-processes within a fed-batch optimization [28].
The aim of this work was to use the information provided by the calorimetric signal to develop a novel robust controller for low-density cultivations of Crabtree-positive S. cerevisiae, in aerobic fed-batch mode. By designating the heat flow signal directly as the control variable, the noise inherent to on-line growth rate estimates can be circumvented, allowing for more stable growth control while preventing the Crabtree effect.
2. Materials and Methods
2.1. Strain and Cell Bank
Saccharomyces cerevisiae (SafAle™ US-05, Fermentis, Marcq-en-Barœul, France) strain was used to carry out all experiments. Cells were suspended at 20% in equal proportions of 20 g L−1 glycerol solution and 9 g L−1 NaCl solution, and then stored at −20 °C as 1.8 mL aliquots. These aliquots were used for inoculum preparation.
2.2. Growth Media and Culture Conditions
Cells were precultured in 100 mL of sterile medium in a 1 L shake flask. The flask was incubated at 30 °C on a shaker at 200 rpm for 24 h. The preculture medium had the following composition (in g L−1): D-(+)-glucose (20), yeast extract (10) and peptone from casein (10).
Cells were isolated and used to inoculate the bioreactor. The initial mass of culture medium (mr,0) in the bioreactor was 300 g and the initial biomass concentration was 0.5 g kg−1. To prevent the Crabtree effect during the initial batch phase and to preserve a low cell concentration at the beginning of the fed-batch phase, the glucose concentration in the culture medium was kept low. The culture medium had the following composition (in g kg−1): D-(+)-glucose (0.03), ammonium sulfate (5.0), potassium dihydrogen phosphate (3.0), magnesium sulfate heptahydrate (0.5), yeast extract (1.0) and peptone from casein (1.0). Cultures were carried out at 30 °C, the pH was controlled at pH 5 using 2M NaOH, the culture medium was stirred at 600 rpm and the air sparging rate was set to 1.7 L min−1 (3.4 VVM).
The feed solution was dosed according to the feeding strategy described below and had the following composition (in g kg−1): D-(+)-glucose (200.0), ammonium sulfate (20.0), potassium dihydrogen phosphate (12.0), magnesium sulfate heptahydrate (1.5), yeast extract (5.0) and peptone from casein (5.0).
2.3. Bioreactor and Calorimetric Set-Up
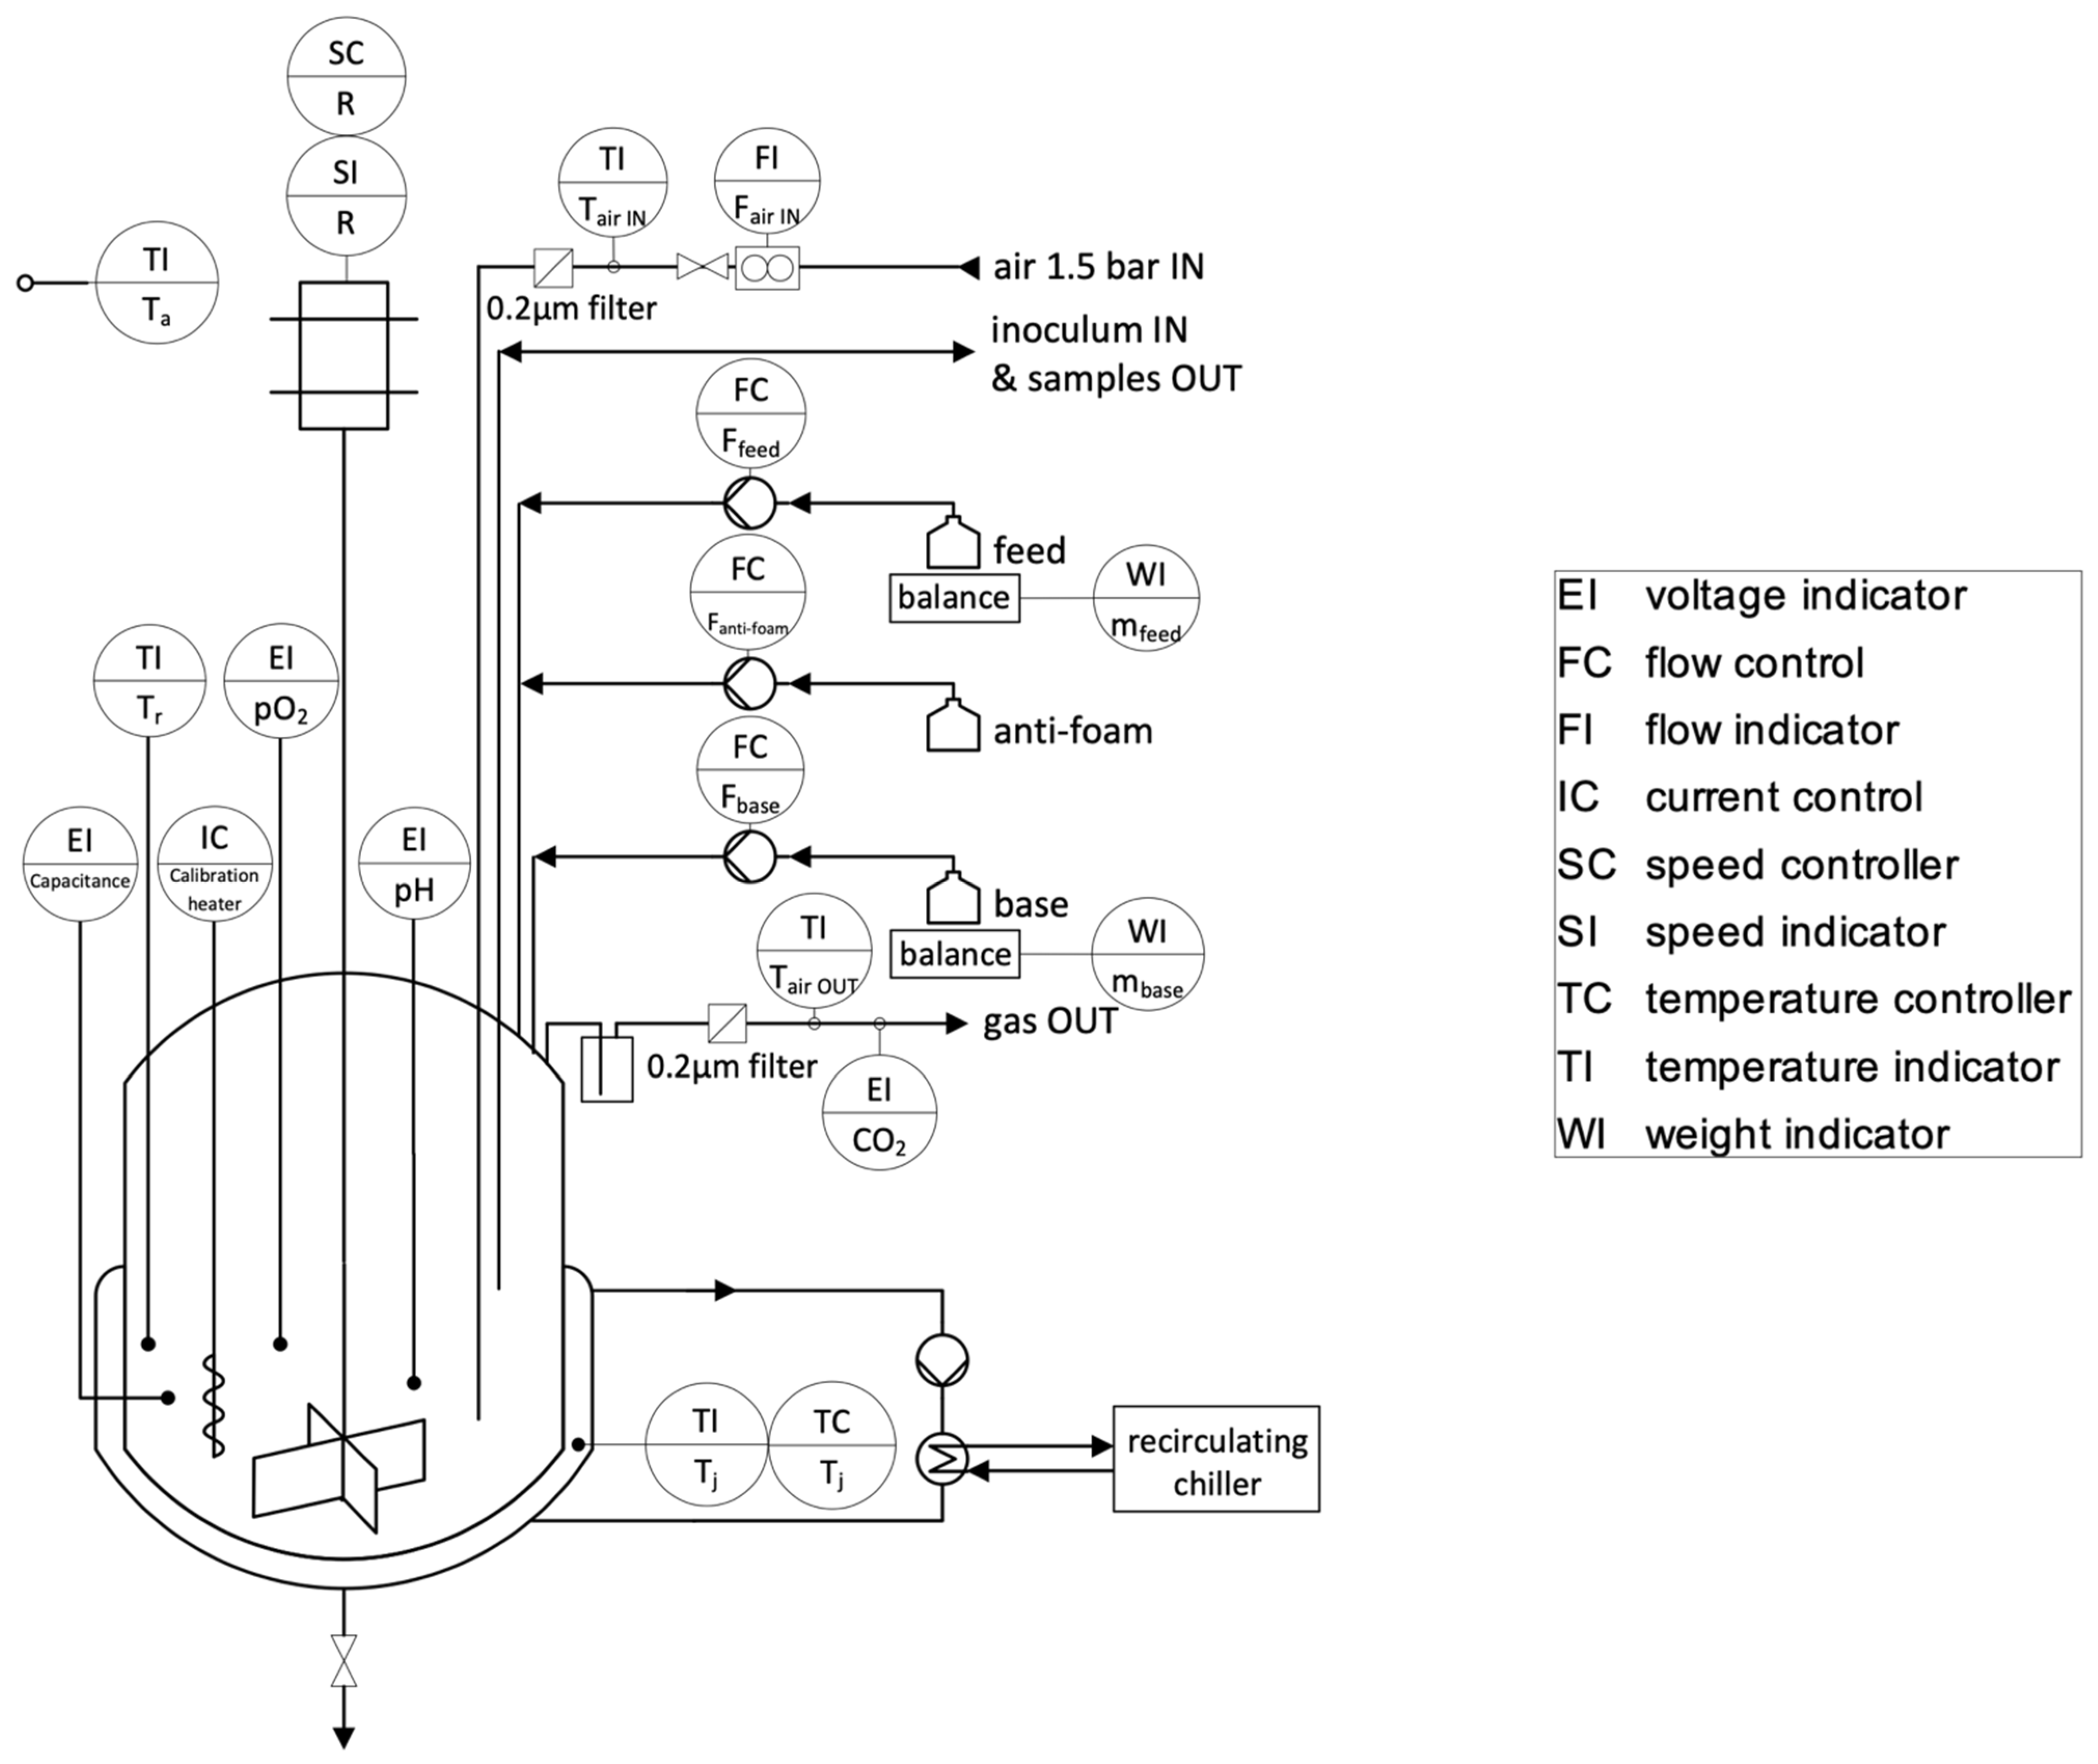
The experimental set-up is shown in Figure 1. A standard glass 0.5 L reaction calorimeter (Reaction Calorimeter RC1e, Mettler-Toledo, Greifensee, Switzerland) was adapted to perform cultures of microorganisms. The culture medium temperature (Tr) and the jacket temperature (Tj) were measured using built-in Pt-100 probes. The ambient temperature (Ta), the temperature at the air inlet (Tair IN) and the temperature at the gas outlet (Tair OUT) were measured with additional type-K thermocouple sensors. All temperature sensors were adjusted monthly using a Pt-100 reference probe (P755-LOG, Dostmann, Wertheim-Reicholzheim, Germany). The reaction calorimeter built-in Tj control system was cooled by an external recirculating chiller (A40 Presto, Julabo, Seelbach, Germany). A calibration heater with a power of 5.54 W (Standard calibration heater, Mettler-Toledo, Greifensee, Switzerland) was installed.
The stirring rate (R) of a 4-bladed glass propeller stirrer was controlled by a motor with speed controller. The air sparging rate (Fair IN) was set using a flowmeter (Mass-View, Bronkhorst, Ruurlo, Netherlands). A sintered metal sparger was used to disperse air in the culture medium. Anti-foam (1% silicone anti-foam suspension) and feed solutions were precisely dosed using peristaltic pumps (Ismatec REGLO Analog, Cole-Parmer, Wertheim, Germany) and a precision balance (TLE, Mettler-Toledo, Greifensee, Switzerland) for the feed line. A sampling cannula enabled inoculation and sampling of the culture medium. A built-in pH control system with a pH-electrode allowed one to control the culture medium at pH 5.0 ± 0.1 by addition of 2M NaOH.
The biomass concentration was followed by dielectric spectroscopy using a capacitance probe (FUTURA Biomass, Aber Instrument, Aberystwyth, UK). Dissolved oxygen (pO2) was measured with an optical probe (Visiferm DO 325, Hamilton Company, Reno, NV, USA). The CO2 concentration in the off-gas was followed using an infrared absorption sensor (TANDEM PRO Gas Analyser, Magellan BioTech, Borehamwood, UK).
All signals were acquired, filtered (backward moving median filter over 10 min) and treated in LabView (LabView 2018.0.1f4, National Instrument, Austin, TX, USA) as OPC and OPC UA variables. Calorimetry data were exported as text files for post processing in MATLAB (MATLAB R2020b, MathWorks, Natick, MA, USA).
2.4. Sampling and Analyses
Samples were taken manually at intervals of 30 to 120 min, depending on the growth phase. Optical density of samples was measured at 600 nm using a UV/VIS spectrophotometer (V-1200 Spectrophotometer, VWR, Radnor, PA, USA). The spectrophotometer was blanked with pure culture medium and samples were diluted to get absorbances between 0.1 and 0.8. Dry-cell-weight (DCW) was determined gravimetrically by the filtration of 1 g of sample through 0.22 µm sterile, hydrophobic syringe filters. Filters were dried until consistency of weight at 98 °C.
An FTIR spectrophotometer was calibrated using a PLS1 regression model based on 7 levels and 6 factors. The seven factors included the concentrations of D-(+)-glucose, ethanol, ammonium, phosphate, yeast extract/peptone and water. Fifty experiments were carried out with 64 spectra per sample acquired at a spectral resolution of 2 cm−1 between 950 cm−1 and 1200 cm−1. The DoE matrix was based on Brereton (1998) [29]. The FTIR spectrophotometer allowed one to measure concentrations of glucose and ethanol from 0 to 22.5 g L−1 (±0.3 g L−1, limit of quantification (LoQ) at 0.5 g L−1) and 0 to 12.5 g L−1 (±0.1 g L−1, LoQ at 0.1 g L−1), respectively. Samples were preliminarily filtered on 0.2 µm filters to remove cells.
2.5. Heat Balance Model
The heat balance model presented in Equation (1) was adapted from works published by von Stockar (1989), Voisard (1998, 2002), Biener (2010, 2012), Sivaprakasam (2011), Schuler (2012) and Mohan (2017) [11,13,14,15,19,20,21,30].
As the uncertainty of the level sensor was too high (±25 mL) for an accurate estimation of the reaction medium volume, it was decided to use mass units instead of volumetric units. The precision balances used had an uncertainty smaller or equal to ±0.1 g. The mass balance was evaluated in real-time, allowing for a precise evaluation of the heat balance model. In isothermal conditions such as during fed-batch cultures, the accumulation term (qacc) is considered equal to zero. As the energy released by the stirrer (qstir) and the heat losses to the environment (qloss) were indissociable in the conducted experiments, a baseline flow term (qb) was defined in Equation (2) as proposed by Voisard (2002) [14].
The heat flow to the reactor jacket (qex) was calculated according to Equation (3) from the overall heat transfer coefficient (U), the heat exchange area (A) and the temperature difference between Tr and Tj.
A calibration heater providing a constant power (qcal) of 5.54 W was used to determine qb and the product of U and A (UA) at steady state but was switched off during cell cultures. A DoE was built according to Brereton (1998) and models were developed for qb (Equation (4)) and UA (Equation (5)) using response surface methodology—a data-driven mode fitting and optimization approach introduced by Box and Wilson [31].
The resulting model for qb, valid for this experimental set-up, showed that qb depended on the temperature difference between Tr and Ta, R and the mass of culture medium filled in the reactor (mr). The resulting model for UA, valid for this experimental set-up, showed that UA depended on mr, Tr and R. The effect of the gassing term (qgas) on the heat balance was measured. A DoE was built according to Brereton (1998) and a model was developed (Equation (6)) using response surface methodology. The air entering the reactor increased in temperature and carried evaporated water when leaving the reactor. It was noticed that the energy needed to heat the gas was negligible compared to the energy required to evaporate water that was stripped.
At culture conditions, qgas depended only on mr and Fair IN. The temperature difference between Tair IN and Tair OUT was indeed smaller than 0.1 °C. The heat removed from the system by the produced CO2 (qCO2) was also negligible compared to qgas. The feed rate was very small (<4 mg s−1) and the feed solution was preheated approaching the reactor. The term qdos was therefore neglected and considered as an insignificant part of qr. During cultivations, the simplified heat balance model presented in Equation (7) was considered.
2.6. Calorimetry-Based Control
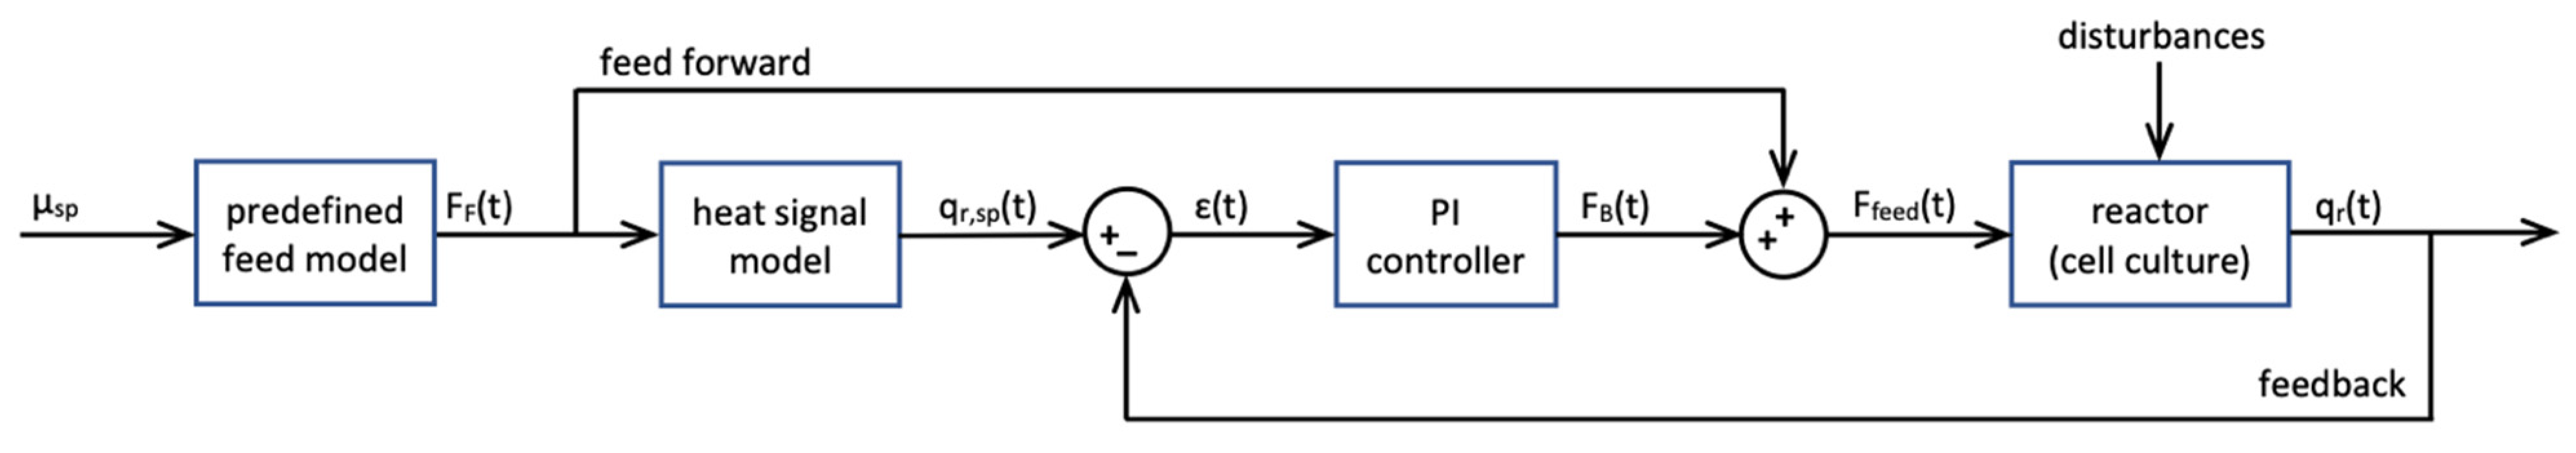
For the calorimetry-based control of all cultivations, a novel controller based on qr was developed in LabView. The block diagram of the developed controller is shown in Figure 2.
The feed rate (Ffeed, g s−1) was calculated as shown in Equation (8).
with the feedback term (FB) and the predefined feed-forward term (FF) calculated from the specific growth rate set point (µsp) (Equation (9)) as described by Biener et al. (2010) [20].
with the initial mass of culture medium (mr,0), the biomass concentration at feeding start (X0) and the concentration of substrate in the feed solution (Sfeed). The yield coefficient of substrate (YX/S) was measured during preliminary experiments and was set to 0.25 g g−1 for glucose and the estimated cellular maintenance term (ms) was set to 0.1 g g−1 h−1.
The estimated heat signal (qr,sp) corresponding to the growth rate set point was expected to be directly proportional to the feed rate and was evaluated from FF (Equation (10)).
The yield coefficient of heat per substrate (YQ/S) was measured during preliminary experiments and corresponds to 959 ± 12 J mol−1 for glucose as substrate.
The deviation of the last iteration of qr from this expected signal qr,sp constitute the error term (ɛ) (Equation (11)).
FB was calculated (Equation (12)) from this error by a simple PI controller.
YQ/S and Sfeed were dissociated from the controller proportional gain (Kp) to take into account changes in these two variables. The PI controller was tuned based on a step experiment using Ziegler–Nichols (1995) methodology [32]. The system was identified as being of the third order. Kp was set to 0.275, the integral time (I) to 475 s and the integration window was set to 2 h. The feed-forward term of the controller was started manually after complete substrate consumption (glucose and ethanol) when qr was stable at 0 W and the feedback term was activated after 2 h to 3 h.
2.7. Specific Growth Rate Evaluation and Error Calculation
Biomass concentration signal (CX) and heat flow signal from cells (qr) were used to evaluate the apparent specific growth rate (µapp). The signal of the exponential growth phase was isolated, filtered (median backward filtering over 15 min) and linearised to calculate µapp from capacitance (µapp_cap, Equation (13)) and from heat signal (µapp_heat, Equation (14)). These on-line estimates were compared to off-line dry-cell-weight measurements (µapp_DCW) calculated using the same equation as for on-line biomass (Equation (13)).
The performance of the controller was assessed by calculating the root mean square error (RMSE, Equation (15)). The calculation of the error started when µapp_cap reached 90% of µsp (representing controller rise time). The mean relative error (MRE) was then calculated from RMSE (Equation (16)).
3. Results
Five Saccharomyces cerevisiae cultivations were carried out in the RC1e Biocalorimeter, using the calorimetry-based controller developed in Section 2.6. Table 1 summarises results obtained for the five experiments (E-1 to E-5) performed with different specific growth rate setpoints (µsp). The table shows the estimates of the apparent specific growth rates that were obtained based on calculations from calorimetry, dielectric spectroscopy and dry-cell-weight monitoring. Model overall F-test (𝛼 = 0.95) p-values much smaller than 0.05 were obtained, rejecting the hypothesis of non-significant models. RMSE and MRE values are also shown in Table 1.
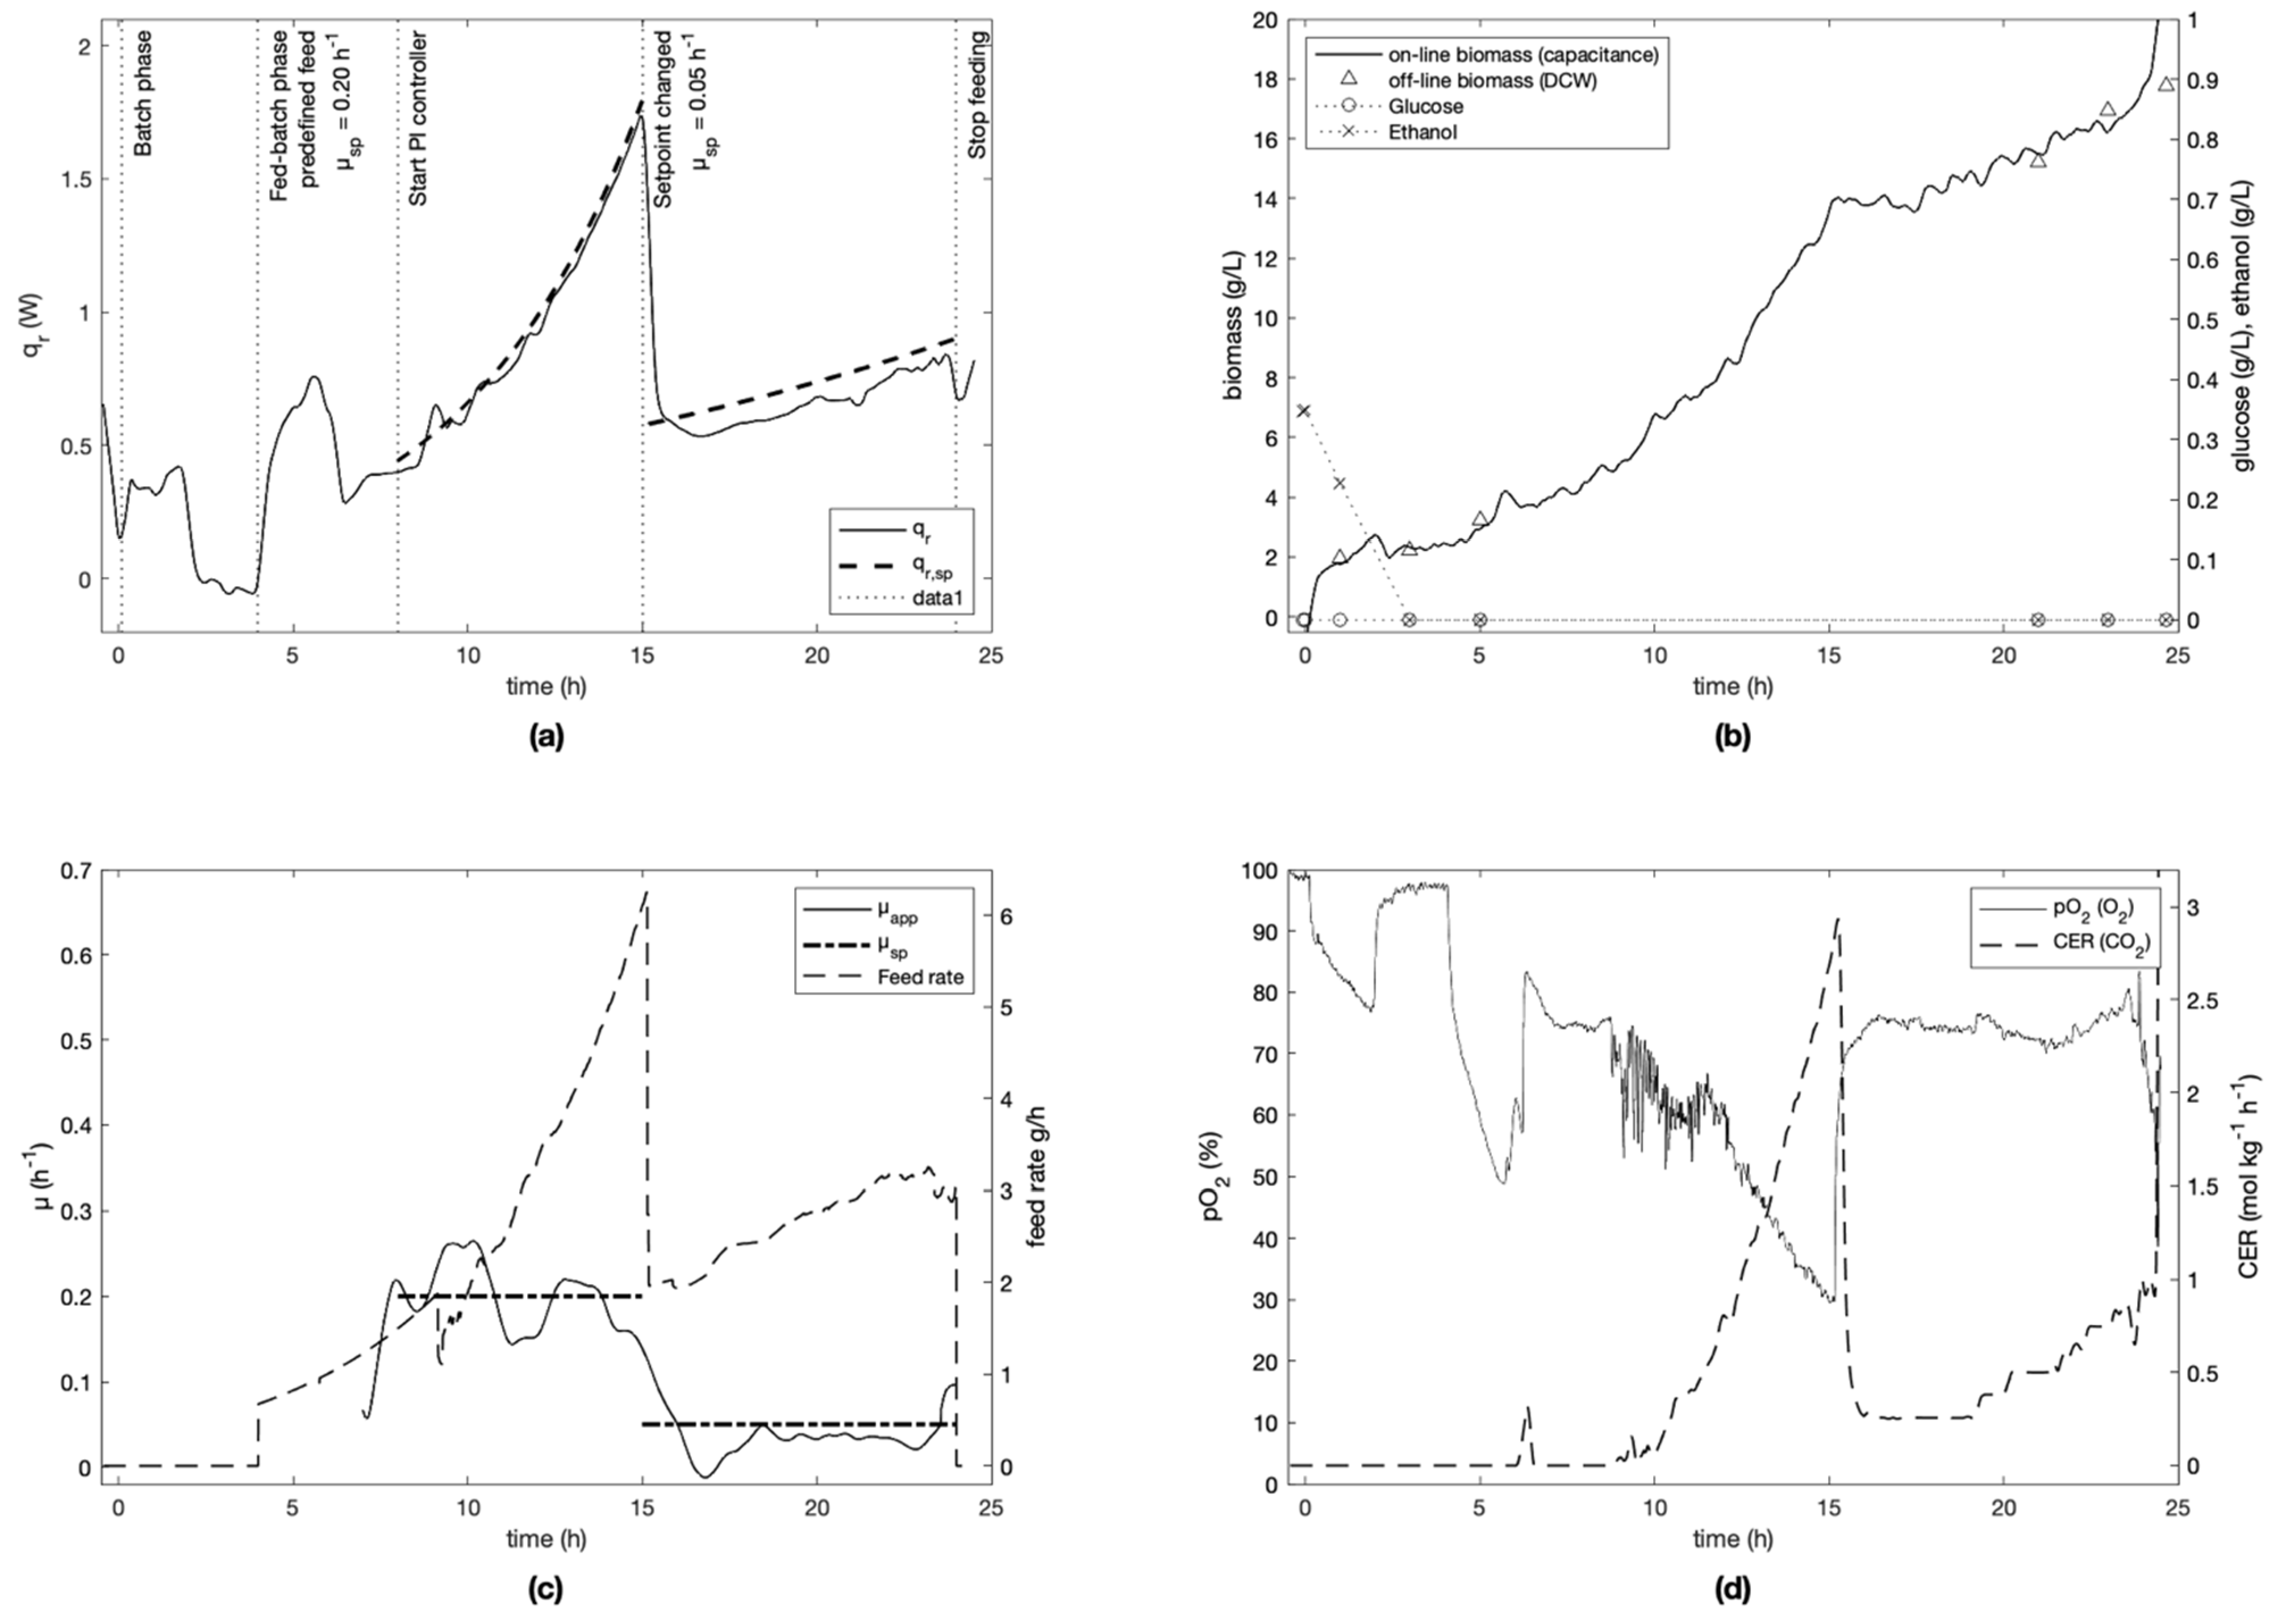
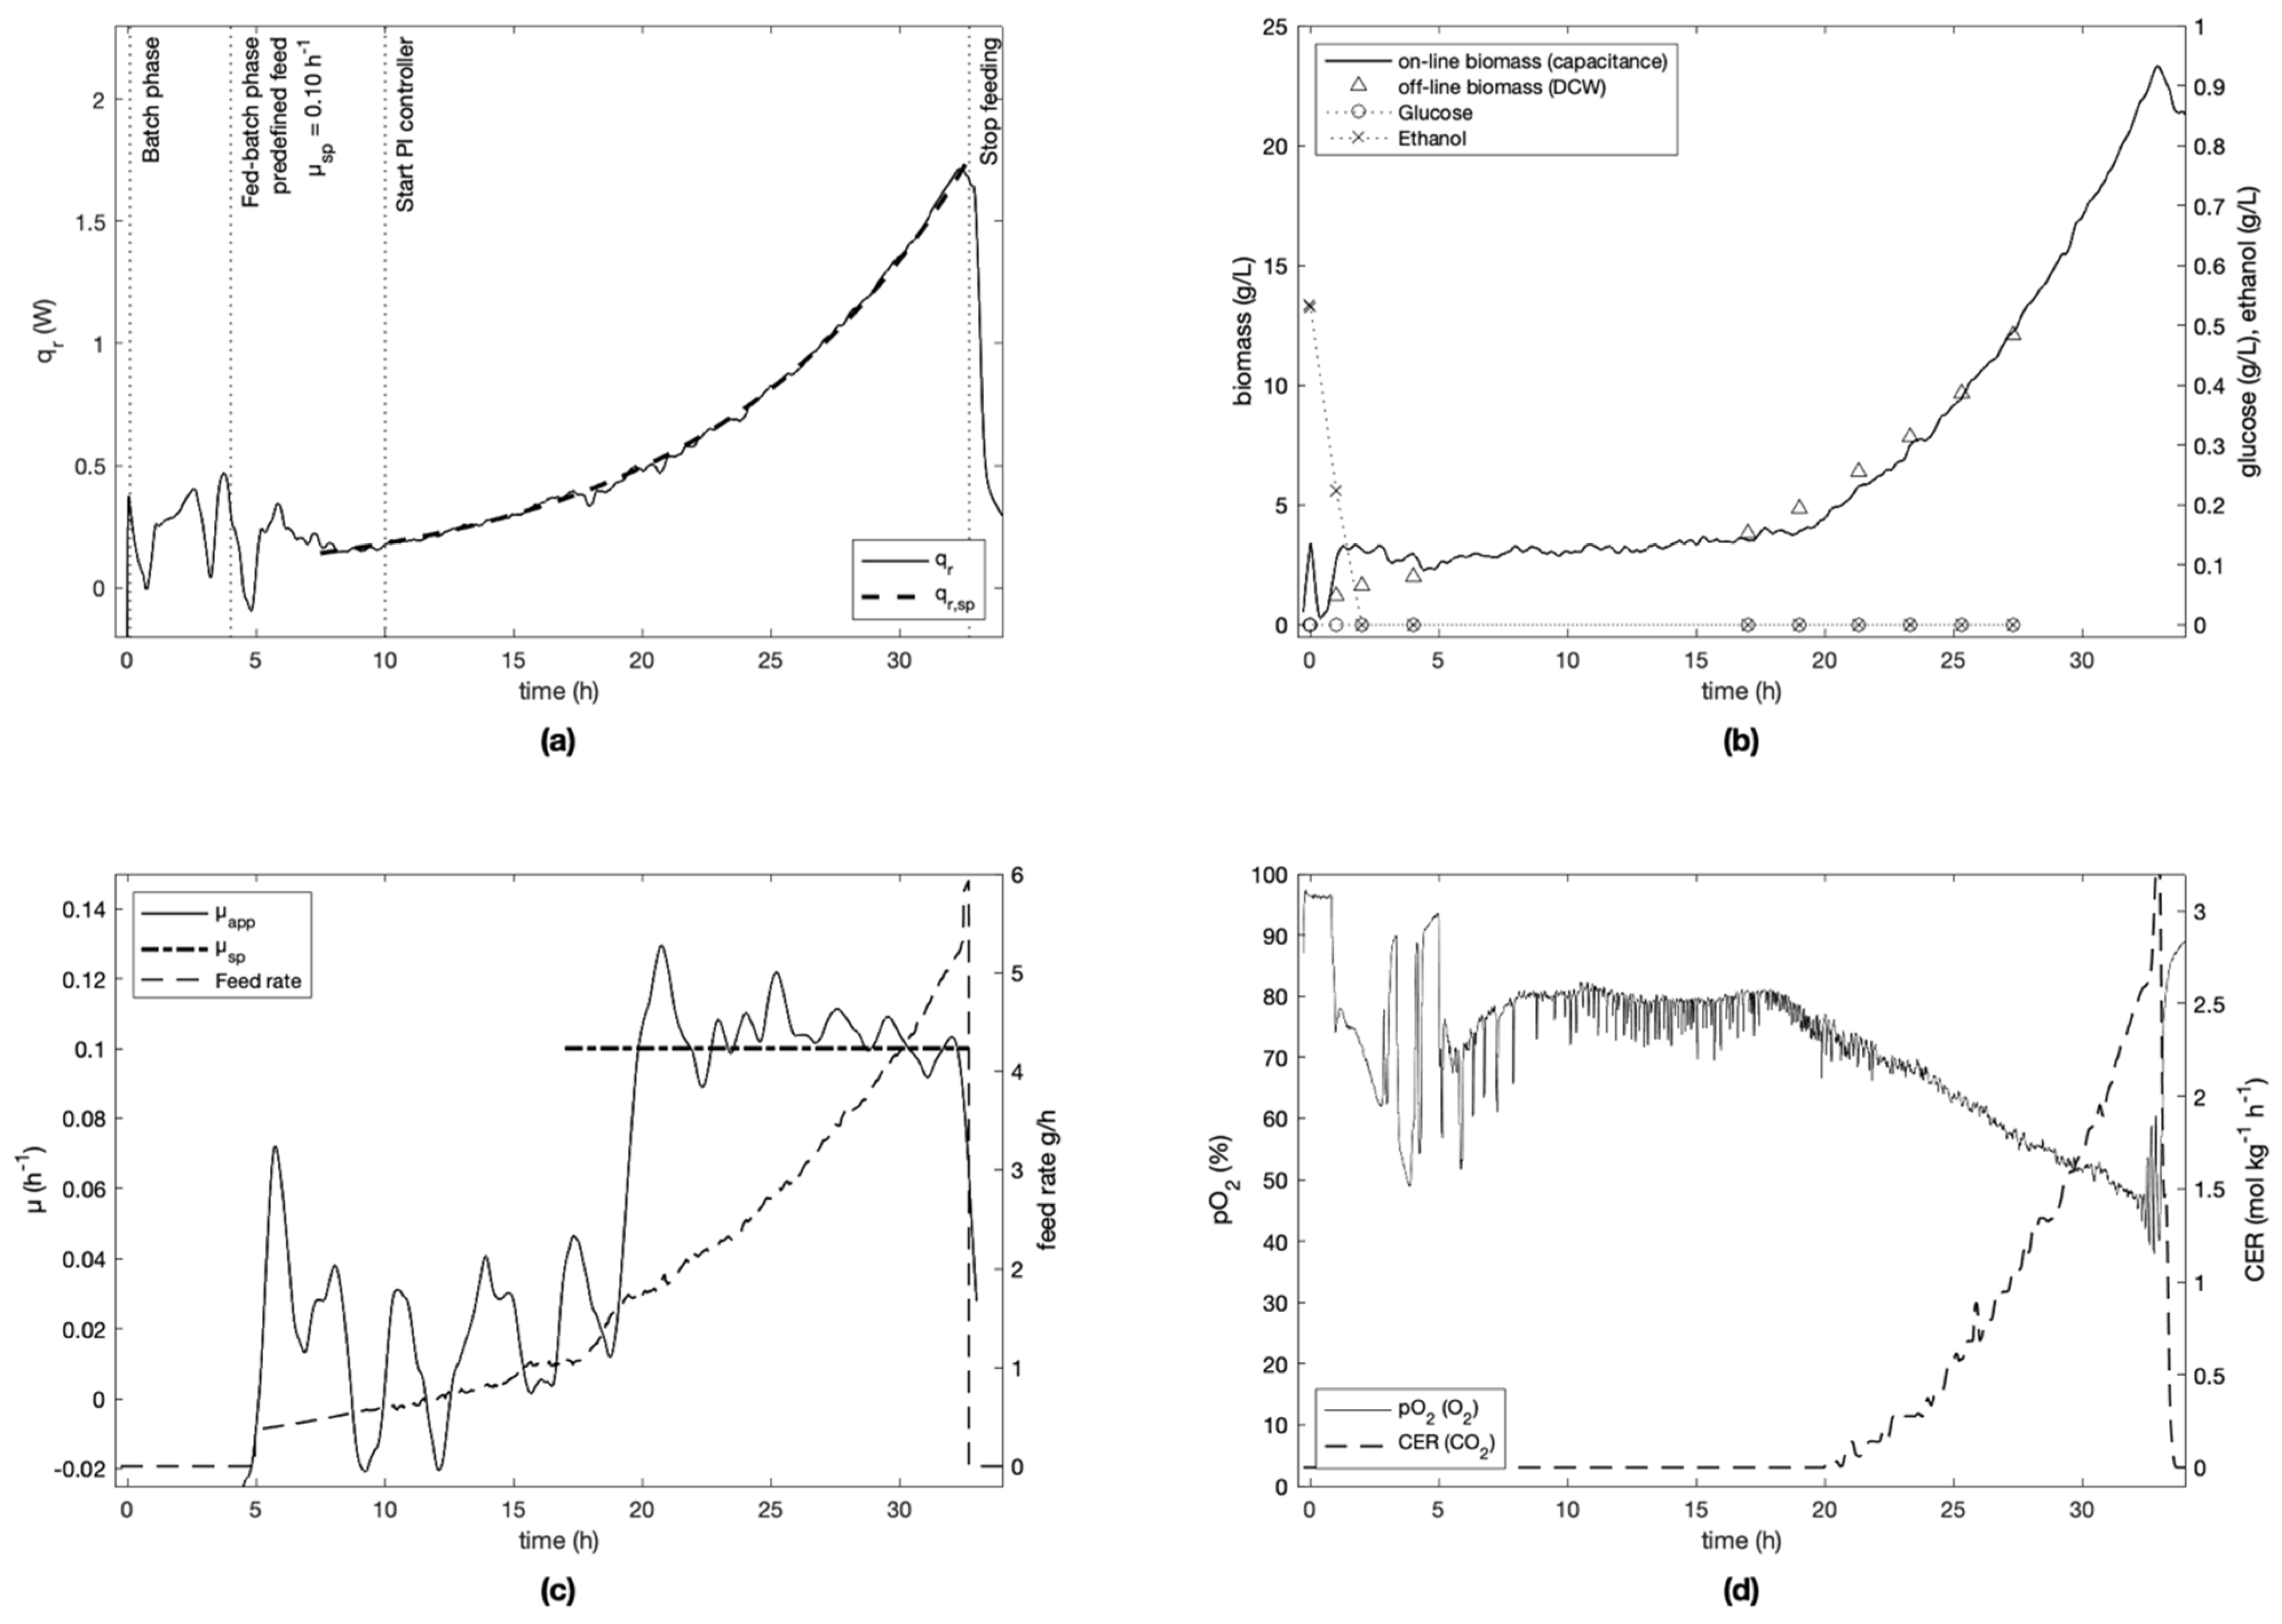
For each experiment, the specific growth rate setpoint was defined at the beginning of the fed-batch phase and kept constant for the cultivation (Figure 3, Figure 4, Figure 5, Figure 6 and Figure 7). Experiment E-4 (Figure 6) is an exception, since the initial setpoint of 0.20 h−1 was changed to 0.05 h−1 after 15 h of cultivation. To ensure process repeatability, experiment E-2 was replicated (experiment E-5). Similar results were obtained as seen in Figure 4 and Figure 7, where the controller RMSE was determined to be 0.014 h−1 and 0.010 h−1, respectively. Due to a data communication problem with the PI controller, the setpoint was not followed accurately between 8–11 h in experiment E-3 (Figure 5).
It was seen that the Crabtree effect was avoided during the controlled phases of all cultivations as visible on trends of glucose and ethanol (Figure 3, Figure 4, Figure 5, Figure 6 and Figure 7) measured off-line by IR spectroscopy. To do this, the specific growth rate was always kept under the critical value µmax of 0.4–0.5 h−1 (determined in preliminary experiments), and the feed rate was kept sufficiently low to avoid instantaneous concentrations of glucose above 0.15 g L−1 [33], which is the upper bound necessary to respect to avoid the Crabtree effect.
4. Discussion
4.1. Heat Flow Model Performance
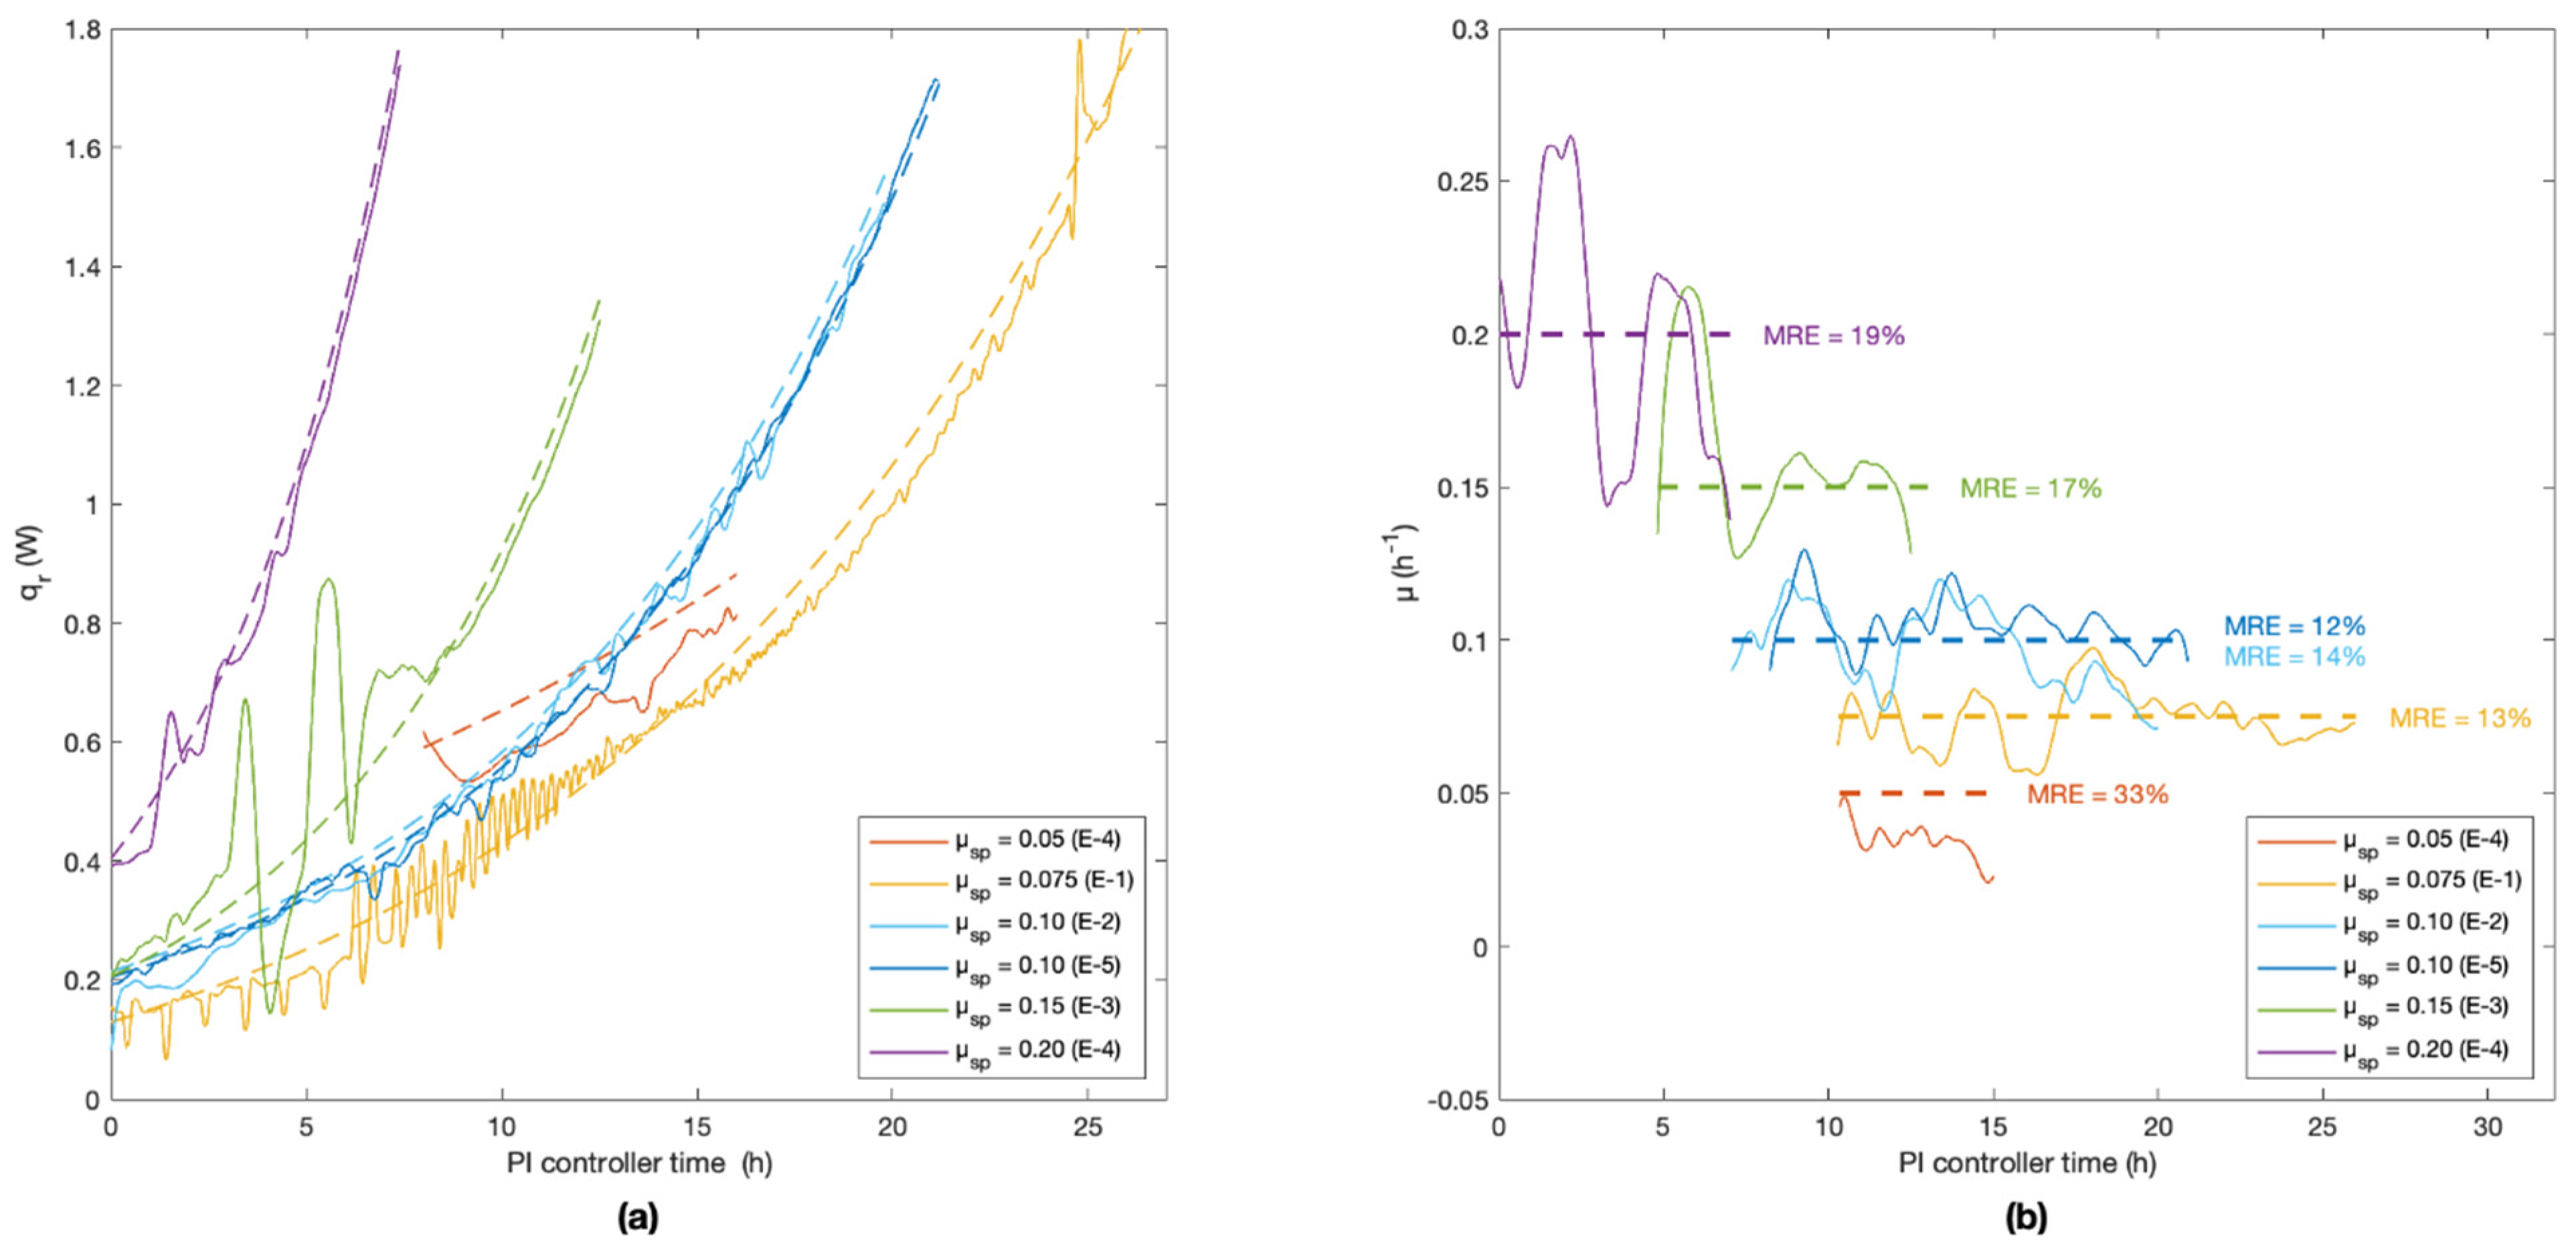
The models established for the prediction of qr, qgas and UA allowed for a precise and accurate real-time evaluation of the heat generated during a cell culture with a sensitivity of ±20 mW L−1 for measured heat flows down to a limit of quantification of 40 mW L−1. Mohan et al. (2017) achieved a higher sensitivity of 6.73 mW L−1, but using a ten times larger reactor (5 L). Using the developed heat flow model, the feed-forward/feedback PI controller was set to follow the dynamic heat-flow setpoint trajectories (qr,sp) which, in turn, permitted reaching and maintaining specific growth rate setpoints successfully between 0.075 h−1 and 0.2 h−1, as described below and shown in Figure 8.
4.2. Controller Performance and Limitations
The controller showed good performance in controlling the specific growth rate, with an average MRE of 18 ± 8% (1σ, n = 6) achieved for all six experiments. The apparent specific growth rates from the calorimetric signal listed in Table 1 illustrate the controller’s ability to follow exponential growth profiles. The developed controller showed process reliability with replicate experiments E-2 and E-5 showing an MRE of 14% and 12% from their respective specific growth rate setpoints. To increase the precision of the controller further, additional monitoring of the air inlet flowrate would be required to account for variations in sparging, which would reduce the uncertainty on the presented heat balance.
The mean apparent specific growth rates determined from on-line biomass concentrations shown in Table 1 represent the effective growth rates during the exponential growth phases of calorimetry-based controlled fed-batch cultivations.
Figure 8 shows that the setpoint value of heat generated by cells (qr,sp) and the measured values for the five cultures performed in this work coincide. The offset on the heat flow signal at the controller start (t = 0) is due to different cell concentrations at this moment.
The highest MRE of 33% was observed for the lowest setpoint of 0.05 h−1, during E-4. This may be due to the resolution of the heat signal, as qr was 15% below the dynamic controller setpoint. A metabolism change could have contributed to the controller error at low growth rates, but the glucose and ethanol signals show that no fermentation occurred. A constant heat-to-substrate yield coefficient (YQ/S) was assumed for all experiments (Equation (10)), which may have induced errors for cultures with low growth rates (under 0.075 h−1). Bailey and Ollis (1986) introduced a cellular heat maintenance term (mQ) for S. cerevisiae cultures [34]. The on-line biomass concentrations show that for cell concentrations under 4 g L−1, the controller accurately follows the target heat flow, but it undershoots the apparent specific growth rate, delaying the beginning of the exponential growth phase. This could be another consequence of the neglected cellular heat maintenance term, but it could also be due to underestimations of the initial biomass concentration. Von Stockar (2006) showed a dependency of YQ/S on the biomass-to-substrate yield coefficient (YX/S) [35]. If YX/S depends on the specific growth rate for small growth rates, due to cellular maintenance, YQ/S would also increase and skew the growth rate. Experiment E-4 (μsp = 0.05 h−1) was, therefore, deemed below the performance threshold of the controller. The average MRE for the range between 0.075 h−1 and 0.2 h−1 is 15 ± 3% (1σ, n = 5).
5. Conclusions
A novel calorimetry-based feed-forward/feedback PI controller was developed. It allowed one to precisely and accurately control fed-batch cultures of Saccharomyces cerevisiae with growth rates from 0.075 h−1 to 0.2 h−1 and low cell concentrations between 5 g L−1 and 25 g L−1, and to prevent the Crabtree effect.
The heat produced by the cells (qr) was successfully applied as the control variable rather than using the estimated specific growth rate (µapp), which can lead to increased controller noise as discussed by Brignoli et al. (2020) [36]. A conventional, calorimetry-based specific growth rate-based controller would typically use the derivative of the heat signal, which would also increase the noise during the evaluation of µ. The approach shown in this paper demonstrates that by using a dynamic setpoint based on the heat signal itself, controller noise was noticeably decreased.
Brignoli et al. developed a controller logic aimed at improved noise management [36]. They obtained an average relative root mean square error of 23 ± 6% for cultivations of Kluyveromyces marxianus with specific growth rates between 0.1 h−1 and 0.4 h−1. In this work, the average relative root mean square error was 15 ± 3% (1σ, n = 5) based on cultures of S. cerevisiae with specific growth rates between 0.075 h−1 and 0.2 h−1. The control of the calorimetric signal requires a deep understanding of the system and of cultured microorganisms, but it provides reliable results even for low biomass concentrations with only a limited number of probes in the bioreactor.
In future work, the authors will apply the developed technique with other microorganisms, such as Crabtree-positive strains of Kluyveromyces marxianus or Escherichia coli, and evaluate the overall applicability of the strategy. The goal of a microorganism cultivation is often to obtain high biomass densities as quickly as possible. To reach this target, it is essential to work as close as possible to the maximum specific growth rate, above which metabolic limitations occur. Biocalorimetry could be used to detect the transition from respiration to fermentation. This paves the way to metabolism differentiations based exclusively on calorimetric signals and to new control strategies.
With the rapid expansion of biotechnology in fields traditionally limited to chemistry, the development of novel monitoring and control technologies becomes urgent. Biocalorimetry is a very promising PAT tool for the monitoring of various strains including Crabtree-positive microorganisms, and its implementation at large scale in the industry can be carried out without prohibitive investments.
Author Contributions
J.K. performed the experimental work under the supervision of M.D. and B.F.; J.K. wrote the original manuscript, which was subsequently revised by M.D. and B.F. All authors have read and agreed to the published version of the manuscript.
Funding
This research received no external funding.
Institutional Review Board Statement
Not applicable.
Informed Consent Statement
Not applicable.
Data Availability Statement
The data presented in this study are available on request from the corresponding author.
Conflicts of Interest
The authors declare no conflict of interest.
References
- Bhatia, S.; Goli, D. Introduction to Pharmaceutical Biotechnology, Volume 1 Basic Techniques and Concepts, 1st ed.; IOP Publishing: Bristol, UK, 2018; ISBN 978-0-7503-1299-8. [Google Scholar]
- Lodolo, E.J.; Kock, J.L.F.; Axcell, B.C.; Brooks, M. The yeast Saccharomyces cerevisiae-The main character in beer brewing. FEMS Yeast Res. 2008, 8, 1018–1036. [Google Scholar] [CrossRef] [Green Version]
- Marison, I.; Hennessy, S.; Foley, R.; Schuler, M.; Sivaprakasam, S.; Freeland, B. The choice of suitable online analytical techniques and data processing for monitoring of bioprocesses. Adv. Biochem. Eng./Biotechnol. 2013, 132, 249–280. [Google Scholar]
- Ehgartner, D.; Hartmann, T.; Heinzl, S.; Frank, M.; Veiter, L.; Kager, J.; Herwig, C.; Fricke, J. Controlling the specific growth rate via biomass trend regulation in filamentous fungi bioprocesses. Chem. Eng. Sci. 2017, 172, 32–41. [Google Scholar] [CrossRef]
- Mears, L.; Stocks, S.M.; Sin, G.; Gernaey, K.V. A review of control strategies for manipulating the feed rate in fed-batch fermentation processes. J. Biotechnol. 2017, 245, 34–46. [Google Scholar] [CrossRef]
- Habegger, L.; Rodrigues Crespo, K.; Dabros, M. Preventing overflow metabolism in crabtree-positive microorganisms through on-line monitoring and control of fed-batch fermentations. Fermentation 2018, 4, 79. [Google Scholar] [CrossRef] [Green Version]
- Rathore, A.S. Roadmap for implementation of quality by design (QbD) for biotechnology products. Trends Biotechnol. 2009, 27, 546–553. [Google Scholar] [CrossRef]
- FDA Guidance for Industry: PAT—A Framework for Innovative Pharmaceutical Development, Manufacturing, and Quality Assurance; Food and Drug Administration: Silver Spring, MD, USA, 2004.
- Dabros, M.; Schuler, M.M.; Marison, I.W. Simple control of specific growth rate in biotechnological fed-batch processes based on enhanced online measurements of biomass. Bioprocess Biosyst. Eng. 2010, 33, 1109–1118. [Google Scholar] [CrossRef] [PubMed]
- Mohan, N.; Sivaprakasam, S. Heat Compensation Calorimeter as a Process Analytical Tool To Monitor and Control Bioprocess Systems. Ind. Eng. Chem. Res. 2017, 56, 8416–8427. [Google Scholar] [CrossRef]
- Sivaprakasam, S.; Schuler, M.M.; Hama, A.; Hughes, K.; Marison, I.W. Biocalorimetry as a process analytical technology process analyser; robust in-line monitoring and control of aerobic fed-batch cultures of crabtree-negative yeast cells. J. Therm. Anal. Calorim. 2011, 104, 75–85. [Google Scholar] [CrossRef]
- Dabros, M.; Amrhein, M.; Bonvin, D.; Marison, I.W.; von Stockar, U. Data reconciliation of concentration estimates from mid-infrared and dielectric spectral measurements for improved on-line monitoring of bioprocesses. Biotechnol. Prog. 2009, 25, 578–588. [Google Scholar] [CrossRef]
- Biener, R.; Steinkämper, A.; Horn, T. Calorimetric control of the specific growth rate during fed-batch cultures of Saccharomyces cerevisiae. J. Biotechnol. 2012, 160, 195–201. [Google Scholar] [CrossRef]
- Voisard, D.; von Stockar, U.; Marison, I.W. Quantitative calorimetric investigation of fed-batch cultures of Bacillus sphaericus 1593M. Thermochim. Acta 2002, 394, 99–111. [Google Scholar] [CrossRef]
- Voisard, D.; Pugeaud, P.; Kumar, A.R.; Jenny, K.; Jayaraman, K.; Marison, I.W.; von Stockar, U. Development of a large-scale biocalorimeter to monitor and control bioprocesses. Biotechnol. Bioeng. 2002, 80, 125–138. [Google Scholar] [CrossRef]
- Marison, I.W.; von Stockar, U. The application of a novel heat flux calorimeter for studying growth of Escherichia coli W in aerobic batch culture. Biotechnol. Bioeng. 1986, 28, 1780–1793. [Google Scholar] [CrossRef] [PubMed]
- Anderson, R.K.; Jayaraman, K.; Voisard, D.; Marison, I.W.; von Stockar, U. Heat flux as an on-line indicator of metabolic activity in pilot scale bioreactor during the production of Bacillus thuringiensis var. galleriae-based biopesticides. Thermochim. Acta 2002, 386, 127–138. [Google Scholar] [CrossRef]
- Larsson, C.; Lidén, G.; Niklasson, C.; Gustafsson, L. Calorimetric control of fed-batch cultures of Saccharomyces cerevisiae. Bioprocess Eng. 1991, 7, 151–155. [Google Scholar] [CrossRef]
- Voisard, D.; Claivaz, C.; Menoud, L.; Marison, I.W.; von Stockar, U. Use of reaction calorimetry to monitor and control microbial cultures producing industrially relevant secondary metabolites. Thermochim. Acta 1998, 309, 87–96. [Google Scholar] [CrossRef]
- Biener, R.; Steinkämper, A.; Hofmann, J. Calorimetric control for high cell density cultivation of a recombinant Escherichia coli strain. J. Biotechnol. 2010, 146, 45–53. [Google Scholar] [CrossRef]
- Schuler, M.M.; Sivaprakasam, S.; Freeland, B.; Hama, A.; Hughes, K.-M.; Marison, I.W. Investigation of the potential of biocalorimetry as a process analytical technology (PAT) tool for monitoring and control of Crabtree-negative yeast cultures. Appl. Microbiol. Biotechnol. 2012, 93, 575–584. [Google Scholar] [CrossRef] [PubMed]
- Katla, S.; Pavan, S.S.; Mohan, N.; Sivaprakasam, S. Biocalorimetric monitoring of glycoengineered P. Pastoris cultivation for the production of recombinant huIFNα2b: A quantitative study based on mixed feeding strategies. Biotechnol. Prog. 2020, 36, 1–14. [Google Scholar] [CrossRef]
- Bayer, B.; Sissolak, B.; Duerkop, M.; von Stosch, M.; Striedner, G. The shortcomings of accurate rate estimations in cultivation processes and a solution for precise and robust process modeling. Bioprocess Biosyst. Eng. 2020, 43, 169–178. [Google Scholar] [CrossRef] [Green Version]
- Urniezius, R.; Survyla, A.; Paulauskas, D.; Bumelis, V.A.; Galvanauskas, V. Generic estimator of biomass concentration for Escherichia coli and Saccharomyces cerevisiae fed-batch cultures based on cumulative oxygen consumption rate. Microb. Cell Fact. 2019, 18, 1–17. [Google Scholar] [CrossRef] [PubMed] [Green Version]
- Galvanauskas, V.; Simutis, R.; Vaitkus, V. Adaptive control of biomass specific growth rate in fed-batch biotechnological processes. A comparative study. Processes 2019, 7, 810. [Google Scholar] [CrossRef] [Green Version]
- Butkus, M.; Repšytė, J.; Galvanauskas, V. Fuzzy Logic-Based Adaptive Control of Specific Growth Rate in Fed-Batch Biotechnological Processes. A Simulation Study. Appl. Sci. 2020, 10, 6818. [Google Scholar] [CrossRef]
- Levišauskas, D.; Simutis, R.; Galvanauskas, V. Adaptive set-point control system for microbial cultivation processes. Nonlinear Anal. Model. Control 2015, 21, 153–165. [Google Scholar] [CrossRef] [Green Version]
- Malairuang, K.; Krajang, M.; Sukna, J.; Rattanapradit, K.; Chamsart, S. High cell density cultivation of saccharomyces cerevisiae with intensive multiple sequential batches together with a novel technique of fed-batch at cell level (FBC). Processes 2020, 8, 1321. [Google Scholar] [CrossRef]
- Brereton, R.G. Multilevel Multifactor Designs for MultivariateCalibration. Analyst 1997, 122, 1521–1529. [Google Scholar] [CrossRef]
- von Stockar, U.; Marison, I.W. The use of calorimetry in biotechnology. Adv. Biochem. Eng./Biotechnol. 1989, 40, 93–136. [Google Scholar]
- Box, G.E.; Wilson, K. On the experimental attainment of optimum conditions. J. R. Stat. Soc. Ser. B 1951, 13, 1–45. [Google Scholar] [CrossRef]
- Ziegler, J.G.; Nichols, N.B. Optimum Settings for Automatic Controllers. J. Dyn. Syst. Meas. Control 1993, 115, 220–222. [Google Scholar] [CrossRef]
- Verduyn, C.; Zomerdijk, T.P.L.; van Dijken, J.P.; Scheffers, W.A. Continuous measurement of ethanol production by aerobic yeast suspensions with an enzyme electrode. Appl. Microbiol. Biotechnol. 1984, 19, 181–185. [Google Scholar] [CrossRef]
- Bailey, J.E.; Ollis, D.F. Biochemical Engineering Fundamentals, 2nd ed.; Carberry, J.J., Fair, J.R., Peters, M.S., Schowalter, W.R., Wei, J., Eds.; McGraw-Hill Education: New York, NY, USA, 1986; ISBN 978-0070666016. [Google Scholar]
- von Stockar, U.; Maskow, T.; Liu, J.; Marison, I.W.; Patiño, R. Thermodynamics of microbial growth and metabolism: An analysis of the current situation. J. Biotechnol. 2006, 121, 517–533. [Google Scholar] [CrossRef] [PubMed]
- Brignoli, Y.; Freeland, B.; Cunningham, D.; Dabros, M. Control of Specific Growth Rate in Fed-Batch Bioprocesses: Novel Controller Design for Improved Noise Management. Processes 2020, 8, 679. [Google Scholar] [CrossRef]
Figure 1.
RC1e Biocalorimeter and probes used to perform all experiments.

Figure 2.
Calorimetry-based controller block diagram for the cultivation of S. cerevisiae. The heat flow dynamic setpoint (qr,sp) evaluated dynamically for a specified growth rate (µsp) is compared to the measured heat flow generated by cells (qr), yielding the controller error term (ɛ). The error term is used as entry variable of a PI controller, which returns a feeding rate feedback value (FB). The addition of the feed-forward (FF) and feedback (FB) terms provides the final instantaneous feeding rate (Ffeed).

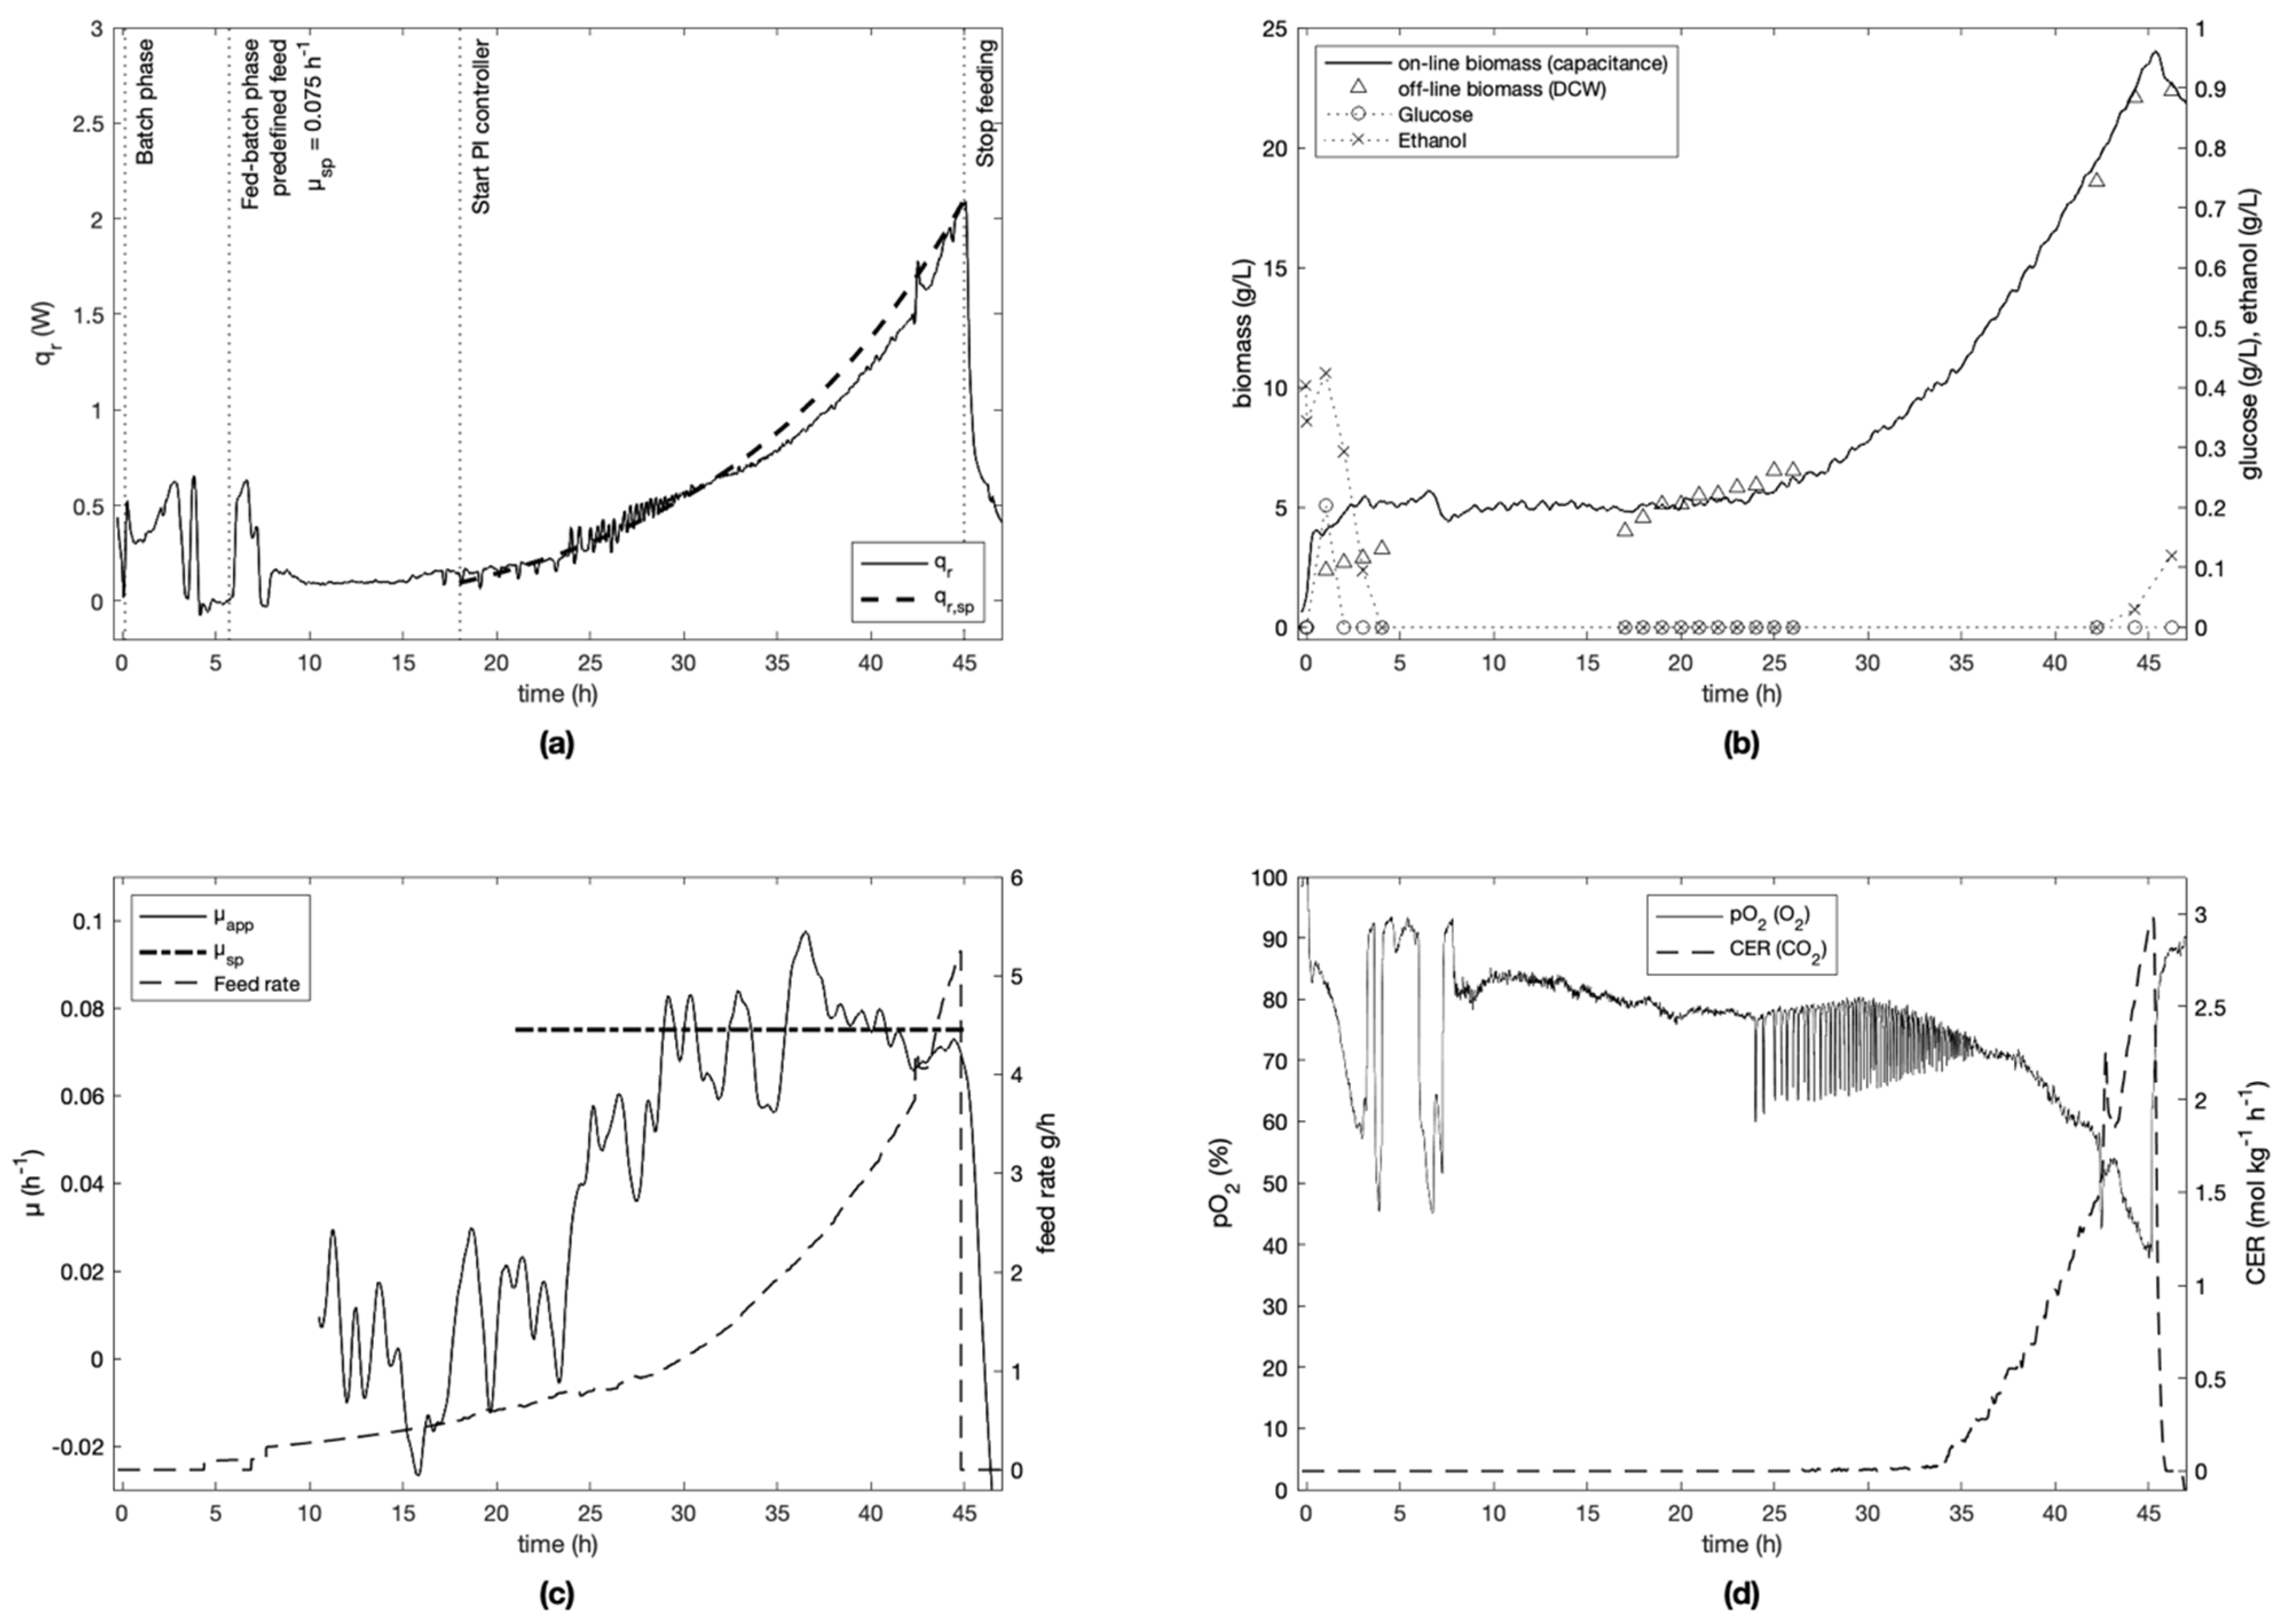
Figure 3.
Fed-batch culture (E-1) of S. cerevisiae with µsp of 0.075 h−1. (a) Heat flow (qr) and dynamic heat flow setpoint (qr,sp) profiles. Events indicated by vertical lines. (b) On-line (dielectric spectroscopy) and off-line (DCW) biomass. Glucose and ethanol concentrations measured by IR spectroscopy. (c) Apparent specific growth rate (µapp) from dielectric spectroscopy, specific growth rate setpoint (µsp) and feed rate (Ffeed) of glucose. Controller MRE of 13% achieved. (d) Oxygen partial pressure (pO2) and carbon dioxide evolution rate (CER). Oscillations of pO2 and qr signals start simultaneously with the addition of NaOH for the pH regulation.

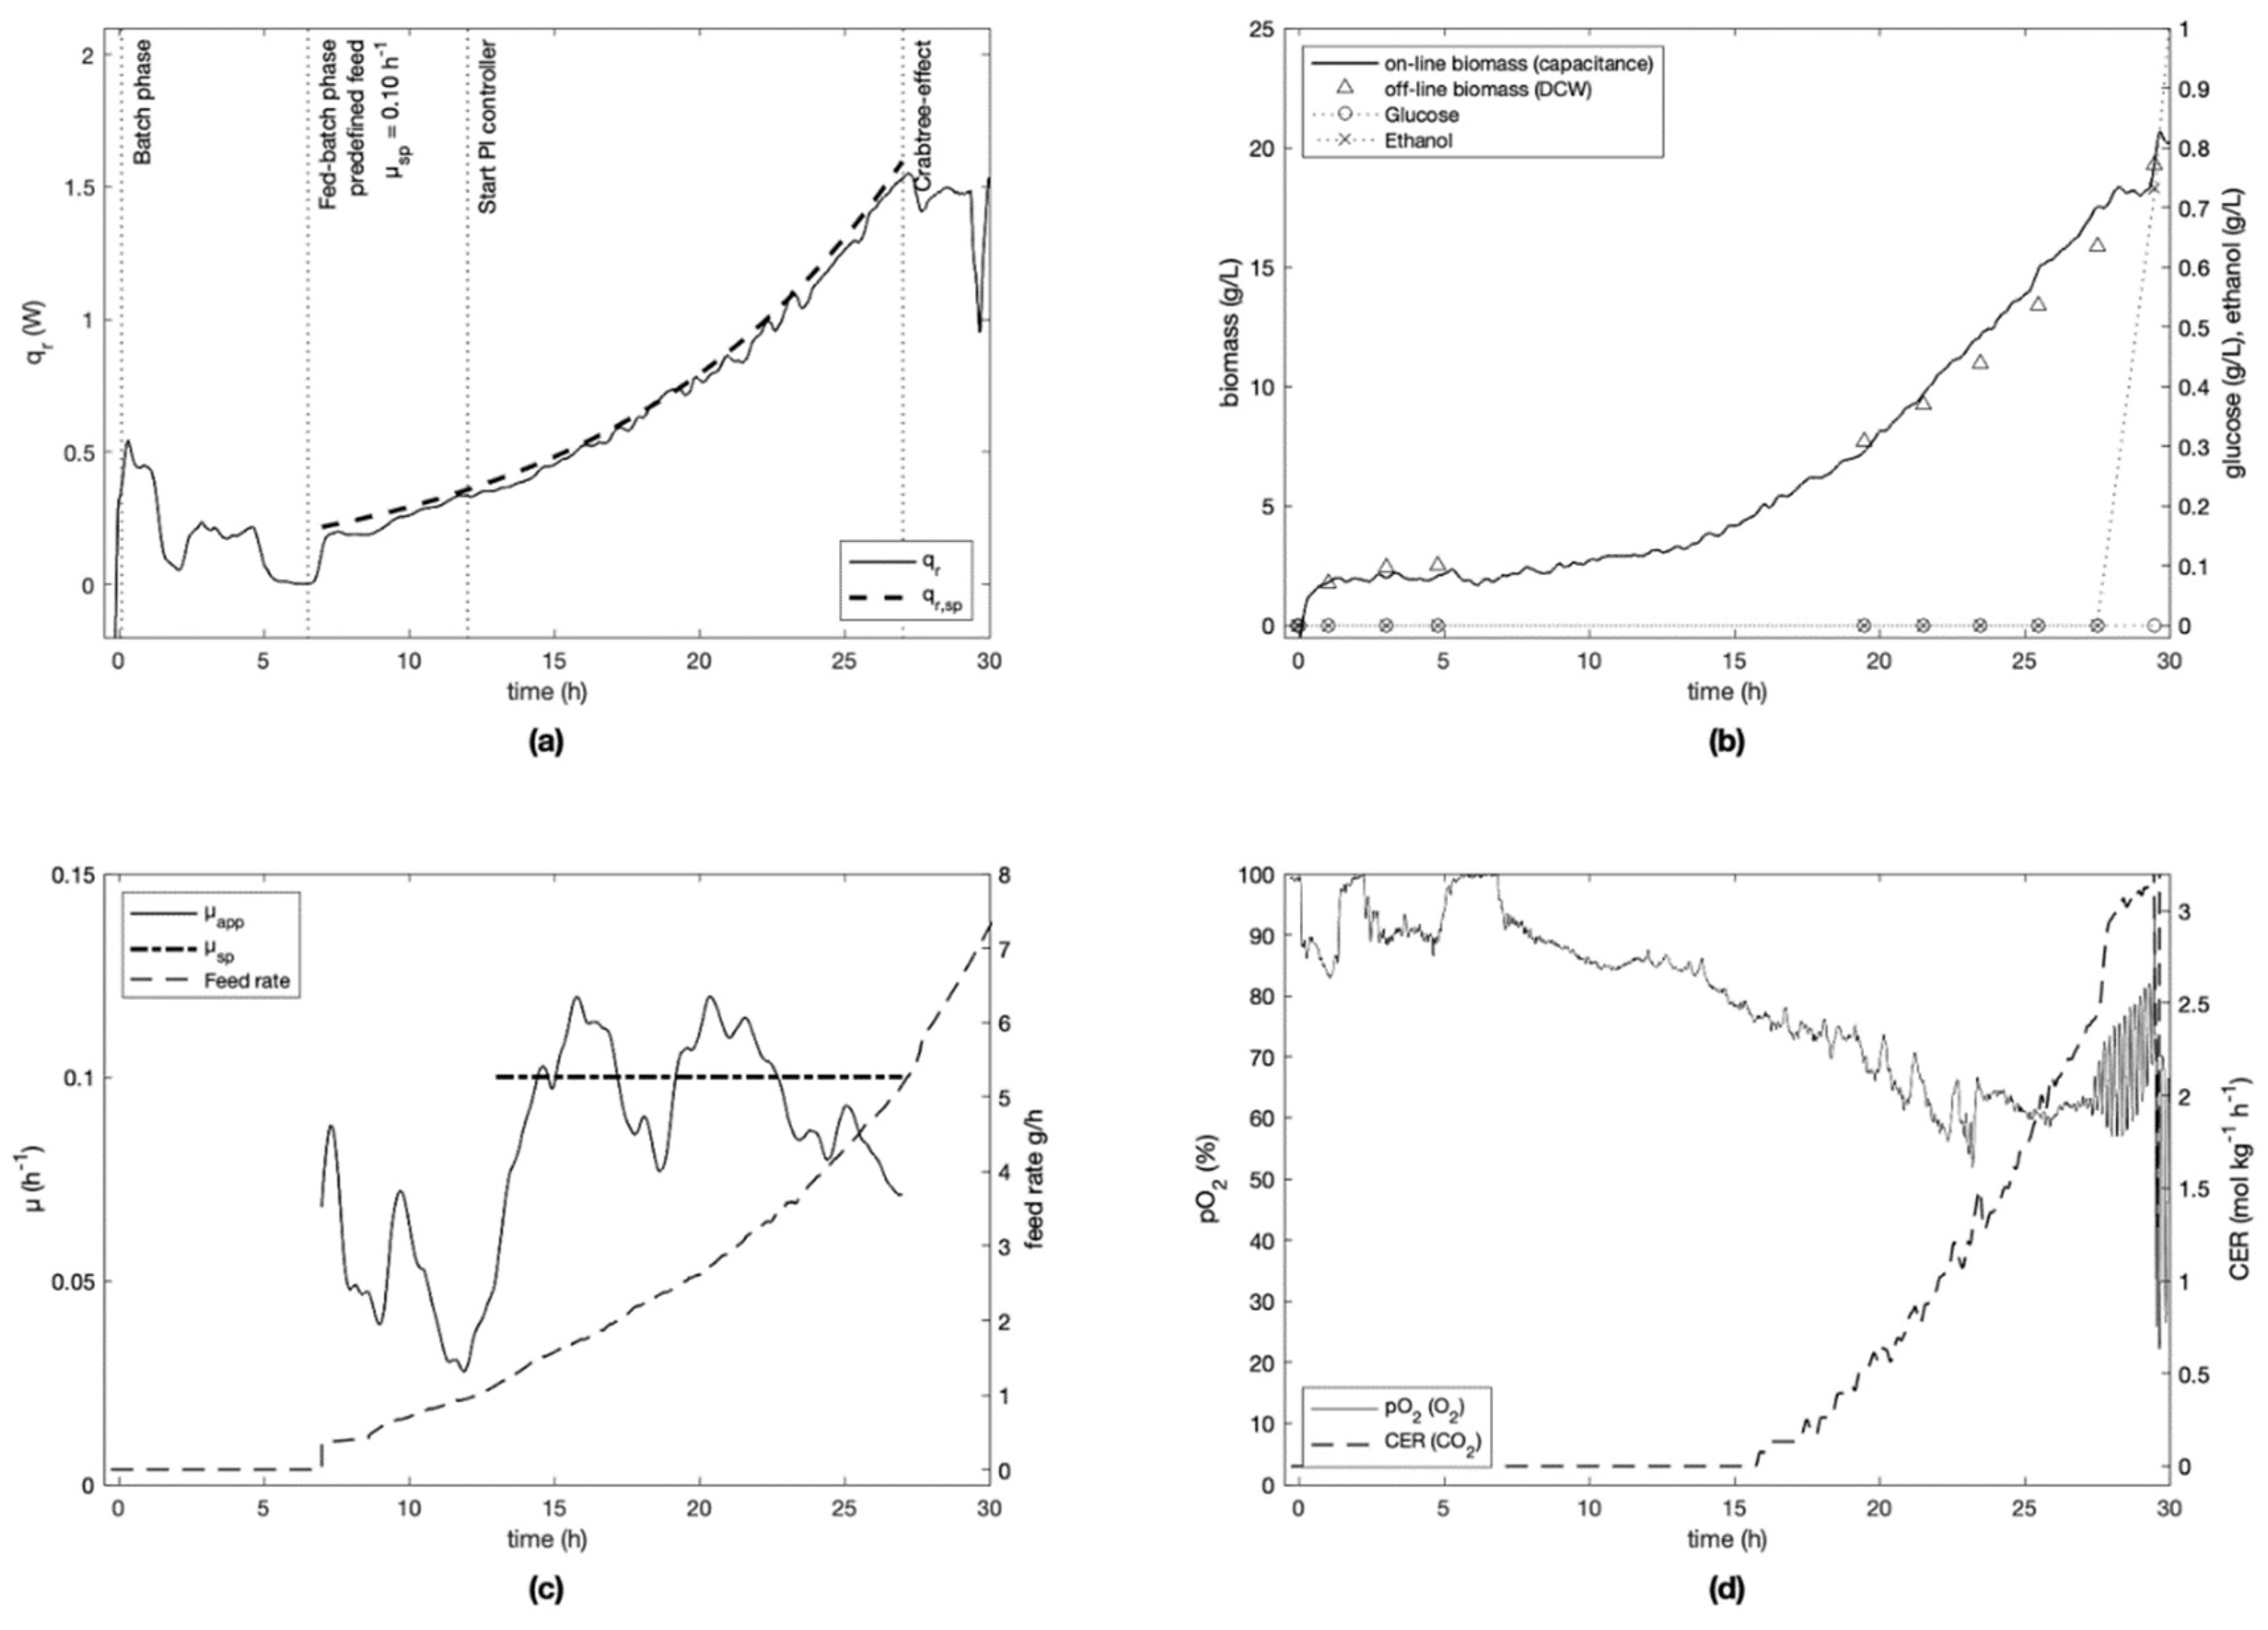
Figure 4.
Fed-batch culture (E-2) of S. cerevisiae with µsp of 0.10 h−1. (a) qr and qr,sp profiles. Events indicated by vertical lines. (b) Biomass profiles. Glucose and ethanol concentrations. (c) µapp from dielectric spectroscopy, µsp and Ffeed. Controller MRE of 14% achieved. (d) pO2 and CER. Oscillations of the pO2 signal and the decrease in qr after 27 h are due to a switch form aerobic respiration to a fermentation transition metabolism after the controller was switched off.

Figure 5.
Fed-batch culture (E-3) of S. cerevisiae with µsp of 0.15 h−1. (a) qr and qr,sp profiles. Events indicated by vertical lines. (b) Biomass profiles. Glucose and ethanol concentrations. (c) µapp from dielectric spectroscopy, µsp and Ffeed. Controller MRE of 17% achieved. (d) pO2 and CER. A problem occurred with data communication to the PI controller between 8 h and 11 h, hence the large variation on all metabolic signals.

Figure 6.
Fed-batch culture (E-4) of S. cerevisiae with µsp initially set to 0.2 h−1 and changed to 0.05 h−1 after 15 h. (a) qr and qr,sp profiles. Events indicated by vertical lines. (b) Biomass profiles. Glucose and ethanol concentrations. (c) µapp from dielectric spectroscopy, µsp and Ffeed. Controller MRE of 19% and 33% achieved, respectively. (d) pO2 and CER.

Figure 7.
Fed-batch culture (E-5) of S. cerevisiae with µsp of 0.10 h−1. (a) qr and qr,sp profiles. Events indicated by vertical lines. (b) Biomass profiles. Glucose and ethanol concentrations. (c) µapp from dielectric spectroscopy, µsp and Ffeed. Controller MRE of 12% achieved. (d) pO2 and CER.
Figure 7.
Fed-batch culture (E-5) of S. cerevisiae with µsp of 0.10 h−1. (a) qr and qr,sp profiles. Events indicated by vertical lines. (b) Biomass profiles. Glucose and ethanol concentrations. (c) µapp from dielectric spectroscopy, µsp and Ffeed. Controller MRE of 12% achieved. (d) pO2 and CER.

Figure 8.
(a) Summary of time profiles of the heat generated by cells (qr, solid lines) and the setpoint value (qr,sp, dashed lines) from the controller start (t = 0); (b) resulting specific growth rate control during experiments, monitored by dielectric spectroscopy.
Figure 8.
(a) Summary of time profiles of the heat generated by cells (qr, solid lines) and the setpoint value (qr,sp, dashed lines) from the controller start (t = 0); (b) resulting specific growth rate control during experiments, monitored by dielectric spectroscopy.


Table 1.
Summary of the specific growth rates calculated for the five experiments performed.
| µsp | Mean µapp_heat 1,2 | Mean µapp_cap 1,3 | Mean µapp_DCW 1,4 | RMSE 5 | MRE 6 | Experiment |
|---|---|---|---|---|---|---|
| 0.050 h−1 | 0.056 ± 0.012 h−1 | 0.035 ± 0.006 h−1 | 0.017 h−1 | 33% | E-4 | |
| 0.075 h−1 | 0.069 ± 0.012 h−1 | 0.072 ± 0.010 h−1 | 0.010 h−1 | 13% | E-1 | |
| 0.100 h−1 | 0.107 ± 0.018 h−1 | 0.102 ± 0.014 h−1 | 0.094 ± 0.007 h−1 | 0.014 h−1 | 14% | E-2 |
| 0.100 h−1 | 0.102 ± 0.012 h−1 | 0.106 ± 0.010 h−1 | 0.096 ± 0.005 h−1 | 0.012 h−1 | 12% | E-5 |
| 0.150 h−1 | 0.154 ± 0.023 h−1 | 0.155 ± 0.024 h−1 | 0.026 h−1 | 17% | E-3 | |
| 0.200 h−1 | 0.202 ± 0.014 h−1 | 0.199 ± 0.038 h−1 | 0.038 h−1 | 19% | E-4 |
1 The uncertainty on µ is expressed as the standard deviation to the mean (1σ). 2 Mean apparent specific growth rates calculated from the heat signal from cells (qr). 3 Mean apparent specific growth rates calculated from on-line biomass measurements by dielectric spectroscopy. 4 Mean apparent specific growth rates calculated from off-line biomass measurements by dry-cell-weight (only available for cultures with exponential growth phases during daytime). 5 Controller RMSE on µapp from on-line biomass measurements. 6 Controller MRE on µapp from on-line biomass measurements.
Publisher’s Note: MDPI stays neutral with regard to jurisdictional claims in published maps and institutional affiliations. |
© 2021 by the authors. Licensee MDPI, Basel, Switzerland. This article is an open access article distributed under the terms and conditions of the Creative Commons Attribution (CC BY) license (https://creativecommons.org/licenses/by/4.0/).
Share and Cite
MDPI and ACS Style
Kottelat, J.; Freeland, B.; Dabros, M. Novel Strategy for the Calorimetry-Based Control of Fed-Batch Cultivations of Saccharomyces cerevisiae. Processes 2021, 9, 723. https://0-doi-org.brum.beds.ac.uk/10.3390/pr9040723
AMA Style
Kottelat J, Freeland B, Dabros M. Novel Strategy for the Calorimetry-Based Control of Fed-Batch Cultivations of Saccharomyces cerevisiae. Processes. 2021; 9(4):723. https://0-doi-org.brum.beds.ac.uk/10.3390/pr9040723
Chicago/Turabian StyleKottelat, Jérémy, Brian Freeland, and Michal Dabros. 2021. "Novel Strategy for the Calorimetry-Based Control of Fed-Batch Cultivations of Saccharomyces cerevisiae" Processes 9, no. 4: 723. https://0-doi-org.brum.beds.ac.uk/10.3390/pr9040723
Note that from the first issue of 2016, this journal uses article numbers instead of page numbers. See further details here.