Article

Digital Twin of mRNA-Based SARS-COVID-19 Vaccine Manufacturing towards Autonomous Operation for Improvements in Speed, Scale, Robustness, Flexibility and Real-Time Release Testing

Institute for Separation and Process Technology, Clausthal University of Technology, Leibnizstr. 15, 38678 Clausthal-Zellerfeld, Germany
*
Author to whom correspondence should be addressed.
Submission received: 19 March 2021 / Revised: 12 April 2021 / Accepted: 19 April 2021 / Published: 23 April 2021
(This article belongs to the Special Issue Towards Autonomous Operation of Biologics and Botanicals)

Abstract

:
Supplying SARS-COVID-19 vaccines in quantities to meet global demand has a bottleneck in manufacturing capacity. Assessment of existing mRNA (messenger ribonucleic acid) vaccine processing shows the need for digital twins enabled by process analytical technology approaches to improve process transfers for manufacturing capacity multiplication, reduction of out-of-specification batch failures, qualified personnel training for faster validation and efficient operation, optimal utilization of scarce buffers and chemicals, and faster product release. A digital twin of the total pDNA (plasmid deoxyribonucleic acid) to mRNA process is proposed. In addition, a first feasibility of multisensory process analytical technology (PAT) is shown. Process performance characteristics are derived as results and evaluated regarding manufacturing technology bottlenecks. Potential improvements could be pointed out such as dilution reduction in lysis, and potential reduction of necessary chromatography steps. 1 g pDNA may lead to about 30 g mRNA. This shifts the bottleneck towards the mRNA processing step, which points out co-transcriptional capping as a preferred option to reduce the number of purification steps. Purity demands are fulfilled by a combination of mixed-mode and reversed-phase chromatography as established unit operations on a higher industrial readiness level than e.g., precipitation and ethanol-chloroform extraction. As a final step, lyophilization was chosen for stability, storage and transportation logistics. Alternative process units like UF/DF (ultra-/diafiltration) integration would allow the adjustment of final concentration and buffer composition before lipid-nano particle (LNP) formulation. The complete digital twin is proposed for further validation in manufacturing scale and utilization in process optimization and manufacturing operations. The first PAT results should be followed by detailed investigation of different batches and processing steps in order to implement this strategy for process control and reliable, efficient operation.

1. Introduction

Vaccine supply for whole populations in a pandemic crisis has been known from the beginning as a dominating scientific, technical and organizational challenge for any society [1,2,3,4].
Arguments for technological challenges and potential solution approaches are discussed in the following.
It is obvious that speed in time-to-market and sufficient capacities save wellbeing, lives and economic status [5,6]. Nevertheless, regulatory demands must be fulfilled without compromise versus political interest. Decisions need to be—as usual—data-driven and without compromise. To generate data and come to any broadly supported decision in society takes time, in any democracy. Nevertheless, comparing vaccine development to market pathways in different states, there are organizational government systems which function quite well and some which do not. The history of vaccine development [7,8,9,10] demonstrates quite long times from first product feasibility to patient usage, ranging between a few decades to at least 10–15 years if sped up. This overview focuses on the recent success in SARS-COVID19 vaccination within a timespan of less than one year, as well with a broad variety of new vaccine types such as mRNA, as especially successful.
Virus type and mechanism of action elucidation was extremely fast, as were first vaccine product ideas including initial clinical trials [11]. Almost worldwide and nearly totally open communication within the scientific, academic, and industrial communities, as well as obvious immediate availability of clinical trial candidates, sped up those steps. This speed was also based dedicated scientists with many years of professional experience within this specialised field of research. Overall credit is given, on the one side, to exceptional individual performance and, on the other side, to state or company innovation systems which allowed long-term basic science research in “niches”; a contradiction in modern management and political theory [12].
Nevertheless, this remarkable success story seems to end when manufacturing in world-scale amounts is needed. Supply of vaccines needed worldwide are at stake. In pharmaceutical industries, management manufacturing technology is treated as housekeeping; the focus is laid on new product development, their clinical trials, and regulatory approval. Manufacturing is considered as offhandedly possible and as having no issues of budget or technology. In contradiction to this, due to management behavior, on average any pharmaceutical company is known to need to discard 1–2 drug candidates per year due to manufacturing technology-based challenges–quite a pity for patients and health care systems as well as company budgets.
Finally, rapid state investments have secured fast progress opportunities for SMEs and start-ups in drug research, which have for quite some time and through many a death-valley been financed and supported long-term by altruistic investors like [13,14,15] of ‘big pharma’. This financial governmental backup has allowed small companies to establish fast cooperation with custom manufacturing organization (CMO) companies in order to speed up manufacturing capacity [16,17,18,19].
Actual virus vaccine manufacturing technology has the benefit of being very small-scaled due to the minimal dosage forms needed, in magnitude of few tenths of µgs. Nevertheless, stable formulation systems are based on large molecules’ bio-availability during transportation and storage. Special lyophilization and nano-lipid particle techniques are still a challenge for robust operation [20,21].
A manufacturing technology analysis survey reports that the biologics production sector dealt with nearly identical issues as past years, with a slight shift in priority, for the last year [22]. Manufacturing production has moved up to second position, after the general priority one regulatory complaint for quality stems, organization and documentation. Personnel qualification is a constant number three in priority, but equipment deficiencies have reached number 4 priority at least, whereas complaints about computerized systems have lost attention [23,24,25].
One of the otherwise-typical challenges of ordering manufacturing equipment based on vague assumptions during development was no issue in the SARS-COVID19 vaccine strategy, as any product on the market was known to be sold. Therefore, the normal delay due to unknown penetration of the market which leads to non-appropriately scaled, scheduled and dimensioned and therefore afterwards non-optimal operated equipment was ruled out by definition. Nevertheless, the next obstacle in priority, any out of specification (OOS) problems due to variability, is still valid and especially for new product technologies like mRNA-vaccine-types and lipid-nano-particle (LNP) formulations and is a dominant challenge [23,24,25,26].
Survey statistics sum up about a magnitude of 10% batch failures with even higher contamination rates in small-scale facilities, in combination with 5-times-higher losses owing to operator errors [23,24,25].
From any manufacturing operation point of view, this trend clearly indicates towards the need for the establishment of advanced process control systems based on digital twins and process analytical technologies in order to cope with sensor drift, process variance and allow for real time release testing in order to reduce significant efforts and improve batch variability. 40–80% of manufacturing efforts are dedicated to QA issues [27,28]. This makes it obvious to start technical improvements there. The summarized main challenges to be addressed, as discussed above, are summarized in Figure 1 by SWOT (strength, weakness, opportunity, and threat) analysis regarding bottlenecks, challenges, and threats.
There are several types of vaccines, both approved and still under development. Three major subtypes can be distinguished: drugs that already contain the immune response-inducing spike protein; viral vectors, mostly AAV, that deliver the spike protein-encoding DNA sequence into the cells; and the mRNA drugs discussed in this paper, which carry the gene information of the spike protein in the form of mRNA for direct formation in the patient’s cells and are delivered in LNP (Figure 2).

1.1. State-of-The-Art in mRNA Manufacturing

Synthesis of mRNA needs, as a starting point, template DNA that contains the genetic code for the respective spike protein. While complete cell-free manufactured DNA is feasible and on the horizon [30], e.g., by doggy-bone technology [31], state-of-the art is still plasmid manufacturing by E. coli fermentation followed up by purification and linearization [32]. In the next phase the linearized DNA serves as template during in vitro transcription. While traditionally transcription and capping are separate process steps, modern technology enables co-transcriptional capping [33] (Figure 3).
Purification processes of so-obtained mRNA are in literature often referred to rely on platform technology [34]. Like monoclonal antibody platform technology, where the same process steps can be used to manufacture different antibody derivatives, an existing mRNA plant, or at least the same process steps, can be utilized to manufacture different mRNA vaccines [35]. However, in contrast to antibody manufacturing, the purification strategy, in terms of which separation technologies are to be applied and in which order, is not standardized.
There are a wide variety of different separation technologies and overall purification strategies published in literature. While the key steps of transcription, purification and final encapsulation into lipid nanoparticles are mostly the same for the known mRNA vaccine candidates, the purification steps in-between are not alike.
For example, a patent filed by CureVac [36], which, in cooperation with Bayer, produces the soon-to-be-authorized CVnCoV vaccine, discloses a manufacturing process with the key purification sequence consisting of transcription and capping, LiCl precipitation, reversed phase, chromatography, alcohol precipitation, lyophilization and sterile filtration. In this process concept, the necessary concentration adjustment between steps 5 and 6 is done by resuspension of the lyophilized product into the appropriate amount of formulation solution. To our knowledge, it is not disclosed if this process strategy will also be used to produce CVnCoV. CureVac, however, will manufacture the vaccine in a cooperation network including Bayer, Rentschler, Wacker and Fareva [37].
A proposed process sequence by BIA Separations, which aims to streamline mRNA purification without precipitation steps, simplifies scale-up and increases yield, and is composed of transcription, multimodal chromatography, capping and affinity chromatography. This sequence is likely to be complemented by at least a UF/DF step for adjustment of concentration as well as the obligatory sterile filtration [38].
Another process concept used as a framework in an RNA manufacturing assessment study by Kis et al. [35] employs transcription and capping, tangential flow filtration, diafiltration, multimodal or ion-exchange chromatography, tangential flow filtration, diafiltration and sterile filtration. After these steps the concept process used by Kis et al. goes into further process stages including LNP formulation and fill-to-finish.
The manufacturing process of BNT162b2, authorized and marketed as Comirnaty in the EU, is for the most part not disclosed. While the template plasmid DNA for all markets is produced in Chesterfield (USA), the transcription process takes place at market-specific locations. Transcription for the US is primarily done at the Pfizer site in Andover (USA) [39], while in the EU transcription takes place at a BioNTech manufacturing site in Marburg (Germany) [40], which was acquired from Novartis in September 2020 to expand production capacities. Encapsulation into LNP is again performed in a separate location, namely Pfizer’s sites in Kalamazoo (USA) and Puurs (Belgium) and, as recently announced, also at Novartis’ site in Stein (Switzerland) for the EU.
While it is reported that the manufacturing of Moderna’s vaccine in the EU takes place at Lonza’s production site in Visp (Switzerland), LNP encapsulation as well as fill and finish is handled by Rovi Pharma Industrial Services (Spain), no details of the manufacturing process are disclosed.
pDNA has developed into a platform process. E. coli fermentation followed by alkaline lysis and clarification is industrial standard and only the number of chromatography steps varies, depending on purity demands and application of the produced pDNA. Therefore, in this paper, monolithic anion-exchange chromatography (AEX) is chosen as a sufficient purification step for further mRNA processing. The processing scale is chosen based on literature and discussed in Section 3. mRNA processing is based on co-transcriptional capping as industry standard, as it needs one purification step less than post-transcriptional capping. Therefore, processing is faster. The processes reported in literature and the process framework depicted in this work are both summarized in Figure 4. For this total pDNA to mRNA process, a digital twin is proposed based on literature data, pre-existing knowledge and experimental experience as well as existing basically validated process models [41,42,43,44,45,46,47].

2. Material and Methods

2.1. Model Overview

2.1.1. Fermentation

Simulation of Escherichia coli fermentation was based on a Monod-type process model. Growth rate was a function of glucose (Glc) and oxygen concentration (O2)
μ = μ max · Glc Glc + K Glc · O 2 O 2 + K O 2
where µmax is the maximal growth rate and KGlc and KO2 are the Monod-coefficients for glucose and oxygen, respectively.
The change of biomass and substrate concentration over time is given by
dc X dt = V ˙ in · c X , in V ˙ out · c X V + μ · c X
dc Glc dt = V ˙ in · c Glc , in V ˙ out · c Glc V μ Y X / Glc + m Glc · c X
respectively, where c X is the biomass concentration, c Glc is the glucose concentration, YX/Glc is the yield coefficient of biomass from glucose, mGlc is the maintenance coefficient of biomass on glucose, V ˙ is the volumetric flow rate either in or out of the bioreactor as indicated by the subscripts, and V is the volume of the fermentation broth. For fed-batch fermentations V ˙ out was set to zero.
The volumetric change over time was considered using a volume balance:
dV dt = V ˙ in V ˙ out
The change of the oxygen concentration was calculated based on the oxygen transfer and the oxygen consumption by the biomass.
dc O 2 dt = k L a · c O 2 * c O 2 q O 2 · X
where k L a is the specific oxygen transfer coefficient, c O 2 * is the oxygen saturation concentration in the fermentation broth, c O 2 is the current oxygen concentration in the fermentation broth and q O 2 is the specific oxygen uptake rate.
The required mass flow of glucose into the bioreactor for achieving a constant growth rate, µset, was calculated as suggested by Korz et al. [48].
m t = μ set Y X / Glc + m Glc · V t F · X t F · e μ set t t F
where V t F , is the volume of the fermentation broth at the beginning of the feed, X t F the biomass concentration at the beginning of the feed, tF the start time of feeding and t the current process time. All model parameter could be found in literature as specified in Section 3 in detail.

2.1.2. Alkaline Lysis

For simulation of alkaline lysis, a cGMP process for industrial scale plasmid DNA manufacturing published by Urthaler et al. [49,50,51] is used as template. After fermentation, wet cell paste (WCP) is resuspended in buffer P1 at ratio of 1:10 (g WCP/mL P1). Lysis is achieved by mixing with alkaline buffer P2 (0.2 M NaOH, 1% SDS). For this, resuspended biomass and P2 are continuously pumped into a tubular lysis line at ratio of 1:1 (mL WCP+P1/mL P2) at a residence time of 3 min. Subsequently this solution is neutralized by 3 M potassium acetate buffer P3 (pH5.5) at a ratio of 1:1:1 (WCP+P1:P2:P3) prior to concentration.
Main equations of the lysis model are the kinetics of cell lysis and release of plasmid DNA as well as impurities like genomic DNA and proteins. Homogeneity of plasmid DNA is also calculated by a first-order kinetics approach.
r x = d [ X ] dt = k 1 · X · NaOH
r x disr = d [ X disr ] dt = k 1 · X · NaOH
r scpDNA = d [ scpDNA ] dt = k 1 · X x pDNA · NaOH k 2 · scpDNA · [ NaOH ]
r NaOH = d [ NaOH ] dt = k 1 · X · NaOH  
r ocpDNA = d [ ocpDNA ] dt = k 2 · scpDNA · NaOH k 3 · ocpDNA · [ NaOH ]
r linpDNA = d [ linpDNA ] dt = k 3 · ocpDNA · NaOH
Variables in brackets represents concentrations. Main model parameters characterizing the kinetics of lysis and reactions are k1 to k3.
The necessary partial-differential equation to describe concentration change over time and positional change is calculated by distributed plug-flow model:
c i   t = u · c i   z + D a x c i 2   z 2 + r i
Main model parameters are axial backmixing characterized by Dax, flow velocity u, concentration of species i ci and reaction rate ri.

2.1.3. Concentration by Ultrafiltration

For concentration by UF/DF, a model developed by Grote et al. [52] is used. Details can be found in the publication. Here, the main transport equation for the filtration is shown based on osmotic pressure.
J i = L P · Δ p R   T c i , M c i , P M i
while transport through the membrane is calculated by the product of membrane area, flux and driving force, the transport from inlet to outlet is handled by the distributed plug-flow model. Additional terms accommodate for transport resistances like concentration polarization and fouling.

2.1.4. Purification with Adsorption Monoliths

Modelling of the monolithic column is based on the general mass transfer model, consisting of convective and dispersive mass transport, including adsorption, as in Equation (15). This is commonly done since the average pore size of 1 µm significantly favors convective mass transport [53,54]. This is also common for the mass transport in membrane adsorption [55,56,57,58].
δ c δ t = u i n t · δ c δ z + D a x · δ 2 c δ z 2 1 ε ε · δ q δ t
Here, c is the concentration in the fluid phase of any molecule analytically measurable, uint is the interstitial velocity Dax is the axial dispersion coefficient, ε the voidage of the monolith and q the corresponding solid phase concentration of any molecule. The modelled monoliths are made up of tubular cylinders, as depicted in Figure 5. To describe this shape in our model the coordinate z was adjusted to reflect a radial coordinate as shown in the figure. This is necessary since z also has to represent the direction of flow through the media for Equation (15) to be true.
With the adjustment of z, the velocity can be calculated over z, dividing the flow V ˙ by the cross-sectional area A z . This is described in Equation (16). The cross-sectional area is calculated as the surface of a cylinder, as depicted in Equation (17), where d is the outer diameter of the cylinder and h the height.
u z = V ˙ A z
A z = π · d z · h
Combining Equation (15) and Equation (16) the mass balance is given in Equation (18).
δ c δ t = V ˙ A z δ c δ z + D · δ 2 c δ z 2 1 ε ε · δ q δ t
Different approaches for modelling of adsorption have been described by different working groups [59,60,61,62,63]. For the modelling of adsorption for this process a Langmuir model was used [62,64], see Equation (19). This was done since for more sophisticated adsorption models such as competitive Langmuir or steric mass action (SMA), as a bigger data set for parameter determination is required [65,66]. Langmuir, however, has shown for different target molecules an accurate description of adsorption for different working groups [44,67,68].
q i = q m a x , i · K e q , i · c i 1 + K e q , i · c i
Here, q m a x , i is the maximum loading capacity of the component and K e q , i is the Langmuir coefficient of the component. K e q , i and q m a x , i are related by the Henry coefficient H i , see Equation (20) [59]. Salt influence can be described by Equation (21) and Equation (22) defining a 1 , a 2 , b 1 and b 2 as correlation coefficients [60,69].
q m a x , i · K e q , i = H i
q m a x , i = b 1 · c p , 1 + b 2
H i = a 1 · c p , 1 a 2
The data for parameter determination were taken from literature [38,70]. The axial dispersion coefficient Dax was determined using the buffer gradient measured after the monolith, using either conductivity or pH. Isotherm parameters were determined using the identification given in these publications. The parameters b 1 and b 2 for the calculation of the maximum loading capacity are taken from a publication of Tarmann and Jungbauer [71]. The determined parameters were used to calculate a scale-up for each separation process. Monoliths simulated are CIM® monoliths (BIA Separations, Ljubljana, Slovenia). For the comparison with literature data, monoliths with a volume of 1 mL are simulated, as these are used in the laboratory experiments. For scale-up, 8 L monoliths are used as these are the biggest easily-available size.

2.1.5. Linearization

Linearization of circular plasmid DNA through the EcoRI restriction endonuclease was modelled as a Michaelis–Menten type reaction [72]:
v = v m a x · c p D N A K p D N A + c p D N A
where v m a x is the maximal reaction rate, K p D N A is the Michaelis constant of EcoRI for pDNA, and c p D N A is the pDNA concentration.

2.1.6. Transcription

In vitro transcription of mRNA from linearized pDNA was described by a Michaelis–Menten equation:
v = v m a x · c n u c K n u c + c n u c
where v m a x is the maximal reaction rate, K n u c is the Michaelis constant of T7 RNA polymerase for nucleotides and c n u c is the concentration of the four nucleotides.

2.1.7. Lyophilization of mRNA

A one-dimensional sorption sublimation model introduced by Klepzig et al. models the lyophilization [47]. The publication shows the exact derivation of the proposed model. It allows the calculation of the time-dependent product temperature and the residual moisture during the lyophilization process. Here, the main equations of the coupled mass and heat transfer equation for the primary and secondary drying are shown.
During primary drying, heat is mainly transported by conduction through the frozen layer. At the sublimation interface, the ice sublimates and subsequently flows through the porous dried layer. The energy balance can be formulated to:
ρ P r o d u c t · c p , a p p a r e n t · T t = λ · 2 T x 2
ρProduct describes the density of the product, cp,apparent is the apparent heat capacity, T the product temperature inside the vial and λ is the heat conductivity. The density and heat conductivity depend on the mass fractions of the frozen and ice-free product per discrete. The apparent heat capacity is used to ensure that phase change is only considered at the sublimation interface.
The overall mass balance of water considers the frozen and the dried product. The phase change of water is considered faster than the convection of the vapor. Therefore, convection controls the overall transport rate.
m W t = ρ W , g · Δ p η W · K · A v i a l
with mw as overall water mass, ρw,g as density of water vapor, Δ p as pressure difference between discretes, η W as dynamic vapor viscosity of water, K as hydraulic flow resistance, and AVial as cross-sectional area of the vial. The mass and heat balance are coupled through the sublimating mass flow.
The next step in Lyophilization is the secondary drying. Here, desorption of the bound water in the dried matrix is the main transport mechanism. Desorption is modeled by an Arrhenius approach because the desorption rate highly depends on the temperature. The mass balance of the bound water during secondary drying is described by:
w b w t = exp Δ h s u b l R · T p r o d u c t a W · w b w w b w , e q
with wbw as mass fraction of the bound water in the dried product, Δhsubl as sublimation enthalpy, R as gas constant, αw as water activity, and wbw,eq as mass share of bound water at equilibrium.

3. Results

3.1. Process Synthethis

The manufacturing of mRNA as presented here is a three-step process. First pDNA, used as template during transcription, is produced by fermentation, subsequent purification, and linearization. The second major manufacturing step starts with the transcription of the spike protein encoding gene from the linearized DNA into mRNA, which is the key ingredient substance of the vaccine, and subsequent purification. The third and last major phase is the encapsulation of the highly purified mRNA into LNP (Figure 6). The sequence of process steps were selected after assessing the current-state-of-the art in mRNA manufacturing (see also Section 1.1). Plasmid manufacturing is based on published information by Urthaler et al. [49,50,51,73]. Since for linearization the usual separation of iso-forms is not necessary, the process is based around a single AEX chromatography unit. Process scale for mRNA manufacturing was set to be comparable with information given by Pfizer, who are able to manufacture up to 10 million doses of their drug product in a single 40 L batch [39]. The corresponding scale of pDNA is done in 200 L fermentation batches (2 g/L). Lower product titer, e.g., 1 g/L, would result in 400 L fermentation batches and 4× instead of 2× concentration during harvest.

3.2. Process Simulation

3.2.1. Fermentation

Simulation results of fermentation runs with different kLa-values are shown in Figure 7. The solid line shows the fermentation result with a kLa-value of 0.87 s−1, whereas the dotted lines indicate the fermentation result, resulting from a deviation of ±10% of the kLa-value. Dots indicate experimental results taken from the literature [73].

3.2.2. Resuspension and Alkaline Lysis

The concentration profile after alkaline lysis is shown in Figure 8. After entering the lysis line, the cells are immediately disrupted and pDNA as well as intracellular impurities are released. This process is finished up to 67% after 10 s according to data by Urthaler et al. and can be described by the process model. While impurity concentration stays constant, once all cells are lysed, the concentration of sc-pDNA decreases due to the formation of unwanted isoforms.

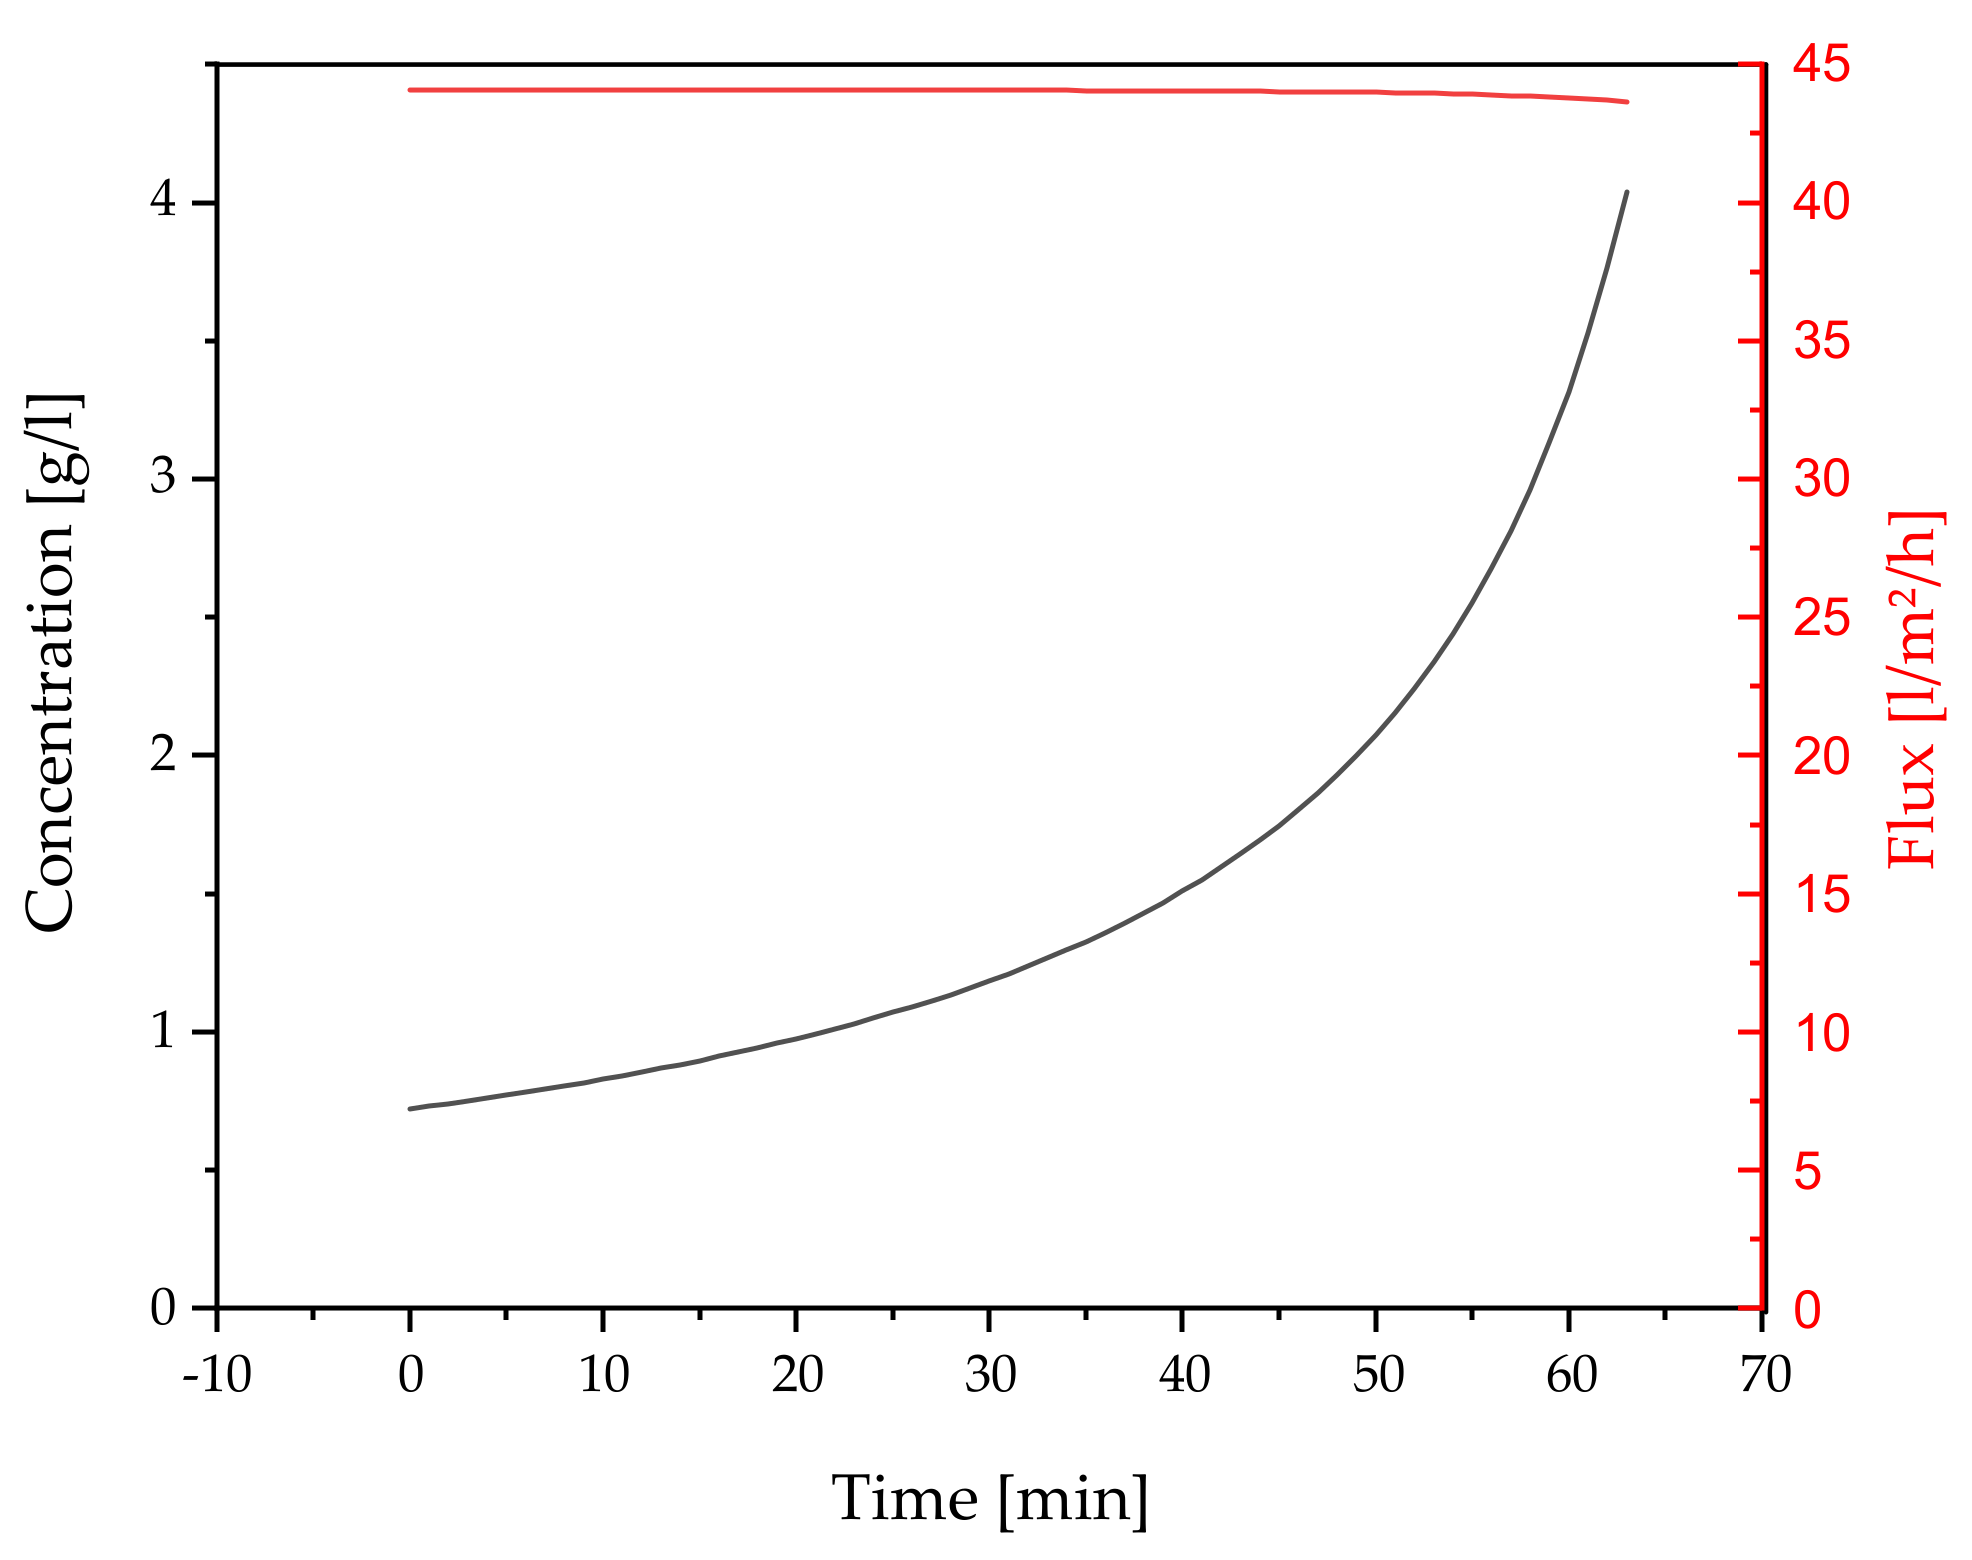
3.2.3. Concentration by Ultrafiltration

After alkaline lysis, pDNA is concentrated by ultrafiltration. Several studies have been published regarding the ultrafiltration of pDNA. Besides the investigation of a fundamental sieving and folding mechanism, e.g., by electrolyte addition [74,75,76], only a few case studies provide data of process-representative parameters. Here, data published by Urthaler et al. and Repligen are utilized to obtain a reliable comparison [49,50,51,77]. During this step a 5-fold increase in concentration is achieved at flux of 41 LMH and transmembrane pressure of 0.4 bar (Figure 9).

3.2.4. Purification of pDNA by AEX

The simulation results of the small monolith in comparison with literature data are given in Figure 10. The dispersive mass transfer coefficient is determined to be 10−7 m2/s by the salt gradient signal; however, the influence of this coefficient is small compared to the convective mass transfer. The dispersion observed in the gradient is predominantly influenced by the monolith’s geometry.
In Figure 11 the scale-up of the AEX capture is depicted, and for process optimization a high salt load can be employed. This optimized process is shown in Figure 11. Using the high salt wash, side components, which elute in the first gradient step, can be separated in the flowthrough, improving productivity of this process step from 15.294 to 17.805 g/(L·d) while maintaining a yield of 99%.

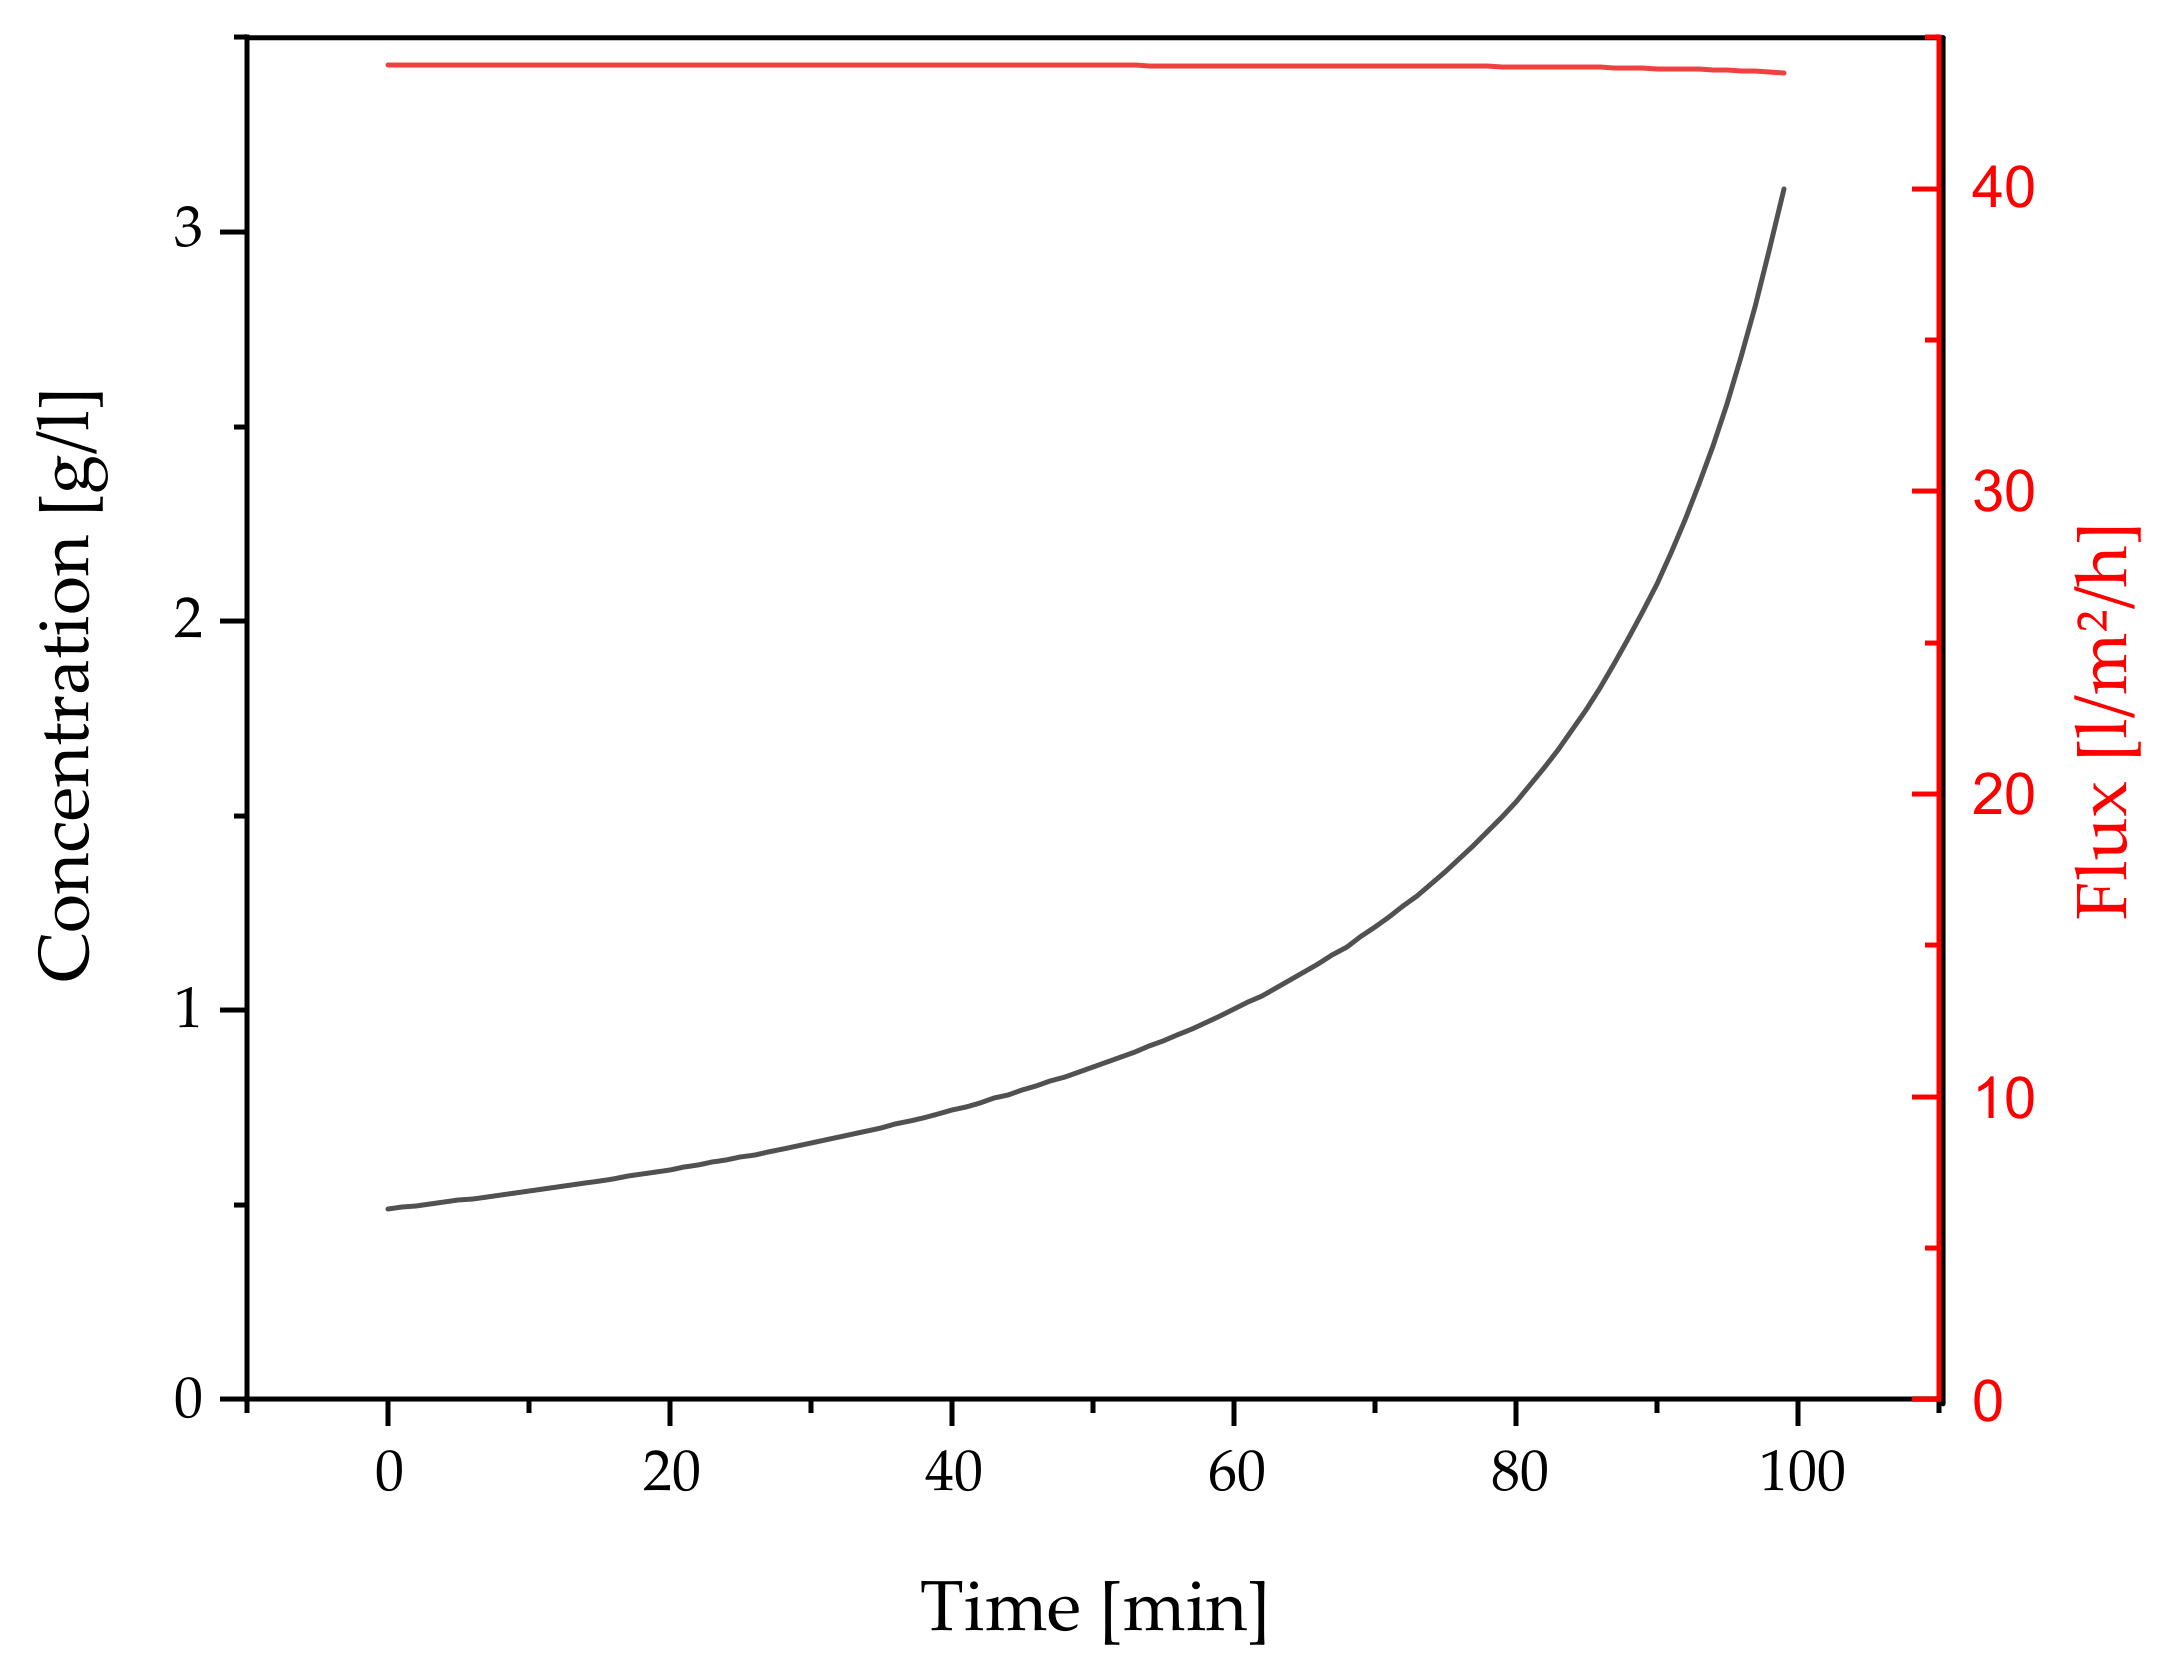
3.2.5. Concentration and Diafiltration by UF/DF

After purification by AEX and prior to linearization, concentration and buffer exchange is achieved by UF/DF. The same model as in Section 3.2.3 is used to calculate the reduction of 440 L process volume after AEX to 100 L after concentration and 9 diafiltration volumes (Figure 12 and Figure 13).

3.2.6. Linearization

In mRNA production, the pDNA template is typically linearized using a restriction endonuclease, in order to prevent transcriptional read-through. For the simulation, kinetic parameters of EcoRI restriction endonuclease from the literature were used [72]. The concentrations of pDNA and EcoRI were taken from the literature [36]. The linearization of 3.1 g/L pDNA takes approximately 2.6 h, which is consistent with literature data [36,78]. Due to the low KM value of EcoRI for pDNA, the reaction proceeds almost the entire time at the maximum reaction speed (Figure 14).

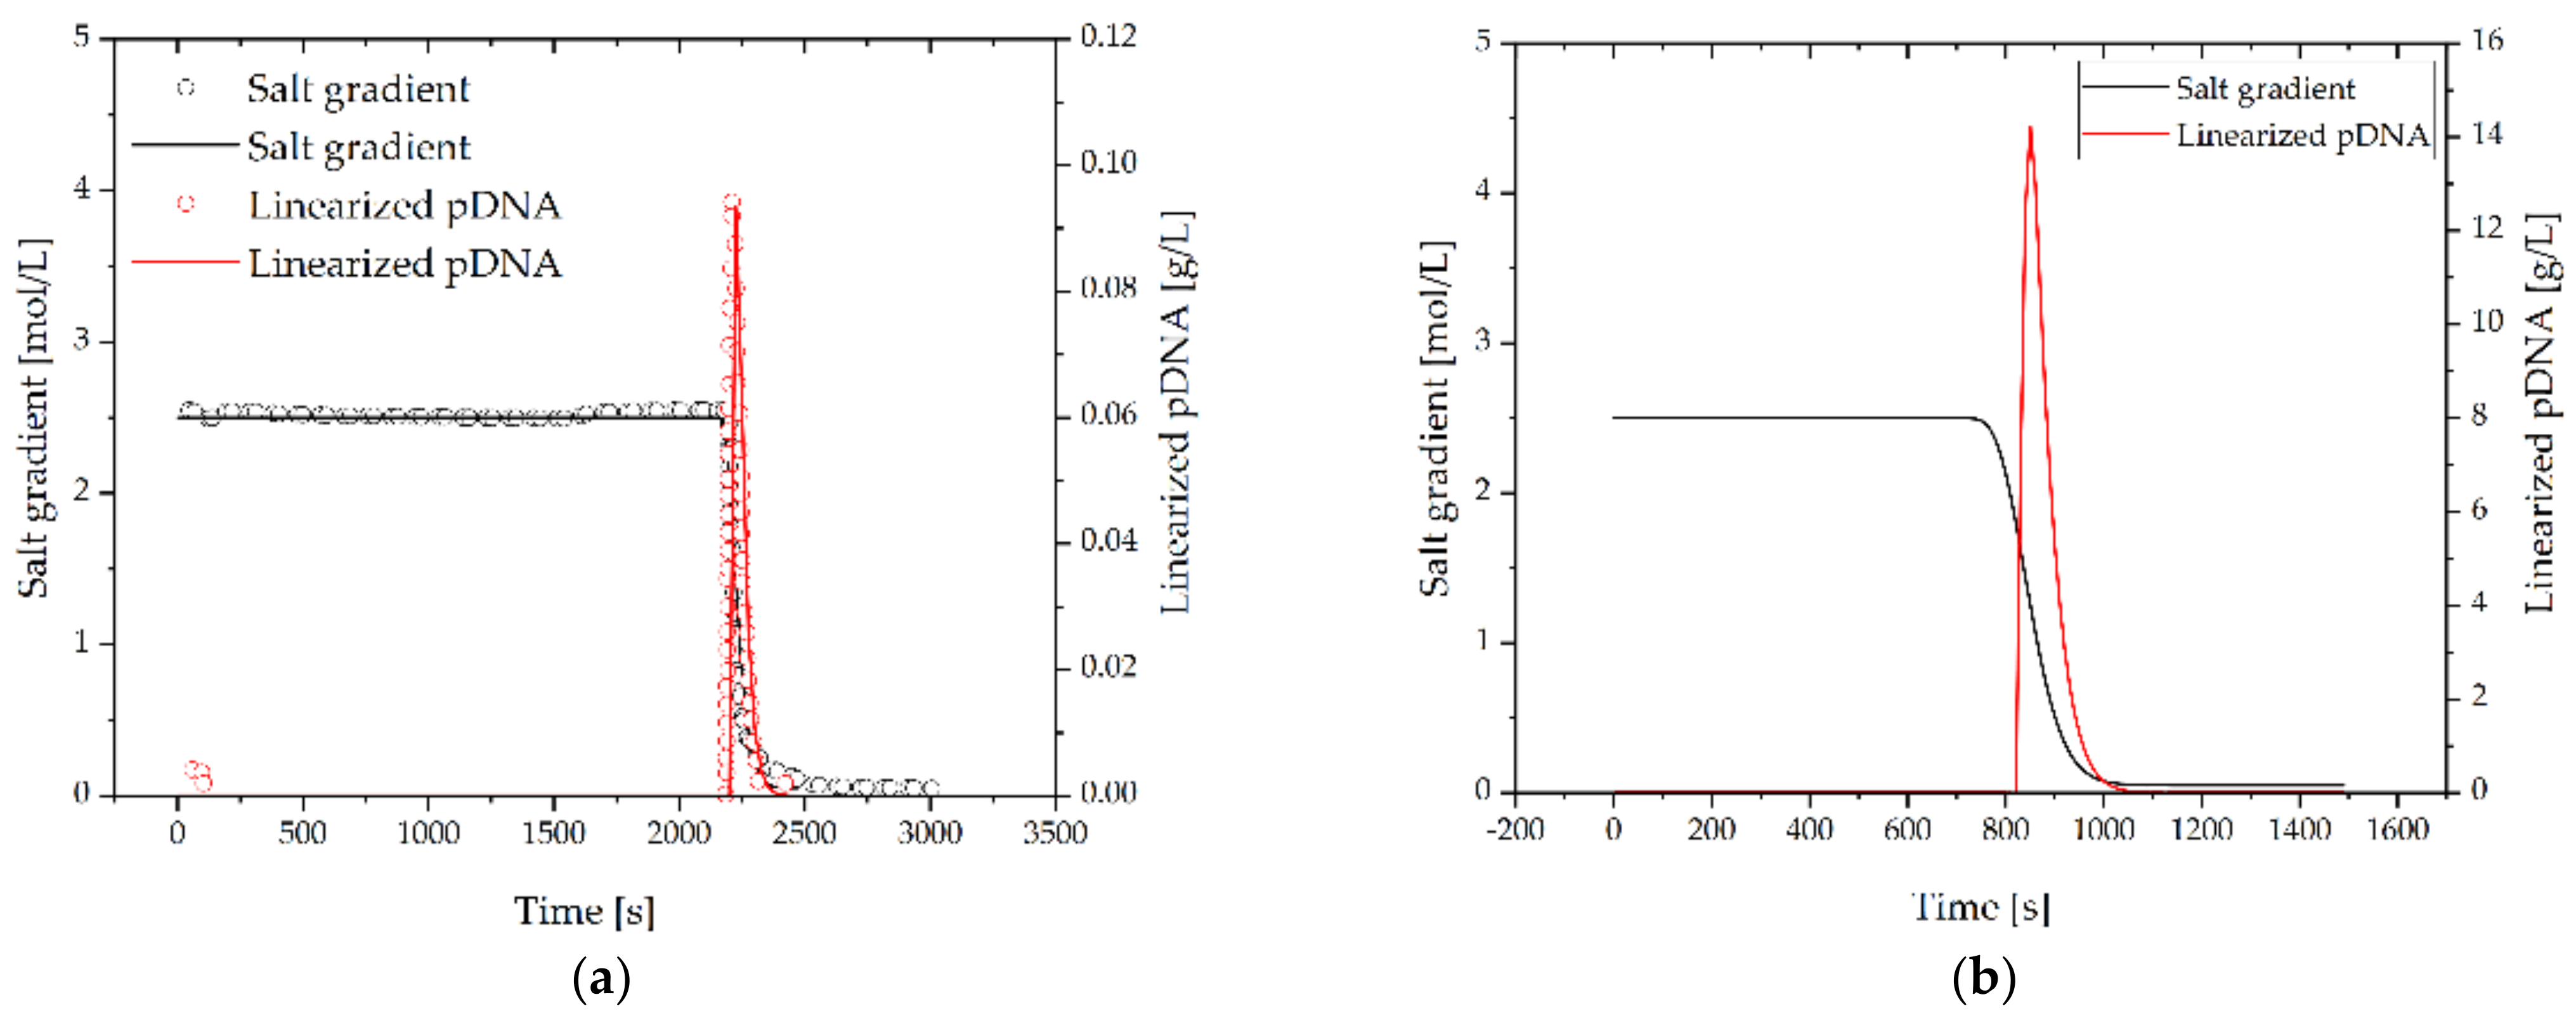
3.2.7. Purification of Linearized ds-DNA by HIC

In Figure 15 the simulation results for the HIC monolith are given. Compared to the anion exchange monolith productivity is greatly increased to 61.402 g/(L·d). This is mainly caused by the higher input concentration to the process, resulting in a significantly shorter loading time. It should be noted, however, that the regeneration of the monolith has to be added to the process time, increasing the process time and resulting in a productivity of 34.112 g/(L·d).

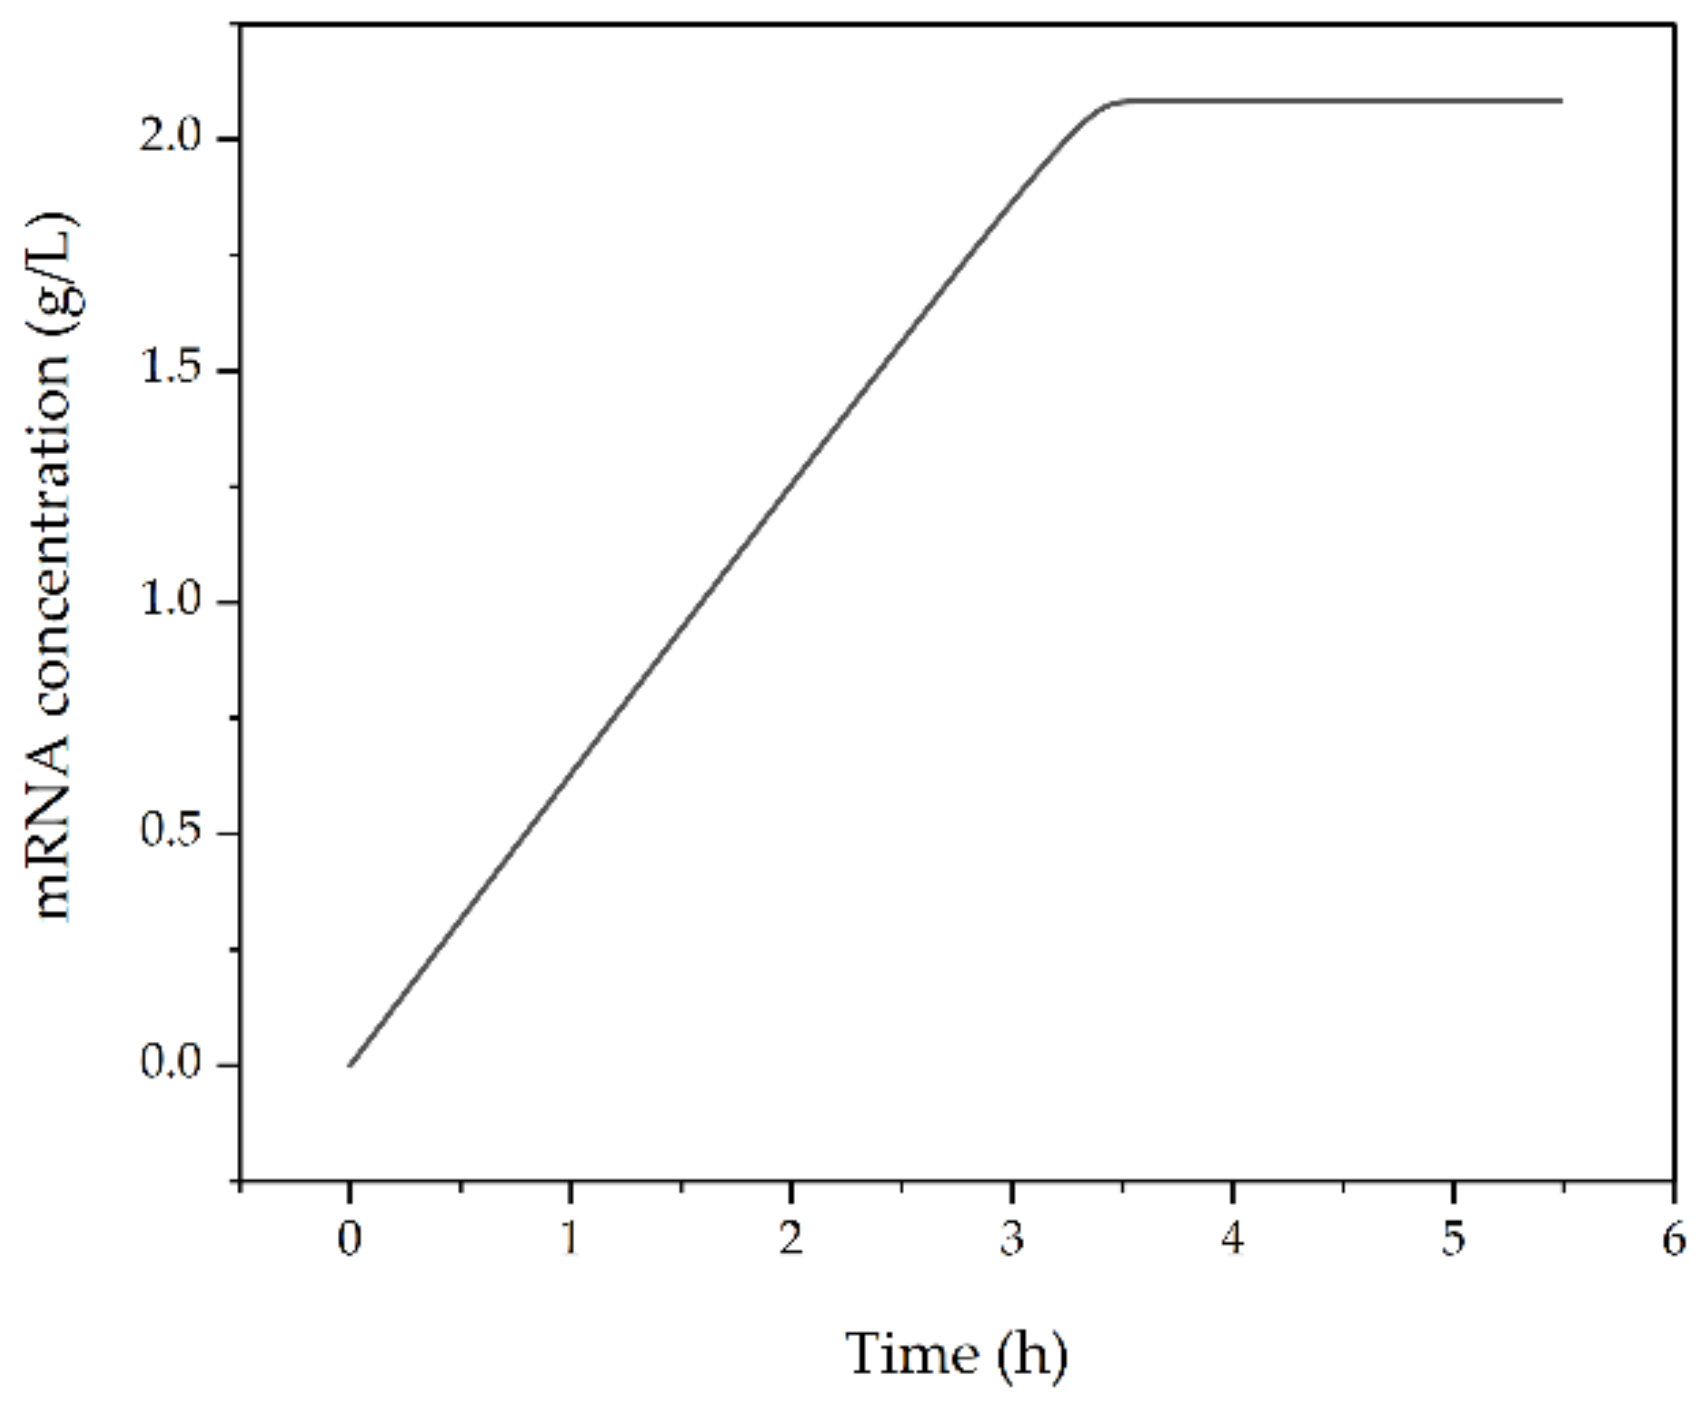
3.2.8. Transcription

RNA is synthesized enzymatically in a polymerization reaction by RNA polymerase. Different RNA polymerases exist as commercial products, e.g., T7-, T3 and Sp6-RNA polymerase. For the simulation (Figure 16), kinetic parameters of the T7-RNA polymerase were used. The transcribed sequence was assumed to have a length of 669 bp, which is equivalent to the length of the sequence encoding Arg319 to Phe 541 from the RBD of the SARS-CoV2 spike protein. Transcription terminates at the end of the sequence, which is the site of prior enzymatic cleavage. After the transcription reaction, the premature mRNA needs to be capped and a poly-A tail needs to be added. Both processes can be either performed as separate enzymatic steps or be performed alongside the transcription reaction by incorporating a poly(T) sequence of about 50 nucleotides into the DNA-sequence and adding the cap analog to the reaction mixture. The 5′-cap (e.g., m7GpppN) can be methylated enzymatically by mRNA (guanine-N7-)-methyltransferase.

3.2.9. Purification of mRNA by MMC

Simulation results for the mixed-mode monolith are given in Figure 17. In (a) the literature data and the simulated results for this process are given. The peaks at 350 and 650 s are caused by the high salt wash induced in the paper, and are therefore not simulated [70]. The product is eluted in a pH gradient. For the scaled-up process, the resolution of the chromatography worsens, resulting in a yield of 90% cited in literature and later in this paper. Productivity is 18.3 g/(L·d) for the simulated 8 L monolith.

3.2.10. Purification of mRNA by RPC

The simulation results for the RP monolith compared to the laboratory data are given in Figure 18. The data from the simulated laboratory process [38] is given as symbols while the simulation results are given as lines.
For scale up, an optimization similar to HIC can be explored via simulation. The wash step, employing 6.5% acetonitrile in the laboratory process, can be integrated into the column load. This comparison between low and high acetonitrile load is shown in Figure 19. The process time can be shortened significantly if a high acetonitrile load is employed. This might also increase the binding capacity as it would hinder competitive adsorption to some extent, as described for the HIC process [71]. The productivity increased from 43.5 g/(L·d) to 87.1 g/(L·d) based on the shorter process time.

3.2.11. Lyophilization of mRNA

For the simulation of the Lyophilization process, two model parameters are necessary: the vial heat transfer and the hydraulic flow resistance. These parameters are adopted from literature [47]. For this study, similar heat transfer coefficients are assumed for the pilot and manufacturing scale. The hydraulic flow resistance is increased for the manufacturing scale due to higher supercooling [79]. The edge vials receive a higher heat input during lyophilization due to radiation [80]. Therefore two critical vials can be obtained. The first vial obtains the highest heat input and therefore limits the shelf temperature whereas the coldest vial determines the minimal process time. It is of immense importance to keep the product temperature below the collapse temperature to avoid the loss of cake elegance and maintain a long enough primary drying phase to remove the ice from the product. The lyophilization process for different vials is shown in Figure 20.
The shelf temperature is raised from −40 °C to −10 °C in 6 h, followed by a hold of 11 h. During primary drying, the chamber pressure is lowered to 0.16 mbar. The secondary drying starts with a temperature ramp from −10 °C to 20 °C for 3 h and the chamber pressure is lowered to 0.068 mbar. This temperature is held for 7 h. Both product temperatures start at −40 °C and gradually approach the shelf temperature. The product temperature of the hottest vial increases faster to the shelf temperature compared to the colder vial because it is subject to higher heat input through radiation. Therefore, the drying process of vial is completed faster. The drying process of the coldest vial is slower. Product temperature of the coldest vial reaches the shelf temperature right before the primary drying is finished. As such, the primary drying process can be considered completed and the secondary drying begins. Since bound water already can be desorbed during the primary drying phase, the product temperature of the hottest vial lays near the shelf temperature. In contrast, the coldest vial has a higher amount of desorbed water in the dried matrix and therefore a high amount of energy is used for desorption. The final residual moisture of the vials is about 1.5%.

3.3. Feasibility of PAT for APC

Digital twins in mRNA manufacturing rely on online process data that updates the information fed into the process models in real-time [81,82,83,84,85]. Besides simple process parameters like pressure, conductivity, pH, temperature, etc., concentration of the target component and main impurities are necessary to ensure that the information gathered from the digital twin are reliable. Spectroscopic technologies like Raman, FTIR, UV-vis, fluorescence and circular dichroism have been demonstrated to be suitable detection methods for a variety of biologics manufacturing processes.
To assess the potential of APC-enabling techniques, plasmid concentration after alkaline lyses in different concentration and purity ranges are exploratory investigated by Raman spectroscopy (Raman shift 1800–400 cm−1), FTIR spectroscopy (absorption frequencies from 1800–800 cm−1) and DAD (wavelength 200–500 nm).
In Figure 21, Figure 22 and Figure 23, raw and processed Raman, FTIR and DAD spectra are shown. Details on how to apply correct pre-processing and PLS-model building and benefits of multi-detector combinations have been published previously [83]. R2 of Raman prediction for pDNA titer is 0.99 (R2val 0.85, RMSE 0.04 g/L, 2 factors). R2 of FTIR prediction for pDNA titer is 0.97 (R2val 0.89, RMSE 0.076 g/L, 2 factors). R2 of DAD prediction for pDNA titer is 0.99 (R2val 0.90, RMSE 0.02 g/L, 3 factors).
This first feasibility study with few data points shows clearly that different titer concentrations can be distinguished by state-of-the-art spectroscopic technologies. Therefore, any detailed investigation in process scale regarding different batches and process steps is worthwhile. Laboratory scale approaches are existing like C Technologies’ variable pathlength UV-vis spectroscopy [86].
In combination with the proposed digital twin, any PAT strategy would allow advanced process control implementation towards autonomous operation in order to reduce OOS batch failures, qualified personnel bottlenecks and rare chemicals like buffer utilization to a minimum. This increases productivity—i.e., more vaccine amounts on the market for patients. In addition, any start-up training simulation would make it possible for new equipment and plants to reduce qualification and validation time.

4. Discussion

The digital twin results of the total pDNA to mRNA process are summarized in the following: purity, yield and titer concentration are key-characteristic numbers for process performance evaluation and are summarized in Figure 24 and Figure 25.
pDNA processing shows obvious (about factor 10) large dilution during lysis as a first approach for debottlenecking. Second, a target is the reduction of chromatography steps necessary for further mRNA processing, especially efficient transcription. High purity pDNA processing does have the objective of separating isoforms. This is, for further mRNA processing, not necessary. Only proteins, gDNA and endotoxins must be separated. Third, 1 g pDNA may lead to about 30 g mRNA. This shifts the bottleneck towards the mRNA processing stage.
Co-transcriptional capping is successful in reducing the number of purification steps accompanied by any natural yield losses. Purity demands are fulfilled with a combination of mixed-mode and reversed-phase chromatography. As established unit operations with standardized equipment skids and materials in manufacturing scale, those chromatography steps are on a higher industrial readiness level than, e.g., precipitation and ethanol-chloroform extraction. This, in addition, would cause ATEX explosion proof installation and approval. Even one chromatography step, AEX or mixed-mode, in combination with following UF/DF may be sufficient for purity reasons. But, orthogonal purification mechanisms are often regarded as save for regulatory approval in processing for product safety reasons. UF/DF would allow for adjusting final concentration and buffer composition before LNP formulation. At this final step, lyophilization was chosen because any desired concentration for patient application could be easily adjusted by resuspension. In addition, stability, storage and transportation logistics are discussed as easier Adjuvants can also be added during formulation, e.g., QS-21, which is a purified watery extract consistent of saponines from Quillaja saponaria Molina as auxiliaries for vaccine adjuvant formulation [87,88,89,90]. For the institute it is another beneficial combination of biologics and botanicals topics [91,92].

5. Conclusions

A complete digital twin is proposed for further validation in manufacturing scale and utilization in process optimization and manufacturing operations. Personnel training is an additional key issue on order to avoid downtime, OOS batch failures and the inefficient start-up of new build plants, as well as assisting the speed-up of technology transfer to multiple manufacturing sites.
The first PAT results should be followed by detailed investigation at different batches and processing steps in order to implement this strategy for process control and reliable efficient operation. Towards application of the existing digital twin for advanced process control (APC), the PAT study must be concluded in order to reduce off-line quality assurance (QA) testing and finally enable real time release testing (RTRT).
One bottleneck in manufacturing capacity and transfer is availability of qualified, skilled and experienced operators. The digital twin enables a training simulator in combination with the existing process control system, and is a well-established and beneficial procedure in petro-, basic- and fine-chemicals industry. In addition, the question of operator workload must be discussed, particularly for having many parallel steps around the product through the process unit operations of single-use devices which needed to be fetched from storage in time, de-packed and packing material de-positioned, then mounted, connected, tested, filling and operating with product and, finally, cleaning, disconnecting, dismounting, packing and waste-disposal, e.g., [93]. Besides availability, the normal multiplication of operators is naturally limited to working space and the described working procedures themselves. In addition, the configuration and operation has to be tested, started, supervised, ended and documented with aid of the process control system, which is a considerable multi-tasking operation. Here, the question has to be asked whether single-use technology is still the efficient modus operandi of choice for those manufacturing issues: continuous (or batch) small-scale stainless steel equipment in pilot-scale for manufacturing has the benefit in combining advanced process control based on digital twins and with PAT for process control at autonomous operation to automize any manual handling by switching valves within piping, which enables in addition safety issued back answer of set-point acceptance as well as cleaning including cleaning validation testing and even real-time-release-testing (RTRT) [94] with different PAT sensors than for process control issues. This would reduce the parallel workload of handling and process control panel operation to the most important supervision of the product, allowing easy manifold coping of a plant and its skilled operation as well as potential OOS reductions. Moreover, operator workload is reduced drastically, as they would be capable of operating different plants in parallel—a most wanted capacity increase option at enhanced product robustness.
Generation of such a total-process digital twin does need about 4 scientists within 2–3 weeks, if experienced, trained and skilled in laboratory work, process modelling and PAT with PCS. Final validation with manufacturing data runs would take about 1–2 months, as an educated guess. The authors offer companies of interest accessibility or further studies based on the digital twin.

Author Contributions

A.S. performed PAT experiments and was responsible for filtration simulation; H.H. was responsible for simulation of fermentation, alkaline lysis, linerarization and transcription; F.L.V. was responsible for simulation of chromatographic separation; A.J. was responsible for lyophilization simulation; J.S. substantively revised the work and contributed the materials and analysis tools; J.S. is responsible for the conception and supervision. All authors have read and agreed to the published version of the manuscript.

Funding

This research received no external funding.

Institutional Review Board Statement

Not applicable.

Informed Consent Statement

Not applicable.

Acknowledgments

The authors like to especially thank Dean Harde, Katrin Ganja and Cecile Brocard from Boehringer Ingelheim RCV GmbH & Co. KG for pDNA material supply and fruitful cooperation. Special thanks are also addressed to Anne-Luise Tscheliessnig and Wolfgang Buchinger for constructive input and discussion. Petra Knerr and Frank Harms from Martin Christ, Osterode a.H./Germany is thanked for the extraordinary cooperation on lyophilization. The authors would like to acknowledge their institute’s laboratory and mechanical, electrical workshop colleagues, especially Reinhard Ditz for conceptional discussions, paper review and English editing, Frank Steinhäuser and Volker Strohmeyer as well as Thomas Knebel and Annika Leibold for excellent laboratory work. The authors acknowledge financial support by Open Access Publishing Fund of Clausthal University of Technology.

Conflicts of Interest

The authors declare no conflict of interest.

References

  1. Sheila Rocchio. COVID-19 Vacine Development at Full Tilt: Will the Rapod Development of COVID-19 Vaccines Lead to Unsafe Therapies?; The Medicine Make. 2020. Available online: https://themedicinemaker.com/manufacture/covid-19-vaccine-development-at-full-tilt (accessed on 2 March 2021).
  2. Hu, Y. Graphics: How Soon Can We Get a COVID-19 Vaccine? 2020. Available online: https://news.cgtn.com/news/2020-04-07/Graphics-How-soon-can-we-get-a-COVID-19-vaccine--PuPkfQbGxi/index.html (accessed on 2 March 2021).
  3. GSK. How We Develop New Vaccines. 2021. Available online: https://www.gsk.com/en-gb/research-and-development/development/how-we-develop-new-vaccines/ (accessed on 2 March 2021).
  4. Krammer, F. SARS-CoV-2 vaccines in development. Nature 2020, 586, 516–527. [Google Scholar] [CrossRef]
  5. Alia, C. COVID-19 Vaccines Explained in Maps and Charts. Available online: https://www.aljazeera.com/features/2020/11/24/covid-19-vaccines-explained-in-maps-and-charts (accessed on 2 March 2021).
  6. McCarthy, N. The Cost Per Jab Of Covid-19 Vaccine Candidates. 2020. Available online: https://0-www-statista-com.brum.beds.ac.uk/chart/23658/reported-cost-per-dose-of-covid-19-vaccines/ (accessed on 2 March 2021).
  7. McCarthy, N. How Effective Are The Covid-19 Vaccines? 2021. Available online: https://0-www-statista-com.brum.beds.ac.uk/chart/23510/estimated-effectiveness-of-covid-19-vaccine-candidates/ (accessed on 2 March 2021).
  8. Pietromarchi, V. WHO Against Mandatory Coronavirus Vaccines: Latest Updates. 2020. Available online: https://www.aljazeera.com/news/2020/12/7/millions-in-california-face-stay-at-home-order-live-news (accessed on 2 March 2021).
  9. Sloan, C.; Cappio, K.; Vidulich, A.; George, K.L.; Shaw, M.; Chepigin, C. Recent History Shows Variability in Vaccine Development Timeline. 2020. Available online: https://avalere.com/press-releases/recent-history-shows-variability-in-vaccine-development-timeline (accessed on 2 March 2021).
  10. Thompson, S.A. How Long Will a Vaccine Really Take? 2020. Available online: https://www.nytimes.com/interactive/2020/04/30/opinion/coronavirus-covid-vaccine.html (accessed on 2 March 2021).
  11. Plotkin, S.A.; Plotkin, S.L. The development of vaccines: How the past led to the future. Nat. Rev. Microbiol. 2011, 9, 889–893. [Google Scholar] [CrossRef]
  12. Sprenger, R.K. Magie des Konflikts: Warum ihn jeder braucht und wie er uns weiterbringt, 1. Auflage; Deutsche Verlags-Anstalt: München, Germany, 2020; ISBN 3421048541. [Google Scholar]
  13. Brors, P.; Hofmann, S. Dietmar Hopp will Mit Curevac “Rennen um Besten Impfstoff Gewinnen”. Available online: https://www.handelsblatt.com/unternehmen/management/der-risikoinvestor-dietmar-hopp-will-mit-curevac-rennen-um-besten-impfstoff-gewinnen/26154156.html?ticket=ST-13985126-bIPozoMDRzkCluynaUe7-ap3 (accessed on 11 March 2021).
  14. Bill & Melinda Gates Foundation. Bill & Melinda Gates Foundation, Wellcome, and Mastercard Launch Initiative to Speed Development and Access to Therapies for COVID-19: Press Release. Available online: https://www.gatesfoundation.org/Media-Center/Press-Releases/2020/03/COVID-19-Therapeutics-Accelerator (accessed on 11 March 2021).
  15. Müller, E.; Noe, M. Die Pläne der Biontech-Geldgeber. 2021. Available online: https://www.manager-magazin.de/unternehmen/pharma/biontech-thomas-struengmann-helmut-jeggle-und-michael-motschmann-ueber-ihre-plaene-a-00000000-0002-0001-0000-000174925829 (accessed on 11 March 2021).
  16. Pfizer Inc. Pfizer and BioNTech Announce Further Details on Collaboration to Accelerate Global COVID-19 Vaccine Development. 2020. Available online: https://www.pfizer.com/news/press-release/press-release-detail/pfizer-and-biontech-announce-further-details-collaboration (accessed on 6 March 2021).
  17. GlaxoSmithKline plc. Sanofi and GSK to Join Forces in Unprecedented Vaccine Collaboration to Fight COVID-19. 2020. Available online: https://www.gsk.com/en-gb/media/press-releases/sanofi-and-gsk-to-join-forces-in-unprecedented-vaccine-collaboration-to-fight-covid-19/ (accessed on 6 March 2021).
  18. CureVac AG. CureVac and Bayer join forces on COVID-19 vaccine candidate CVnCoV: Joint Press Release. 2021. Available online: https://www.curevac.com/en/2021/01/07/curevac-and-bayer-join-forces-on-covid-19-vaccine-candidate-cvncov/ (accessed on 6 March 2021).
  19. Lonza Group Ltd. Moderna and Lonza Announce Worldwide Strategic Collaboration to Manufacture Moderna’s Vaccine (mRNA-1273) Against Novel Coronavirus. Available online: http://e3.marco.ch/publish/lonza/551_1203/200501_Press_Release__Moderna_Lonza_COVID_FINAL.pdf (accessed on 6 March 2021).
  20. Thermo Fisher Scientific. Challenges, Risks and Strategies for Biologic Substance Manufacturing. 2018. Available online: https://patheon.com/resource-library/whitepapers/challenges-risks-and-strategies-for-biologic-substance-manufacturing/ (accessed on 6 March 2021).
  21. Ward, J. Solutions to Today’s Biomanufacturing Challenges. 2018. Available online: https://patheon.com/resource-library/whitepapers/solutions-to-todays-biomanufacturing-challenges/ (accessed on 6 March 2021).
  22. ISR Reports. Changes in Manufacturing Pipeline Focus. 2020. Available online: https://www.bioprocessonline.com/doc/changes-in-manufacturing-pipeline-focus-0002 (accessed on 6 March 2021).
  23. Unger, B. Top 10 Most-Cited MHRA GMP Inspection Deficiencies by Annex/Chapter in 2019. 2021. Available online: https://www.pharmaceuticalonline.com/doc/top-most-cited-mhra-gmp-inspection-deficiencies-by-annex-chapter-in-0001 (accessed on 6 March 2021).
  24. Unger, B. An Analysis of MHRA’s Annual GMP Inspection Deficiencies Report. 2020. Available online: https://www.pharmaceuticalonline.com/doc/an-analysis-of-mhra-s-annual-gmp-inspection-deficiencies-report-0001 (accessed on 6 March 2021).
  25. Unger, B. An Analysis of 2018 FDA Warning Letters Citing Data Integrity Failures. 2019. Available online: https://www.pharmaceuticalonline.com/doc/an-analysis-of-fda-warning-letters-citing-data-integrity-failures-0001 (accessed on 6 March 2021).
  26. Wouters, O.J.; Shadlen, K.C.; Salcher-Konrad, M.; Pollard, A.J.; Larson, H.J.; Teerawattananon, Y.; Jit, M. Challenges in ensuring global access to COVID-19 vaccines: Production, affordability, allocation, and deployment. Lancet 2021, 397, 1023–1034. [Google Scholar] [CrossRef]
  27. Sommerfeld, S.; Strube, J. Challenges in biotechnology production—generic processes and process optimization for monoclonal antibodies. Chem. Eng. Process. Process Intensif. 2005, 44, 1123–1137. [Google Scholar] [CrossRef]
  28. Strube, J.; Sommerfeld, S.; Lohrmann, M. Process Development and Optimization for Biotechnology Production—Monoclonal Antibodies. In Bioseparation and Bioprocessing, 2nd ed.; Subramanian, G., Ed.; Wiley-VCH: Weinheim, Germany; New York, NY, USA, 2007. [Google Scholar]
  29. Verband Forschender Arzneimittelhersteller e.V. Impfstoffe zum Schutz vor der Coronavirus-Infektion Covid-19. 2021. Available online: https://www.vfa.de/de/arzneimittel-forschung/woran-wir-forschen/impfstoffe-zum-schutz-vor-coronavirus-2019-ncov (accessed on 2 March 2021).
  30. Melinek, B.; Colant, N.; Stamatis, C.; Lennon, C.; Farid, S.S.; Polizzi, K.; Carver, M.; Bracewell, D.G. Toward a Roadmap for Cell-Free Synthesis in Bioprocessing. Available online: https://bioprocessintl.com/upstream-processing/expression-platforms/toward-a-roadmap-for-cell-free-synthesis-in-bioprocessing/ (accessed on 2 March 2021).
  31. Ipsen Biopharm Ltd. Novel Production Process for a Highly Potent Recombinant Protein Using Doggybone DNA (dbDNA) Vector and Cell Free Expression Technology. 2020. Available online: https://gtr.ukri.org/projects?ref=104201 (accessed on 3 June 2020).
  32. GenScript ProBio. Accelerating Vaccine development against COVID-19. 2020. Available online: https://www.genscriptprobio.com/gsfiles/techfiles/GPB-COVID19-GMP%20plasmid-GPB_052020.pdf (accessed on 6 March 2021).
  33. Shin, D.; Azizian, K.T.; Henderson, J.M.; Hogrefe, R.I.; Lebedev, A.; Houston, M.; McCaffrey, A.P. CleanCap® Co-transcriptional Capping Streamlines mRNA Manufacturing. Available online: https://www.trilinkbiotech.com/media/contentmanager/content/mRNA_WVC2_1.pdf (accessed on 6 March 2021).
  34. Geipel-Kern, A. Covid-19-Impfstoff—warum bei den Rohstoff-Herstellern die Kasse klingelt. 2021. Available online: https://www.process.vogel.de/covid-19-impfstoff-warum-bei-den-rohstoff-herstellern-die-kasse-klingelt-a-1004361/ (accessed on 6 March 2021).
  35. Kis, Z.; Kontoravdi, C.; Shattock, R.; Shah, N. Resources, Production Scales and Time Required for Producing RNA Vaccines for the Global Pandemic Demand. Vaccines 2020, 9, 3. [Google Scholar] [CrossRef] [PubMed]
  36. Von der Mülbe, F.; Reidel, L.; Ketterer, T.; Gontcharova, L.; Bauer, S.; Pascolo, S.; Probst, J.; Schmid, A. Method for Producing RNA. U.S. Patent No. 10,017,826, 10 July 2018. [Google Scholar]
  37. Stark, A. Novartis startet Produktion von Curevac-Impfstoff im zweiten Quartal. 2021. Available online: https://www.process.vogel.de/novartis-startet-produktion-von-curevac-impfstoff-im-zweiten-quartal-a-1005737/?cmp=nl-98&uuid=B2EB5C9F-EC8E-64F3-11C6F1C278C9BE12 (accessed on 11 March 2021).
  38. Nemec, K.S.; Cernigoj, U.; Vidic, J.; Livk, A.G.; Goricar, B.; Bozic, K.; Celjar, A.M.; Skok, J.; Mencin, N.; Kralj, S.; et al. High yield mRNA production process from E. coli to highly pure mRNA. 2020. Available online: https://www.biaseparations.com/en/library/seminars-webinars/1098/high-yield-mrna-production-process-from-ecoli-to-highly-pure-mrna (accessed on 2 March 2021).
  39. Weise, E.; Weintraub, K. A COVID-19 Vaccine Life Cycle: From DNA to Doses. 2021. Available online: https://eu.usatoday.com/in-depth/news/health/2021/02/07/how-covid-vaccine-made-step-step-journey-pfizer-dose/4371693001/ (accessed on 6 March 2021).
  40. BioNTech SE. BioNTech to Acquire GMP Manufacturing Site to Expand COVID-19 Vaccine Production Capacity in First Half 2021. 2020. Available online: https://investors.biontech.de/news-releases/news-release-details/biontech-acquire-gmp-manufacturing-site-expand-covid-19-vaccine (accessed on 6 March 2021).
  41. Zobel-Roos, S.; Schmidt, A.; Mestmäcker, F.; Mouellef, M.; Huter, M.; Uhlenbrock, L.; Kornecki, M.; Lohmann, L.; Ditz, R.; Strube, J. Accelerating Biologics Manufacturing by Modeling or: Is Approval under the QbD and PAT Approaches Demanded by Authorities Acceptable Without a Digital-Twin? Processes 2019, 7, 94. [Google Scholar] [CrossRef] [Green Version]
  42. Kornecki, M.; Strube, J. Accelerating Biologics Manufacturing by Upstream Process Modelling. Processes 2019, 7, 166. [Google Scholar] [CrossRef] [Green Version]
  43. Schmidt, A.; Strube, J. Distinct and Quantitative Validation Method for Predictive Process Modeling with Examples of Liquid-Liquid Extraction Processes of Complex Feed Mixtures. Processes 2019, 7, 298. [Google Scholar] [CrossRef] [Green Version]
  44. Zobel-Roos, S.; Mouellef, M.; Ditz, R.; Strube, J. Distinct and Quantitative Validation Method for Predictive Process Modelling in Preparative Chromatography of Synthetic and Bio-Based Feed Mixtures Following a Quality-by-Design (QbD) Approach. Processes 2019, 7, 580. [Google Scholar] [CrossRef] [Green Version]
  45. Huter, M.J.; Strube, J. Model-Based Design and Process Optimization of Continuous Single Pass Tangential Flow Filtration Focusing on Continuous Bioprocessing. Processes 2019, 7, 317. [Google Scholar] [CrossRef] [Green Version]
  46. Lohmann, L.J.; Strube, J. Accelerating Biologics Manufacturing by Modeling: Process Integration of Precipitation in mAb Downstream Processing. Processes 2020, 8, 58. [Google Scholar] [CrossRef] [Green Version]
  47. Klepzig, L.S.; Juckers, A.; Knerr, P.; Harms, F.; Strube, J. Digital Twin for Lyophilization by Process Modeling in Manufacturing of Biologics. Processes 2020, 8, 1325. [Google Scholar] [CrossRef]
  48. Korz, D.J.; Rinas, U.; Hellmuth, K.; Sanders, E.A.; Deckwer, W.-D. Simple fed-batch technique for high cell density cultivation of Escherichia coli. J. Biotechnol. 1995, 39, 59–65. [Google Scholar] [CrossRef]
  49. Urthaler, J.; Buchinger, W.; Necina, R. Improved downstream process for the production of plasmid DNA for gene therapy. Acta Biochim. Pol. 2005, 52, 703–711. [Google Scholar] [CrossRef]
  50. Urthaler, J.; Ascher, C.; Wöhrer, H.; Necina, R. Automated alkaline lysis for industrial scale cGMP production of pharmaceutical grade plasmid-DNA. J. Biotechnol. 2007, 128, 132–149. [Google Scholar] [CrossRef]
  51. Urthaler, J.; Buchinger, W.; Necina, R. Industrial Scale cGMP Purification of Pharmaceutical Grade Plasmid-DNA. Chem. Eng. Technol. 2005, 28, 1408–1420. [Google Scholar] [CrossRef]
  52. Grote, F.; Fröhlich, H.; Strube, J. Integration of Ultrafiltration Unit Operations in Biotechnology Process Design. Chem. Eng. Technol. 2011, 34, 673–687. [Google Scholar] [CrossRef]
  53. Gritti, F.; Piatkowski, W.; Guiochon, G. Study of the mass transfer kinetics in a monolithic column. J. Chromatogr. A 2003, 983, 51–71. [Google Scholar] [CrossRef]
  54. Hahn, R.; Panzer, M.; Hansen, E.; Mollerup, J.; Jungbauer, A. Mass transfer properties of monoliths. Sep. Sci. Technol. 2007, 37, 1545–1565. [Google Scholar] [CrossRef]
  55. Boi, C.; Dimartino, S.; Sarti, G.C. Modelling and simulation of affinity membrane adsorption. J. Chromatogr. A 2007, 1162, 24–33. [Google Scholar] [CrossRef] [PubMed]
  56. Fröhlich, H.; Villian, L.; Melzner, D.; Strube, J. Membrane Technology in Bioprocess Science. Chem. Ing. Tech. 2012. [Google Scholar] [CrossRef]
  57. Schwellenbach, J.; Kosiol, P.; Sölter, B.; Taft, F.; Villain, L.; Strube, J. Controlling the polymer-nanolayer architecture on anion-exchange membrane adsorbers via surface-initiated atom transfer radical polymerization. React. Funct. Polym. 2016, 106, 32–42. [Google Scholar] [CrossRef]
  58. Zobel-Roos, S.; Stein, D.; Strube, J. Evaluation of Continuous Membrane Chromatography Concepts with an Enhanced Process Simulation Approach. Antibodies 2018, 7, 13. [Google Scholar] [CrossRef] [Green Version]
  59. Guiochon, G. Fundamentals of Preparative and Nonlinear Chromatography, 2nd ed.; Elsevier Acad. Press: Amsterdam, The Netherlands, 2006; ISBN 9780123705372. [Google Scholar]
  60. Zobel-Roos, S. Entwicklung, Modellierung und Validierung von integrierten kontinuierlichen Gegenstrom-Chromatographie-Prozessen. Ph. D. Thesis, Shaker Verlag GmbH, Technische Universität, Clausthal-Zellerfeld, Germany, 2018. [Google Scholar]
  61. Brooks, C.A.; Cramer, S.M. Steric mass-action ion exchange: Displacement profiles and induced salt gradients. AIChE J. 1992, 38, 1969–1978. [Google Scholar] [CrossRef]
  62. Carta, G.; Jungbauer, A. Protein Chromatography: Process Development and Scale-Up; Wiley-VCH: Weinheim, Germany, 2010; ISBN 978-3-527-31819-3. [Google Scholar]
  63. Seidel-Morgenstern, A.; Guiochon, G. Modelling of the competitive isotherms and the chromatographic separation of two enantiomers. Chem. Eng. Sci. 1993, 48, 2787–2797. [Google Scholar] [CrossRef]
  64. Langmuir, I. The adsorption of gases on plane surfaces of glass, mica and platinum. J. Am. Chem. Soc. 1918, 40, 1361–1403. [Google Scholar] [CrossRef] [Green Version]
  65. Ullmann’s Encyclopedia of Industrial Chemistry; Wiley-VCH Verlag GmbH & Co. KGaA: Weinheim, Germany, 2000; ISBN 3527306730.
  66. Wiesel, A.; Schmidt-Traub, H.; Lenz, J.; Strube, J. Modelling gradient elution of bioactive multicomponent systems in non-linear ion-exchange chromatography. J. Chromatogr. A 2003, 1006, 101–120. [Google Scholar] [CrossRef]
  67. Leśko, M.; Åsberg, D.; Enmark, M.; Samuelsson, J.; Fornstedt, T.; Kaczmarski, K. Choice of Model for Estimation of Adsorption Isotherm Parameters in Gradient Elution Preparative Liquid Chromatography. Chromatographia 2015, 78, 1293–1297. [Google Scholar] [CrossRef] [Green Version]
  68. Zobel, S.; Helling, C.; Ditz, R.; Strube, J. Design and operation of continuous countercurrent chromatography in biotechnological production. Ind. Eng. Chem. Res. 2014, 53, 9169–9185. [Google Scholar] [CrossRef]
  69. Seidel-Morgenstern, A. Experimental determination of single solute and competitive adsorption isotherms. J. Chromatogr. A 2004, 1037, 255–272. [Google Scholar] [CrossRef] [PubMed]
  70. BIA Separations. Purification of mRNA with CIMmultus PrimaS™: Technical Note. 2020. Available online: https://www.biaseparations.com/en/library/technical-notes/1088/purification-of-mrna-with-cimmultus-primastm (accessed on 2 March 2021).
  71. Tarmann, C.; Jungbauer, A. Adsorption of plasmid DNA on anion exchange chromatography media. J. Sep. Sci. 2008, 31, 2605–2618. [Google Scholar] [CrossRef]
  72. Wright, D.J.; Jack, W.E.; Modrich, P. The kinetic mechanism of EcoRI endonuclease. J. Biol. Chem. 1999, 274, 31896–31902. [Google Scholar] [CrossRef] [PubMed] [Green Version]
  73. Urthaler, J.; Schuchnigg, H.; Garidel, P.; Huber, H. Industrial Manufacturing of Plasmid-DNA Products for Gene Vaccination and Therapy. In Gene Vaccines; Thalhamer, J., Weiss, R., Scheiblhofer, S., Eds.; Springer Vienna: Vienna, Austria, 2012; pp. 311–330. ISBN 978-3-7091-0438-5. [Google Scholar]
  74. Latulippe, D.R.; Ager, K.; Zydney, A.L. Flux-dependent transmission of supercoiled plasmid DNA through ultrafiltration membranes. J. Membr. Sci. 2007, 294, 169–177. [Google Scholar] [CrossRef]
  75. Latulippe, D.R.; Zydney, A.L. Salt-induced changes in plasmid DNA transmission through ultrafiltration membranes. Biotechnol. Bioeng. 2008, 99, 390–398. [Google Scholar] [CrossRef]
  76. Latulippe, D.R.; Zydney, A.L. Separation of plasmid DNA isoforms by highly converging flow through small membrane pores. J. Colloid Interface Sci. 2011, 357, 548–553. [Google Scholar] [CrossRef] [PubMed]
  77. Rodriguez, J. Allowing the Process to Determine Filtration Technology: Hollow Fiber vs. Flat Sheet. 2020. Available online: https://vimeo.com/478502171 (accessed on 12 March 2021).
  78. Madigan, J.; Dobbs, C.; Henderson, J.; Lebedev, A.; McCaffrey, A.P.; Powers, J. Considerations for the Development, Scale-up and Manufacturing of mRNA Therapeutics. 2021. Available online: https://www.trilinkbiotech.com/media/contentmanager/content/mRNA_OTS1.pdf (accessed on 2 March 2021).
  79. Zhu, T.; Moussa, E.M.; Witting, M.; Zhou, D.; Sinha, K.; Hirth, M.; Gastens, M.; Shang, S.; Nere, N.; Somashekar, S.C.; et al. Predictive models of lyophilization process for development, scale-up/tech transfer and manufacturing. Eur. J. Pharm. Biopharm. 2018, 128, 363–378. [Google Scholar] [CrossRef] [PubMed]
  80. Rambhatla, S.; Pikal, M.J. Heat and mass transfer scale-up issues during freeze-drying, I: Atypical radiation and the edge vial effect. AAPS PharmSciTech 2003, 4, E14. [Google Scholar] [CrossRef] [Green Version]
  81. Zobel-Roos, S.; Mouellef, M.; Siemers, C.; Strube, J. Process Analytical Approach towards Quality Controlled Process Automation for the Downstream of Protein Mixtures by Inline Concentration Measurements Based on Ultraviolet/Visible Light (UV/VIS) Spectral Analysis. Antibodies 2017, 6, 24. [Google Scholar] [CrossRef] [Green Version]
  82. Kornecki, M.; Schmidt, A.; Strube, J. PAT as key-enabling technology for QbD in pharmaceutical manufacturing A conceptual review on upstream and downstream processing. Chim. Oggi Chem. Today 2018, 36, 44–48. [Google Scholar]
  83. Helgers, H.; Schmidt, A.; Lohmann, L.J.; Vetter, F.L.; Juckers, A.; Jensch, C.; Mouellef, M.; Zobel-Roos, S.; Strube, J. Towards Autonomous Operation by Advanced Process Control—Process Analytical Technology for Continuous Biologics Antibody Manufacturing. Processes 2021, 9, 172. [Google Scholar] [CrossRef]
  84. Vetter, F.L.; Zobel-Roos, S.; Strube, J. PAT for Continuous Chromatography Integrated into Continuous Manufacturing of Biologics towards Autonomous Operation. Processes 2021, 9, 472. [Google Scholar] [CrossRef]
  85. Lohmann, L.J.; Strube, J. Process Analytical Technology for Precipitation Process Integration into Biologics Manufacturing towards Autonomous Operation—mAb Case Study. Processes 2021, 9, 488. [Google Scholar] [CrossRef]
  86. C Technologies, Inc. SoloVPE. 2021. Available online: https://www.ctechnologiesinc.com/products/solovpe (accessed on 11 March 2021).
  87. Wikimedia Foundation, I. QS-21. 2021. Available online: https://en.wikipedia.org/wiki/QS-21 (accessed on 18 March 2021).
  88. Wikimedia Foundation, I. Quillaia. 2021. Available online: https://en.wikipedia.org/wiki/Quillaia (accessed on 18 March 2021).
  89. Fleck, J.D.; Betti, A.H.; Da Silva, F.P.; Troian, E.A.; Olivaro, C.; Ferreira, F.; Verza, S.G. Saponins from Quillaja saponaria and Quillaja brasiliensis: Particular Chemical Characteristics and Biological Activities. Molecules 2019, 24, 171. [Google Scholar] [CrossRef] [Green Version]
  90. Sharma, R.; Palanisamy, A.; Dhama, K.; Mal, G.; Singh, B.; Singh, K.P. Exploring the possible use of saponin adjuvants in COVID-19 vaccine. Hum. Vaccin. Immunother. 2020, 16, 2944–2953. [Google Scholar] [CrossRef] [PubMed]
  91. Schmidt, A.; Uhlenbrock, L.; Strube, J. Technical Potential for Energy and GWP Reduction in Chemical–Pharmaceutical Industry in Germany and EU—Focused on Biologics and Botanicals Manufacturing. Processes 2020, 8, 818. [Google Scholar] [CrossRef]
  92. Uhlenbrock, L.; Sixt, M.; Tegtmeier, M.; Schulz, H.; Hagels, H.; Ditz, R.; Strube, J. Natural Products Extraction of the Future—Sustainable Manufacturing Solutions for Societal Needs. Processes 2018, 6, 177. [Google Scholar] [CrossRef] [Green Version]
  93. Lenz, C.; Reichen, P. Ganz Europa Schaut Nach Visp—und Jetzt Ruckelts bei Lonza. Available online: https://www.bazonline.ch/im-schweizer-impf-eldorado-knirscht-es-im-system-772070807325 (accessed on 18 March 2021).
  94. Jiang, M.; Severson, K.A.; Love, J.C.; Madden, H.; Swann, P.; Zang, L.; Braatz, R.D. Opportunities and challenges of real-time release testing in biopharmaceutical manufacturing. Biotechnol. Bioeng. 2017, 114, 2445–2456. [Google Scholar] [CrossRef] [PubMed]
Figure 1. Typical SWOT analysis of bottlenecks, challenges & threats.
Processes 09 00748 g001
Figure 2. Examples of vaccine candidates, manufacturers, technologies and trial phases. Three major subtypes can be distinguished: drugs that already contain the immune response-inducing spike protein; viral vectors, mostly AAV, that deliver the spike protein-encoding DNA sequence into the cells; and the mRNA drugs discussed in this paper, which carry the gene information of the spike protein in the form of the mRNA for direct spike-protein formation in the patient’s cells and are delivered in LNP [29].
Processes 09 00748 g002
Figure 3. Main process phases and intermediates in mRNA vaccine manufacturing. Synthesis of mRNA needs, as a starting, point template DNA that contains the genetic code for the respective spike protein. State-of-the art is still plasmid manufacturing by E. coli fermentation followed up by purification and linearization. In the next phase the linearized DNA serves as template during in-vitro transcription, capping and formulation including encapsulation of mRNA in LNP.
Processes 09 00748 g003
Figure 4. Overview of published and new mRNA manufacturing processes. (RP: Reversed-Phase, MM: Mixed-Mode, IEX: Ion-Exchange). Numbers indicate the order of flow. Three processes are summarized (grey arrow) that represent published process frameworks for the manufacturing of mRNA. The green arrow marks the process sequence as discussed in this work.
Processes 09 00748 g004
Figure 5. Schematic representation of the chromatographic monolith with diameter (d), height (h) and flow direction (z) of the sample.
Processes 09 00748 g005
Figure 6. Overview of the plasmid production, quality testing and mRNA manufacturing process. The process consists of three main steps, which are plasmid production, linearization, and in-vitro transcription. After linearization and mRNA purification extensive quality testing is required.
Processes 09 00748 g006
Figure 7. Comparison of literature and simulation data for (a) biomass and (b) pDNA concentration during fermentation. Multiple simulation runs with varying kLa-values where performed. Dotted lines indicate maximal and minimal biomass and plasmid concentrations.
Processes 09 00748 g007
Figure 8. Concentration profile of sc-pDNA and protein impurities during alkaline lysis. Lysis of E. coli cells is completed shortly after the lysis pathway is entered. A too-long residence time leads to the degradation of the desired isoform to undesired ones.
Processes 09 00748 g008
Figure 9. Overview of concentration profile, process volume and flux during the concentration step. Filtration is performed at a constant flux. This results in an exponential increase of the concentration. A 5-fold increase in concentration is achieved after 90 min.
Processes 09 00748 g009
Figure 10. Comparison of literature data (symbols) and simulation results (lines).
Processes 09 00748 g010
Figure 11. Comparison of the scaled-up process (a) and the optimized process (b).
Processes 09 00748 g011
Figure 12. Initial 9× concentration prior to addition of diafiltration buffer and final concentration. Filtration is performed at a constant flux. This results in an exponential increase of the concentration. A 9-fold increase in concentration is achieved after 60 min.
Processes 09 00748 g012
Figure 13. Concentration to final volume of 100 L and 3.1 g/L titer after addition of 9 DV. Filtration is performed at a constant flux. This results in an exponential increase of the concentration. A 5-fold increase in concentration is achieved after 90 min.
Processes 09 00748 g013
Figure 14. Progression of the linearization reaction over time. The linearization of plasmid DNA is completed after approximately 2.6 h. Reaction time depends on the enzyme used and concentration, as well as desired product concentration and substrate turnover.
Processes 09 00748 g014
Figure 15. Comparison of the laboratory process (a) and the scaled-up process (b). In the laboratory process, the literature data is depicted with symbols, the simulated data with lines.
Processes 09 00748 g015
Figure 16. mRNA concentration over process time. Transcription is completed after approx. 5 h. Similar to linearization depends on the enzyme used and concentration, as well as desired product concentration and substrate turnover.
Processes 09 00748 g016
Figure 17. Comparison of the laboratory process (a) and the scaled-up process (b). The literature data is given as symbols, the simulated data is depicted as lines.
Processes 09 00748 g017
Figure 18. Laboratory data of the RP monolith is given as symbols; simulated data is given as lines.
Processes 09 00748 g018
Figure 19. Comparison between the scale-up of the laboratory process (a) and the optimized laboratory process (b).
Processes 09 00748 g019
Figure 20. Shelf and product temperature profiles.
Processes 09 00748 g020
Figure 21. Raman raw (a) and processed spectra (b) as well as titer prediction vs. reference (c) after alkaline lysis and clarification.
Processes 09 00748 g021
Figure 22. FTIR raw (a) and processed spectra (b) as well as titer prediction vs. reference (c) after alkaline lysis and clarification.
Processes 09 00748 g022
Figure 23. DAD raw (a) and processed spectra (b) as well as titer prediction vs. reference (c) after alkaline lysis and clarification.
Processes 09 00748 g023
Figure 24. Overview of titer, volume (a) as well as purity and yield (b) during plasmid manufacturing and linearization.
Processes 09 00748 g024
Figure 25. Overview of titer, volume (a) as well as purity and yield (b) during mRNA manufacturing.
Processes 09 00748 g025
Publisher’s Note: MDPI stays neutral with regard to jurisdictional claims in published maps and institutional affiliations.

