Article

An Experimental Investigation of Water Vapor Condensation from Biofuel Flue Gas in a Model of Condenser, (1) Base Case: Local Heat Transfer without Water Injection

Nuclear Engineering Laboratory, Lithuanian Energy Institute, Breslaujos 3, LT-44403 Kaunas, Lithuania
*
Author to whom correspondence should be addressed.
Submission received: 9 April 2021 / Revised: 4 May 2021 / Accepted: 10 May 2021 / Published: 12 May 2021
(This article belongs to the Special Issue Advances in Bioprocess Technology)

Abstract

:
Waste heat recovery from flue gas based on water vapor condensation is an important issue as the waste heat recovery significantly increases the efficiency of the thermal power units. General principles for designing of this type of heat exchangers are known rather well; however, investigations of the local characteristics necessary for the optimization of those heat exchangers are very limited. Investigations of water vapor condensation from biofuel flue gas in the model of a vertical condensing heat exchanger were performed without and with water injection into a calorimetric tube. During the base-case investigations, no water was injected into the calorimetric tube. The results showed that the humidity and the temperature of inlet flue gas have a significant effect on the local and average heat transfer. For some regimes, the initial part of the condensing heat exchanger was not effective in terms of heat transfer because there the flue gas was cooled by convection until its temperature reached the dew point temperature. The results also showed that, at higher Reynolds numbers, there was an increase in the length of the convection prevailing region. After that region, a sudden increase was observed in heat transfer due to water vapor condensation.

1. Introduction

The water vapor condensation process is important for many industrial applications, such as nuclear, chemical, and thermal. To increase the efficiency of thermal power and boiler stations, they are equipped with condensing heat exchangers (economizers). The design of condensing heat exchangers depends on the power required [1]. Despite of that, most condensing heat exchangers have housing where a few hundreds of small diameter tubes are installed and the relative length x/d of these tubes could be more than 150. The flue gas from the boiler is routed to these tubes, cooling water flows around them, and a counter-current flow arrangement is usually used.
As the flue gas leaving the boiler is still of high temperature and humidity, especially when incinerating biofuel, there is a possibility to gain additional heat and increase the efficiency of boiler stations by condensing water vapor from flue gas in condensing heat exchangers. When the dew point is reached, water vapor from flue gas starts to condensate. The condensation process generates an additional amount of heat, which is usually used to heat the return water from consumers. Besides, when the condensate film flows down the condenser tubes, it precipitates various solid particles from the flue gas that are the most significant source of environmental pollution, especially when incinerating biofuels [2,3]. Although the efficiency of boilers is usually less than 100%, it can be increased by installing condensing heat exchangers in boilers, as condensing heat exchangers can get additional amount of heat from the same amount of burned fuel [4,5].
Despite the fact that the general principles for the designing of this type of heat exchangers are known, not much knowledge is acquired of processes taking place in condensing heat exchangers and peculiarities of these processes in the case of flue gas. The review of publications showed that there are many experimental and theoretical studies related to pure water vapor condensation in tubes at a high condensable gas-water vapor content (90–100%, by volume) and small amount of non-condensable gas [6,7,8,9,10], etc. The investigations in Reference [11] of average condensation heat transfer with the steam flow rate of 2.5–5.5 g/s and non-condensable gas mass fraction from 0% to 10% in a vertical tube, whose active length of condensation was x/d ≈ 38, demonstrated that condensation heat transfer decreases with the increase of the non-condensable gas fraction. The analysis of pressure influence also showed that, in the case of pressure decrease in the system, the obtained heat due to the condensation process also decreased. The calculated average condensation heat transfer coefficient at various experimental conditions (system pressure and inlet non-condensable gas mass fraction at inlet) varied from 3 to 10 kW/m2·K.
The local condensation heat transfer of pure steam and a steam–nitrogen mixture in a vertical tube was investigated in Reference [12]. The investigations were performed in a relatively long vertical test section (x/d ≈ 230) with the measurements of the cooling water temperature, bulk steam temperature and tube wall temperature along the test section. The steam and the cooling water supply was performed in a counter-current configuration. The steam was supplied from the upper part of the test section. When the pure steam was supplied to the test section at a flow rate of about 11.2 kg/h, the bulk steam temperature was constant (about 100 °C) almost till the middle of the condenser tube, i.e., up to x/d ≈ 107, which indicated that condensation is taking place in that part of the test section. When x/d was in the range from 107 to 162, a sudden decrease in the bulk temperature to about 17 °C was observed. From x/d ≈ 162 until the end of the test section, the bulk temperature was almost constant. The bulk temperature breakdown at x/d ≈ 107 means that, after that point, all the vapor was condensed and there was a single phase only, i.e., condensed water flowing in the tube. The character of the cooling water temperature was not so evidently expressed as that of the bulk steam temperature. The cooling water (flow rate 290 kg/h) temperature (at the inlet of about 17 °C) was changing insignificantly from the end of the test section until about x/d ≈ 107. From x/d ≈ 107 until the beginning of the test section, the cooling water temperature was increasing and reached almost 40 °C. The obtained character of the water temperature clearly indicated when the water was gaining heat due to steam condensation. With the increase of non-condensable gas mass fraction up to 10.2%, the bulk steam temperature drop was not so evidently expressed as in the case with pure steam. In this case, also, the decrease from about 100 °C at x/d ≈ 107 was observed, and the temperature was continuously decreasing until the end of the test section, where it was about 60 °C. Along all the test section, two-phase flow was observed, as not all the steam was condensed, as in the case before. The cooling water temperature was negligibly increasing from ≈17 to ≈20 °C from the end of the test section until about x/d ≈ 107. From x/d ≈ 107 until the beginning of the test section, the increase was better expressed, meaning that the cooling water was heated from ≈20 to ≈40 °C. The analysis of the local condensation heat transfer showed that the increase of the non-condensable gas mass fraction significantly decreased the local condensation heat transfer. However, this was true until x/d ≈ 65, and further from that point, the change of non-condensable gas mass fraction at the inlet from 3% to 30% practically had no influence on heat transfer.
The results presented in papers [11,12] also generally reflect the main aspects occurring in vertical heat exchangers in the case of pure steam or steam condensation with small amount of non-condensable gas. The main conclusions determined in these works are that, in the case of pure steam, the condensation occurs almost in the initial part of the experimental section and it results in very high heat and mass transfer rates.
When incinerating biofuel or other fuels, the flue gas usually contains a relatively small amount (~5–25% vol.) of water vapor and the remaining portion consisting of non-condensable gas is high. Thus, in the case of flue gas, the situation is different in comparison to that presented in References [11,12].
The condensation of flue gas generated by incinerating natural gas was studied in Reference [13]. The experiments were performed in a rather short vertical tube x/d ≈ 80, with inlet water vapor volume fraction of 15–18%. The Reynolds number for flue gas during the experiments was varied from 2300 to 5000. The results indicated that the water vapor in the flue gas increased the average total heat transfer at least by about two times in comparison with dry air in the same range of Reynolds numbers. The ratio between sensible (by convection) and latent (by condensation) heat transfer increases with the cooling wall temperature decrease. The decrease of wall temperature of about 1.3 times, i.e., from about 49 to 38 °C, leads to the total heat transfer increase of almost up to 1.8 times. During the experiments, the average total Nusselt number for different cooling wall temperatures and Re numbers was in the range between 20 and 70. Wall temperature is also an important factor in terms of the condensing rate. It was determined that, in a certain wall temperature range (49–38 °C), the condensate mass flow rate increases by about three times, i.e., from ≈0.25 to ≈0.7 kg/(m2·s).
Most of researchers do not use real flue gas but usually simulate them as an air-vapor mixture. The air-vapor mixture was used for the analysis of heat and mass transfer in rather a short vertical tube of x/d ≈ 70 in Reference [14]. The cooling agent in this study was air with the inlet temperature of 20 °C. The volumetric water vapor fraction during the experiment with condensation was about 17% and without condensation—about 1% without condensation. The flue gas temperature measured in the center of the test section for the case without condensation showed a decrease of about 12 °C from the inlet temperature, while for the case with condensation, the decrease observed was about 5 °C along the test section. Although during the experiments only 30% of water vapor was condensed, the average total heat transfer was almost two times higher in comparison with the experiments without condensation.
Results related to condensation of simulated flue gases in a vertical annulus, whose test section was about x/d = 32, were presented in Reference [15]. At the inlet, the water-vapor mass fraction was in the range from 5% to 12%, and the Reynolds number was Re = 4600–14,000. When the vapor mass fraction was 5%, the condensation rate was between 0.2 and 0.6 kg/h. When the vapor mass fraction was increased to 12%, the condensation rate was from 1 to 2.8 kg/h for the mentioned Reynolds number range. The measured wall temperature for all the experiments was gradually and almost linearly decreasing along the test section. The average condensation heat transfer coefficient for Re = 4600 and for water vapor fraction of 5% was determined to be almost the same as the sensible heat transfer coefficient. When the water vapor fraction was 12%, the average condensation heat transfer coefficient for the same Re number was about five times higher in comparison with the sensible heat transfer coefficient. In general, the average condensation heat transfer was more effective when the inlet vapor mass fraction and the Re number were increased.
Other theoretical and experimental investigations also confirm that condensation of water vapor from flue gas has a noticeable impact on heat transfer [16,17], etc.
Therefore, the literature review shows that there is a very broad topic to study: local heat-transfer processes in flue gas condensers, using real flue gas from boilers in the real range of their operational parameters, with a relatively small amount of water vapor (~5–25% vol.).
The current investigations of water vapor condensation from biofuel flue gas in a model of the vertical condensing heat exchanger (a long tube with x/d ≈ 170) were performed with and without injection of water into the calorimetric tube. This paper presents the base case experimental results without injection of water at the inlet to the calorimetric tube, analyzing temperature and local total heat transfer variations along the mentioned model (vertical tube) of the condensing heat exchanger.

2. Experimental Setup

The experimental setup used for the investigations of water vapor condensation from flue gas is presented in Figure 1. Flue gas was generated by incinerating wood pellets in a class 3 (according to EN303-5:2012) automatic boiler Kostrzewa (Poland, Gizycko). The boiler’s power (maximum 50 kW) can be adjusted in the range from 50% to 100%. Generated flue gas with the temperature of about 180–190 °C (at the exit from the boiler) was directed to the experimental section. For flue gas temperature regulation, the boiler’s power and the economizer of the boiler were used.
The flue gas flow rate was adjusted by the valves. Then the flue gas flew inside the vertical calorimetric tube and was directed to the flue gas pipe (chimney) and discharged into the environment.
The test section was made of stainless steel. It was composed of an internal calorimetric tube (length x ≈ 5.8 m, inner diameter d = 0.034 m, wall thickness δ = 2 mm, x/d ≈ 170), where condensation on the internal surface takes place, and of an outer tube (length x ≈ 5.9 m, inner diameter D = 0.108 m) with cooling water. The experimental section as well as the flue gas pipe (chimney) was insulated by using 5 cm thickness Rockwool insulation.
For cooling of the calorimetric tube, distilled water was supplied to the space between the inner and the outer tubes from the storage tank, using a water pump. The weighting method was used to measure the water flow rate, which was then adjusted by regulating a corresponding valve. Before entering the experimental section, water was mixed in a water mixer to have a uniform temperature. When leaving the experimental section, the water was also mixed in the same type of a water mixer. After the mixer, the water passed the heat exchanger (air–water) to cool down and then was directed back to the water tank.
The water condensed on the calorimetric tube inner wall was drained into the condensate collection tank.

3. Methodology

The investigations were performed at different temperatures of flue gas and at two humidity levels of flue gas at the inlet to the calorimetric tube. The mass fraction of water vapor was about 7% in flue gas when biofuel pellets were incinerated in the boiler. When hot water was additionally sprayed into the furnace of the boiler with the purpose to simulate the incineration of more humid biofuel, the water-vapor mass fraction increased till about 17%.
Temperature measurements were carried out by using calibrated chromel–copel thermocouples (wire diameter 0.2 mm, accuracy ± 0.3%) directly connected to the data-acquisition system:
  • Twenty thermocouples were installed in the center of the calorimetric tube (tc) to measure the flue gas temperature along the tube. The distance between the thermocouples was approximately 0.28 m.
  • Twenty thermocouples were installed at the inner wall of the calorimetric tube (tw) along the length of the tube. The distance between the thermocouples was approximately 0.28 m.
  • Ten thermocouples were installed between the inner and the outer tubes to measure the cooling water temperature (tcw) along the space between the tubes. The distance between the thermocouples was approximately 0.56 m.
  • Three thermocouples were installed in each of the water mixers to measure cooling water temperatures at the inlet and the outlet of the test section.
More detailed information is provided in the Table 1.
During the experiments, all thermocouple readings were collected by using the Keithley automatic data acquisition system (accuracy ± 0.25%).
The parameters of the boiler (flue gas temperature, supply and return water temperature, chimney draft) were automatically registered every 5 min, using the KD7 data recording system. The flue gas temperature (tin, °C) and the relative humidity (RHin, %) at the inlet to the experimental section were measured with a KIMO C310 (Switzerland) temperature and humidity sensor. The accuracy for RHin measurement is ±0.88% and for temperature ± 0.3%. The sensor was installed about 25 cm above the calorimetric tube. The inlet flue gas velocity (for determination of the flow rate) was measured by using a bellmouth with installed Pitot–Prandtl tubes, which were connected to the micromanometer (accuracy ± 1.5%). The flow rate of cooling water during the experiments was approximately ≈ 33 kg/h.
Before the experiments, the humidity of the biofuel pellets was measured by using a biofuel moisture meter BIO-1 (Poland), which has the accuracy of ±1.5%. The measured humidity was low (when it is lower than 8%, the biofuel moisture meter indicates the humidity value as “low”).
In the formulas presented further, all the properties (cp, λ, etc.) of the gas, i.e., the mixture of flue gas and water vapor, were calculated by using formulas for mixture properties calculation [18]. The calculation of the properties is based on flow temperature measured in the center of the calorimetric tube.
The local (represented by index, i, in formulas further) total (convection and condensation) heat transfer coefficient and the Nusselt number were calculated in 20 positions along the tube where flow temperature in the center of the tube and inner wall temperatures were measured.
Total local heat flux was obtained as follows:
q t i = m H 2 O i · c p H 2 O i π · d · d t H 2 O i d x ,
where mH2O is inlet mass flow rate of the cooling water, kg/s; cpH2O is specific heat of the water, kJ/kg·°C; d is the inner diameter of the calorimetric tube, m; dtH2O/dx is the slope of the cooling water temperature gradient, which was determined as the least squares polynomial fit of the coolant temperature as a function of the length of the heat exchanger model.
The local total heat transfer coefficient was calculated as follows:
α t i = q t i / ( t c t w ) i ,
where tc is the temperature measured in the center of the calorimetric tube, °C; tw is the measured inner wall temperature of the calorimetric tube, °C.
The total Nusselt number:
N u t i = α t i · d / λ i
To evaluate the performance of the heat exchanger, the condensation efficiency (%) parameter was used [19]. This parameter was calculated as follows:
n c d = m c d m H 2 O i n · 100 ,
where mcd is the condensate mass flow rate, kg/s; mH2Oin is the water vapor (in flue gas) inlet flow rate, kg/s. The condensate flow rate was calculated based on the condensate level increase in the condensate collection tank and time during which the condensate was collected.
The accuracy of the data was evaluated by using the methodology presented in Reference [20]. The highest uncertainties are at the end of the tube, where the temperature difference between flue gas and tube wall is the smallest. For the Nusselt number, this uncertainty is 6–14%.

4. Results Analysis

As it has been indicated earlier, the experiments were carried out at different temperatures and for two humidity levels of flue gas at the inlet to the calorimetric tube. During the incineration of biofuel pallets in the boiler, the mass fraction of water vapor in flue gas was about 7%. When hot water (about 70 °C) was additionally sprayed into the furnace of the boiler, the water-vapor mass fraction increased until about 17%.

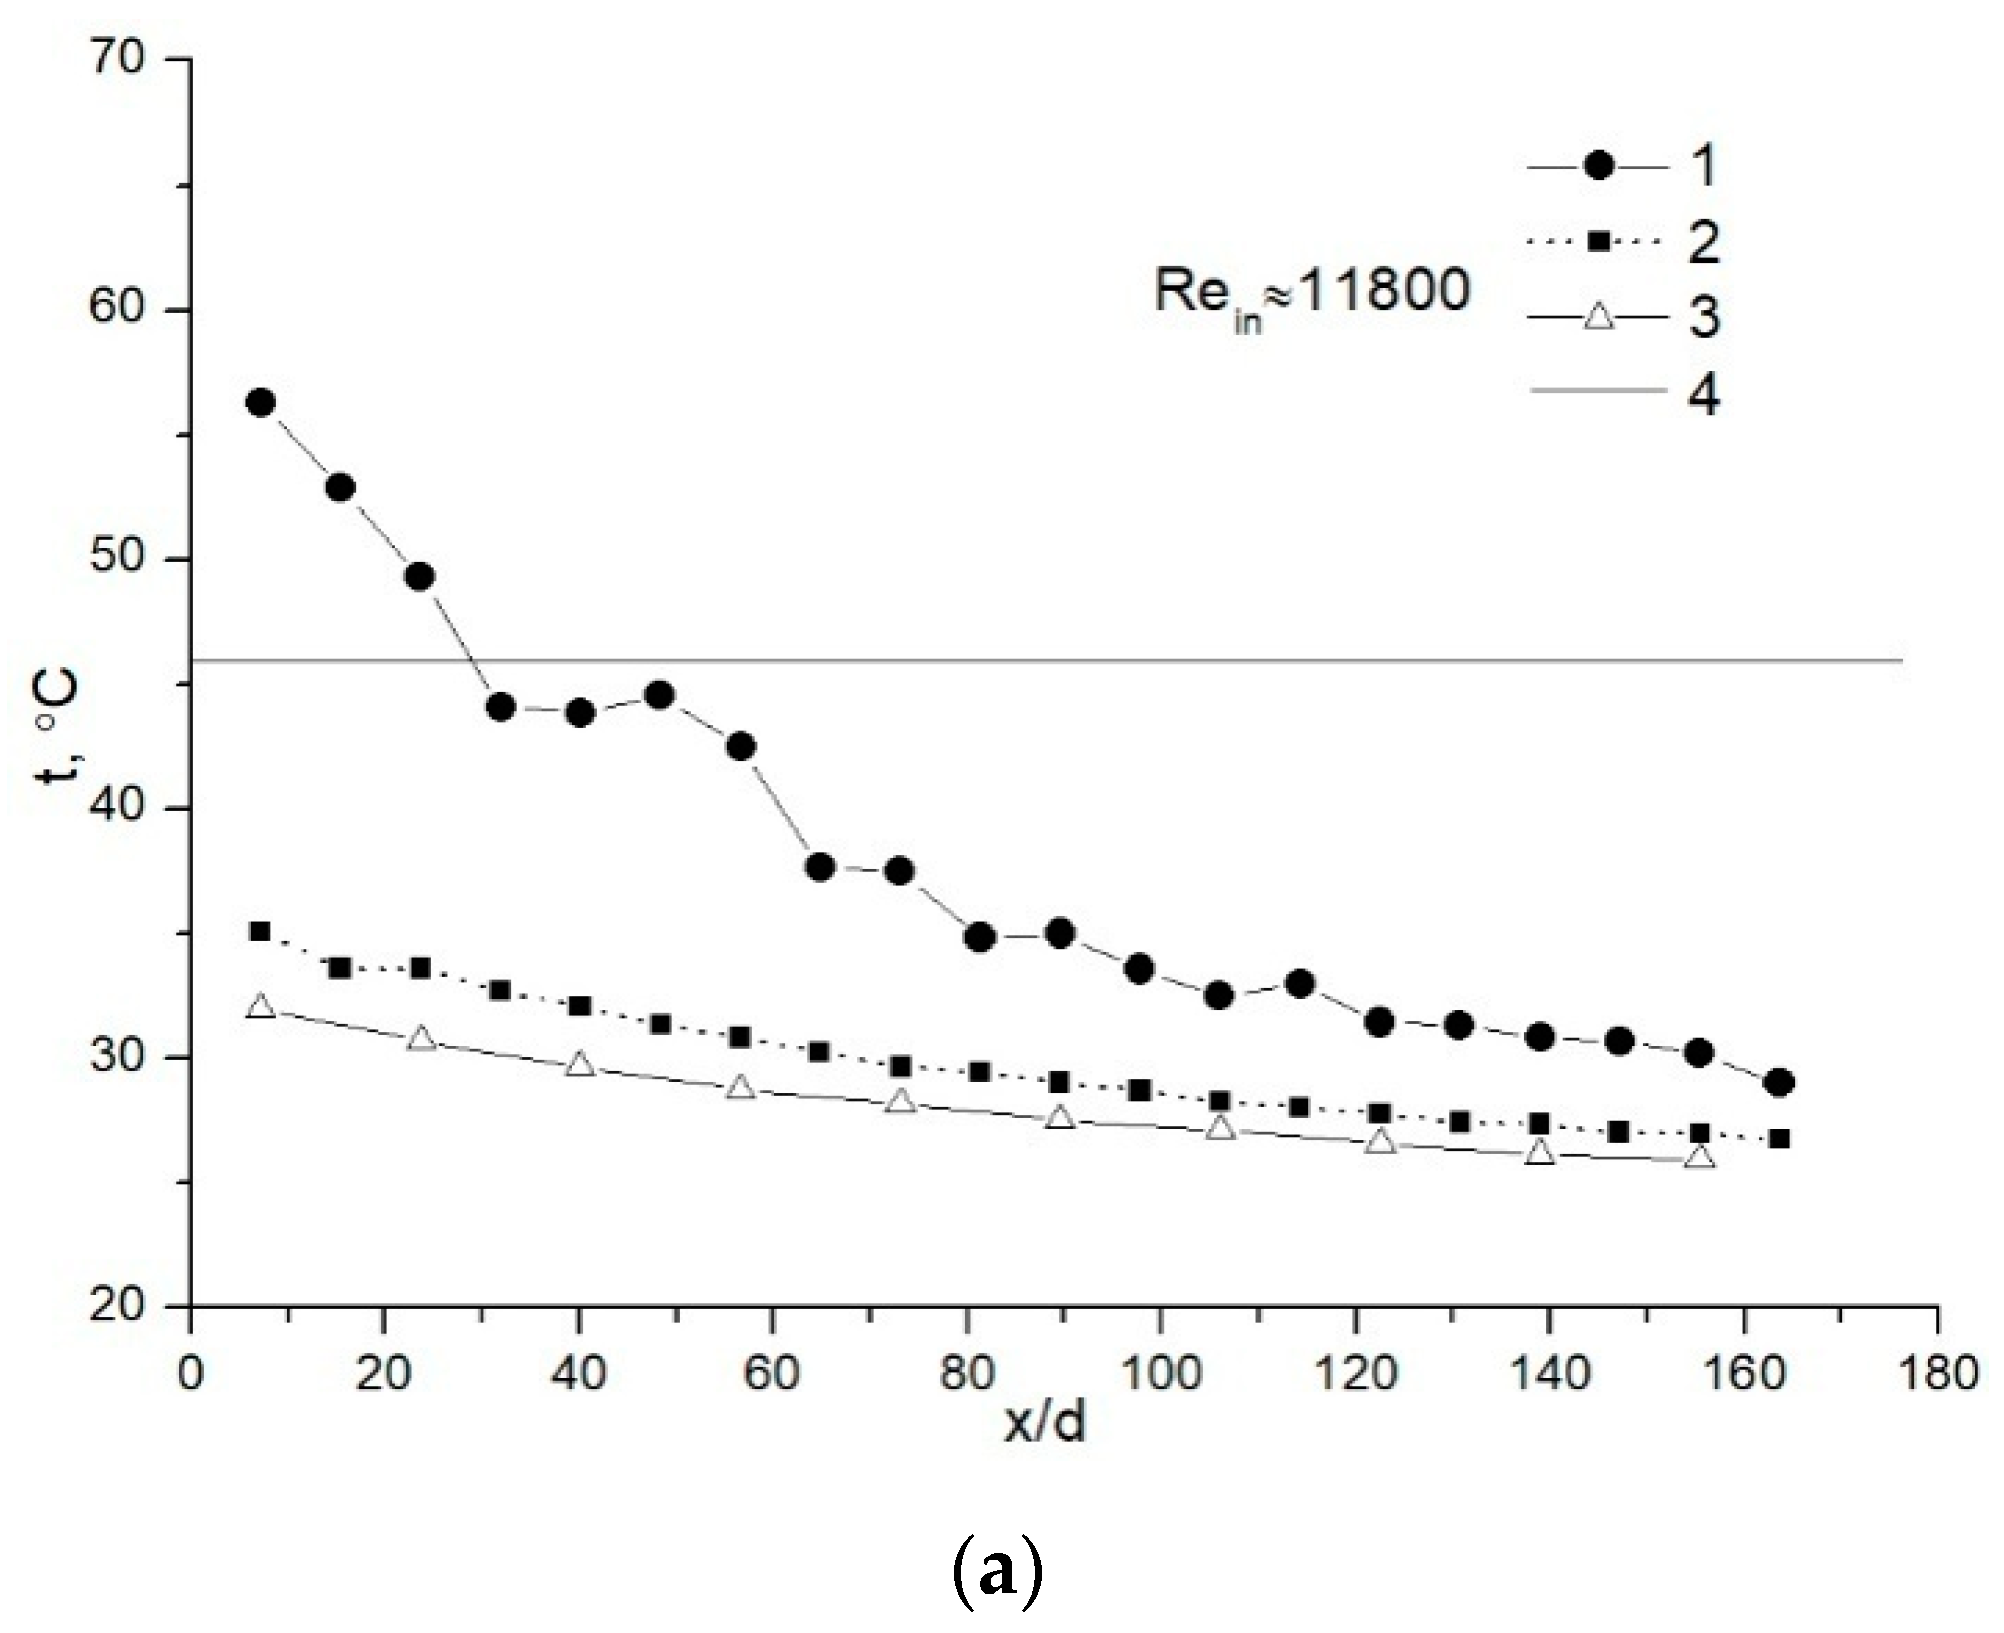
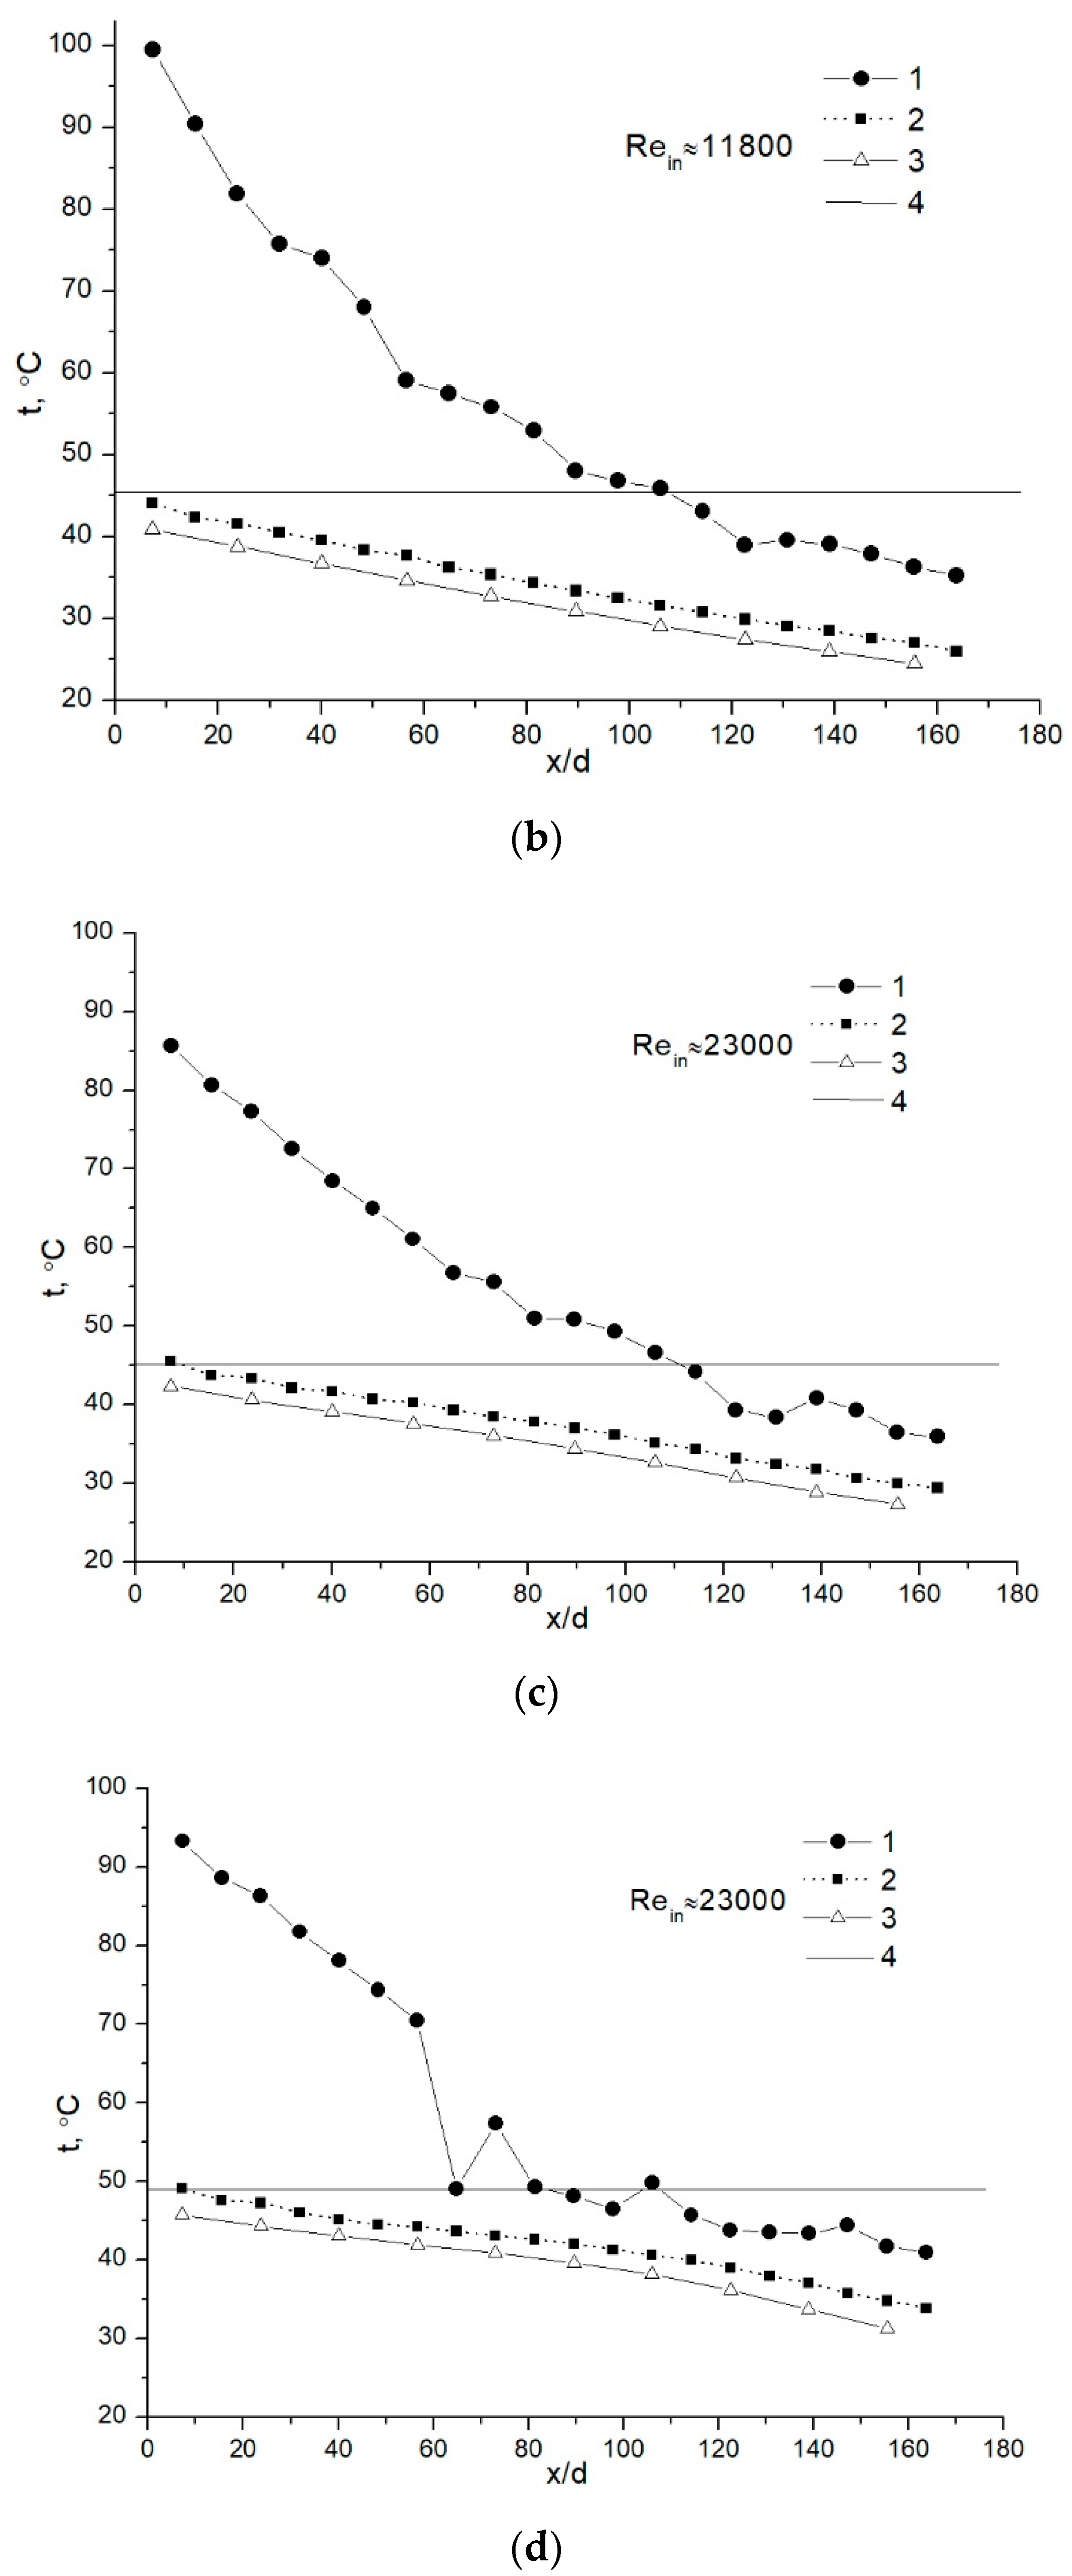
4.1. Water-Vapor Mass Fraction 7%

Figure 2 presents some typical distributions of temperatures along the tube (the model of the condensing heat exchanger) at different Reynolds inlet numbers (Rein), different inlet flue gas temperatures and an almost constant condensable gas (water vapor) mass fraction mcd ≈ 7% when no water was sprayed into the furnace of the boiler. The dew point temperature at the inlet to the test section for the presented cases was in the range of 46–49 °C and was calculated based on measured RHin and tin and using equations presented in Reference [21]. The inlet cooling water temperature was in the range of 25–27 °C.
It is known that, when the condenser wall temperature from the flue gas flow side is lower than the dew point temperature, water vapor starts to condensate on the wall of the calorimetric tube. If the temperature of the flue gas in the center of the calorimetric tube reaches the dew point temperature, water vapor should start to condense in all its volume.
For the case presented in Figure 2a, the wall temperature (curve 2) is below the dew point temperature. Hence, from the inlet to the tube the condensation on the wall is going on. In other cases (Figure 2b–d), the wall temperature near the flue gas inlet is very close to the dew point temperature or even slightly exceeds it. Therefore, condensation cannot start on the wall from the very beginning of the tube, or it is very week. The decrease of the flow temperature in the center of the tube indicates the cooling of the flow. Due to this, almost a linear decrease in the temperature of the flue gas is observed initially (Figure 2, curve 1) until the temperature reaches the dew point temperature. Therefore, flow cooling by convection is prevailing in this part.
Figure 2 shows that, with an increase in Rein, the part of the calorimetric tube where convection is prevailing extends. When Rein ≈ 11,800 convection is prevailing region is observed from the beginning of the calorimetric tube until x/d ≈ 30–40 (Figure 2a,b). For the cases when Rein was increased to 23,000 (Figure 2b,c), it has extended further, i.e., until x/d ≈ 60–70.
After a linear decrease in the flue gas temperature, some regions with temperature fluctuations occurs. At lower Rein and at higher Rein (Figure 2b,c), these temperature fluctuations are not clearly expressed. Clearly expressed flue gas temperature fluctuations were observed at Rein when the flue gas inlet temperature was about 95 °C (Figure 2d), just before the flue gas temperature in the center of the calorimetric tube reached the dew point temperature. It is possible that these fluctuations show fog formation in the total cross-section of the calorimetric tube. As the fog forms in the total cross-section of the tube, it is likely that the formed water droplets splash thermocouple and due to this, a local temperature fluctuation with some minimum of flue gas temperature was determined; however, more investigations are needed to understand this process.
When the flue gas temperature in the whole cross-section reaches the dew point temperature, the character of flue gas temperature in the center of the tube changes and the temperature decrease is much slower. This indicates that the condensation process dominates, but it is not as intensive as in the case of pure water vapor condensation when the temperature of the flow along the tube does not change as it was presented in References [12,18].
The higher was the inlet flue gas temperature, the higher the calorimetric tube wall temperature was observed. The variation of the calorimetric tube wall temperature for all the analyzed cases is practically similar to the variation of the cooling water temperature. The cooling water temperature increases faster at the beginning of the water inlet (x/d ≈ 170–140) where condensation of water vapor prevails. This is more clearly expressed in the case of a higher inlet flue gas temperature and a higher Reynolds number (Rein ≈ 23,000) (Figure 2d, curve 4).
Variation in the total Nusselt number with the Rein number at different inlet flue gas temperatures is shown in Figure 3. For a lower Rein number (Figure 3a, Rein≈ 11,800), the total Nusselt number is rather high even at the beginning of the calorimetric tube. This is related to the fact that the calorimetric tube wall temperature is low in comparison with the dew point temperature (Figure 2a), and due to this temperature difference, the favorable conditions for condensation are created. Further on, in the case of a lower flue gas inlet temperature (Figure 2a), heat transfer reaches the maximum value of Nut ≈ 95 at about x/d ≈ 100 and then starts to decrease (Figure 3a). At the end of the calorimetric tube, the Nusselt number is even slightly lower than it was at the beginning. This could be related to the fact that the condensation influence on heat transfer became less strong as some amount of water vapor had already been condensed and temperature differences were rather small.
When the flue gas inlet temperature is increased (Figure 3a), the total heat transfer increases more rapidly in comparison with the case before. The increase is observed even until x/d ≈ 120 and after that, some stabilization of heat transfer occurs. This could be related to an almost constant difference between the flue gas temperature and the tube wall temperature. In any case, the maximum value of Nut ≈ 200 is almost twice higher than it was determined at a lower flue gas inlet temperature.
At higher Rein numbers (Figure 3b), the heat transfer at the beginning of the calorimetric tube is slightly lower in comparison with the lower Rein number discussed earlier. In case of higher Rein numbers, the tube wall temperature is very close to the dew point temperature or slightly higher at the beginning of the calorimetric tube (Figure 2c,d), and therefore condensation cannot occur from the very beginning of the calorimetric tube or it is very week.
At Rein ≈ 23,000 for both inlet flue gas temperatures (Figure 2c,d), the heat transfer increases rather intensively with the distance of the tube (Figure 3b). For the lower inlet flue gas temperature, the heat transfer constantly increases until the end of the tube. For the higher inlet flue gas temperature, three zones of the Nut variation can be distinguished: the first one is from the beginning of the tube, where the heat transfer gradually increases until about x/d ≈ 50, the second one is from x/d > 50, when a rather sharp increase of heat transfer is observed, and the third one from x/d of about 110 when Nut starts to stabilize. Such intensification of heat transfer could be related with prevailing of the condensation due to a decrease in the flow temperature in whole cross-section below the dew point temperature.

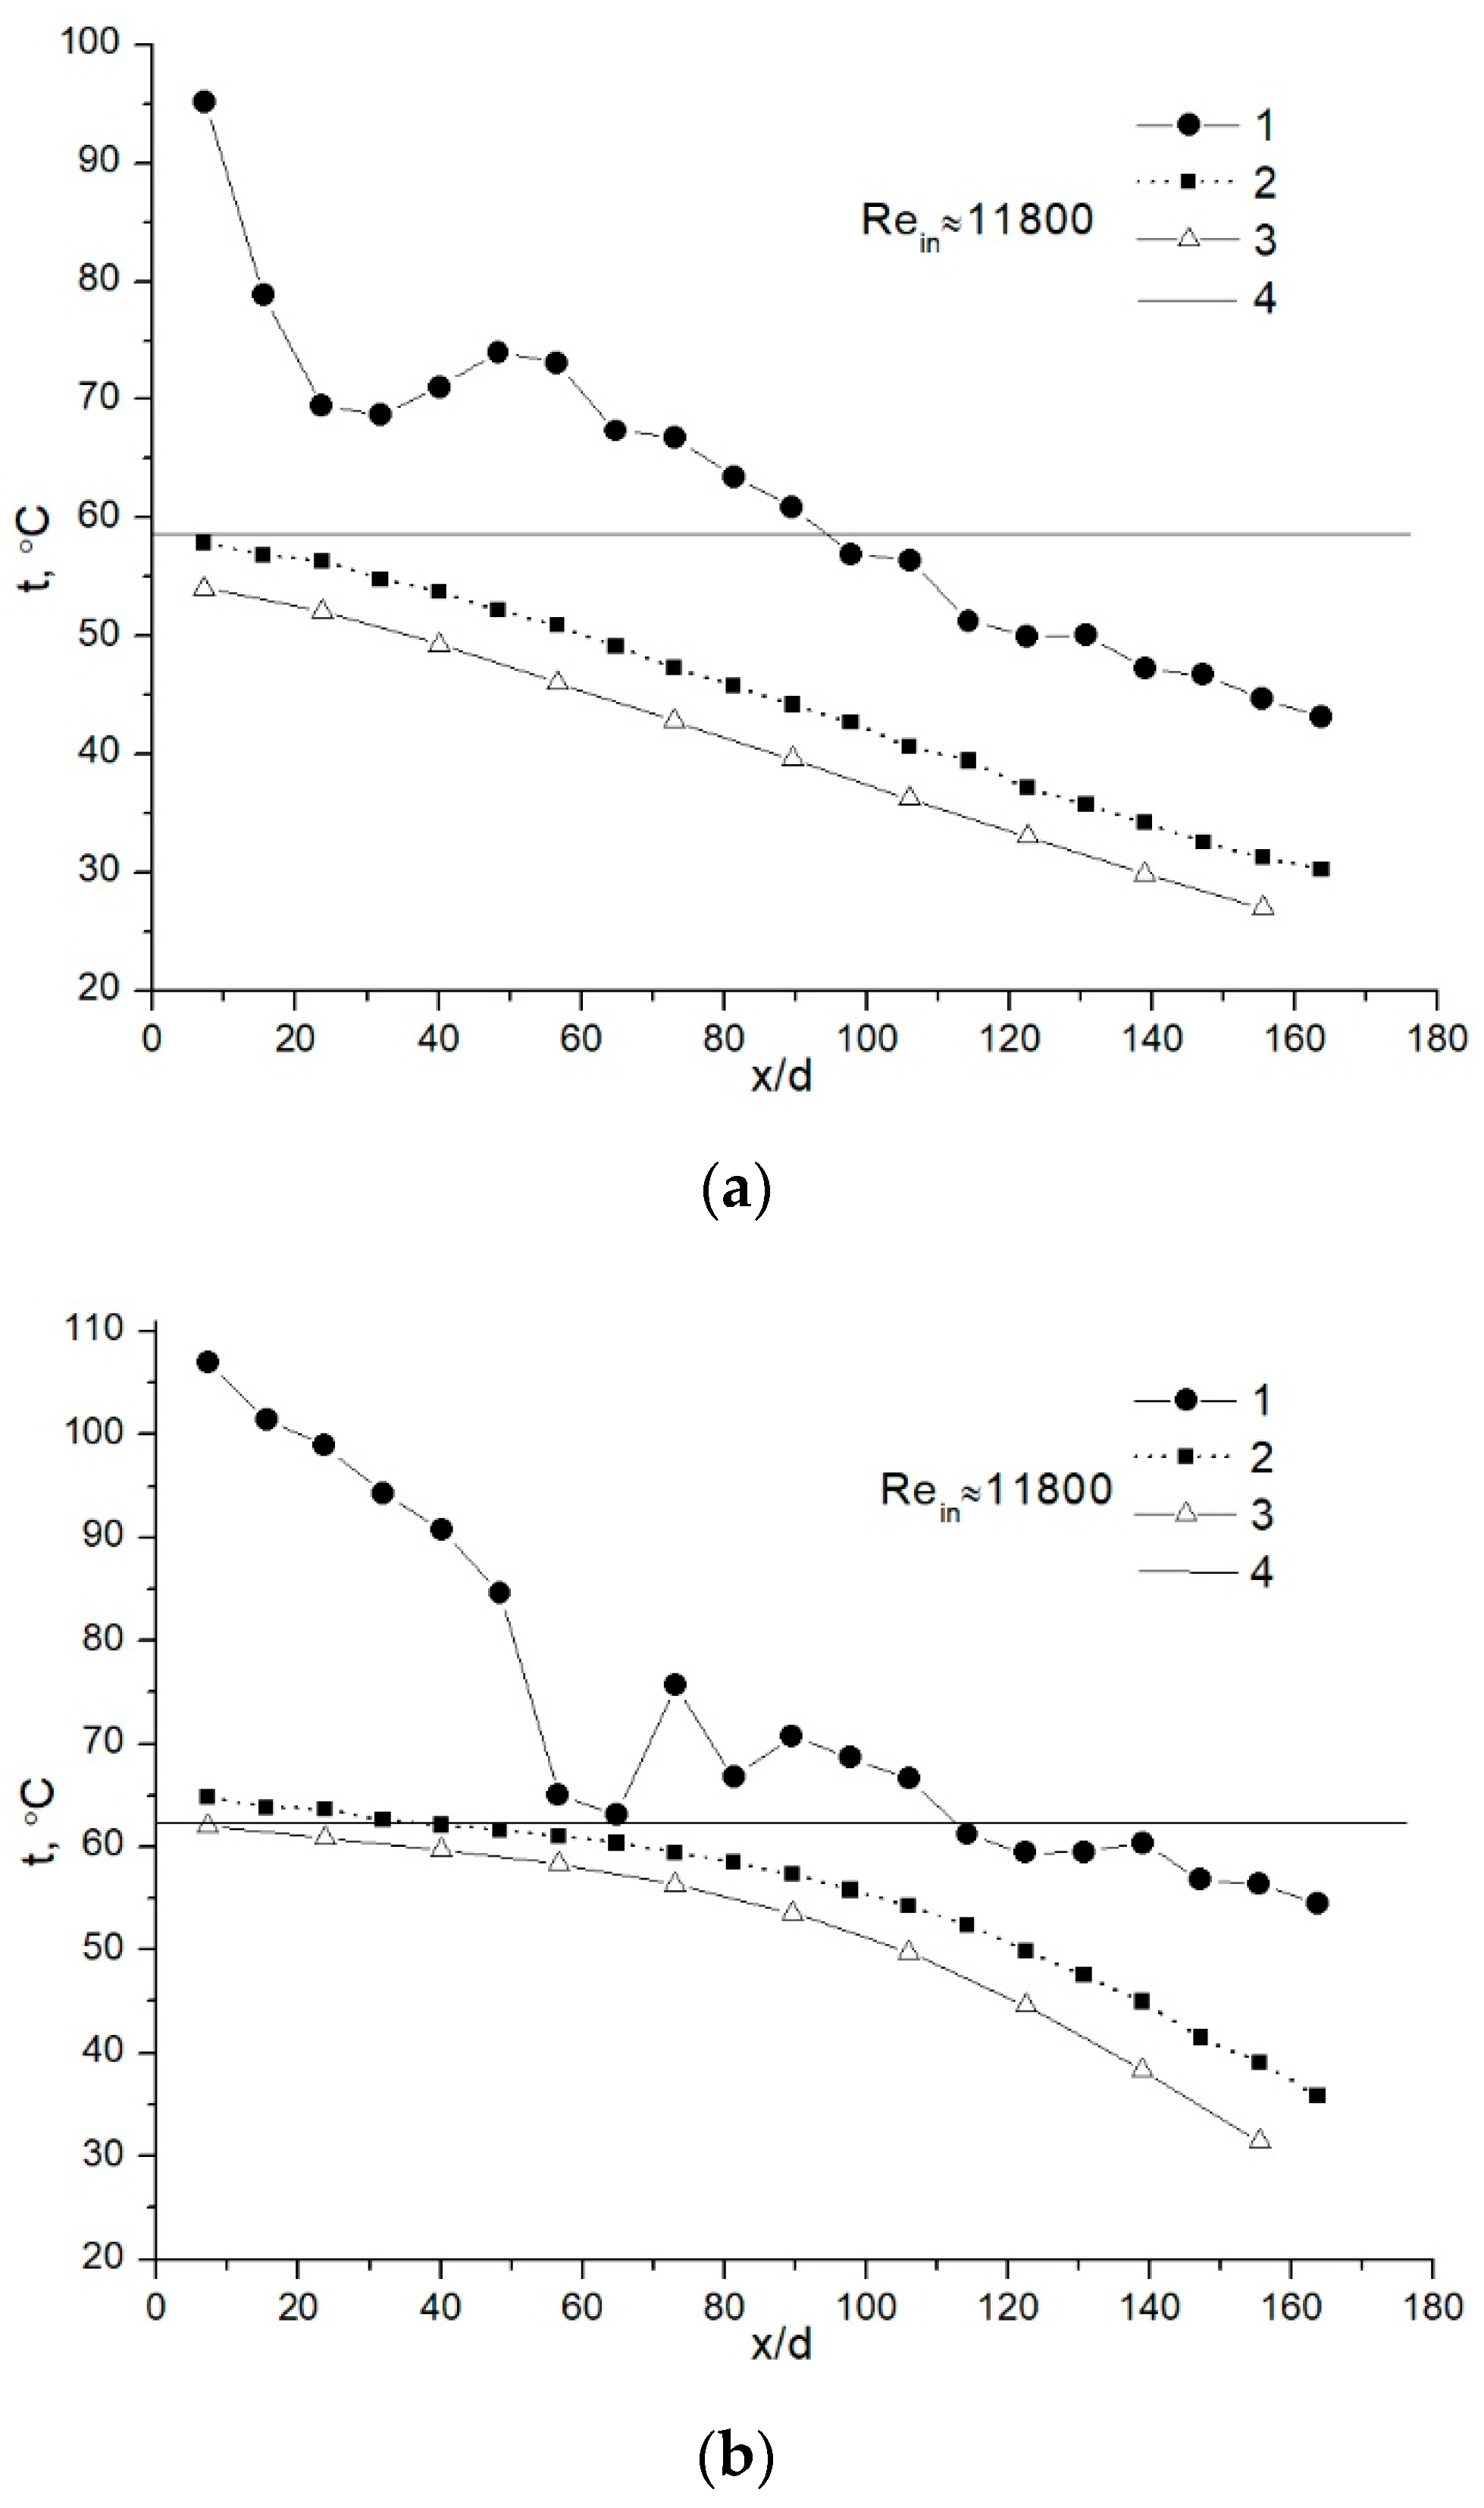
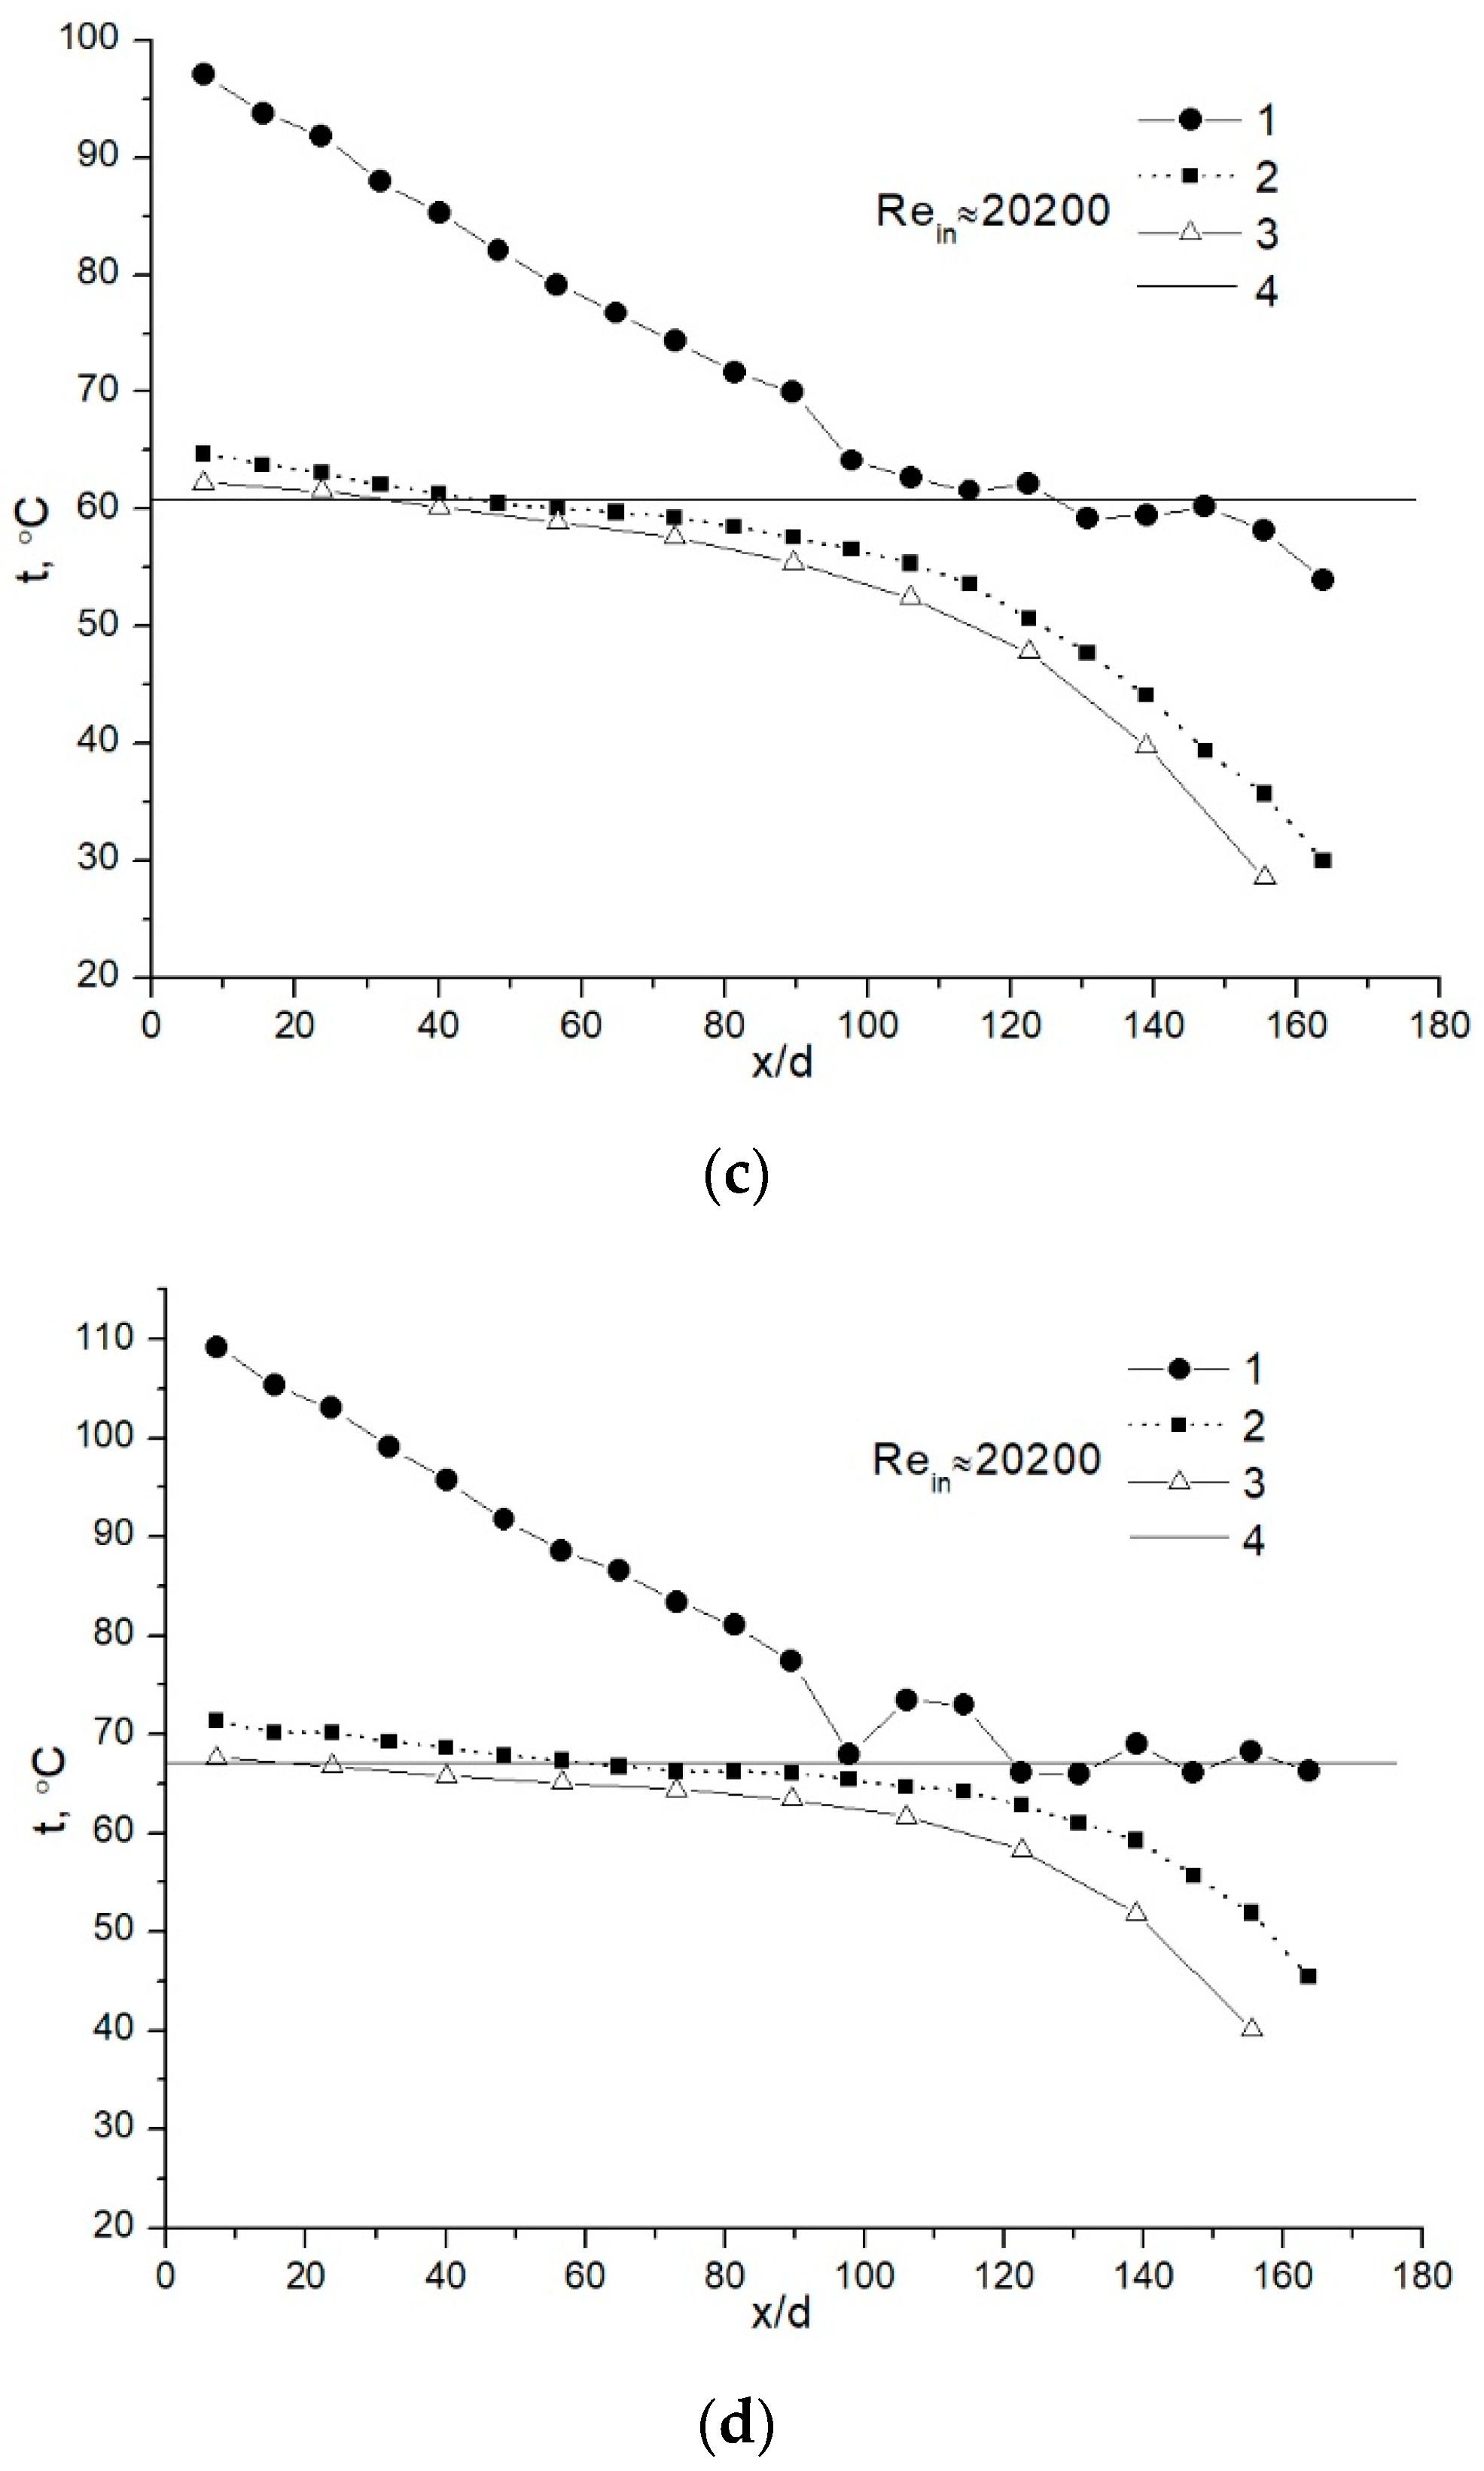
4.2. Water-Vapor Mass Fraction 17%

In order to increase moisture content in the flue gas and to reveal differences in temperature variations and heat transfer in comparison with the previous case, hot water was sprayed into the furnace of the boiler, but the Rein numbers were kept almost the same.
The dew point temperature at the inlet to the test section for the presented cases was in the range of 58–67 °C, and it was calculated based on the measurements of the RHin and tin and using equations presented in Reference [21]. The inlet cooling water temperature was in the range of 26–29 °C.
It can be seen (Figure 4a) that the tube wall temperature is close but still below the dew point temperature at the inlet to the tube.
This means that condensation on the wall takes place from the very beginning of the tube. In other cases (Figure 4b–d) at x/d until 50–80, the tube wall temperature exceeds the dew point temperature. Therefore, no condensation occurs in these regions and the flow is cooled due to convection. It must be stressed that, for a higher Rein number and a higher inlet temperature (Figure 4d), this region extended to a higher x/d value, until about x/d ≈ 80.
The variations in the tube wall temperature and in the cooling water temperature (Figure 4) are rather similar. However, comparing the current cases with the results presented in Figure 2, it can be seen that the cooling water temperature increases much faster from the water inlet (x/d ≈ 170) until a certain point in the test section. The increase in the cooling water temperature is very well expressed till the points where the condensation begins, and this results in a water temperature increase by about 22–24 °C when Rein ≈ 11,800 (Figure 4a,b) or even more, i.e., by about 22–27 °C when Rein ≈ 20,200 (Figure 4c,d). Further, until the cooling water exits the test section (at x/d = 0), the increase in its temperature is much modest, i.e., by about 7–8 °C.
The regions of prevailing convection and condensation are very clearly demonstrated by the total Nusselt number variation along the tube (Figure 5). At the beginning of the calorimetric tube, the Nut for a lower Rein number and a lower inlet flue gas temperature (Figure 5a) is slightly higher in comparison to that at a higher inlet flue gas temperature. The condensation heat transfer in the first case and the convection heat transfer in the second one could explain such a difference, as it was indicated above. For the first case, with the further distance the heat transfer increase is noticed until it reaches the maximum value of about Nut = 200, and then, as in the case for a lower condensable gas mass fraction (Figure 3a), the heat transfer starts to decrease, likely for the reasons already discussed in previous sections. For the case with a higher inlet flue gas temperature, the heat transfer gradually increases from the beginning of the tube until about x/d ≈ 50. Then a sharp increase follows due to a condensation occurrence in almost all the volume of the calorimetric tube (Figure 4b, see curve 1). Later it starts to stabilize and stays in the range of Nut≈ 375–425 in the remaining part of the calorimetric tube.
When Rein is higher (Figure 5b) and the flue gas temperature is lower, the convection heat transfer extends until x/d ≈ 60. After that, the heat transfer increases rather steeply due to the condensation of water vapor and at x/d ≈ 110 reaches the maximum value of Nut ≈ 600. After that, some variation could be observed. At a higher inlet flue gas temperature, the convection heat transfer is almost constant until x/d ≈ 80. After that, a sharp increase is noticed in the heat transfer due to water vapor condensation, which reaches the maximum value of Nut ≈ 1000 at x/d ≈ 130, and further, as in the case before, some variation is observed.
In general, the results presented in Figure 5 show that, in the case of high Rein numbers, almost half of the calorimetric tube of the heat exchanger (the model of the economizer), where heat from flue gas is recovered by convection, would be used inefficiently in terms of the heat transfer process.

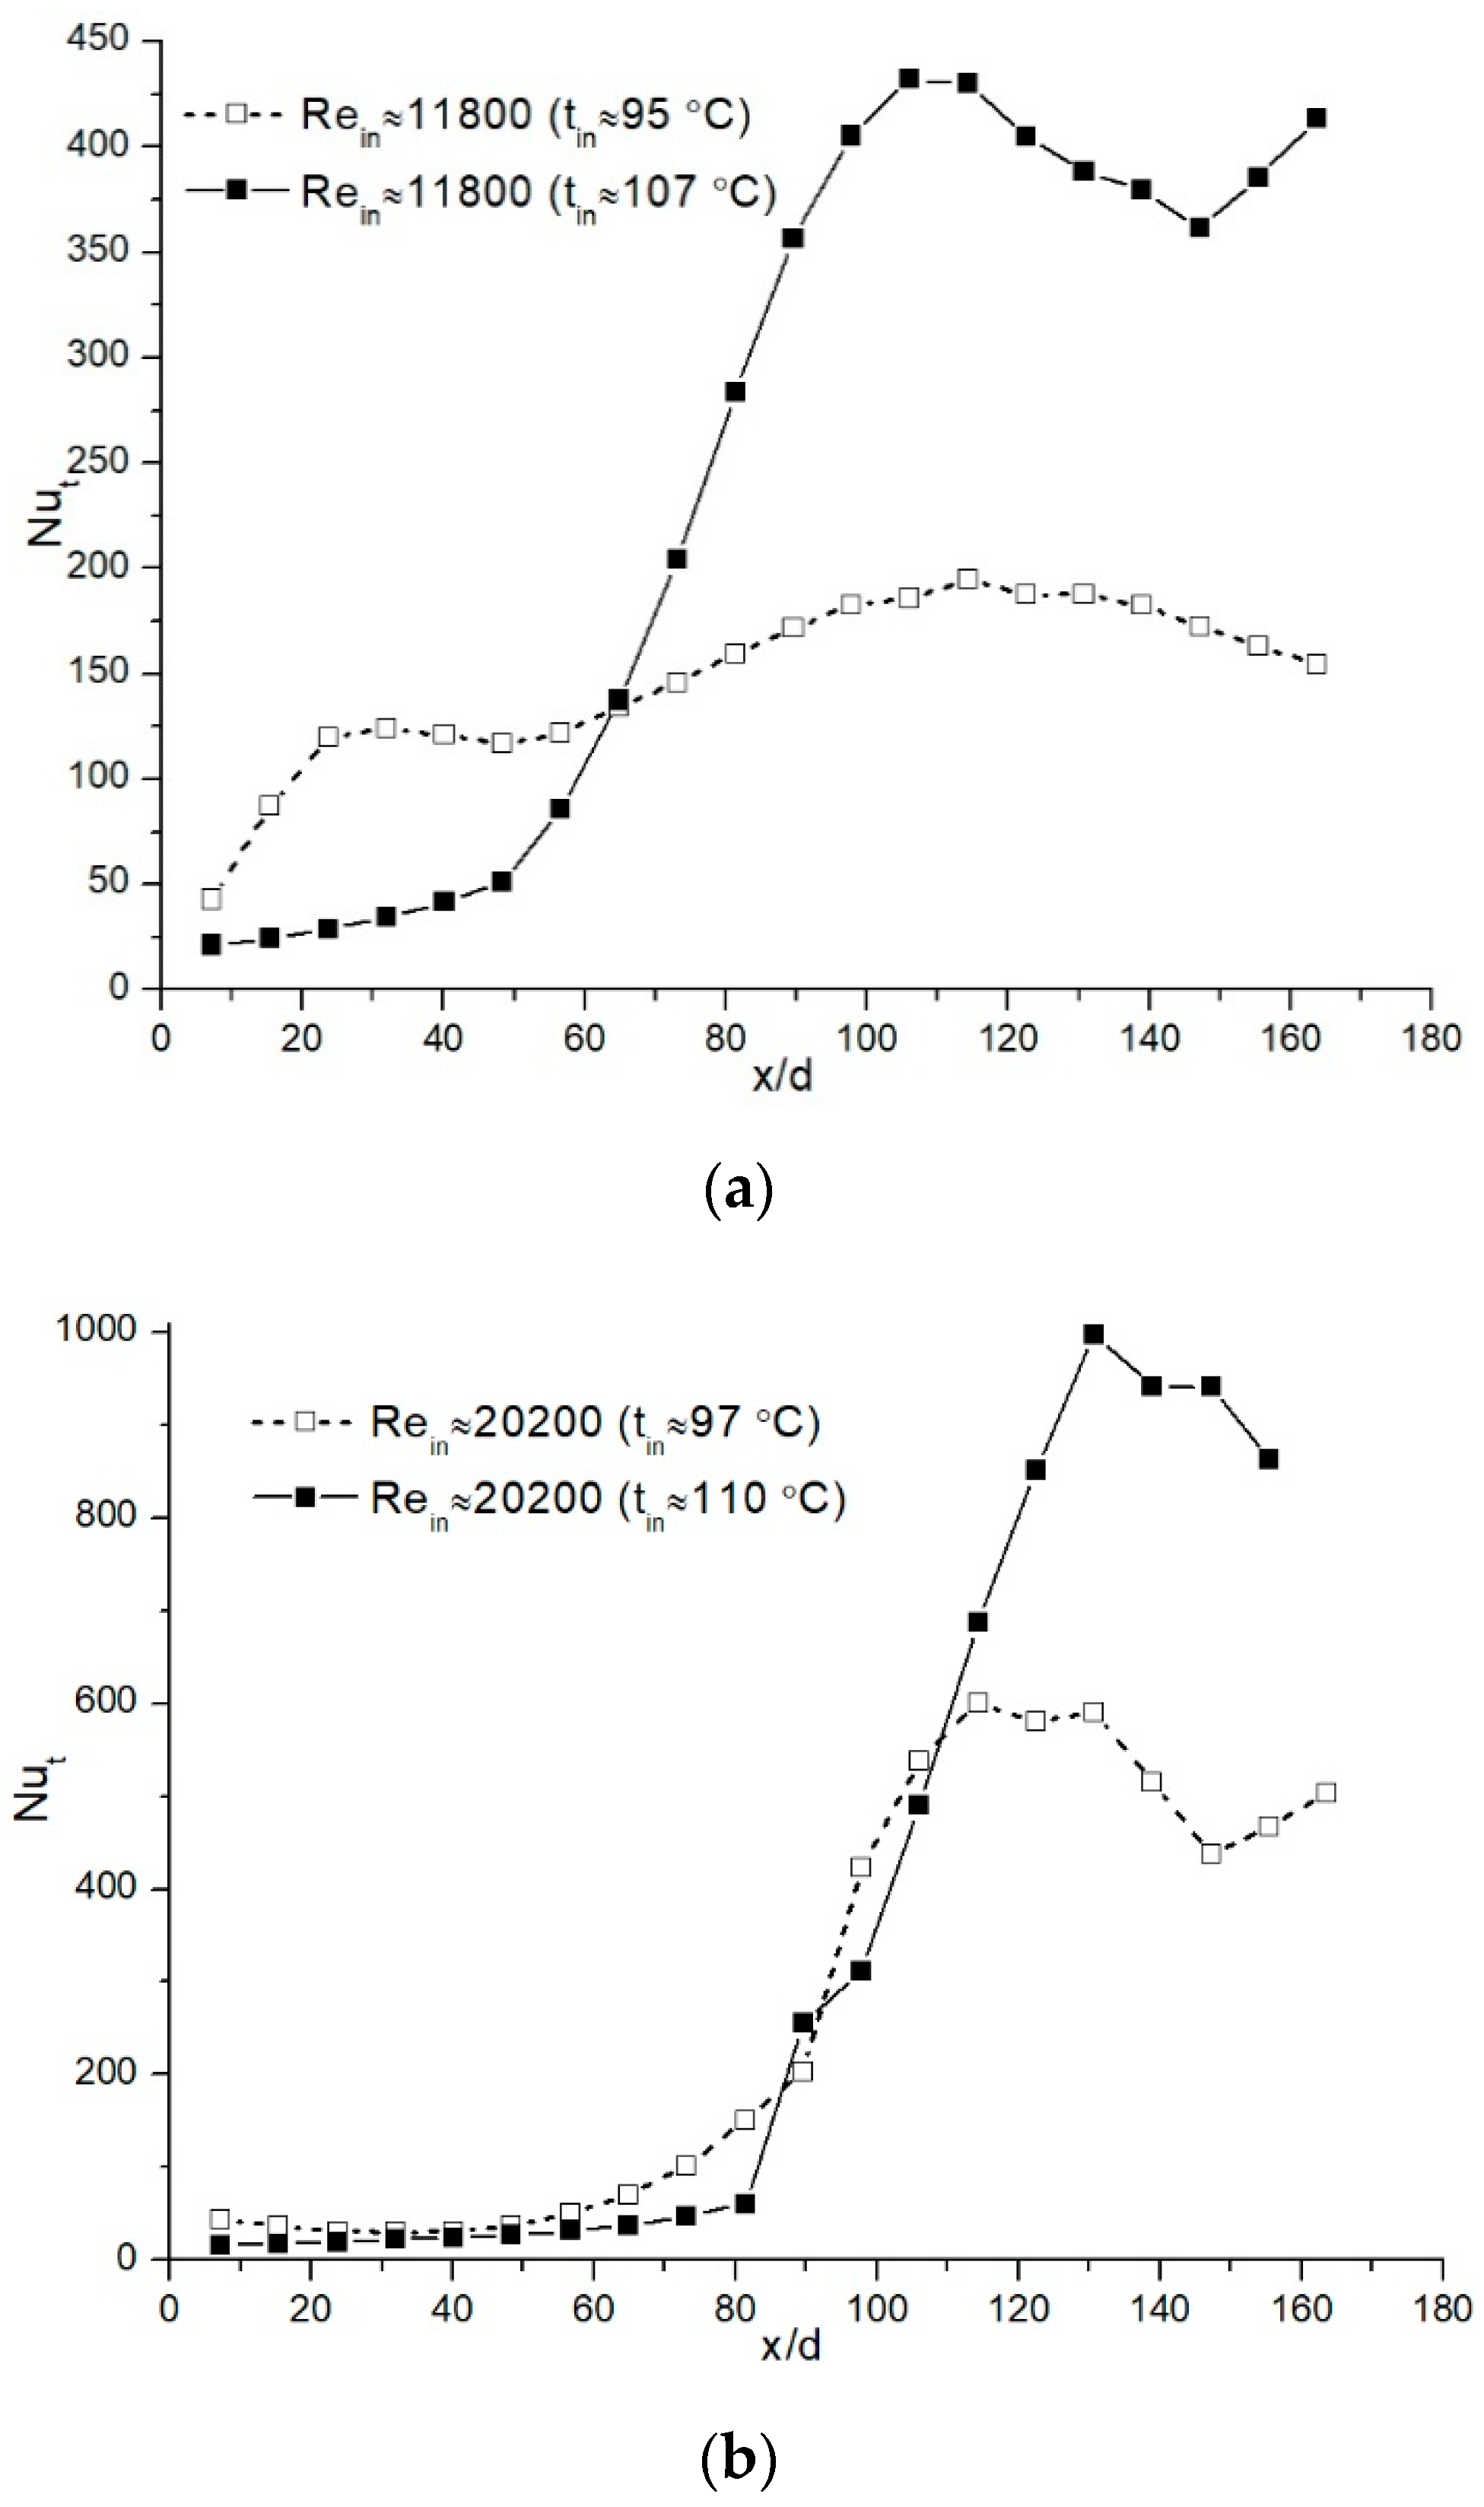
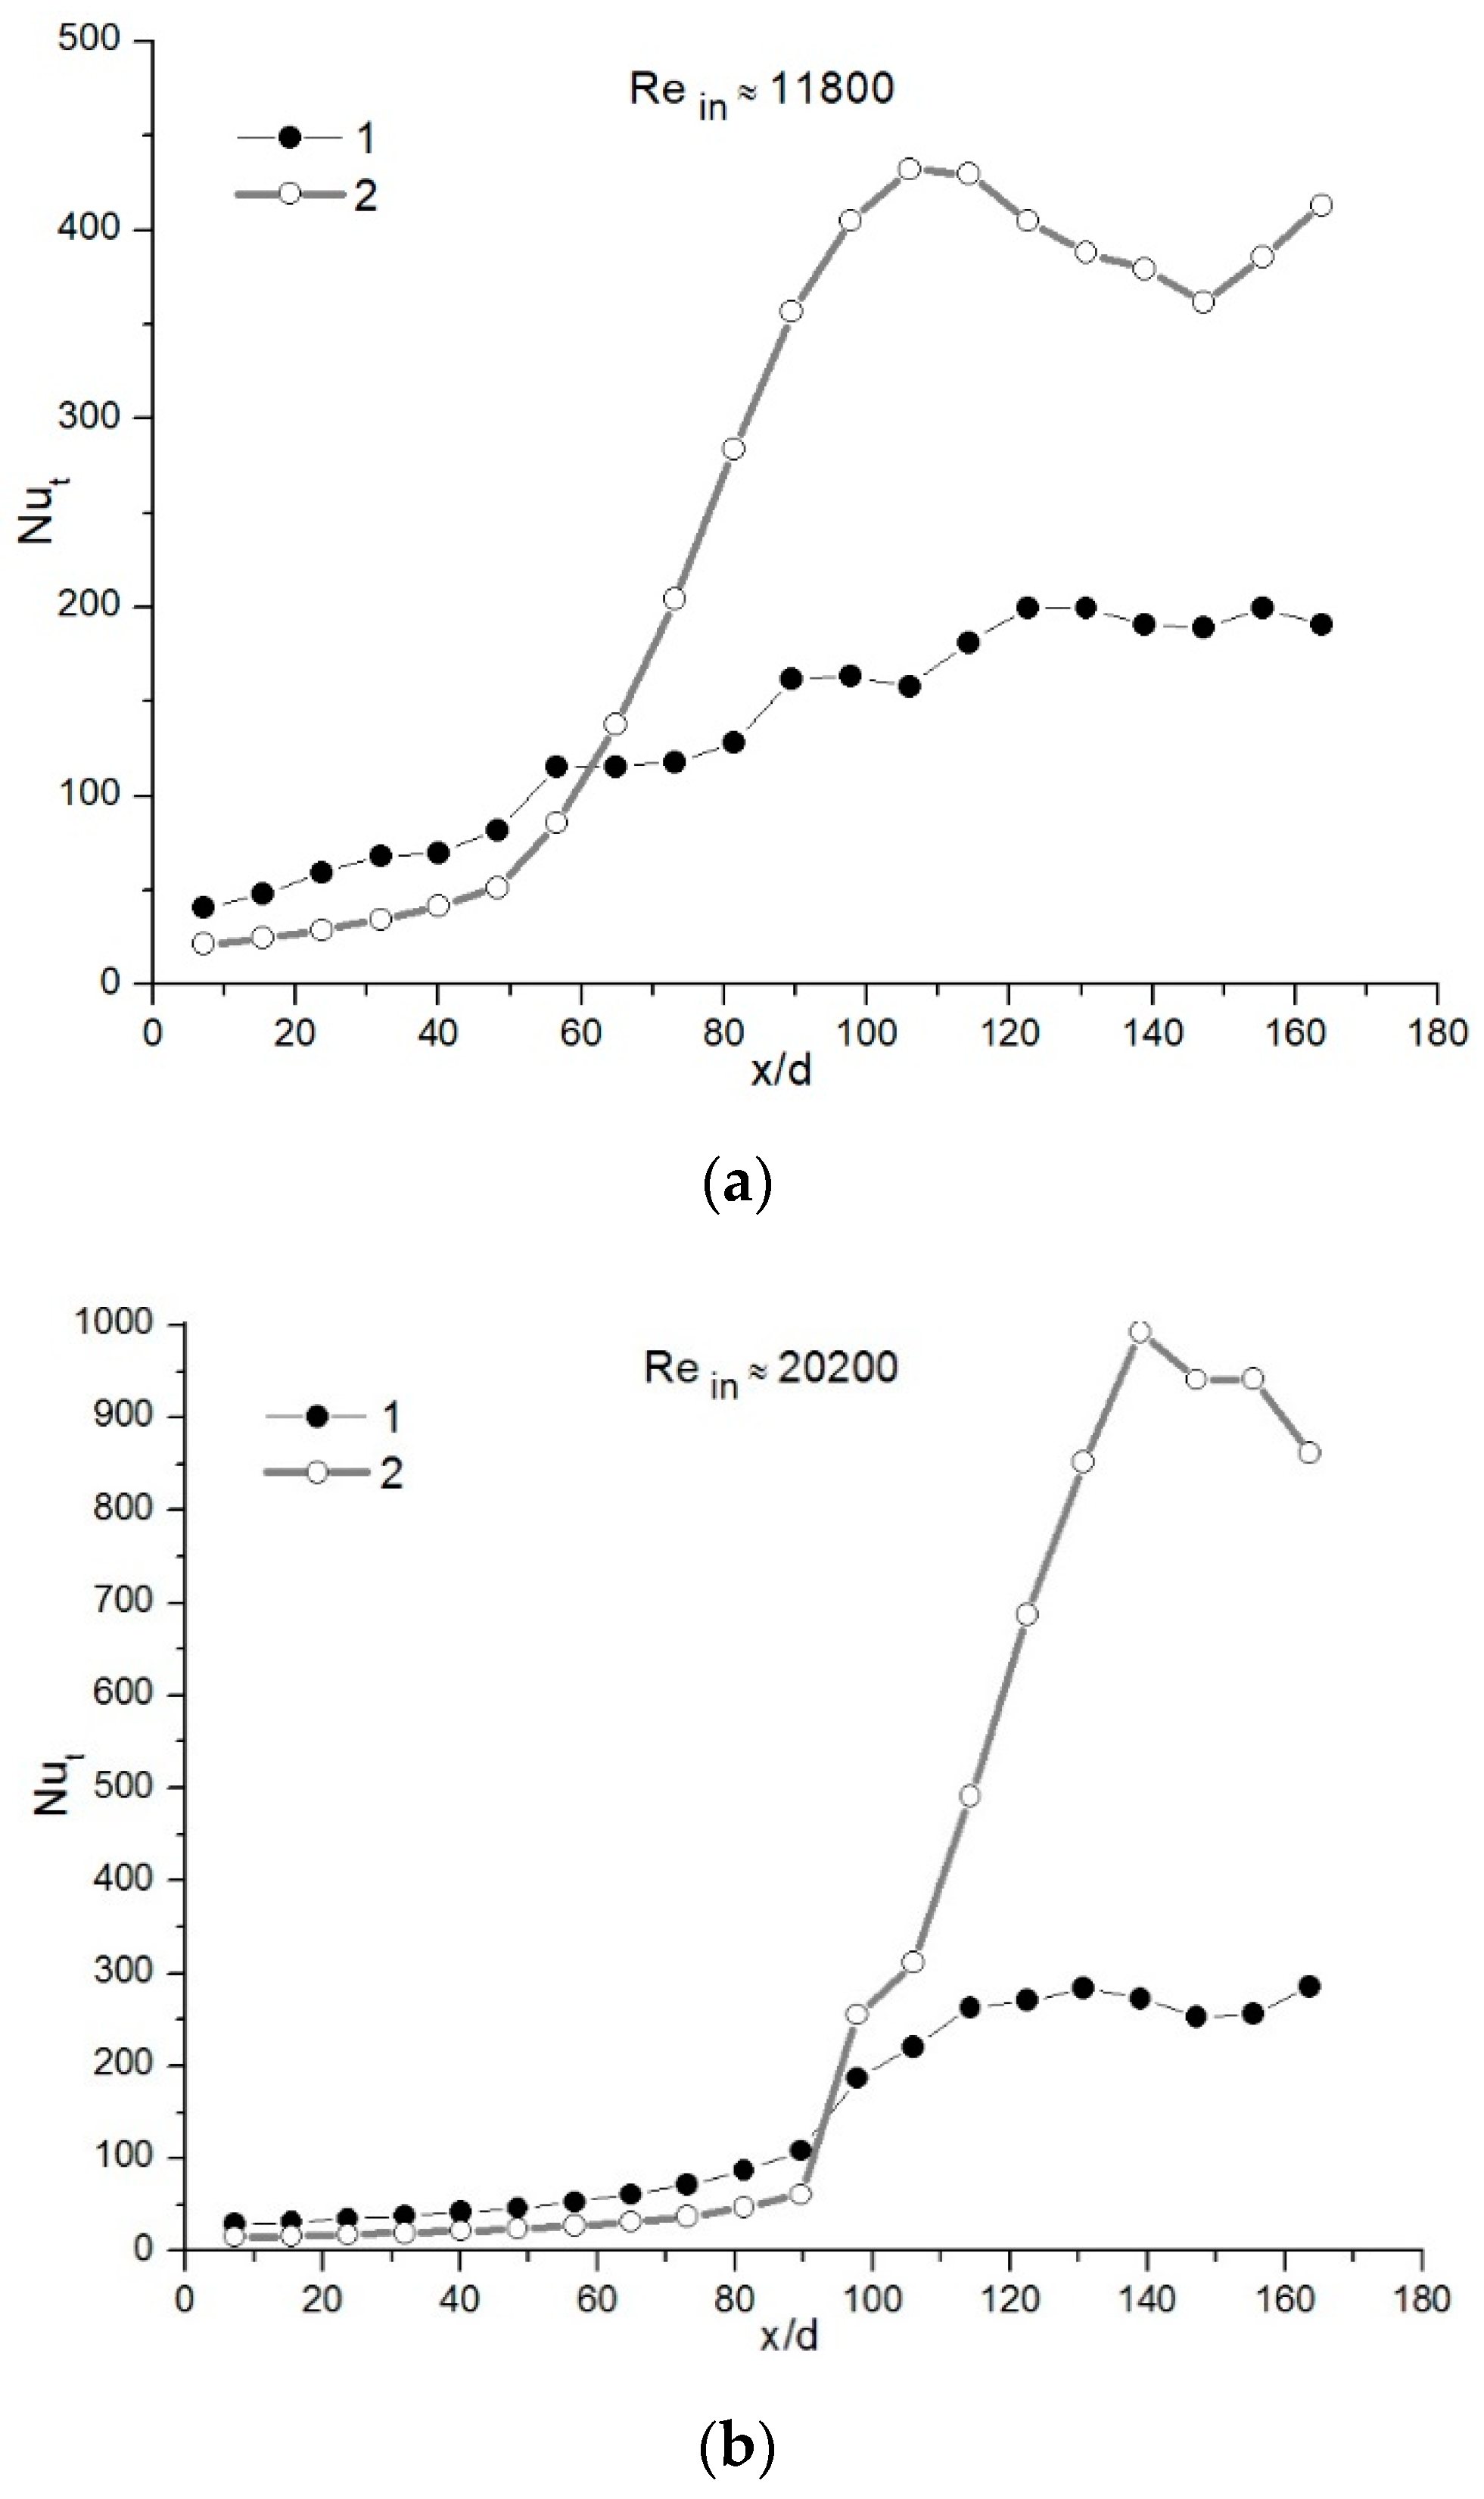
4.3. Comparison of the Results for Different Water-Vapor Mass Fractions

The influence of the water-vapor mass fraction on the total local heat transfer at a constant Rein number and a high inlet flue gas temperature was also analyzed. The results in Figure 6 show that the increase in the water-vapor mass fraction from ≈ 7% to ≈ 17% has a significant impact on heat transfer.
For the case with the smaller Rein number (Figure 6a), the increase in the water-vapor mass fraction resulted in an increase in the total heat-transfer peak value by about 2.2 times till about 450 and for the higher Rein number (Figure 6b) by about 3.4 times, till about 1000. The results presented in Figure 6 indicate that, the higher the Rein number, the longer the part of the model of the condensing heat exchanger that is inefficiently used for heat transfer due to convection in a larger inlet part of it.
The analysis showed that, in the case of water-vapor mass fraction ≈ 7% as the inlet water vapor flow rate was from ≈ 1.7 to ≈ 3.1 kg/h, the total condensate flow rate was also small and the condensation efficiency was in the range between ≈ 15% and 26%. When the condensable gas mass fraction was increased to ≈ 17 %, the inlet water vapor flow rate was almost two times higher and the total condensate flow rate was also about two times higher in comparison with the previous case. Due to this, the condensation efficiency was about 2.3–2.5 times higher and was in the range between ≈ 39% and 56%.

5. Conclusions

After performing the analysis of the local water vapor condensation from biofuel flue gas along the model of the condensing heat exchanger (vertical tube) at different water-vapor mass fractions, Rein numbers, and inlet flue gas temperatures, the following conclusions were drawn:
  • Performed analysis revealed the influence of inlet parameters on heat transfer processes occurring in condensing heat exchangers.
  • The investigations of the local heat transfer along the tube (the model of the condensing heat exchanger) provided important findings related to the optimization of the operation of heat exchangers of such type.
  • The investigations showed that, in some cases in the initial part of the condensing heat exchanger model, the heat from flue gas is recovered by convection. Only after that, a sharp increase is noticed in heat transfer due to water vapor condensation.
  • The analysis showed that, in the case of water-vapor mass fraction ≈ 7%, the condensation efficiency was in the range between ≈ 15% and 26%. When the condensable gas mass fraction was increased until ≈ 17%, the condensation efficiency was in the range between ≈ 39% and 56%.
  • To use the condensing heat exchangers efficiently, there is a need to adjust certain flue gas flow rate, temperature and humidity and other parameters in such a way that the condensation of water vapor would be from the beginning of the condensing heat exchanger.

Author Contributions

Conceptualization, R.P.; methodology, A.S. and P.P.; formal analysis, A.S. and V.K.; experimental investigation, V.K. and A.S.; writing—original draft preparation, A.S. and V.K.; writing—review and editing, P.P. and R.P.; supervision, R.P. All authors have read and agreed to the published version of the manuscript.

Funding

This research was funded by Research council of Lithuania (LMTLT), grant number S-MIP-20-30.

Institutional Review Board Statement

Not applicable.

Informed Consent Statement

Not applicable.

Data Availability Statement

Not applicable.

Conflicts of Interest

The authors declare no conflict of interest.

References

  1. Thulukkanam, K. Heat Exchanger Design Handbook, 2nd ed.; CRC Press: Boca Raton, FL, USA, 2013. [Google Scholar]
  2. Kasurinen, S.; Jalava, P.I.; Tapanainen, M.; Uski, O.; Happo, M.S.; Mäki-Paakkanen, J.; Lamberg, H.; Koponen, H.; Nuutinen, I.; Kortelainen, M.; et al. Toxicological effects of particulate emissions—A comparison of oil and wood fuels in small- and medium-scale heating systems. Atmos. Environ. 2015, 103, 321–330. [Google Scholar] [CrossRef]
  3. Survey of the Present State of Particle Precipitation Devices for Residential Biomass Combustion with a Nominal Capacity up to 50 KW in IEA Bioenergy Task32; Final Version; Institute for Process and Particle Engineering, Graz University of Technology: Graz, Austria, 2013; Available online: https://www.bios-bioenergy.at/uploads/media/Filter-study-IEA-Dez-2011.pdf (accessed on 21 January 2021).
  4. Che, D.; Liu, Y.; Gao, C. Evaluation of retrofitting a conventional natural gas fired boiler into a condensing boiler. Energy Convers. Manag. 2004, 45, 3251–3266. [Google Scholar] [CrossRef]
  5. Satyavada, H.; Baldi, S. A novel modelling approach for condensing boilers based on hybrid dynamical systems. Machines 2016, 4, 10. [Google Scholar] [CrossRef]
  6. Siddique, M.; Golay, M.W.; Kazimi, M.S. Local heat transfer coefficients for forced-convection condensation of steam in a vertical tube in the presence of a noncondensable gas. Nucl. Technol. 1993, 102, 386–402. [Google Scholar] [CrossRef]
  7. Park, H.S.; No, H.C. A condensation experiment in the presence of noncondensables in a vertical tube of a passive containment cooling system and its assessment with RELAP5/MOD3.2. Nucl. Technol. 1999, 127, 160–169. [Google Scholar] [CrossRef]
  8. Maheshwari, N.; Saha, D.; Sinha, R.; Aritomi, M. Investigation on condensation in presence of a noncondensable gas for a wide range of Reynolds number. Nucl. Eng. Des. 2004, 227, 219–238. [Google Scholar] [CrossRef]
  9. Caruso, G.; Giannetti, F.; Naviglio, A. Experimental investigation on pure steam and steam-air mixture condensation inside tubes. Int. J. Heat Technol. 2012, 30, 77–84. [Google Scholar] [CrossRef]
  10. Park, I.; Kim, S.-M.; Mudawar, I. Experimental measurement and modeling of downflow condensation in a circular tube. Int. J. Heat Mass Transf. 2013, 57, 567–581. [Google Scholar] [CrossRef]
  11. Oh, S.; Revankar, S.T. Experimental and theoretical investigation of film condensation with noncondensable gas. Int. J. Heat Mass Transf. 2006, 49, 2523–2534. [Google Scholar] [CrossRef]
  12. Lee, K.-Y.; Kim, M.H. Experimental and empirical study of steam condensation heat transfer with a noncondensable gas in a small-diameter vertical tube. Nucl. Eng. Des. 2008, 238, 207–216. [Google Scholar] [CrossRef]
  13. Jia, L.; Peng, X.; Yan, Y.; Sun, J.; Li, X. Effects of water vapor condensation on the convection heat transfer of wet flue gas in a vertical tube. Int. J. Heat Mass Transf. 2001, 44, 4257–4265. [Google Scholar] [CrossRef]
  14. Delalić, N.; Ganić, E.; Džaferović, E. Experimental and numerical study on vapor condensation of wet flue gas in chimney. Defect Diffus. Forum 2008, 273, 119–125. [Google Scholar] [CrossRef]
  15. Chantana, C.; Kumar, S. Experimental and theoretical investigation of air-steam condensation in a vertical tube at low inlet steam fractions. Appl. Therm. Eng. 2013, 54, 399–412. [Google Scholar] [CrossRef]
  16. Shi, X.; Che, D.; Agnew, B.; Gao, J. An investigation of the performance of compact heat exchanger for latent heat recovery from exhaust flue gases. Int. J. Heat Mass Transf. 2011, 54, 606–615. [Google Scholar] [CrossRef]
  17. Li, J.-D.; Saraireh, M.; Thorpe, G. Condensation of vapor in the presence of non-condensable gas in condensers. Int. J. Heat Mass Transf. 2011, 54, 4078–4089. [Google Scholar] [CrossRef]
  18. Siddique, M. The Effects of Noncondensable Gases on Steam Condensation under Forced Convection Conditions. Ph.D. Thesis, Department of Nuclear Engineering, Massachusetts Institute of Technology, Cambridge, MA, USA, 1992. [Google Scholar]
  19. Jeong, K.; Kessen, M.J.; Bilirgen, H.; Levy, E.K. Analytical modeling of water condensation in condensing heat exchanger. Int. J. Heat Mass Transf. 2010, 53, 2361–2368. [Google Scholar] [CrossRef]
  20. Barford, N.C. Experimental Measurements: Precision, Error and Truth, 2nd ed.; John Willey & Sons: Hoboken, NJ, USA, 1985. [Google Scholar]
  21. American Meteorological Society. Available online: https://journals.ametsoc.org/doi/pdf/10.1175/BAMS-86-2-225 (accessed on 21 January 2021).
Figure 1. Experimental setup (not to scale): (1) boiler; (2) flue gas pipe; (3) heat exchanger (fan coil); (4) flue gas exhauster; (5) by-pass pipe; (6) damper; (7) inlet flue gas flow rate, temperature, and humidity measurement point; (8) water mixer; (9) vertical calorimetric tube as model of flue gas condensing heat exchanger (economizer); (10) water tank; (11) water pump; and (12) condensate collection tank.
Processes 09 00844 g001
Figure 2. Temperature variation along the model of the condensing heat exchanger at a constant inlet water-vapor mass fraction of approximately 7% and at different flue gas inlet temperatures (a) Rein ≈ 11,800, tin ≈ 58 °C, (b), Rein ≈ 11,800, tin≈ 100 °C, (c) Rein ≈ 23,000, tin≈ 85 °C (d) Rein ≈ 23,000, tin≈ 95 °C (1) center of the calorimetric tube, (2) inner wall of the calorimetric tube, (3) cooling water in the middle between inner and outer tubes, and (4) dew point temperature at the inlet to the calorimetric tube.
Processes 09 00844 g002aProcesses 09 00844 g002b
Figure 3. Variation of the total Nusselt number along the model of the condensing heat exchanger at a constant inlet water-vapor mass fraction of approximately 7%, different flue gas inlet temperatures and Reynolds numbers: (a) Rein ≈ 11,800, tin ≈ 58 °C and tin ≈ 100 °C, (b) Rein ≈ 23,000, tin ≈ 85 °C and tin ≈ 95 °C
Processes 09 00844 g003
Figure 4. Temperature variation along the model of the condensing heat exchanger at a constant inlet water-vapor mass fraction of approximately 17% and different flue gas inlet temperatures (a) Rein ≈ 11,800, tin ≈ 95 °C, (b) Rein ≈ 11,800, tin ≈ 107 °C, (c) Rein ≈ 20,200, tin ≈ 97 °C (d) Rein ≈ 20,200, tin ≈ 110 °C. (1) center of calorimetric tube, (2) inner wall of the calorimetric tube, (3) cooling water in the gap between the inner and the outer tubes, and (4) dew point temperature at the inlet to the calorimetric tube.
Processes 09 00844 g004aProcesses 09 00844 g004b
Figure 5. Distribution of the total Nusselt number along the model of the condensing heat exchanger at a constant inlet water-vapor gas mass fraction of approximately 17% and different flue gas inlet temperatures and Reynolds numbers: (a) Rein ≈ 11,800, tin ≈ 95 °C and tin ≈ 107 °C, (b) Rein ≈ 20,200, tin ≈ 97 °C and tin ≈ 110 °C.
Processes 09 00844 g005
Figure 6. Variation of the total Nusselt number along the model of the condensing heat exchanger at a different water-vapor mass fraction but a constant Rein (a) Rein ≈ 11,800, (b) Rein ≈ 20,200: (1) mcd in ≈ 7% and (2) mcd in ≈ 17%.
Processes 09 00844 g006
Table 1. Distribution of temperature measurement points.
Temperaturex/d
tc7.2; 15.4; 23.7; 31.9; 40.1; 48.4; 56.6; 64.9; 73.1; 81.3; 89.6; 97.8; 106.0; 114.3; 122.5; 130.7; 139.0; 147.2; 155.4; 163.7.
tw7.2; 23.7; 40.1; 56.6; 73.1; 89.6; 106.0; 122.5; 139.0; 155.4.
tcw7.2; 15.4; 23.7; 31.9; 40.1; 48.4; 56.6; 64.9; 73.1; 81.3; 89.6; 97.8; 106.0; 114.3; 122.5; 130.7; 139.0; 147.2; 155.4; 163.7.
Publisher’s Note: MDPI stays neutral with regard to jurisdictional claims in published maps and institutional affiliations.

