Article

Optimization and Analysis of Liquid Anaerobic Co-Digestion of Agro-Industrial Wastes via Mixture Design

by
Roberto Eloy Hernández Regalado
1,2,3,*,
Tobias Weide
2,3,
Daniel Baumkötter
2,3,
Lukas Wettwer
2,3,
Jurek Häner
2,3,
Elmar Brügging
2,3 and
Jens Tränckner
1
1
Faculty of Agriculture and Environmental Sciences, University of Rostock, Justus-von-Liebig-Weg 6, 18059 Rostock, Germany
2
Faculty of Energy Building Services Environmental Engineering, Münster University of Applied Sciences, Stegerwaldstr. 39, 48565 Steinfurt, Germany
3
Institute for Resources, Energy, and Infrastructure, Münster University of Applied Sciences, Stegerwaldstr. 39, 48565 Steinfurt, Germany
*
Author to whom correspondence should be addressed.
Submission received: 26 April 2021 / Revised: 10 May 2021 / Accepted: 11 May 2021 / Published: 17 May 2021
(This article belongs to the Special Issue Bioprocess Design and Optimization)

Abstract

:
Anaerobic co-digestion (AcoD) is a widely employed technique to produce biogas from simultaneous digestion of various biomasses. However, the selection of the optimal proportions of the substrates in the mixtures presents a challenge. This research used a mixture design to investigate the interactions between the liquid fraction of piglet manure (PM), cow manure (CWM), and starch wastewater (SWW). A modified Gompertz model was used to identify the statistically significant parameters of the methane production curves. The optimal compositions of the mixtures were identified based on multi-objective optimization of the maximal methane yield (YCH4) and maximal methane specific production rate (rCH4) parameters. The study was validated using a double mixture of PM and CWM and a triple mixture. The estimated degradation rates for both mixtures were faster than the predicted ones. The absolute relative errors of rCH4 were 27.41% for the double mixture and 5.59% for the triple mixture, while the relative errors of YCH4 were 4.64% for the double mixture and 10.05% for the triple mixture. These relative errors are within the normal limits of a process with high variability like AD. Thus, mixture design supported by the tested models is suitable for the definition of practically advisable mixtures of substrates.

Graphical Abstract

1. Introduction

Enhancement of anaerobic digestion (AD) is a commonly researched topic. The improvement can be achieved by several methods. Among the most popular and recommended methods for improving AD one can find pretreatments or enzymes (i.e., biocatalysts), reactor engineering, coupling AD with dark fermentation, genetically improving the microbial community (bio-augmentation), and anaerobic co-digestion (AcoD) [1].
AcoD involves the simultaneous AD of two or more substrates. It has proved to be a viable option for improving biogas production because it alleviates the disadvantages of mono-digestion while increasing the economic feasibility of the process [2]. Distinct advantages of AcoD include the supply of macro and micronutrients, balanced carbon-nitrogen ratio, superior buffer capacity, dilution of inhibitors, and potentially enhanced biogas production [3].
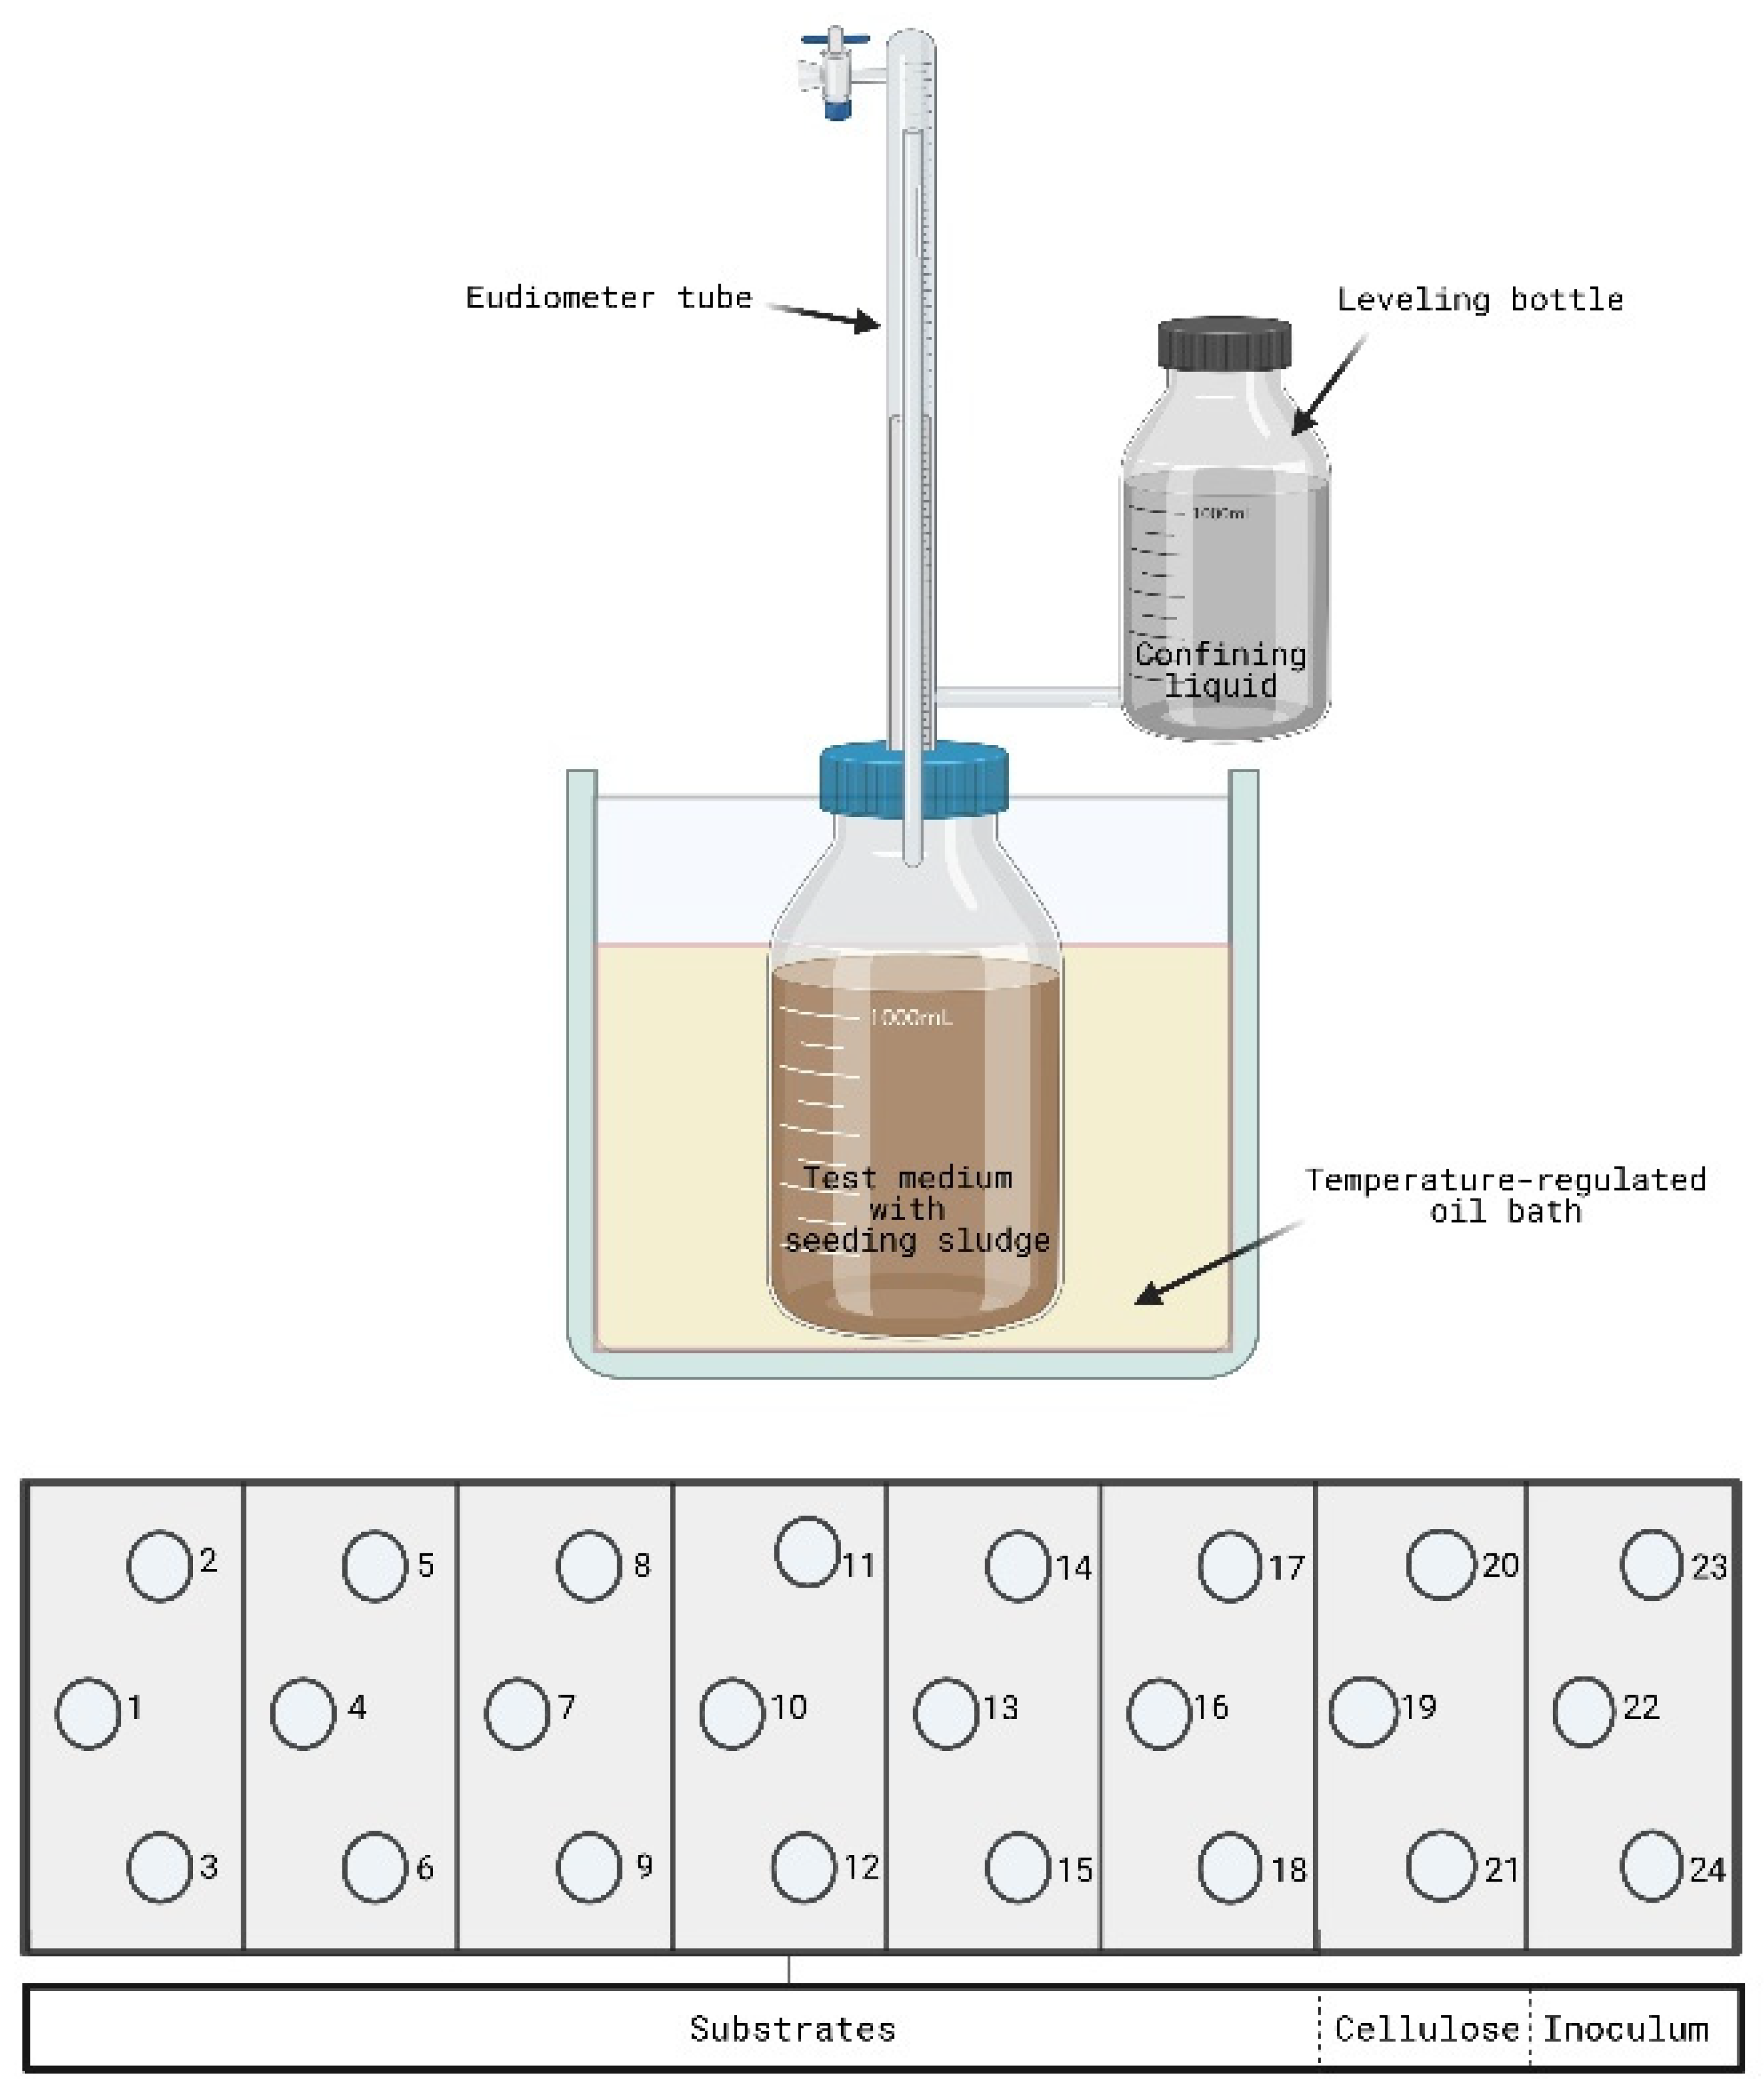
There exist different criteria to assess the performance of AD processes, however, the most well-accepted and commonly used is the bio-methane potential (BMP) procedure. BMP is defined as the capacity of a substrate to be converted into methane and carbon dioxide. Determination of BMP is the first step in evaluating the digestibility or applicability of a substrate. The BMP parameter provides valuable information about general degradability, expectable energy yield, and the economic evaluation of new biogas plants. BMP is usually determined by employing a BMP test procedure in a batch anaerobic fermentation assay. This method is reliable, straightforward, and avoids inconsistencies in collected data [4,5]. The BMP test consists of adding a known quantity of an organic substrate to an active anaerobic inoculum in an air-tight serum bottle [6,7].
BMP optimization is the first step in AcoD optimization. BMP optimization for a substrate mixture is usually conducted based on statistical methods and variables. Substrate ratios and the inoculum/substrate ratio are the experimental factors. However, additional process variables may be included [4,8].
A popular statistical optimization method is response surface methodology (RSM). RSM is a group of mathematical and statistical techniques that identify process improvements based on the fit of empirical models to measured experimental data [9]. A special type of RSM is the mixture design. Mixture design is an effective method for determining the optimal proportions of ingredients in a mixture [10].
In mixture design experiments, the independent variables are the proportions of the investigated components. The total amount of material must be held constant in a mixture design experiment. This allows for analysis of the dependency of the component proportions without confounding variability due to changes in the total amount of the mixture. The mixture design analysis provides valuable information about the interactions between independent factors. It also provides a better understanding of the response variables [11].
Mixture design has been previously used to understand how substrates interact during AcoD. Pagés-Díaz et al. [12] used a four-factor mixture simplex-centroid design, which employed solid cattle slaughterhouse wastes, manure, various crops, and municipal solid wastes. Methane yield (YCH4) and specific methane production rate (rCH4) were the response variables. Rahman et al. [13] used two sets of mixtures. The first set consisted of poultry droppings with sugarcane bagasse. The second set consisted of press mud and poultry droppings with roots, tops, and press mud from sugar beets. An augmented simplex-centroid design was applied to describe the interactions.
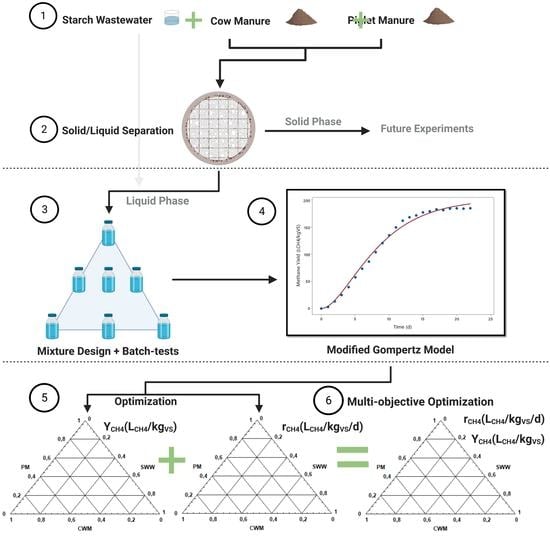
This paper generated experimental data for the integration of high-rate anaerobic reactors in conventional agricultural biogas plants. The objective was to find the optimal mixture composition of three substrates that are usually found in great quantity in the agro-industrial sector, especially in the region of North Rhine-Westphalia (NRW), Germany. A plant’s profitability and flexibility can be improved by using information about the interactions between these substrates. The substrates used in this study were piglet manure (PM), cow manure (CWM), and starch wastewater (SWW). A three-factor mixture design was employed to analyze and describe the interactions between the substrate BMP tests. The BMP tests were only conducted using the liquid fraction of the selected substrates. This was necessary because the study used expanded granular sludge bed (EGSB) reactors which operated in a continuous mode with a dry matter (DM) content of less than 8 wt%.

2. Materials and Methods

2.1. Raw Materials

In this study, the three selected substrates were PM, CWM, SWW. In NRW, animal manure management is a topic of interest due to the large livestock population [14]. PM and CWM were selected to address this issue. Both PM and CWM provide a strong buffer capacity that supports pH balance in the livestock management operation. SWW was selected due to its low DM content. Low DM content avoids clogging in the reactors of a long-term operation. Also, the high content of readily degradable carbohydrates in SWW may increase the biogas yield and the co-digestion degradation rate of the mixture [15]. In Germany, SWW is highly available because it is obtained from crops that have already been treated by AD, including potatoes, corn, and wheat [16].
Previously, PM and CWM were processed using screw press systems that separated the solid and liquid phases. For PM, a dual screw press (i.e., Vakusep from BETEBE GmbH) with a sieve filter size of 100 µm was applied. CWM was collected from farmers in a pre-separated form which was then processed by a second separation using o a screw press with a sieve size of 200 µm.
The liquid fractions of the substrates were used to characterize the content of DM, volatile solids (VS), macromolecules, and nutrients. The results of these analyses are shown in Table 1.

2.2. Batch-Test Setup

Batch assays were conducted on fermentation tests of the organic substances, based on the VDI 4630 guidelines. Each test was performed using a 1000 mL glass vessel. Five grams of VS were added to the vessel of each test. A defined amount of substrate and a previously calculated quantity of inoculum were weighed into the reaction vessel. When necessary, the reaction vessel was carefully filled with warm water to reach a reaction volume of 800 mL. To prevent inhibition, the substrate inoculum rate VSsubstrate/VSinoculum was kept constant at 0.5. Each bottle was vigorously agitated, sealed with a rubber stopper, and clamped down with a plastic screw cap connected to an eudiometer tube (as shown in Figure 1). The produced gases were transferred through PVC hoses into 1000 mL eudiometer tubes. This process enabled daily measurements of gas volume and quality. The eudiometers were sealed with a barrier fluid comprised of water and 5 wt% sulfuric acid. The acidification of the barrier liquid prevented carbon dioxide (CO2) from dissolving in the gas mixture. Additionally, 7.5 wt% sodium sulfate (Na2SO4) was added to prevent the entry of CO2 into the barrier fluid [17]. The batch assays were developed for 42 days.
A test vessel with cellulose as the reference substrate was produced to compare and ensure adequate biological activity by the inoculum. The biogas potential of cellulose is known. Thus, cellulose can be used as a reference for evaluating the reliability of an experiment. Also, an inoculum-only batch fermentation test or zero-test was conducted. In the zero-test, the gas production value from the inoculum was subtracted from the gas production value from the substrate inoculum. Each fermentation test was performed at least three times, including the cellulose reference sample and the zero-test sample [17,18]. The pH was measured at the beginning and the end of every batch-test because changes in pH are usually correlated with other operational parameters. The accumulation of organic acids (acidification) typically lowers the pH, while increased ammonia concentrations or CO2 removal increases the pH [19,20].

2.3. Mathematical Modeling

Prior to modeling the methane yield curves (MYC), pre-processing of the measured data was necessary. The pre-processing of the measured data involved the application of three criteria:
(1)
Stopping criterion: The test was concluded when the relative increase of YCH4 was less than 1% for three consecutive days.
(2)
Plausibility criterion: The existence of abrupt or non-monotonic trends in the curves requires individual analysis of the affected test.
(3)
Reproducibility/accuracy criterion: After deleting possible outliers, a coefficient of variation (CV) smaller than 5% between the curves was required.
If any of the above criteria were not met, the sample from all three batch-tests was eliminated from the study. The three criteria are based on the recommendations by Holliger et al. [18].
For validation, BMP results from the experimental tests were compared to reported BMP values from the literature and calculated theoretical BMP values. The theoretical BMP values and the degradation fraction (fd) values were calculated using the equations from Raposo et al.,Ebner et al. [5,21], shown in Equations (1) and (2), respectively.
BMP theo = 415 · X Carbohydrates + 496 · X Proteins + 1014 · X Lipids
f d = B M P measured / B M P theo
where
  • Xi: fraction of the macromolecule expressed in g of macromolecule per g of total so-lids
  • BMPtheol: theoretical BMP calculated using Equation (1) (LCH4/kgVS)
  • BMPmeasured: measured BMP obtained as a result of the practical tests (LCH4/kgVS)
The most appropriate models to simulate MYCs include quantification of important parameters like maximal YCH4, rCH4, and, if it exists, lag phase time (λ). The most commonly used of these models are the first-order one-step model [6], the first-order two-step model [22] and the modified Gompertz model [12]. All three models were fitted to the measured data. Goodness-of-fit statistics were compared to identify the model with the best fit. The non-linear regression tool of the software Minitab 19 was used to fit the models to the measured data. The root mean square error (RMSE) statistic was used to evaluate goodness-of-fit. An RMSE value less than 10 LCH4/kgVS was designated as an acceptable goodness-of-fit. The first-order one-step model, the first-order two-step model, and the modified Gompertz models are shown in Equation (3), Equation (4), and Equation (5), respectively (Table 2).

2.4. Mixtures Characterization

The synergistic and antagonistic effects of the individual mixtures on the BMP and reaction rate were characterized by two indices: (1) the co-digestion index (CI) (Equation (7)) and (2) the kinetic index (KI) (Equation (8)). In these two equations, the parameter values for the BMP and reaction rates were estimated from the three selected models that describe the MYCs.
B M P a d d i t i v e = i = 1 n ( B M P i · x i )
C I ( % ) = ( B M P f i t t e d B M P a d d i t i v e 1 ) · 100 %
K I ( % ) = ( R max m i x t u r e R max f a s t e s t 1 ) · 100 %
where
  • BMPadditive: Calculated BMP based on substrates individuals BMP (LCH4/kgVS)
  • BMPfitted: Fitted value of BMP during the batch-test by the selected model (LCH4/kgVS)
  • CI (%): Co-digestion index (%)
  • Rmax: Fitted biomethane production rate by the selected model (LCH4/kgVS/d)
  • Rmax fastest: Fitted biomethane production rate of the fastest substrates in the mixture by the selected model (LCH4/kgVS/d)
  • KI (%): Kinetic index (%)
The CI (%) expresses the relative increase in YCH4 compared to the sum of the individual substrates in the mixture. Thus, it detects if the interaction between the substrates is positive or negative. The positive interactions are interpreted as synergistic effects. However, this term should be used with caution since batch-tests are inoculum-biased. Instead, the term “acute effects” is suggested to describe the positive interactions in batch-tests [17,23].
The KI (%) expresses the relative increase in the degradation rate compared to the fastest substrate in the mixture. A positive KI (%) is likely related to an improvement in continuous operation mode [22].

2.5. Experimental Design

A three-factor simplex-centroid mixture design with seven design points was used to evaluate the interaction between the substrates for the response variables. Based on the procedure described in Section 2.2, the seven design points were replicated three times for a total of 21 data points. The response variables were YCH4 and rCH4. The mixture design’s experimental points employed in this study are detailed in Table 3.
The compositions of the mixtures are expressed in VS ratios (% VS) since the total VS in each batch-test was held constant at 5 g to avoid confounding variability from the response variables. Based on Equation (9), each component’s proportion varied between 0 and 1, and the variable xi represents the proportion of ith constituent in the mixture.
i = 1 3 x i = x 1 + x 2 + x 3 = 1
The effect of the mixtures on the response variables was modeled by a special cubic model shown in Equation (10) [10,11,13]:
Y ^ = i = 1 n β i · x i + i = 1 j = 1 n β i j · x i · x j + i = 1 j = 1 k = 1 n β i j k · x i · x j · x k
The βij and βijk coefficient values indicate the strength of the interaction between the substrates. The sign of the βij and βijk coefficients indicates whether the interaction is positive or negative. An ANOVA analysis was used to identify the terms in the model. In an ANOVA analysis, the p-value associated with the statistical confidence level determines if a term should be included in the model [24]. The response optimization method was employed to identify the combination of substrate proportions that simultaneously optimize both responses. A desirability function was applied in the optimization procedure. Desirability is an objective function that ranges from zero outside of the limits to one at the goal. The desirability function approach is one of the most widely used methods for optimizing multiple response processes. This method identifies the operating conditions that provide the most desirable response values given the specified assumptions. The characteristics of a goal may be altered by adjusting the weight or importance of each variable or the ranges within the optimization performance [24].

3. Results

3.1. Analysis of the Curves

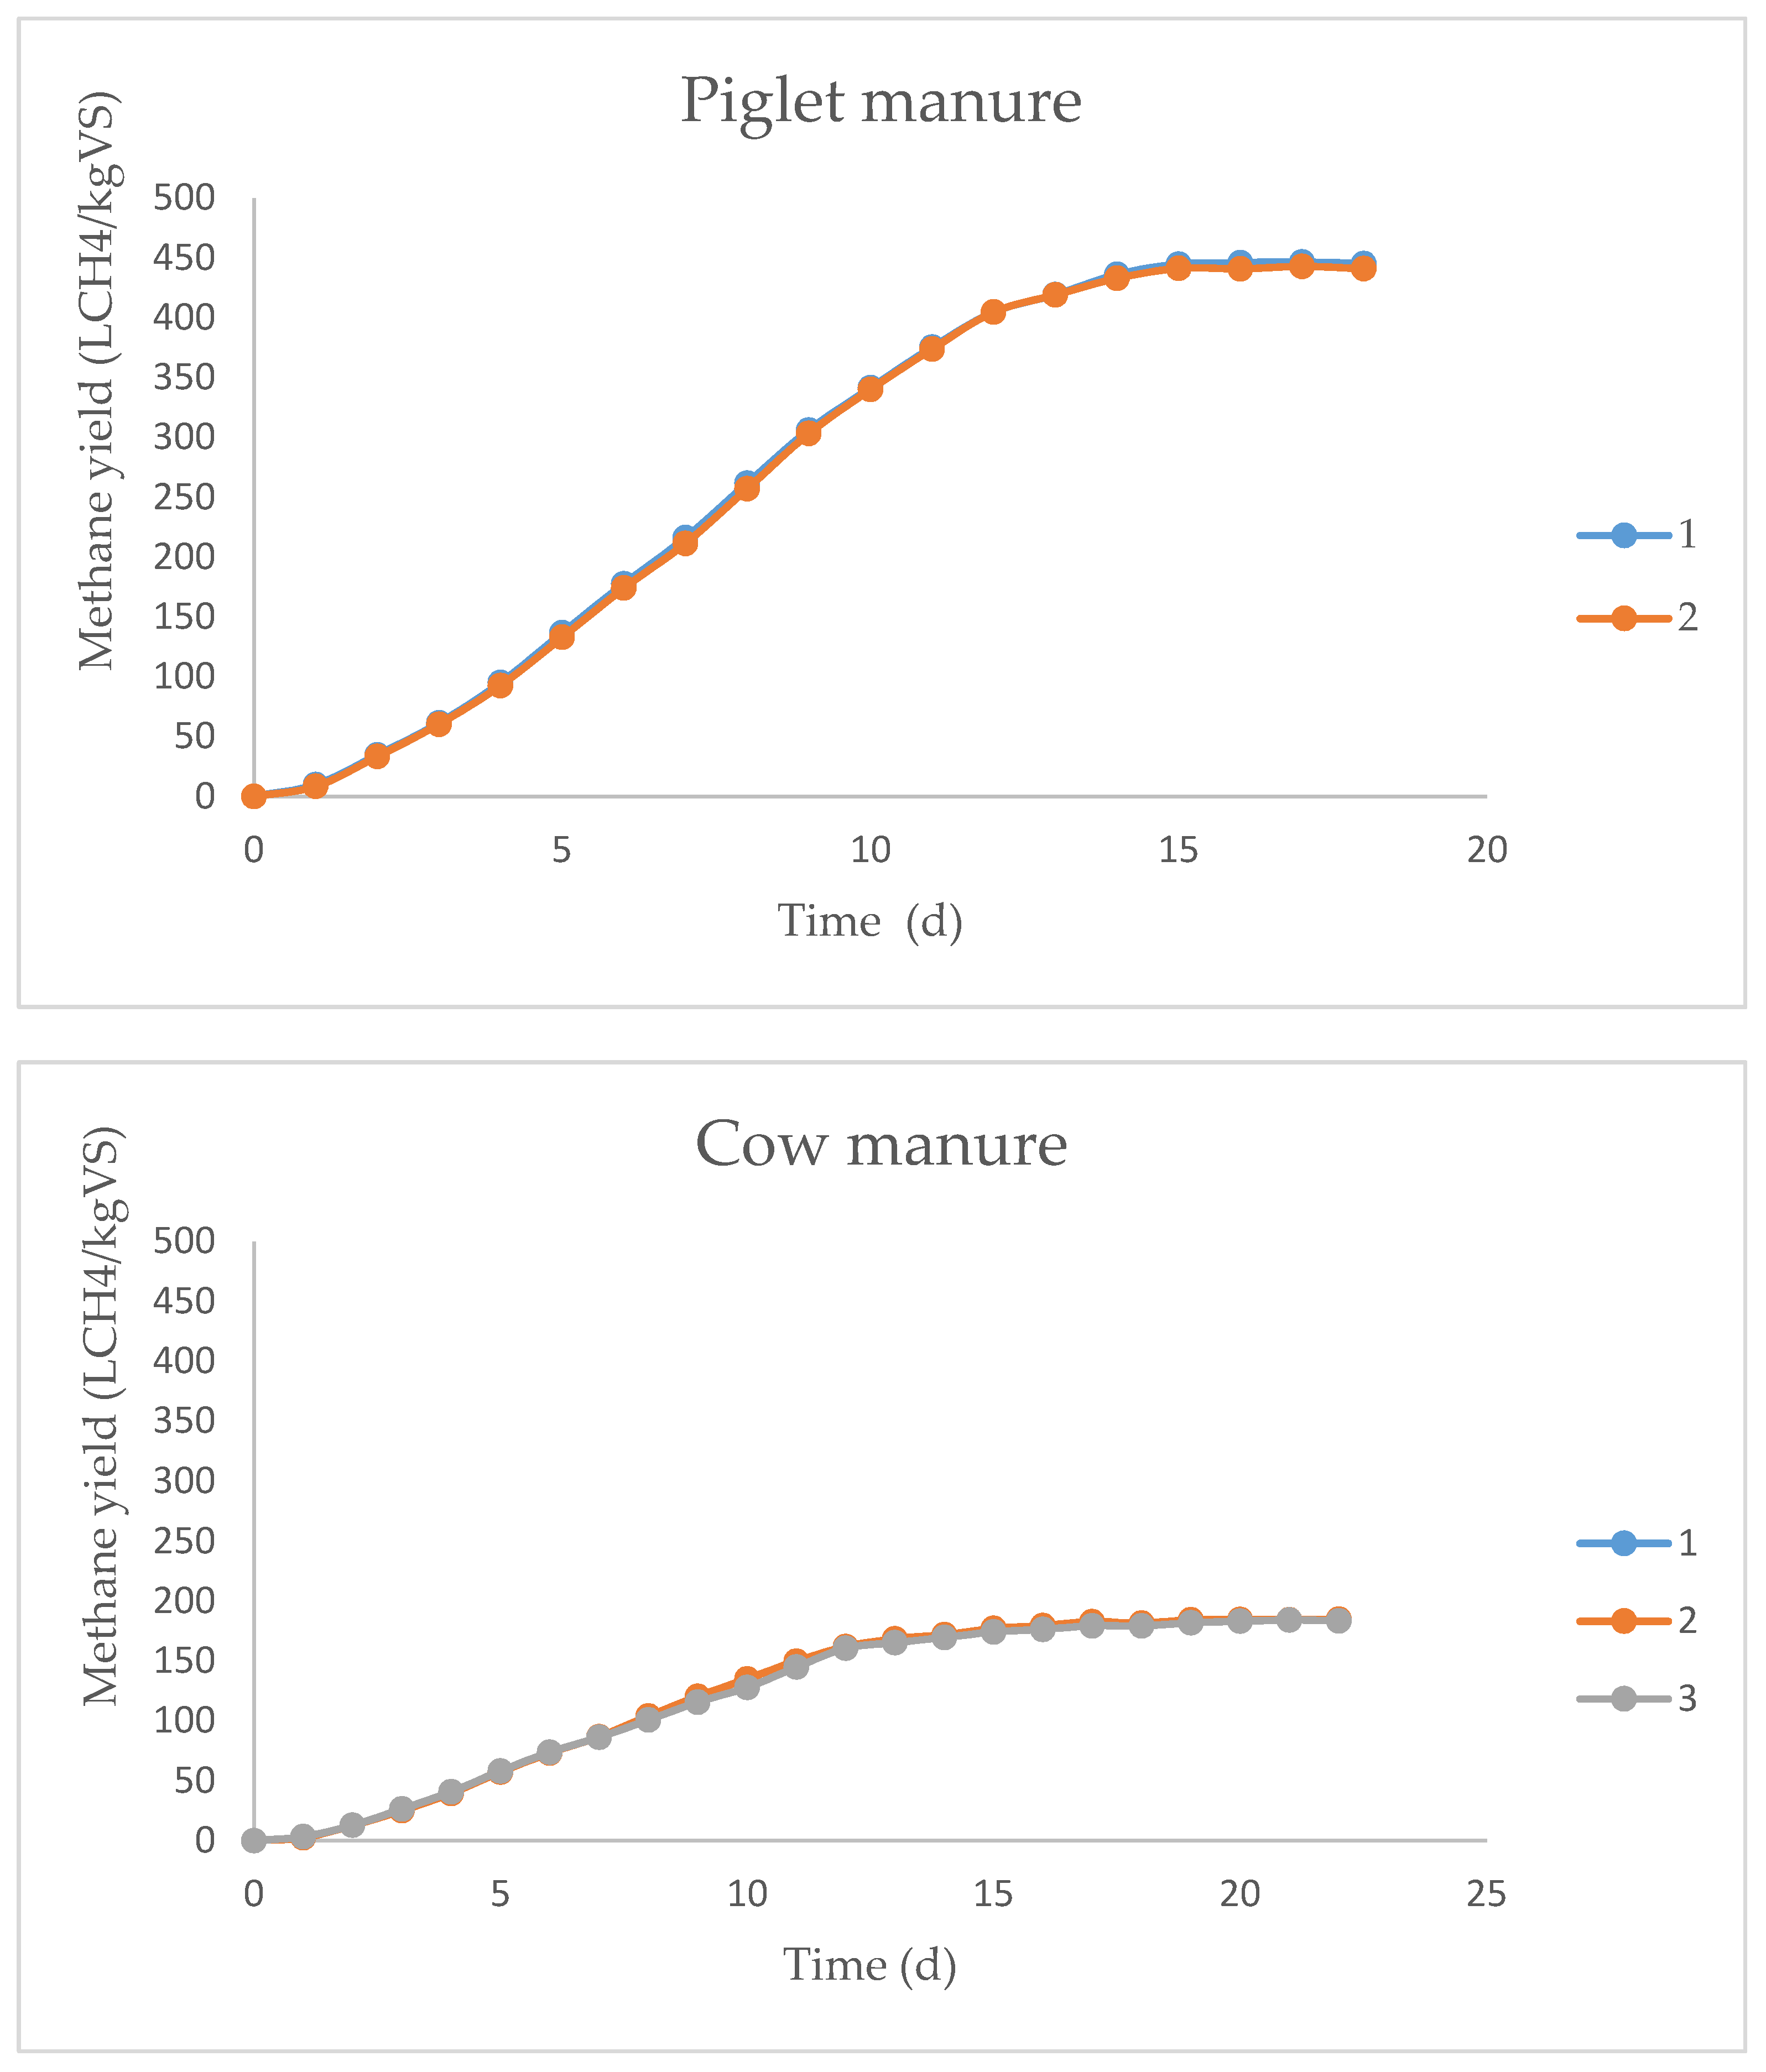
The MYCs were predominantly smooth with a slight leaning toward the logistic growth and signs of small lag phases. Subsequently, the dispersion analysis of the batches identified an outlier in one of the three PM replicate runs. This run was eliminated, to keep a CV of less than 5%. Furthermore, to make symmetrical the mixture experimental design the outlier curve was replaced during the mixture design analysis by the average of the two remaining curves. The rest of the CVs were approximately ≤5%, which is the validation criteria recommended by Holliger et al. [18]. The curves of the single digestions are presented in Figure 2, the numbers in the legend represent the valid number of replicates of each curve.
Both PM and CWM had reasonably small lag phases. This was attributed to the relatively large presence of nitrogen-associated compounds, which are common in these substrates [19]. Nevertheless, the ammonia concentrations were very different from the inhibition values reported by [
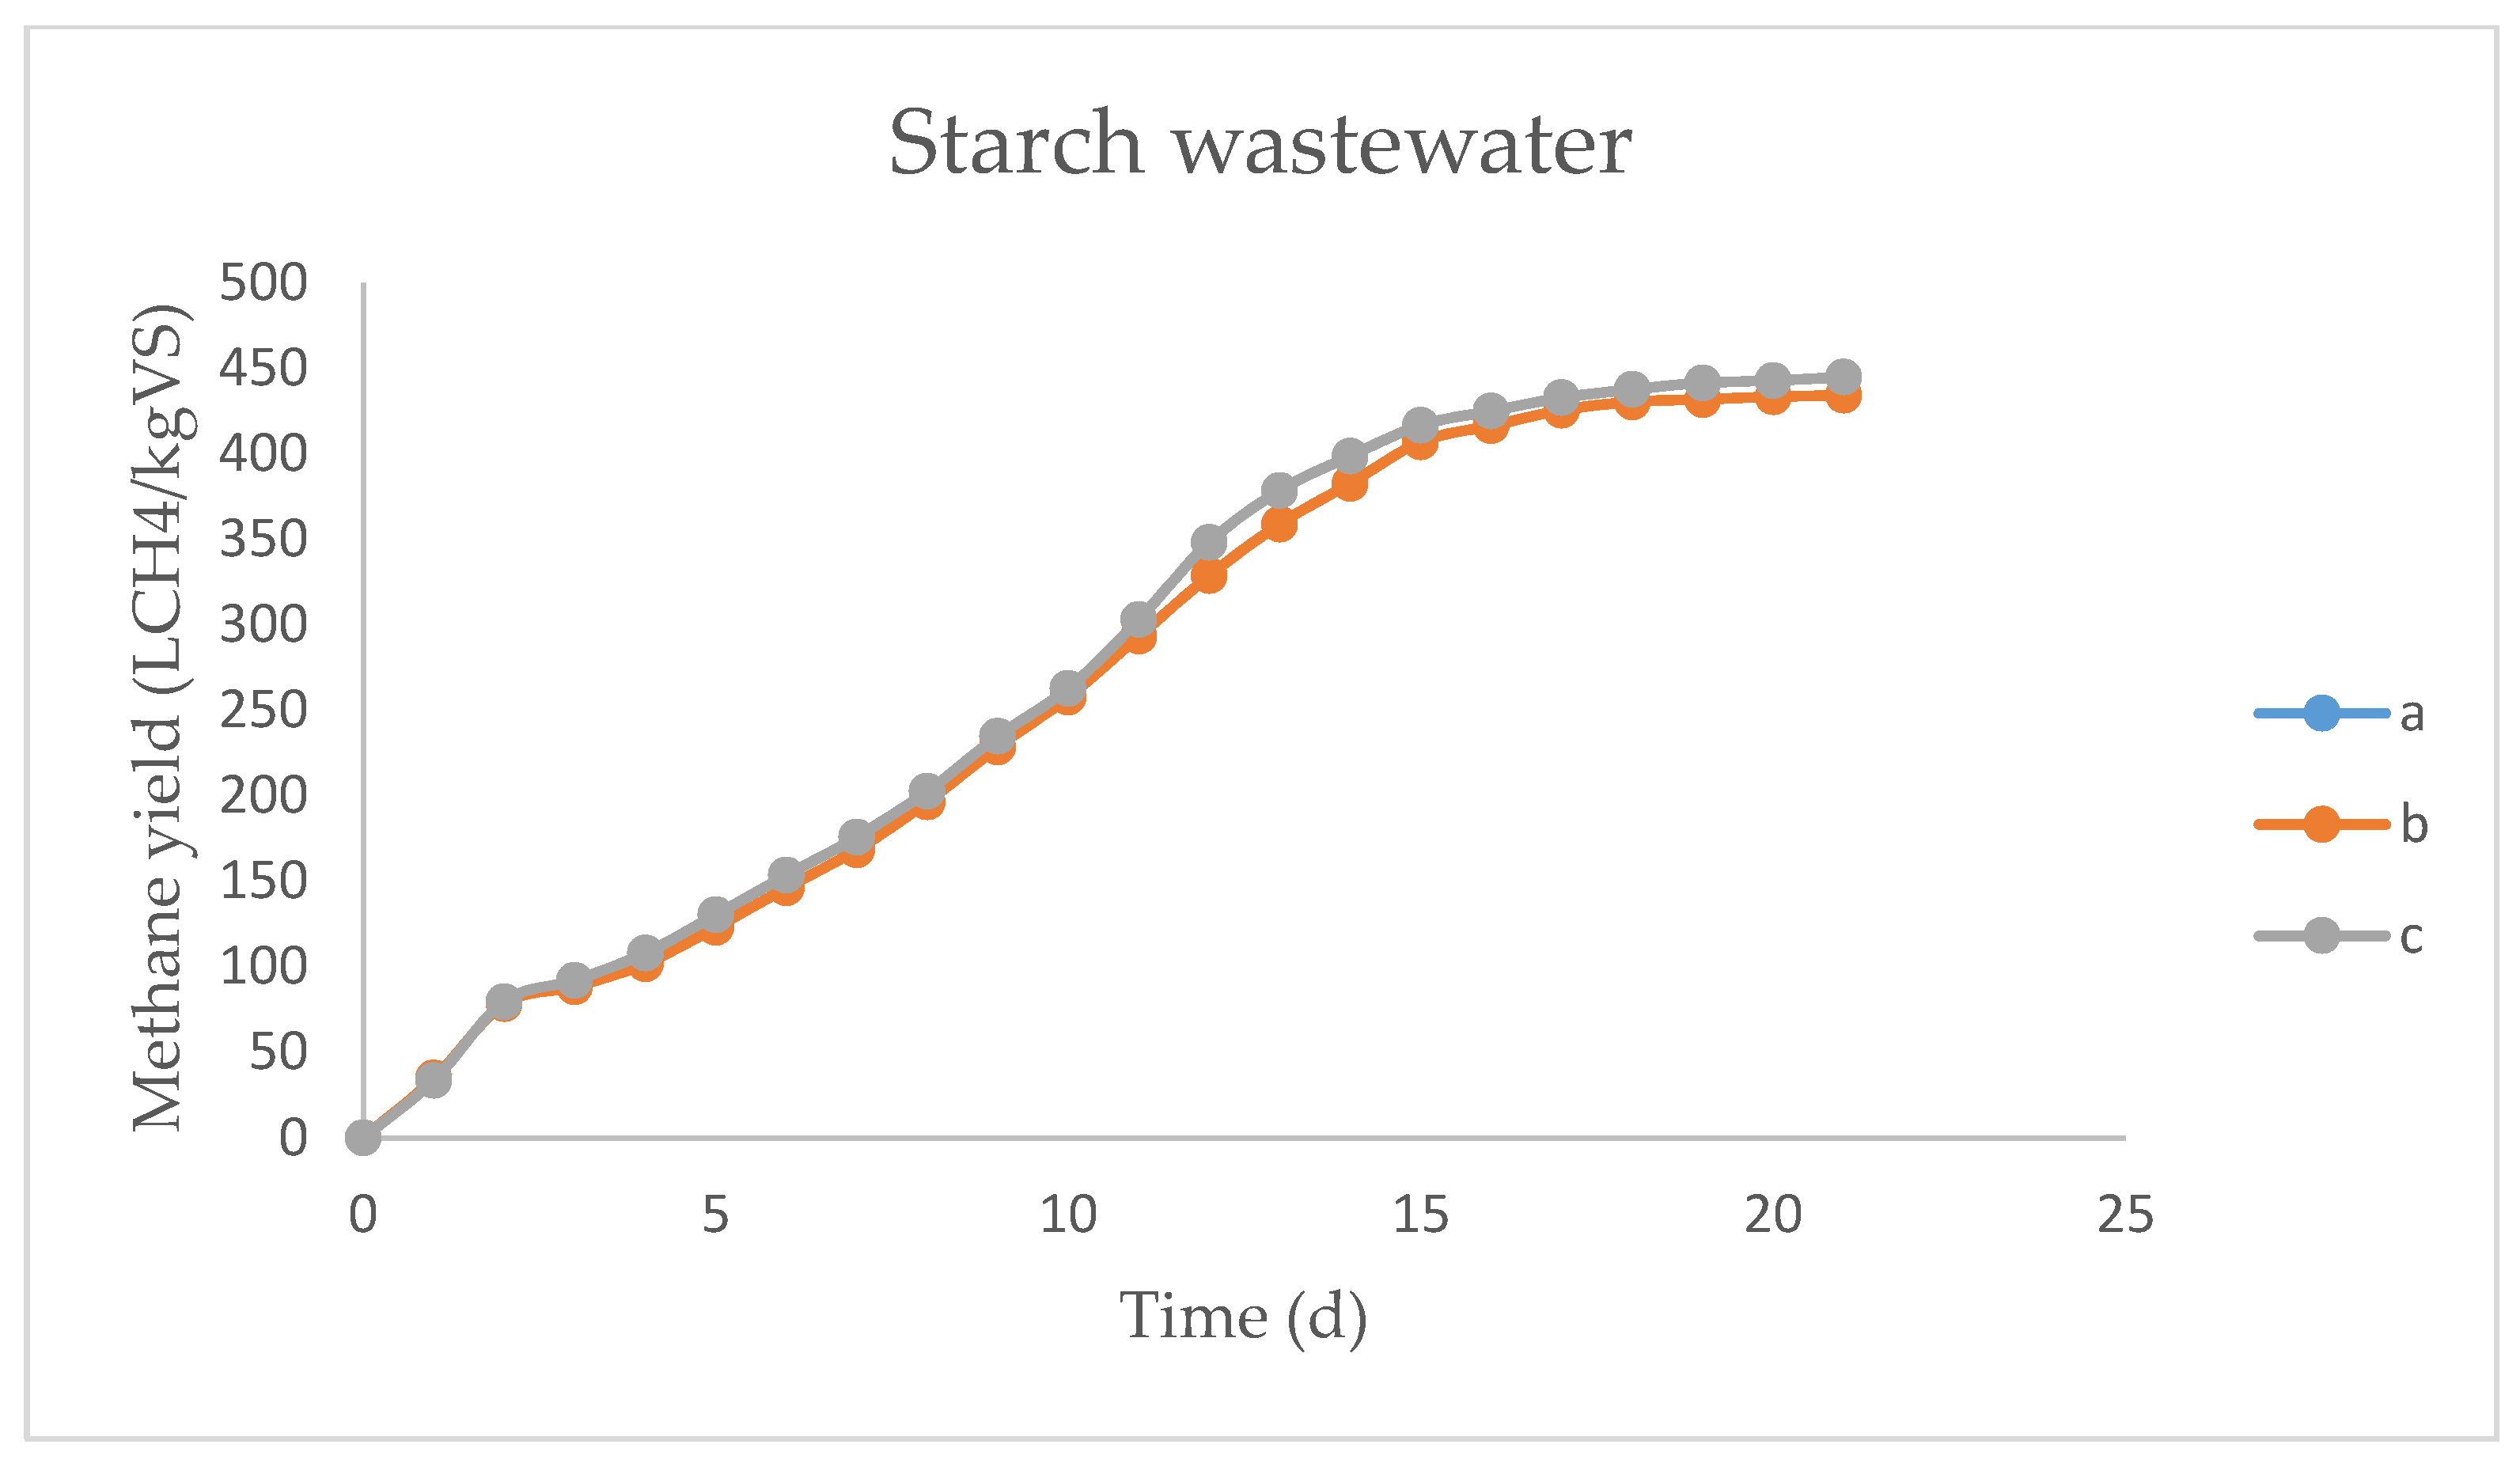
25]. Thus, the lag phases were probably related to an adaptation phase rather than due to inhibition. SWW was the only readily degradable substrate because of the relatively large presence of nitrogen-free extracts. Consequently, no lag phase was detected for SWW. Instead, a sharp change in slope occurred after the second day, indicating slight diauxic behavior. Thus, it was assumed that a second substrate was consumed after the second day. However, no plateau phase was observed, and the MYC was considered monotonic.
The majority of the batch-tests had small lag phases. However, none of the lag phases were long enough to cause inhibition. Similarly, the YCH4 values were compared to the theoretical and literature values (shown in Table 4).
For each substrate, the measured values were smaller than the calculated theoretical values but relatively close to the values reported in the literature. The YCH4 of PM was above the interval reported by the literature. However, it has been reported that different factors like age, sex, type of feeding, and separation processes of the manure can cause significant variations in YCH4 results [26,27,28,29].
The measured YCH4 of CWM was significantly different from the calculated theoretical value, though it was within the interval reported by the literature. Since the three batch-tests behaved similarly with a CV of 2.34%, this finding was attributed to cows being ruminants. Thus, the organic matter was partially degraded before the AD. Furthermore, the presence of microorganisms provided high VS values in the analysis of the macromolecules. The VS were not available for the production of biogas. However, VS are included in the calculation of the BMPtheo in Equation (1).
The fd was approximately 85% in PM and SWW. This result was expected because the AD occurred in the liquid phase, and no fiber content was measured in the substrates. Thus, hydrolysis was probably not a rate-limiting step. Next, the batch-test data were processed for compatibility with the model fitting procedures.

3.2. Model Fitting

The three models to describe MYCs were fitted to the measured data from the 20 batch-tests, which met the three data pre-processing criteria. Table 5 shows the average RMSE results of the fit for each substrate and mixture. The modified Gompertz model had the best fit in all cases. According to Koch et al. [30], the modified Gompertz model is a better fit when a lag phase is necessary to describe a curve. However, the lag phases detected were rather small.
The fit to the first-order one-step model was not acceptable, based on the RMSE value of 10 LCH4/kgVS. This poor fit is due to small lag phases in all MYCs and hydrolysis being unlikely the rate-limiting step. A similar explanation applies to the poor fit from the first-order two-step model. However, the first-order two-step model accounts for a second degradation constant of VFAs. Thus, the first-order two-step model fit to the MYC was better than the first-order one-step model fit. However, the first-order two-step model did not meet the RMSE criteria for four of the seven substrate or mixture cases. Moreover, the values of the constants were predominantly the same, indicating that the process had only one rate-limiting step.
None of the three models adequately fit the MYCs of the SWW. Thus, a two-substrate model would provide a better fit, despite lacking a visually observed plateau phase in the SWW curve. However, for consistency in the mixture experimental design, all substrates must be described using the same model. Table 6 summarizes the average values from the fitted modified Gompertz model along with the measured pH before and after the AD.
The adjusted lag times were relatively short. The lag times from the samples containing SWW were approximately one day slower than those without it. This was due to better C/N in the mixtures from the supply of carbohydrates readily degraded by the SWW. It was also due to high nitrogen content in substrates, like manures. Also, substrates with an initial pH of ≥8.10 corresponded to a lag phase of at least two days. Substrates with initial pH values < 8.10 had a maximum lag phase of 1.27 days. This drop in performance was associated with a shift in the NH4+-NH3 equilibria. This was because a higher pH moves the equilibria to NH3 production. It was reported that ammonia inhibition is commonly found in protein-rich substrates like the digestions of the manures and their double mixtures [19]. The pH was always in the optimal recommended interval of 7.4 to 7.6 [31] at the end of the AD. This indicated that the manures provided adequate buffer capacity.
Continuous surveying of the operational parameters during the batch-tests was not feasible. However, the measured initial and final pH values combined with the continuous gas production indicate that the process was kept in stable operating conditions.
The adjusted BMP of PM and CWM were smaller than the measured BMP. This was assumed to be due to the cancellation of noise from the measured data by the model, associated with the 10% measurement uncertainty of the eudiometers.

3.3. Mixture Characterization

The mixtures were further analyzed based on the CI and KI parameters, the results are shown in Table 7. No positive interactions were found for either the YCH4 or rCH4 of the double mixtures. However Ebner et al. [21] used CI to characterize nine double mixtures of manure and a second substrate. The CIs ranged from −32% to 21% for a mixture proportion of 70:30% w/w. The mixtures of manures and carbon-rich substrates showed statistically significant positive effects. This was attributed to the buffering of the VFAs by the manure when it is digested together with carbon-rich substrates, as explained in Mata-Alvarez et al. [32]. The mixture from CWM + SWW carries this assertion, since despite having both negative CI and KI, an increase of both the methane yield and the rate were observed when compared to the individual digestion of CWM. This suggests that the augmentation of the design could find optimal double mixtures PM + SWW and CWM + SWW by providing new data and improving the interpolating capacity of the model.
For the triple mixture, both parameters showed a positive effect with a CI value of 32.26% and a KI value of 7.42%. The triple mixture was the only mixture with a pH close to neutral at the beginning and a constructive effect for both CI and KI, which in batch processes benefits the acidogenic microorganisms [31]. Also, Astals et al. [33] found that “mixing a carbohydrate and/or protein source to lipids is a feasible option to reduce long-chain fatty acids (LCFA) inhibition, mainly due to the dilution”. Furthermore, he concluded that AcoD leads to an enhancement of the AD kinetics, but rarely to a methane yield increase. However, in the triple mixture, both are observed. Thus, the superior performance of the triple mixture was attributed to better macro and micronutrient balance.

3.4. Mixture Design

An extra batch-test was manually added to the twenty measured batch-tests. The added test resulted from the average between the two fitted PM curves. Consequently, all substrates had three tests in the mixture design. The response variables were Y C H 4 and r C H 4 and the input data were the parameters resulting from the fitted curves by the modified Gompertz model.
Special cubic models were fit for each variable. Model selection was made using a stepwise procedure with a 90% confidence interval for the parameters. The goodness-of-fit statistics for the models are detailed in Table 8.
The statistics indicated very good goodness-of-fit. Thus, the model was deemed acceptable for prediction purposes. The predicted model equations for the response variables were as follows:
Y ^ C H 4 = 476.27 P M + 187.70 C W M + 506.64 S W W 14.47 P M C W M 210.72 P M S W W 143.61 C W M S W W + 4372.78 P M C W M S W W
r ^ C H 4 = 47.03 P M + 18.63 C M + 32.11 S W W + 6.16 P M C M + 17.39 P M S W W + 13.74 C M S W W + 373.08 P M C M S W W
where
  • PM: Piglet Manure
  • CWM: Cow Manure
  • SWW: Starch Wastewater
The predicted model includes all of the mixtures that participated in the design since all terms were statistically significant in the equations. The response equation for YCH4 indicated a very negative interaction between two double mixtures: (1) PM and SWW and (2) CWM and SWW. A slight negative interaction was observed between PM and CWM. Additionally, the strength of the negative effect in the double mixtures negatively correlated with the protein ratio in the mixture. The triple mixture interaction was very positive, as previously detected in the characterization. Furthermore, Pagés-Díaz et al. [12] found qualitatively similar results having the highest positive effects among triple, while Kashi et al. [24] found the best results in a mixture of four substrates, as well that the mixture was very sensitive to changes in their composition. Moreover, the interactions between the variables in the equation were consistent with the characterization of the mixtures by the KI and CI parameters. Therefore, it served as a practical validation of the model.
The equation that described rCH4 showed positive interactions for all terms. The positive interactions did not necessarily contradict the characterization by KI. Unlike CI, KI only compares the fastest component of the mixture and not the mixture’s predicted rate from the combination of individual substrates. The finding that all rate equation influences are positive is promising for further development in this research area. This finding indicates that it is more likely that the kinetics interaction transfers to the continuous stage rather than to the yield [17,23]. Therefore, the equation for rCH4 provided a better description of the interactions than the equation for KI.
Based on the rCH4 equation, the weakest positive interaction occurred in the PM + CWM mixture. Also, the magnitude of the positive interaction between double mixtures positively correlated with the percentage of readily degradable carbohydrates. It should be noted that the model was calibrated based solely on the seven mixtures but interpolated for the entire VS fraction range of 0 to 1 for each substrate. Thus, the positive interactions in the double mixtures that were outside the range of measured ratios indicated a need to improve the model by recalibration with additional runs.
The multi-objective optimization was performed after the constructed models were validated by acceptable matching with the practical values obtained from the characterization of the curves.

3.5. Optimization

The optimization was conducted with three constraints to treat a significant fraction of the piglet manure and to increase the chance of success in a continuous long-term operation. The three constraints were as follows:
  • Maximize the specific methane production rate;
  • Bound the BMP with a minimum value of 450 LCH4/kgVS;
  • Require a minimal fraction of 0.4 of volatile solids in the piglet manure.
The optimization goal was to detect the optimal region(s) where coupled strong positive kinetics interacted with high YCH4 quantities. The constraint that the minimum VS fraction was at least 0.4 guaranteed that most of the PM was treated due to its low VS content in terms of FM. The CWM content was indirectly restricted by giving a higher weight in the optimization to the rCH4 rather than the YCH4. This was due to the CWM deceleration effect on the degradation. However, it was advantageous to limit the DM content in the subsequent high-rate continuous operation.
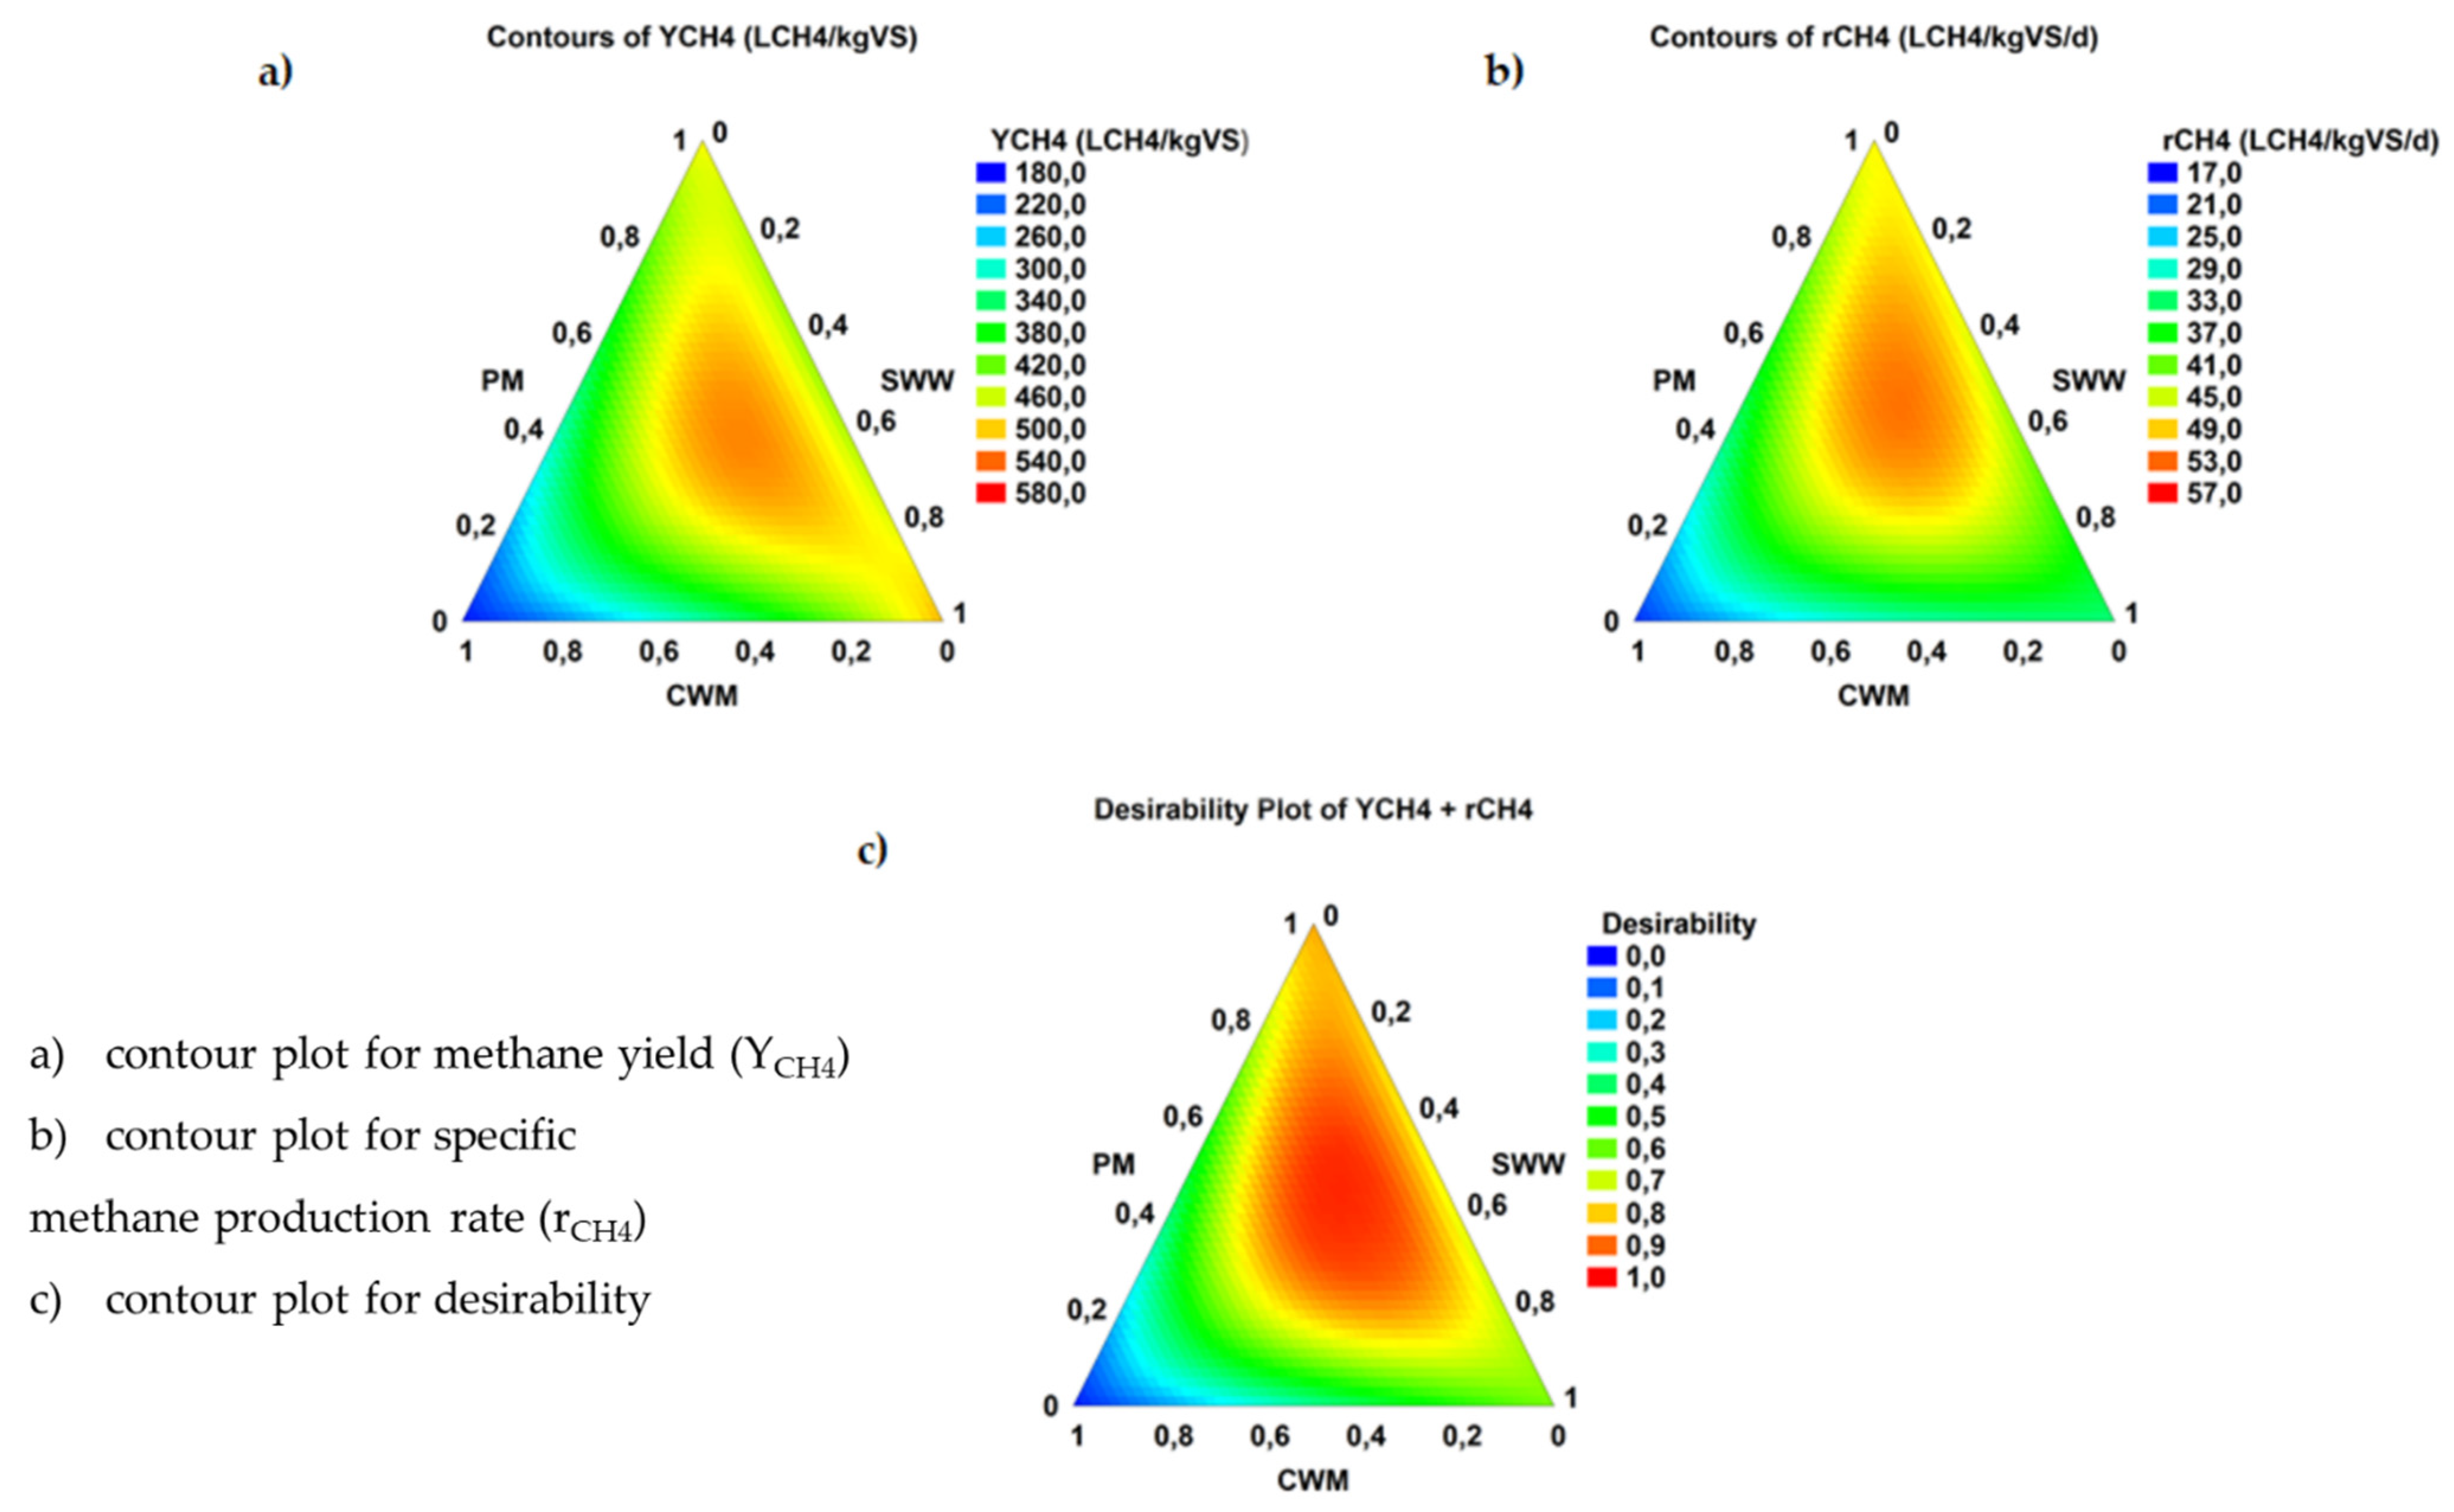
A single common optimal region was found. Contour plots display the optimal region in Figure 3.
The red coloring indicates the most powerful interaction, while blue indicates the least powerful interaction. Figure 3c resulted from the superposition of Figure 3a,b. The rate (Figure 3b) had its maximal values in the region close to the center point of the mixture design. The model predicted a zone of higher rates compared to the center point of the mixture design because it was near the exterior border of the optimal rate region.
The optimal region in the contour plot of YCH4 (Figure 3a) was bigger than the optimal rate region, but both were similarly located. Consequently, the yield region contained most of the rate region. However, the third imposed constraint bounded the optimal range to the section between the PM vertex and its inferior bound on 0.4 PM. This resulted in an optimal area that did not contain most of the high YCH4 area. Nevertheless, the relatively large size of the optimal zone represents a practical advantage since it can provide some resilience to measurement errors in VS content and still be able to operate inside the optimal region.
The three best solutions found in the optimal desirability region are shown in Table 9.
The three optimal solutions were triple mixtures with high predicted values for both CI and KI. In the first two mixtures, at least 71% of the VS in the mixtures were formed by the manures. Consequently, large quantities of manure can be treated by AcoD. Also, due to the buffer capacity of the three mixtures and their low VS values, the mixtures provide an opportunity to reach a stable operation in continuous high-rate reactors. The mixtures are composed of macro and micronutrients that provide high yields. No significant differences were found in the response variables’ values between the three mixtures. This provides practical flexibility for continuous operation since the substrate’s availability is sometimes a limiting factor. [19]. Additionally, other constraints can be imposed to find optimal solutions for the double mixture, but alternative approaches were not investigated in this study.

3.6. Validation of the Models

Two mixtures were selected to validate the models, namely, PM + CWM and PM + CWM + SWW. This allowed evaluation of the effect of adding SWW to a base mixture of PM + CWM. The constraints were as follows:
  • The mixture had to remain within the optimum zone.
  • The PM composition had to be the same in both mixtures.
The validation used fresh substrates that were collected during a different time of year than the substrates used in the modeling. The mixtures selected after optimization are detailed in Table 10.
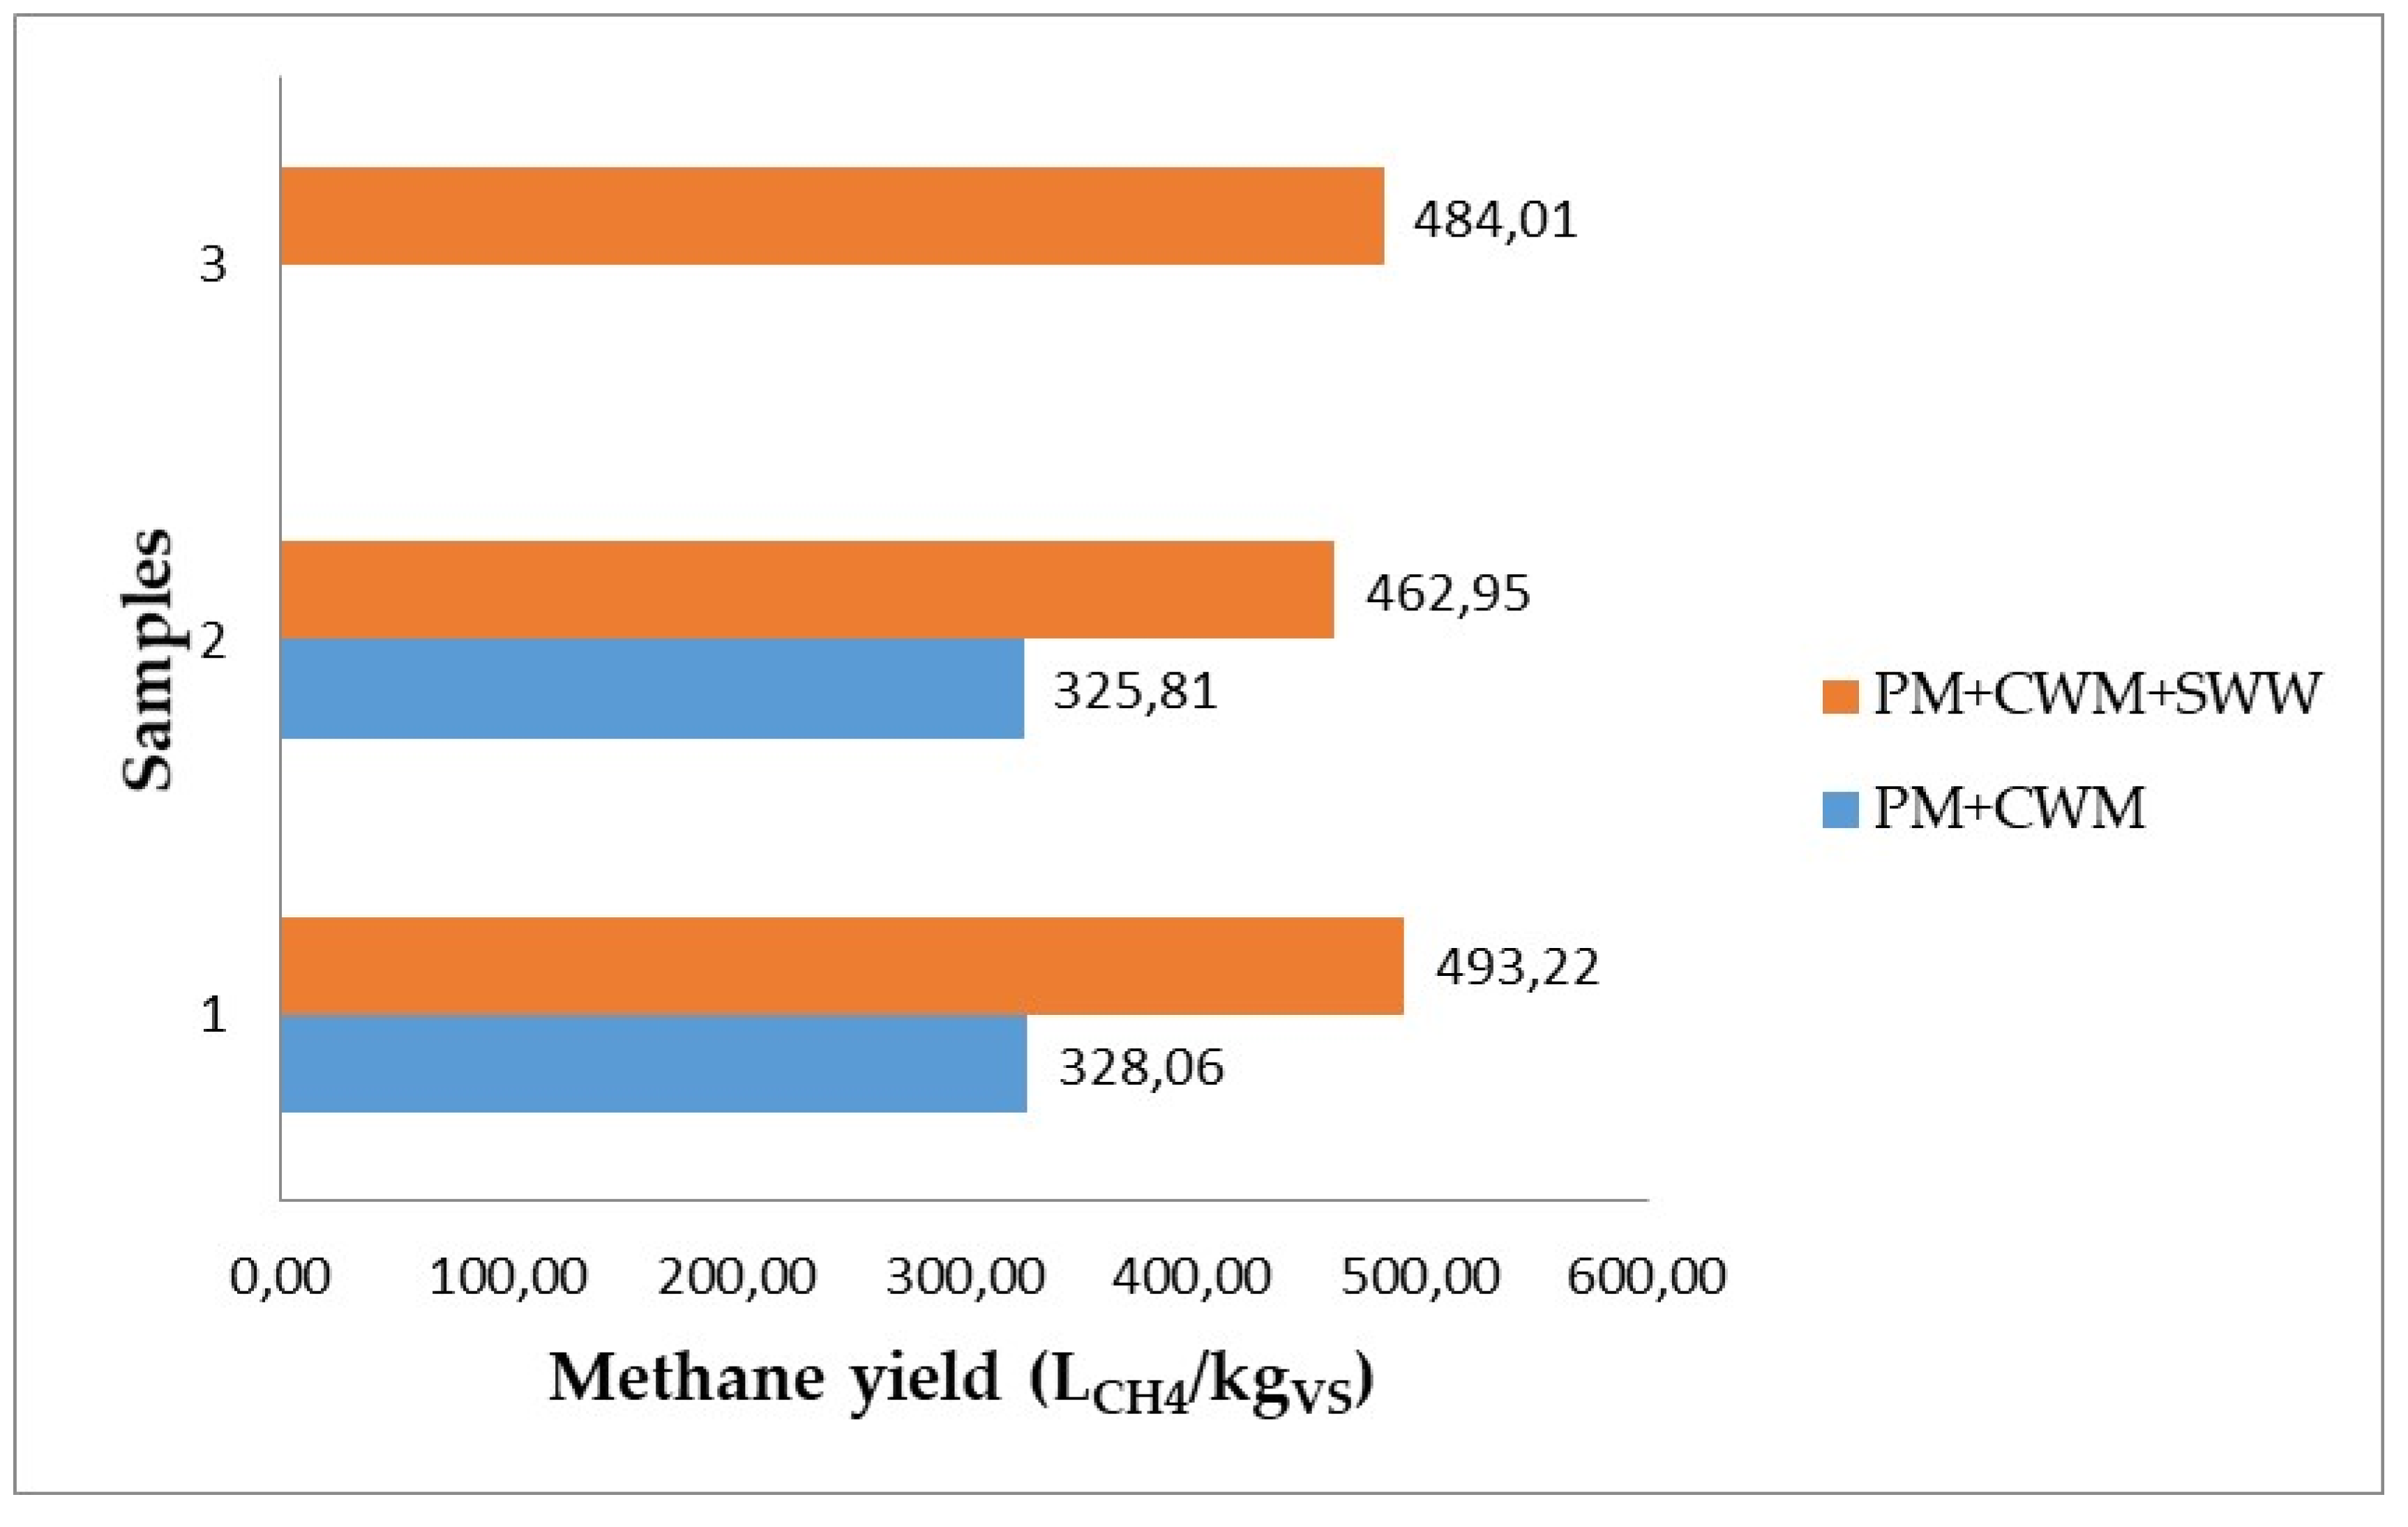
One batch-test from the co-digestion of PM + CWM had to be eliminated to keep the CV value under 5%. Furthermore, the curves showed a smooth trend, and the lag phase was barely noticeable. This is a good sign for the practical application, despite affecting the fit to the modified Gompertz model. Moreover, as predicted by the model, the addition of SWW to the mixture of both manures produced a significant increase in the performance. The comparison of the methane yield of the double and the triple mixture is shown in Figure 4.
The average MYCs were fitted by the modified Gompertz model. The fitted rates were superior to the predicted rates by the resulting mixtures’ design model due to the lack of a lag phase. Thus, an increase in the rate was observed, and the modified Gompertz model was not the best possible fit. However, the modified Gompertz model was employed to establish a direct comparison between the predicted and the measured results from the validation. Still, this model was a good fit with an RMSE value of less than 10 LCH4/kgVS. The results of the predicted and measured values are detailed in Table 11.
The predicted values were used as references in the relative error calculations. The relative errors in YCH4 were relatively small considering the multiple sources of error, including the age of inoculum, differences in the VS content between the substrates used for modeling, and human error in the preparation of the batch-tests.
The relative error for rCH4 in the PM + CWM mixture was quite large, but it was encouraging because the measured value was superior than the predicted one. This occurred because the deceleration of the CWM decreased compared to the CWM used in the model fitting. The average rate of the single digestion of CWM was 22.40 to a previous value of 18.66 LCH4/kgVS/d.
Thus, it was concluded that the models were valid for practical application and can be used for prediction. However, smaller values of YCH4 and larger values of rCH4 should be expected. These two mixtures are currently being continuously tested in two separate high-rate reactors.
The developed mixture design model provided a reliable prediction and description of the interaction of the substrates at a macro scale, although it does not present profound insights into the biochemical interactions of the substrates in the mixture. This issue can be overcome by the development of a more complex mechanistic model. However, it usually requires the estimation of several non-measurable parameters, which is time-consuming and often does not assure the same level of precision as the empirical models.

4. Conclusions

The simultaneous anaerobic digestion of two or more substrates presents the challenge of selecting the correct proportions of substrates in the mixture. Mixture design describes a solid approach to finding the optimal proportions and understanding the interaction between the substrates in a mixture. The statistical models obtained in this experimental design presented physical meaning, also they seemed to describe accurately the constructive and destructive interactions between the substrates observed in the experimental data. The same models predicted the existence of an optimal zone where several triple mixtures presented many advantages for future continuous operation, and this existence was properly validated.
Thus, mixture design is advisable as the first step of a substrate-specific methodology for optimizing and understanding the co-digestion of a specific group of substrates.

Author Contributions

Conceptualization, R.E.H.R. and T.W.; methodology, R.E.H.R. and J.T.; software, R.E.H.R.; validation, R.E.H.R., D.B., J.H. and L.W.; formal analysis, R.E.H.R.; investigation, R.E.H.R.; resources, D.B.; data curation, R.E.H.R.; writing—original draft preparation, R.E.H.R.; writing—review and editing, T.W. and J.T.; visualization, R.E.H.R.; supervision, J.T.; project administration, E.B.; funding acquisition, E.B. All authors have read and agreed to the published version of the manuscript.

Funding

This research was funded under the Bio-Smart Project. The Bio-Smart project is funded by the Federal Ministry of Food and Agriculture based on a resolution of the German Bundestag (project management agency Fachagentur Nachwachsende Rohstoffe e.V. (FNR), FKZ: 22031318).

Informed Consent Statement

Not applicable.

Data Availability Statement

The data presented in this study are available on request from the corresponding author.

Conflicts of Interest

The authors declare no conflict of interest.

References

  1. Treichel, H.; Fongaro, G. Improving Biogas Production: Technological Challenges, Alternative Sources, Future Developments; Springer International Publishing: Cham, Switzerland, 2019; ISBN 9783030105167. [Google Scholar]
  2. Rabii, A.; Aldin, S.; Dahman, Y.; Elbeshbishy, E. A Review on Anaerobic Co-Digestion with a Focus on the Microbial Populations and the Effect of Multi-Stage Digester Configuration. Energies 2019, 12, 1106. [Google Scholar] [CrossRef] [Green Version]
  3. Esposito, G.; Frunzo, L.; Giordano, A.; Liotta, F.; Panico, A.; Pirozzi, F. Anaerobic co-digestion of organic wastes. Rev Environ Sci. Biotechnol. 2012, 11, 325–341. [Google Scholar] [CrossRef]
  4. Pagés-Díaz, J.; Pereda-Reyes, I.; Sanz, J.L.; Lundin, M.; Taherzadeh, M.J.; Horváth, I.S. A comparison of process performance during the anaerobic mono- and co-digestion of slaughterhouse waste through different operational modes. J. Environ. Sci. (China) 2018, 64, 149–156. [Google Scholar] [CrossRef] [PubMed]
  5. Raposo, F.; Fernández-Cegrí, V.; de La Rubia, M.A.; Borja, R.; Béline, F.; Cavinato, C.; Demirer, G.; Fernández, B.; Fernández-Polanco, M.; Frigon, J.C.; et al. Biochemical methane potential (BMP) of solid organic substrates: Evaluation of anaerobic biodegradability using data from an international interlaboratory study. J. Chem. Technol. Biotechnol. 2011, 86, 1088–1098. [Google Scholar] [CrossRef]
  6. Angelidaki, I.; Alves, M.; Bolzonella, D.; Borzacconi, L.; Campos, J.L.; Guwy, A.J.; Kalyuzhnyi, S.; Jenicek, P.; van Lier, J.B. Defining the biomethane potential (BMP) of solid organic wastes and energy crops: A proposed protocol for batch assays. Water Sci. Technol. 2009, 59, 927–934. [Google Scholar] [CrossRef] [PubMed] [Green Version]
  7. Ohemeng-Ntiamoah, J.; Datta, T. Perspectives on variabilities in biomethane potential test parameters and outcomes: A review of studies published between 2007 and 2018. Sci. Total Environ. 2019, 664, 1052–1062. [Google Scholar] [CrossRef] [PubMed]
  8. Xie, S.; Hai, F.I.; Zhan, X.; Guo, W.; Ngo, H.H.; Price, W.E.; Nghiem, L.D. Anaerobic co-digestion: A critical review of mathematical modelling for performance optimization. Bioresour. Technol. 2016, 222, 498–512. [Google Scholar] [CrossRef] [PubMed]
  9. Bezerra, M.A.; Santelli, R.E.; Oliveira, E.P.; Villar, L.S.; Escaleira, L.A. Response surface methodology (RSM) as a tool for optimization in analytical chemistry. Talanta 2008, 76, 965–977. [Google Scholar] [CrossRef]
  10. Buruk Sahin, Y.; Aktar Demirtaş, E.; Burnak, N. Mixture design: A review of recent applications in the food industry. Pamukkale J. Eng. Sci. 2016, 22, 297–304. [Google Scholar] [CrossRef]
  11. Cornell, J.A. Experiments with Mixtures: Designs, Models, and the Analysis of Mixture Data, 3rd ed.; Wiley: New York, NY, USA, 2002; ISBN 9781118150498. [Google Scholar]
  12. Pagés-Díaz, J.; Pereda-Reyes, I.; Taherzadeh, M.J.; Sárvári-Horváth, I.; Lundin, M. Anaerobic co-digestion of solid slaughterhouse wastes with agro-residues: Synergistic and antagonistic interactions determined in batch digestion assays. Chem. Eng. J. 2014, 245, 89–98. [Google Scholar] [CrossRef] [Green Version]
  13. Rahman, M.A.; Saha, C.K.; Ward, A.J.; Møller, H.B.; Alam, M.M. Anaerobic co-digestions of agro-industrial waste blends using mixture design. Biomass Bioenergy 2019, 122, 156–164. [Google Scholar] [CrossRef]
  14. Heinrich-Böll-Stiftung. Fleischatlas 2016-Deutschland Regional|Heinrich-Böll-Stiftung. Available online: https://www.boell.de/de/dossier-zum-fleischatlas-deutschland-regional (accessed on 13 October 2020).
  15. Yu, L.; Wensel, P.C. Mathematical Modeling in Anaerobic Digestion (AD). J. Bioremed. Biodeg. 2013, s4. [Google Scholar] [CrossRef]
  16. Rosenwinkel, K.-H.; Kroiss, H.; Dichtl, N.; Seyfried, C.-F.; Weiland, P. Anaerobtechnik: Abwasser-, Schlamm- und Reststoffbehandlung, Biogasgewinnung; Springer: Berlin/Heidelberg, Germany, 2015; ISBN 9783642248955. [Google Scholar]
  17. Association of German Engineers. Fermentation of Organic Materials-Characterisation of the Substrate, Sampling, Collection of Material Data, Fermentation Tests: VDI 4630; Düsseldorf. 2016. Available online: https://standards.globalspec.com/std/10052171/VDI%204630 (accessed on 13 October 2020).
  18. Holliger, C.; Alves, M.; Andrade, D.; Angelidaki, I.; Astals, S.; Baier, U.; Bougrier, C.; Buffière, P.; Carballa, M.; de Wilde, V.; et al. Towards a standardization of biomethane potential tests. Water Sci. Technol. 2016, 74, 2515–2522. [Google Scholar] [CrossRef] [PubMed]
  19. Kougias, P.G.; Angelidaki, I. Biogas and its opportunities—A review. Front. Environ. Sci. Eng. 2018, 12, 1–12. [Google Scholar] [CrossRef]
  20. Weide, T.; Baquero, C.D.; Schomaker, M.; Brügging, E.; Wetter, C. Effects of enzyme addition on biogas and methane yields in the batch anaerobic digestion of agricultural waste (silage, straw, and animal manure). Biomass Bioenergy 2020, 132, 105442. [Google Scholar] [CrossRef]
  21. Ebner, J.H.; Labatut, R.A.; Lodge, J.S.; Williamson, A.A.; Trabold, T.A. Anaerobic co-digestion of commercial food waste and dairy manure: Characterizing biochemical parameters and synergistic effects. Waste Manag. 2016, 52, 286–294. [Google Scholar] [CrossRef]
  22. Brulé, M.; Oechsner, H.; Jungbluth, T. Exponential model describing methane production kinetics in batch anaerobic digestion: A tool for evaluation of biochemical methane potential assays. Bioprocess Biosyst. Eng. 2014, 37, 1759–1770. [Google Scholar] [CrossRef]
  23. Koch, K.; Hafner, S.D.; Weinrich, S.; Astals, S.; Holliger, C. Power and Limitations of Biochemical Methane Potential (BMP) Tests. Front. Energy Res. 2020, 8. [Google Scholar] [CrossRef]
  24. Kashi, S.; Satari, B.; Lundin, M.; Horváth, I.S.; Othman, M. Application of a mixture design to identify the effects of substrates ratios and interactions on anaerobic co-digestion of municipal sludge, grease trap waste, and meat processing waste. J. Environ. Chem. Eng. 2017, 5, 6156–6164. [Google Scholar] [CrossRef]
  25. Fotidis, I.A.; Karakashev, D.; Kotsopoulos, T.A.; Martzopoulos, G.G.; Angelidaki, I. Effect of ammonium and acetate on methanogenic pathway and methanogenic community composition. FEMS Microbiol. Ecol. 2013, 83, 38–48. [Google Scholar] [CrossRef] [Green Version]
  26. Cu, T.T.T.; Nguyen, T.X.; Triolo, J.M.; Pedersen, L.; Le, V.D.; Le, P.D.; Sommer, S.G. Biogas production from vietnamese animal manure, plant residues and organic waste: Influence of biomass composition on methane yield. Asian-Australas J. Anim. Sci. 2015, 28, 280–289. [Google Scholar] [CrossRef] [Green Version]
  27. Triolo, J.M.; Ward, A.J.; Pedersen, L.; Sommer, S.G. Characteristics of Animal Slurry as a Key Biomass for Biogas Production in Denmark. In Biomass Now; Matovic, M.D., Ed.; InTech: Rijeka, Croatia, 2013; ISBN 978-953-51-1105-4. [Google Scholar]
  28. Kouas, M.; Torrijos, M.; Sousbie, P.; Steyer, J.-P.; Sayadi, S.; Harmand, J. Robust assessment of both biochemical methane potential and degradation kinetics of solid residues in successive batches. Waste Manag. 2017, 70, 59–70. [Google Scholar] [CrossRef] [PubMed]
  29. Garcia, N.H.; Mattioli, A.; Gil, A.; Frison, N.; Battista, F.; Bolzonella, D. Evaluation of the methane potential of different agricultural and food processing substrates for improved biogas production in rural areas. Renew. Sustain. Energy Rev. 2019, 112, 1–10. [Google Scholar] [CrossRef]
  30. Koch, K.; Hafner, S.D.; Weinrich, S.; Astals, S. Identification of Critical Problems in Biochemical Methane Potential (BMP) Tests From Methane Production Curves. Front. Environ. Sci. 2019, 7. [Google Scholar] [CrossRef]
  31. Khanal, S.K. Anaerobic Biotechnology for Bioenergy Production: Principles and Applications; Wiley-Blackwell: Ames, Iowa, 2008. [Google Scholar]
  32. Mata-Alvarez, J.; Dosta, J.; Macé, S.; Astals, S. Codigestion of solid wastes: A review of its uses and perspectives including modeling. Crit. Rev. Biotechnol. 2011, 31, 99–111. [Google Scholar] [CrossRef]
  33. Astals, S.; Batstone, D.J.; Mata-Alvarez, J.; Jensen, P.D. Identification of synergistic impacts during anaerobic co-digestion of organic wastes. Bioresour. Technol. 2014, 169, 421–427. [Google Scholar] [CrossRef] [Green Version]
Figure 1. The schematic diagram of the test stands.
Processes 09 00877 g001
Figure 2. Single degradations of piglet manure, cow manure, and starch wastewater.
Processes 09 00877 g002aProcesses 09 00877 g002b
Figure 3. Contour plots of the optimal region for piglet manure (PM), cow manure (CWM), and starch wastewater (SWW).
Processes 09 00877 g003
Figure 4. Comparison of the methane yields of the mixtures employed in the validation. PM: piglet manure; CWM: cow manure; SWW: starch wastewater.
Processes 09 00877 g004
Table 1. Characterization of the liquid fraction of the substrates.
VariablePiglet ManureCow ManureStarch Wastewater
DM/FM (wt%)1.805.301.70
VS/DM (wt%)58.3369.8182.35
VS/FM (wt%)1.053.701.40
Crude protein/FM (wt%)0.802.600.40
Crude fat/FM (wt%)0.250.300.20
Crude fiber/FM (wt%)0.000.000.00
Free nitrogen extracts/FM (wt%)0.000.800.80
ash/FM (wt%)0.751.600.30
Total nitrogen/FM (wt%)0.360.360.07
Ammonium nitrogen /FM (wt%)0.290.190.01
DM: dry matter; VS: volatile solids; FM: fresh matter.
Table 2. Models employed to describe the methane yield curves.
ModelEquationReference
First-order one-step B M P ( t ) = B M P · ( 1 e k · t ) (3)[6]
First-order two-step B M P ( t ) = B M P · ( 1 + k v f a · e k h y d · t k h y d · e k v f a · t k h y d k v f a ) (4)[22]
Modified Gompertz B M P ( t ) = B M P · e e · ( R max B M P · ( λ t ) + 1 ) (5)[12]
BMP: Extrapolated BMP at infinite retention time in LCH4/kgVS. k: First-order reaction constant (1/d). khyd: First-order reaction constant of the first step (hydrolysis/acidification) (1/d). kvfa: First-order reaction constant of the second step (volatile fatty acids degradation) (1/d). Rmax: Maximum biomethane production rate (LCH4/kgVS/d). λ: Lag time (d). t: Time (d).
Table 3. Summary of the experimental design points.
MixtureNumberRatio (% VS)
Pure component3100%
Double mixture350% + 50%
Triple mixture133% + 33% + 33%
VS: volatile solids.
Table 4. Validation through literature and theoretical values of the measured methane yield values.
SubstratesTheoretical Methane Yield (LCH4/kgVS)Measured Methane Yield (LCH4/kgVS)Degradation Fraction (%)Literature Methane Yield (LCH4/kgVS)
Piglet manure (PM)577.79489.984.79[400–443.60] [26,27]
Cow manure (CWM)520.49190.1236.53[175–212.00] [28,29]
Starch wastewater (SWW)523.71456.1587.1466.87 (from previous laboratory experiments)
Table 5. The root mean square error (RMSE) for each model by substrate and mixture.
RMSE (LCH4/kgVS)Modified Gompertz ModelFirst-Order One-Step ModelFirst-Order Two Steps Model
Substrates
PM8.2932.3915.68
CWM2.8713.485.98
SWW16.2023.3821.44
PM: piglet manure; CWM: cow manure; SWW: starch wastewater; RMSE: root mean square error
Table 6. Modified Gompertz model fitting summary.
SubstrateMaximum Specific Methane Production (LCH4/kgVS)Specific Methane Production Rate (LCH4/kgVS/d)Lag Time (d)pH at the BeginningpH at the End
PM476.3847.052.198.267.55
CWM187.8118.662.098.107.36
SWW506.7532.131.068.057.43
PM + CWM328.4834.392.278.307.48
PM + SWW438.6743.910.957.887.48
CWM + SWW311.1628.800.988.027.45
PM + CWM + SWW511.0750.541.277.157.52
PM: piglet manure; CWM: cow manure; SWW: starch wastewater.
Table 7. Comparison of the constructive/destructive effects of the mixtures.
Type of MixtureMixtureCo-Digestion Index CI (%)Kinetic Index KI (%)Prot/VS (%)Fat/VS (%)FNE/VS (%)
Double mixturePM + SWW−10.76−6.680.490.180.33
Double mixtureCWM + SWW−10.40−10.320.470.280.25
Double mixturePM + CWM−1.09−26.890.730.100.17
Triple mixturePM + CWM + SWW32.267.420.620.120.26
Double mixturePM + SWW−10.76−6.680.490.180.33
Double mixtureCWM + SWW−10.40−10.320.470.280.25
Double mixturePM + CWM−1.09−26.890.730.100.17
PM: Piglet Manure; CWM: Cow manure; SWW: Starch Wastewater; VS: Volatile Solids; Prot: crude Protein; Fat: crude Fat; FNE: Free Nitrogen Extracts.
Table 8. Goodness-of-fit statistics for the special cubic models by response variable.
VariableR2Adjusted R2Predicted R2
Methane yield (LCH4/kgVS)0.990.990.99
Specific methane production rate (LCH4/kgVS/d)0.970.960.93
Table 9. Goodness-of-fit statistics for the special cubic models by response variable.
NumberPMCWMSWWMethane Yield (LCH4/kgVS)Specific Methane Production Rate (LCH4/kgVS/d)Desirability
10.530.200.27513.0751.930.91
20.400.310.29513.0351.290.89
30.400.140.46513.0550.160.86
PM: Piglet Manure; CWM: Cow Manure; SWW: Starch Wastewater.
Table 10. Mixtures selected after Optimization.
%Volatile Solids MixturePiglet ManureCow ManureStarch Wastewater
10.530.200.27
20.400.310.29
30.400.140.46
Table 11. Mixtures selected after Optimization.
MixturesObtained YCH4 (LCH4/kgVS)Predicted YCH4 (LCH4/kgVS)Obtained rCH4 (LCH4/kgVS/d)Predicted rCH4 (LCH4/kgVS/d)Relative Error YCH4 (%)Relative Error rCH4 (%)
PM + CWM326.94342.8345.5835.774.64−27.41
PM + CWM + SWW480.54534.2154.5951.710.05−5.59
PM: piglet manure; CWM: cow manure; SWW: starch wastewater; YCH4: methane yield (LCH4/kgVS); rCH4: Specific methane production rate.
Publisher’s Note: MDPI stays neutral with regard to jurisdictional claims in published maps and institutional affiliations.

