Article

Independent Variation of Reynolds Number, Wall Shear Stress and Flow Velocity for Cleaning Experiments: A Geometrically Flexible Parallel Plate Flow Cell

by
Lakshmi Narasiman Vijayasarathi
,
Bernhard Spies
,
Daniel Schiochet Nasato
,
Heiko Briesen
and
Petra Foerst
*
Chair of Process Systems Engineering, Technical University of Munich, 85354 Freising, Germany
*
Author to whom correspondence should be addressed.
Submission received: 19 April 2021 / Revised: 5 May 2021 / Accepted: 14 May 2021 / Published: 18 May 2021

Abstract

:
For a long time, determining the factors influencing the cleaning of technical surfaces in the food and beverage industry has been of significant interest. In this study, an innovative test setup with a newly designed parallel plate flow cell was implemented to assess the cleaning of soluble molecular fouling materials, which allows for the independent variation of flow parameters, such as the Reynolds number, velocity, and wall shear stress. The test setup used fluorescence spectroscopy; it was found to produce reliable measurements of cleaning, and the results were confirmed with the help of another fluorescent tracer. A comparison of cleaning times for both equipment revealed that the cleaning times tend to have a geometrically independent power-law relationship with the wall shear stress and velocity, and they were used to directly correlate the cleaning times of the used soluble fouling material. However, the Reynolds number showed a geometric dependence on cleaning times. Nevertheless, on dividing the Reynolds number with respective channel characteristic lengths, geometric independence was observed, and, therefore, a correlation was obtained. We also suggest that complex fouling materials should still be investigated to elucidate their cleaning mechanisms better and test for parameter influences on complex cleaning mechanisms.

1. Introduction

Cleaning in food industries is an essential process during food production and handling in all food-processing plants. Reliable and efficient cleaning must be ensured to meet the hygienic standards and expectations of end consumers. Inadequate cleaning poses health risks to consumers. In addition, cleaning is a complex process, involving more than one type of mechanism to remove fouling materials; therefore, its validation is complex, and cleaning processes are rarely optimized [1]. The interaction of the fouling material with water is vital given that water is the most widely used cleaning medium. Consequently, fouling materials are classified into soluble, swellable, emulsifiable, and particulate [1,2]. Different types of fouling models are employed to perform cleaning tests. Examples of widely used soluble fouling materials are malt extract, tomato paste, and riboflavin. This is because these fouling materials can spread evenly over a wide surface and form crack-free surface upon drying, thereby yielding high reproducibility. Riboflavin is easily detectable because of its self-fluorescence and capability to detect other fouling materials such as tomato paste and malt extract. The use of a fluorescent or a photoluminescent tracer is usually employed to detect removal and determine the progress of cleaning [3,4,5,6,7]. Fluorescence spectroscopy is used in various disciplines [8,9] and can be easily integrated into a closed cleaning unit such as flow cells. Parallel plate flow cells (PPFC) are used in performing cleaning experiments because of their simple geometry and easily reproducible well-developed flow. Researchers have employed PPFCs in cleaning experiments, such as the detection of microbial adhesion [10,11,12], as well as for comparison of cleaning behaviors of various food biopolymers [13].
In a previous research [13], quantification of cleaning with the help of fluorescence spectroscopy and a PPFC is shown, along with a comparison of cleaning behaviors of different fouling materials, but no work exists in the literature to show the comparison of cleaning by independent variation of flow parameters. This is because such a variation requires geometric flexibility in PPFC. The current study develops a PPFC with geometric flexibility to independently vary flow parameters—velocity, Reynolds number, and wall shear stress—to determine the parameter influences on the cleaning of soluble fouling materials and determine whether these experimental results could be used to correlate the cleaning times.

2. Materials and Methods

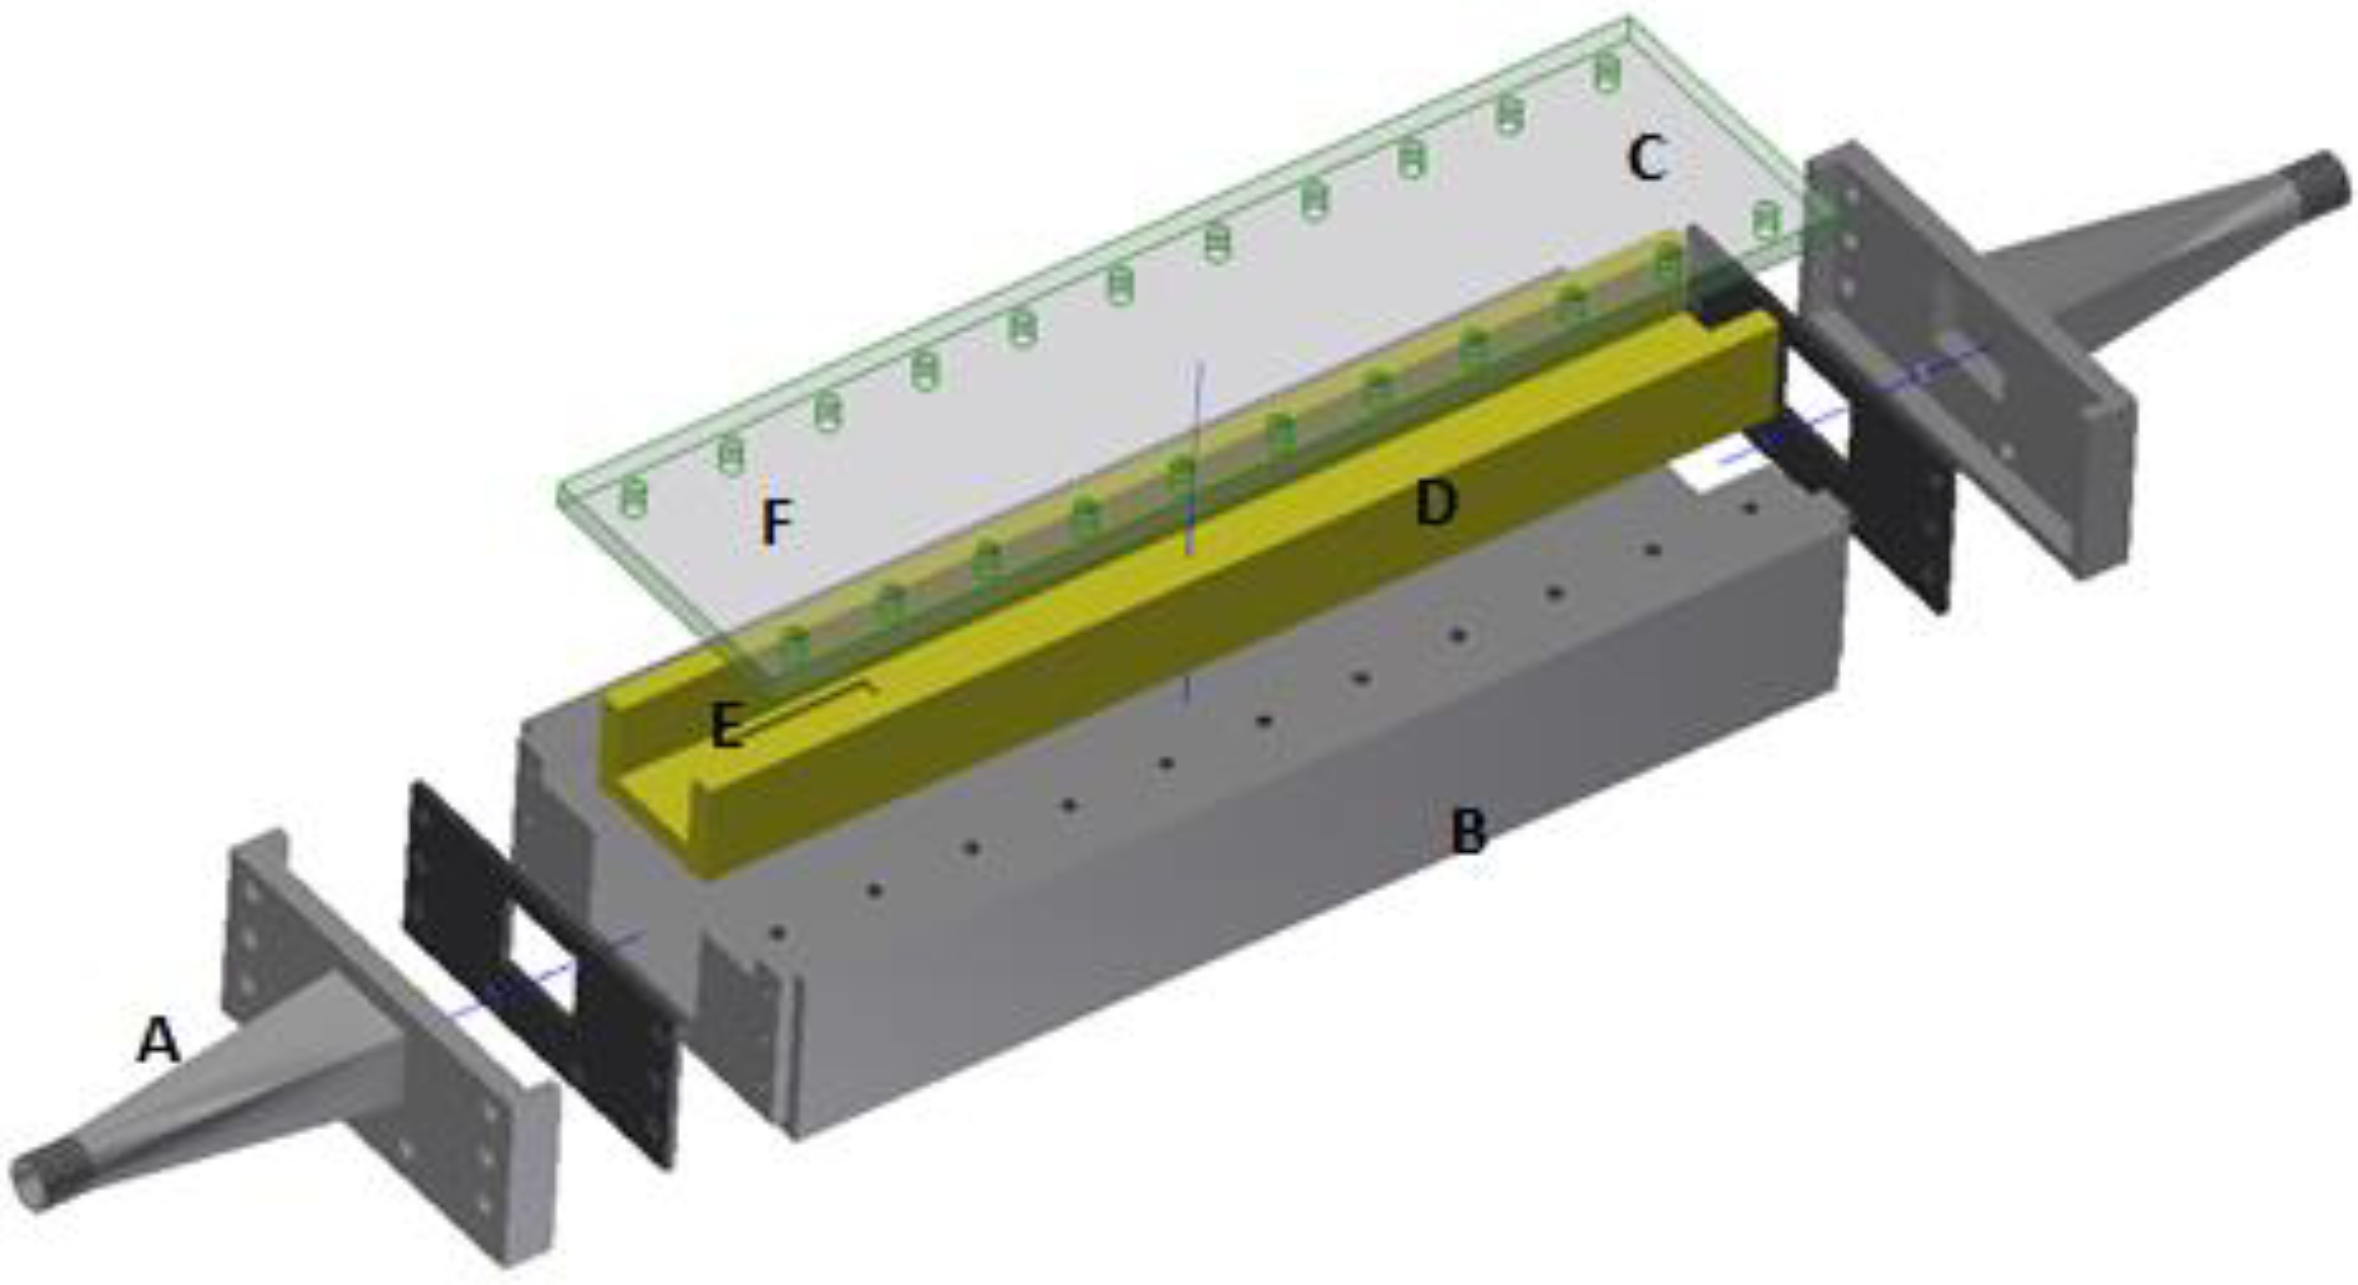
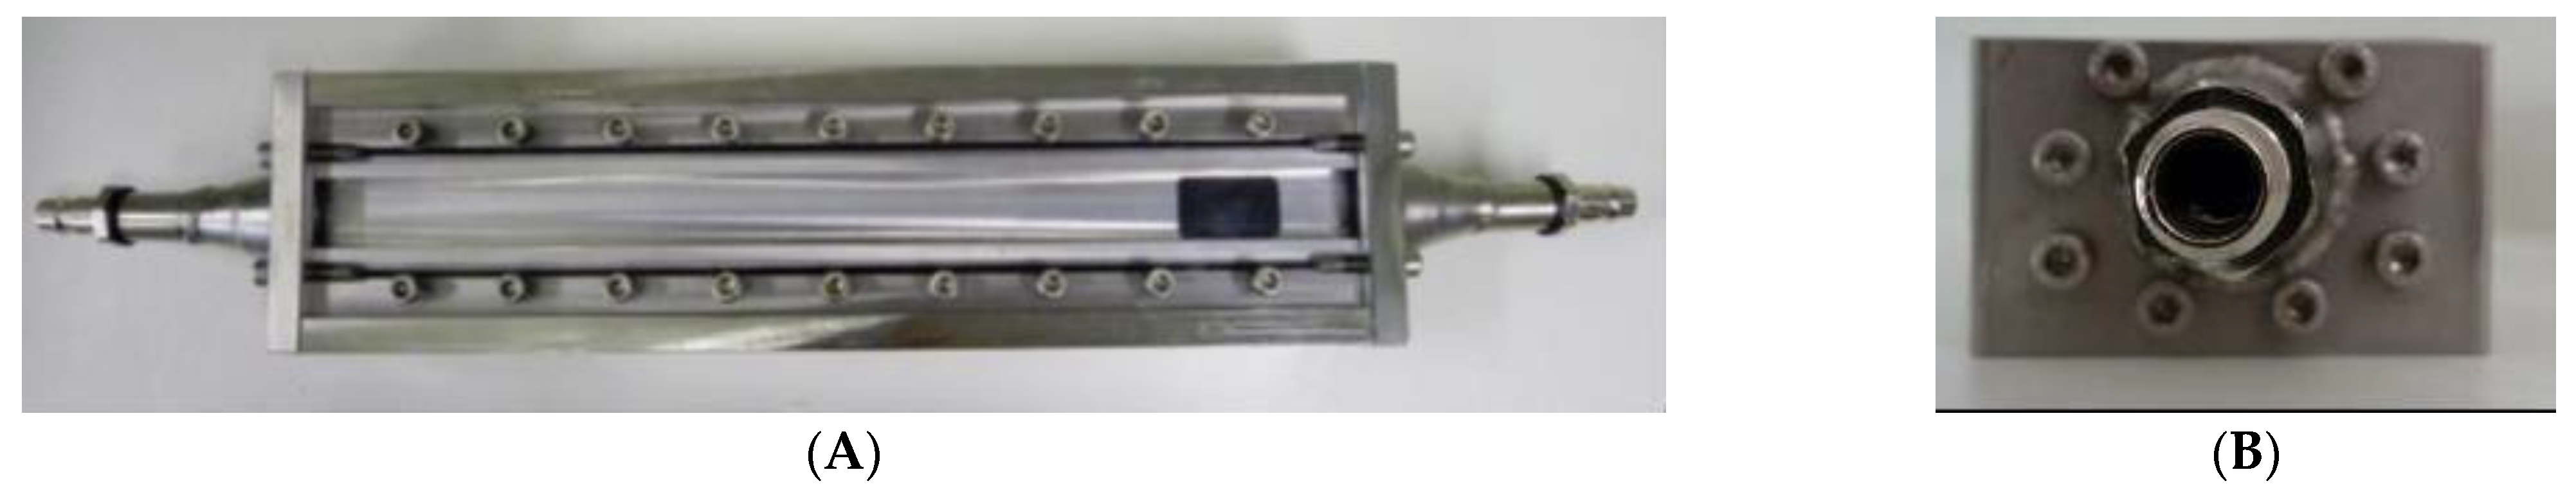
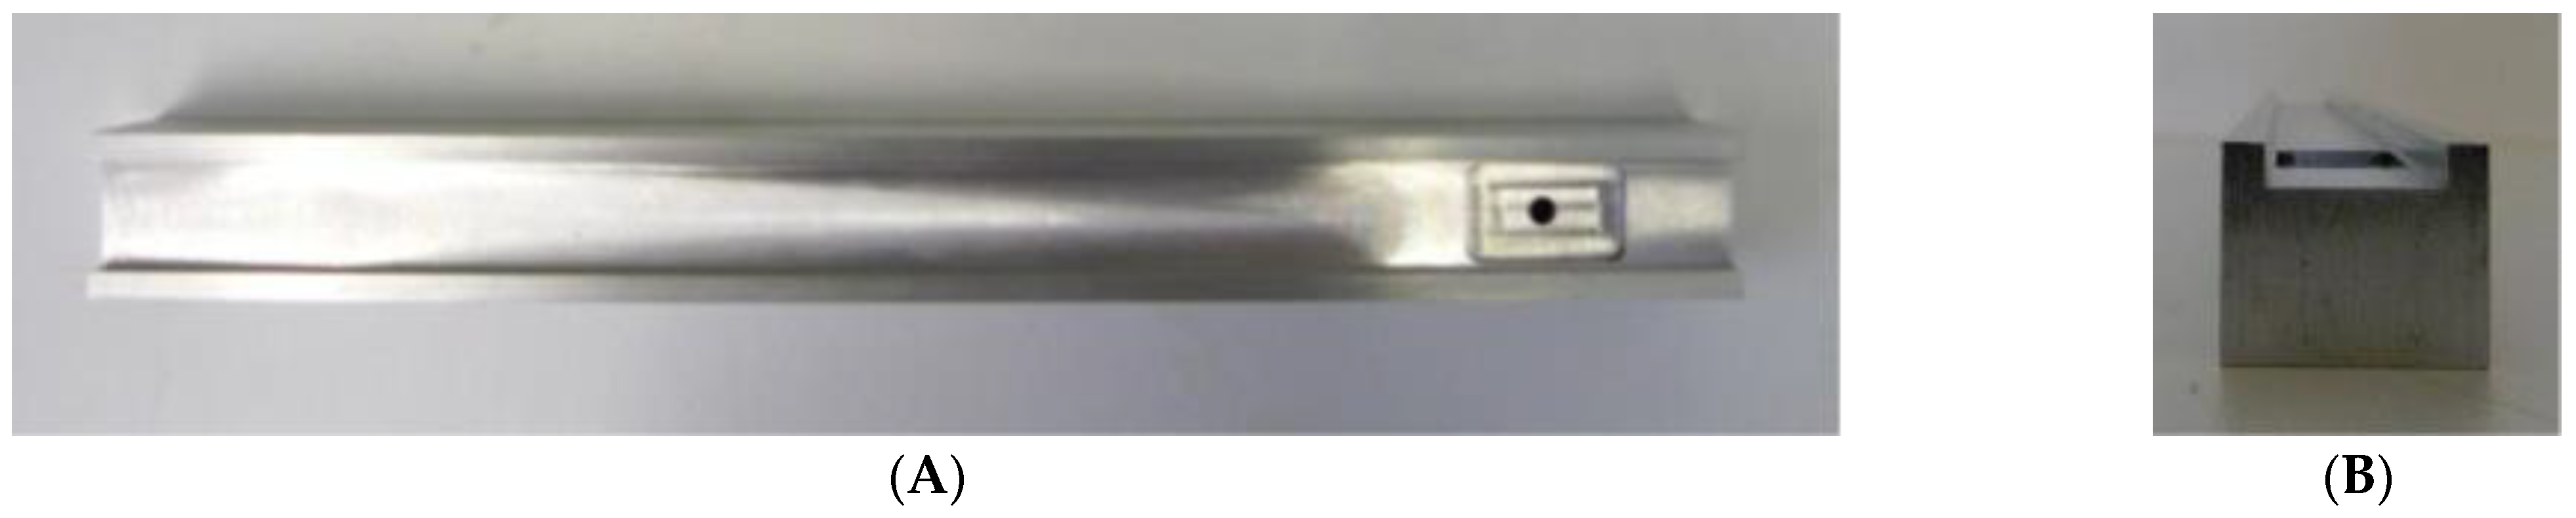
2.1. Newly Designed PPFC

The flow parameters, Reynolds number ( R e ), and wall shear stress ( τ ) are both dependent on the geometry through which the fluid flows. The Reynolds number, a dimensionless quantity, is the ratio of inertial to viscous forces acting on the fluid and is calculated using the following [14,15]:
  R e = V D h ν
where V is the average flow velocity [ m / s ] , D h is the hydraulic diameter of the flow geometry [ m ] and ν is the kinematic viscosity of the fluid [ m 2 / s ]. The wall shear stress ( τ ) is calculated using the following [14,15]:
τ = ρ V 2 f 8
where ρ is the density of the fluid [ kg / m 3 ] and f is the Darcy friction factor [14] for calculating the pipe roughness. The Darcy friction factor for turbulent flow in pipes is evaluated by the following (for 2320 < R e < 10 5 ) [14,15]:
f = 0.316 R e 4  
The flow cells used so far are geometrically rigid [7,8,9,10], and, therefore, a new design with geometrical flexibility is required so that the flow parameters can be varied independently. By setting up a flow cell with a variable height of the flow channel, it is possible to vary the flow parameters independently as the channel becomes geometrically flexible.
Figure 1 shows the newly designed PPFC with exchangeable flow channels. The flow cell in Figure 1 consists of an inlet and outlet (A) that are connected to water hoses via couplings, a bottom (B), and a cover plate (C) made of poly (methyl methacrylate) or more commonly known as plexiglas. The use of plexiglas allows for viewing the cleaning during experimentation. The exchangeable flow channel (D), where the groove (E) is built on the surface to host a stainless steel coupon (SSC) with the food soiling, is variable by design. By using three different flow channels (D), the measuring cell can be operated with variable height and width ratios. Multiple holes (F) are drilled on the plexiglas cover plate (C) to fasten it to the bottom (B). The new flow cell has three flow channels with heights of 2.5, 5, and 7.5 mm. The length and width of the flow channels are 30 cm and 20 mm, respectively. Since cleaning must take place under a turbulent flow condition, it is paramount to ensure that the flow is fully developed. The hydraulic diameter ( D h ) for a rectangular channel with width ( w ) and depth ( d ) can be calculated as follows [15]:
D h = 2 w d w + d
The maximum value of hydraulic diameter for the three different channels is 10.9 mm in the case of the 7.5 mm channel (Table 1). For pipe flow, by ensuring an inlet length of about 10 × D (D: hydraulic diameter), the flow is fully developed for turbulent flows [15]. An inlet length of 250 mm, where the cleaning takes place, already ensures a fully developed turbulent flow.
Figure 2 shows the fully assembled PPFC. The individual parts of the cell are fastened with 36 screws and sealed with silicone and rubber seals. The flow channel with a height of 5 mm is shown in Figure 3.

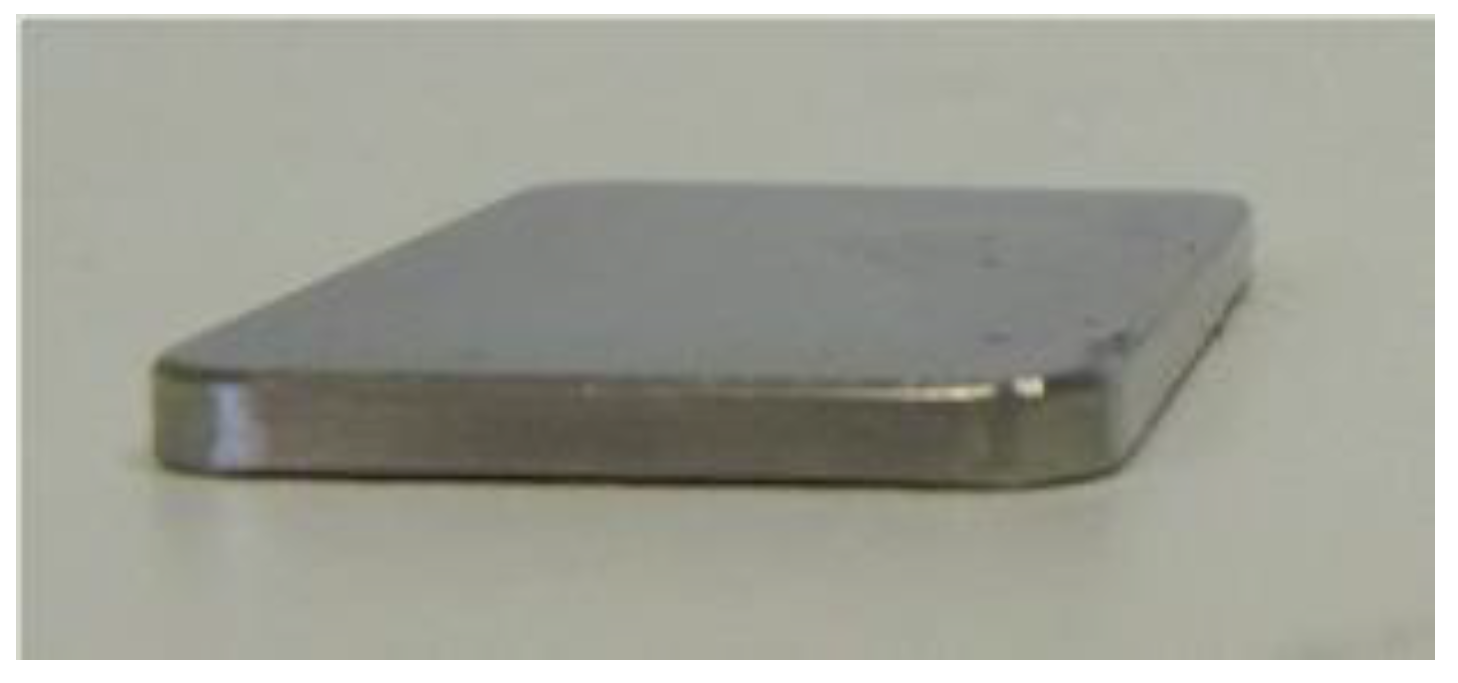
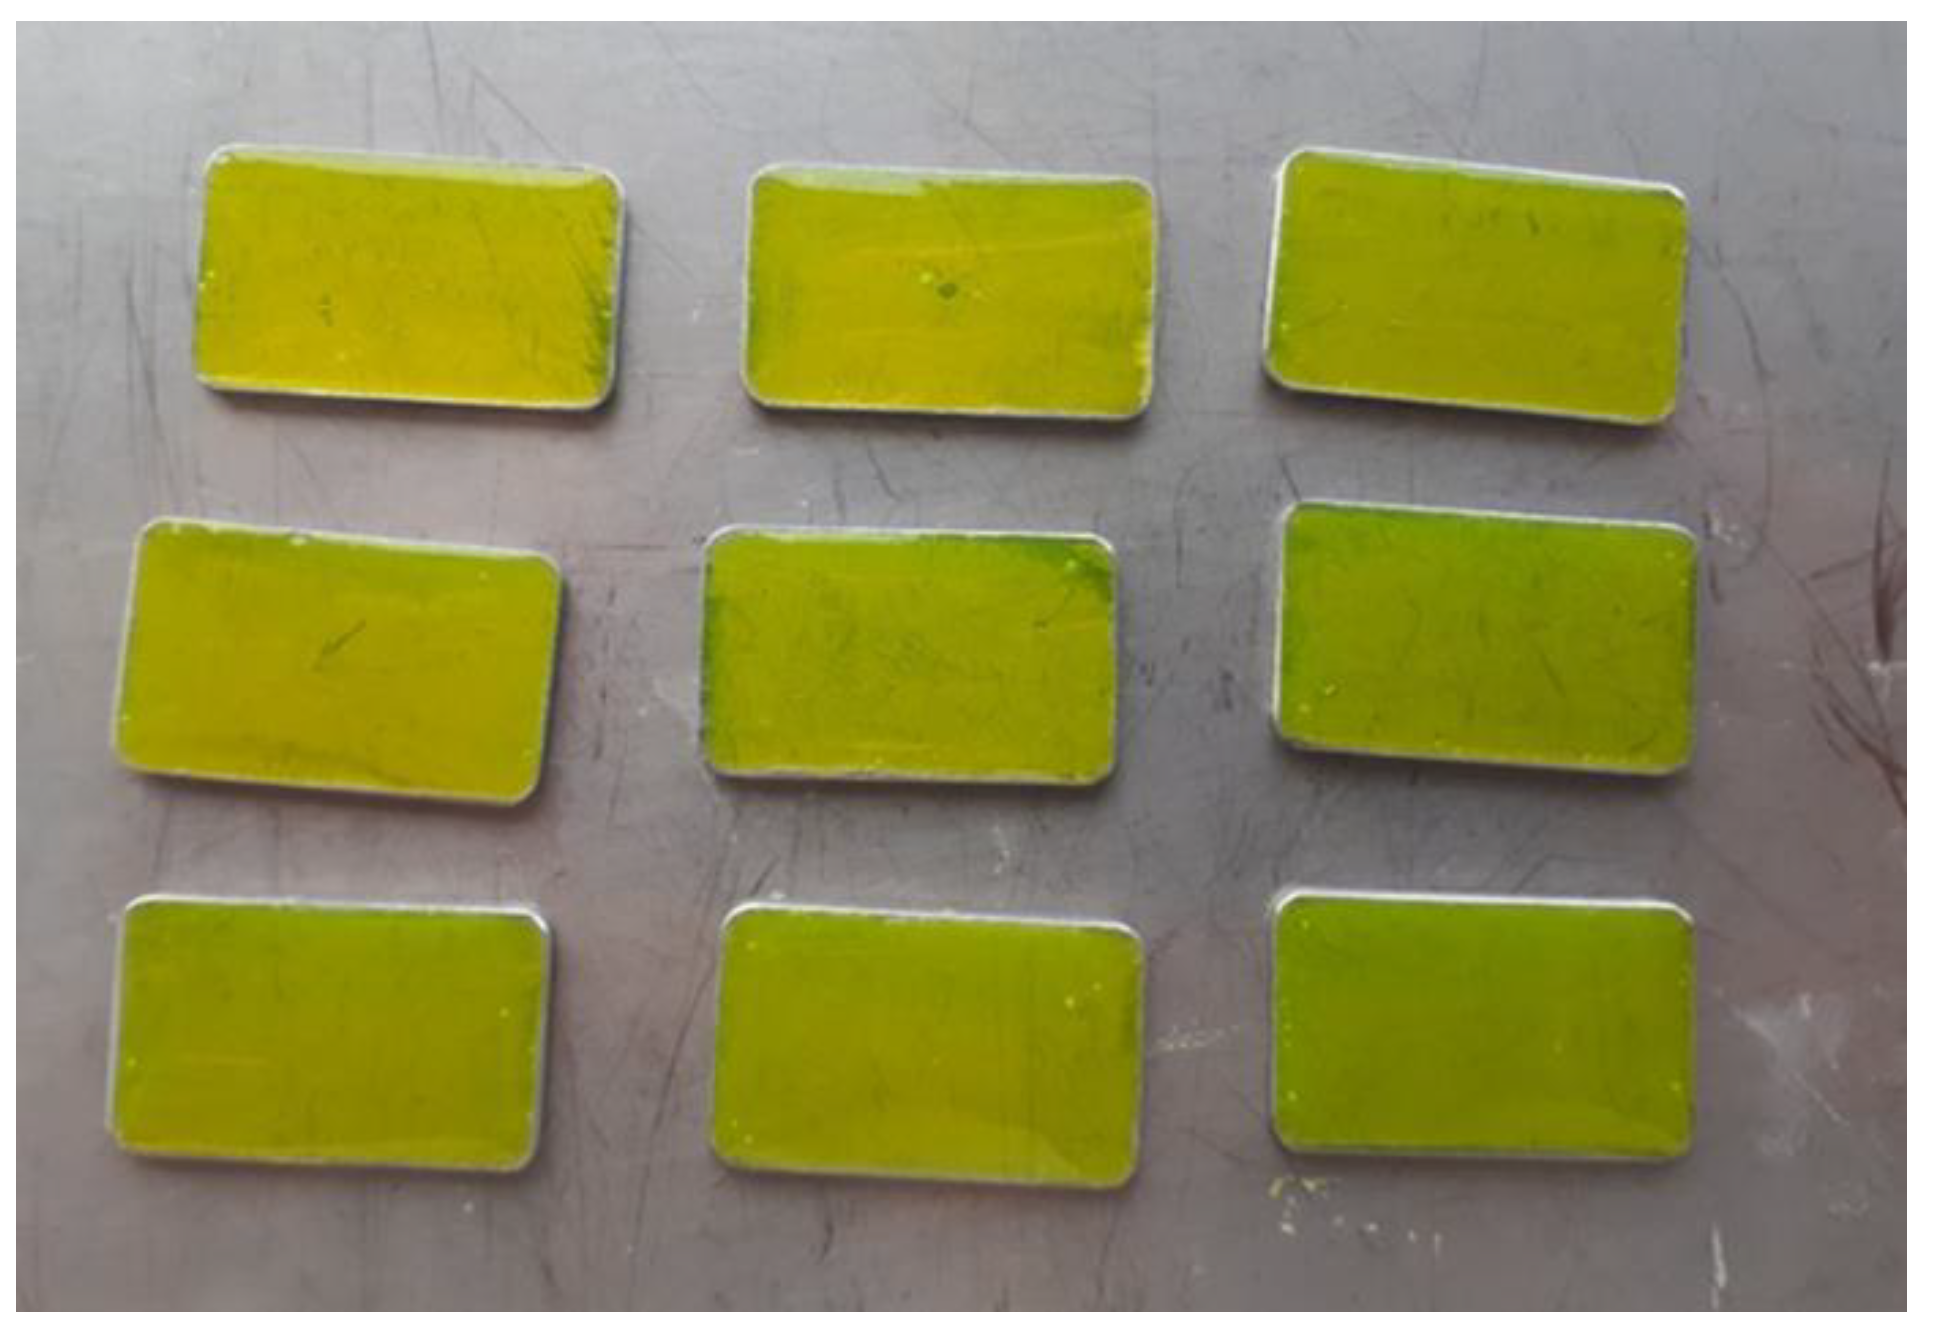
2.2. Reparation of the Soiling Material and SSC Matrix

SSCs, similar to the work of Otto, Zahn et al. [13], were employed for the application of fouling material. The SSCs (Figure 4) have length, width, and thickness of 30, 18, 2 mm, respectively; they have rounded corners with a radius of 2.5 mm. A smooth finish on the surface of the SSCs is used to produce comparable and reproducible test samples. The SSCs fit exactly into the recess of the flow channels of the PPFC and do not affect the flow rate. A mixture of maltose [D(+)-maltose-monohydrate ≥92%–Carl Roth, Karlsruhe, Germany], demineralized water, and the fluorescent tracer uranine AP (AppliChem, Darmstadt, Germany) was used as molecular fouling material. Similarly, for validation experiments (Appendix C) fluorescent tracer eosin Y (Alfa Aesar, Kandel, Germany) was employed in place of uranine AP.
For the test, a maltose–uranine mixture was prepared in a 2000:1 ratio. A solution consisting of 15 g maltose and 6.7 mL demineralized water was prepared at a constant temperature of 110 °C with stirring (MH 15, Rotilabo magnetic stirrer with heating, Carl Roth, Karlsruhe, Germany). To weigh, AUW220D (Shimadzu Deutschland GmbH, Duisburg, Germany) semi-micro balance was used. Then, 25 mg uranine AP was mixed in 750 μL demineralized water to produce an uranine solution. Finally, 225 μL uranine solution was mixed in maltose solution to obtain the maltose–uranine mixture. The SSCs were cleaned with the help of acetone (>96% v/v)—also purchased from Carl Roth—before the application of the maltose–uranine mixture over it. Approximately 0.5 g of the cooled uranine–maltose mixture was applied to the SSCs with a pipette (Eppendorf, Hamburg, Germany) and distributed. They were dried in a drying cabinet (UF55, Memmert GmbH and Co. KG, Büchenbach, Germany) for 4 min at 100 °C, then removed and carefully distributed to the edges with a spatula. The applied amount was then weighed again exactly to 0.4 g (±0.002 g). The SSCs were then dried for another 1 h in the drying cabinet. To cool them down, they were placed in the desiccator (Glaswerk Wertheim, Wertheim am Main, Germany) for about 21 h and measured on the fluorescence spectrometer the next day. Before the measurement, the coupons were weighed, and the weight of the applied fouling material was determined. The samples (Figure 5) had a mean weight of 0.331 g, a residual water content of 0.155 (w/w), and a standard deviation of 0.0069 g, which meant the samples deviated from the mean value by approximately 2%. The fouling material falls under type 1—soluble—categorized by Fryer et al. [1,16]

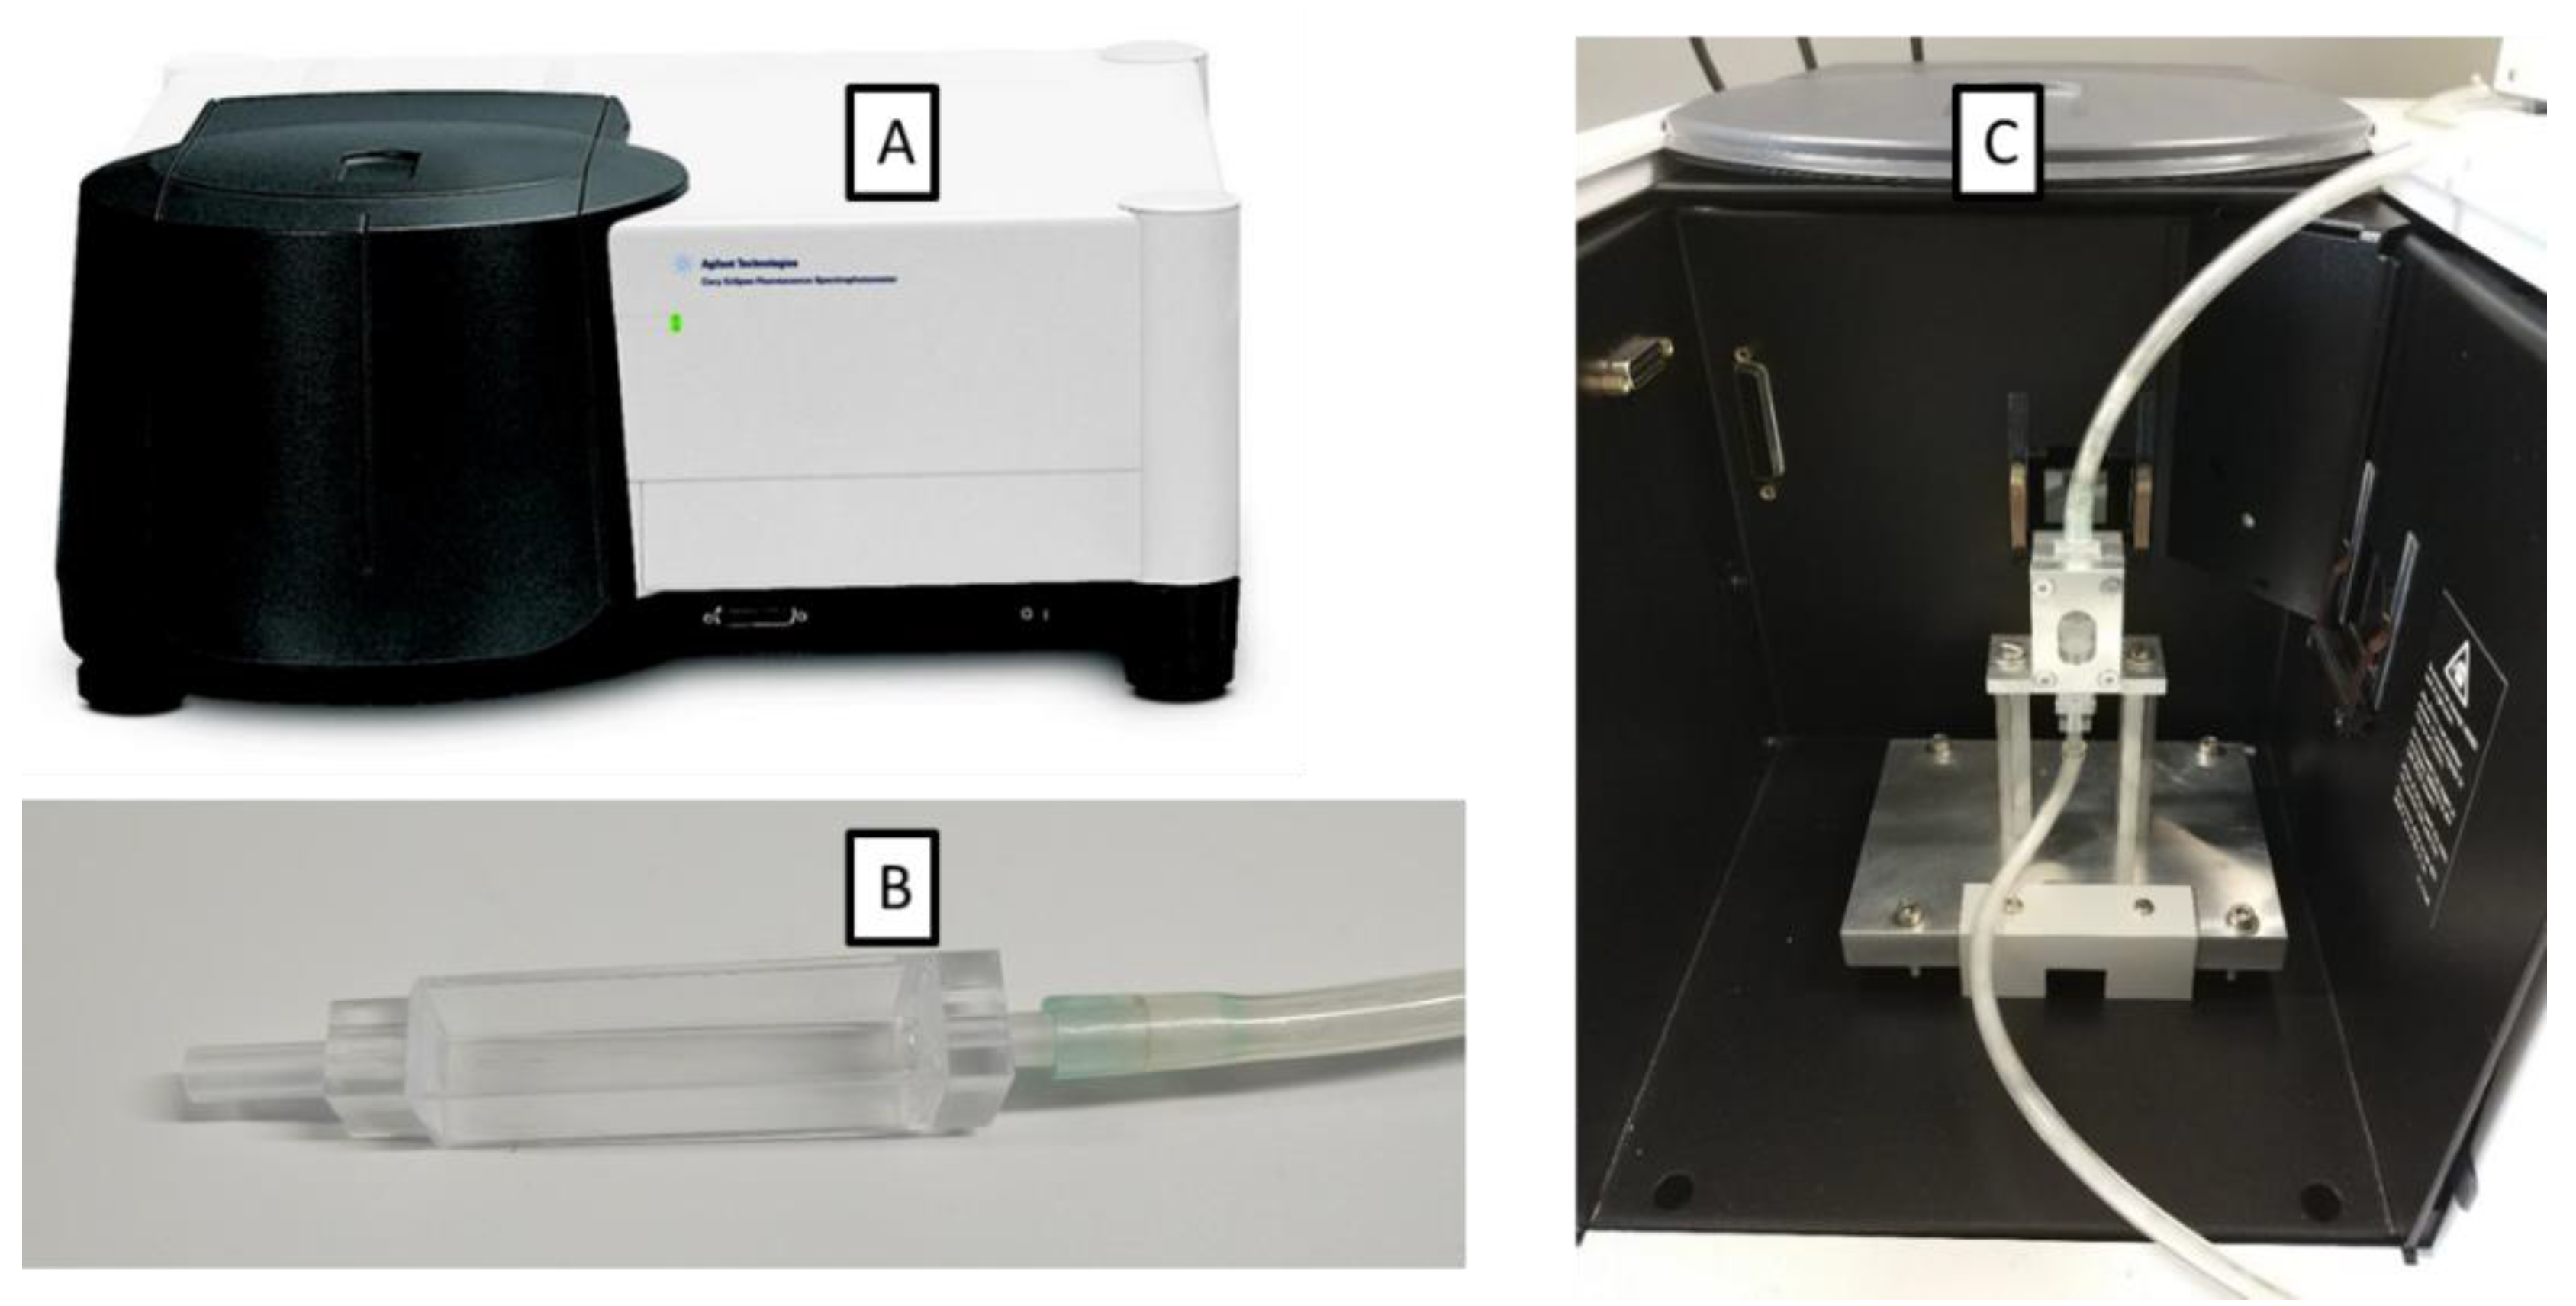
2.3. Fluorescence Spectrometer

Fluorescence spectroscopy was used in this project to perform online measurements of the cleaning of the molecular fouling material. The fluorescence spectrometer used was “Cary Eclipse” (Figure 6A), obtained from Agilent Technologies, Waldbronn, Germany. A xenon lamp was used to excite the samples used in the cuvette. The spectrometer was accompanied by a software called “Cary Eclipse,” which allows continuous measurement of the change in fluorescence intensity of a sample in the cuvette via the program “Kinetic”. For single measurements of the fluorescence intensities, the program “Scan” was used. To ensure inline measurements using the fluorescence spectrometer, a specially designed holder for the flow through cuvette was used (Figure 6C). The resulting calibration curves of the Fluorescence Spectrometer are shown in Figure A1.

2.4. Cleaning Tests

Cleaning behavior can be monitored with help of an experimental setup consisting of a storage tank, flow cell, continuous measuring unit, and pump [13,17,18]. The cleaning tests were conducted in the experimental setup (Figure 7), which is a similar configuration as proposed by Otto, Zahn et al. [13]. The arrangement was such that the cleaned material was discarded from the flow cell once the cleaning has taken place, and a volume fraction of the flow was diverted, with the help of a peristaltic pump, to the fluorescence spectrometer to measure the cleaning taking place. First, initial experiments were conducted to check the reproducibility of the cleaning tests and define a calculation method for the evaluation of the results. The fluorescence spectrometer measures the fluorescence intensities in arbitrary units. Therefore, a calculation method had to be developed to validate the cleaning experiments. This can be done using the calibration curves previously obtained. The calculation procedures and test protocols were then used to perform the actual cleaning tests to obtain the most influential parameter in the cleaning of the molecular soil used. Since uranine is sensitive to the pH values of the solvent [8,9], demineralized water with a temperature of 15 °C was used as the cleaning medium. The flow in the system was controlled by regulating the mass flow. With the new concept of the flow cell, the height of the channel (three different heights) can be varied, so that any of the flow parameters—velocity, wall shear stress, and Reynolds number—can be varied independently with respect to another.
Table 1 shows how the wall shear stress and velocity change with the duct depth for the same value of Reynolds number. Table A2 and Table A3 show the other variations used in this study. Each test was performed using a three-fold determination.

3. Results and Discussion

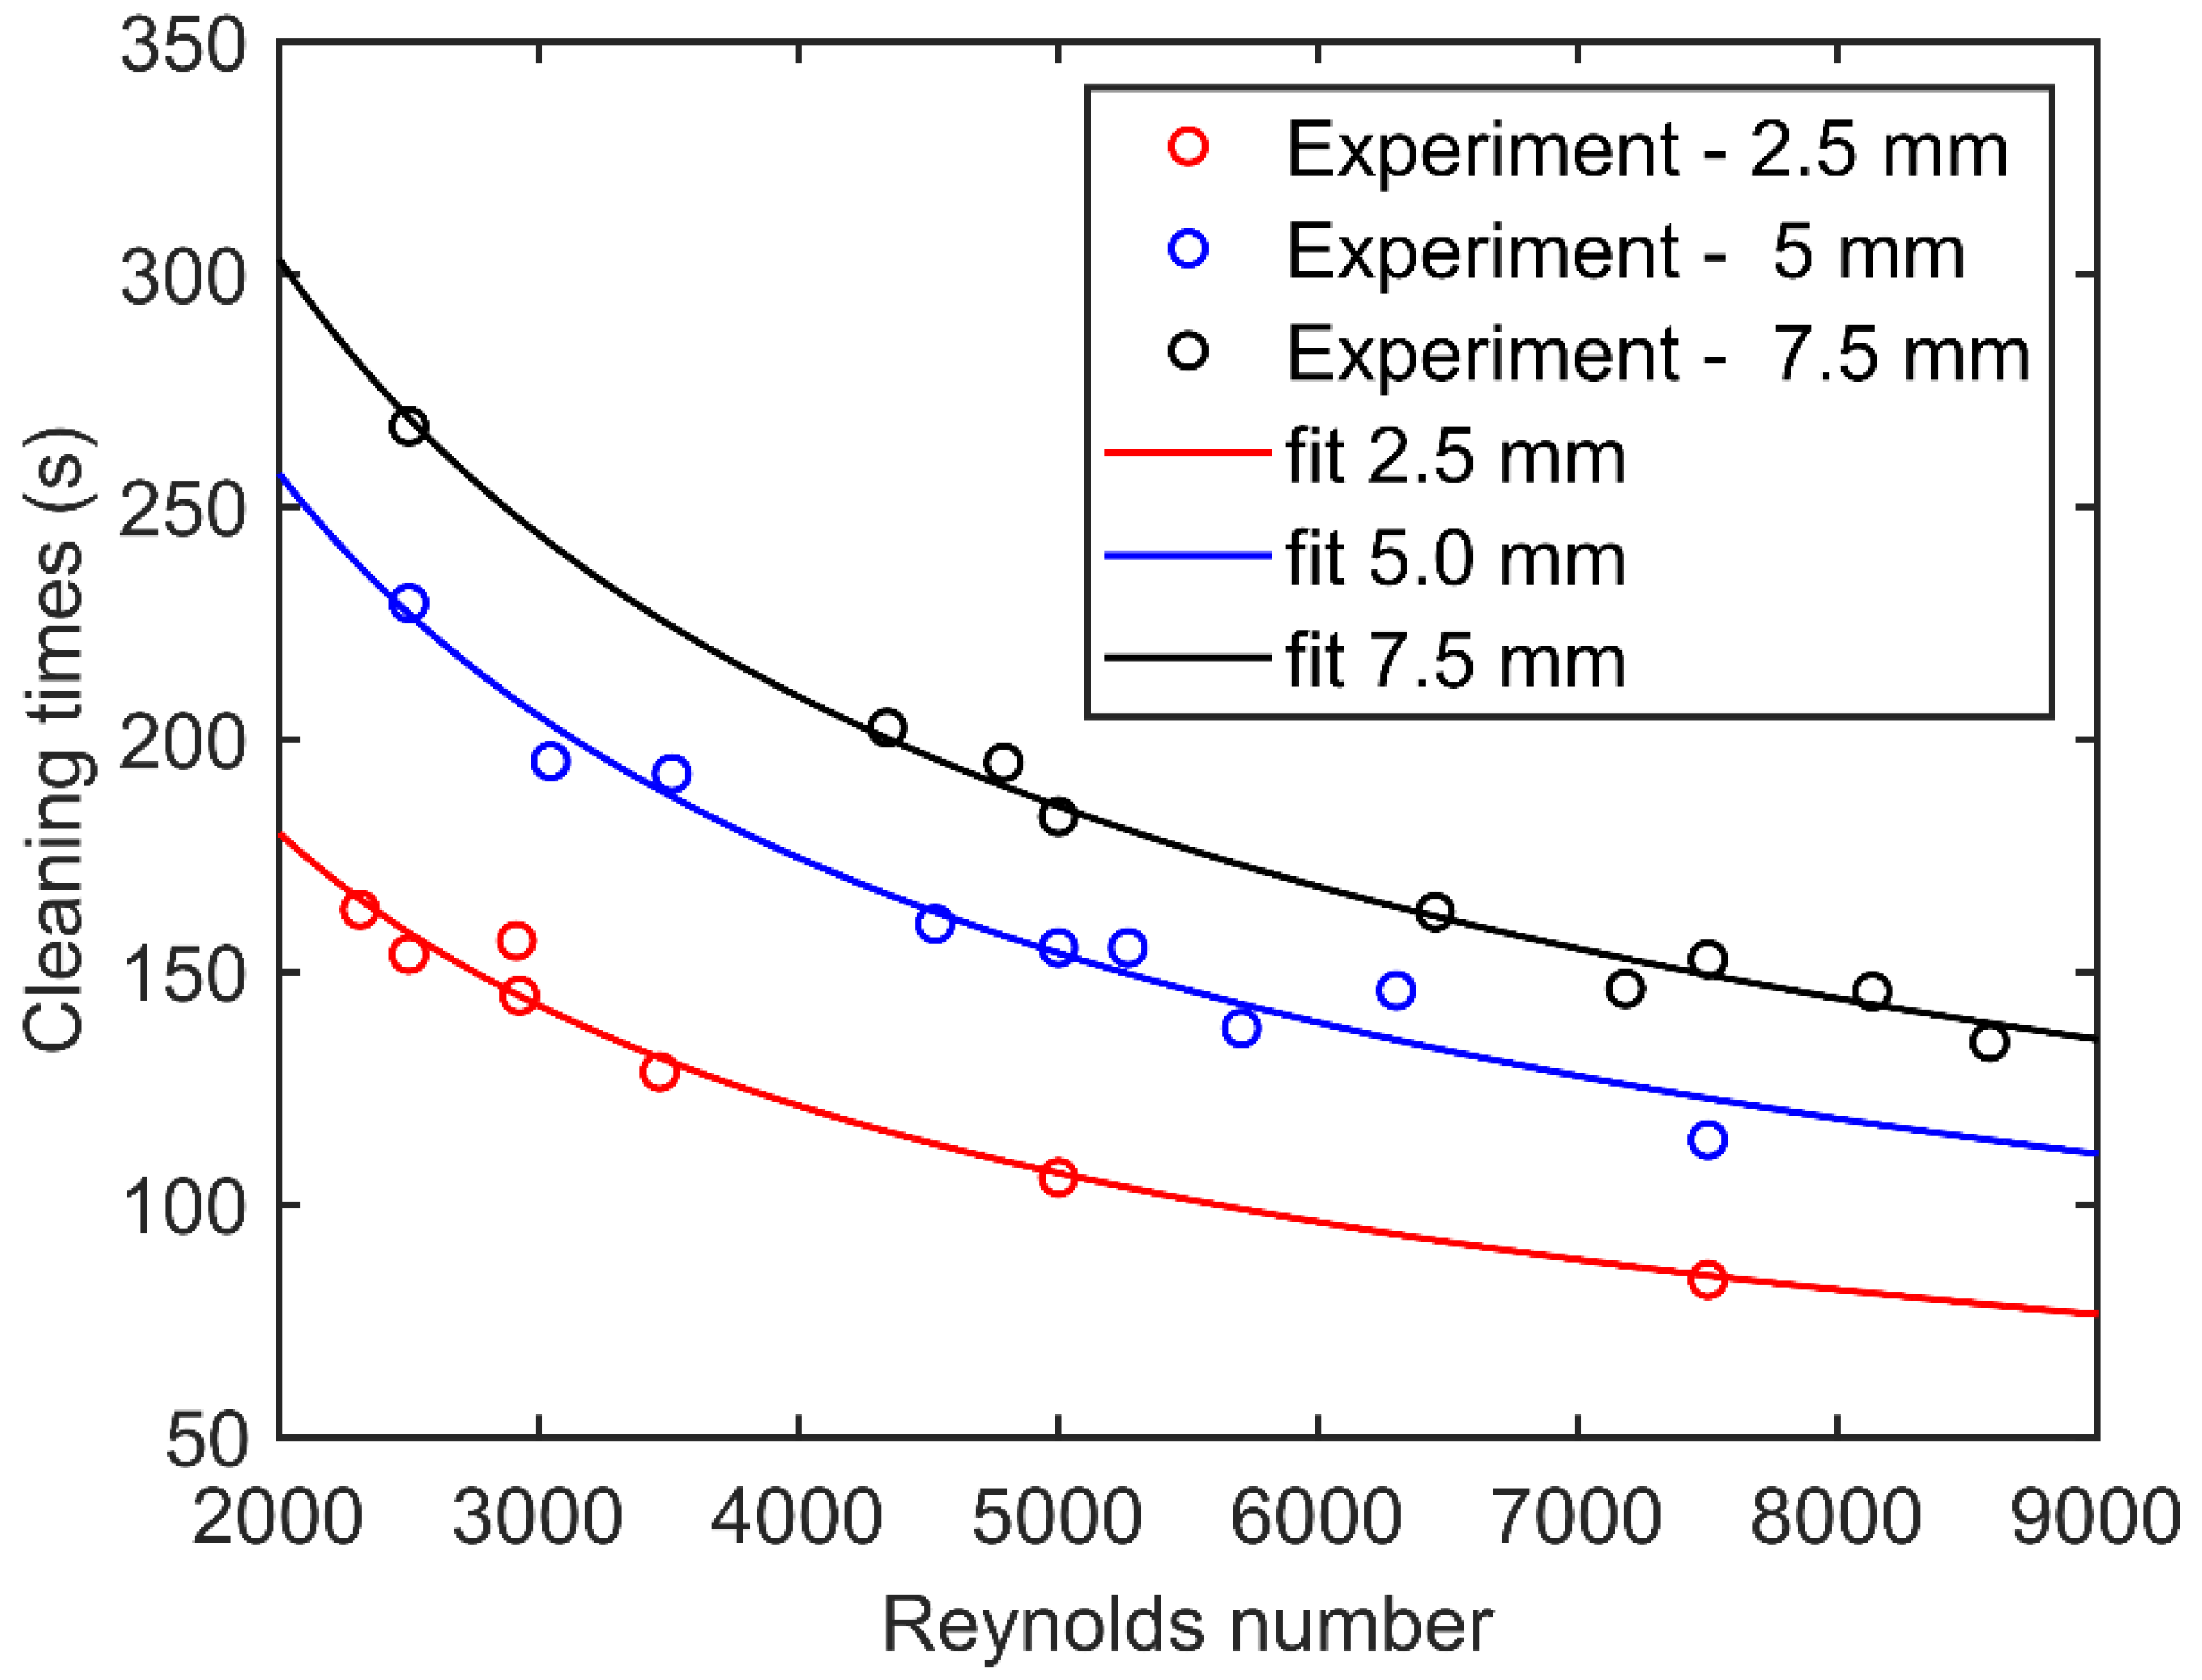
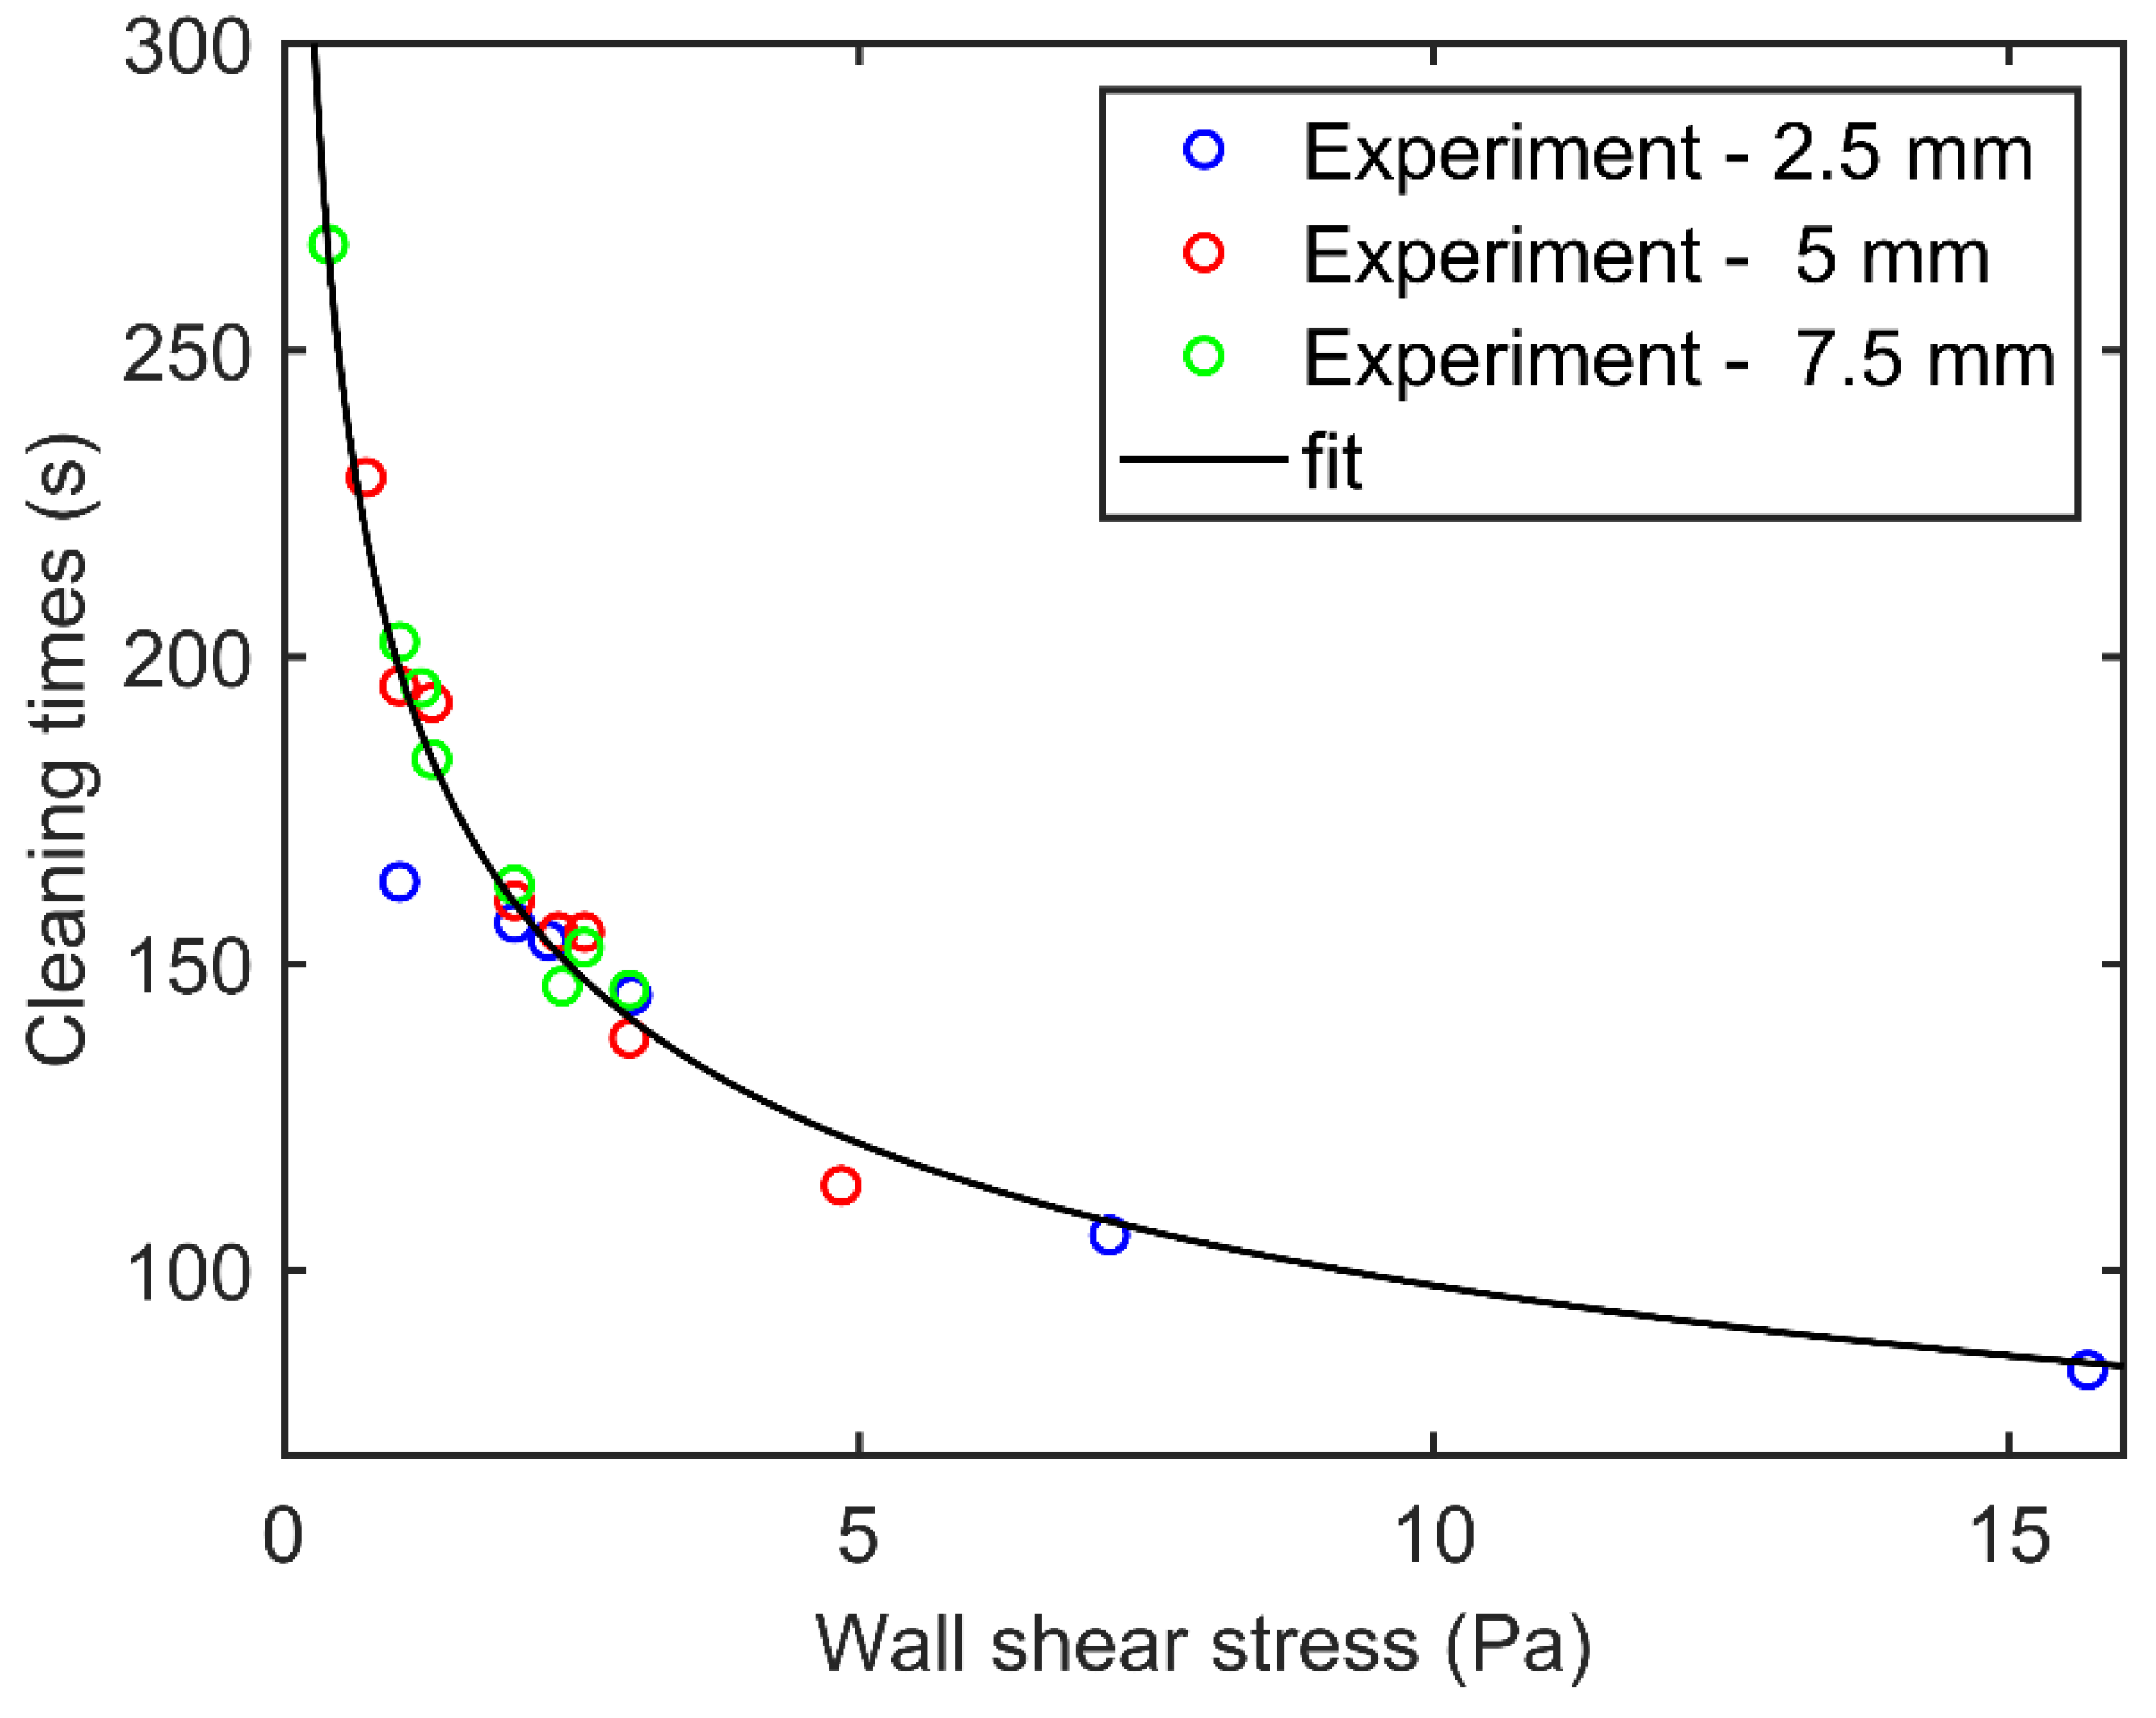
Determination of the Parameter Influences

This study investigates the influence of flow parameters on the cleaning of a molecular fouling material, which can be later used to correlate cleaning times. As explained, cleaning experiments were performed by independent variation of the flow parameters—Reynolds number, velocity, and wall shear stress. Therefore, it was possible to record the cleaning curves for a fixed value of the Reynolds number and changing values of the wall shear stress and velocity (Figure 8), and vice versa.
It is observed that the peak value of material removed, observed at around 30 s, decreases with increasing values of channel depth. This is expected as the values of flow velocity and wall shear reduce with the increasing values of channel depth (Table 1). Additionally, the cleaning times increase with the increasing values of channel depth. Cleaning time is characterized by the time at which the fluorescence spectrometer readings go to zero (maltose concentration = 0). In addition, the cleaning times of all cleaning experiments with Reynolds numbers greater than the critical value of 2300 were plotted against the respective values of the flow parameters. Figure 9 shows the cleaning times plotted against the Reynolds number.
It can be observed that for each channel geometry configuration, the cleaning times reduce according to a power-law fit with the increasing value of Reynolds number. This shows a geometric dependency of the relationship between cleaning time and Reynolds number. Therefore, cleaning times show a power-law relationship with the Reynolds number, but only for the respective channel geometries. In Figure 10, the cleaning times are plotted against the respective velocity values.
Additionally, here a power–law relationship between cleaning times and the flow velocity is observed. However, here no geometric dependence on the channel geometry is observed. That is, irrespective of the channel configurations, the cleaning times reduce with increasing flow velocities following a power–law fit.
Similarly, for wall shear stress, the cleaning times show a power–law relationship with the wall shear stress values for all measured points independent of the channel geometry (Figure 11).
Table 2 shows the correlation of cleaning time obtained for all the flow parameters.

4. Conclusions

In this study, in-line cleaning experiments could be performed reliably with the help of fluorescence spectroscopy and a test setup consisting of a new design of PPFC (Appendix B). The results of the test method proposed are consistent with the usage of tracers of different molecular weights and, thus, different diffusive properties (Appendix C). The results of the cleaning experiments demonstrate that by using a geometrically flexible PPFC, independent variation of flow parameters is possible to reveal the influences of flow parameters on the cleaning times of a molecular food soiling. A general decrease in cleaning times with increases in the Reynolds number, flow velocity, and wall shear stress was observed. A power–law relationship between cleaning times and the Reynolds number was observed, which is consistent with the review work of Goode et al. [16] as the fouling material used here is of type 1 deposit as classified by Fryer et al. [1]. It was shown that concerning the flow parameters—wall shear stress and velocity—cleaning times show geometrically independent power–law relationship with the respective flow parameters, for the fouling material used in this study. Therefore, they were used to directly correlate the cleaning times (Table 2). However, for the Reynolds number, a geometric dependency was observed. Although velocity and wall shear stress seemed to have more influence on the cleaning times due to their geometric independence, the wall shear stress had a steeper correlation curve in comparison and was the most influential parameter on cleaning of the molecular fouling used in this study. Therefore, this study provides a better understanding of the cleaning mechanism involved as well as presents an innovative strategy to vary the cleaning parameters to determine the cleaning behavior. More research with fouling materials involving complex removal mechanisms such as dairy cream is required to elucidate their respective cleaning mechanisms and the effect of flow parameters.

Author Contributions

Conceptualization: L.N.V., and B.S.; Methodology: L.N.V., and B.S.; Investigation: L.N.V., and D.S.N.; Project administration: P.F. and H.B.; Supervision: P.F. and H.B.; Resources: P.F. and H.B.; Visualization: L.N.V.; Writing–original draft: L.N.V.; Writing–review and editing: L.N.V., B.S., D.S.N., P.F., H.B. All authors have read and agreed to the published version of the manuscript.

Funding

The research made use of the Cary Eclipse Fluorescence spectrometer as part of the IGF project 19409 N of the research association Industrievereinigung für Lebensmitteltechnologie und Verpackung e. V.-IVLV, Giggenhauser Str. 35, 85354 Freising, Germany, funded via the Arbeitsgemeinschaft industrieller Forschungsvereinigungen “Otto von Guericke” e.V.-AiF within the framework of the program for the promotion of industrielle Gemeinschaftsforschung (IGF) and development by the Federal Ministry for Economic Affairs and Energy on the basis of a resolution of the German Parliament.

Conflicts of Interest

The authors declare no conflict of interest.

Appendix A. Calibration of the Fluorescence Spectrometer

To perform the calibration of the fluorescent tracers—uranine AP and eosin Y—used in this project, serial dilutions of different concentrations of the tracers were prepared, similar to the works of many other authors [8,9]. The diluted solutions contained maltose and the fluorescent tracer under the same weight ratio (2000:1) as in the fouling material used for the cleaning tests. The fluorescence intensities for the solutions with different concentrations were measured and plotted against the respective concentration values. The calibration experiment was performed on 12 different concentration values for each tracer.
The resulting calibration curves are shown in Figure A1. The goal of the calibration experiments is to obtain a trend function with a good coefficient of determination ( R 2 > 0.95 ). The performed experiments resulted in a 0.999 coefficient of determination.
Figure A1. Calibration curve for uranine AP and eosin Y.
Processes 09 00881 g0a1

Appendix B. Initial Cleaning Experiments
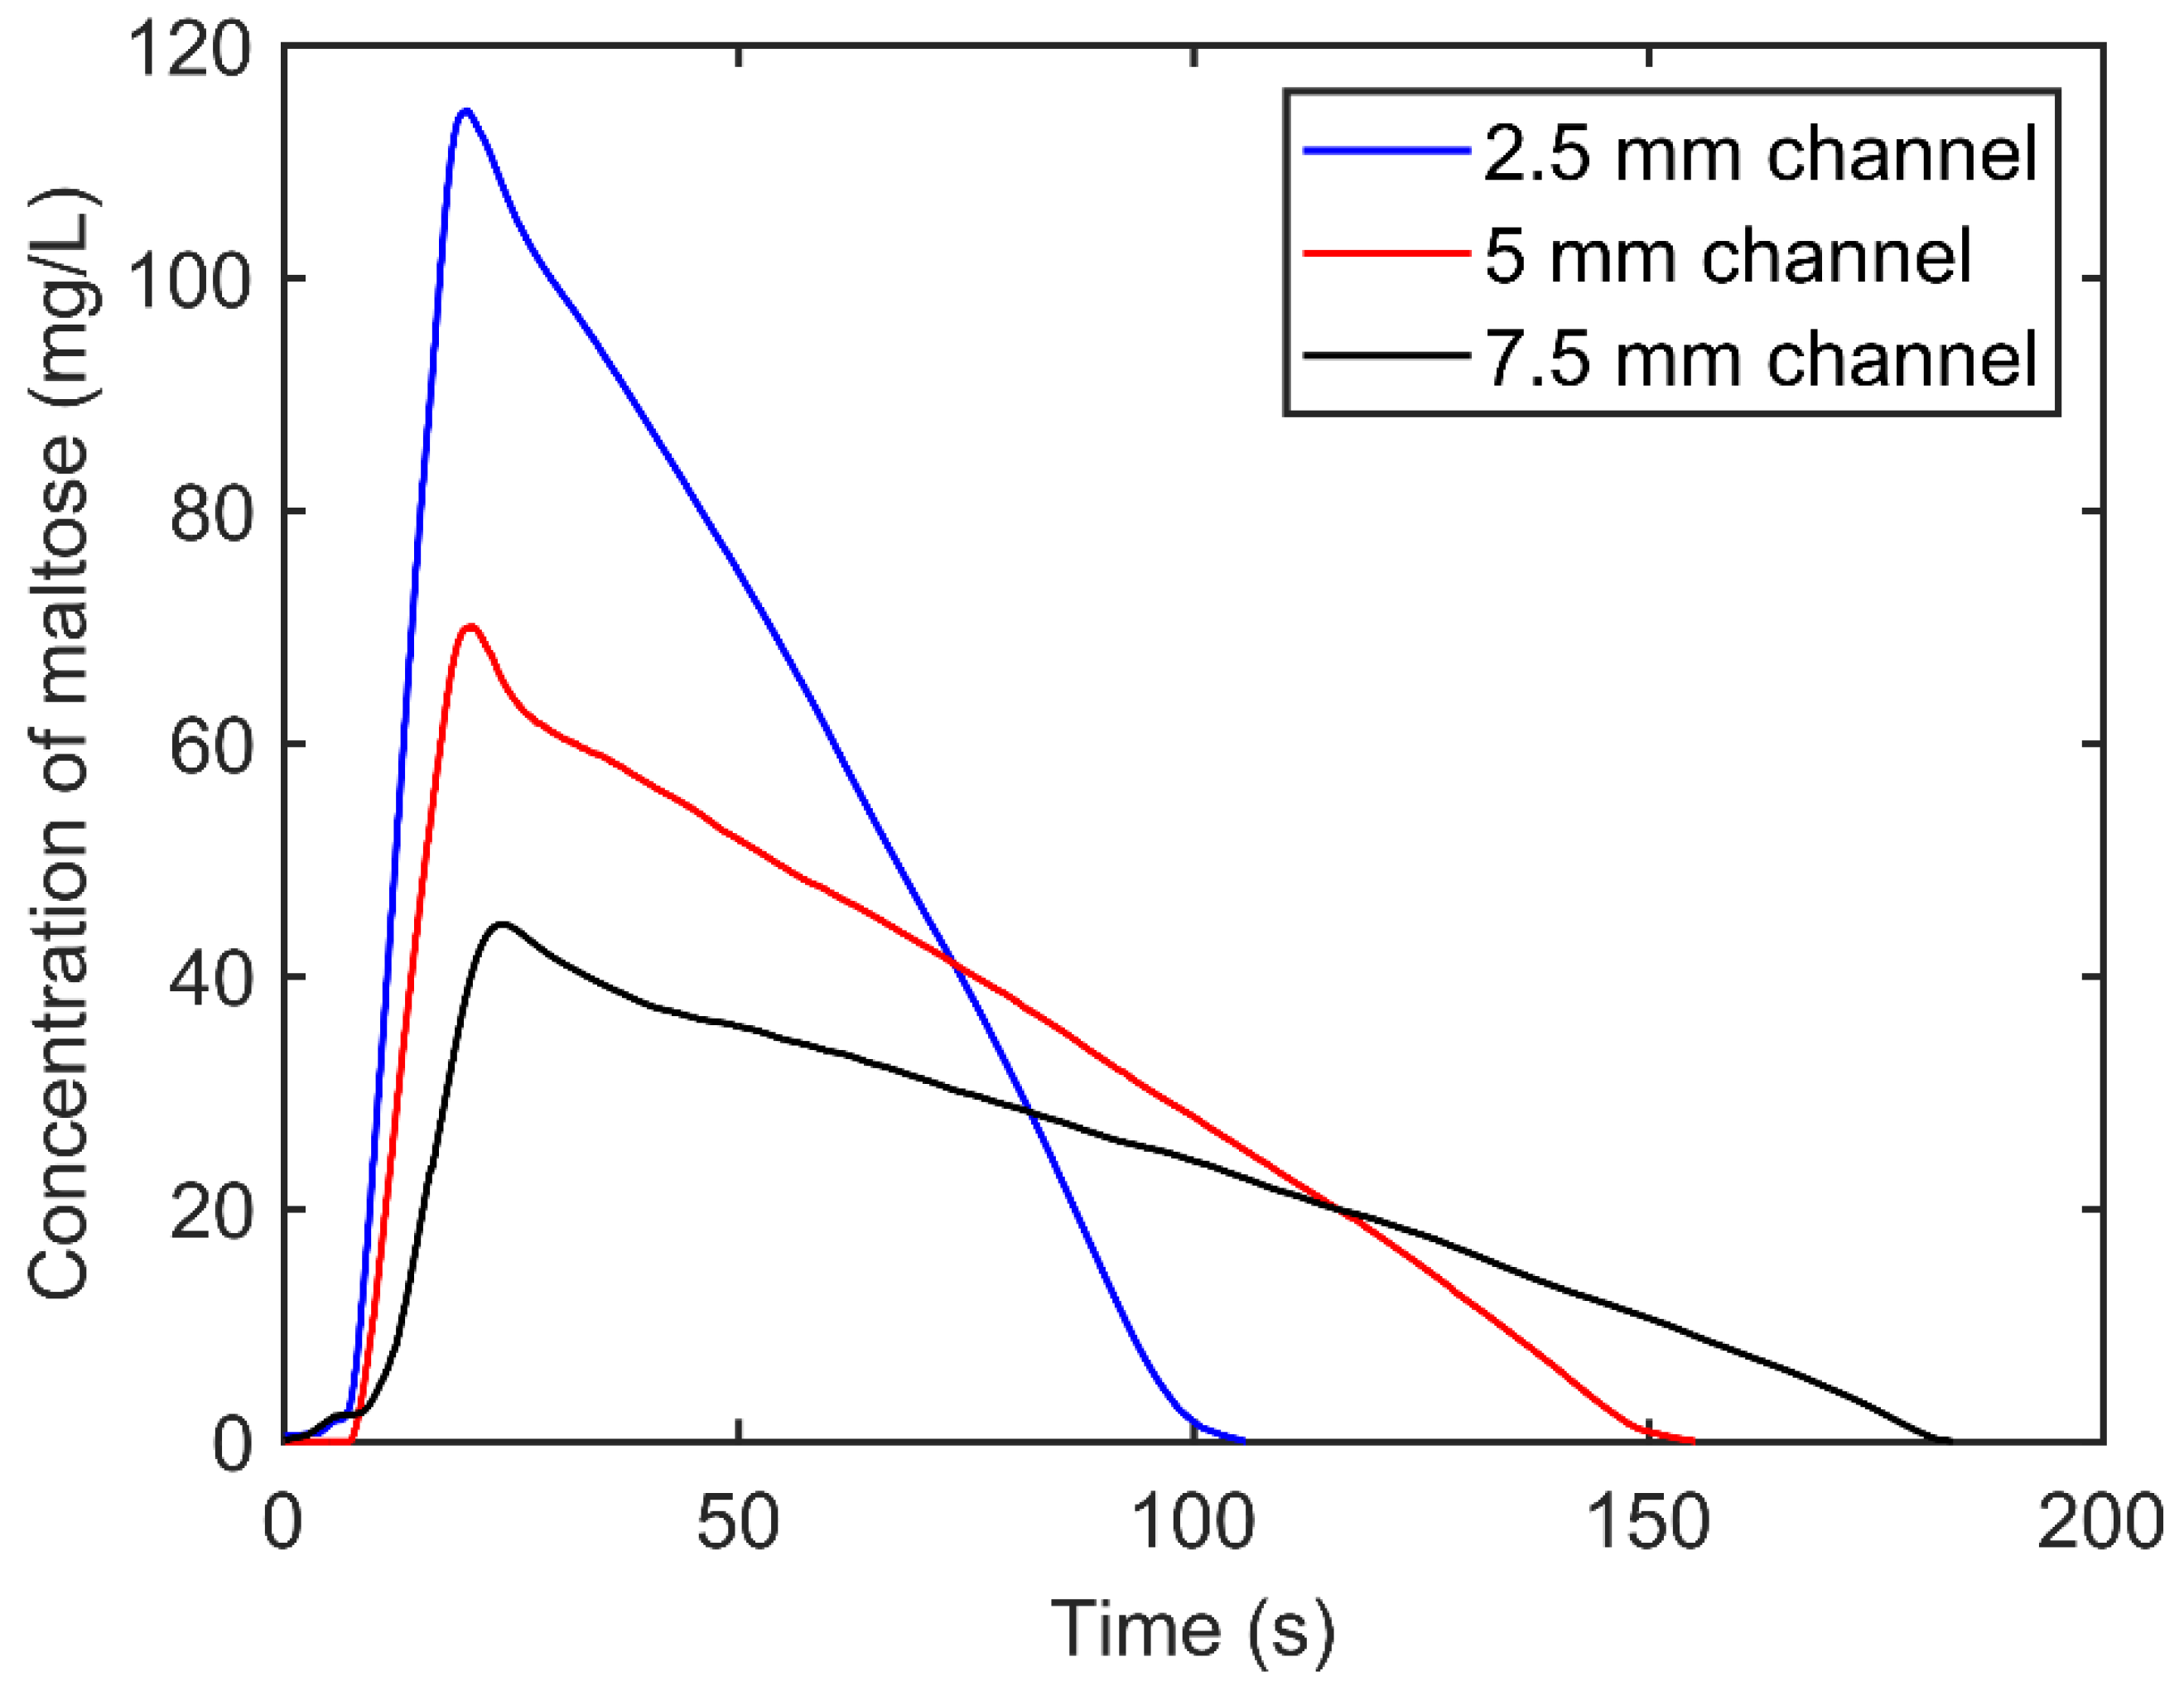
The preliminary cleaning tests were performed to show the feasibility of the cleaning experiments. The idea was to determine the difference in mass measured by fluorescence spectrometer and the actual measured mass before cleaning experiments. The fluorescence spectrometer measures the intensities of fluorescent tracer in the solution in arbitrary units (a.U.) and is then converted to a concentration by exploiting the calibration curve obtained previously. Based on the mass fraction of maltose to that of the fluorescent tracer present in the fouling layer prepared, the concentration of maltose is calculated. Figure A2 shows the change in mass concentration of maltose ( C m ) with time obtained from the measurements of the fluorescence spectrometer. The total mass of maltose removed during cleaning experiments from the fluid cell can be calculated using the following steps:
  • Finding the area under the curve ( A ):
    A = 0 t e n d C m . d t
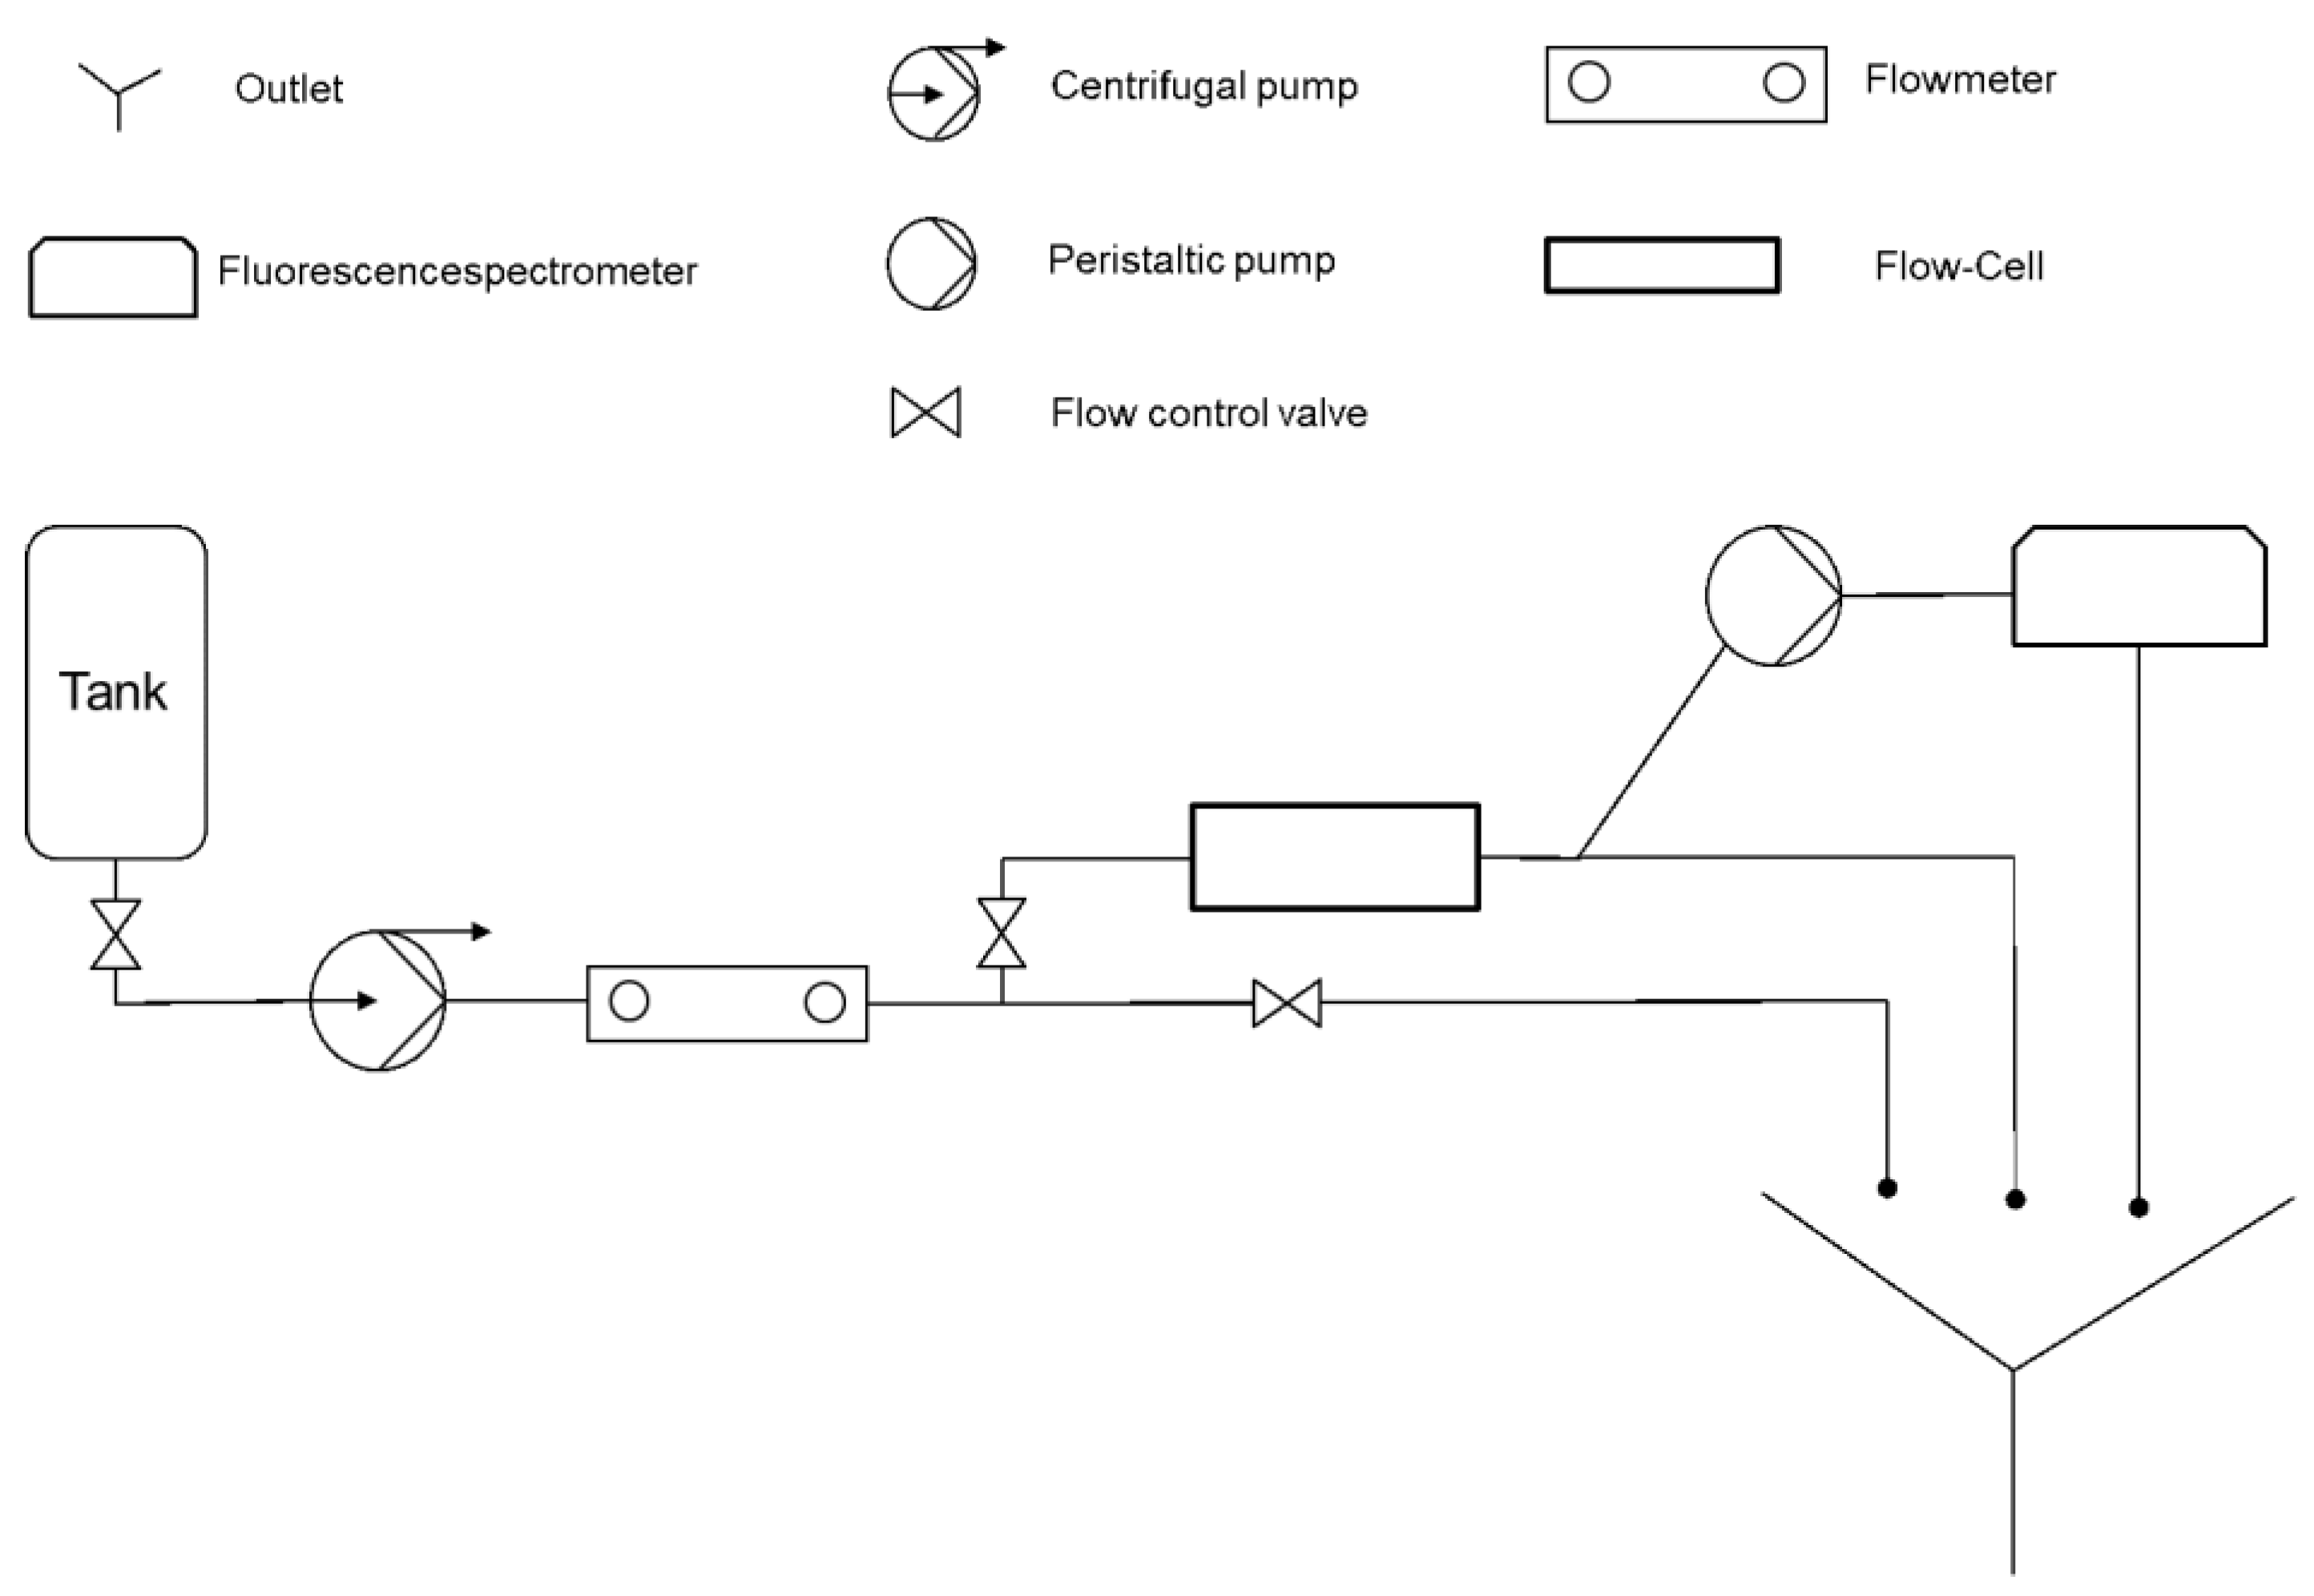
  • The mass of maltose that passed via the cuvette ( m c ) can be calculated using the volume flow through the cuvette ( V ˙ c )
    m c = A . V ˙ c
  • The mass of maltose that was removed from the system ( m t o t ), assuming a homogeneous distribution of the solute in both the separated flows, can be calculated using the fraction of volume flows through the flow cell to that through the cuvette ( r = V ˙ t o t V ˙ c )
    m t o t = m c . r
  • Finally, the deviation of the mass measured by the fluorescent spectrometer ( m t o t ) from the mass measured before the cleaning experiments ( m m e ) can be calculated from
    % e r r o r = m m e m t o t m m e
The following table (Table A1) shows the error values from the preliminary cleaning tests. The deviations from the mean values are smaller, and the experiments can be considered reliable.
Table A1. Feasibility of the cleaning tests.
Channel Size (mm)Velocity (m/s)Experiment Nr.Mass Before Cleaning (g)Measured Cleaned Mass (g)Mean % Error
50.510.3370.3292.85
20.3370.328
30.3410.329
50.8910.3330.3193.98
20.3380.325
30.3350.322
Channel Size (mm)Reynolds NumberExperiment Nr.Mass Before Cleaning (g)Measured Cleaned Mass (g)Mean % Error
7.5250010.3330.3155.97
20.3350.316
30.3370.314
7.5750010.3350.37.77
20.3350.315
30.3340.311
A1 Flow is controlled by controlling the mass flow in the system.
Figure A2. Concentration of maltose over time for the initial cleaning experiments.
Processes 09 00881 g0a2

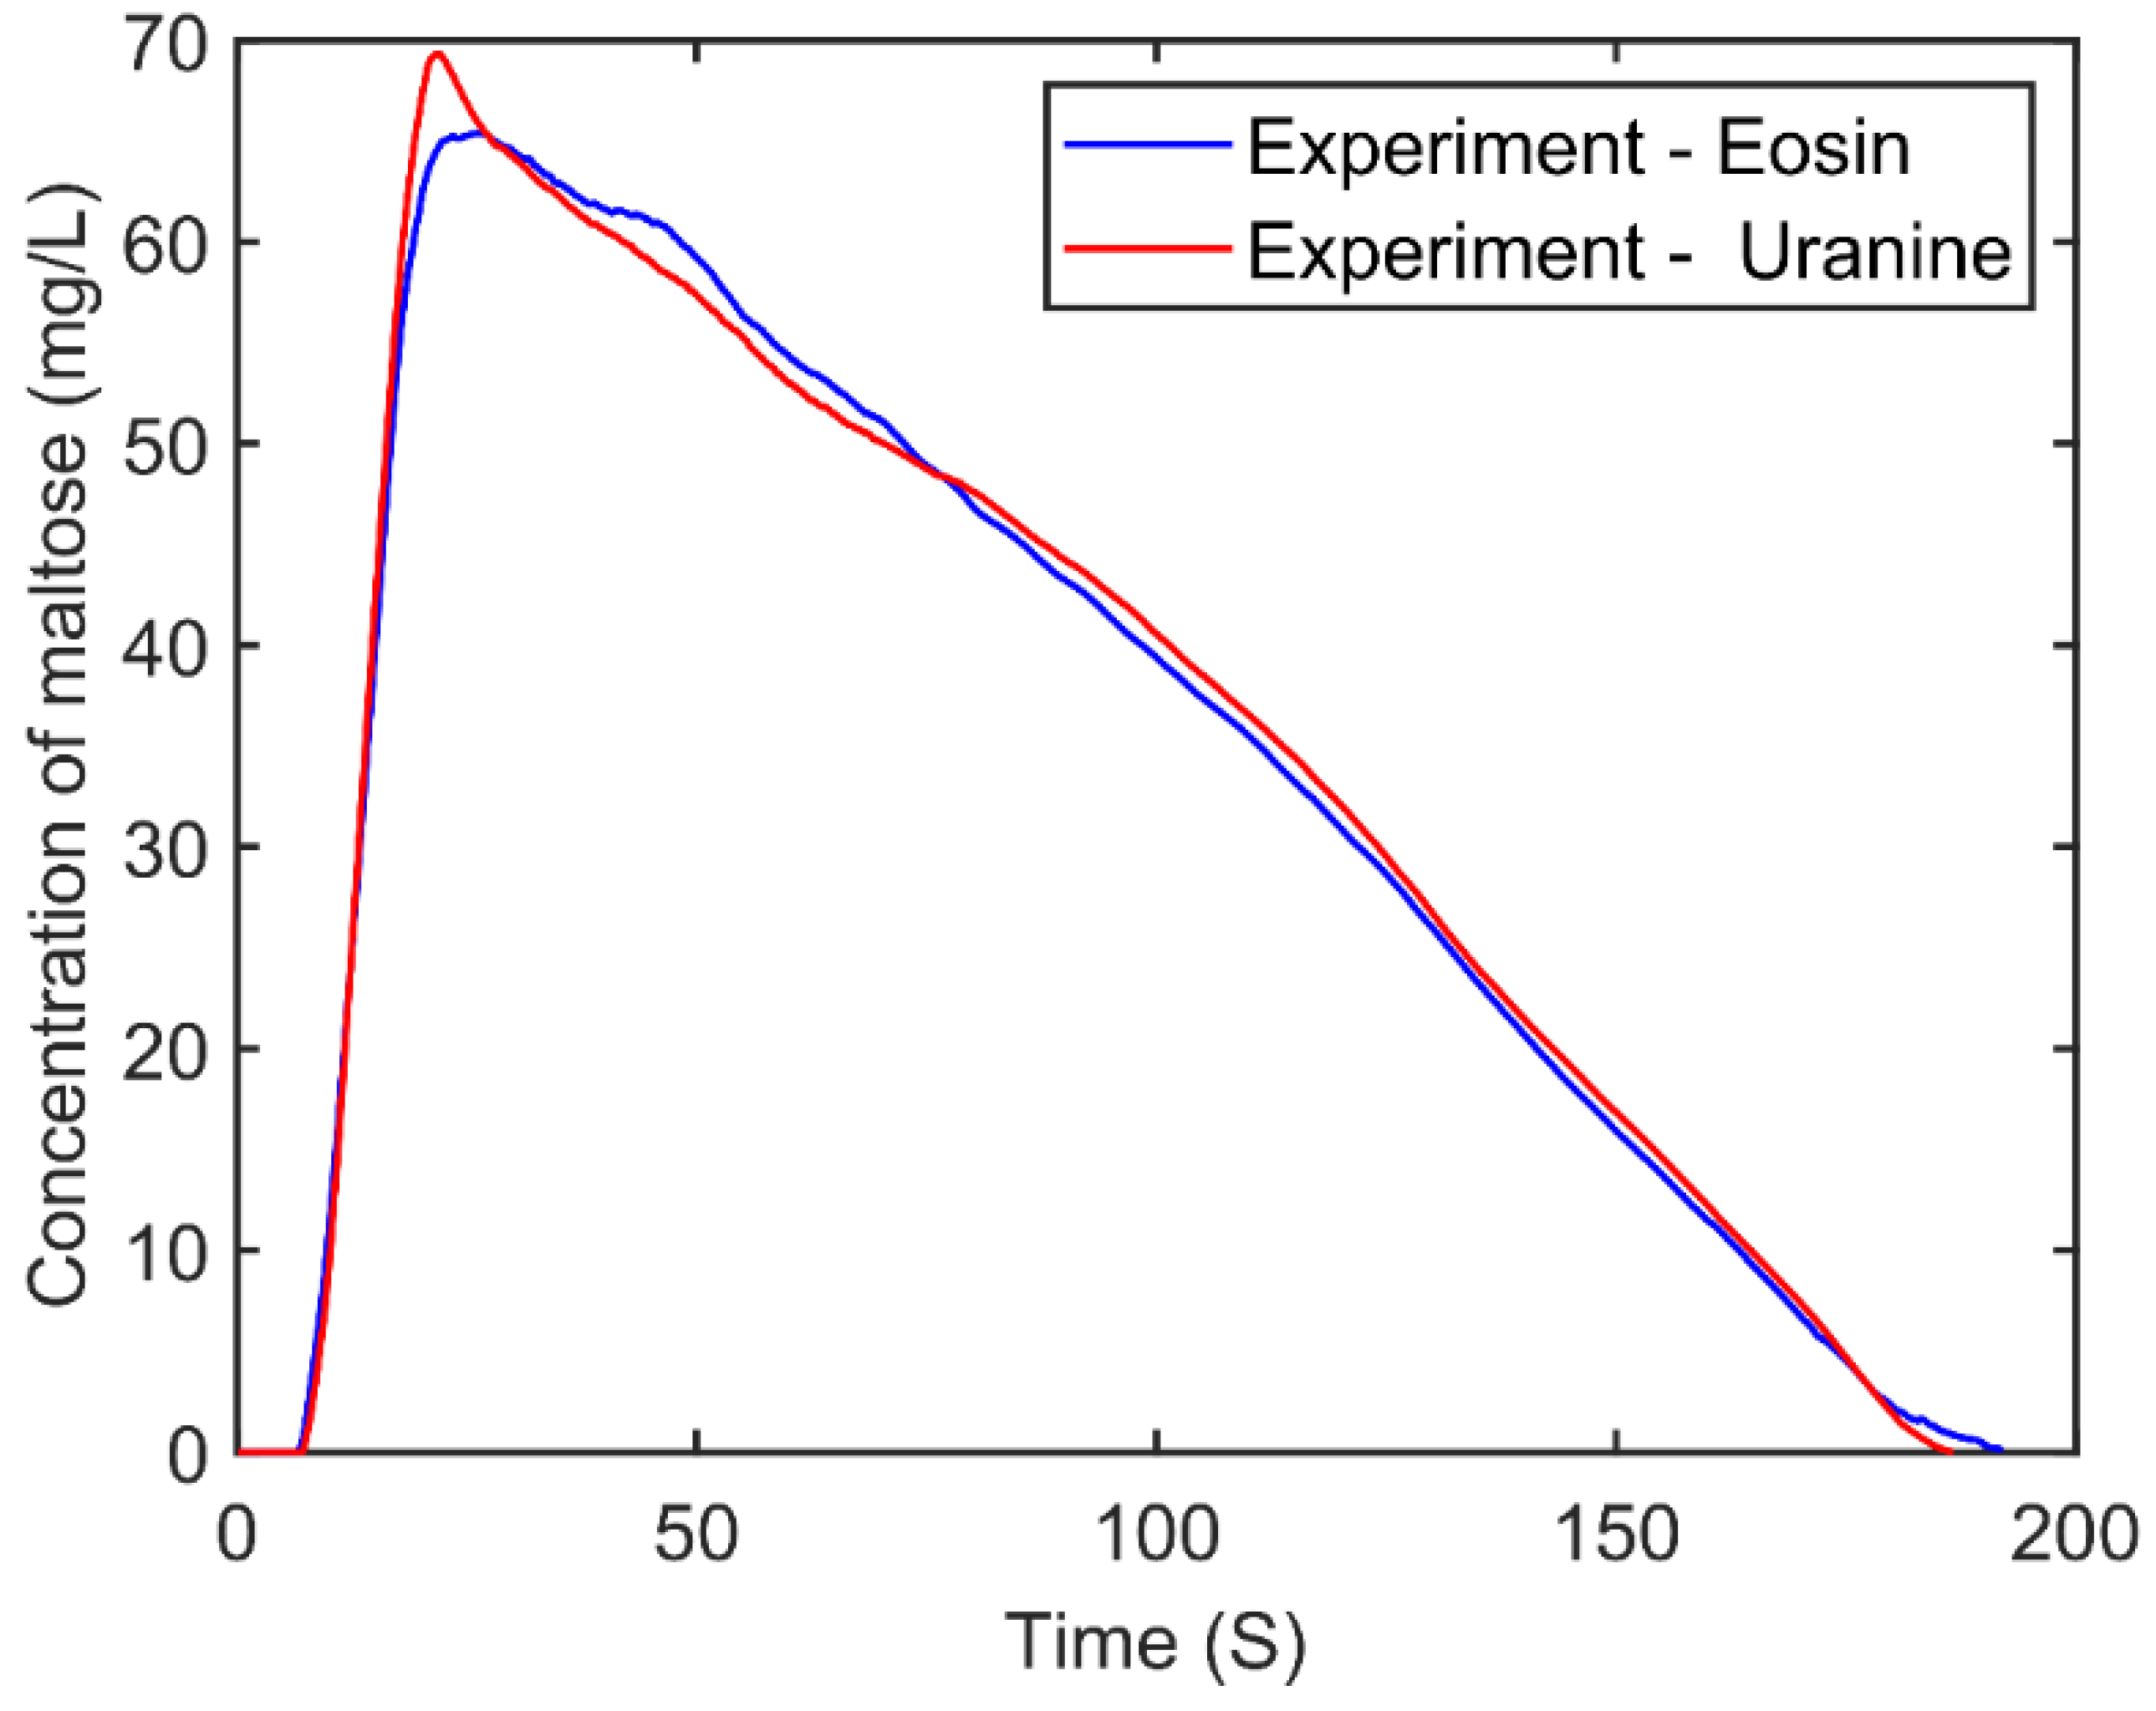
Appendix C. Validation of the Fluorescent Spectrometer Measurements with Eosin Y

To ensure that the current experimental setup with the fluorescence spectrometer measures the cleaning of the fouling material used and not just the dissolution of uranine AP from the fouling material in the system, another initial cleaning test was conducted using the common fluorescent tracer eosin Y. In this test, the fouling material was prepared similarly as in that of uranine AP. Calibration experiments were also performed like that of uranine AP (Figure A1). The expectation is that if the fluorescence spectrometer measures the cleaning of the fouling material used, the test results should not vary significantly when using another common fluorescent tracer, given that both are soluble in water. Figure A3 shows the comparison of the change in maltose concentration over time with the use of eosin Y (blue line) and uranine (red line). From Figure A3, the values are consistent, and the fluorescence spectrometer measurements were, therefore, successfully validated.
Figure A3. Validation of fluorescent experiments using eosin Y.
Processes 09 00881 g0a3

Appendix D

Appendix D.1. Variation of Flow Parameters with Constant Velocity

Table A2. Variation of Reynolds number and wall shear stress for constant velocity.
Velocity [m/s]ParameterChannel Depth
2.5 mm5 mm7.5 mm
0.5Mass flow [kg/h]90180270
Reynolds number1951.0293511.8534788.89
Wall shear stress [Pa]1.4861.2831.188
0.75Mass flow [kg/h]135270405
Reynolds number2926.5445267.7797183.335
Wall shear stress [Pa]3.0222.6092.414
0.89Mass flow [kg/h]160.2320.4480.6
Reynolds number3438.4056256.598524.604
Wall shear stress [Pa]3.8113.2813.0377
Flow is controlled by controlling the mass flow in the system.

Appendix D.2. Variation of Flow Parameters with Constant Wall Shear Stress

Table A3. Variation of Reynolds number and velocity for constant wall shear stress.
Wall Shear Stress [Pa]ParameterChannel Depth
2.5 mm5 mm7.5 mm
1Mass flow [kg/h]71.76156.092244.745
Reynolds number1555.6223045.3984340.955
Velocity [m/s]0.3990.4340.453
2Mass flow [kg/h]106.635231.952363.690
Reynolds number2311.6454525.446450.634
Velocity [m/s]0.5920.6440.673
3Mass flow [kg/h]134.438292.429458.516
Reynolds number2914.375705.3828132.536
Velocity [m/s]0.7440.8120.849
Flow is controlled by controlling the mass flow in the system.

References

  1. Fryer, P.J.; Robbins, P.T.; Asteriadou, K. Current knowledge in hygienic design: Can we minimize fouling and speed cleaning? Procedia Food Sci. 2011, 1, 1753–1760. [Google Scholar] [CrossRef] [Green Version]
  2. Wildbrett, G. Reinigung und Desinfektion in der Lebensmittelindustrie. 2., überarb. u. Aktual; Behr: Hamburg, Germany, 2006. [Google Scholar]
  3. Augustin, W.; Fuchs, T.; Föste, H.; Schöler, M.; Majschak, J.-P.; Scholl, S. Pulsed flow for enhanced cleaning in food processing. Food Bioprod. Process. 2010, 88, 384–391. [Google Scholar] [CrossRef]
  4. Weidemann, C. Reinigungsfähigkeit von Filtermedien Mithilfe Kontinuierlicher und Pulsierender Strömung; KIT Scientific Publishing: Karlsruhe, Germany, 2015. [Google Scholar]
  5. Mauermann, M.; Eschenhagen, U.; Weyrauch, T.; Köhler, H.; Bley, T.; Majschak, J.P. Monitoring the progress of cleaning using optical detection methods. Proc. Int. Conf. Fouling Clean. Food Process. 2010, 2010, 80–87. [Google Scholar]
  6. Liu, W.; Fryer, P.J.; Zhang, Z.; Zhao, Q.; Liu, Y. Identification of cohesive and adhesive effects in the cleaning of food fouling deposits. Innov. Food Sci. Emerg. Technol. 2006, 7, 263–269. [Google Scholar] [CrossRef]
  7. Simeone, A.; Deng, B.; Watson, N.; Woolley, E. Enhanced Clean-In-Place Monitoring Using Ultraviolet Induced Fluorescence and Neural Networks. Sensors 2018, 18, 3742. [Google Scholar] [CrossRef] [PubMed] [Green Version]
  8. Tolocka, M.; Tseng, P.; Wiener, R. Optimization of the Wash-Off Method for Measuring Aerosol Concentrations. Aerosol Sci. Technol. 2001, 34, 416–421. [Google Scholar] [CrossRef]
  9. Gerke, K.M.; Sidle, R.C.; Mallants, D. Criteria for selecting fluorescent dye tracers for soil hydrological applications using Uranine as an example. J. Hydrol. Hydromech. 2013, 61, 313–325. [Google Scholar] [CrossRef]
  10. Bakker, D.P.; van der Plaats, A.; Verkerke, G.J.; Busscher, H.J.; van der Mei, H.C. Comparison of velocity profiles for different flow chamber designs used in studies of microbial adhesion to surfaces. Appl. Environ. Microbiol. 2003, 69, 6280–6287. [Google Scholar] [CrossRef] [PubMed] [Green Version]
  11. Bakker, D.P.; Huijs, F.M.; de Vries, J.; Klijnstra, J.W.; Busscher, H.J.; van der Mei, H.C. Bacterial deposition to fluoridated and non-fluoridated polyurethane coatings with different elastic modulus and surface tension in a parallel plate and a stagnation point flow chamber. Colloids Surf. B Biointerfaces 2003, 32, 179–190. [Google Scholar] [CrossRef]
  12. Bundy, K.J.; Harris, L.G.; Rahn, B.A.; Richards, R.G. Measurement of fibroblast and bacterial detachment from biomaterials using jet impingement. Cell Biol. Int. 2001, 25, 289–307. [Google Scholar] [CrossRef] [PubMed]
  13. Otto, C.; Zahn, S.; Plenker, J.; Rohm, H. Application of a flow cell for the comparative investigation of the cleaning behavior of starch and protein. J. Food Eng. 2014, 131, 1–6. [Google Scholar] [CrossRef]
  14. Truckenbrodt, E. Elementare Strömungsvorgänge dichtebeständiger Fluide. In Fluidmechanik: Band 1: Grundlagen und Elementare Strömungsvorgänge Dichtebeständiger Fluide; Springer: Berlin/Heidelberg, Germany, 1989; pp. 188–361. ISBN 978-3-662-07274-5. [Google Scholar]
  15. Yunus, A.C. Fluid Mechanics: Fundamentals and Applications (Si Units); Tata McGraw Hill Education Private Limited: Delhi, India, 2010. [Google Scholar]
  16. Goode, K.R.; Asteriadou, K.; Robbins, P.T.; Fryer, P.J. Fouling and Cleaning Studies in the Food and Beverage Industry Classified by Cleaning Type. Compr. Rev. Food Sci. Food Saf. 2013, 12, 121–143. [Google Scholar] [CrossRef]
  17. Xin, H.; Chen, X.D.; Özkan, N. Cleaning Rate in the Uniform Cleaning Stage for Whey Protein Gel Deposits. Food Bioprod. Process. 2002, 80, 240–246. [Google Scholar] [CrossRef]
  18. Fickak, A.; Al-Raisi, A.; Chen, X.D. Effect of whey protein concentration on the fouling and cleaning of a heat transfer surface. J. Food Eng. 2011, 104, 323–331. [Google Scholar] [CrossRef]
Figure 1. New design for a PPFC.
Processes 09 00881 g001
Figure 2. The fully assembled PPFC: (A) top view of the flow measurement cell and (B) side view of the flow measurement cell.
Processes 09 00881 g002
Figure 3. The interchangeable flow channel with a height of 5 mm: (A) top view of the flow channel and (B) side view of the flow channel.
Processes 09 00881 g003
Figure 4. A typical SSC.
Processes 09 00881 g004
Figure 5. SSC samples with the fouling material.
Processes 09 00881 g005
Figure 6. Fluorescence spectroscopy setup: (A) fluorescence spectrometer, (B) flow through cuvette, and (C) special cuvette holder.
Processes 09 00881 g006
Figure 7. Experimental setup for cleaning tests.
Processes 09 00881 g007
Figure 8. Cleaning curves for constant the Reynolds number of 5000.
Processes 09 00881 g008
Figure 9. Cleaning times plotted against the Reynolds number.
Processes 09 00881 g009
Figure 10. Cleaning times plotted against velocity.
Processes 09 00881 g010
Figure 11. Cleaning times plotted against the wall shear stress.
Processes 09 00881 g011
Table 1. Variation of wall shear stress and velocity under constant Reynolds number.
Reynolds Number1 ParameterChannel Depth
2.5 mm5 mm7.5 mm
-NA-Hydraulic diameter [m]0.00440.0080.0109
2500Mass flow [kg/h]115.234128.138140.951
Velocity [m/s]0.6410.3560.261
Wall shear stress [Pa]2.2940.7080.380
5000Mass flow [kg/h]230.648256.275281.903
Velocity [m/s]1.2810.7120.522
Wall shear stress [Pa]7.1762.3811.281
7500Mass flow [kg/h]345.971384.413422.854
Velocity [m/s]1.9221.0680.783
Wall shear stress [Pa]15.6864.8422.604
1 Flow is controlled by controlling the mass flow in the system.
Table 2. Parameters and correlation obtained.
Parameter2 Fit EquationR2
The Reynolds number: 2.5 mm channel y = 15234.4   x 0.584 0.967
The Reynolds number: 5 mm channel y = 24344.7   x 0.597 0.986
The Reynolds number: 7.5 mm channel y = 17919.3   x 0.537 0.991
Wall shear stress [Pa] y = 200.9   x 0.318 0.983
Velocity [m/s] y = 125.2   x 0.578 0.982
2y refers to the cleaning times and x refers to the respective parameter.
Publisher’s Note: MDPI stays neutral with regard to jurisdictional claims in published maps and institutional affiliations.

