
Intergenerational Externalities Influence for Exploitation Process of Rare Metal Minerals


1
School of Business, Central South University, Changsha 410083, China
2
Institute of Metal Resources Strategy, Central South University, Changsha 410083, China
3
Changsha Water Industry Group Co., LTD., Changsha 410083, China
4
School of Mathematics and Statistics, Central South University, Changsha 410083, China
*
Author to whom correspondence should be addressed.
Processes 2021, 9(5), 883; https://0-doi-org.brum.beds.ac.uk/10.3390/pr9050883
Submission received: 2 April 2021
/
Revised: 5 May 2021
/
Accepted: 7 May 2021
/
Published: 18 May 2021
(This article belongs to the Special Issue Energy Conservation and Emission Reduction in Process Industry)
Abstract
:Rare metal minerals are important strategic resources. Promoting the sustainable development of their mining process is not only related to energy and environmental issues, but also directly affects the sustainable development of the entire supply chain. Considering the influence of intergenerational externalities on the equilibrium in the rare metal mineral exploitation process is of critical significance to maintaining the sustainable development of rare metal minerals and securing a sustainable resource exploitation process. This paper develops a sustainability analysis model based on an intergenerational externalities influence and examines the influence of the shift in comprehensive production cost burden through the whole supply chain, which aims at the sustainable development of the exploitation process of rare metal minerals. The results indicate that in a vertically linked industrial chain, the upstream and downstream structure of the supply chain and the type of production cost are the factors that determine sustainable development. Upstream suppliers or countries should design their production systems based on their own circumstances. Specifically, when an upstream country has a low technological level for mineral exploitation processes and high development costs, a resource tax would be more effective in mediating sustainable development.
1. Introduction
Rare metal minerals constitute the foundation of a country’s industrial development, as well as an important pillar that supports sustainable social development. The exploitation process has a significant impact on its sustainable development. China’s rare metal industry has long been marked by disorderly development, the waste of resources, and environmental degradation. A streamlined tax and fee policy with regard to development compensation has yet to be developed. The existing policy heavily focuses on compensation for economic and ecological losses, does not pay sufficient attention to intergenerational compensation, and overlooks the long-term benefits of the environment and resource utilization. The market price for China’s rare metal minerals has long been below their actual value. The industry is characterized by rapid resource depletion, high environmental costs, and small profit margins, which have constituted a serious impediment to the industry’s sustainable development. The Report to the 18th National Congress of the Communist Party of China (CPC) recommended deepening the reform of prices, taxes, and fees for resource products and establishing a system for paying for resource consumption and compensating for ecological damage—a system that responds to market supply and demand and resource scarcity, recognizes the ecological value, and requires intergenerational compensation. This requirement represented a top-down design for deepening the reform of prices, taxes, and fees for resource products. Streamlining the compensation system for resource development should not only consider the ecological value of resources but also be mindful of compensation for future generations. The development game for rare metal minerals, however, is complex. The externalities created in this process cannot be reasonably borne in the supply chain. Rare metal mineral development is affected by multiple players; not only does it depend on the game among firms (the oligopoly) but it is also affected by a variety of factors, such as fee and tax policies, international trade patterns, demand and supply in the supply chain, both upstream and downstream, and expectations for industrial policies. Given this reality, systematically studying the complexity of rare metal mineral development—especially the mechanism through which intergenerational externalities influence the game equilibrium—against the backdrop of international mineral development is of profound and long-lasting significance to exploring sustainable development of rare metal minerals, breaking the existing competitive pattern of the rare metal industry, and incrementally controlling the discourse-setting authority with regard to rules on the international trade of rare metal minerals.
Intergenerational externalities are manifested in the role and influence of the previous generation of resource consumption as “transaction insiders” on the subsequent generations who do not have a direct transaction agreement relationship with them as “transaction outsiders” [1]. From the perspective of the intergenerational allocation of resources, in reality, this intergenerational externality is manifested as the influence of the previous generation’s insufficient or excessive consumption of resources on the positive or negative externalities of several subsequent generations. The existence of intergenerational externalities causes one of the “trading insiders” or “trading outsiders” between generations to enjoy additional benefits but not bear the corresponding costs in the process of intergenerational allocation of resources. The objective existence of the phenomenon affects the effective use of resources in a very hidden way, so that when considering the intergenerational category, the price of resources deviates from the actual supply and demand relationship of resources. It can be seen that intergenerational externalities are not conducive to intergenerational equity and sustainable development of intergenerational allocation of resources.
Theoretical research by the academic community on compensation for rare metal mineral development has laid a solid foundation for addressing the externality issue related to rare metal minerals. However, due to the difficulty in measuring marginal user costs and marginal external costs and due to market participants’ omission of externalities in considering their costs, there is a value distortion in the development and utilization of rare metal minerals in China, leading to disequilibrium in the market game and international trade disputes. Therefore, examining how externalities affect the market game in the development of rare metal minerals, identifying the path through which external costs are shifted in the game, and studying how to allocate the external costs among different game participants are important theoretical issues in the research of the game equilibrium in the rare metal mineral market. There are two main theoretical frameworks in this paper: one is the strategic trade policy model based on the vertical linked market [2,3,4]; The second is the classic tax burden transfer literature in industrial organization literature [5,6,7], that is, how consumption tax (production tax) is transferred between consumers and producers. The existing literature mainly focuses on how demand elasticity and supply elasticity affect tax burden-bearing.
This paper uses rare earths—A typical strategic mineral resource—as an example for the study of rare metal minerals and analyses the impact of intergenerational externalities on the game equilibrium in rare metal mineral development. The rare earths exploitation process mainly includes mining, rough machining, transportation, and finish machining. Existing research on the development and exploitation of strategic mineral resources, such as rare earths, mainly focuses on the sustainable development of these resources. Based on the demand forecast and analysis, Ali et al. explored how to maintain ecological sustainability in the global mineral resource supply in the future decades [8]. From the perspective of energy sustainability, Bazilian analysed the critical role of minerals and metals in the current “energy transition” and possible policy measures and pointed out that cleaner, low-carbon technologies are the future direction of energy development [9]. Carvalho examined the macro relationship between the mining industry and sustainability and proposed that sustainable resource development in the future would depend, to a large extent, on progress in the mining industry [10]. Yakovleva, Monteiro, and Hilson conducted research related to the goal of sustainable development in resource mining and explored how the entire mining industry as well as certain small firms developed their sustainable development goals [11,12,13]. Kamenopoulos and Burford studied the criteria and indicators of sustainable development, with a focus on the criteria for and performance indicators of sustainable development in rare earth mining [14,15]. Liang et al. applied the entropy method and grey relational analysis method, and developed a set of performance indicators for the sustainable development of rare earths in China, and evaluated the sustainable development of rare earths in China from 2006 to 2016 [16]. The results indicated that the main factor that affected the sustainable development of rare earths was a lag in the development of an environmental protection system and a rare earth protection system. Using rare earths as an example, Okabe discussed the bottleneck in the supply of rare metals and the importance of recycling [17]. Huang studied the sustainable development of rare earth mining from the perspectives of the environment and public health [18].
The existing literature on the development and exploitation of strategic resources, such as rare earths, mostly focuses on either sustainable development of the mining industry or tax policies for mineral resources. The research is limited to theoretical analyses and only conducting analyses through models and does not systematically integrate rare metal minerals or the issue of intergenerational externalities to examine the role that intergenerational externalities play in a vertically linked market. Building on previous research, this paper makes certain progress in that it incorporates both theoretical policy analyses and analyses based on models developed for the research. The paper examines—in a vertically linked competitive market—how to simulate market competition through mathematical models, how to make a more significant shift in the tax burden, and how to shift the costs of developing rare metal minerals to countries in the downstream supply chain in a reasonable and effective manner that conforms to rules.
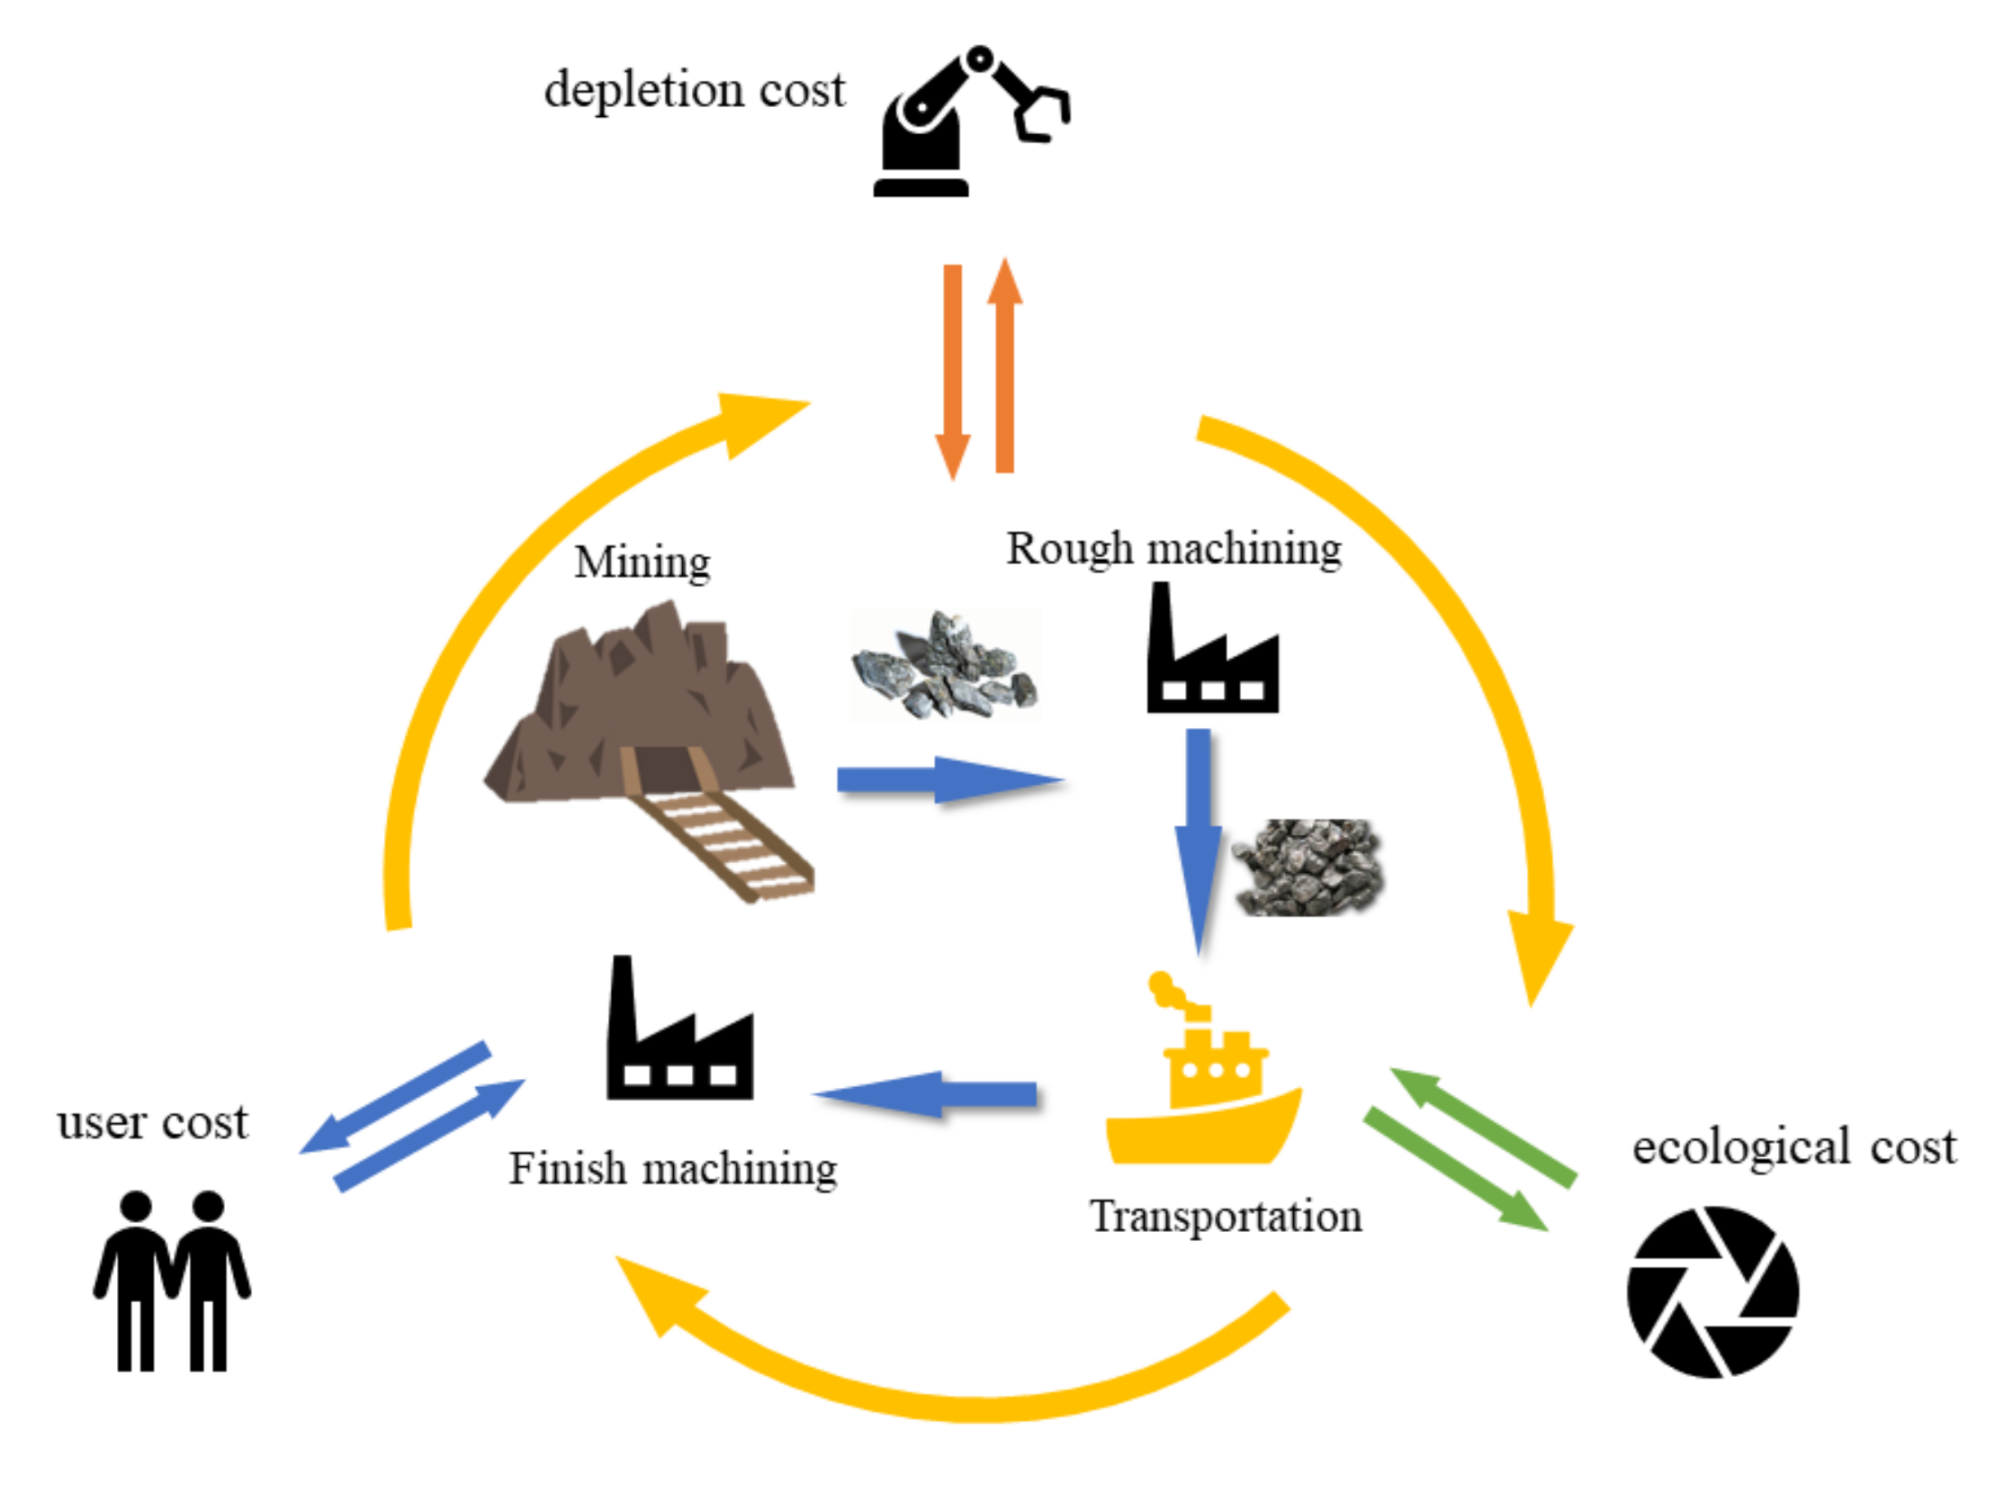
This paper develops a sustainability analysis model based on the intergenerational externality influence to incorporate the costs, including user cost, ecological cost, and depletion cost, that reflect scarcity and externalities into the game, as shown in Figure 1. Based on the current situation of the rare metal mineral market and international patterns, a game model of the rare metal mineral market is constructed, a game model of externalities is introduced, and the mechanism by which intergenerational externalities influence the game of the rare metal mineral market is analysed. Additionally, the mechanism by which external costs influence the game and the path whereby the external costs are shifted is analysed. Different from the existing industrial organization literature that discusses the tax burden transfer of specific tax and AD valorem tax under the closed economy, this paper discusses it under the open economy. In addition, this paper innovatively considers vertically related upstream and downstream markets in a unified way. The whole game process is divided into two parts. In the first part, domestic rare metal mining manufacturers compete for Cournot output; in the second part, upstream and downstream manufacturers conduct import and export trade, forming an economic cycle. In contrast to previous studies, when building the game model of manufacturers in upstream and downstream countries, for the convenience of processing and without distinguishing the difference of market influence of downstream oligarchic manufacturers, we fully consider the difference of products of downstream oligarchic manufacturers and the difference of market influence of oligarchic manufacturers. In addition, in past strategic trade policy literature, there is more of a focus on specific taxes, but this paper will bring specific tax and tax burden shifts into the framework of strategic trade policy.
2. Methods
2.1. Cournot Triopoly Game Model
A Cournot triopoly game model was developed based on international market patterns. Assume there are three firms acting as a triopoly in a market of rare metal mineral development, , and , and that they account for the majority of the market share. Each oligopoly optimizes its own interest by adjusting the sales price based on the market situation and the government’s macro regulatory policies; each oligopoly’s quantity of mining is also adjusted in response to the pricing; thus, the process is complex. When oligopoly gaming occurs frequently, the price of rare metal minerals will also change frequently, and the market will become disorderly. When the gaming reaches an equilibrium condition, the market eventually stabilizes. Let ) denote the pricing of each of the three firms, , and ) denote the mining quantity that each firm decides on based on the mineral price resulting from the last gaming. To be more relevant to the reality of the market, the non-linear demand function is employed:
where and the cost function is set as a linear function
In the equation, denotes the cost of firms , respectively; and denotes the cost of each unit of minerals mined, which depends on each firm’s mining technology. The profit function of each oligopoly is as follows:
Substitute Equations (1)–(3), and we have
The marginal profit of the triopoly is , .
Due to constant changes in the market, each oligopoly must determine its strategy based on the market conditions to maximize profits. Limited by the information available, however, each oligopoly can only determine a pricing strategy for the next round of gaming out of bounded rationality. In the abstract model, this strategy is reflected by applying a price adjustment factor to the model. Let denote the price adjustment factor; the repeated pricing game model is as follows:
Substitute the marginal profit into the above equation; the repeated pricing game models of the triopoly in the rare metal mineral market are derived as follows:
where are controllable parameters that denote the price adjustment factors of the triopoly. Assign values to the parameters:
Substitute the above parameters into Equation (7); a three-dimensional discrete dynamic system is derived:
Solve the model using the Matlab application; the eight fixed points of the system are obtained:
Consider the Jacobian matrix of the only non-negative real root , and analyse the local stability
In the equation, the characteristic equation of is:
where
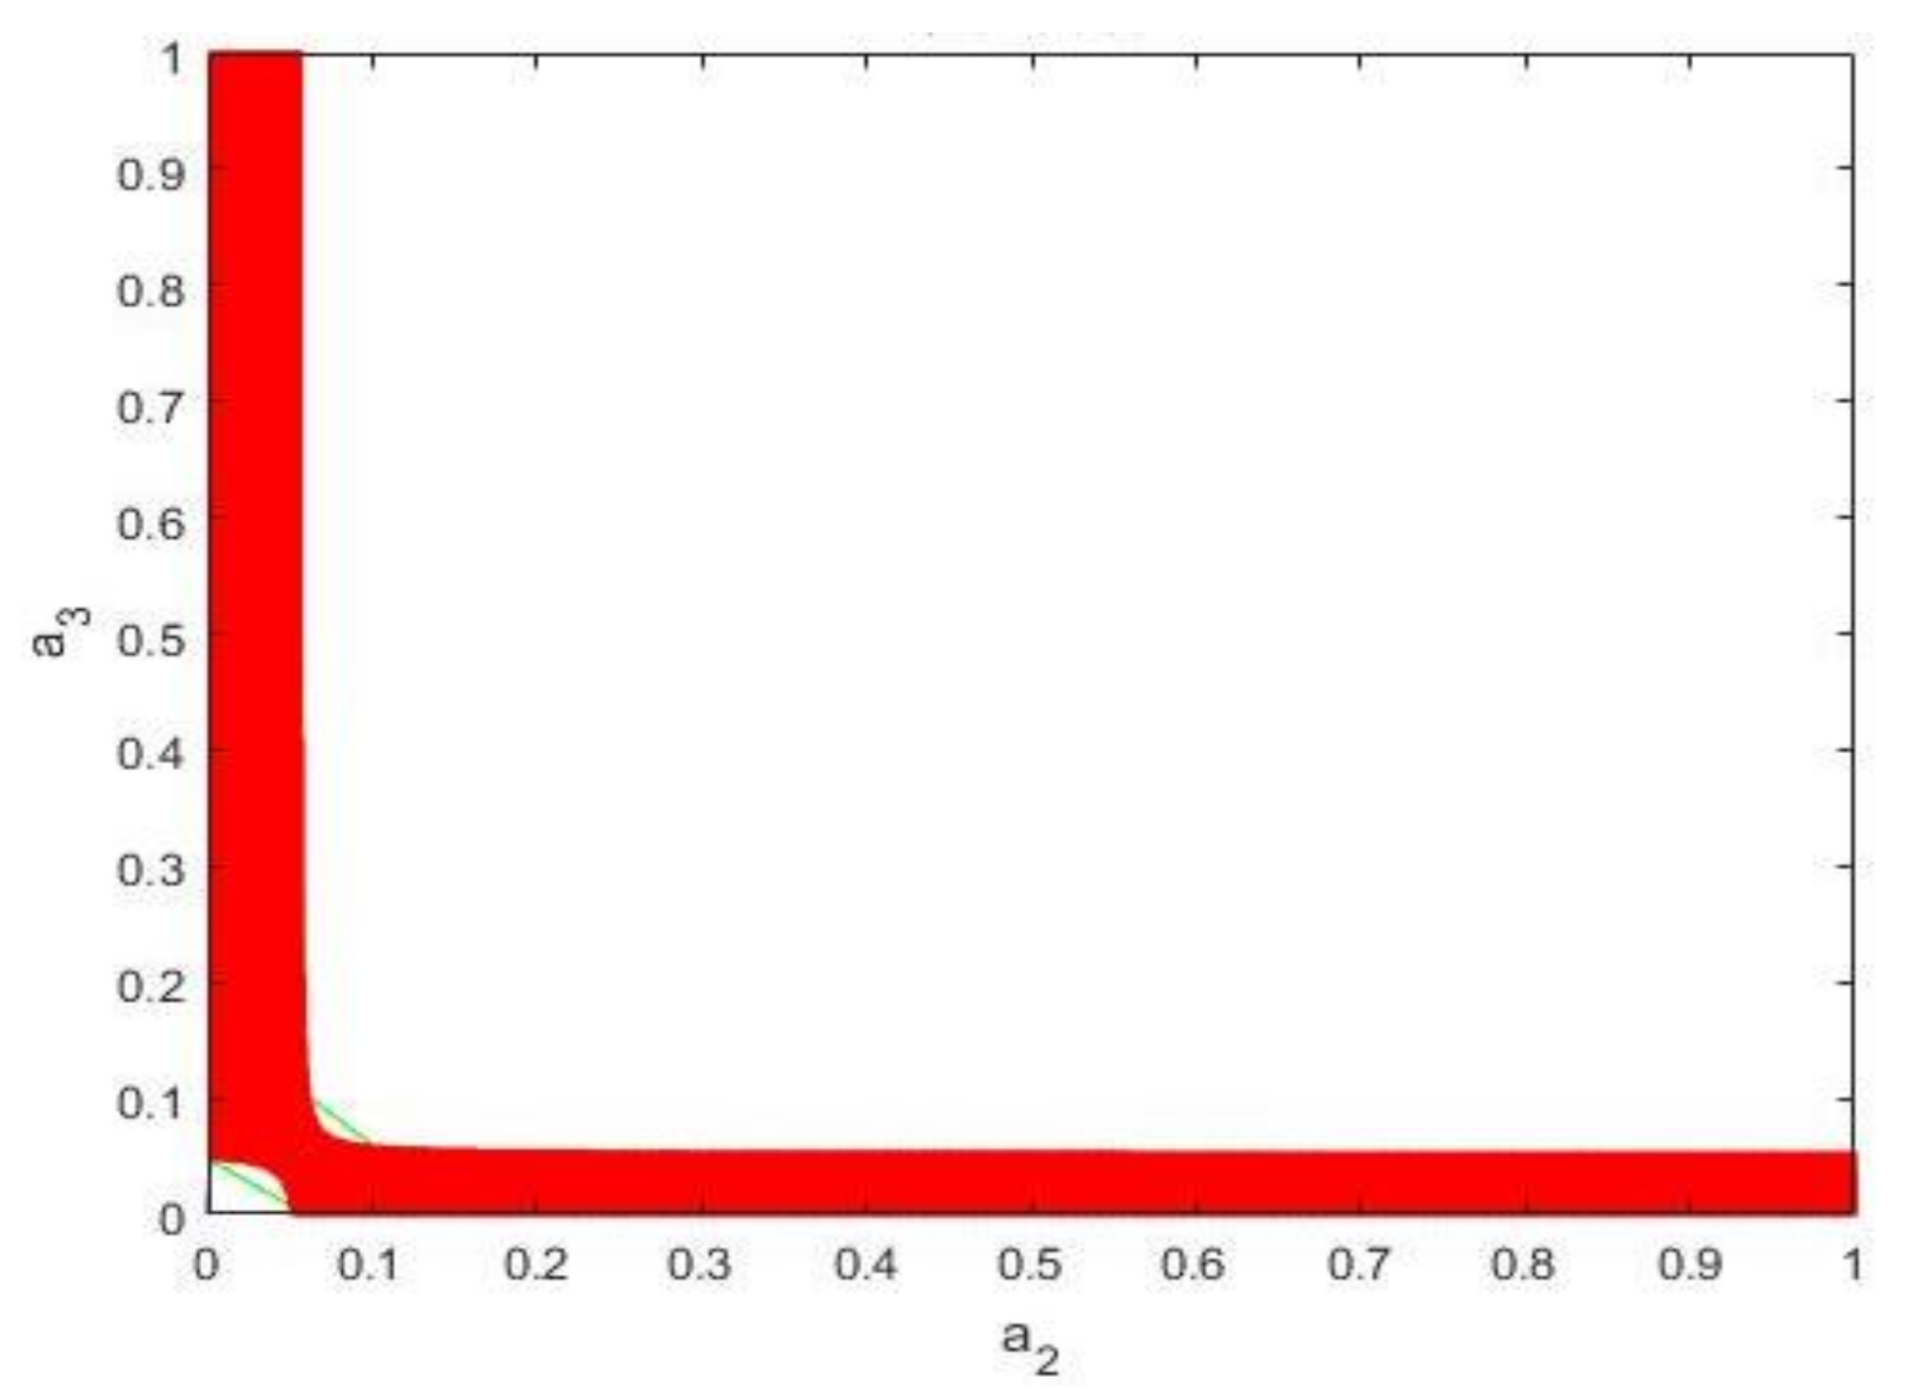
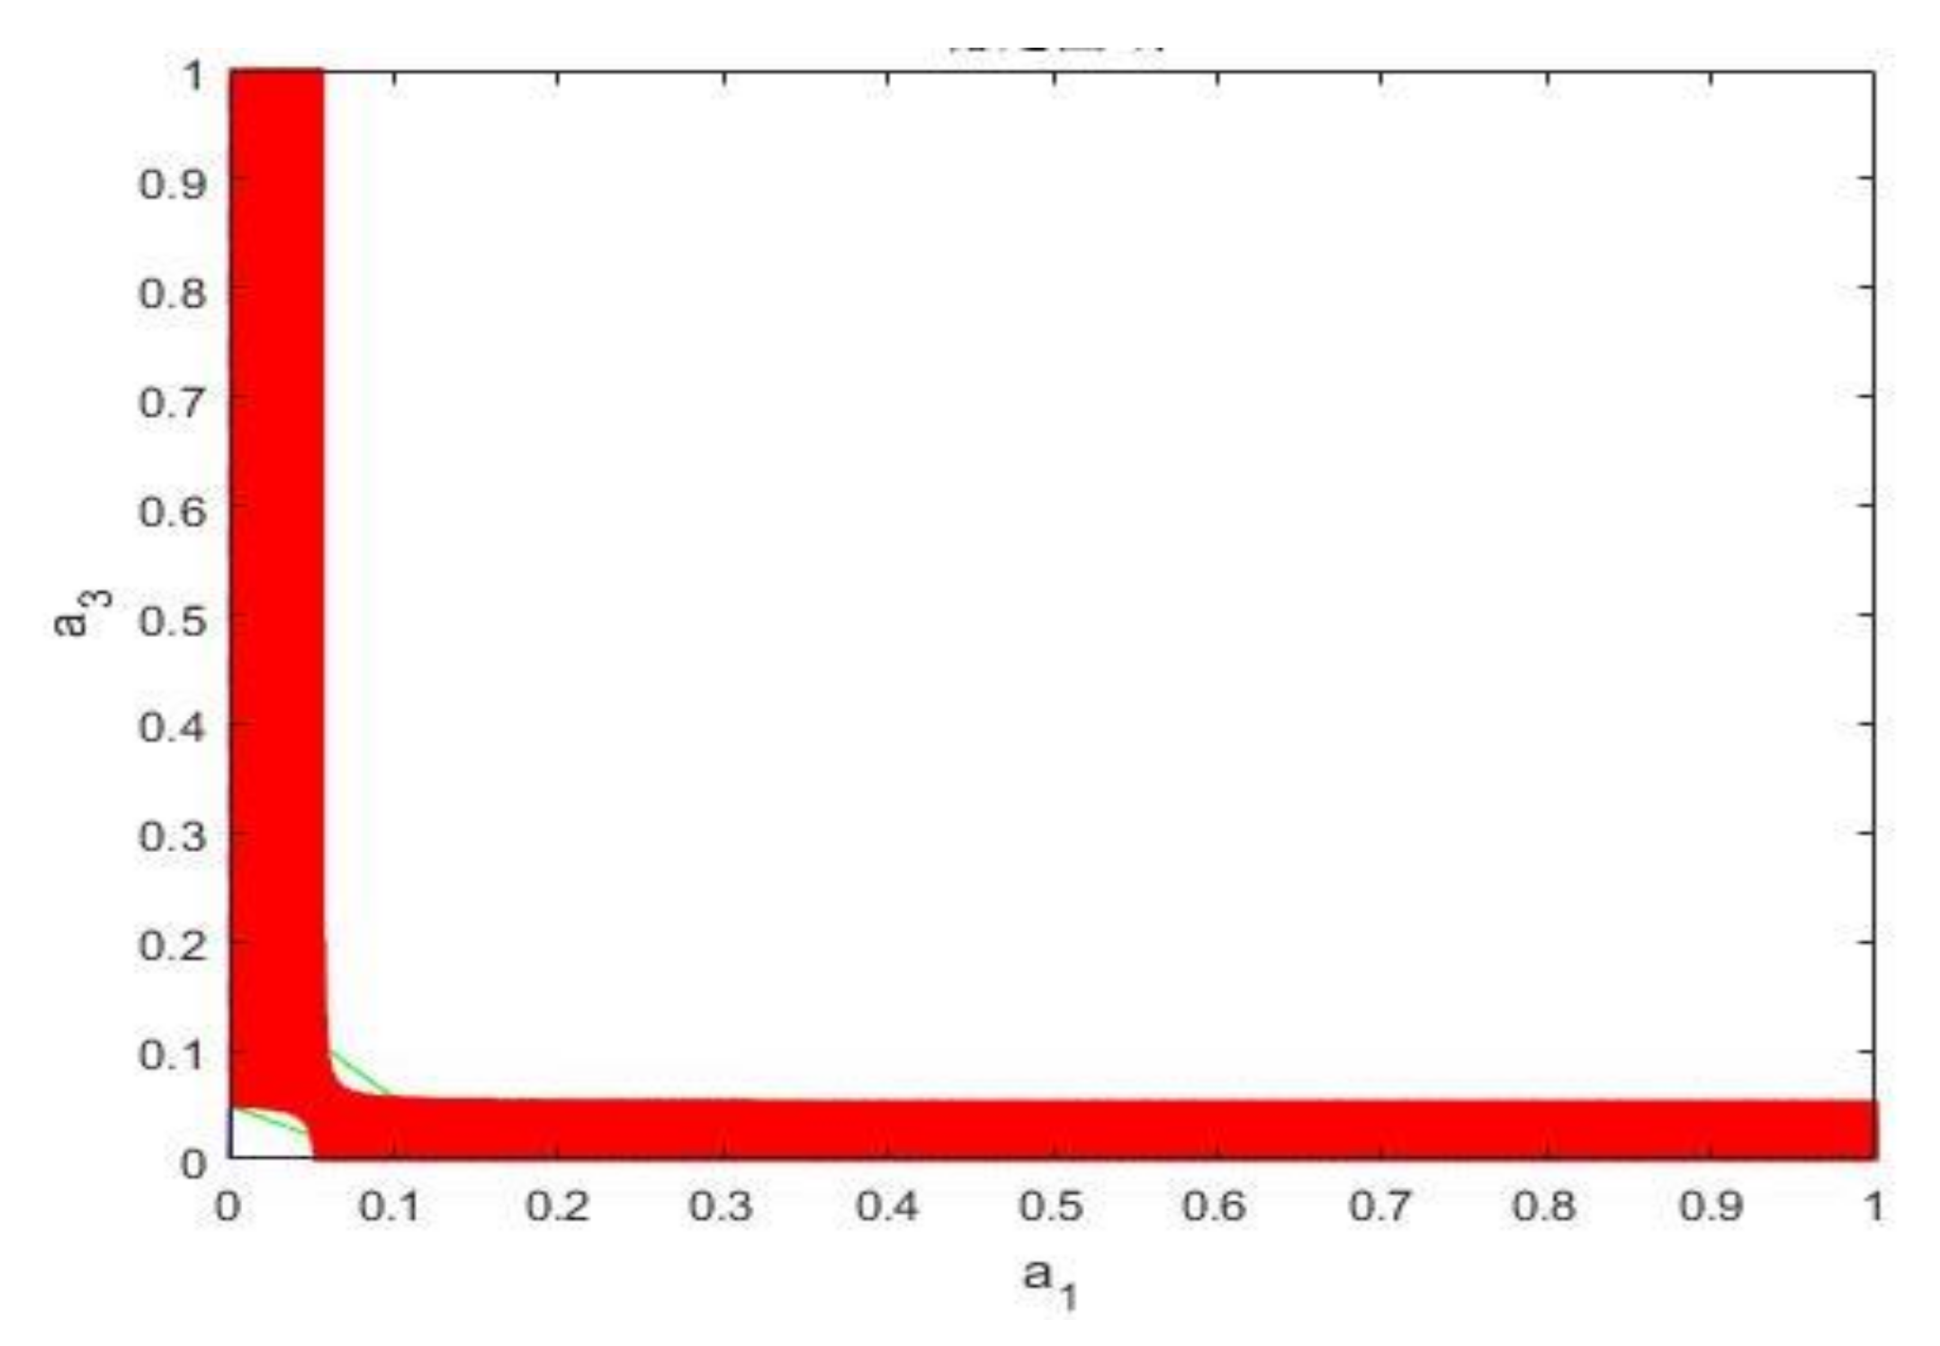
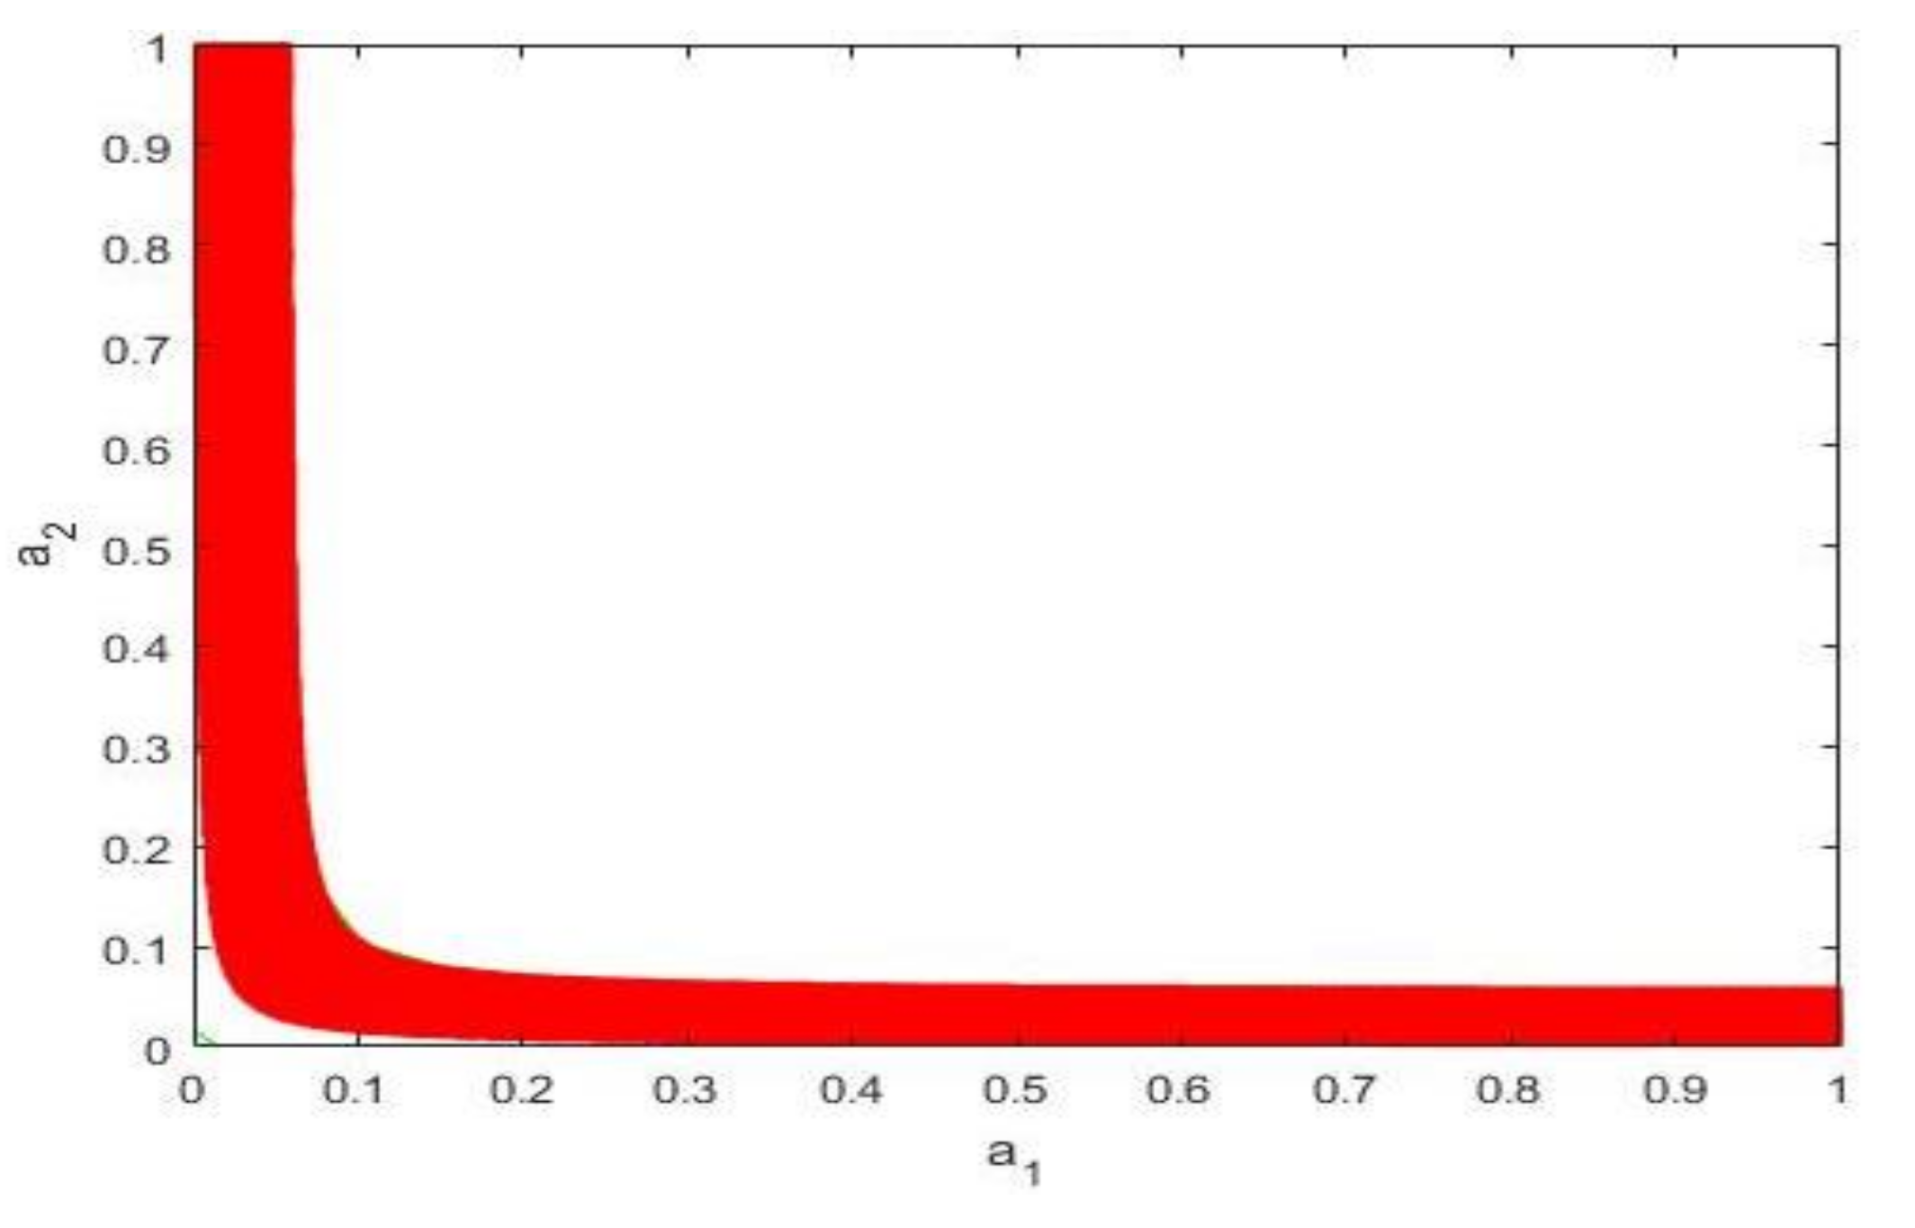
Based on the stability assessment, the stable region of the Nash equilibrium point satisfies:
Let ; the stable region is the red area of planes , ,, respectively, as shown in Figure 2, Figure 3 and Figure 4.
The three figures depict the scenario in which one oligopoly firm determines its price adjustment strategy, and the other two oligopoly firms adjust their prices within the stable region. The three figures are similar because the oligopoly firms have considerable influence, and the parts that are different indicate the differences among the oligopoly firms. If the other two oligopoly firms simultaneously adjust their prices or do not make any adjustments, the market stability will be affected.
The oligopoly firms will constantly adjust pricing to maximize their own interests. Any adjustment by one oligopoly firm will promote the other two to adjust accordingly, thereby generating continuous gaming in the market and affecting the prices of the entire rare metal mineral market. Although the pace at which the oligopoly firms adjust prices will not change the equilibrium point, it will change the stability of the Nash equilibrium point. If the firms in the market develop a healthy competition pattern, the market will gradually stabilize; otherwise, if an oligopoly firm frequently changes its prices, namely, prices are adjusted at such a fast pace that those adjustments affect market stability, then the rare metal mineral market will gradually transition into a disorderly state.
2.2. Basic Gaming Model of Intergenerational Externalities
Assume that in a vertically linked international trade market there are m producers of high-tech products, to achieve the sustainable development of rare metal minerals, the government of the upstream country must levy a resource tax (volume-based or price-based) on the mining firms. Assume that firms in the downstream country rely on imports for all raw materials. Let denote the quantity of a product by the ith firm in the downstream country; the product’s inverse demand function is:, where denotes the weighting factor to reflect the influence of the products of firms in the downstream country in the market. Let denote the production costs of the firms in the downstream and upstream countries, respectively; then the profit function of firms in the downstream country is:
where T denotes the import tariff, denotes the price of the products from the downstream country, and denotes the price of the products from the downstream county. Let denote the volume of production of the kth firm in the upstream country; the profit function is:
where t denotes the specific duty, denotes the volume-based resource tax, and the price-based resource tax.
The model for analysing the mechanism by which intergenerational externalities exert an influence is connected to the Cournot triopoly game model for rare metal minerals: the upstream country will engage in price gaming first; when the Cournot equilibrium is reached, the market price stabilizes. Firms in the downstream country purchase raw materials in the market and engage in Cournot competition for production based on the price of raw materials to determine their respective optimal production. The ultimate production by firms in the downstream country, in turn, exerts an impact on the market and affects firms’ pricing for intermediate products in the upstream country, and this initiates a new round of gaming. To simplify the issue, we assume that one unit of intermediate product, after processing, will produce one unit of final product. Given this assumption, we have , where k = 1, 2, or 3, the induced inverse demand function of the intermediate product holds.
Equation (13) indicates the pricing of the intermediate product by the upstream country. By substituting this equation into Equation (11), we obtain the profit function of the kth firm in the upstream country. Furthermore, through calculating and applying the marginal profit, the equations for the intermediate and final products (14) and (15) are derived:
We apply the single-variable analysis method to examine the impact of different tax levy methods on rare metal mineral development. First, let ; find the derivative of ω with respect to t and the derivative of p with respect to t:
Then, let t = 0; find the derivative of ω and p with respect to τ
Next, consider a more general situation: assume there are firms in the upstream country, and firms in the downstream country. The price of the intermediate product in the upstream country and the final product in the downstream country are expressed, respectively, as follows:
with the controlled variable method, we separately consider the situation in which only a specific duty or ad valorem tax is levied, find the derivative of the price of the intermediate product and the price of the final product to the specific duty and ad valorem tax, and seek the derivative of the upstream and downstream market concentration, respectively. These steps allow us to examine the impact of market concentration in the upstream and downstream countries on the shift in the resource tax burden. The following are derived:
3. Results and Discussion
3.1. The Intergenerational Externalities Influence on Rare Metal Minerals Exploitation Process
Static Analysis of the Mechanism by Which Intergenerational Externalities Exert Influence
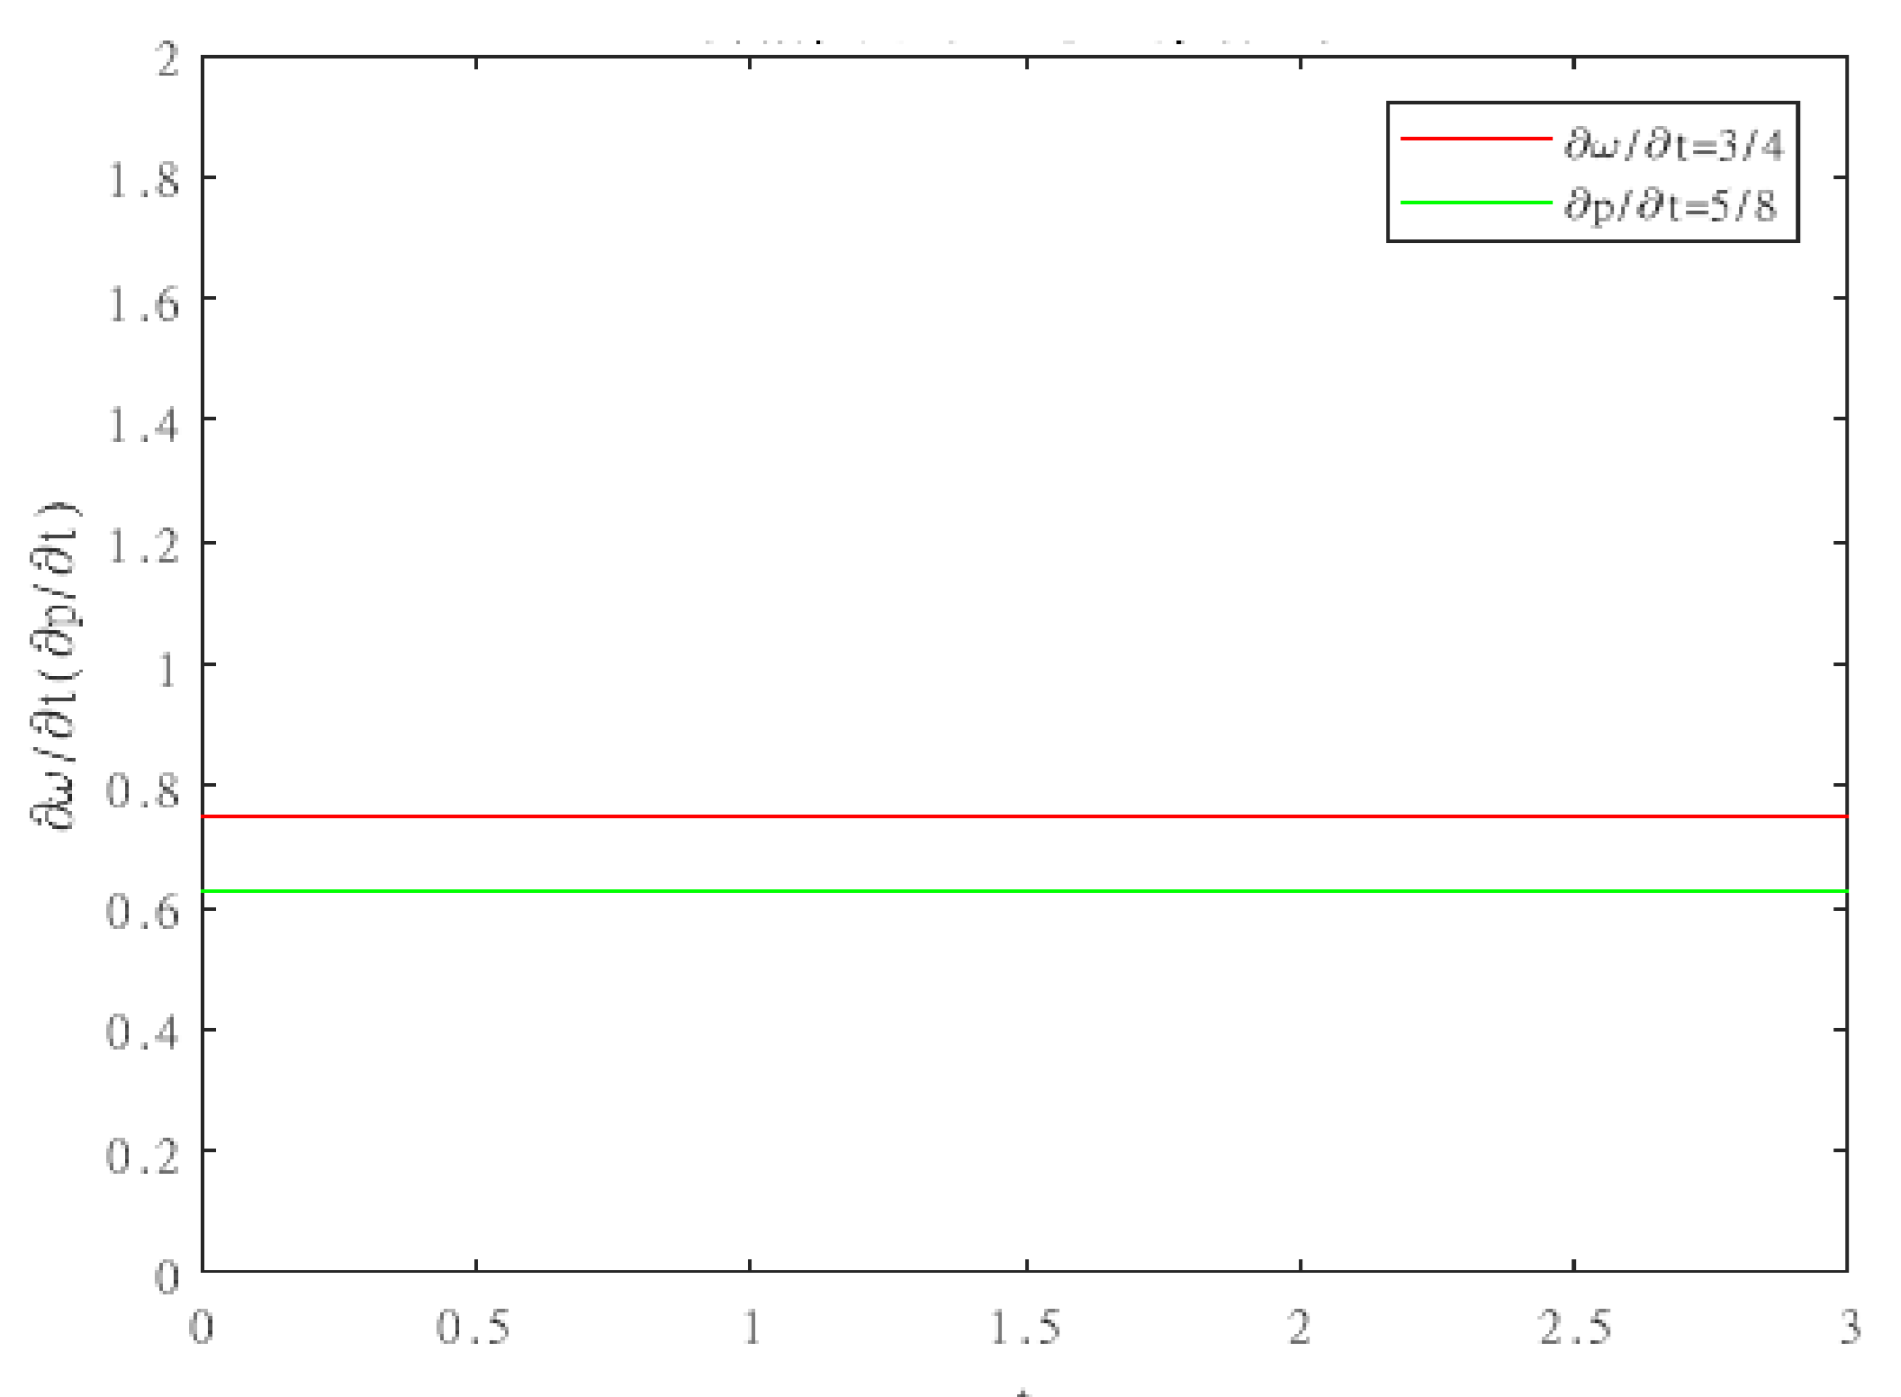
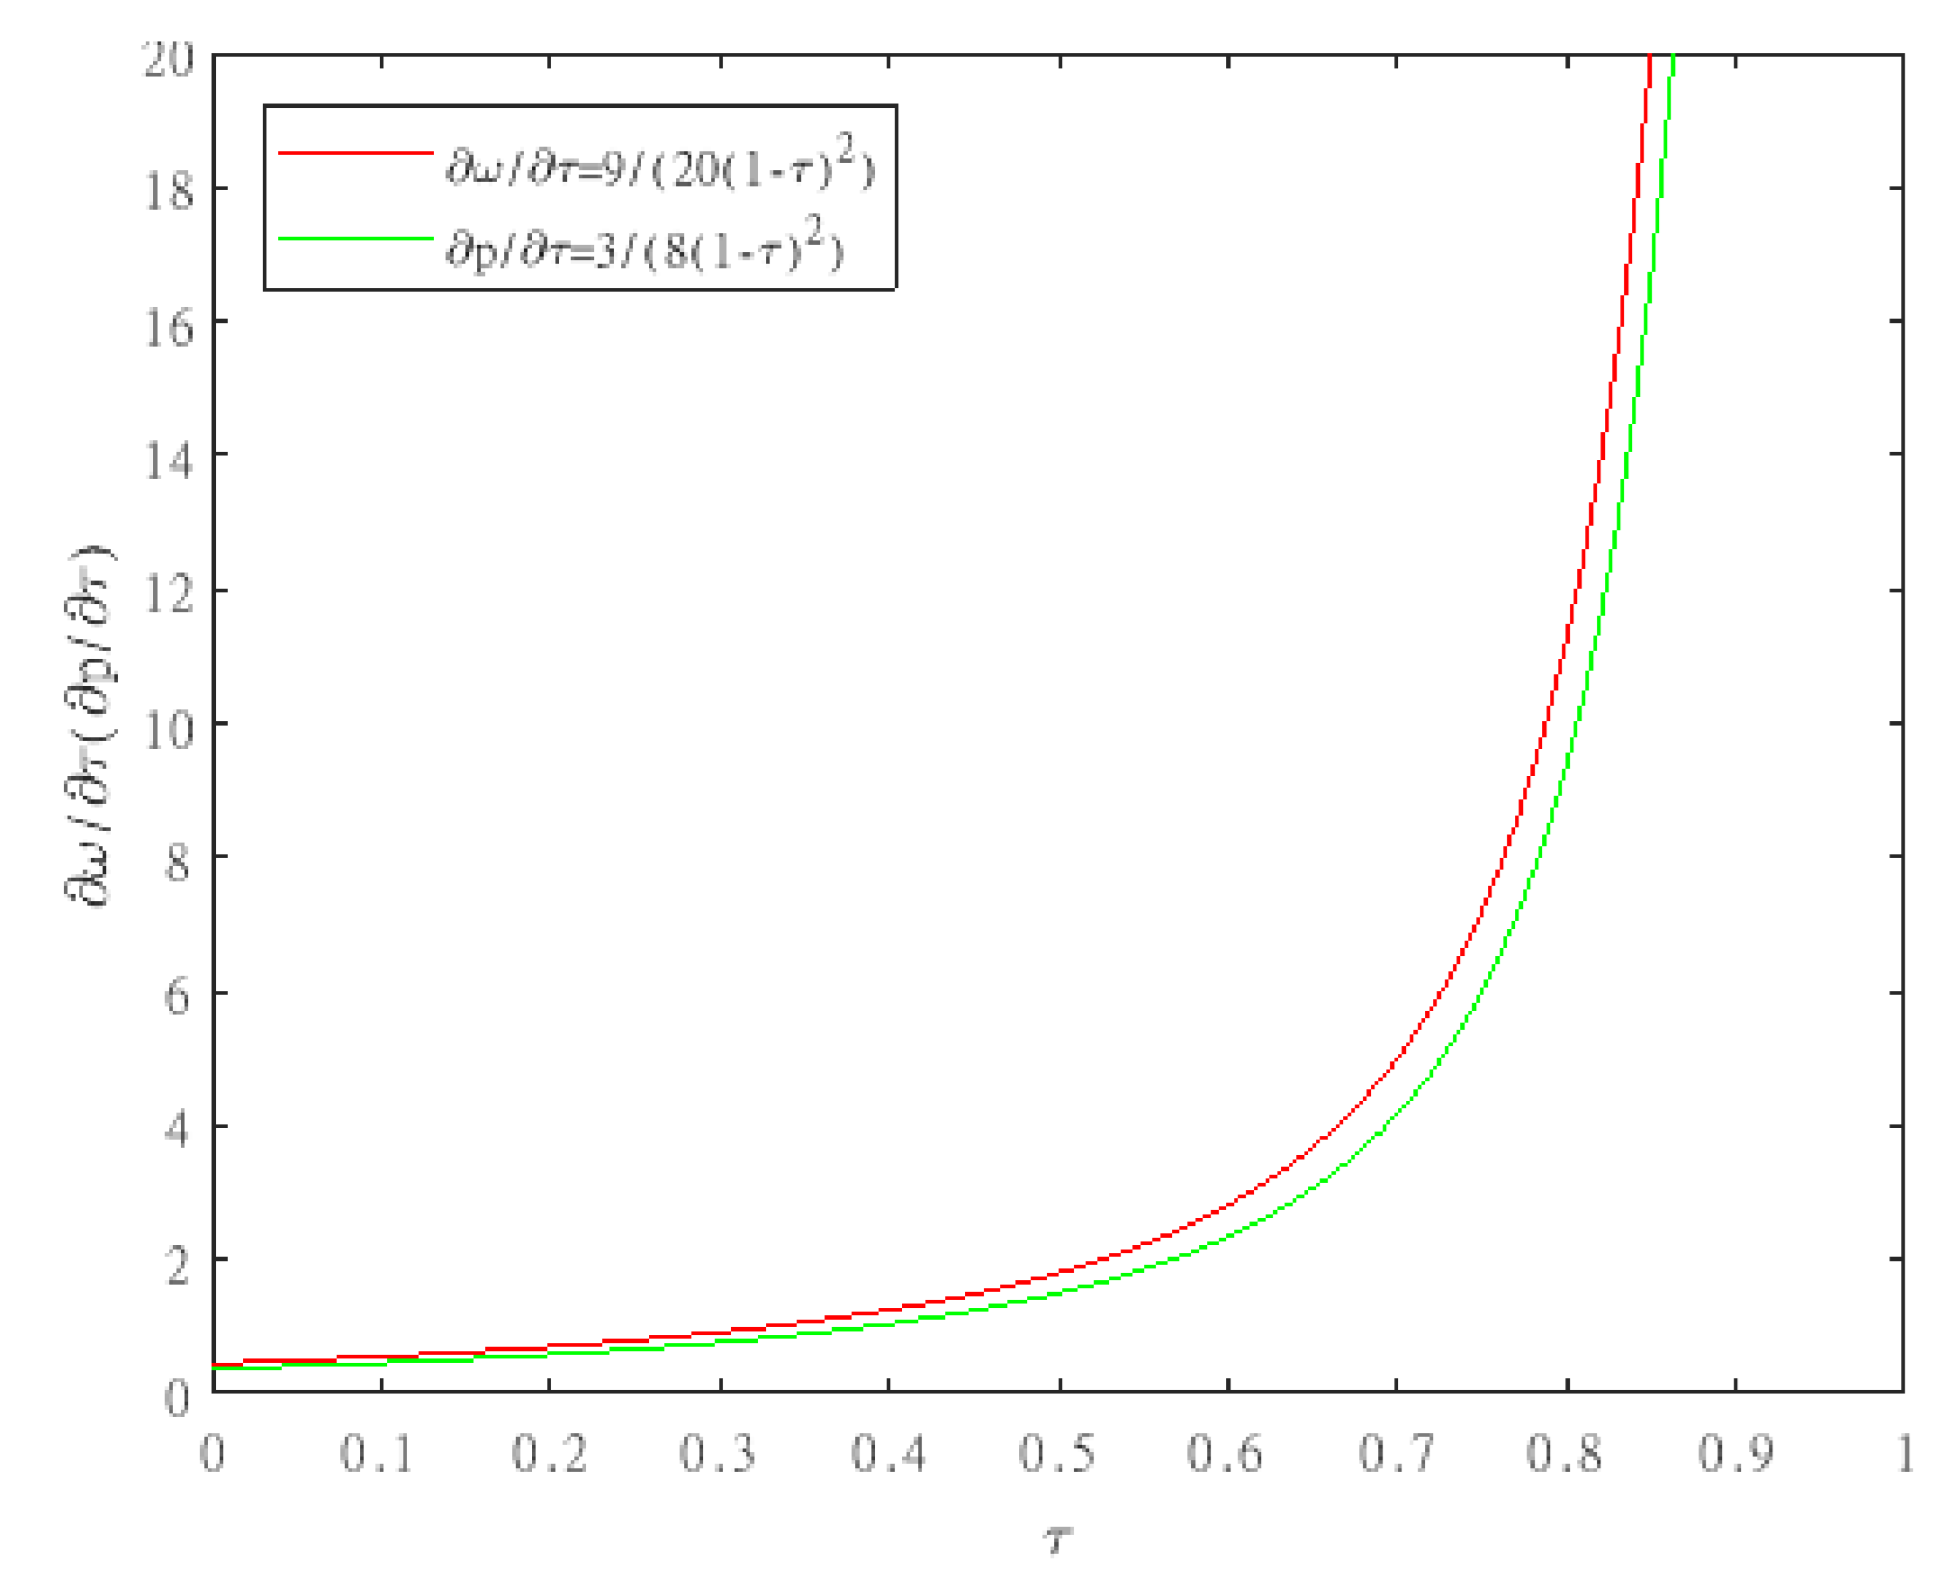
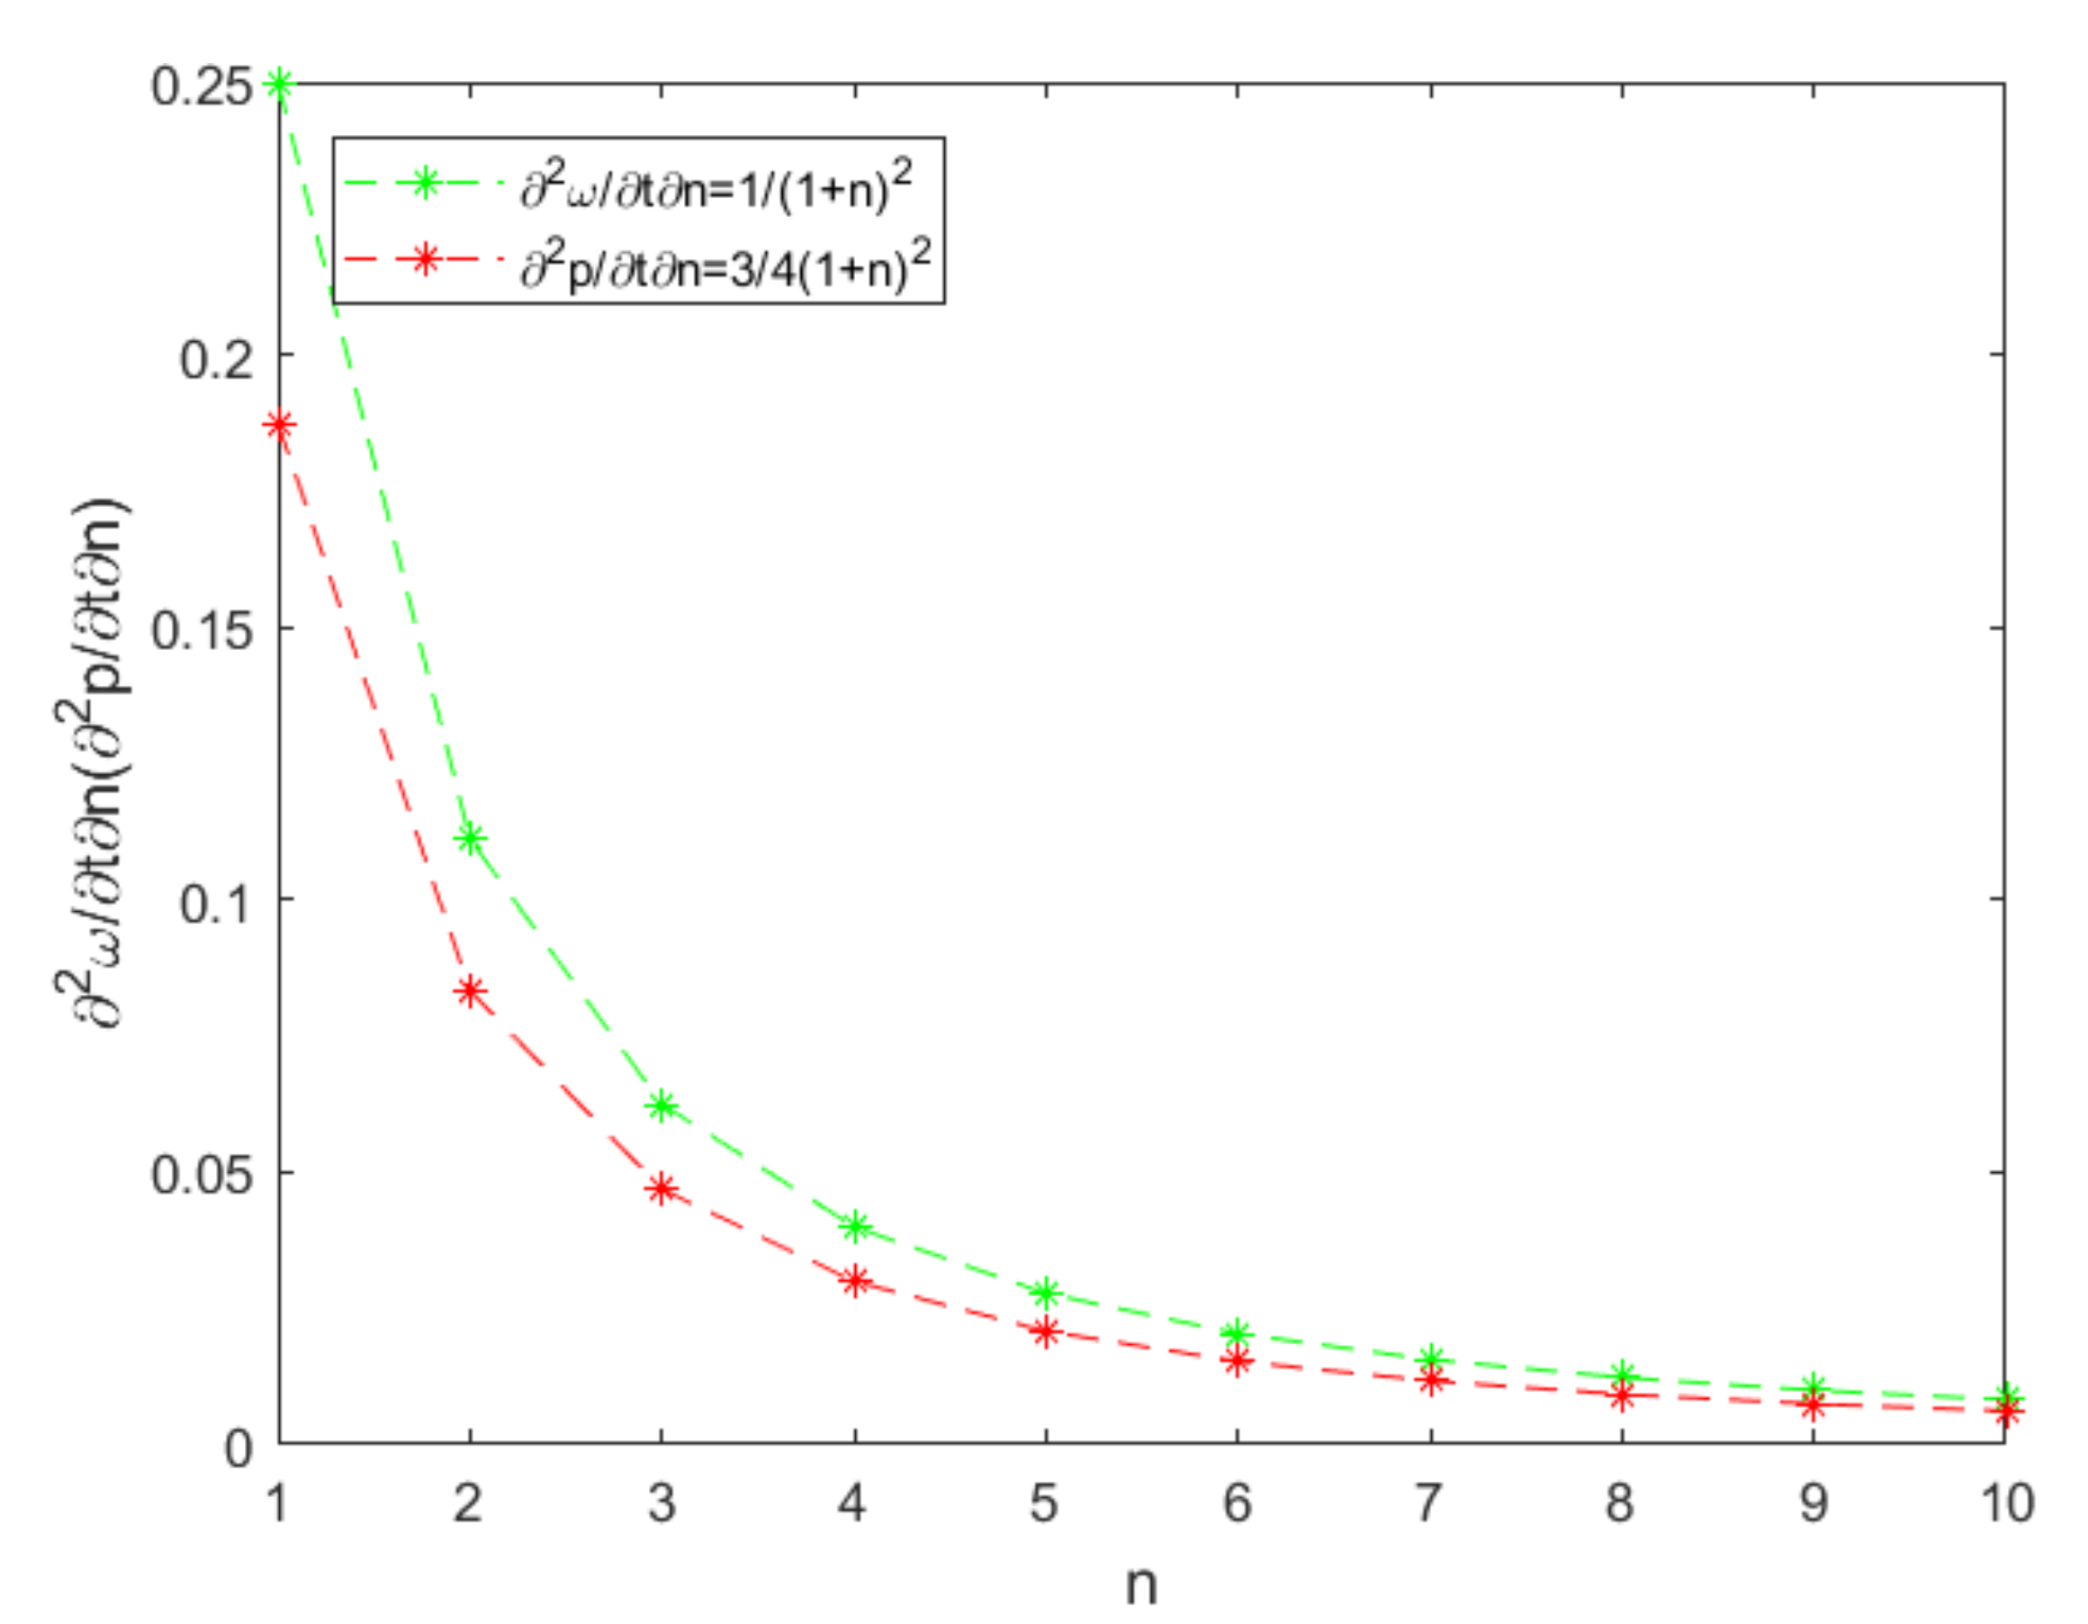
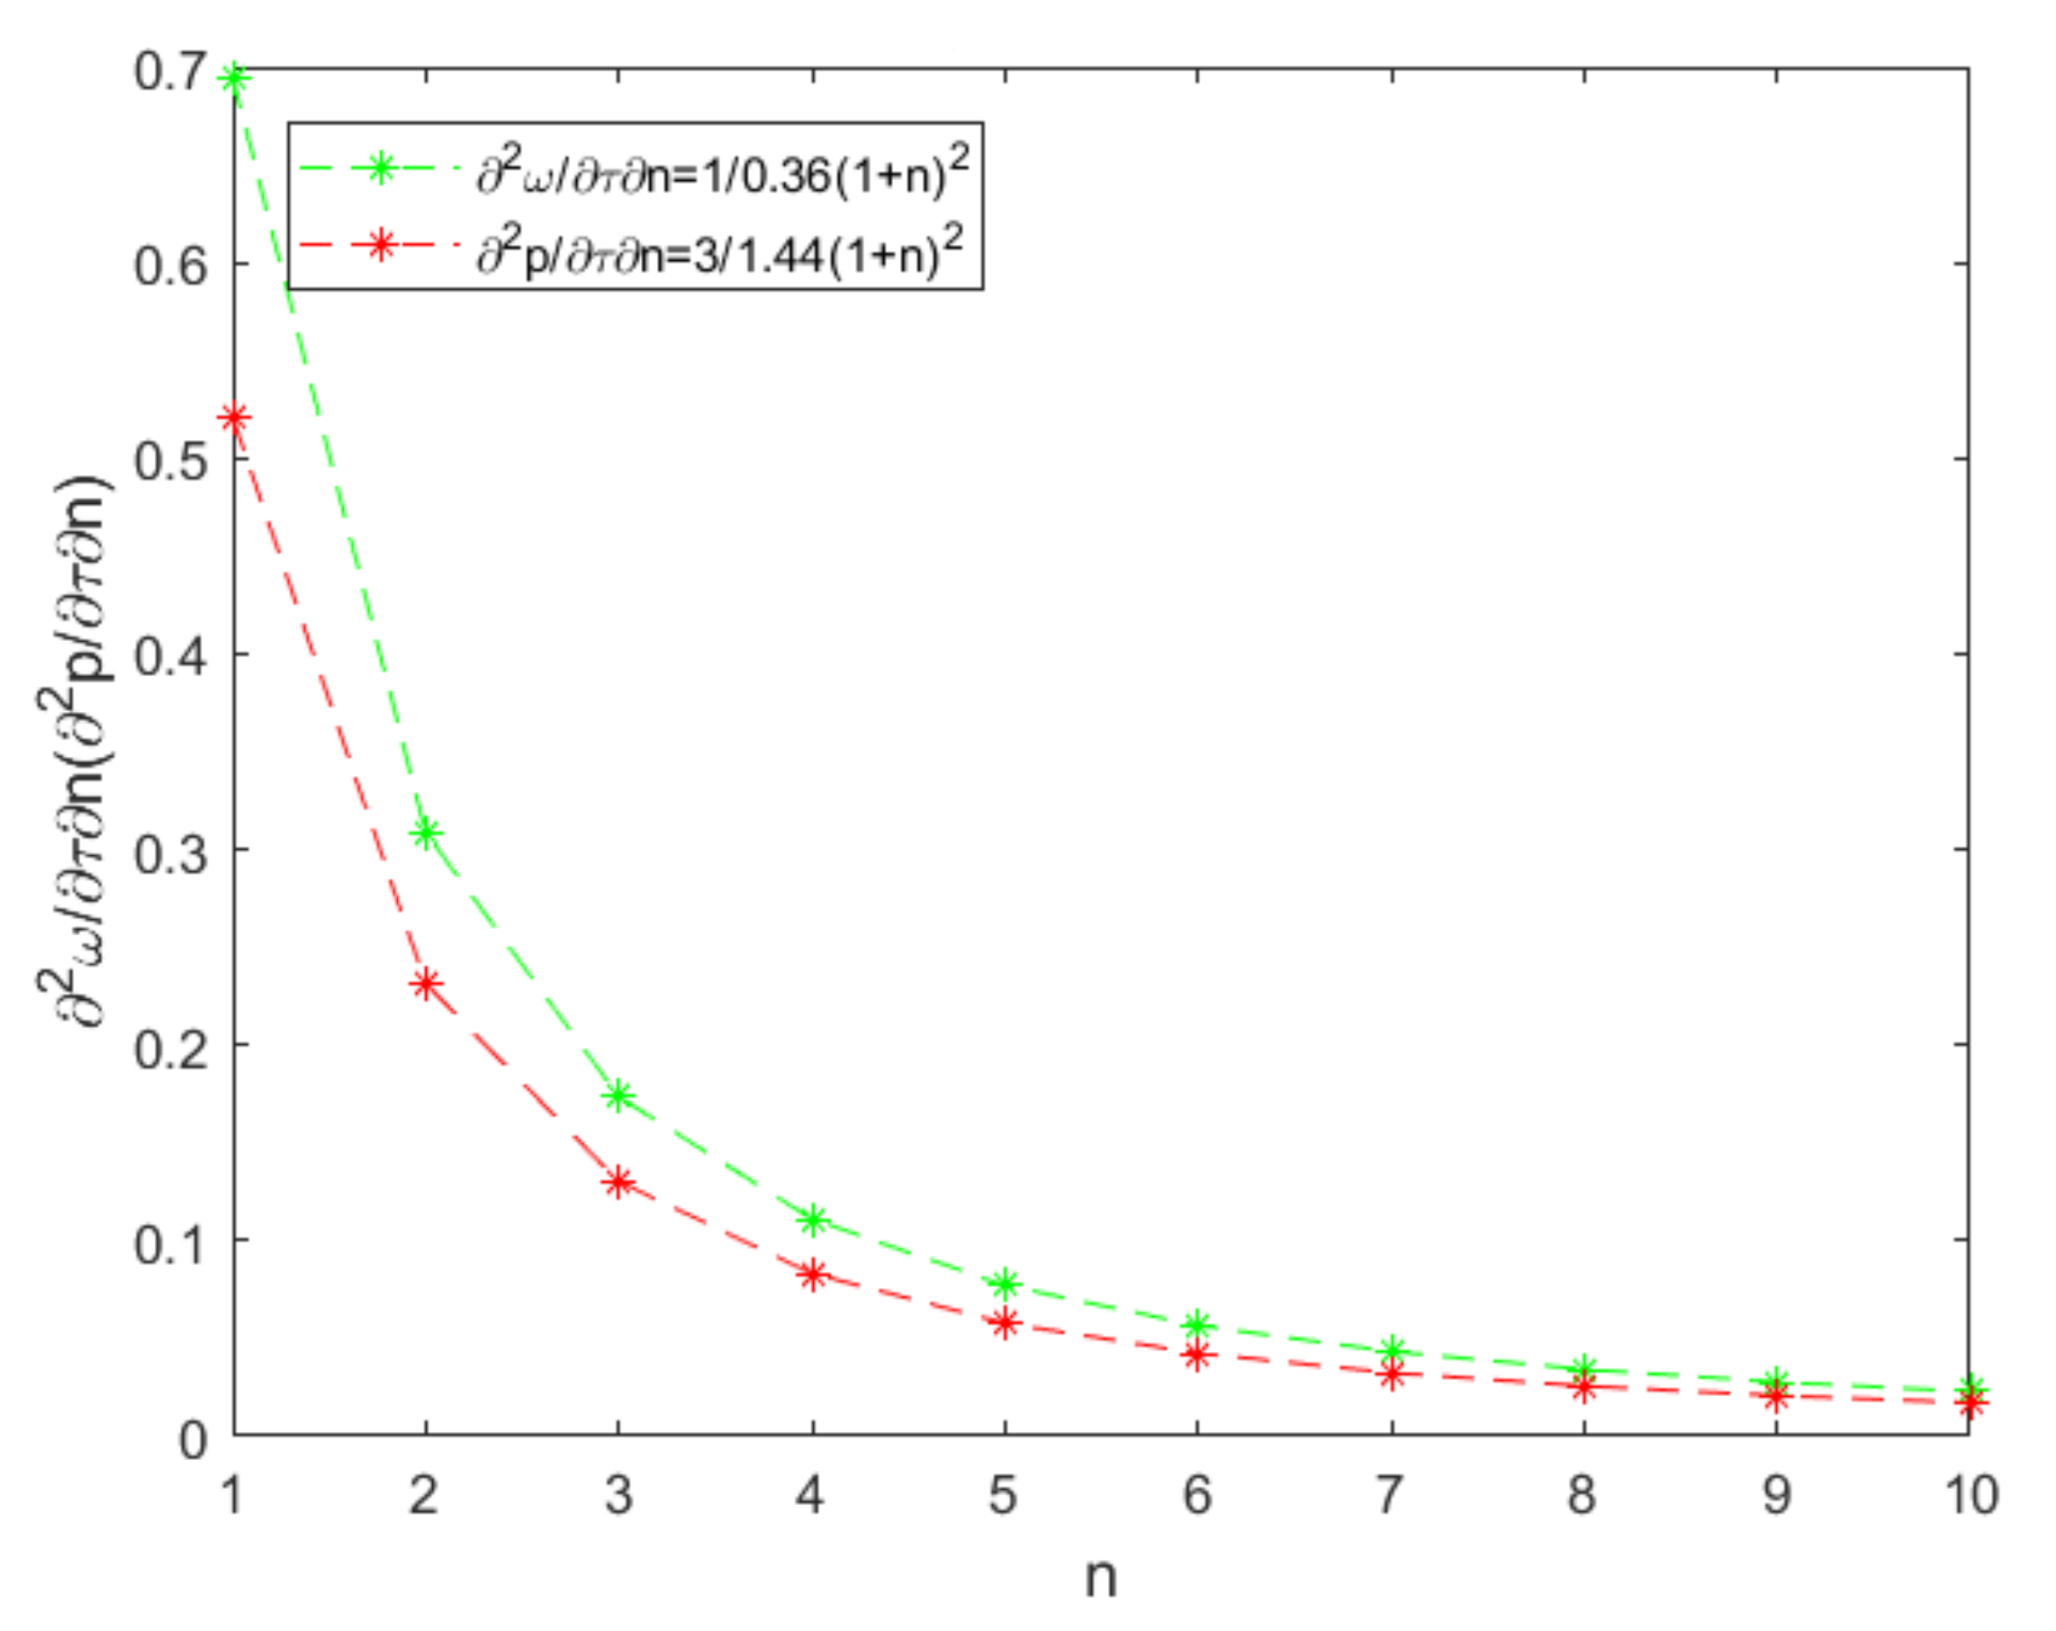
We performed numerical simulations for the above model; let The two lines parrel to the x-axis in Figure 5 indicate that if a resource is only levied based on production volume, the price change in both the intermediate and final products will be fixed; in other words, the market price is not sensitive to the specific duty. In Figure 6, the slopes of the two curves gradually increase, and the growth rapidly increases around the point , indicating that when the ad valorem tax rate reaches a certain point, the market price is extremely sensitive to the tax rate. Theoretically, as long as an appropriate tax rate is determined, the market price will be effectively mediated. When the ad valorem tax rate is very low, however, the price is not sensitive to the tax rate. Therefore, the determination of the ad valorem tax rate is of critical importance. There is also a need for the ad valorem tax to supplement the implementation of the specific duty so that the market price can be mediated by the combined effect of both taxes.
Conclusion 1: Independent of whether the resource tax is volume or price-based, the bearers of the tax burden are downstream firms, namely, firms in the country that imports raw materials.
However, due to competition, upstream firms cannot shift all the tax burden to the downstream firms; only a part of the burden can be shifted. This has nothing to with the tax levy method. The levy method only determines the tax amount that firms need to pay but does not affect the market structure. To further compare price and a specific duty, we again assume .
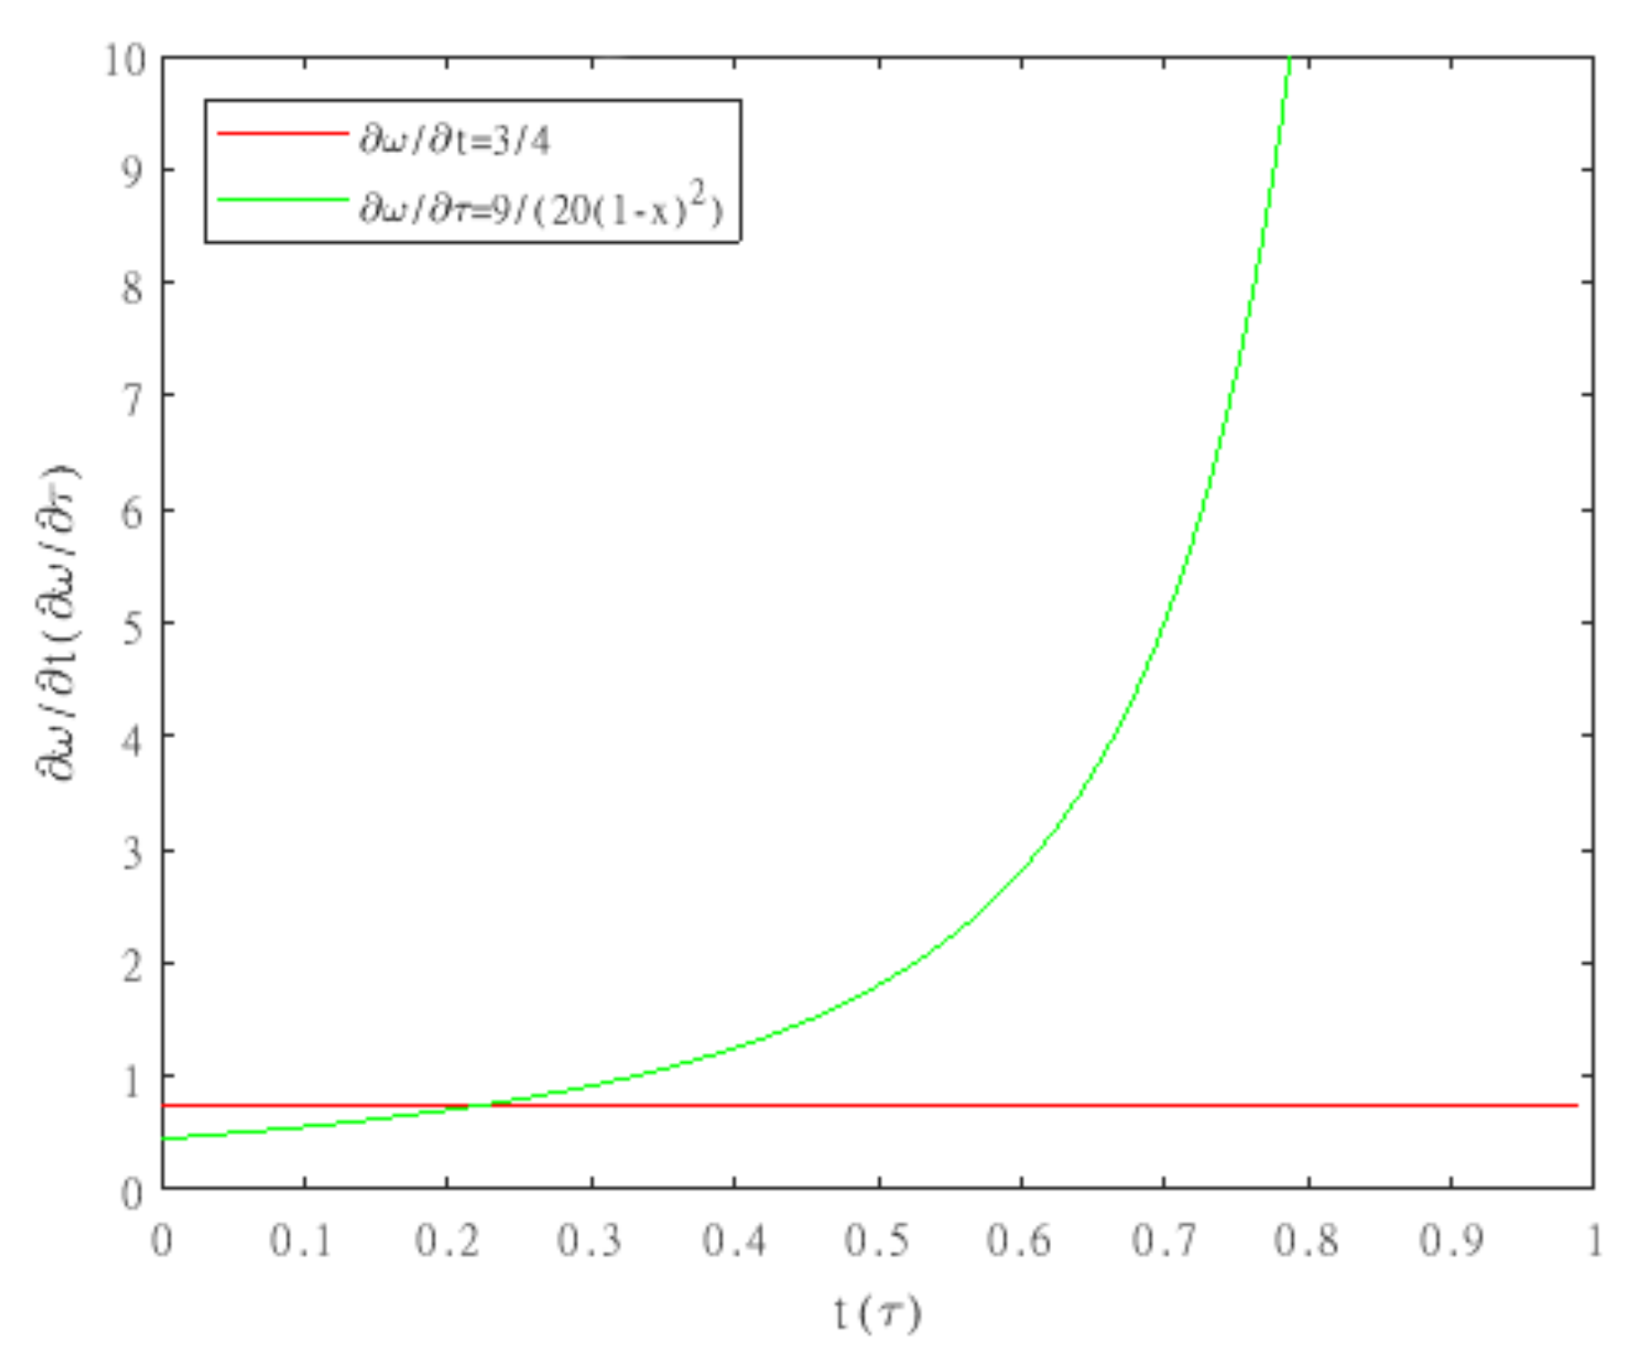
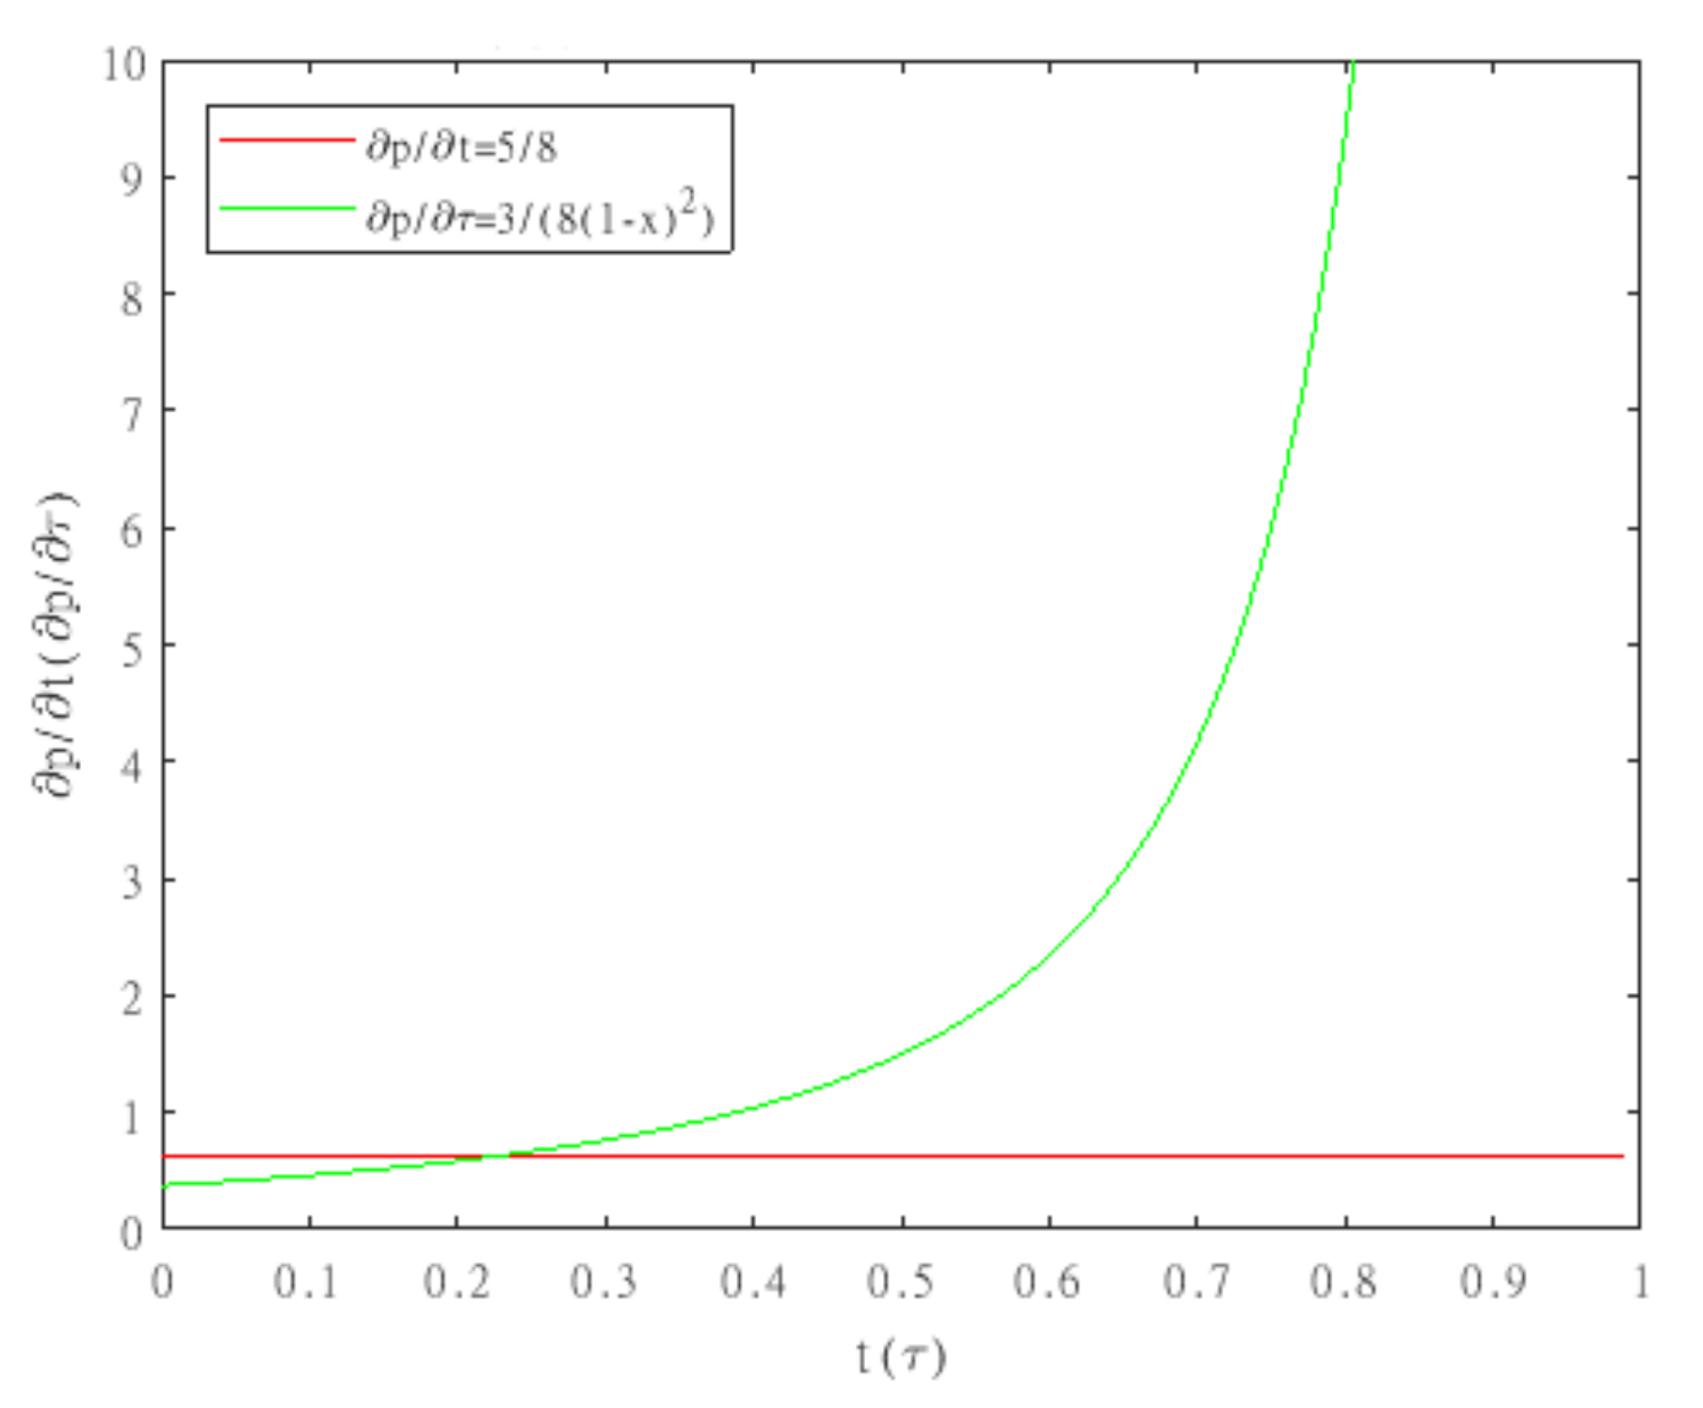
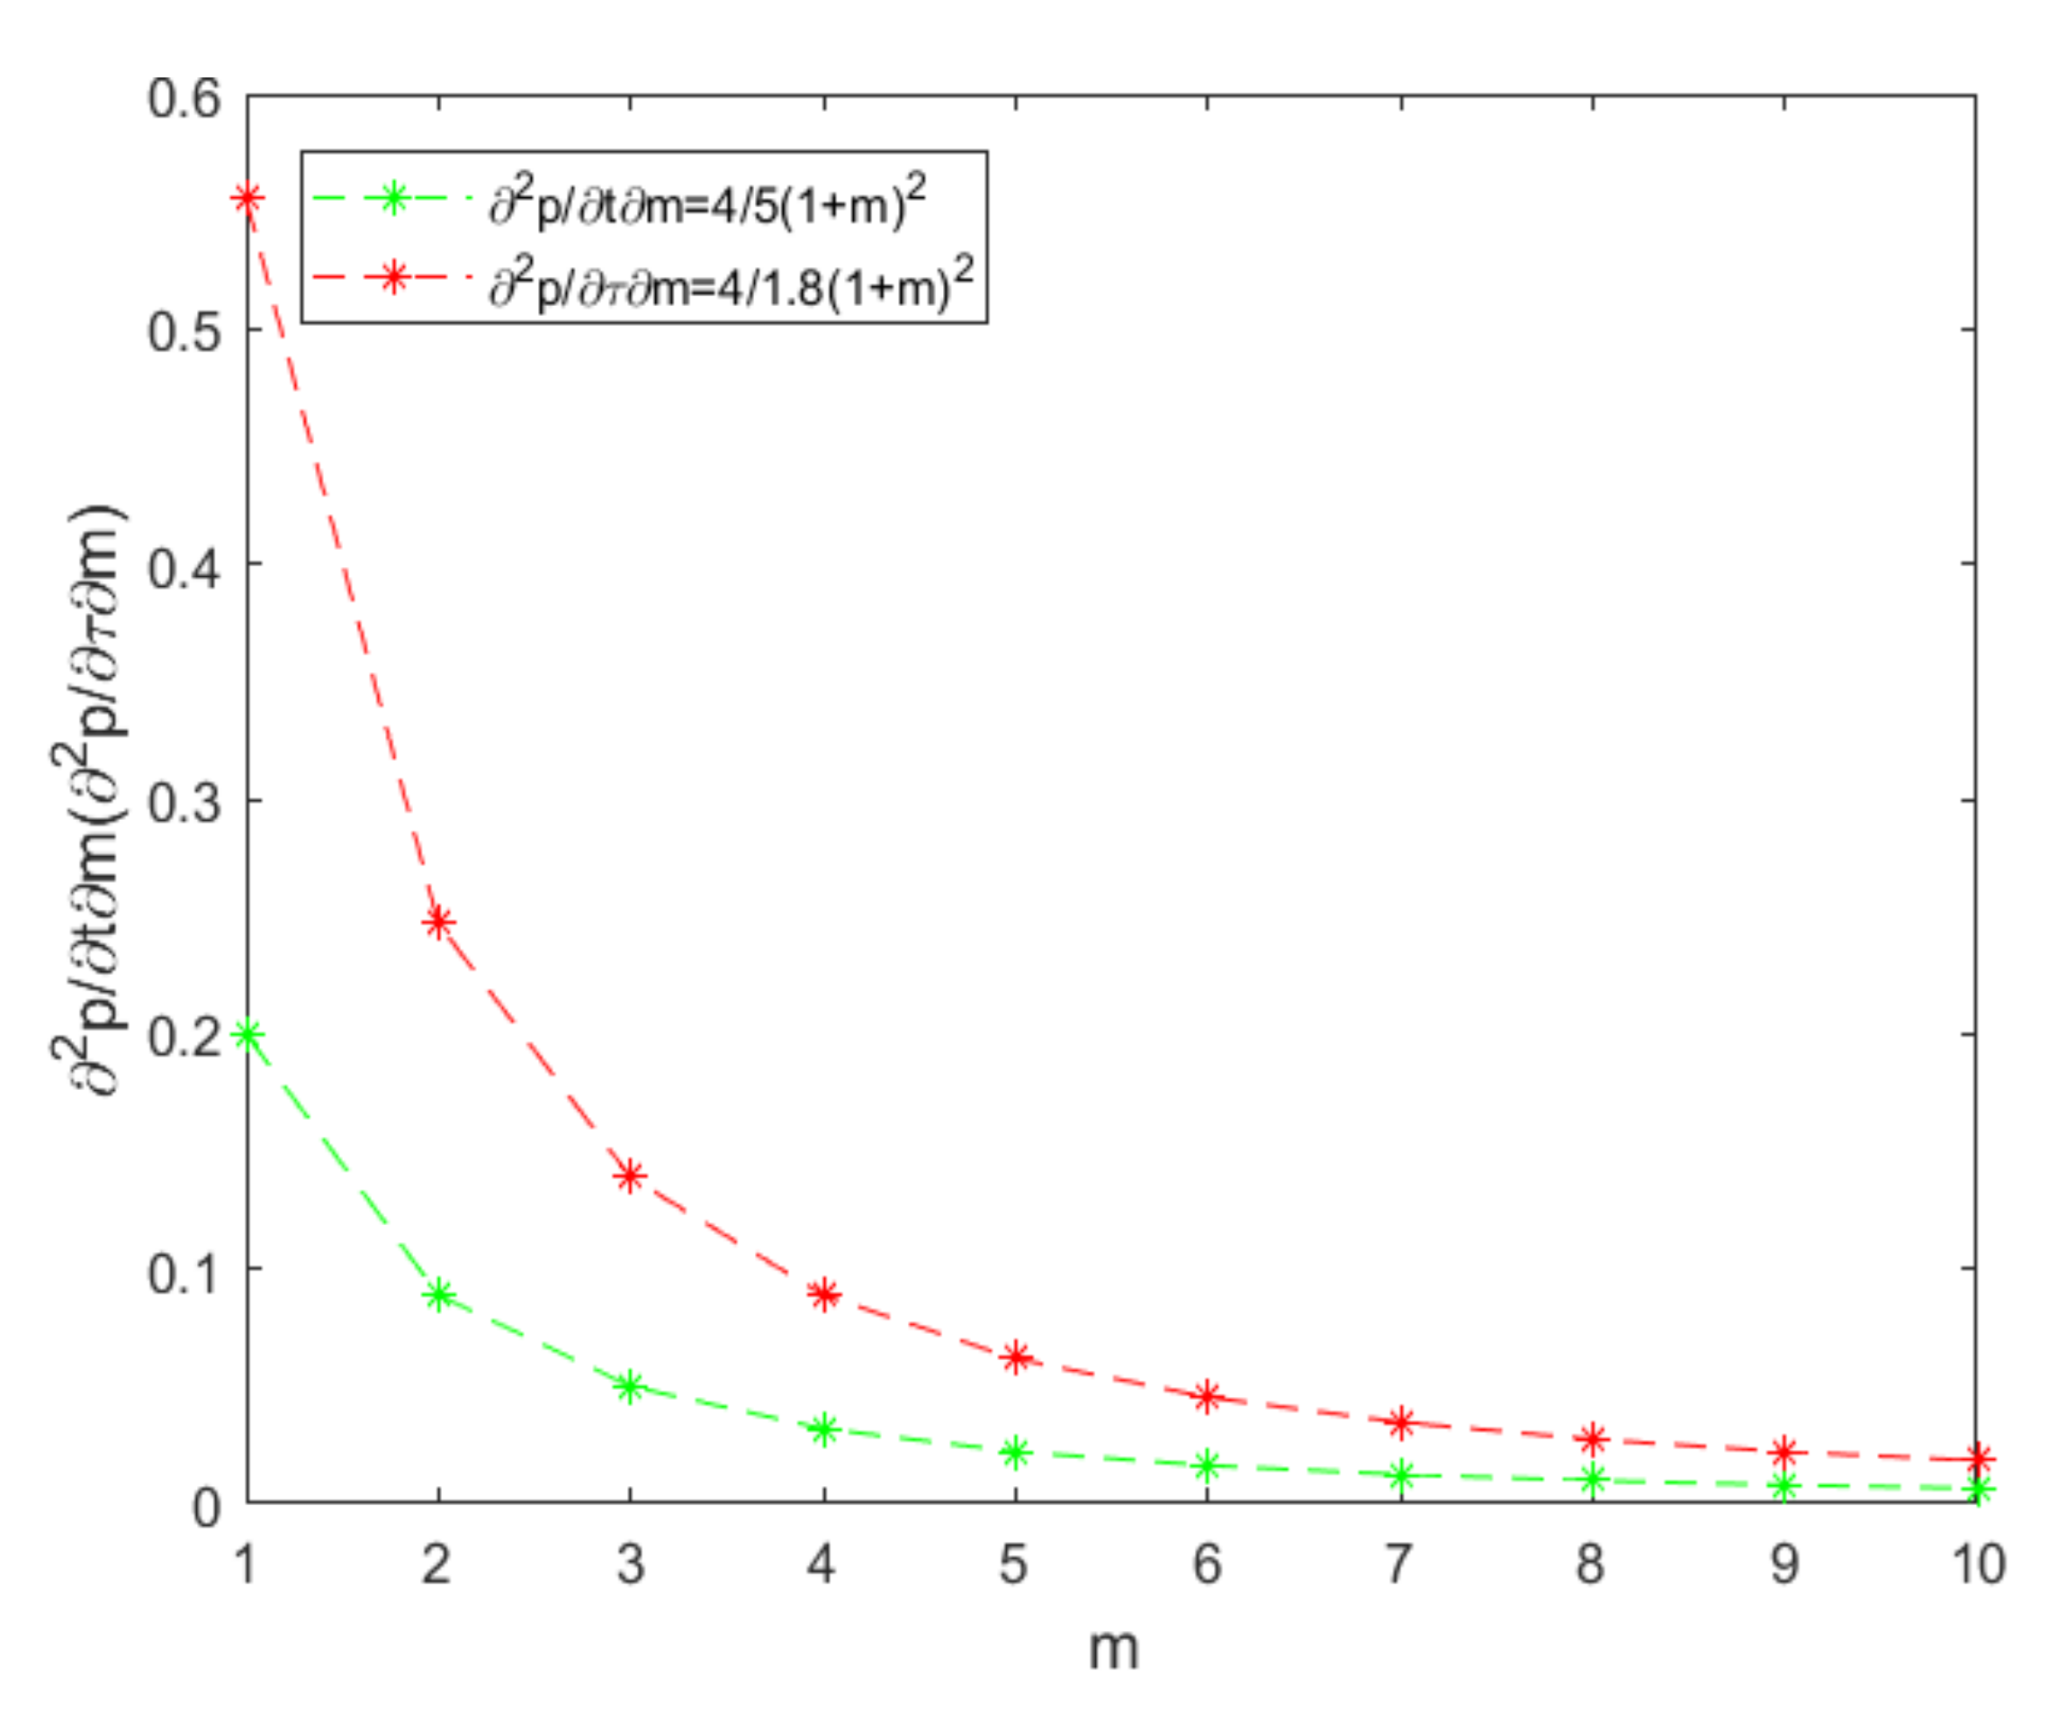
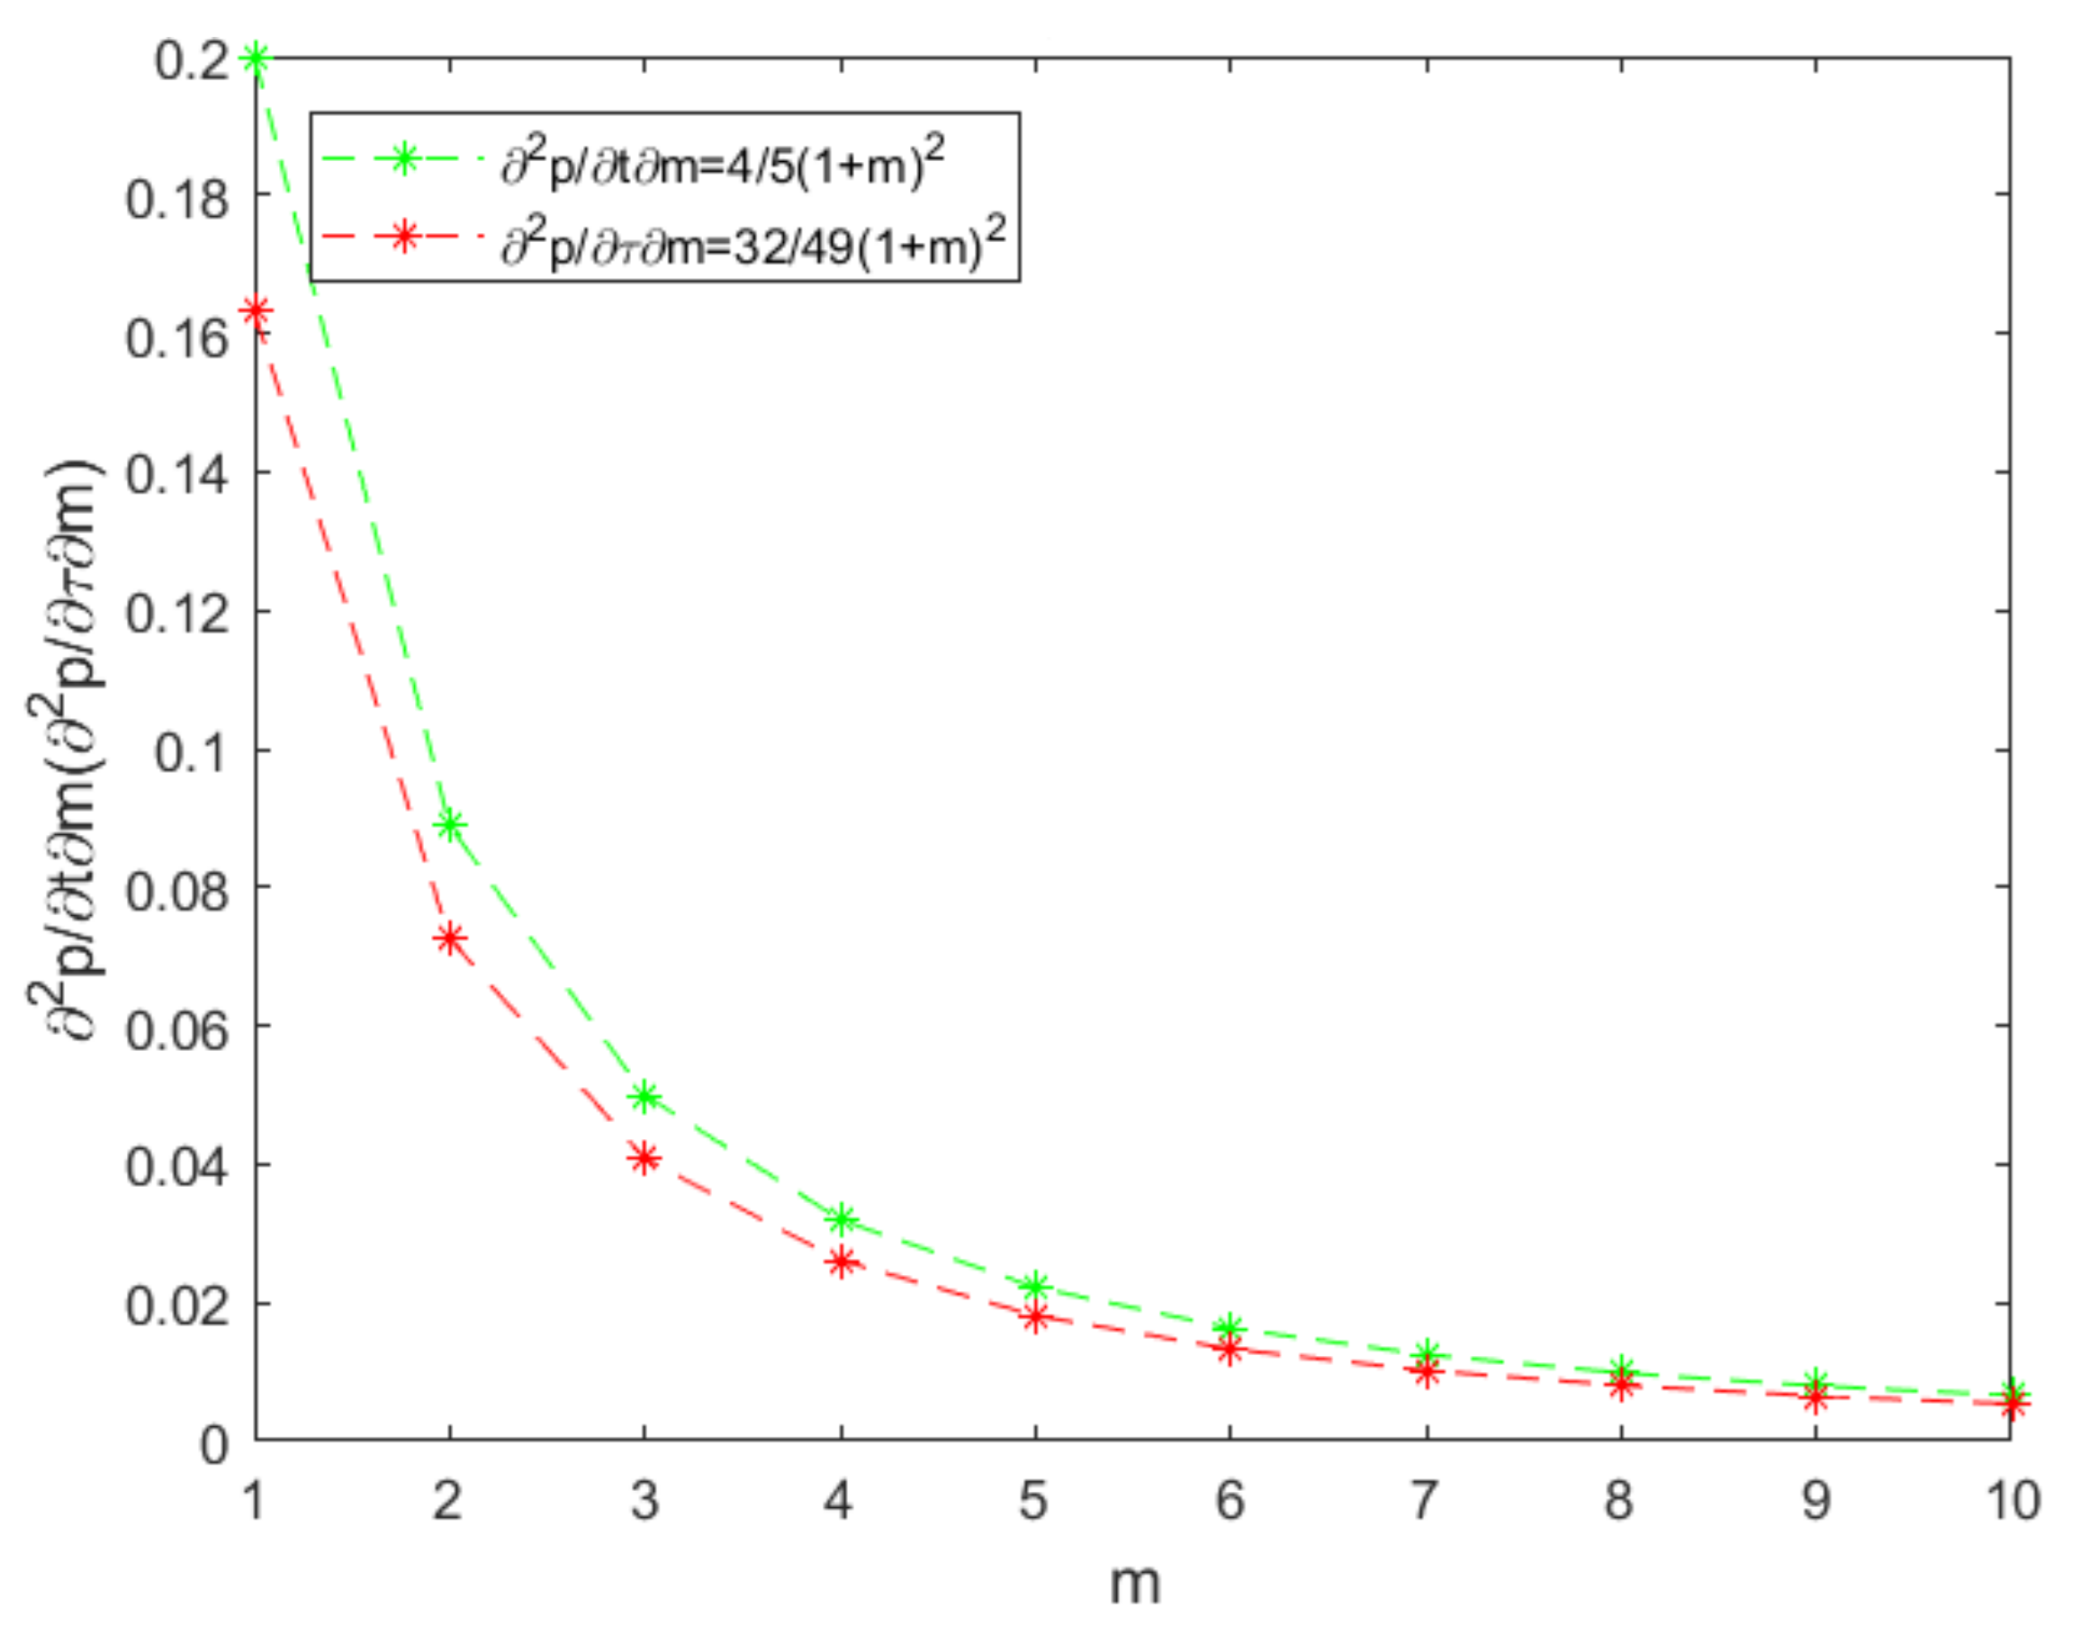
The red line in Figure 7 is parallel to the x-axis, indicating that the price of the intermediate product is not sensitive to changes in the specific duty; the price of the intermediate product increases at a constant rate with the increase in the specific duty. The price change rate for the intermediate product in the upstream country forms a curve, and the slope of the curve gradually increases. The red line and green line intersect between 0.2 and 0.3. On the left of the intersection point, the green line is below the red line, indicating that when the price and specific duty rates are low and if only one type of tax is levied, the specific duty has a greater impact on the price than the ad valorem tax. If the ad valorem tax rate is overly low, there is basically no impact on the price; in contrast, the specific duty has a greater effect, indicating that to a certain extent this type of tax levy is reasonable. The curve in Figure 8 is similar to that in Figure 6; the major differences are the height of the starting points for the red and green lines, the intersection points, and the slope of the green line. In general, the prices in the upstream and downstream countries have similar rates of change in response to different levy methods of the resource tax.
Conclusion 2: Considering environmental pollution from rare metal mineral exploitation, environmental taxes, and the high mining costs, a price-based resource tax will promote improvements by firms in mining technologies.
The real-world implications of conclusion 2 are that the ad valorem tax levy is directly linked to the price, is more sensitive to the market, and responds more promptly to the market. A price-based resource tax can more effectively mediate the market. The ad valorem tax levy is directly related to firms’ profits. When raising prices is less effective for increasing profits, firms rely more on lowering costs to generate profits, which will lead to innovations in technologies and management and green development.
3.2. Game Equilibrium Analysis of Intergenerational Externality Distribution
3.2.1. Impact of the Degree of Concentration of the Upstream and Downstream Markets on the Shift in the Resource Tax Burden
We assign values to the (20), (21), and (22); let . As the independent variables are integers, the values are connected with dotted lines.
The x-axis in Figure 9 and Figure 10 represents the degree of firm concentration in the upstream country, and the y-axis represents the change in the products in upstream and downstream countries with regard to the change in the specific duty or ad valorem tax. Whether the tax is price-based or volume-based, the green curve is above the red curve. At the starting point, the distance between the two curves is the greatest. As the degree of market concentration decreases, namely, the value of increases, the distance between the two curves decreases gradually, and the curves converge at the x-axis. The implication is that when the degree of market concentration decreases, independent of whether a specific duty or ad valorem tax is levied, the rates of tax rate change in the products in the upstream and downstream countries converge to 0. The major differences between Figure 9 and Figure 10 are that the values at the starting point are different and the rates of decrease are different, indicating that the ad valorem tax levy is more sensitive to changes in market concentration. When a specific duty is levied, in comparison with the price of the final product, the price change in the intermediate product with regard to the tax rate change for the specific duty is more sensitive to firm concentration in the upstream country. When the degree of firm concentration increases, the price change in the intermediate product with regard to the rate change for the specific duty rapidly increases; when increases, the price change in the intermediate product with regard to the rate change for the specific duty rapidly decreases. When only a specific duty is levied, with the increase in , more of the resource tax burden shifts to firms in the downstream country.
Assign two sets of values, and then, compare with :
(I (II .
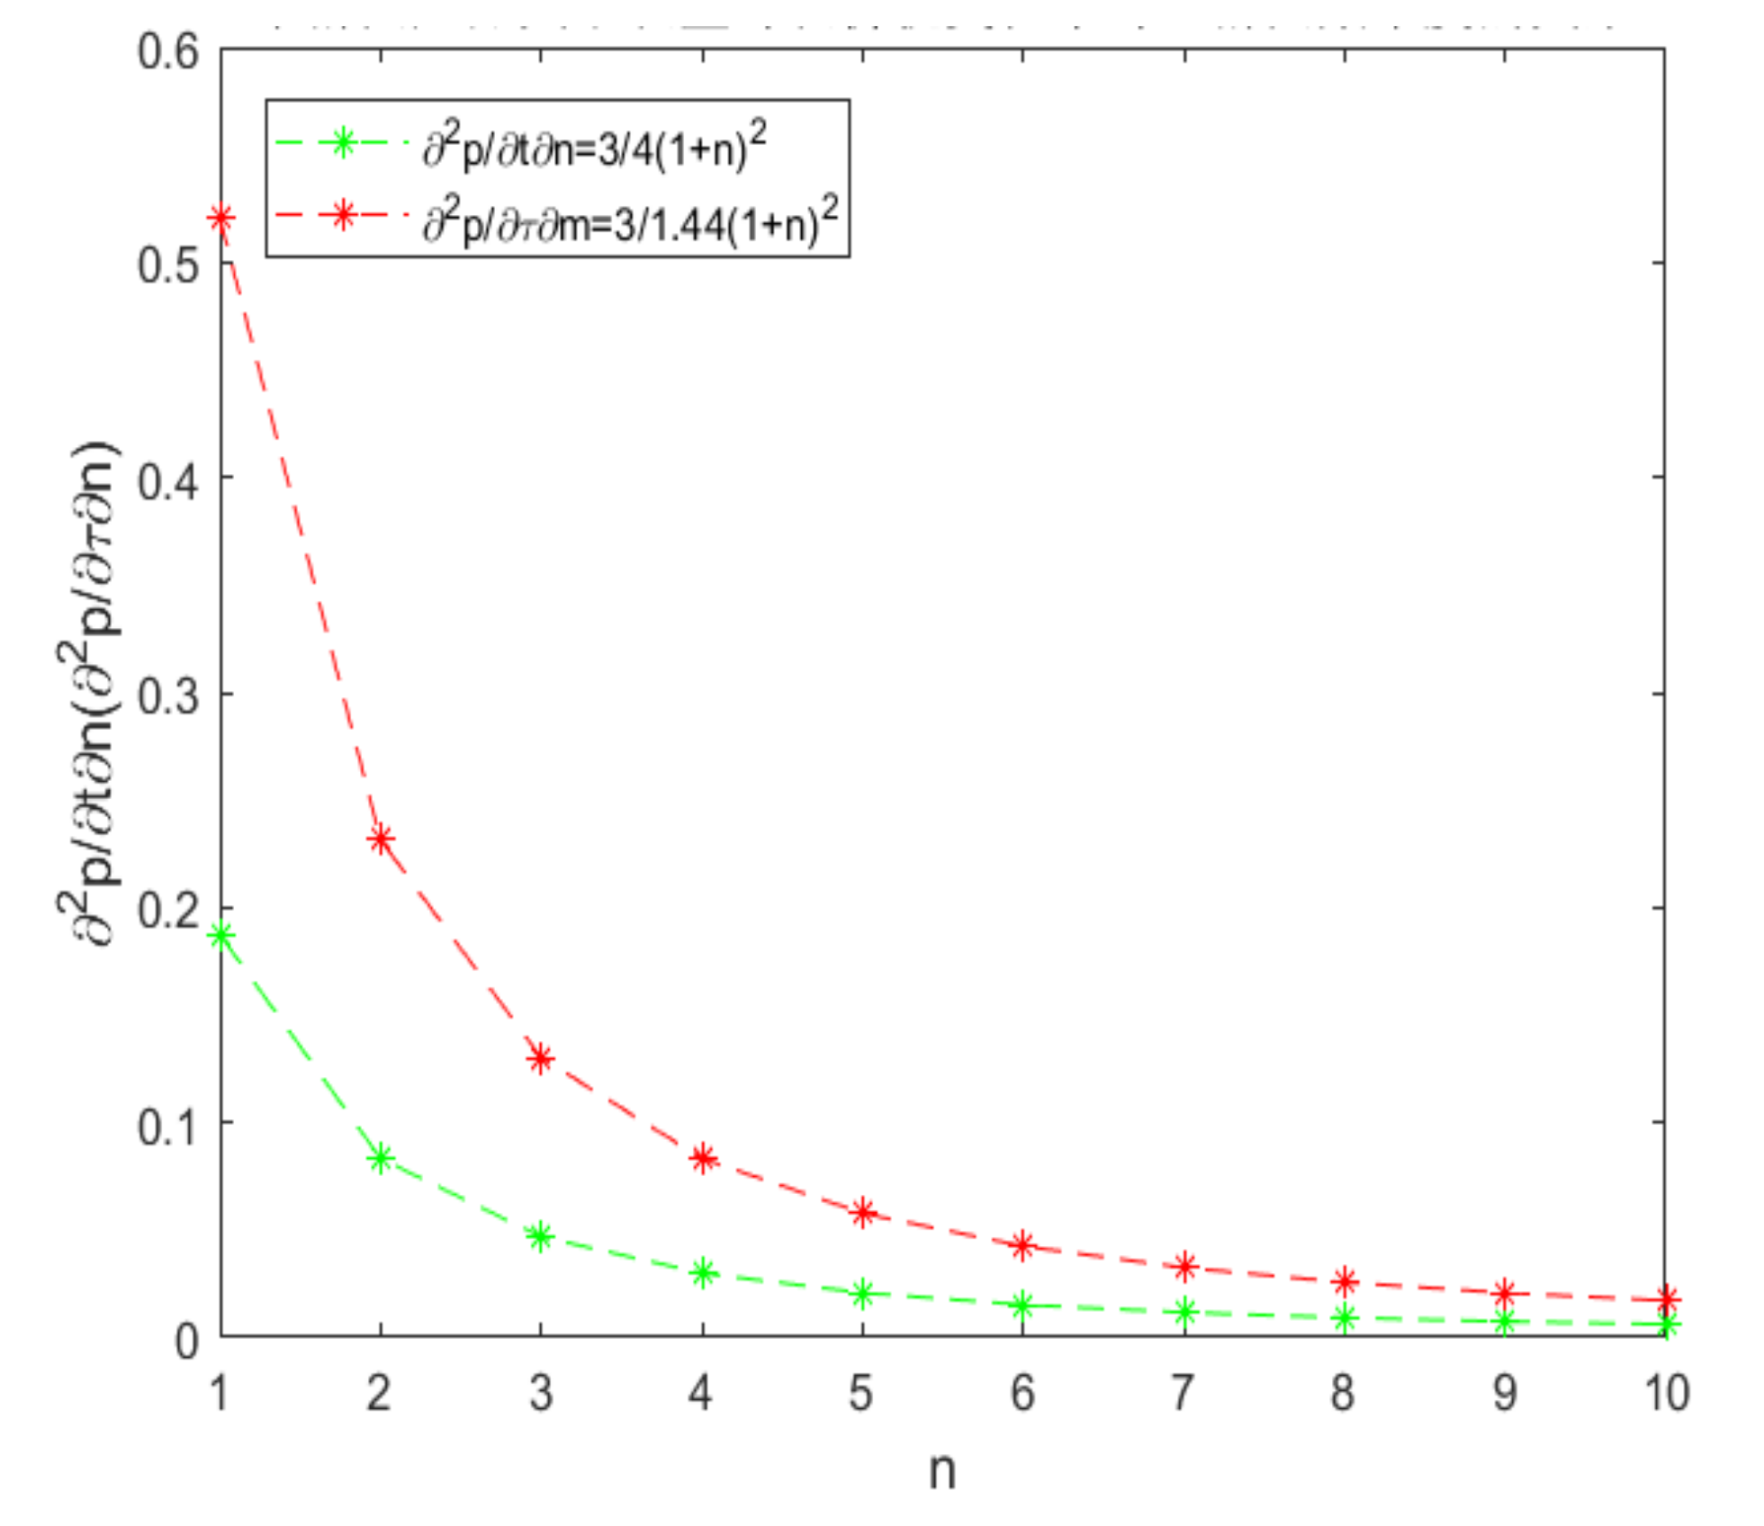
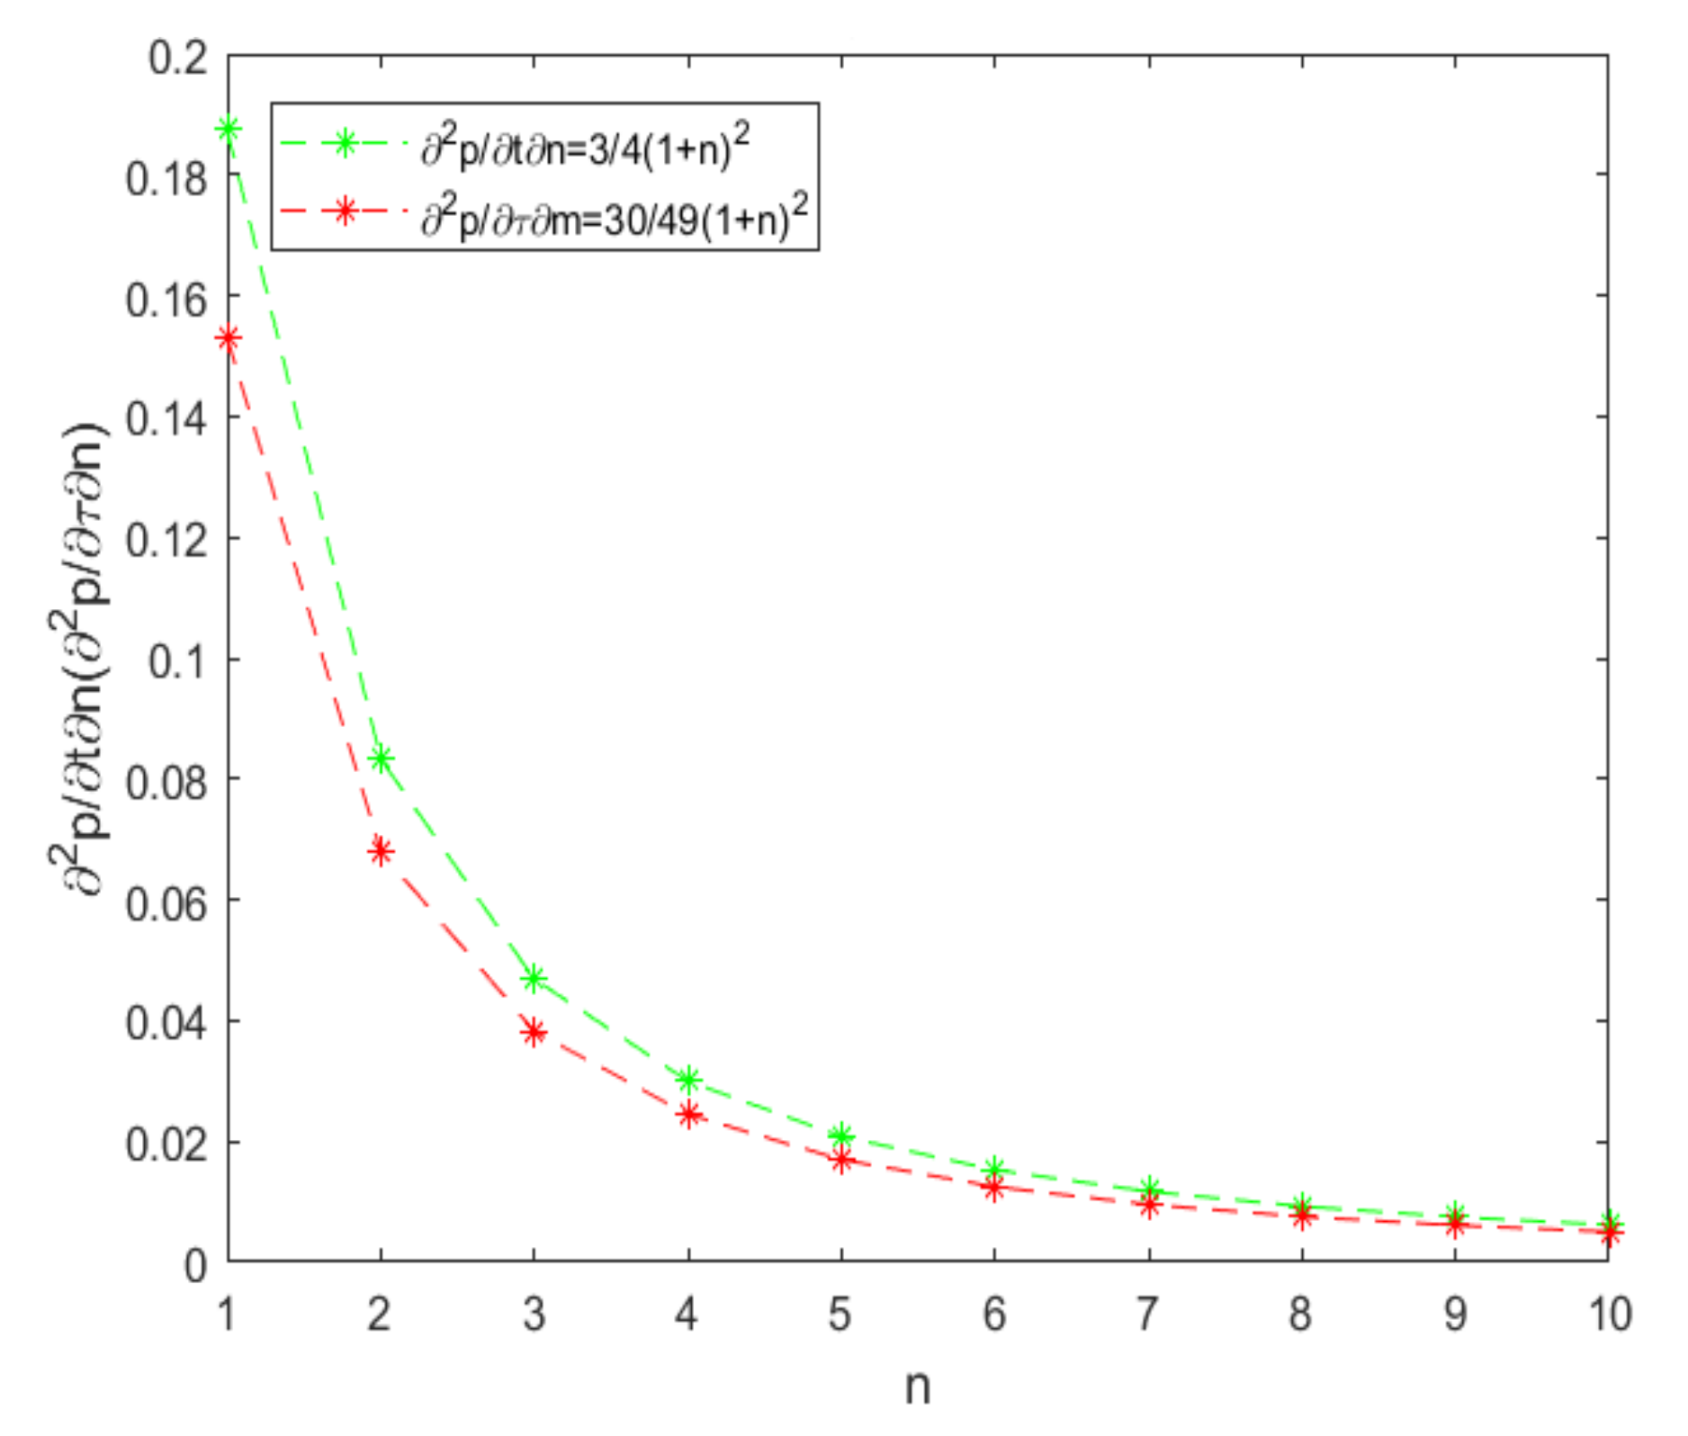
The value relationship between and depends on . It can be seen from the Figure 11 and Figure 12 that when the first set of values is assigned, the red line is above the green line; with the second set of values, the red line is below the green line. There are significant differences in the starting values and rates of change in the two figures, indicating that the value assignment for the ad valorem tax rate and production cost has a significant impact on the product’s rate of change in the ad valorem tax or specific duty in the downstream country. The shift of the ad valorem tax through the price of firms’ final product in the downstream country is not only related to the degree of concentration of mining firms in the upstream country and the degree of concentration of high-tech firms in the downstream country but is also closely related to the ad valorem tax rate and production cost .
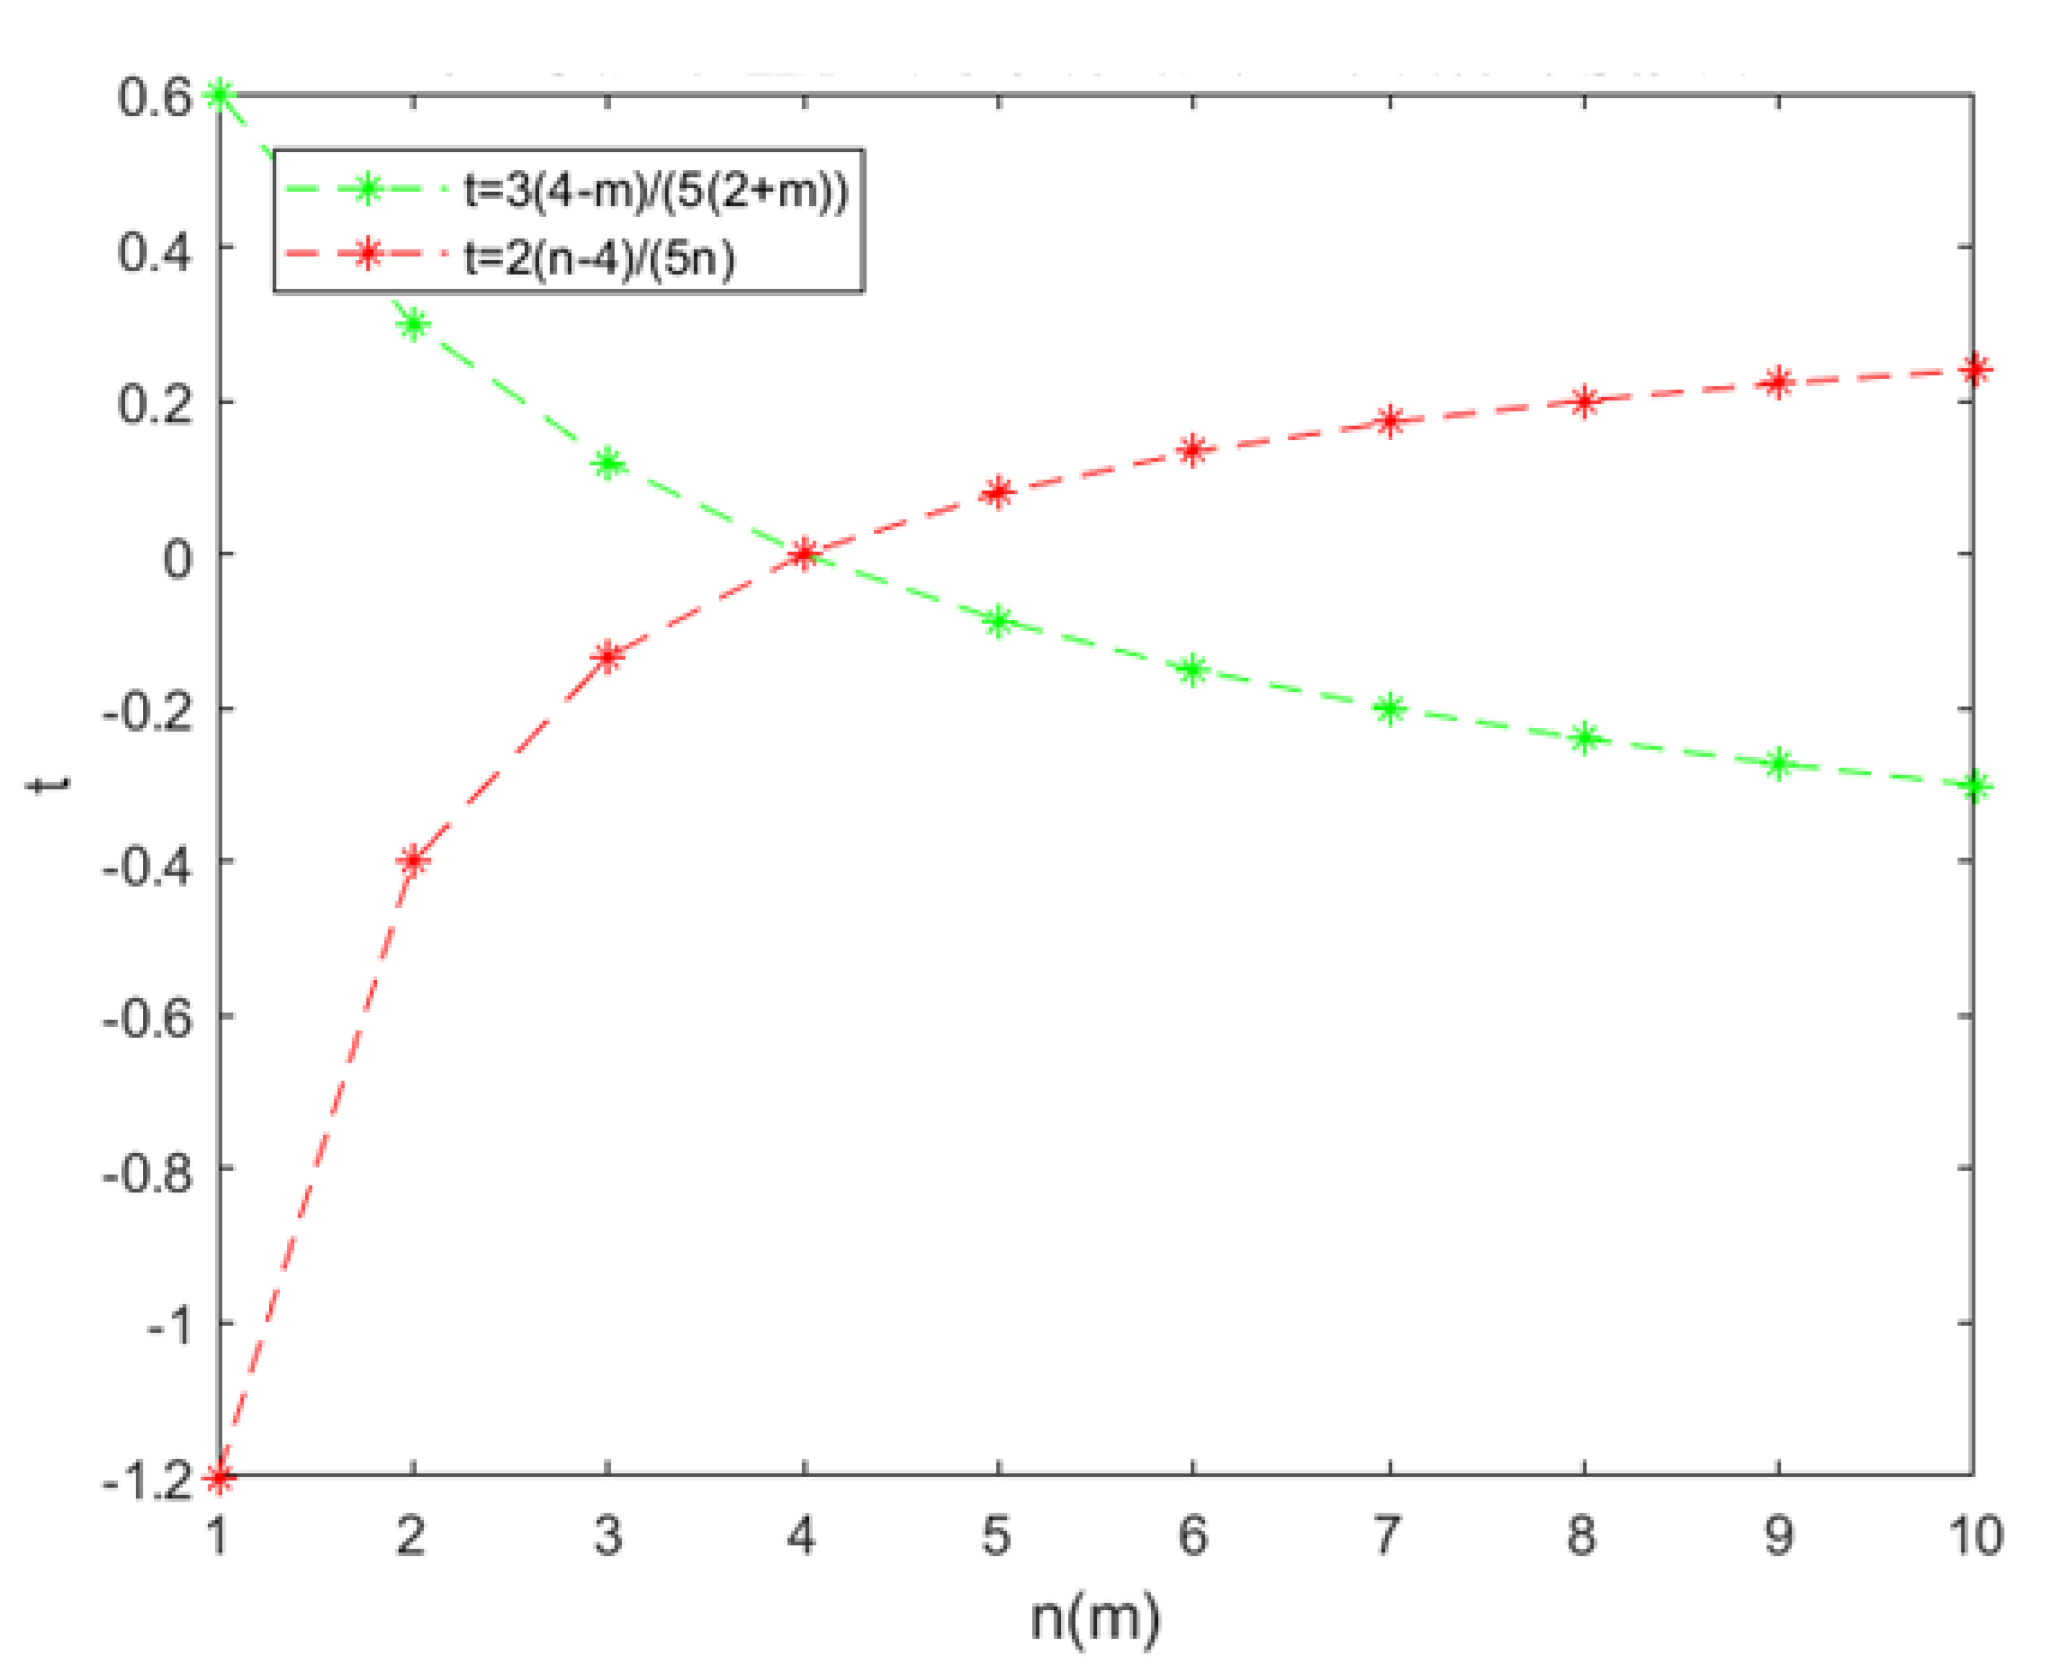
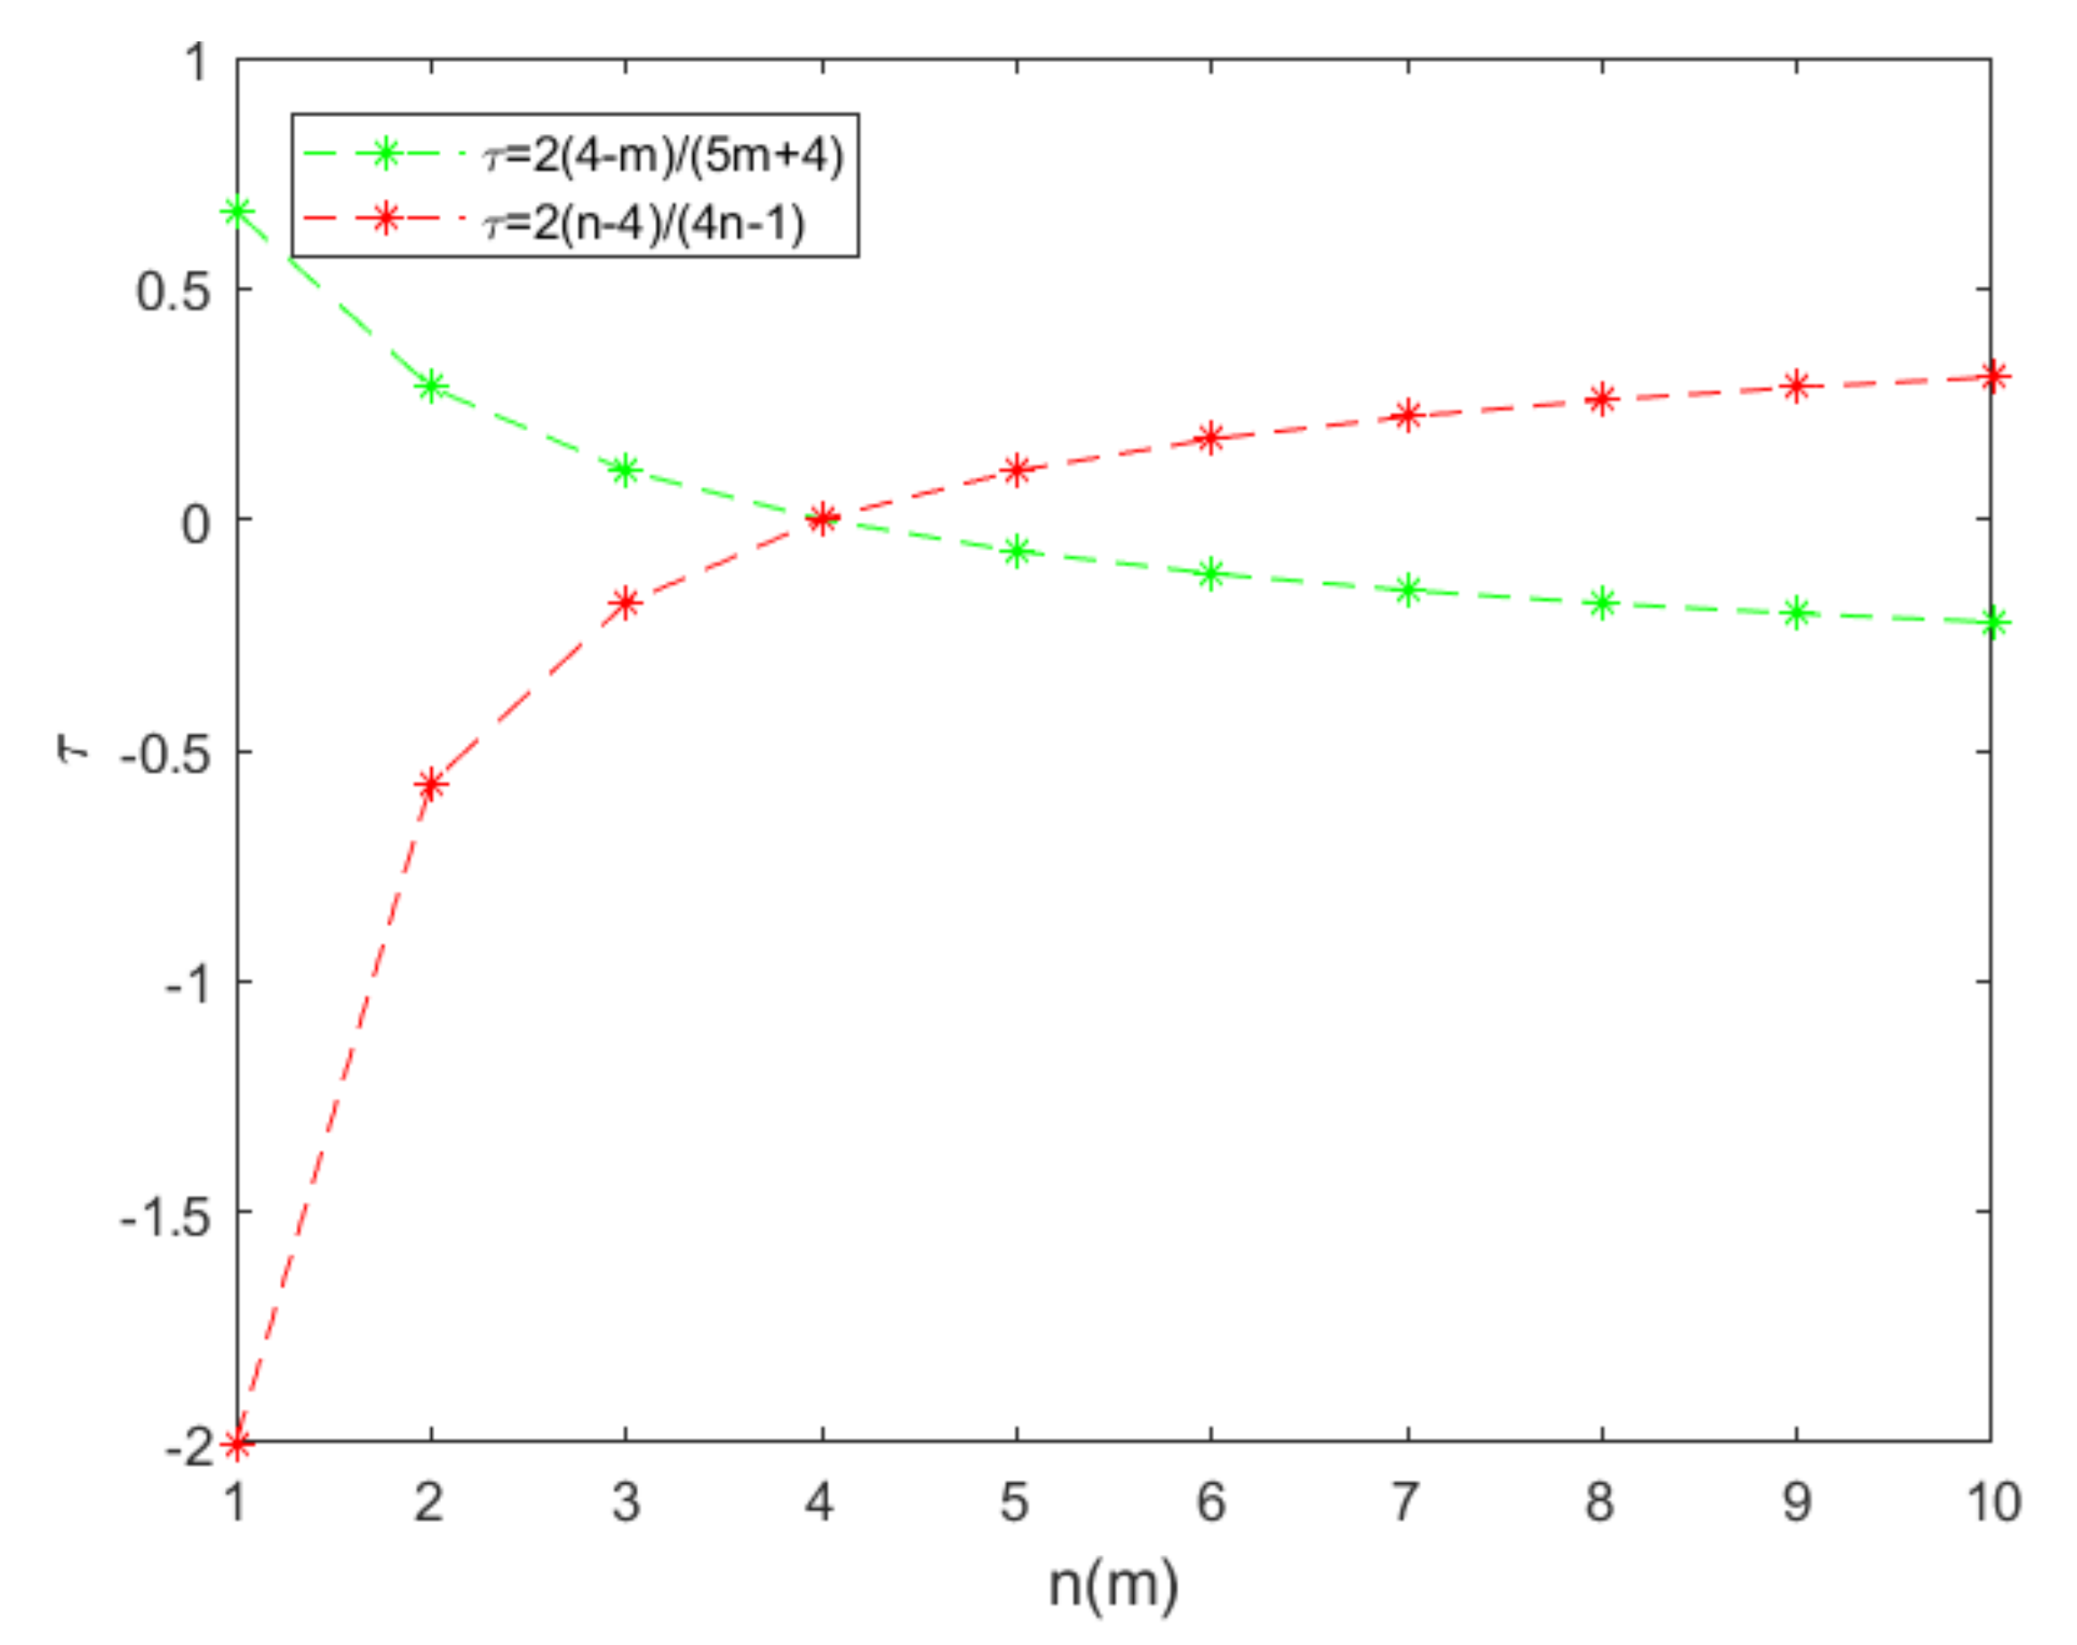
Assign two sets of values, and compare with ; the results of the numerical simulation are provided in Figure 13 and Figure 14.
Conclusion 3: Independent of whether the upstream country only levies an ad valorem tax or only levies a specific duty, when the degree of mining firm concentration in the upstream country decreases, more resource taxes levied on rare metal mineral development by the upstream country will be shifted to firms in the downstream country. Similarly, when the degree of concentration of high-tech firms decreases, more resource taxes imposed by the upstream country will be shifted to firms in the downstream country.
When the degree of concentration in the rare metal mineral development sector is low, the market competition is more intense, leading to overly low pricing for intermediate products, and raw materials may be sold at low prices. Governments should impose a resource tax with an appropriate tax rate and levy method to effectively increase the price of rare metal minerals and shift more of the resource tax burden to the developed downstream countries.
If the degree of concentration of high-tech firms in the downstream country is low, then the market competition is intense, and there are many substitutes for any given product. As competition lowers the price of final products, the downstream country cannot shift a large amount of tax burden to the upstream country. The resource tax levied by the upstream country constitutes part of the costs; via intermediate products, the increased portion is shifted to the high-tech firms in the downstream country. To earn a profit, firms in the downstream country will employ the power of the oligopoly to raise the prices of final products. By influencing the overall market price, these firms eventually shift the cost increase to consumers.
3.2.2. Impact of Resource Taxes Levied by Upstream Countries on the Shift in the Resource Tax Burden
In the trade between upstream and downstream countries, to shift the tax burden and maximize a country’s own interests, the upstream country will take the optimal approach to impose a resource tax on intermediate products (a comprehensive strategy that only considers the levy method and the tax rate but does not consider price or a specific duty). We will examine the scenario in which either of the two methods is applied.
Assume only a specific duty is levied; . Then, the optimal tax strategy function of the upstream country is
Let , as seen in Figure 15.
Figure 15 indicates how the degree of firm concentration in upstream and downstream countries affects the optimal decision function when only a specific duty is levied. The x-axis denotes the degree of firm concentration in the upstream country or the downstream country, and the y-axis denotes the tax base of the specific duty. When the value is below 0, the optimal strategy does not apply and needs adjustment. When the value is greater than 0, this strategy will yield the optimal result. The difference between the two curves is due to the assigned initial values for and , which determine the intersection point of the red line and green line. The ordinate of the intersection point is 0, indicating that when the degrees of concentration of the upstream and downstream markets satisfy this situation, there is a need to adjust the strategy based on the situation.
Conclusion 4: When an upstream country levies a specific duty, if the upstream country has a low industry concentration, then it is reasonable for the government to levy a resource tax; otherwise, the government should adjust the policy.
When the market concentration is low in the upstream country, imposing a resource tax will help to raise the price of intermediate products, phase out certain outdated productivity, optimize the market structure, and achieve more efficient resource allocation. When the market concentration is high and there are abundant reserves in the upstream country, the government may adjust the tax policy in accordance with the market conditions, provide subsidies to firms based on the circumstances, and increase exports to reduce the prices of the final products. The theoretical result only provides the basis for analysis, and the specific tax rate needs to be determined based on the real situation in the market.
Consider only an ad valorem tax is imposed; namely, . Then, the optimal tax strategy function of the upstream country is
Conclusion 5: When the market concentration is low in an upstream country, it is reasonable for the government to levy a price-based resource tax, and the tax rate can be determined through Equation (24); when the market concentration is high in the upstream country, the government must adjust the tax policy based on the real situation.
Figure 16 indicates that when a price-based resource tax is levied and the market concentration is low in the upstream country, the resource tax is a strong measure to protect resources as it can effectively raise the prices of intermediate products. However, when there is a high degree of market concentration, the prices of intermediate products are determined collectively by the oligopoly, and the resource tax’s effect of raising the prices of intermediate products in the upstream country is minor. Moreover, an overly high resource tax will dampen the passion of firms in the country. This tax will ultimately be reflected in the final products produced by firms in the downstream country and reduce the capacity of the upstream country to buy these final products. Therefore, when there is an overly high market concentration in the upstream country, the tax policy needs to be designed based on the reality of the market, and it should protect the interests of the firms in the country while ensuring sustainable resource mining.
Based on the above analysis, an ad valorem tax is far more effective for increasing the prices of intermediate products than a specific duty. When there is an overly high concentration of firms in the upstream country, imposing a specific duty may require subsidies to firms to ensure economic benefits from rare metal mineral development. When an ad valorem tax is imposed, there may be a need to reinforce the collection of a resource tax. As an ad valorem tax has a more significant effect on increasing the prices of intermediate products in the upstream market, even if the degree of market concentration is high in the upstream country, the government can still impose an ad valorem tax to increase the prices of intermediate products to protect resources. This policy may, to a certain extent, avoid the overexploitation of mineral resources.
4. Conclusions
This paper develops a non-linear inverse demand function for oligopoly firms in the vertically linked market of rare metal minerals. By constructing a triopoly game model for the international market and constructing a model for analysing the mechanism by which intergenerational externalities exert influences, the paper examines how upstream countries can more effectively and rapidly mediate the prices of intermediate products by levying a resource tax to improve firms’ efficiency in using mineral resources in upstream countries. The paper discusses the game equilibrium of the distribution of intergenerational externalities among different participants and how to shift the tax burden so as to achieve sustainable rare metal mineral development. The research findings indicate that regardless of whether a resource tax is volume-based or price-based, the major bearers of the tax burden are firms in downstream countries, namely, the countries that import rare metal minerals. When the degree of concentration of mining firms in upstream countries decreases, a larger portion of the resource tax imposed by the upstream countries will shift to firms in downstream countries. When the degree of concentration of high-tech firms in downstream countries decreases, a larger portion of the resource tax imposed by upstream countries will shift to firms in downstream countries. In addition, when the rare metal mining costs are high, in comparison with a volume-based resource tax, an ad valorem tax is more effective for increasing the utilization rate of rare metal minerals. Furthermore, as an ad valorem tax is directly related to price and responds more promptly to the market, this type of tax levy is more conducive to the effective allocation of rare metal mineral resources.
These conclusions provide a new analytical paradigm for research on the orderly development of rare metal minerals from the perspectives of improving the compensation system and enhancing the sustainable development of rare metal minerals. This paper also provides new approaches to deepening the reform of the tax system for rare metal mineral development.
Author Contributions
Conceptualization, S.D. and M.W.; methodology, M.W. and H.Z.; investigation, S.D., M.W. and H.Z.; data curation, M.W. and H.Z.; writing—original draft preparation, S.D. and M.W.; writing—review and editing, M.W. and H.Z; supervision, S.D. and M.W. All authors have read and agreed to the published version of the manuscript.
Funding
This work was supported by the National Natural Science Foundation of China (71633006), Natural Science Foundation of Hunan Province (2020JJ5784) and Innovation-Driven Project of Central South University (2020CX049).
Data Availability Statement
All relevant data are included within the paper.
Conflicts of Interest
The authors declare no conflict of interest.
References
- Fan, J. Optimal Economic Growth under Sustainable Development; Economic Management Press: Beijing, China, 2002. (In Chinese) [Google Scholar]
- Spencer, B.J.; Jones, R. Vertical foreclosure and international trade policy. Rev. Econ. Stud. 1991, 58, 53–170. [Google Scholar] [CrossRef] [Green Version]
- Spencer, B.J.; Jones, R. Rrade and protection in vertically related markets. J. Ind. Econ. 1992, 32, 31–55. [Google Scholar]
- Ishikawa, J.; Lee, K.D. Backfiring tariffs in vertically related markets. J. Int. Econ. 1997, 42, 395–423. [Google Scholar] [CrossRef]
- Delipalla, S.; Keen, M. The comparison between ad valorem and specific taxation under imperfect competition. J. Public Econ. 1992, 49, 351–367. [Google Scholar] [CrossRef] [Green Version]
- Anderson, S.P.; de Palma, A.; Kreider, B. Tax incidence in differentiated product oligopoly. J. Public Econ. 2001, 81, 173–192. [Google Scholar] [CrossRef]
- Peitz, M.; Reisinger, M. Indirect taxation in vertical oligopoly. J. Ind. Econ. 2014, 62, 709–755. [Google Scholar] [CrossRef] [Green Version]
- Ali, S.H.; Giurco, D.; Arndt, N.; Nickless, E.; Brown, G.; Demetriades, A.; Durrheim, R.; Enriquez, M.A.; Kinnaird, J.; Littleboy, A.; et al. Mineral supply for sustainable development requires resource governance. Nature 2017, 543, 367. [Google Scholar] [CrossRef] [PubMed]
- Bazilian, M.D. The mineral foundation of the energy transition. Extr. Ind. Soc. 2018, 5, 93–97. [Google Scholar] [CrossRef]
- Carvalho, F.P. Mining industry and sustainable development: Time for change. Food Energy Secur. 2017, 6, 61–77. [Google Scholar] [CrossRef]
- Yakovleva, N.; Kotilainen, J.; Toivakka, M. Reflections on the opportunities for mining companies to contribute to the United Nations Sustainable Development Goals in sub–Saharan Africa. Extr. Ind. Soc. 2017, 4, 426–433. [Google Scholar] [CrossRef] [Green Version]
- Monteiro, N.B.R.; da Silva, E.A.; Neto, J.M.M. Sustainable development goals in mining. J. Clean. Prod. 2019, 228, 509–520. [Google Scholar] [CrossRef]
- Hilson, G.; Maconachie, R. Artisanal and small-scale mining and the Sustainable Development Goals: Opportunities and new directions for sub-Saharan Africa. Geoforum 2020, 111, 125–141. [Google Scholar] [CrossRef]
- Kamenopoulos, S.N.; Shields, D.; Agioutantis, Z. Sustainable Development Criteria and Indicators for the Assessment of Rare Earth Element Mining Projects; Rare Earths Industry; Elsevier: Amsterdam, The Netherlands, 2016; pp. 87–109. [Google Scholar]
- Burford, G.; Tamás, P.; Harder, M.K. Can we improve indicator design for complex sustainable development goals? A comparison of a values-based and conventional approach. Sustainability 2016, 8, 861. [Google Scholar]
- Liang, X.; Ye, M.; Yang, L.; Fu, W.; Li, Z. Evaluation and Policy Research on the Sustainable Development of China’s Rare Earth Resources. Sustainability 2018, 10, 3792. [Google Scholar] [CrossRef] [Green Version]
- Okabe, T.H. Bottlenecks in rare metal supply and the importance of recycling–a Japanese perspective. Miner. Process. Extr. Metall. 2017, 126, 22–32. [Google Scholar] [CrossRef]
- Huang, X.; Zhang, G.; Pan, A.; Chen, F.; Zheng, C. Protecting the environment and public health from rare earth mining. Earth’s Future 2016, 4, 532–535. [Google Scholar] [CrossRef]
Figure 1.
The policy instrument of the rare metal minerals exploitation process.

Figure 2.
The stable region of the Nash equilibrium point in-plane .

Figure 3.
The stable region of the Nash equilibrium point in-plane .

Figure 4.
The stable region of the Nash equilibrium point in-plane .

Figure 5.
Price change rates for the intermediate and final products in response to a specific duty.
Figure 5.
Price change rates for the intermediate and final products in response to a specific duty.

Figure 6.
Price change rates for the intermediate and final products in response to ad valorem taxes.
Figure 6.
Price change rates for the intermediate and final products in response to ad valorem taxes.

Figure 7.
Price change rate for the intermediate product of firms in the upstream country in response to changes in the ad valorem tax and specific duty.
Figure 7.
Price change rate for the intermediate product of firms in the upstream country in response to changes in the ad valorem tax and specific duty.

Figure 8.
Price change rate for the final product of firms in the downstream country in response to changes in the ad valorem tax and specific duty.
Figure 8.
Price change rate for the final product of firms in the downstream country in response to changes in the ad valorem tax and specific duty.

Figure 9.
Relationship between the rate of change for products in upstream and downstream countries with regard to changes in the specific duty and the degree of concentration in upstream countries.
Figure 9.
Relationship between the rate of change for products in upstream and downstream countries with regard to changes in the specific duty and the degree of concentration in upstream countries.

Figure 10.
Relationship between the rate of change for products in upstream and downstream countries with regard to changes in the ad valorem tax and the degree of concentration in upstream countries.
Figure 10.
Relationship between the rate of change for products in upstream and downstream countries with regard to changes in the ad valorem tax and the degree of concentration in upstream countries.

Figure 11.
Relationship between rates of change for products in downstream countries with regard to rates of change for a specific duty and ad valorem tax and the degree of concentration in downstream countries.
Figure 11.
Relationship between rates of change for products in downstream countries with regard to rates of change for a specific duty and ad valorem tax and the degree of concentration in downstream countries.

Figure 12.
Relationship between rates of change for products in downstream countries with regard to rates of change for a specific duty and ad valorem tax and degree of concentration in downstream countries.
Figure 12.
Relationship between rates of change for products in downstream countries with regard to rates of change for a specific duty and ad valorem tax and degree of concentration in downstream countries.

Figure 13.
Relationship between rates of change for products in downstream countries with regard to rates of change for a specific duty and ad valorem tax and the degree of concentration in upstream countries.
Figure 13.
Relationship between rates of change for products in downstream countries with regard to rates of change for a specific duty and ad valorem tax and the degree of concentration in upstream countries.

Figure 14.
Relationship between rates of change for products in downstream countries with regard to rates of change in a specific duty and ad valorem tax and the degree of concentration in upstream countries.
Figure 14.
Relationship between rates of change for products in downstream countries with regard to rates of change in a specific duty and ad valorem tax and the degree of concentration in upstream countries.

Figure 15.
Relationship between the optimal strategy and degrees of concentration in upstream and downstream countries under a specific duty.
Figure 15.
Relationship between the optimal strategy and degrees of concentration in upstream and downstream countries under a specific duty.

Figure 16.
Relationship between the optimal strategy and degrees of concentration in upstream and downstream countries under an ad valorem tax.
Figure 16.
Relationship between the optimal strategy and degrees of concentration in upstream and downstream countries under an ad valorem tax.

Publisher’s Note: MDPI stays neutral with regard to jurisdictional claims in published maps and institutional affiliations. |
© 2021 by the authors. Licensee MDPI, Basel, Switzerland. This article is an open access article distributed under the terms and conditions of the Creative Commons Attribution (CC BY) license (https://creativecommons.org/licenses/by/4.0/).
Share and Cite
MDPI and ACS Style
Ding, S.; Wang, M.; Zhang, H. Intergenerational Externalities Influence for Exploitation Process of Rare Metal Minerals. Processes 2021, 9, 883. https://0-doi-org.brum.beds.ac.uk/10.3390/pr9050883
AMA Style
Ding S, Wang M, Zhang H. Intergenerational Externalities Influence for Exploitation Process of Rare Metal Minerals. Processes. 2021; 9(5):883. https://0-doi-org.brum.beds.ac.uk/10.3390/pr9050883
Chicago/Turabian StyleDing, Shijie, Mengxian Wang, and Hongwei Zhang. 2021. "Intergenerational Externalities Influence for Exploitation Process of Rare Metal Minerals" Processes 9, no. 5: 883. https://0-doi-org.brum.beds.ac.uk/10.3390/pr9050883
Note that from the first issue of 2016, this journal uses article numbers instead of page numbers. See further details here.