
Factors Affecting Detoxification of Softwood Enzymatic Hydrolysates Using Sodium Dithionite


1
Department of Chemistry, Umeå University, SE-901 87 Umeå, Sweden
2
RISE Processum AB, SE-891 22 Örnsköldsvik, Sweden
*
Author to whom correspondence should be addressed.
Processes 2021, 9(5), 887; https://0-doi-org.brum.beds.ac.uk/10.3390/pr9050887
Submission received: 27 April 2021
/
Revised: 14 May 2021
/
Accepted: 14 May 2021
/
Published: 18 May 2021
(This article belongs to the Special Issue Advances in Bioprocess Technology)
Abstract
:Conditioning of lignocellulosic hydrolysates with sulfur oxyanions, such as dithionite, is one of the most potent methods to improve the fermentability by counteracting effects of inhibitory by-products generated during hydrothermal pretreatment under acidic conditions. The effects of pH, treatment temperature, and dithionite dosage were explored in experiments with softwood hydrolysates, sodium dithionite, and Saccharomyces cerevisiae yeast. Treatments with dithionite at pH 5.5 or 8.5 gave similar results with regard to ethanol productivity and yield on initial glucose, and both were always at least ~20% higher than for treatment at pH 2.5. Experiments in the dithionite concentration range 5.0–12.5 mM and the temperature range 23–110 °C indicated that treatment at around 75 °C and using intermediate dithionite dosage was the best option (p ≤ 0.05). The investigation indicates that selection of the optimal temperature and dithionite dosage offers great benefits for the efficient fermentation of hydrolysates from lignin-rich biomass, such as softwood residues.
1. Introduction
Biorefining of lignocellulosic biomass offers a route for the production of bio-based commodities, to reduce the dependency on fossil fuels, and reduce greenhouse gas emissions [1,2]. Coniferous trees, principally Norway spruce and Scots pine, are predominant (82%) in Swedish forests [3], and softwood is therefore the main form of lignocellulosic biomass. Mandatory reforestation after harvesting was introduced in Sweden in the Forestry Act of 1903, and active forest management has led to an increase in standing volume from roughly 1700 million m3 in 1926 (when measurements were initiated) to around 3500 million m3 today [3].
Lignocellulosic biomass consists mainly of cellulose, hemicellulose, and lignin [1]. One of the main biorefining routes is biochemical conversion, in which lignocellulosic biomass is converted by pretreatment, enzymatic saccharification of cellulose, microbial fermentation of sugars, and separation and refining of hydrolysis lignin, an approach sometimes referred to as a sugar-platform process. Pretreatment is necessary to make the cellulose in lignocellulosic biomass more accessible to enzymatic saccharification [2,4]. Enzymatic saccharification and microbial fermentation can be performed separately (SHF, separate hydrolysis and fermentation) or simultaneously (SSF, simultaneous saccharification and fermentation) [5]. Other approaches include consolidated bioprocessing (CBP) [6], in which the fermenting microorganism contributes to the enzymes required for saccharification, and hybrid hydrolysis and fermentation (HHF) [7], in which the saccharification is initiated prior to addition of the fermenting microorganisms.
Among numerous pretreatment methods, hydrothermal pretreatment with or without externally added acid catalyst is one of the most studied [2,8,9]. Regardless of whether an acid catalyst, such as sulfuric acid or sulfur dioxide, is added, the pretreated material will become acidic due to formation of carboxylic acids when hemicelluloses are degraded. Hydrothermal pretreatment targets hemicellulose, but cellulose and lignin will also be affected [2,10]. For feedstocks such as wood, and particularly softwood, harsh pretreatment conditions must be used to remove the main part of the hemicelluloses, which is imperative for getting high sugar yields in the ensuing enzymatic saccharification.
Hydrothermal pretreatment under harsh acidic conditions is a good approach for removing hemicelluloses, but also leads to the formation of by-products, particularly from hemicellulose but also from cellulose, lignin, and extractives. The by-products may reach concentrations that are inhibitory for both enzymes that are used for saccharification [7,10,11,12] and microorganisms that are used for the fermentation process [10,13,14].
Certain groups of by-products that inhibit microorganisms have been extensively studied, and these include aliphatic carboxylic acids (such as acetic acid, formic acid, and levulinic acid), furan aldehydes (such as furfural and 5-hydroxymethylfurfural [HMF]), and phenolic and other phenylic substances [10,13,14]. More recently, small aliphatic aldehydes (such as formaldehyde and acetaldehyde) [15] and benzoquinones (such as p-benzoquinone) [16] were also found to be commonly occurring in pretreated biomass. Martín et al. [17] reported that formaldehyde was the most important inhibitor of Saccharomyces cerevisiae yeast in a set of slurries of pretreated Norway spruce. p-Benzoquinone was found only in very low concentrations (micromolar range), but on the other hand it was by far the most toxic inhibitor on the basis of concentration.
Enzyme inhibitors are less well characterized than microbial inhibitors. Apart from feedback inhibition by sugars [18], aromatic substances also cause inhibition [10]. Ximenes et al. [12] found that phenols occurring in lignocellulosic hydrolysates inhibit cellulases. Malgas et al. [19] investigated inhibition by lignin derivatives of mannanolytic enzymes. Zhai et al. [20] found that monomeric sugars and phenolics were the main enzyme inhibitors in steam-pretreated biomass, whereas oligomeric sugars had little influence.
Conditioning of slurries and hydrolysates is used to make them suitable for biocatalysts, such as enzymes and microbes. Detoxification is a form of conditioning that is used to minimize inhibition of microorganisms [13,21]. The drawbacks of many detoxification methods include the requirement of an additional process step, the use of large amounts of chemicals, and that they only address inhibition of microorganisms and not inhibition of enzymes. These drawbacks have been addressed by the introduction of conditioning using reducing agents [22,23,24]. This approach relies on the use of relatively low concentrations of reducing agents, preferably industrial chemicals such as sodium sulfite and sodium dithionite, and their addition to the bioreactor just prior to or simultaneously with the biocatalysts [22]. Further investigations have shown that sulfur oxyanions, such as sulfite and dithionite, cause hydrophilization of inhibitors by sulfonation [23], which alleviates inhibition of cellulolytic enzymes in a way that other reducing agents, such as sodium borohydride, do not do [24].
Sodium dithionite has been shown to be very potent for the conditioning of softwood hydrolysates, but despite the potential benefits very little is known about fundamental aspects of the treatment. The current work addresses that lack of knowledge by investigation of the effects of pH, method of administration of dithionite, treatment temperature, and dosage of dithionite in experiments with a hydrolysate of Norway spruce. The effects were evaluated using a standard S. cerevisiae industrial yeast strain and by analyzing productivities and yields. Research on the efficiency of the process is important for industrial implementation of new technology for the biorefining of lignocellulosic feedstocks, an industrial enterprise in which high yields and efficient use of expensive biocatalysts are among the keys to high competitiveness.
2. Materials and Methods
2.1. Pretreatment
The SF (Severity Factor) (Equation (1)) of the pretreatments was determined as the logarithm of the reaction ordinate according to Overend and Chornet [25] (Equation (2)), and the CSF (Combined Severity Factor) of the acid-catalyzed pretreatments was calculated as outlined by Chum et al. [26] (Equation (3))
where t is the holding time of pretreatment in minutes, and Tr is the pretreatment temperature in °C.
The pretreatment of sawdust from Norway spruce was performed by SEKAB E-Technology in the Biorefinery Demonstration Plant (BDP), Örnsköldsvik, Sweden. The demonstration unit has a pre-treatment capacity of approx. two tons of feedstock per day and is equipped with a continuous steam explosion pretreatment reactor. The Norway spruce was impregnated with sulfuric acid prior to pretreatment and the subsequent pretreatment was performed at a temperature, residence time and reactor pH that resulted in a CSF of approx. 2.6. The pretreatment conditions were: load of sulfuric acid, 1% (w/w) per dry weight biomass; temperature, 210 °C; residence time, 7–8 min. The resulting pH was 1.5. The pretreated biomass was collected and stored at 4 °C until further use. For determination of the dry-matter content, the slurry was separated through vacuum filtration (membrane diameter equal to 0.50 mm and pore size 0.20 μm) (VWR International AB, Spånga, Sweden) and the solid phase was washed with deionized water and analyzed using an HG63 moisture analyzer (Mettler-Toledo, Greifensee, Switzerland). The WIS (water-insoluble solids) content of the slurry was around 17.5% (w/v) and was determined according to Sluiter et al. [27].
2.2. Enzymatic Hydrolysis
Each of three 2 L shake flasks was filled with 750 g of slurry, and the pH of the slurry was adjusted to 5.5 with a 10 M aqueous solution of sodium hydroxide. Enzymatic saccharification was initiated by addition of 14 g Cellic CTec2 solution (obtained from Sigma-Aldrich, Steinheim, Germany) to each flask. The flasks were incubated for 48 h at 50 °C and 140 rpm in an orbital shaker (Kühner Lab-Therm LT-X, Adolf Kühner AG, Birsfelden, Switzerland). After enzymatic saccharification, the slurry was filtered by vacuum filtration and the enzymatic hydrolysates were pooled and used in fermentation experiments.
The concentration of glucose after pretreatment and enzymatic saccharification was measured by high-performance liquid chromatography (HPLC). The HPLC instrument was a 1260 Infinity system equipped with a refractive index detector (RID), an autoinjector, and a column oven (Agilent Technologies, Santa Clara, CA, USA). The column was an Aminex HPX-87P column (300 mm × 7.8 mm) equipped with a guard column, 125-0131 Standard Cartridge Holder (30 mm × 4.6 mm) (Bio-Rad, Irvine, CA, USA). The temperature of the column oven was set to 80 °C and the temperature of the detector was set to 55 °C. The injection volume was 10 µL. The eluent consisted of ultrapure water and the flow rate was 0.6 mL/min. Glucose calibration standards were used for the determination of released glucose by converting the peak heights in chromatograms to concentrations. The software was OpenLAB CDS Chem Station Edition for LC and LC/MS Systems Rev.C.01.07 Edition 27. The analysis was performed in triplicates.
2.3. Conditioning of Hydrolysate
Three different experimental series were performed. In the first experimental series (A, Table 1) the pH and the temperature of conditioning were varied. The pH was adjusted to 5.5 prior to conditioning using a 10 M aqueous solution of sodium hydroxide, and then the hydrolysates were conditioned with sodium dithionite, which was added as a powder (technical grade 93%) for 10 min at 23 °C with magnetic mixing. For reactions at 75 °C, the sodium dithionite was added when the hydrolysates reached a temperature of 75 °C, and the reaction mixtures were incubated for 10 min. Experiments included triplicates of each reaction mixture.
In the second experimental series (B, Table 1) the temperatures were decided based on the results of the first experimental series and investigated in order to better understand and evaluate the impact of the temperature under the conditioning step.
In the third experimental series (C, Table 1) the concentration of sodium dithionite was varied from 5 mM to 12.5 mM, while the conditioning temperature was set at 50 °C, 75 °C, 95 °C, and 110 °C. The conditioning at 95 °C and 110 °C was performed in an oil bath. The experiments were performed using reagent bottles with screw caps. The bottles with the enzymatic hydrolysates were placed in the oil bath and the sodium dithionite was added when the sample reached the right temperature (95 °C or 110 °C) under magnetic stirring. Experiments included triplicates of each reaction mixture.
2.4. Fermentation
For assessing the effects of conditioning, fermentation of media based on hydrolysate was performed with the industrial S. cerevisiae yeast Ethanol Red (Fermentis, Marcq-en-Baroeul, France). After the enzymatic saccharification, the monosaccharide composition of the hydrolysate (in g/L) was: glucose, 97; galactose, 7.7; mannose, 37; xylose, 20; arabinose, 3.2. A medium based on a synthetic glucose solution was used as a reference. Reference fermentations were included in all series to compensate for potential differences between inocula used on different occasions. The glucose medium consisted of 97 g/L glucose in ultrapure water (the same glucose concentration as in the hydrolysate). Fermentations were performed in 30 mL glass flasks containing 25 mL culture medium. The culture medium contained 23.5 mL hydrolysate, or, alternatively, glucose reference solution, and 0.5 mL of a nutrient solution (containing 150 g/L yeast extract, 75 g/L (NH4)2HPO4, 3.75 g/L MgSO4·7 H2O, and 238.2 g/L NaH2PO4·H2O). The pH of the media was adjusted to 5.5 before inoculation. Before inoculum, freeze-dried Ethanol Red was rehydrated by suspension in five times its weight of sterilized water for 30 min at 35 °C. One mL of yeast suspension was added to each flask to an initial yeast biomass concentration of 2 g/L. The flasks were sealed with rubber plugs pierced with cannulas for letting out carbon dioxide and were then incubated for 48 h or 60 h in a water bath, with magnetic stirring at 180 rpm and 30 °C. The glucose levels during the fermentation were monitored using a glucometer (Glucometer Elite XL, Bayer AG, Leverkusen, Germany). Fermentations were performed in duplicates.
2.5. Analysis of Ethanol and Glucose
The Agilent 1260 Infinity HPLC system was used for determination of ethanol and glucose in fermentation samples. The column was an Aminex HPX-87H column (300 mm × 7.8 mm) equipped with a 125-0131 Standard Cartridge Holder guard column (30 mm × 4.6 mm) (Bio-Rad). The temperature of the column oven was set to 80 °C and the temperature of the detector was set to 55 °C. The injection volume was 10 μL and the flow rate was 0.6 mL/min. The eluent consisted of a 5 mM aqueous solution of H2SO4. The software used for the analysis was OpenLAB CDS Chem Station Edition for LC and LC/MS Systems Rev.C.01.07 Edition 27. Calibration standards were used for both glucose and ethanol. The concentrations were calculated by converting the peak heights in chromatograms to concentrations. Analysis was performed in triplicates.
2.6. Analysis of Monosaccharides
Analysis of monosaccharides was performed using high-performance anion-exchange chromatography (HPAEC) with pulsed amperometric detection (PAD). The instrument used was an ICS-5000 system equipped with a CarboPac PA1 4 × 250 mm separation column and a 4 × 50 mm guard column (all from Dionex, Sunnyvale, CA, USA). Elution was performed with ultra-pure water using a flow rate of 1 mL/min for 25 min. Post-column addition of a 300 mM aqueous solution of NaOH (0.5 mL/min) was used to amplify the signal. The column was regenerated by washing for 11 min with a mixture consisting of 60% of the 300 mM NaOH solution and 40% of a 200 mM NaOH solution with 170 mM sodium acetate, and equilibration with ultra-pure water for 3 min. PAD was performed on gold electrode applying a Gold Standard PAD waveform with Ag/AgCl as reference electrode. Prior to analysis all samples were diluted with ultra-pure water and filtered through 0.2 μm nylon membranes.
2.7. Determination of Microbial Inhibitors
Determination of furfural and 5-hydroxymethylfurfural (HMF) was performed using an HPLC system (Dionex UltiMate 3000) equipped with a diode-array detector and a 3 × 50 mm, 1.8 µm Zorbax RRHT SB-C18 column (Agilent Technologies). The temperature of the column oven was set to 40 °C. Gradient elution was performed using a mixture of Eluent A (an aqueous solution of 0.1% (v/v) formic acid) and Eluent B (acetonitrile with 0.1% (v/v) formic acid). The flow rate was 0.5 mL/min. Separation was achieved with 3% Eluent B for 3 min. The ensuing cleaning step was done with 20% Eluent B for 4 min. Finally, the column was equilibrated for 4 min with 3% Eluent B. The absorption at 282 nm was monitored.
Analysis of commonly occurring aliphatic carboxylic acids (acetic acid, formic acid, and levulinic acid) was performed by MoRe Research Örnsköldsvik AB, Sweden. The analysis was done using HPAEC.
Ultra-high performance liquid chromatography-electrospray ionization-triple quadrupole-mass spectrometry (UHPLC-ESI-QqQ-MS) was used for determination of formaldehyde, acetaldehyde, p-benzoquinone, vanillin, coniferyl aldehyde, syringaldehyde, p-hydroxybenzaldehyde, p-coumaraldehyde, and acetovanillone. Derivatization with 2,4-dinitrophenylhydrazine (DNPH) and calibration was performed as previously described [15,16]. Briefly, UHPLC-ESI-QqQ-MS analysis was carried out using an Agilent 1290 Infinity system coupled to an Agilent 6490 TripleQuad mass spectrometer (QqQ-MS) used in negative electrospray ionization (ESI) mode and equipped with Agilent Jetstream technology. The QqQ-MS source parameters were optimized for each analyte using the following settings: gas temperature 290 °C, gas flow 20 L/min, nebulizer 30 psi, sheath gas temperature 400 °C, sheath gas flow 12 L/min, capillary voltage −3000 V, nozzle voltage −2000 V. The separation was performed on a 2.1 mm × 50 mm Kinetex 1.7 μm biphenyl 100 Å column (Phenomenex, Torrance, CA, USA) operating at 30 °C and using a flow rate of 0.3 mL/min. The eluent consisted of a mixture of aqueous 0.1% (v/v) formic acid (Eluent C) and a three-to-one (by volume) solution of acetonitrile and 2-propanol mixed with 0.1% formic acid (Eluent D). Elution was performed using a gradient profile containing the following fractions of Eluent D: 0.0–4.5 min 30–40%, 4.5–9.0 min 40–50%, 9.0–11.0 min 50–70%, 11.0–11.01 min 70–95%, 11.01–15.0 min 95%, 15.0–15.01 min 95–30%, 15.01–18.0 min 30%, and, at the end, two min post-time with 30% for further re-equilibration. Data evaluation was done with MassHunter quant software (Agilent Technologies).
For determination of total phenolics, the Folin–Ciocalteu method [28] was used with vanillin as calibration standard. The color generated after 2 h at about 23 °C was read at 760 nm in a microtiter plate using SpectraMax i3x (Molecular Devices, San Jose, CA, USA). Reactions were performed in triplicates.
Total aromatic content (TAC) [29] in pretreatment liquids was determined by measuring the absorbance at 280 nm using a UV-1800 spectrophotometer (Shimadzu, Kyoto, Japan). Total carboxylic acid content (TCAC) [29] was determined by titration from pH 2.8 to pH 7.0 using an aqueous solution of sodium hydroxide (200 mM).
2.8. Calculations
The ethanol yield on consumed sugar (Ycon) was calculated as the amount of ethanol formed per gram of consumed glucose (g/g). The ethanol yield on initial sugar (Yini) was calculated as the amount of ethanol formed per gram of initial glucose (g/g). The volumetric productivity (Q) was based on grams of ethanol produced per L of culture medium during the first 24 h, 36 h, and 48 h of the fermentation [g/(L h−1)]. The specific productivity (q) was based on the volumetric productivity divided by the initial cell dry weight concentration [g/(g h−1)].
3. Results and Discussion
Three series of fermentations, using different detoxification conditions, were performed to investigate how pH, temperature, and loading of the reducing agent affected the fermentability of hydrolysates of wood of Norway spruce. The concentrations of microbial inhibitors were also determined (Table 2).
With regard to aliphatic aldehydes, the hydrolysate contained a high concentration of formaldehyde (6.1 mM) whereas the concentration of acetaldehyde was rather low (1.7 mM). Cavka et al. [15] and Martin et al. [17] found that 1.0 mM of formaldehyde and 5.0 mM of acetaldehyde was sufficient to inhibit S. cerevisae. Thus, the formaldehyde concentration found in the hydrolysate would be expected to be strongly inhibitory, while the acetaldehyde concentration would not be inhibitory. The observed concentrations are in line with previous studies of pretreated spruce showing higher concentrations of formaldehyde than of acetaldehyde [15,17]. It is probable that formaldehyde primarily comes from lignin, and that acetaldehyde primarily comes from acetyl groups in hemicelluloses. As softwood has comparatively high lignin content and low acetyl content, this can explain the predominance of formaldehyde.
The sum of the concentrations of acetic acid, formic acid, and levulinic acid (Table 2) was 135 mM. As expected, the TCAC value was higher than that, viz. 153 mM. Lignocellulosic hydrolysates typically contain other aliphatic acids as well as aromatic carboxylic acids [30]. Individual carboxylic acids are not covered by the mass spectrometric method used in this investigation, as DNPH derivatization targets aldehydes and ketones. Studies by Larsson et al. [31] showed an inhibitory impact of aliphatic acids on S. cerevisiae yeast when the concentrations were above 100 mM. Thus, it is likely that carboxylic acids (Table 2) contributed to the toxicity. However, detoxification with sodium dithionite would not be expected to decrease the concentrations of aliphatic acids in the hydrolysates, as has been previously reported [22].
p-Benzoquinone was not detected (Table 2). Previous studies have shown the presence of p-benzoquinone in steam-pretreated Norway spruce, even when less severe pretreatment conditions were used [17]. The concentration of p-benzoquinone is closely related to lignin degradation, especially at high temperature.
The concentration of furan aldehydes (HMF and furfural) was slightly lower than in spruce hydrolysates in a previous study [17]. Although common in lignocellulosic hydrolysates due to dehydration of sugars, the molar toxicity of HMF and furfural is low [17]. According to a recent study by Wang et al. [32], concentrations of furfural and HMF above 31 mM and 39 mM, respectively, inhibit yeast. Therefore, concentrations around 20 mM (Table 2) would hardly be inhibitory. Based on previous studies, conditioning of hydrolysates with reducing agents, such as sodium dithionite, would not be expected to cause any significant changes in the concentrations of HMF and furfural [22,33]. In model experiments with only one inhibitor present at the time, the concentrations of HMF and furfural decreased after treatment with dithionite [23], so the reaction may occur even if it is not favored in complex media such as lignocellulosic hydrolysates.
The concentrations of six individual phenols (acetovanillone, coniferyl aldehyde, p-coumaraldehyde, 4-hydroxybenzaldehyde, syringaldehyde, and vanillin) are shown in Table 2. Vanillin and coniferyl aldehyde were the most abundant of the phenols. This can be explained by the fact that both are guaiacyl-type substances, as is softwood lignin [34]. The concentration of total phenolics, estimated as vanillin equivalents using the Folin–Ciocalteu method, was 1.6 g/L, which corresponds to 11 mM. The combined concentration of the six phenols in Table 2 is 0.6 mM. The reason for the discrepancy is that lignocellulosic hydrolysates contain a wide variety of phenolic and other aromatic substances [13,30], and that the subset shown in Table 2 is just a small fraction of the total. Furthermore, common analytical procedures used (for example by Du et al. [30] and in this work) result in reports on mononuclear aromatics, whereas dimeric and oligomeric phenolic lignin fragments would also contribute to total phenolics as determined using the Folin–Ciocalteu method. The concentration of total phenolics would not be expected to be affected by conditioning with dithionite [22], as that treatment does not necessarily lead to a decrease in the content of phenolic hydroxyl groups although it does affect many individual phenols and causes detoxification by sulfonation [23].
TAC (Table 2), which is based on UV absorption at 280 nm, covers both aromatic substances, such as phenols, and heteroaromatic substances, such as furans [29]. Thus, TAC reflects both lignin-degradation products and products of dehydration of sugars formed during the pretreatment.
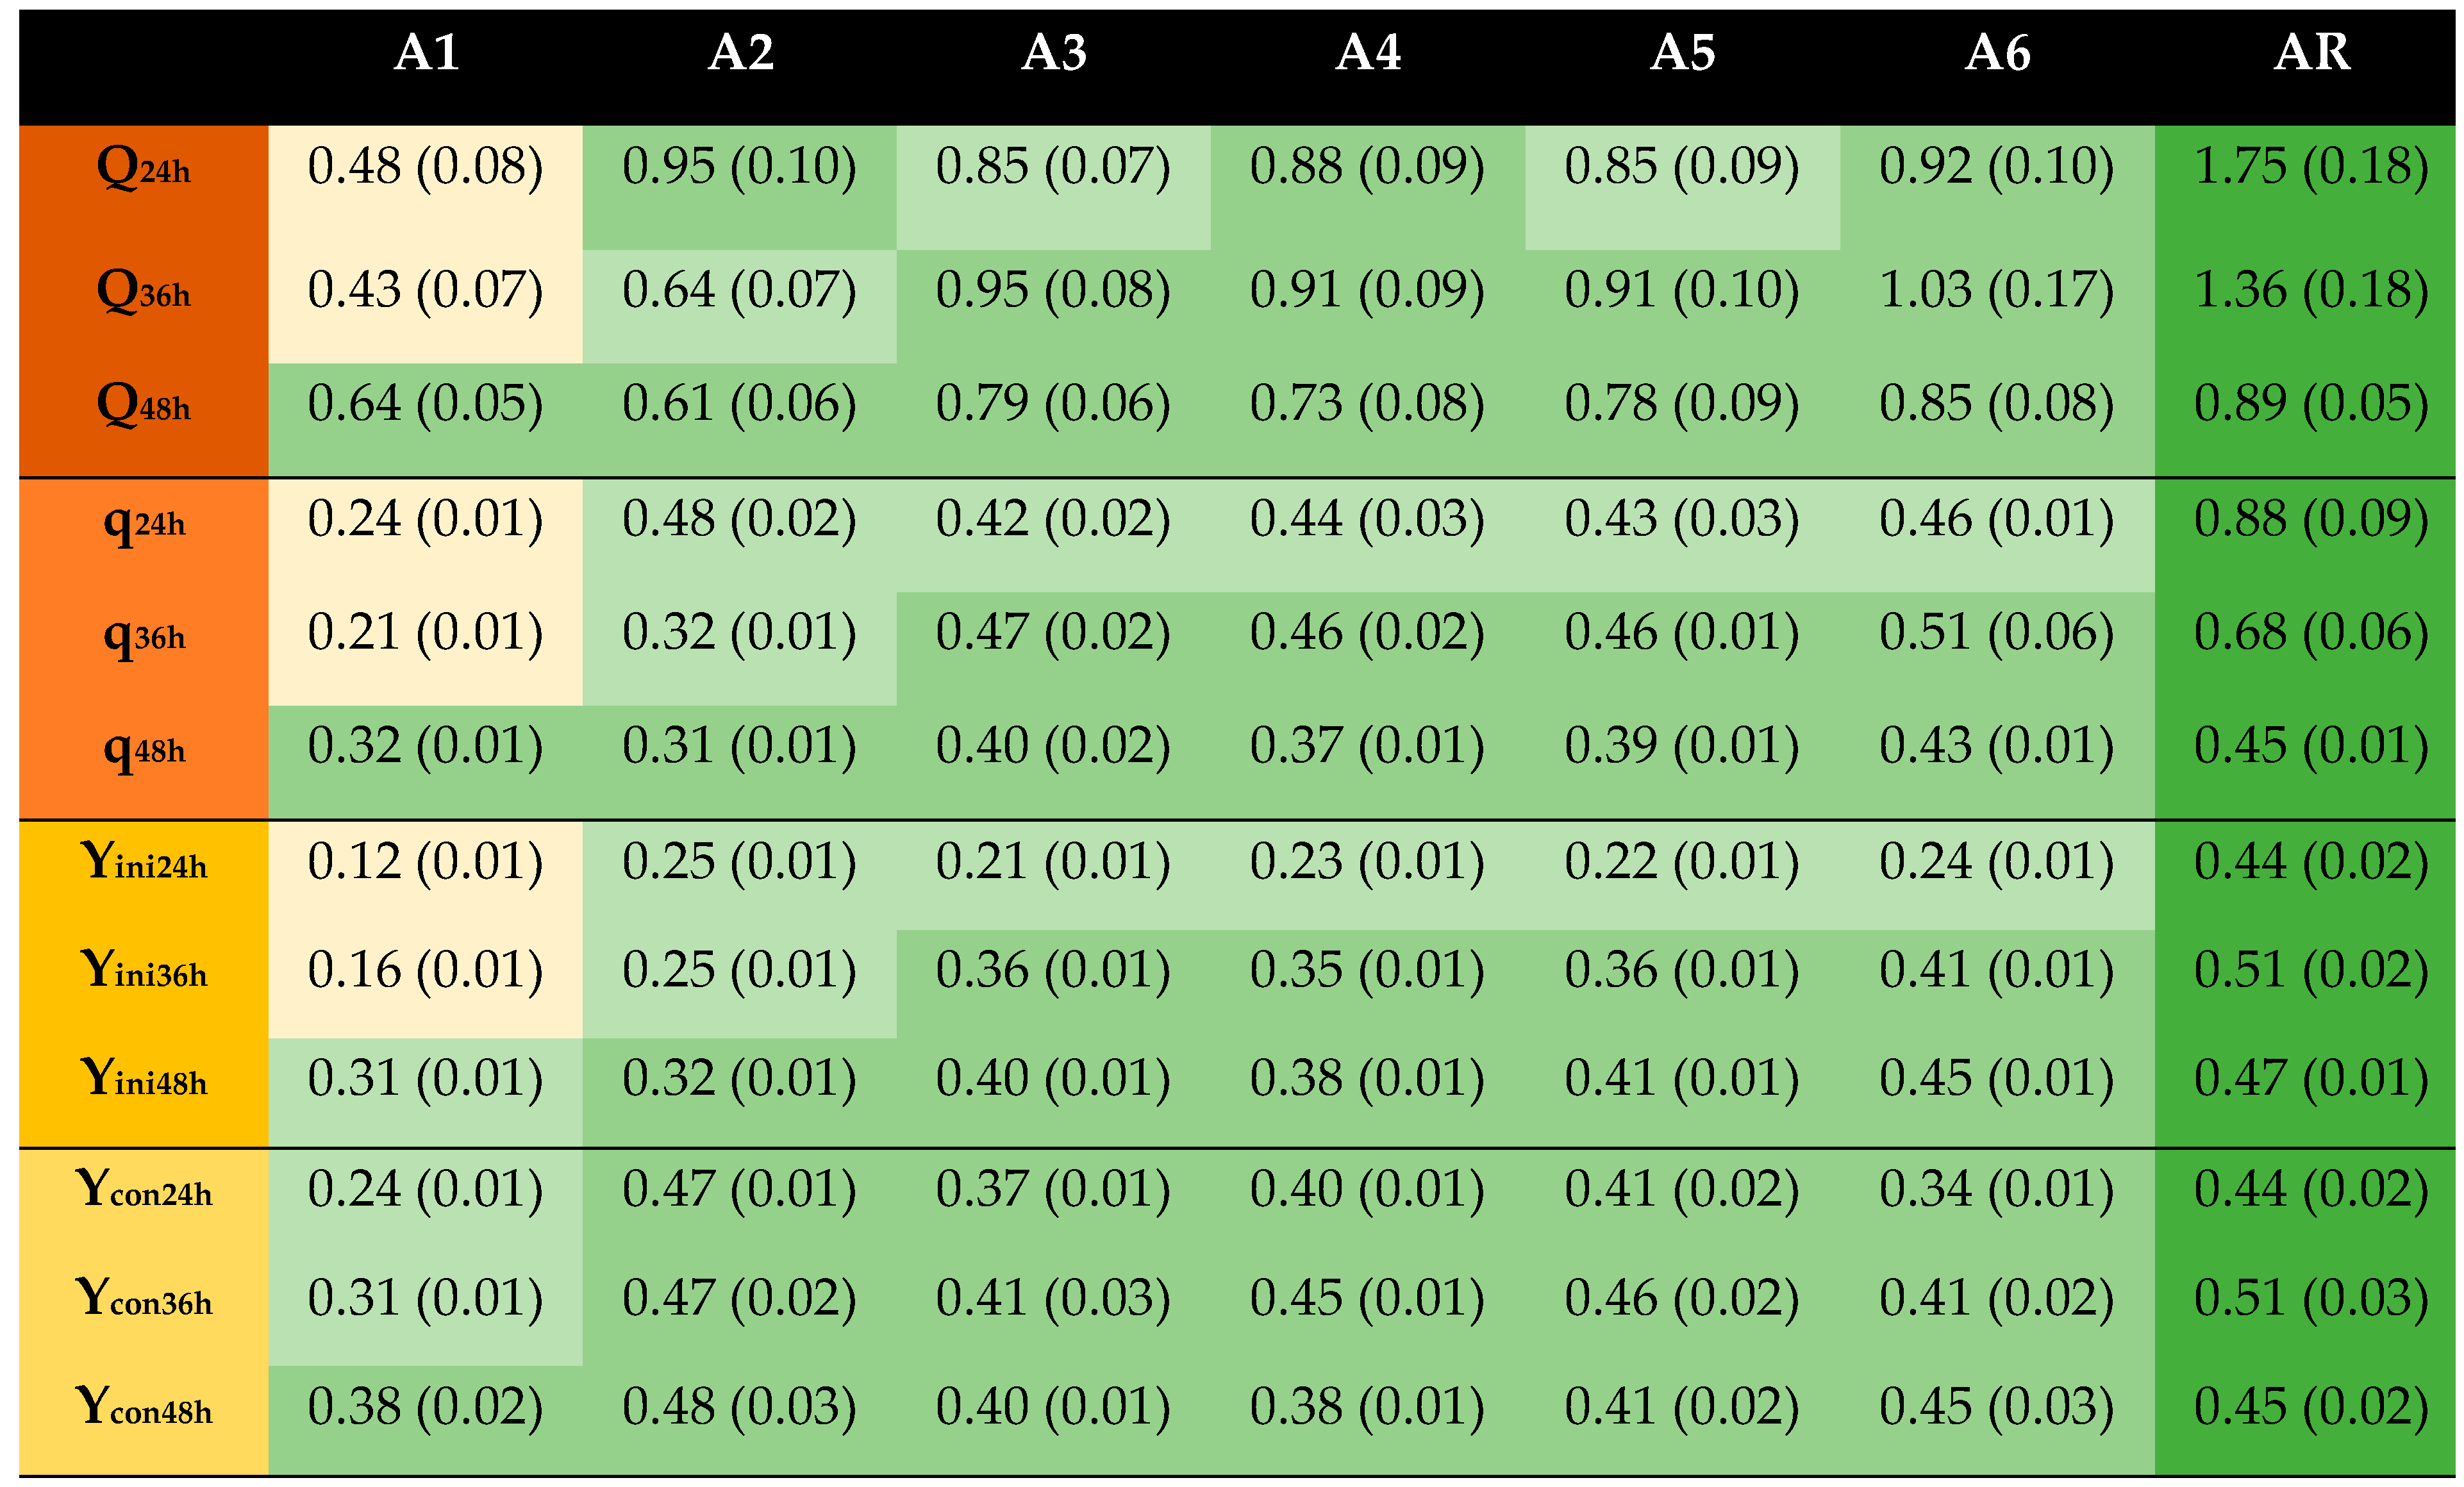
The first experimental series (Table 1, Figure 1) was aimed at the questions whether the pH (2.5, 5.5 or 8.5), the temperature (23 °C or 75 °C), or the mode of addition of dithionite (as a salt or as an aqueous solution) had any impact on the detoxification effect. For 24 and 36 h all combinations with dithionite (A2–A6) performed better than the combinations without dithionite (A1) (p ≤ 0.05) (Figure 1). That was evident with regard to volumetric productivity (Q), specific productivity (q), and yield on initial sugar (Yini). It was somewhat less obvious with regard to the yield on consumed sugar (Ycon), which is reasonable considering that inhibitors might not necessarily affect how sugar is utilized by the cell. After 48 h, the values (Q, q, Yini, Ycon) for A1 were close to the values of the worst-performing of A2–A6, but they never came close to the values of the best-performing of A2–A6. The detoxification effect observed for dithionite agrees with the results of previous studies [22,24].
The results of A2–A4 indicate the impact of the pH when dithionite is added. A2 (pH 2.5) reflects the pH of a slurry after pretreatment, A3 (pH 5.5) the pH after conditioning with alkali to a pH that is suitable for enzymes and yeast, and A4 (pH 8.5) an alkaline pH, as alkaline pH improves the stability of dithionite [35]. At the beginning (24 h), there were no clear differences, but by the end (36 h, 48 h) A3 and A4 were always superior compared to A2 with regard to Q, q, and Yini (Table 2). After 48 h, the superiority of A3 and A4 compared to A2 amounted to at least 20% for Q, 19% for q, and 19% for Yini. For Ycon, there were no clear differences. Thus, it is advantageous to wait with dithionite treatment until the pH has been adjusted to around 5.5 to be appropriate for biocatalysts, and there is no reason to raise the pH to an alkaline value.
A comparison of A3 (23 °C) and A6 (75 °C) would indicate whether the temperature is relevant for dithionite treatment. In previous studies [22,24], dithionite and other reducing agents that were investigated were added at room temperature, but, as the pretreated material is warm after the pretreatment, it might be an option to conduct dithionite treatment prior to cooling the pretreated material to a temperature that is not harmful for biocatalysts. Furthermore, enzyme preparations used for saccharification of cellulose are often used at temperatures around 50 °C [9], or even higher if thermostable cellulases are used [36]. Several industrial yeasts exhibit high vigor at 40 °C [37]. Even if both A3 (23 °C) and A6 (75 °C) performed well (Figure 1), A6 was always slightly better for Q, q, and Yini. For Ycon, the outcome of the comparison was variable.
A comparison of A3 (addition as salt) and A5 (addition as aqueous solution) would indicate whether the mode of addition of dithionite is relevant for dithionite treatment. A5 exhibited slightly higher values than A3 for Ycon, but otherwise A3 and A5 performed similarly. Thus, the mode of addition was of no significance (p > 0.05).
At the end of the fermentation (48 h), A6 was always closest to the reference (AR) (Figure 1). Compared to untreated (A1), the volumetric productivity of A6 was 33% higher, the specific productivity was 34% higher, the yield on initial glucose was 45% higher, and the yield on consumed sugar was 18% higher. This demonstrates the efficiency of dithionite as a detoxification agent, even at as low a concentration as 5 mM, which was used in experimental series A.
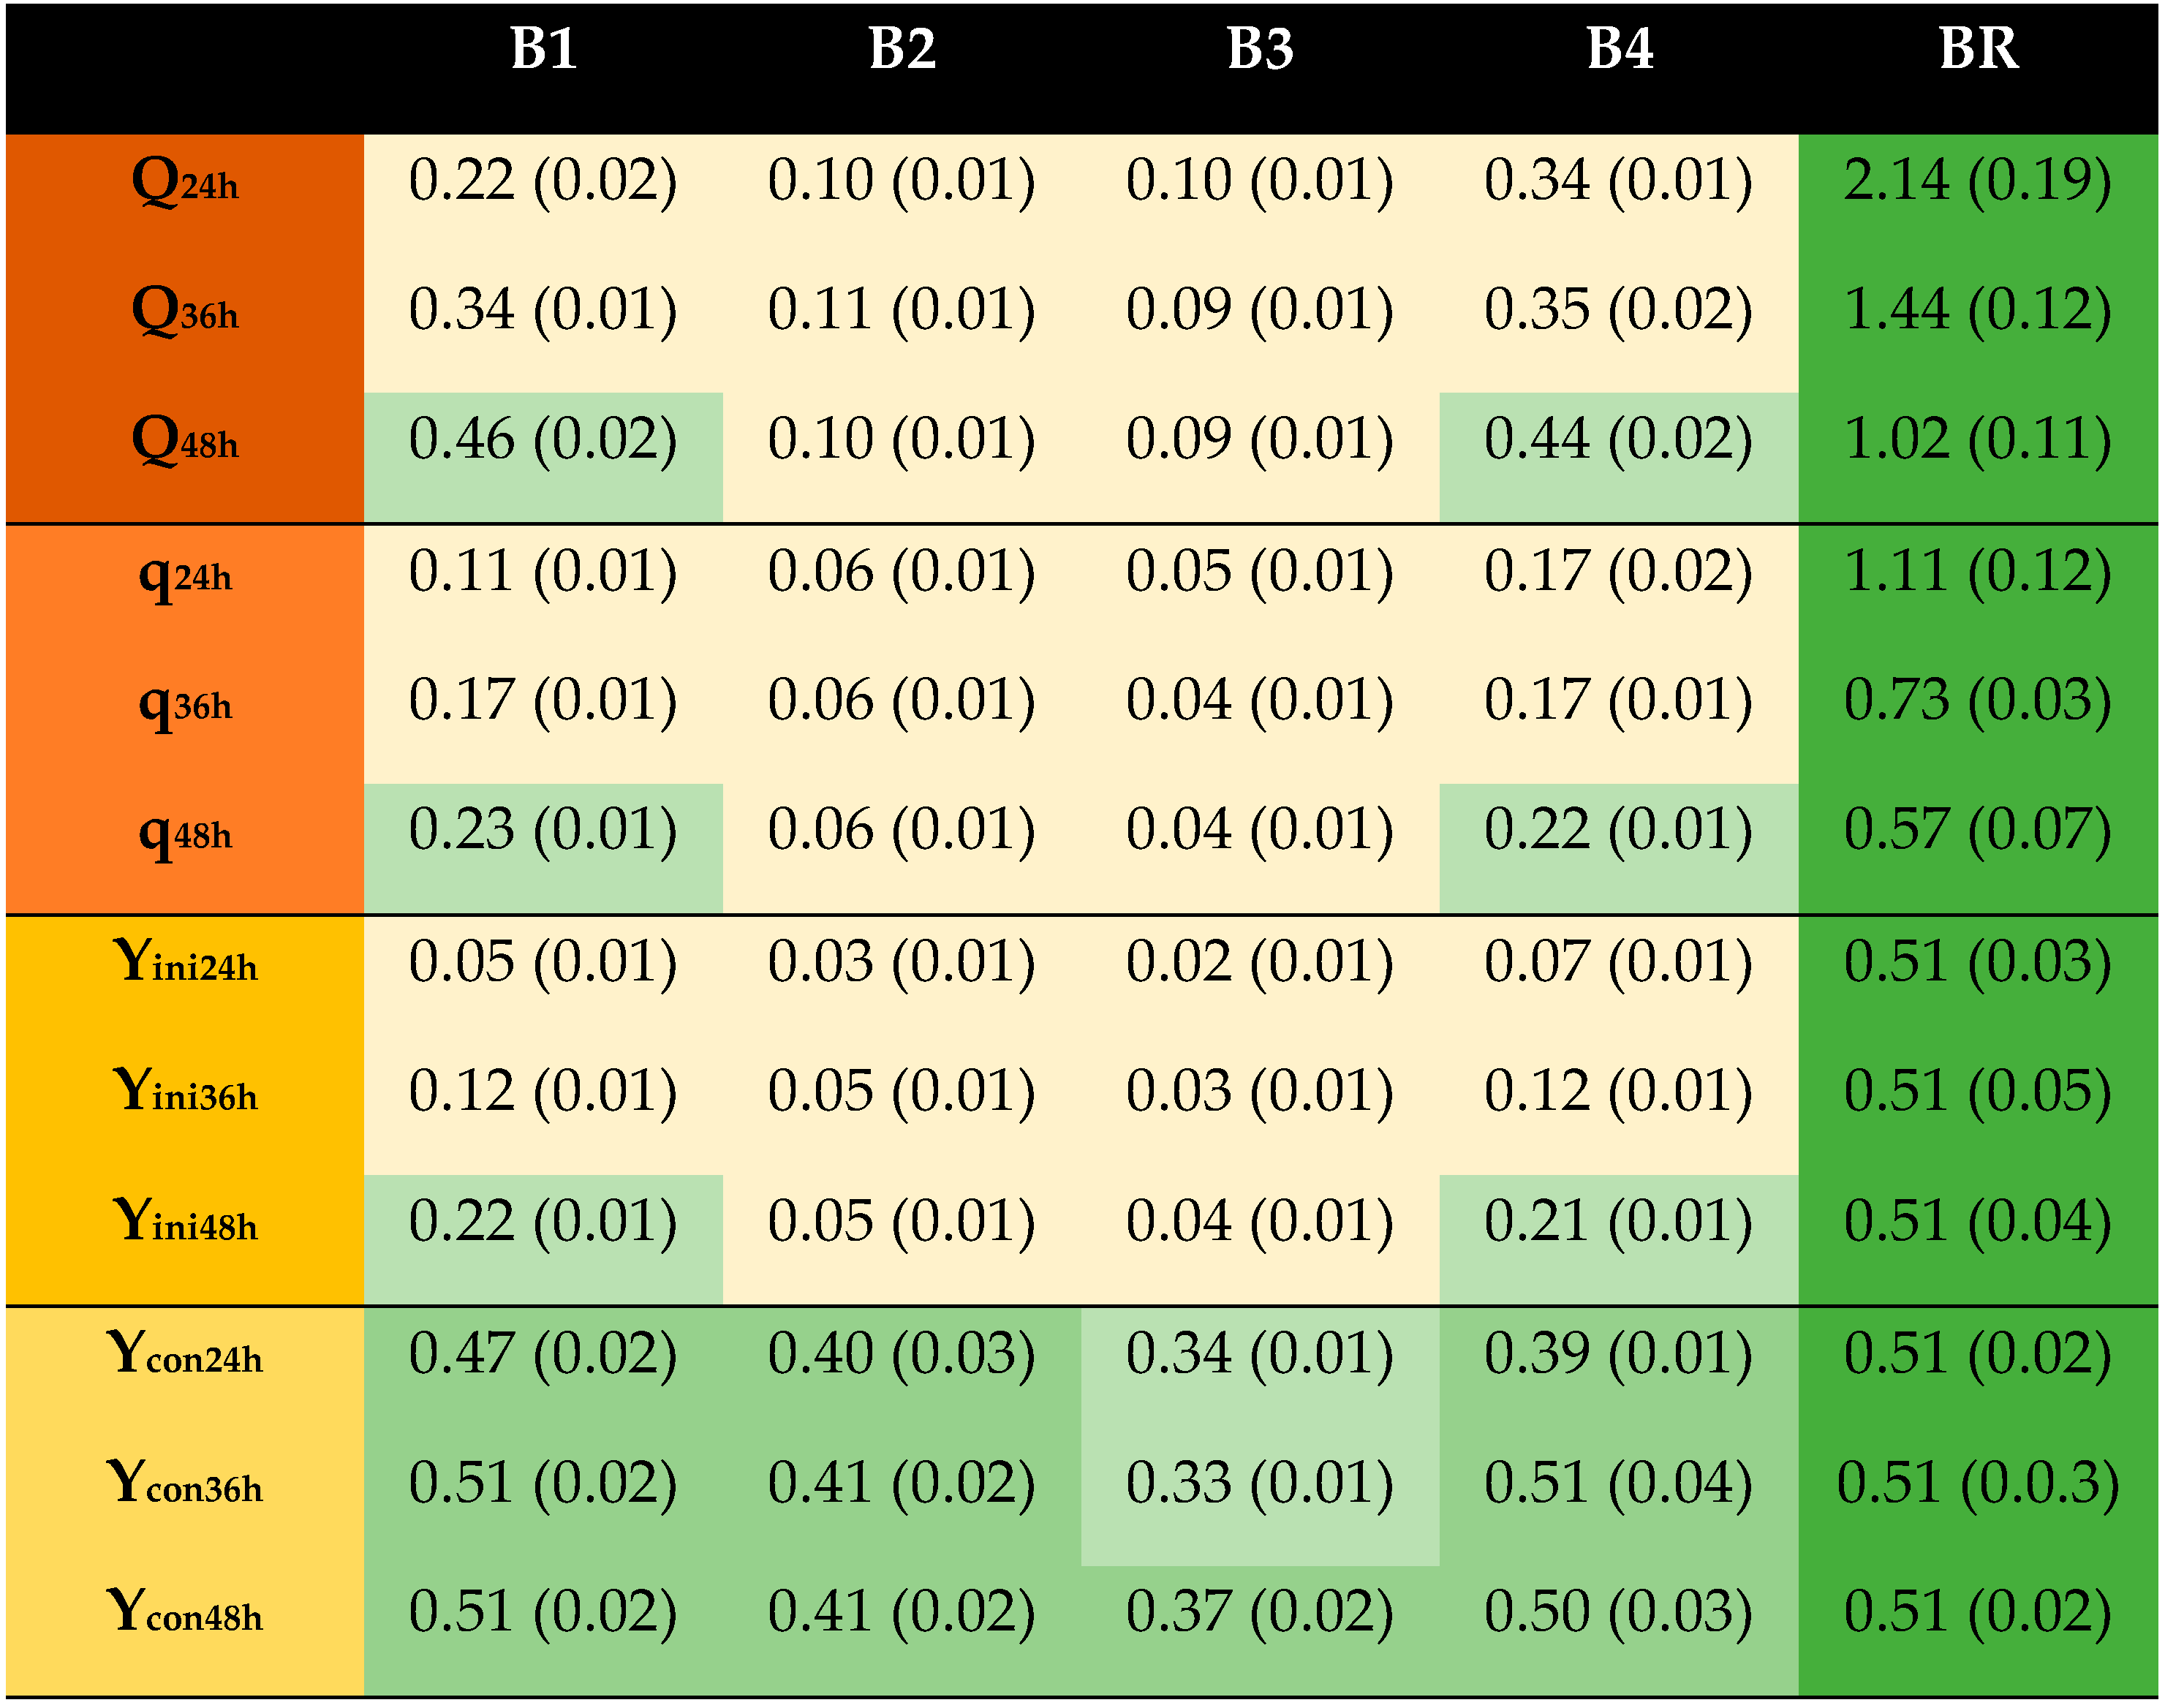
The results from Series A encouraged further investigations of the significance of the treatment temperature. The differences between A3 and A6 were rather small, and one question was if treatment at 75 °C without dithionite addition had any effect. In Series B (Table 1), dithionite treatments at 23 °C (B4) and 75 °C (B1) were again compared, but this time with control fermentations without dithionite both for 23 °C (B3) and 75 °C (B2). The result (Figure 2) showed that dithionite-treated cultures (B1 and B4) always (Q, q, Yini, and Ycon) performed better than the corresponding control (B2 or B3). For Q, q, and Yini, B2 and B3 performed similarly, and the values were always <33% of the values of the reference (Figure 2). With regard to Ycon, B2 was better than B3 (p ≤ 0.05). B1 and B4 performed similarly. Importantly, B4 performed much better than B2 (p ≤ 0.05), demonstrating that it was the dithionite addition that was important, and not incubating the mixture at 75 °C.
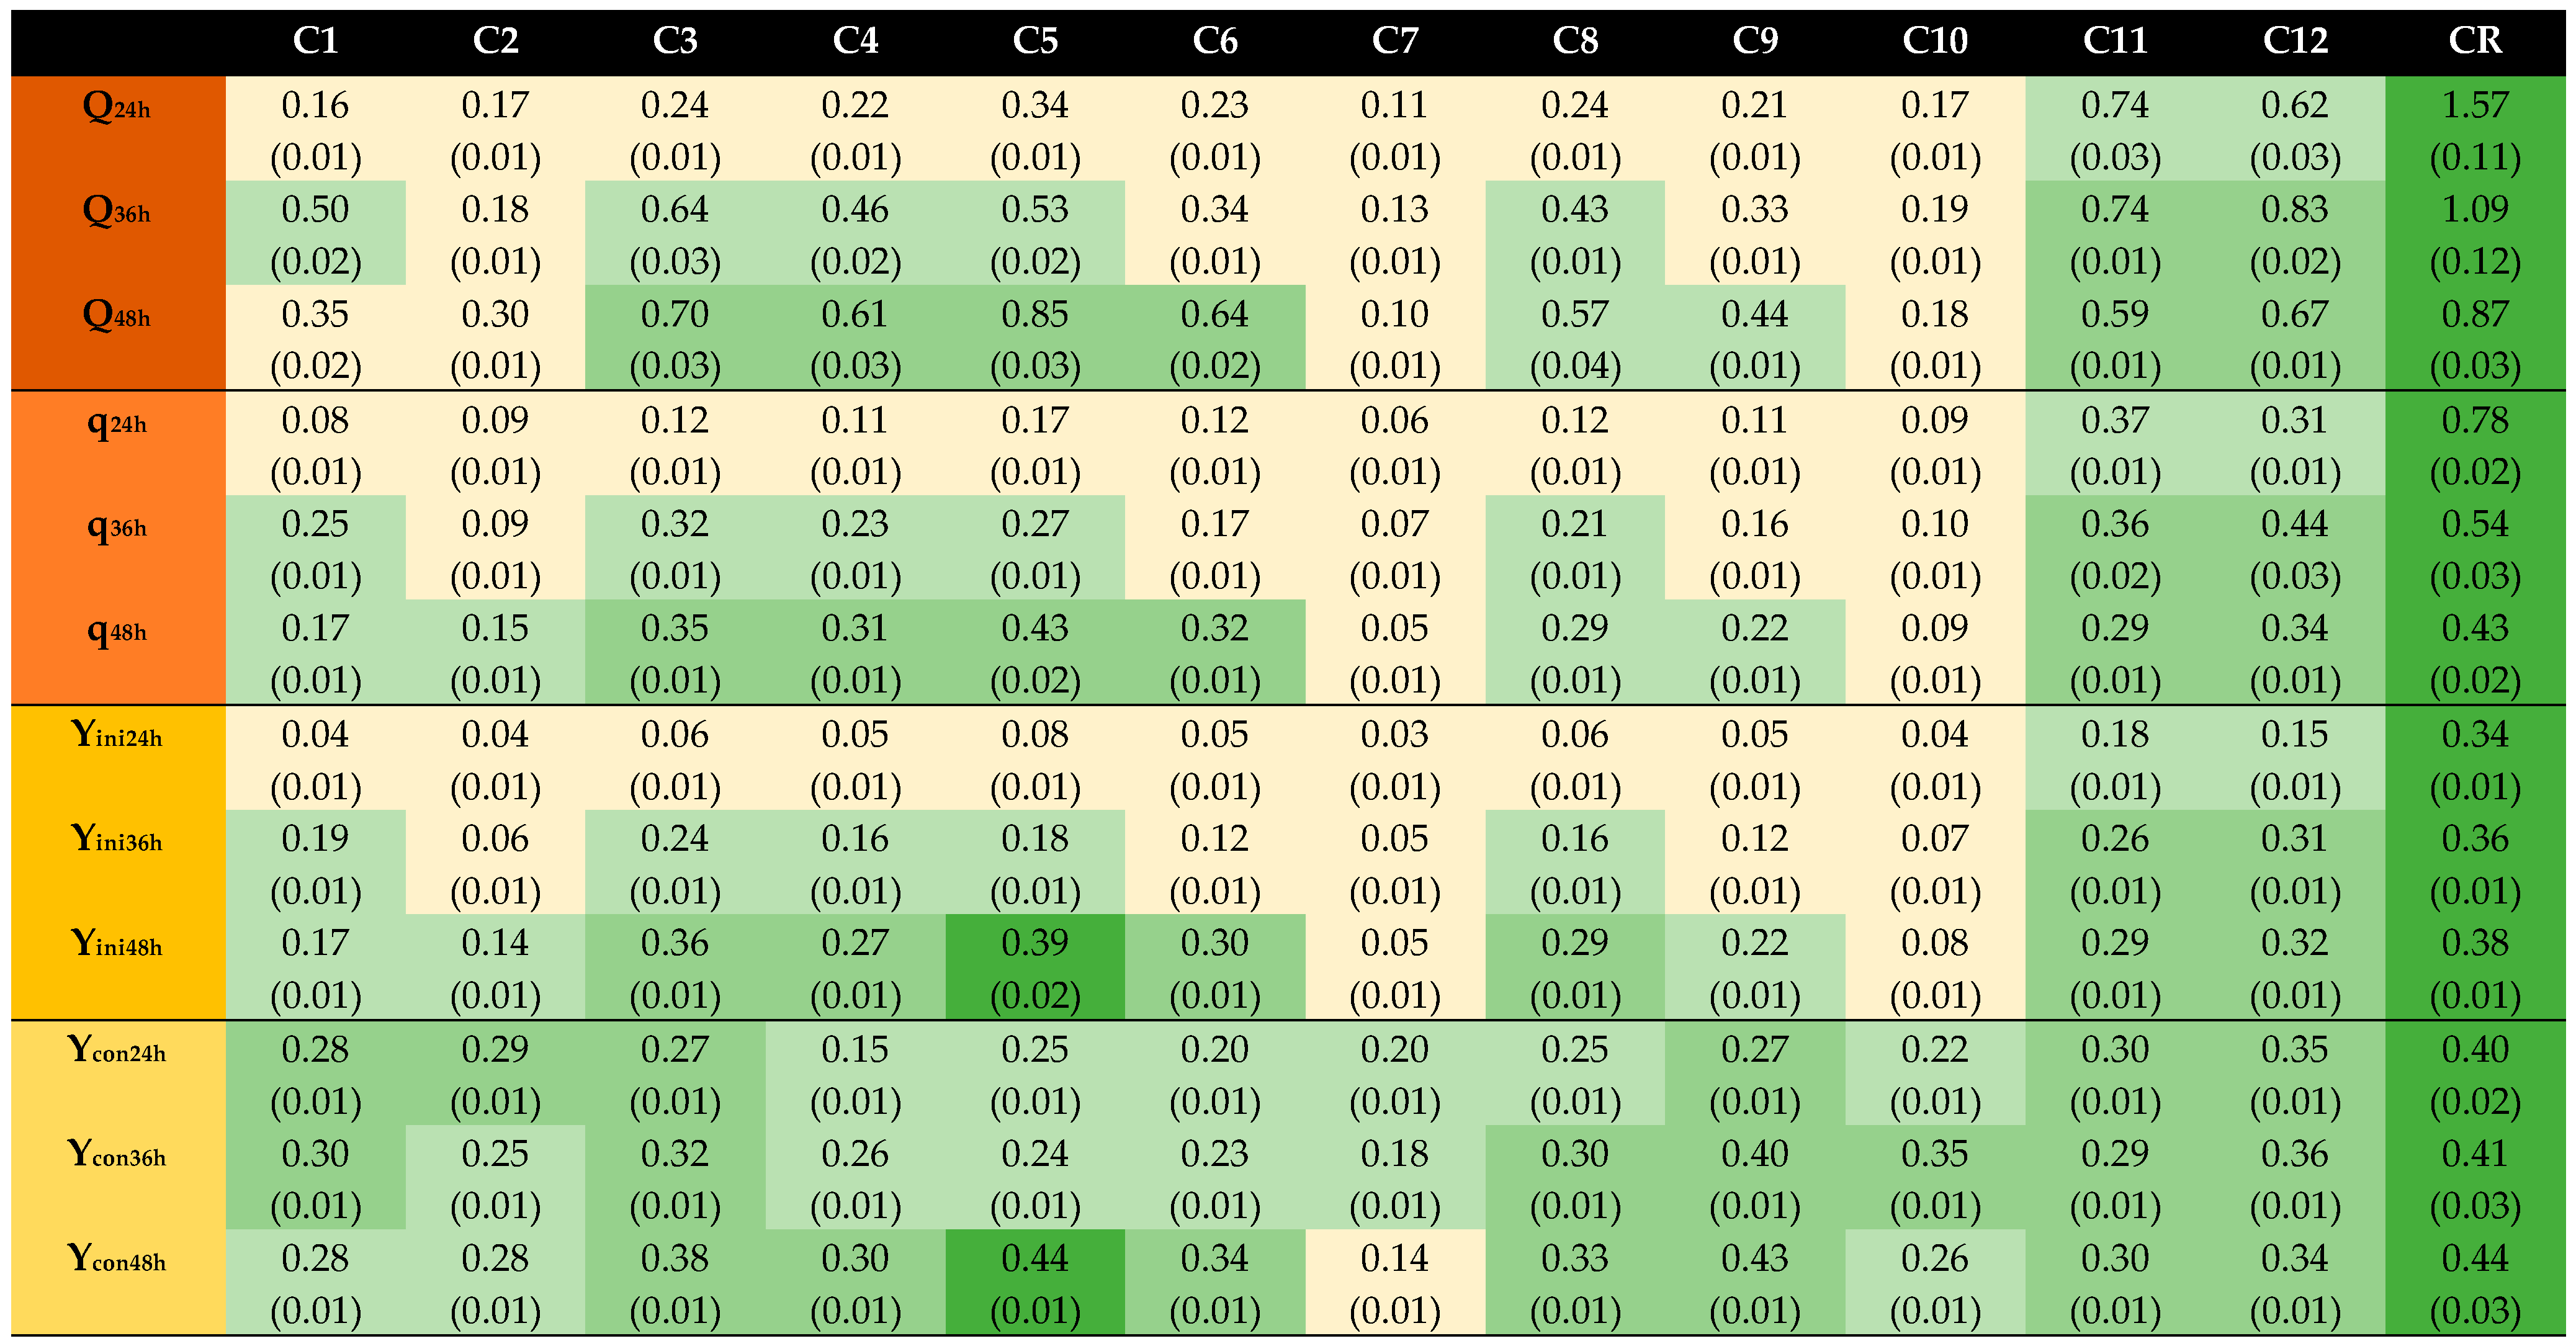
The third experimental series, C, covered four treatment temperatures (50 °C, 75 °C, 95 °C, and 110 °C) and three dithionite concentrations (5.0 mM, 8.7 mM, and 12.5 mM) (Table 1). The results (Figure 3) show that for the lowest dithionite concentration (C1, C4, C7, and C10), treatments at lower temperatures (50 °C and 75 °C) worked better (p ≤ 0.05) than treatments at higher temperatures (95 °C and 110 °C), except for Ycon, which varied within a comparatively low range (0.14–0.35 g/g). For the lowest temperature (50 °C, C2), there was no benefit of raising the dithionite concentration to 8.7 mM, but for all other temperatures there was a clear improvement when the concentration was raised from 5.0 to 8.7 mM (p ≤ 0.05). After 48 h and for all parameters (Q, q, Yini, Ycon), C5 outperformed C8 and C11 (p ≤ 0.05), which in turn outperformed C2 (p ≤ 0.05). For the lowest temperature (50 °C, C3), there was a clear benefit of raising the dithionite concentration to 12.5 mM (p ≤ 0.05), but for all other temperatures there were no or relatively small benefits of raising the concentration from 8.7 to 12.5 mM (p > 0.05). At the beginning (24 and 36 h), the highest values for Q, q, and Yini were observed for C11 (8.7 mM and 110 °C) and C12 (12.5 mM and 110 °C). However, the highest values for hydrolysate-based cultures after 48 h were always observed for C5 (8.7 mM and 75 °C): Q, 0.85 g/(L × h); q, 0.43 g/(g × h); Yini, 0.39 g/g; Ycon, 0.44 g/g. The second highest values were observed for C3 (12.5 mM and 50 °C) (Q, q, and Yini) and C9 (12.5 mM and 95 °C) (Ycon). The lowest values after 48 h were observed for C7 (5.0 mM and 95 °C). The differences between the highest and lowest values were large, as C7 reached 12–13% of the values for Q, q, and Yini shown by C5, and 32% of the value of Ycon shown by C5.
Within the concentration and temperature ranges investigated, the results obtained after 48 h indicate that both the dithionite concentration and the temperature have a large impact on the effect, that using high temperatures (>75 °C) combined with a low dithionite dosage can result in a very poor effect, that high temperatures (such as 95 °C and 110 °C) are not needed to achieve an optimal effect, that the best effect is not necessarily achieved with high dithionite dosage, and that high dithionite dosage might have adverse effects at higher temperatures, such as 75 °C and 95 °C. Consequently, modulating dithionite dosage and treatment temperature emerges as a better alternative than consistently using high dithionite dosage or high temperature.
After 48 h, C4 (5.0 mM and 75 °C) performed clearly better (p ≤ 0.05) than C1 (5.0 mM and 50 °C) and C2 (8.7 mM and 50 °C), and C5 (8.7 mM and 75 °C) performed clearly better (p ≤ 0.05) than C2 and C3 (12.5 mM and 50 °C). Thus, the results also indicate that, at least to some extent, increased temperature can compensate for a lower dosage of sodium dithionite.
4. Conclusions
Conditioning with dithionite was investigated with regard to the influence of pH, mode of addition of dithionite, concentration of dithionite, and temperature. The results showed clearly that conditioning should be done after the pH has been raised to a slightly acidic value suitable for biocatalysts, and that using mildly alkaline pH to stabilize dithionite is of no advantage. The temperature and the dosage of dithionite can be used to modulate the effect. The finding that increased temperature can compensate for using lower concentrations of dithionite can potentially be advantageous from an economical point of view, as the cost for dithionite can be minimized and as the pretreated biomass is warm after the pretreatment and using temperatures at or around 75 °C, therefore, does not necessarily require heating. Further research in the field can facilitate industrial implementation of new technology suitable for bioconversion of lignin-rich lignocellulosic biomass, such as softwood residues.
Author Contributions
Conceptualization, L.J.J., B.A. and D.I.; methodology, D.I. and S.S.; validation, D.I. and S.S.; formal analysis, D.I. and S.S.; investigation, D.I. and S.S.; resources, L.J.J. and B.A.; writing—original draft preparation, D.I.; writing—review and editing, L.J.J.; visualization, D.I. and L.J.J.; supervision, B.A. and L.J.J.; project administration, L.J.J.; funding acquisition, L.J.J. All authors have read and agreed to the published version of the manuscript.
Funding
This research was funded by Swedish Energy Agency (P41285-1, P47516-1), Kempe Foundations, and the Bio4Energy research environment (www.bio4energy.se, accessed on 23 April 2021).
Institutional Review Board Statement
Not applicable.
Informed Consent Statement
Not applicable.
Data Availability Statement
Data is contained within the article.
Acknowledgments
We thank SEKAB E-Technology for supplying the pretreated Norway spruce. Mass spectrometry was carried out using resources at the Swedish Metabolomics Centre Umeå.
Conflicts of Interest
Three of the authors (L.J.J., B.A., and D.I.) are co-inventors of patents/patent applications in the area biochemical conversion of biomass. The funders had no role in the design of the study; in the collection, analyses, or interpretation of data; in the writing of the manuscript, or in the decision to publish the results.
References
- Ragauskas, A.J.; Williams, C.K.; Davison, B.H.; Britovsek, G.; Cairney, J.; Eckert, C.A.; Frederick, W.J., Jr.; Hallett, J.P.; Leak, D.J.; Liotta, C.L.; et al. The path forward for biofuels and biomaterials. Science 2006, 311, 484–489. [Google Scholar] [CrossRef] [Green Version]
- Galbe, M.; Wallberg, O. Pretreatment for biorefineries: A review of common methods for efficient utilisation of lignocellulosic materials. Biotechnol. Biofuels 2019, 12, 294. [Google Scholar] [PubMed] [Green Version]
- Forest Statistics; Official Statistics of Sweden; Swedish University of Agricultural Sciences: Umeå, Sweden, 2018; Available online: https://www.slu.se/globalassets/ew/org/centrb/rt/dokument/skogsdata/skogsdata_2018_webb.pdf (accessed on 14 May 2021).
- Sun, S.; Sun, S.; Cao, X.; Sun, R. The role of pretreatment in improving the enzymatic hydrolysis of lignocellulosic materials. Bioresour. Technol. 2016, 199, 49–58. [Google Scholar] [CrossRef] [PubMed]
- Öhgren, K.; Bura, R.; Lesnicki, G.; Saddler, J.; Zacchi, G. A comparison between simultaneous saccharification and fermenta-tion and separate hydrolysis and fermentation using steam-pretreated corn stover. Process Biochem. 2007, 42, 834–839. [Google Scholar] [CrossRef]
- Lynd, L.R.; Liang, X.; Biddy, M.J.; Allee, A.; Cai, H.; Foust, T.; Himmel, M.E.; Laser, M.S.; Wang, M.; Wyman, C.E. Cellulosic ethanol: Status and innovation. Curr. Opin. Biotechnol. 2017, 45, 202–211. [Google Scholar] [CrossRef] [Green Version]
- Zhong, N.; Chandra, R.; Saddler, J.J.N. Sulfite post-treatment to simultaneously detoxify and improve the enzymatic hydrol-ysis and fermentation of a steam-pretreated softwood lodgepole pine whole slurry. ACS Sustain. Chem. Eng. 2019, 7, 5192−5199. [Google Scholar] [CrossRef]
- Hu, F.; Ragauskas, A.J. Pretreatment and lignocellulosic chemistry. Bioenergy Res. 2012, 5, 1043–1066. [Google Scholar] [CrossRef]
- Gandla, M.L.; Martín, C.; Jönsson, L.J. Analytical enzymatic saccharification of lignocellulosic biomass for conversion to bio-fuels and bio-based chemicals. Energies 2018, 11, 2936. [Google Scholar] [CrossRef] [Green Version]
- Jönsson, L.J.; Martín, C. Pretreatment of lignocellulose: Formation of inhibitory by-products and strategies for minimizing their effects. Bioresour. Technol. 2016, 199, 103–112. [Google Scholar] [CrossRef] [Green Version]
- Berlin, A.; Balakshin, M.; Gilkes, N.; Kadla, J.; Maximenko, V.; Kubo, S.; Saddler, J. Inhibition of cellulase, xylanase and β-glucosidase activities by softwood lignin preparations. J. Biotechnol. 2006, 125, 198–209. [Google Scholar] [CrossRef]
- Ximenes, E.; Kim, Y.; Mosier, N.; Dien, B.; Ladisch, M. Inhibition of cellulases by phenols. Enzym. Microb. Technol. 2010, 46, 170–176. [Google Scholar] [CrossRef]
- Jönsson, L.J.; Alriksson, B.; Nilvebrant, N.-O. Bioconversion of lignocellulose: Inhibitors and detoxification. Biotechnol. Biofuels 2013, 6, 16. [Google Scholar] [CrossRef] [Green Version]
- Ko, J.K.; Um, Y.; Park, Y.-C.; Seo, J.-H.; Kim, K.H. Compounds inhibiting the bioconversion of hydrothermally pretreated lignocellulose. Appl. Microbiol. Biotechnol. 2015, 99, 4201–4212. [Google Scholar] [CrossRef]
- Cavka, A.; Stagge, S.; Jönsson, L.J. Identification of small aliphatic aldehydes in pretreated lignocellulosic feedstocks and evaluation of their inhibitory effects on yeast. J. Agric. Food Chem. 2015, 63, 9747–9754. [Google Scholar] [CrossRef] [PubMed]
- Stagge, S.; Cavka, A.; Jönsson, L.J. Identification of benzoquinones in pretreated lignocellulosic feedstocks and inhibitory effects on yeast. AMB Express 2015, 5, 1–9. [Google Scholar] [CrossRef] [PubMed] [Green Version]
- Martín, C.; Wu, G.; Wang, Z.; Stagge, S.; Jönsson, L.J. Formation of microbial inhibitors in steam-explosion pretreatment of softwood impregnated with sulfuric acid and sulfur dioxide. Bioresour. Technol. 2018, 262, 242–250. [Google Scholar] [CrossRef]
- Xiao, Z.; Zhang, X.; Gregg, D.J.; Saddler, J.N. Effects of sugar inhibition on cellulases and β-glucosidase during enzymatic hydrolysis of softwood substrates. Appl. Biochem. Biotechnol. 2004, 115, 1115–1126. [Google Scholar] [CrossRef]
- Malgas, S.; Van Dyk, J.S.; Abboo, S.; Pletschke, B.I. The inhibitory effects of various substrate pre-treatment by-products and wash liquors on mannanolytic enzymes. J. Mol. Catal. B Enzym. 2016, 123, 132–140. [Google Scholar] [CrossRef]
- Zhai, R.; Hu, J.; Saddler, J.N. What are the major components in steam pretreated lignocellulosic biomass that inhibit the efficacy of cellulase enzyme mixtures? ACS Sustain. Chem. Eng. 2016, 4, 3429–3436. [Google Scholar] [CrossRef]
- Pienkos, P.T.; Zhang, M. Role of pretreatment and conditioning processes on toxicity of lignocellulosic biomass hydrolysates. Cellulous 2009, 16, 743–762. [Google Scholar] [CrossRef]
- Alriksson, B.; Cavka, A.; Jönsson, L.J. Improving the fermentability of enzymatic hydrolysates of lignocellulose through chemical in-situ detoxification with reducing agents. Bioresour. Technol. 2011, 102, 1254–1263. [Google Scholar] [CrossRef]
- Cavka, A.; Alriksson, B.; Ahnlund, M.; Jönsson, L.J. Effect of sulfur oxyanions on lignocellulose-derived fermentation inhibi-tors. Biotechnol. Bioeng. 2011, 108, 2592–2599. [Google Scholar] [CrossRef]
- Cavka, A.; Jönsson, L.J. Detoxification of lignocellulosic hydrolysates using sodium borohydride. Bioresour. Technol. 2013, 136, 368–376. [Google Scholar] [CrossRef] [Green Version]
- Overend, R.P.; Chornet, E. Fractionation of lignocellulosics by steam-aqueous pretreatments. Philos. Trans. R. Soc. Lond. Ser. A Math. Phys. Sci. 1987, 321, 523–536. [Google Scholar] [CrossRef]
- Chum, H.L.; Johnson, D.K.; Black, S.K.; Overend, R.P. Pretreatment-catalyst effects and the combined severity parameter. Appl. Biochem. Biotechnol. 1990, 24–25, 1–14. [Google Scholar] [CrossRef]
- Sluiter, A.; Hyman, D.; Payne, C.; Wolfe, J. Determination of Insoluble Solids in Pretreated Biomass Material; National Renewable Energy Laboratory: Golden, CO, USA, 2008. [Google Scholar]
- Singleton, V.L.; Orhofer, R.; Lamuela-Raventos, R.M. Analysis of total phenols and other oxidation substrates and antioxidants by measure of Folin-Ciocalteu reagent. Methods Enzymol. 1999, 299, 152–178. [Google Scholar]
- Wang, Z.; Wu, G.; Jönsson, L.J. Effects of impregnation of softwood with sulfuric acid and sulfur dioxide on chemical and physical characteristics, enzymatic digestibility, and fermentability. Bioresour. Technol. 2018, 247, 200–208. [Google Scholar] [CrossRef]
- Du, B.; Sharma, L.N.; Becker, C.; Chen, S.-F.; Mowery, R.A.; Van Walsum, G.P.; Chambliss, C.K. Effect of varying feedstock-pretreatment chemistry combinations on the formation and accumulation of potentially inhibitory degradation products in biomass hydrolysates. Biotechnol. Bioeng. 2010, 107, 430–440. [Google Scholar] [CrossRef]
- Larsson, S.; Palmqvist, E.; Hahn-Hägerdal, B.; Tengborg, C.; Stenberg, K.; Zacchi, G.; Nilvebrant, N.-O. The generation of fermentation inhibitors during dilute acid hydrolysis of softwood. Enzym. Microb. Technol. 1999, 24, 151–159. [Google Scholar] [CrossRef]
- Wang, L.-Q.; Cai, L.-Y.; Ma, Y.-L. Study on inhibitors from acid pretreatment of corn stalk on ethanol fermentation by alcohol yeast. RSC Adv. 2020, 10, 38409–38415. [Google Scholar] [CrossRef]
- Guo, X.; Cavka, A.; Jönsson, L.J.; Hong, F. Comparison of methods for detoxification of spruce hydrolysate for bacterial cel-lulose production. Microb. Cell Fact. 2013, 12, 93. [Google Scholar] [CrossRef] [PubMed] [Green Version]
- Ralph, J.; Lapierre, C.; Boerjan, W. Lignin structure and its engineering. Curr. Opin. Biotechnol. 2019, 56, 240–249. [Google Scholar] [CrossRef] [PubMed]
- Veguta, V.L.; Stevanic, J.S.; Lindström, M.; Salmén, L. Thermal and alkali stability of sodium dithionite studied using ATR-FTIR spectroscopy. BioResources 2017, 12, 2496–2506. [Google Scholar]
- Patel, A.K.; Singhania, R.R.; Sim, S.J.; Pandey, A. Thermostable cellulases: Current status and perspectives. Bioresour. Technol. 2019, 279, 385–392. [Google Scholar] [CrossRef]
- Favaro, L.; Jansen, T.; Van Zyl, W.H. Exploring industrial and natural Saccharomyces cerevisiae strains for the bio-based economy from biomass: The case of bioethanol. Crit. Rev. Biotechnol. 2019, 39, 800–816. [Google Scholar] [CrossRef]
Figure 1.
Fermentation results from first experimental series (A1–AR). Codes refer to conditions detailed in Table 1. Calculations are based on the results obtained after 24 h, 36 h, and 48 h of fermentation. Standard deviations are shown in parentheses. Color scheme: ![Processes 09 00887 i001]() , reference;
, reference; ![Processes 09 00887 i002]() , ≥67% of reference;
, ≥67% of reference; ![Processes 09 00887 i003]() , <67% to ≥33% of reference;
, <67% to ≥33% of reference; ![Processes 09 00887 i004]() , <33% of reference. Q, g EtOH/(L × h); q, g EtOH/(g biomass × h); Yini, g EtOH/g initial glucose; Ycon, g EtOH/g consumed glucose.
, <33% of reference. Q, g EtOH/(L × h); q, g EtOH/(g biomass × h); Yini, g EtOH/g initial glucose; Ycon, g EtOH/g consumed glucose.
 , reference;
  , ≥67% of reference;
  , <67% to ≥33% of reference;
  , <33% of reference. Q, g EtOH/(L × h); q, g EtOH/(g biomass × h); Yini, g EtOH/g initial glucose; Ycon, g EtOH/g consumed glucose.
Figure 1.
Fermentation results from first experimental series (A1–AR). Codes refer to conditions detailed in Table 1. Calculations are based on the results obtained after 24 h, 36 h, and 48 h of fermentation. Standard deviations are shown in parentheses. Color scheme: ![Processes 09 00887 i001]() , reference;
, reference; ![Processes 09 00887 i002]() , ≥67% of reference;
, ≥67% of reference; ![Processes 09 00887 i003]() , <67% to ≥33% of reference;
, <67% to ≥33% of reference; ![Processes 09 00887 i004]() , <33% of reference. Q, g EtOH/(L × h); q, g EtOH/(g biomass × h); Yini, g EtOH/g initial glucose; Ycon, g EtOH/g consumed glucose.
, <33% of reference. Q, g EtOH/(L × h); q, g EtOH/(g biomass × h); Yini, g EtOH/g initial glucose; Ycon, g EtOH/g consumed glucose.
, reference; , ≥67% of reference; , <67% to ≥33% of reference; , <33% of reference. Q, g EtOH/(L × h); q, g EtOH/(g biomass × h); Yini, g EtOH/g initial glucose; Ycon, g EtOH/g consumed glucose.
Figure 2.
Results of the second experimental series (B) of the fermentation of detoxified and undetoxified Norway spruce hydrolysates with S. cerevisiae. The codes refer to conditions detailed in Table 1.Calculations are based on the results obtained after 24 h, 36 h, and 48 h of fermentation. Standard deviations are shown in parentheses. Color scheme: ![Processes 09 00887 i005]() , reference;
, reference; ![Processes 09 00887 i006]() , ≥67% of reference;
, ≥67% of reference; ![Processes 09 00887 i007]() , <67% to ≥33% of reference;
, <67% to ≥33% of reference; ![Processes 09 00887 i008]() , <33% of reference. Q, g EtOH/(L × h); q, g EtOH/(g × h); Yini, g EtOH/g initial glucose; Ycon, g EtOH/g consumed glucose.
, <33% of reference. Q, g EtOH/(L × h); q, g EtOH/(g × h); Yini, g EtOH/g initial glucose; Ycon, g EtOH/g consumed glucose.
 , reference;
  , ≥67% of reference;
  , <67% to ≥33% of reference;
  , <33% of reference. Q, g EtOH/(L × h); q, g EtOH/(g × h); Yini, g EtOH/g initial glucose; Ycon, g EtOH/g consumed glucose.
Figure 2.
Results of the second experimental series (B) of the fermentation of detoxified and undetoxified Norway spruce hydrolysates with S. cerevisiae. The codes refer to conditions detailed in Table 1.Calculations are based on the results obtained after 24 h, 36 h, and 48 h of fermentation. Standard deviations are shown in parentheses. Color scheme: ![Processes 09 00887 i005]() , reference;
, reference; ![Processes 09 00887 i006]() , ≥67% of reference;
, ≥67% of reference; ![Processes 09 00887 i007]() , <67% to ≥33% of reference;
, <67% to ≥33% of reference; ![Processes 09 00887 i008]() , <33% of reference. Q, g EtOH/(L × h); q, g EtOH/(g × h); Yini, g EtOH/g initial glucose; Ycon, g EtOH/g consumed glucose.
, <33% of reference. Q, g EtOH/(L × h); q, g EtOH/(g × h); Yini, g EtOH/g initial glucose; Ycon, g EtOH/g consumed glucose.
, reference; , ≥67% of reference; , <67% to ≥33% of reference; , <33% of reference. Q, g EtOH/(L × h); q, g EtOH/(g × h); Yini, g EtOH/g initial glucose; Ycon, g EtOH/g consumed glucose.
Figure 3.
Fermentation results from the third experimental series (C1–CR). Codes refer to conditions detailed in Table 1. Calculations are based on the results obtained after 24 h, 36 h, and 48 h of fermentation. Standard deviations are shown in parentheses. Color scheme: ![Processes 09 00887 i009]() , reference;
, reference; ![Processes 09 00887 i010]() , ≥67% of reference;
, ≥67% of reference; ![Processes 09 00887 i011]() , <67% to ≥33% of reference;
, <67% to ≥33% of reference; ![Processes 09 00887 i012]() , <33% of reference. Q, g EtOH/(L × h); q, g EtOH/(g × h); Yini, g EtOH/g initial glucose; Ycon, g EtOH/g consumed glucose.
, <33% of reference. Q, g EtOH/(L × h); q, g EtOH/(g × h); Yini, g EtOH/g initial glucose; Ycon, g EtOH/g consumed glucose.
 , reference;
  , ≥67% of reference;
  , <67% to ≥33% of reference;
  , <33% of reference. Q, g EtOH/(L × h); q, g EtOH/(g × h); Yini, g EtOH/g initial glucose; Ycon, g EtOH/g consumed glucose.
Figure 3.
Fermentation results from the third experimental series (C1–CR). Codes refer to conditions detailed in Table 1. Calculations are based on the results obtained after 24 h, 36 h, and 48 h of fermentation. Standard deviations are shown in parentheses. Color scheme: ![Processes 09 00887 i009]() , reference;
, reference; ![Processes 09 00887 i010]() , ≥67% of reference;
, ≥67% of reference; ![Processes 09 00887 i011]() , <67% to ≥33% of reference;
, <67% to ≥33% of reference; ![Processes 09 00887 i012]() , <33% of reference. Q, g EtOH/(L × h); q, g EtOH/(g × h); Yini, g EtOH/g initial glucose; Ycon, g EtOH/g consumed glucose.
, <33% of reference. Q, g EtOH/(L × h); q, g EtOH/(g × h); Yini, g EtOH/g initial glucose; Ycon, g EtOH/g consumed glucose.
, reference; , ≥67% of reference; , <67% to ≥33% of reference; , <33% of reference. Q, g EtOH/(L × h); q, g EtOH/(g × h); Yini, g EtOH/g initial glucose; Ycon, g EtOH/g consumed glucose.

Table 1.
Experimental conditions for series with varying pH and conditioning temperature.
| Codification | Na2S2O4 (mM) | T (°C) | Time (min) | pH |
|---|---|---|---|---|
| A1 | - | 23 | 10 | 5.5 |
| A2 | 5 | 23 | 10 | 2.5 |
| A3 | 5 | 23 | 10 | 5.5 |
| A4 | 5 | 23 | 10 | 8.5 |
| A5 | 5 a | 23 | 10 | 5.5 |
| A6 | 5 | 75 | 10 | 5.5 |
| AR | Glucose reference | |||
| B1 | 5 | 75 | 10 | 5.5 |
| B2 | - | 75 | 10 | 5.5 |
| B3 | - | 23 | 10 | 5.5 |
| B4 | 5 | 23 | 10 | 5.5 |
| BR | Glucose reference | |||
| C1 | 5 | 50 | 10 | 5.5 |
| C2 | 8.7 | 50 | 10 | 5.5 |
| C3 | 12.5 | 50 | 10 | 5.5 |
| C4 | 5 | 75 | 10 | 5.5 |
| C5 | 8.7 | 75 | 10 | 5.5 |
| C6 | 12.5 | 75 | 10 | 5.5 |
| C7 | 5 | 95 | 10 | 5.5 |
| C8 | 8.7 | 95 | 10 | 5.5 |
| C9 | 12.5 | 95 | 10 | 5.5 |
| C10 | 5 | 110 | 10 | 5.5 |
| C11 | 8.7 | 110 | 10 | 5.5 |
| C12 | 12.5 | 110 | 10 | 5.5 |
| CR | Glucose reference | |||
a Dissolved in deionized water before addition.
Table 2.
Concentration of bioconversion inhibitors in pretreatment liquid a.
| Substance | Concentration |
|---|---|
| Aliphatic aldehydes (mM) | |
| Acetaldehyde | 1.7 (0.2) |
| Formaldehyde | 6.1 (0.4) |
| Aliphatic carboxylic acids (mM) | |
| Acetic acid | 95 (3) |
| Formic acid | 21 (2) |
| Levulinic acid | 19 (2) |
| Benzoquinones (μM) | |
| p-Benzoquinone | ND b |
| Furan aldehydes (mM) | |
| Furfural | 19.3 (0.9) |
| HMF | 20.1 (0.9) |
| Group analyses | |
| TAC (AU) c | 0.26 (0.01) |
| TCAC (mM) d | 153 (2) |
| Total phenolics (g/L) e | 1.6 (0.1) |
| Phenols (μM) | |
| Acetovanillone | 9.8 (1.0) |
| Coniferyl aldehyde | 121 (10) |
| p-Coumaraldehyde | 1.6 (0.1) |
| 4-Hydroxybenzaldehyde | 35.1 (9.4) |
| Syringaldehyde | 0.12 (0.01) |
| Vanillin | 430 (120) |
a Mean values of three replicates with standard deviations in parentheses. b Not detected. c Total Aromatic Content, absorbance units. d Total Carboxylic Acid Content. e Determined using vanillin as calibration standard.
Publisher’s Note: MDPI stays neutral with regard to jurisdictional claims in published maps and institutional affiliations. |
© 2021 by the authors. Licensee MDPI, Basel, Switzerland. This article is an open access article distributed under the terms and conditions of the Creative Commons Attribution (CC BY) license (https://creativecommons.org/licenses/by/4.0/).
Share and Cite
MDPI and ACS Style
Ilanidis, D.; Stagge, S.; Alriksson, B.; Jönsson, L.J. Factors Affecting Detoxification of Softwood Enzymatic Hydrolysates Using Sodium Dithionite. Processes 2021, 9, 887. https://0-doi-org.brum.beds.ac.uk/10.3390/pr9050887
AMA Style
Ilanidis D, Stagge S, Alriksson B, Jönsson LJ. Factors Affecting Detoxification of Softwood Enzymatic Hydrolysates Using Sodium Dithionite. Processes. 2021; 9(5):887. https://0-doi-org.brum.beds.ac.uk/10.3390/pr9050887
Chicago/Turabian StyleIlanidis, Dimitrios, Stefan Stagge, Björn Alriksson, and Leif J. Jönsson. 2021. "Factors Affecting Detoxification of Softwood Enzymatic Hydrolysates Using Sodium Dithionite" Processes 9, no. 5: 887. https://0-doi-org.brum.beds.ac.uk/10.3390/pr9050887
Note that from the first issue of 2016, this journal uses article numbers instead of page numbers. See further details here.